


Abstract
Attainable yields represent the yields that can be achieved under production conditions and are used to determine the exploitable yield gap. However, these yields are constrained by multiple factors, including soil properties that vary across different spatial scales, even within a single field. Thus, the attainable yields should be adjusted to specific soil units. This study uses results from multi-environment cultivar testing trials conducted by COBORU in Poland to estimate winter wheat attainable yields depending on arable land quality classes (ALQCs) and arable land suitability groups (ALSGs). The database comprises 10 years of observations from 18 locations and 156 experiments. The results indicate a clear relationship between the scores assigned to particular ALQCs and ALSGs in 1981. In contrast, the relationship between the average scores assigned to ALQCs within ALSGs was weaker. Attainable yields were estimated directly based on experimental data, using the median and 90th percentile (P0.9) of yields for well represented soil units, and regression analysis between the median and P0.9 and point scores for less-represented soil units. The results could be improved by using a more extensive dataset, particularly for underrepresented and not represented soils. The proposed method may be applied to estimate soil-adjusted attainable yields for other crops whose cultivars are tested by COBORU in multi-environment trials.
1. Introduction
The yield gap is defined as the difference between actual yield and potential yield that can be achieved under optimal management and environmental conditions [1,2,3,4]. Reducing the yield gap is crucial for achieving food security and improving the efficiency of arable land and agricultural input use [4,5]. These objectives can be addressed by estimating potential yields at different spatial scales, including countries, regions, fields, and even within-field variability. The main approaches used to estimate yield potential include crop model simulations, field experiments, maximum farm yields, climate analogs, and net primary productivity of natural ecosystems [1].
Crop yields depend on numerous natural factors, primarily soil properties and weather conditions, as well as anthropogenic factors such as water, nutrient, disease, pest and weed management, and the use of well-adapted and high-yielding species and cultivars [2,3,5,6,7]. Accordingly, potential yield can be defined under optimal conditions, including sufficient water supply, or as rainfed (water-limited) potential yield when irrigation is not available or not practiced [4]. In addition, attainable (or exploitable) yield—typically representing 70–80% of potential yield—can be distinguished, reflecting realistic production conditions and efficient input use. Consequently, the attainable (exploitable or manageable) yield gap can also be defined [1,4].
Both rainfed potential yield and attainable yield vary across spatial and temporal scales. Differences between countries and regions are mainly driven by climate variability [1,4], whereas within-country and within-field variability is largely related to soil heterogeneity. In addition, interannual variability results from differences in weather conditions [8,9,10,11,12]. Therefore, both potential and attainable yields are expected to differ among soils with varying properties affecting soil quality, suitability, and productivity, even under optimal crop management. Existing definitions of yield gap are typically based on ideal conditions that are rarely achieved not only across entire countries or regions but often, even within a single field due to soil variability. Thus, it is more appropriate to estimate potential and attainable yields—and the corresponding yield gap—not only at broader spatial scales but also for specific soil units characterized by relatively uniform productivity. Moreover, even within homogeneous field zones, yields vary between growing seasons; therefore, attainable yields should be considered season-dependent [8,9,10,11,12].
Soil is one of the most important natural factors determining crop yield; therefore, attainable yield is expected to vary among soil units. In Poland, the agricultural land is classified into soil quality classes (“klasy bonitacyjne” in Polish) and land suitability groups (“kompleksy przydatności rolniczej” or “kompleksy glebowo-rolnicze” in Polish). Soil quality classes are defined based on genetic soil and their productive potential, according to the Prawo Geodezyjne i Kartograficzne [13]. These classes are determined separately for different land-use types (arable lands, meadows, pastures, and forests) and for different physiographic regions (lowlands and uplands, and mountains). Basic information on arable land soil quality classes (ALQCs) is provided in Appendix A (Table A1).
Land suitability groups are defined as groups of soils that can be managed in a similar way and are primarily based on yield-limiting factors such as water conditions and erosion [14]. This concept is closely related to the later-developed concept of management zones (MZs) [15,16]. As soil quality classes, land suitability groups are defined separately for land-use types and physiographic regions. Basic information on arable land suitability groups (ALSGs) is presented in Appendix A (Table A2). Importantly, only soils belonging to specific ALQCs can be assigned to particular ALSGs.
For land valuation purposes, numerical scores were assigned to both soil quality classes and land suitability groups [Appendix A] based on cereal yields obtained from more than 5900 experiments conducted between 1970 and 1975 [17,18]. These data reflect the technological level of that period. In a 20-year study, Niewiadomski et al. [19] demonstrated a clear relationship between ALSGs and winter wheat yield, with the highest yields observed for ALSG 8 (5.6 t ha−1) and ALSG 1 (5.4 t ha−1). More recent studies by Iwańska et al. [20,21] confirmed a strong relationship between the scores assigned to ALSQs by Witek et al. [17] and winter wheat yield. Based on one-year data, an increase of 1 point corresponded to a yield increase of 0.093 t ha−1 [20], whereas in five-year data [21] the increase was lower (0.079 t ha−1 per 10 points).
Additionally, the average score assigned to ALQC and ALSG is used to calculate the soil quality and suitability index (QC-LS), which is applied to characterize agricultural land in Poland alongside indices describing agroclimate, relief, and water conditions. According to Stuczyński et al. [22], these values explained approximately 67% of the variability in cereal yields in Lower Silesia.
In Germany, Hennings et al. [10] analyzed the relationship between winter wheat and rye yields and soil quality indices, including the traditional German soil assessment (Bodenschatzung) and the Müncheberg Soil Quality Rating (M-SQR). They reported strong year-specific correlations, with coefficients ranging from 0.56 to 0.86 for Bodenschätzung and from 0.66 to 0.98 for M-SQR.
Despite this well-established conceptual framework, there is still limited evidence on the direct estimation of attainable yields within officially defined soil quality classes and land suitability groups under contemporary production conditions. Consequently, the quantitative translation of soil classification systems into attainable winter wheat yields remains insufficiently explored in Poland.
The aim of this study is to determine the attainable yields of winter wheat for specific arable soil quality classes and land suitability groups of lowland areas of Poland.
2. Materials and Methods
2.1. Data Source and Experimental Design
Winter wheat grain yield data used in this study was obtained from multi-environment trials conducted by the Research Centre for Cultivar Testing (COBORU). COBORU evaluates of major crop species across 49 experimental locations in Poland under standardized agronomic management conditions.
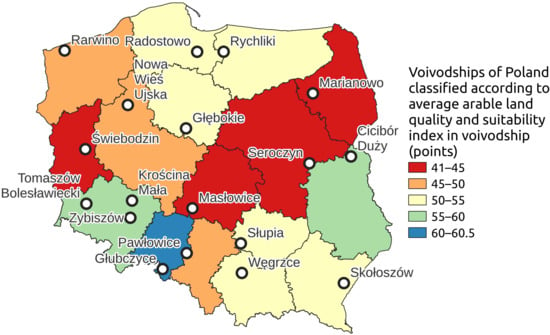
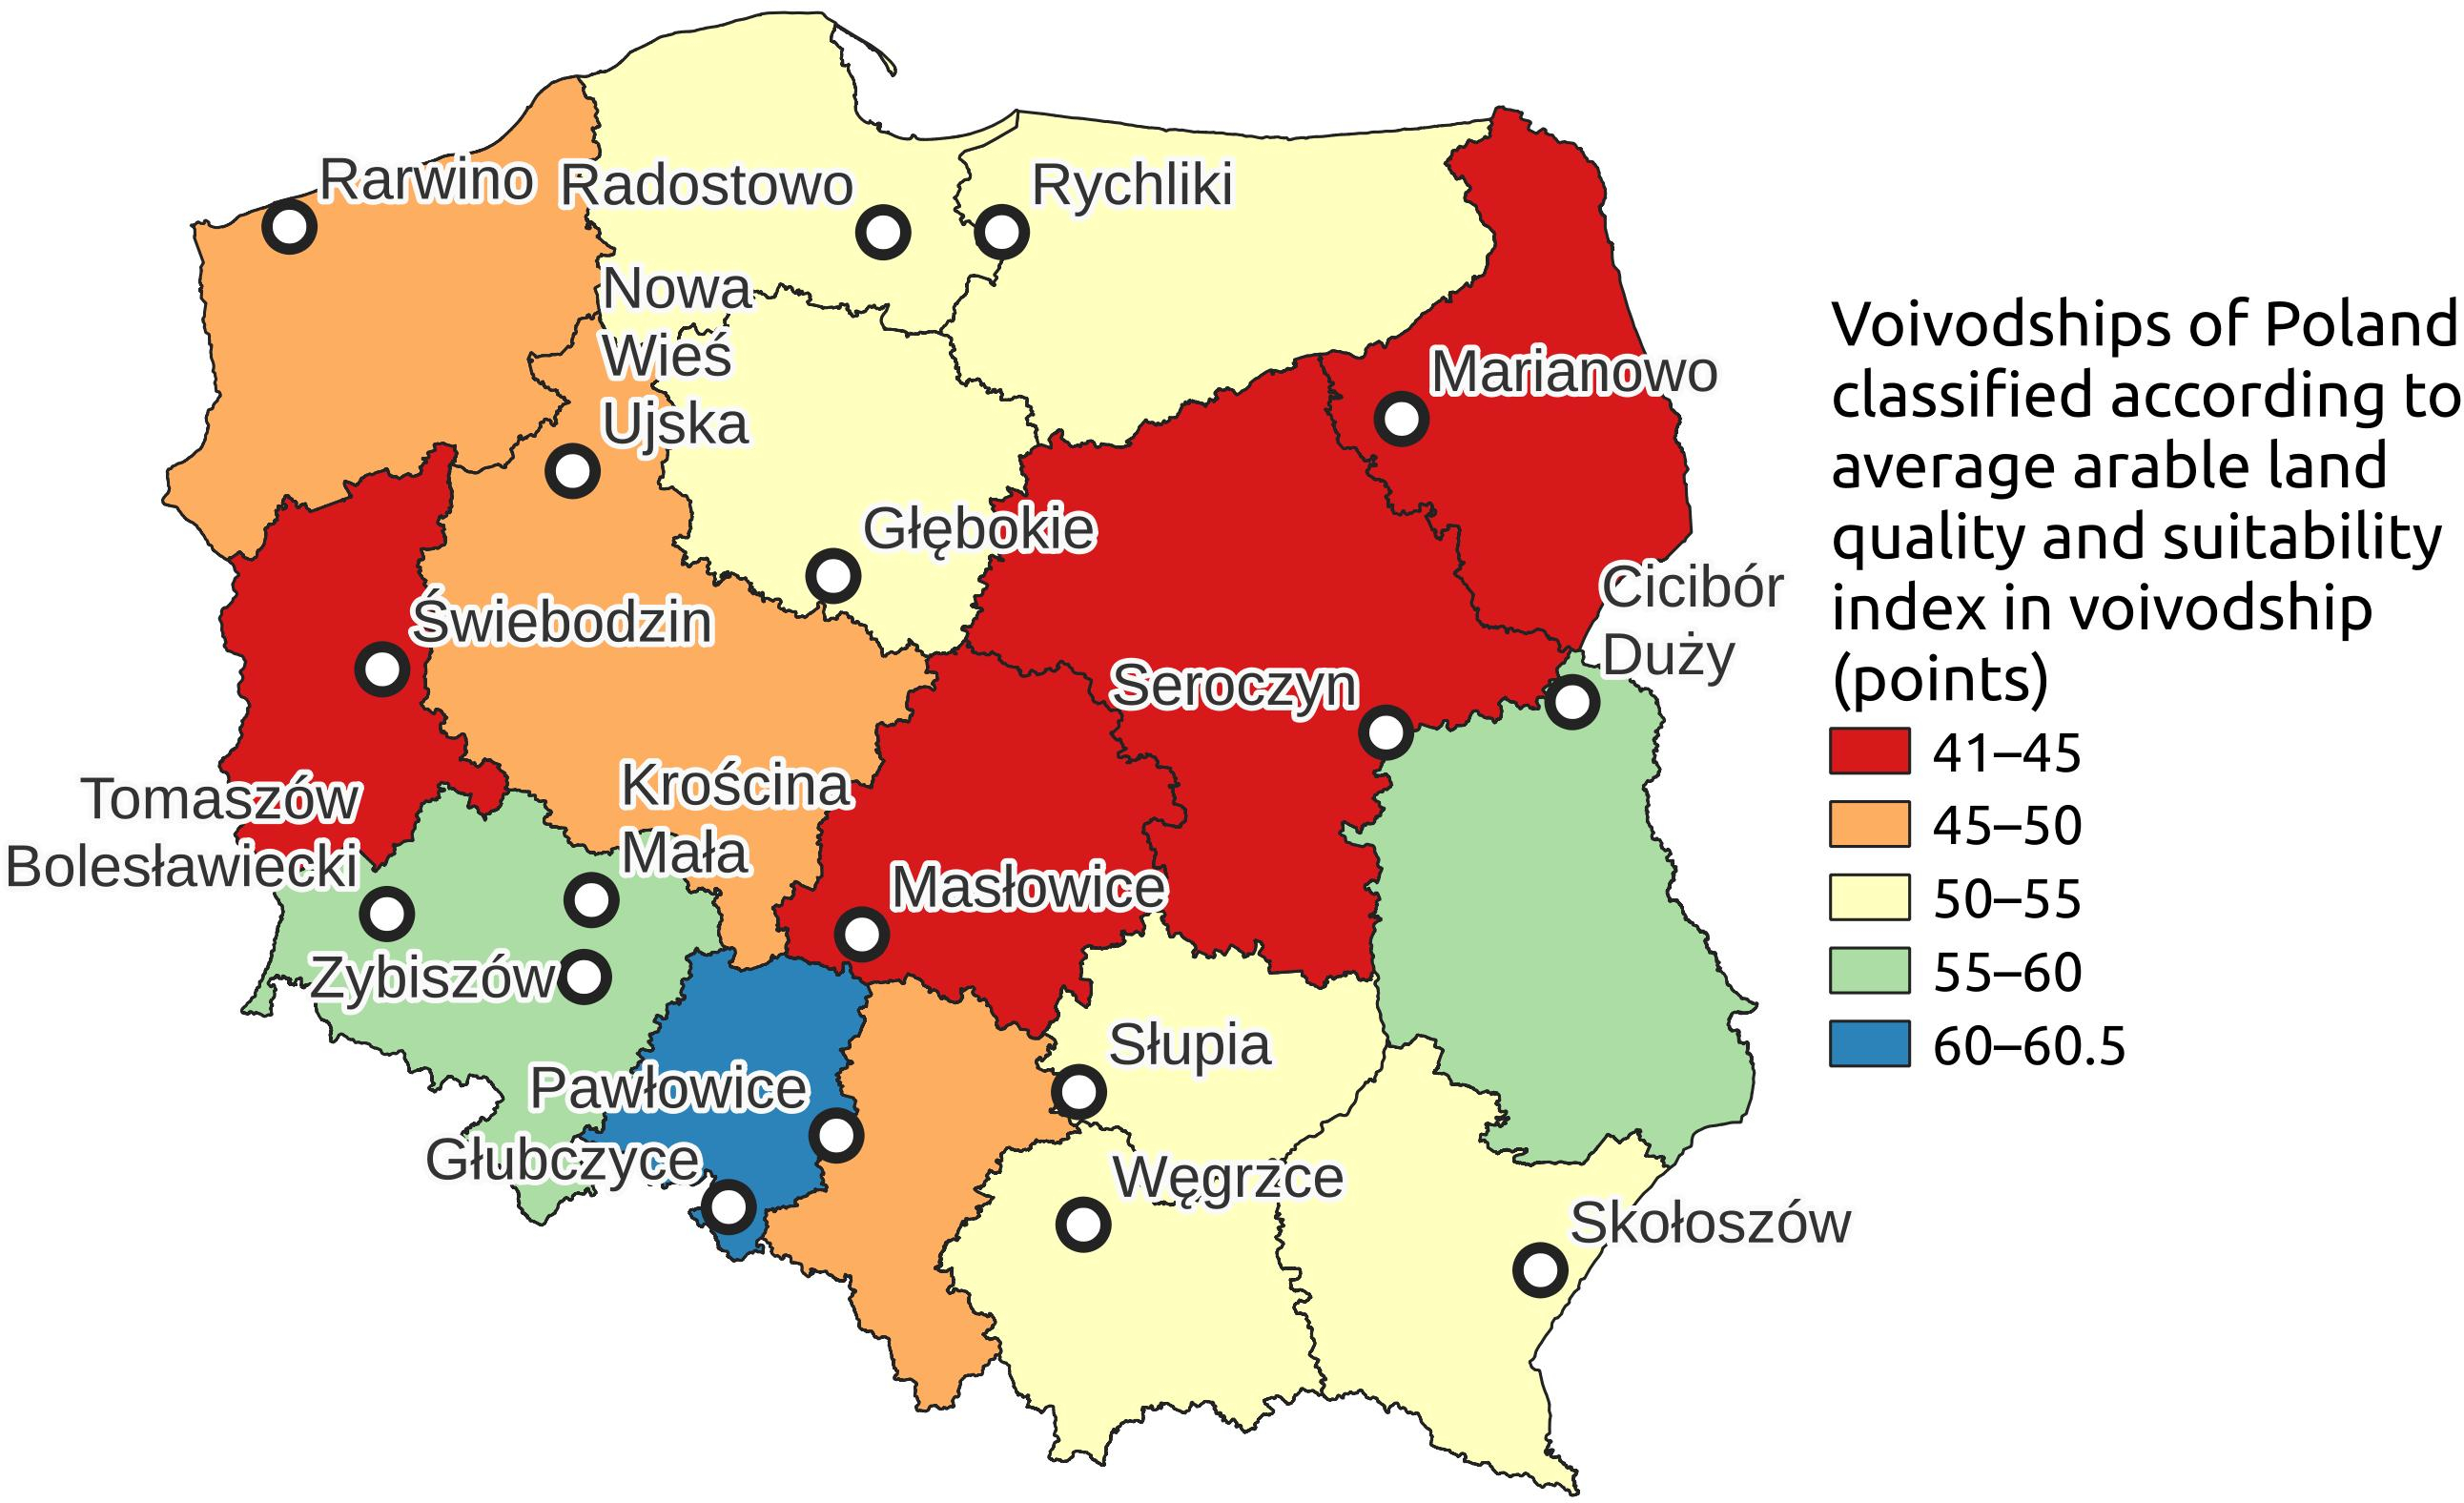
The dataset covered the period 2015–2024 and included results from 18 experimental sites (Figure 1; Table 1) representing all voivodships of Poland (https://en.wikipedia.org/wiki/Administrative_divisions_of_Poland, accessed on 2 December 2025). However, most experimental sites (except Tomaszów Bolesławiecki) were located on soils of higher quality and suitability than the regional averages for the respective voivodship (Table 1). Each experimental location was assigned to an arable land suitability group (ALSG) according to the official Polish soil classification system. The trials were conducted under conventional management practices typical of cultivar testing. The methodology applied by COBORU is uniform across the country and has been described in other studies [21,23]. Grain yield was expressed in dt ha−1 (recalculated to t ha−1) at standard moisture content.
Figure 1.
The winter wheat trial locations within voivodships of Poland.
Table 1.
Basic characteristics of winter wheat experimental sites included in the study.
2.2. Data Preparation and Cleaning
The initial dataset comprised 19,641 winter wheat yield records derived from 185 experiments conducted at 19 locations over 10 years. The database was constructed by integrating winter wheat yield data from COBORU multi-environment trials conducted between 2015 and 2024.
Yield records were merged into a unified dataset containing the following variables: yield, location, year, ALQC, ALSG, and corresponding soil valuation scores. The data were standardized with respect to yield units and classification codes and verified for completeness and logical consistency.
Outliers were identified and removed. Specifically, records with unrealistically low yields (0.007 t·ha−1; 74 observations) and extremely high yields (70.8 t·ha−1; 1 observation) were excluded. Additionally, records containing classification errors—such as non-existent ALQC categories (e.g., ALQC IIa) or inconsistencies between ALQC and ALSG that violated official classification rules—were removed (3010 observations, including one location not shown in Figure 1).
After data cleaning, the final dataset consisted of 16,556 yield observations from 156 experiments conducted at 18 locations over 10 years.
2.3. Statistical Analysis
For each site–year combination (i.e., each experiment), the empirical distribution of yields was summarized using descriptive statistics. The following parameters were calculated: minimum, 10th percentile (P0.1), first quartile (Q1), mean, median, third quartile (Q3), 90th percentile (P0.9), maximum, standard deviation (SD), standard error (SE) and coefficient of variability (CV). The distribution parameters were then calculated for six arable land quality classes (ALQCs), five arable land suitability groups (ALSGs), and eleven combinations of ALQCs within ALSGs. This procedure resulted in a secondary dataset comprising 156 experimental records, each representing the yield distribution for a given site–year combination.
In addition, for illustrative purposes and to ensure comparability with previous studies [10,18,19], a simplified dataset was constructed. This dataset included median values of selected statistical measures (mean, median, Q3, P0.9, and maximum) aggregated for each soil unit and soil score category.
2.4. Estimation of Attainable Yields
Based on the analysis of yield distribution and their comparison with national average winter wheat yields reported by Statistics Poland (GUS) for the period 2015–2024, criteria for estimating attainable yields were established.
Attainable yields were defined using selected upper distribution parameters (primarily median and P0.9), reflecting realistic high-performance production conditions. Based on these criteria, tables of attainable winter wheat yields were developed for each soil unit, including ALQC, ALSG, and combined ALQC–ALSG units (QC–LS). The concept of this study was simple and resembled boundary line analysis [26,27] which treats the main factors under investigation—soil quality and variability—as independent variables. We assumed that, after elimination of some outliers (maximum values), the upper band in the scatterplot of yield values—defined by the median and P0.9— reflects the influence of this factor. All points below this band are presumed to result from limiting effects of other yield-determining factors such as weather conditions, agrotechnology and genotype.
2.5. Normality Testing
The distribution of yield records in the final dataset, as well as within subsets defined by ALQCs, ALSGs and their combinations, was tested for normality using the Shapiro–Wilk test. Statistical analyses were performed using appropriate statistical software (Statistica, version 13; TIBCO Software Inc., Palo Alto, CA, USA).
2.6. Software
The manuscript was prepared mainly using open-source software. Text, tables, and part of the figures were developed using LibreOffice 7.3.7.2 (The Document Foundation). Image processing was performed using GNU Image Manipulation Program (GIMP 2.10.30), and spatial data visualization (Figure 1) was conducted using QGIS 3.22.4-Białowieża. OpenAI tools were used to extract and recalculate average weather data for Poland and experimental locations (Table 1), to extract and summarize data on average winter wheat yields in Poland from GUS (last columns in the Tables S1–S3) and to generate a script for the preparation of Figure 3.
3. Results
3.1. Representation of Land Units
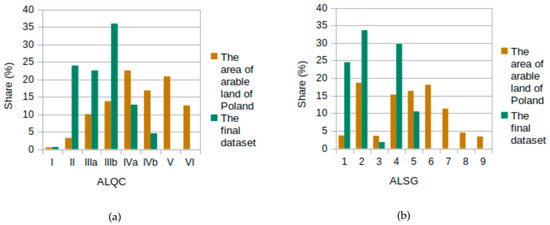
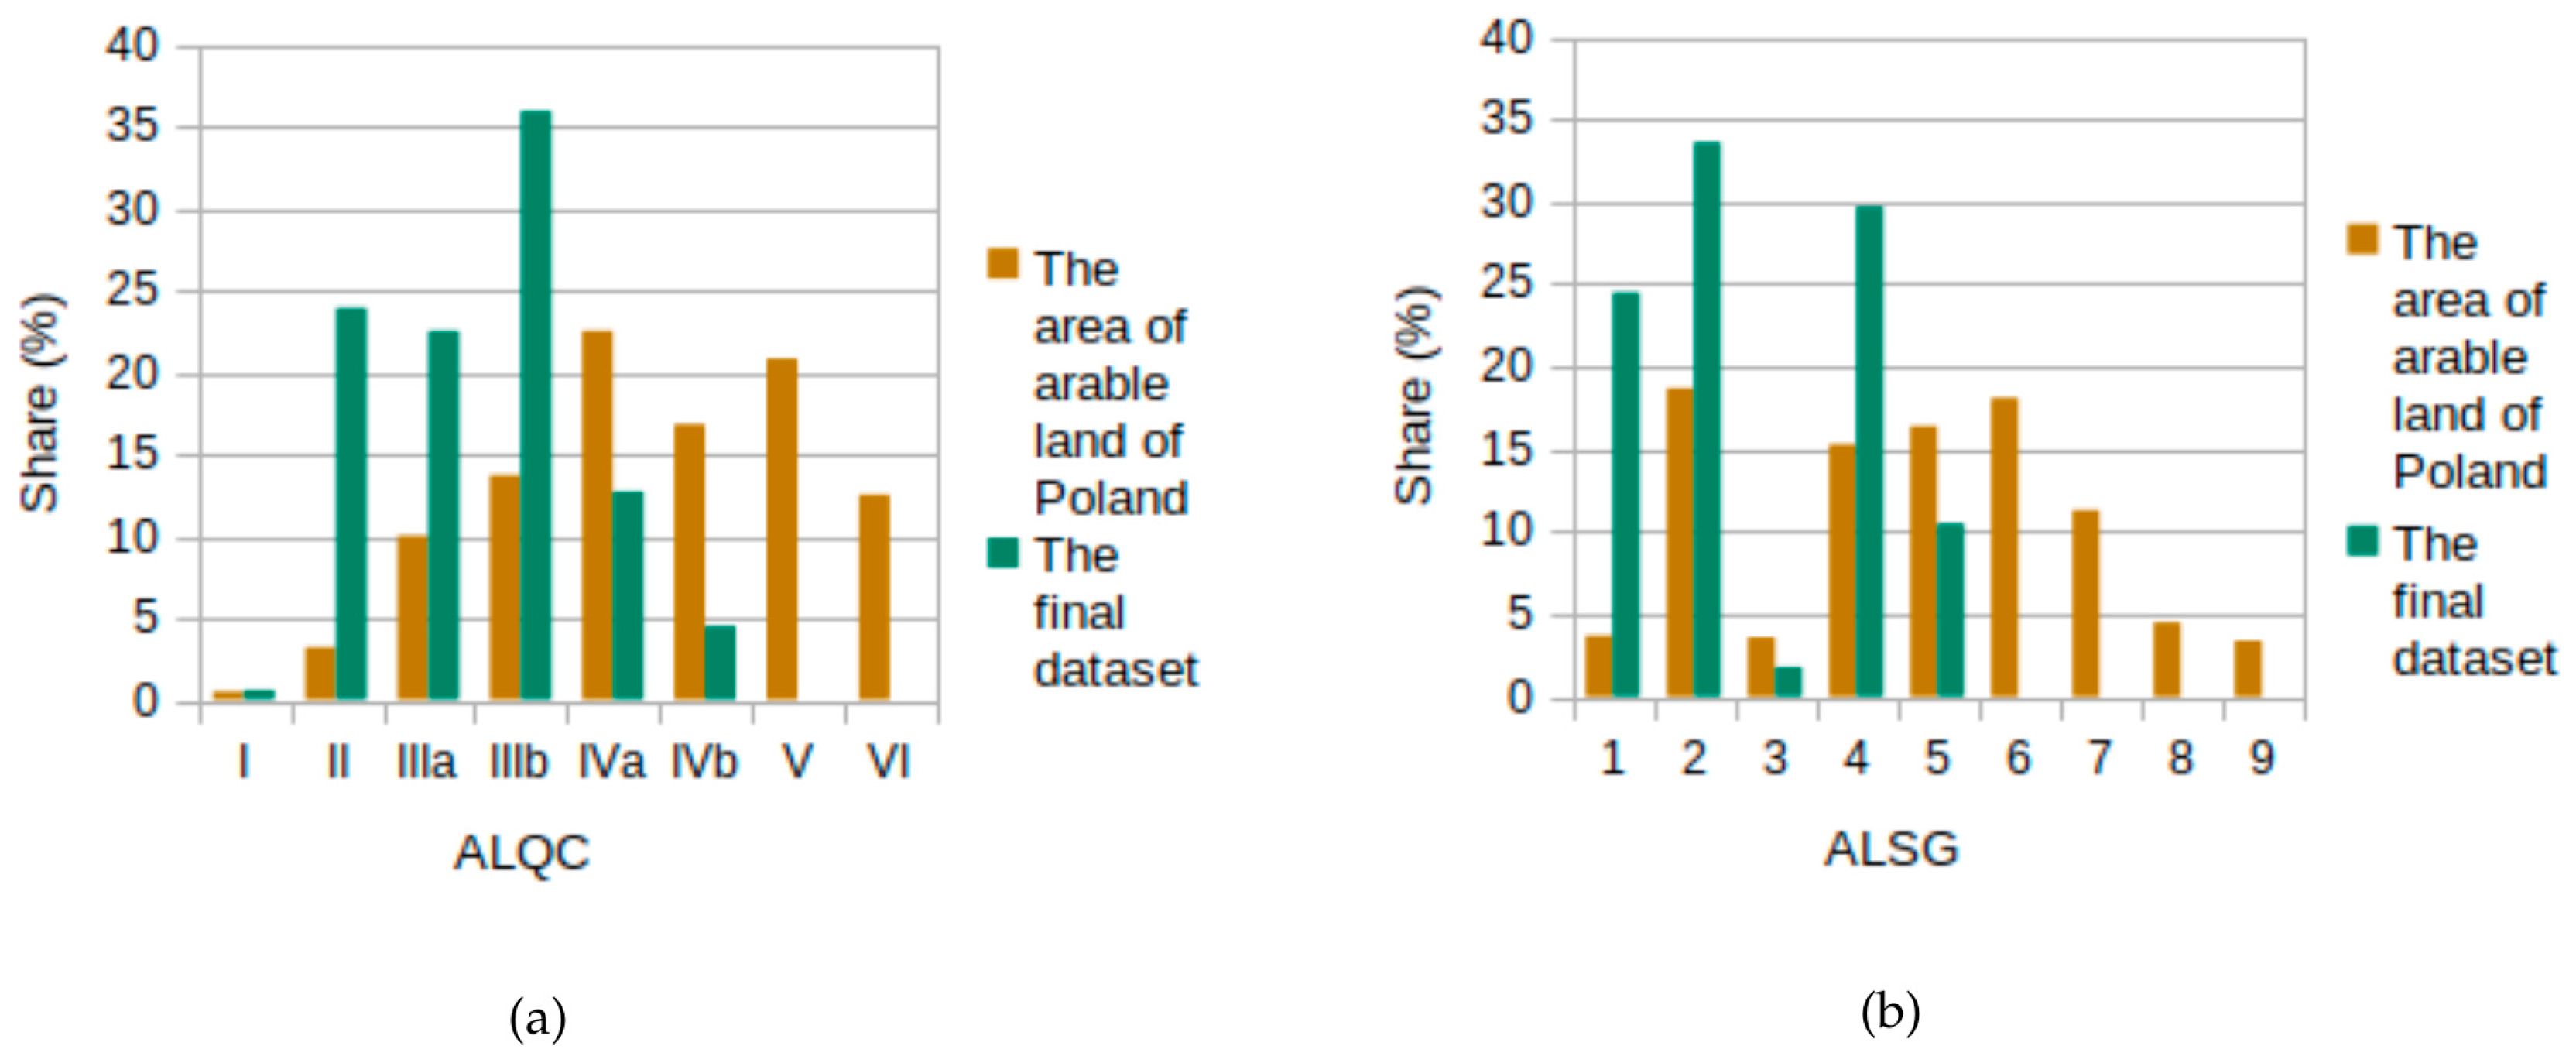
To evaluate the representativeness of the final dataset, the distributions of arable land quality classes (ALQCs) and arable land suitability groups (ALSGs) in the COBORU trials were compared with their national distributions in Poland (Figure 2a,b). This dataset comprised 16,556 yield observations from 156 experiments distributed across six ALQCs and five ALSGS (Table 2).
Figure 2.
The representativenss of particular ALQCs (a) and ALSGs (b) in final dataset and the area of arable land of Poland.
Table 2.
Number of winter wheat yield observations and experiments (in parentheses) across arable land quality classes (ALQCs) and land suitability groups (ALSGs).
The trials (Table 1; Appendix A) were conducted on the best (ALQC I), very good (II), good (IIIa and IIIb), and medium (IVa and IVb) soils belonging to land suitable for wheat cultivation (ALSG 1, 2 and 3) and, to a lesser extent, soils suitable for rye (ALSGs 4 and 5). The best soils (ALQC I) were represented only in 2015, whereas the remaining classes were present throughout the entire study period. Most observations originated from very good (ALQC II) and good soils (ALQCs IIIa and IIIb), which together accounted for over 80% of the dataset.
With respect to ALSGs, the dataset shows a higher proportion of groups most suitable for wheat cultivation (ALSGs 1, 2 and 4) compared with their share in the total arable land area in Poland (Table 2; Figure 2b). In contrast, ALSGs 3 and 5 are underrepresented. ALSGs 6–9 were not represented in the dataset.
When individual years are considered (Table 3), the ALSGs most suitable for wheat (1, 2 and 4) were represented in all ten years (2015–2024). ALSG 5 was present in nine years (absent only in 2019), whereas ALSG 3 occurred only in two years (2015 and 2017), indicating limited representation of less suitable soil groups.
Table 3.
Number of winter wheat yield observations and experiments (in parentheses) by year across arable land quality classes (ALQCs) and arable land suitability groups (ALSGs).
The dataset provides full temporal coverage for the most common ALQC–ALSG combinations (QC-LS) in Poland (Table 3), particularly ALQCs IIIb, (mainly within ALSGs 2 and 4), ALQC IIIa (ALSG 2), and ALQC II (ALSG 1). In contrast, classes IVa (ALSGs 4 and 5) and IVb (ALSG 5) were represented in 6–7 years, while other combinations (e.g., IIIa–ALSG 4, IVa–ALSG 3, IIIb–ALSG 3, and I–ALSG 1) appeared only sporadically (1–3 years). Notably, ALQC IVb within ALSG 3 was not represented.
3.2. Parameters of Yield Distribution
The final yield dataset, as well as almost all subsets defined by arable land quality classes (ALQCs), arable land suitability groups (ALSGs), and their combinations (QC-LS), exhibited an approximately normal distribution. The only exception was ALQC I, which was poorly represented and did not meet the normality assumption (Tables S1–S3).
Almost all yield distribution parameters, except for minimum values, exceeded the national average winter wheat yields in Poland for the period 2015–2024, which ranged from 4.3 t·ha−1 (2018) to 5.48 t·ha−1 (2023), according to Statistics Poland (GUS). Even on medium-quality soils (ALQC IVb) with suitability for rye (ALSG 5), which are generally not recommended for wheat cultivation [28,29], the 10th percentile (P0.9) and higher distribution parameters exceeded the national average. Moreover, the highest national average winter wheat yield (5.48 t·ha−1 in 2023) remained below the first quartile (Q1) observed in the COBORU trials (Tables S1–S3). This confirms the existence of a substantial exploitable yield gap, even on soils with limited suitability for wheat cultivation.
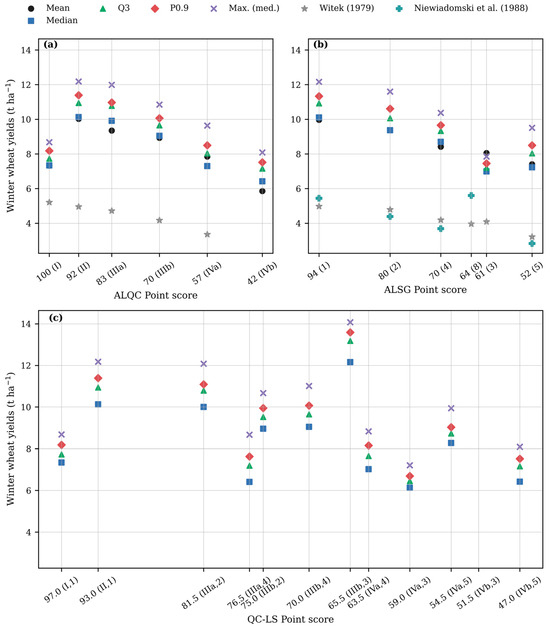
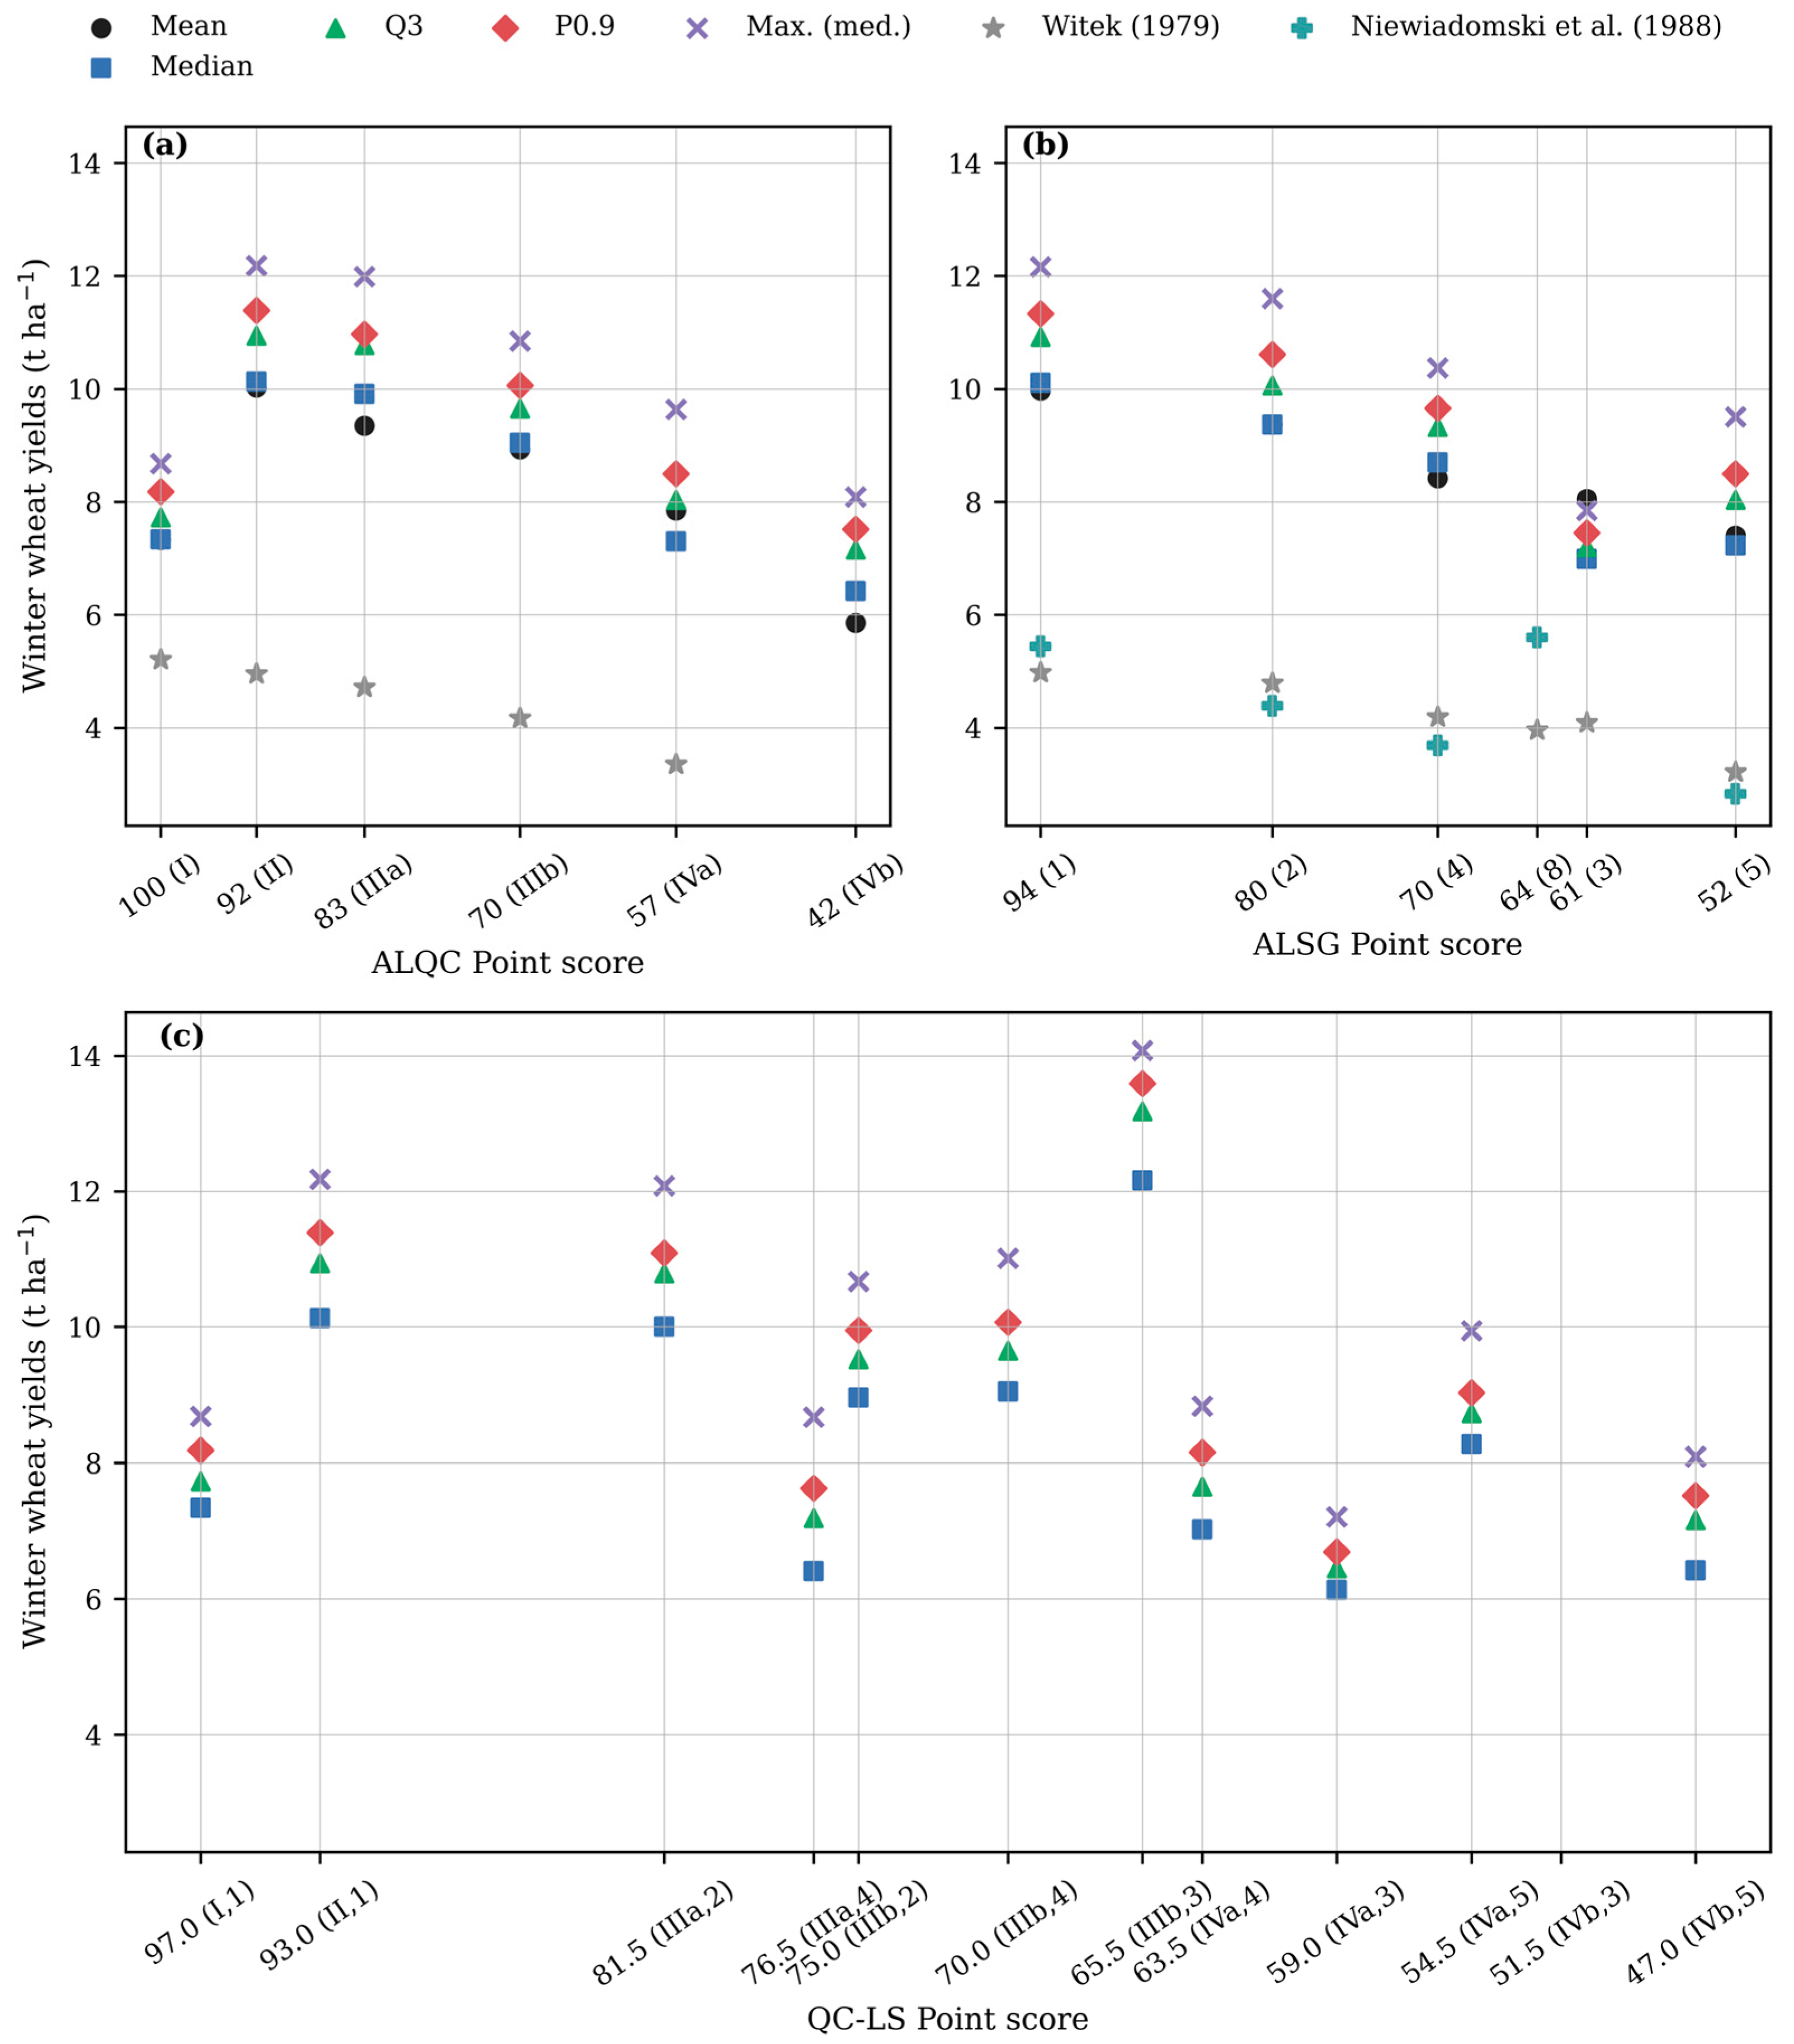
The winter wheat yields differed systematically across ALQCs (Table S1; Figure 3a), decreasing from class II to IVb, in agreement with the soil quality scores assigned to these classes [17]. An anomaly was observed for ALQC I, where relatively low average and median yields (7.3 t·ha−1) were recorded, along with lower distribution parameters compared with ALQCs II–IVa This inconsistency results from the very limited representation of this class in the dataset (one experiment, 98 observations; Table 3). Independent data indicate that winter wheat yields on ALQC I soils may reach 10–14 t·ha−1 under favorable conditions [30]. Therefore, the observed values for ALQC I should be considered unreliable, and this class was excluded from further regression analyses.
Figure 3.
Relationships between selected statistical measures of winter wheat yield and soil valuation scores assigned to arable land quality classes (ALQCs) and arable land suitability groups (ALSGs) [17,19]: (a) ALQCs, (b) ALSGs, and (c) combined ALQC–ALSG index (quality and suitability index, QC-LS). Source: own elaboration based on the study data.
Yields obtained on ALQCs II and IIIa were very similar, with median values of 10.1 and 9.9 t·ha−1, Q3 values of 10.9 and 10.8 t·ha−1, 90th percentiles of 11.4 and 10.9 t·ha−1, and median maximum values of 12.2 and 12.0 t·ha−1, respectively. Yields observed for ALQC IIIb were only slightly lower and still substantially exceeded the national average yields for the study period (Table S1). A similar decreasing trend was observed across ALSGs (Table S2; Figure 3b), generally consistent with the soil valuation scores assigned by Witek et al. [17]. However, ALSG 5 (good rye suitability, 52 points) showed slightly higher productivity than ALSG 3 (imperfect wheat suitability, 61 points), which may be attributed to the limited representation of ALSG 3 in the dataset (298 observations from 3 experiments).
When combined ALQC–ALSG units were analyzed (Table S3; Figure 3c), the general trend of decreasing yields with decreasing soil quality and suitability was maintained. However, deviations from this trend were observed, primarily for combinations with limited representation. Lower-than-expected median yields were observed for ALQC I within ALSG 1 (96 observations), ALQC IIIa within ALSG 4 (364 observations), and ALQC IVa within ALSG 3 (202 observations). Conversely, higher-than-expected values were observed for ALQC IIIb within ALSG 3 (96 observations from one experiment).
3.3. Relationships Between Soil Scores and Winter Wheat Yields
The scatterplots illustrating the relationship between winter wheat yield parameters and the point scores assigned to ALQCs, ALSGs and their combination ALQCs in ALSGs (Figure 3) were developed based on the data summarized in Tables S1–S3 and allow comparison with previous studies [10,18,19,22]. Overall, winter wheat yield parameters (mean, medians, Q3, P0.9 and maximum) showed a strong relationship with ALQC point scores (excluding the poorly represented ALQC I), and a somewhat weaker relationship with ALSG scores. The main deviation from this pattern was observed for ALSG 3 (61 points), which was underrepresented in the dataset.
The relationship between winter wheat yields’ combined soil quality and the suitability index (QC-LS, the mean score of ALQC and ALSG) was less consistent. Deviations were observed particularly for combinations with limited representation, including ALQC I within ALSG 1, ALQC IIIa within ALSG 4, ALQC IIIb within ALSG 3, and ALQC IVa within ALSG 3. Prior to regression analysis, outlying soil units were excluded. Both linear and quadratic regression models were checked, as yield increments tended to decrease at higher soil scores (Figure 3). However, the coefficients of determination (R2) for quadratic models were only slightly higher than linear models which are shown in Table 4, Table 5 and Table 6. Regression equations describing the relationship between ALQC scores and winter wheat yields (Table 4) indicate an increase in yield levels compared with earlier studies by Witek [17,18], reflecting technological progress in agriculture. In the experimental dataset (155 records, excluding ALQC I), the models explained a relatively small proportion of yield variability (R2 = 0.21–0.26, depending on the parameter). For the full dataset (16,556 observations), R2 values were 0.169 for linear and 0.185 for quadratic regression.
Table 4.
Linear regression equations of relationships of selected wheat yield parameters and point scores assigned to particular ALQCs by Witek et al. [17].
Table 5.
Linear regression equations describing relationships between selected winter wheat yield parameters and point scores assigned to ALSGs [17].
Table 6.
Linear regression equations describing relationships between selected winter wheat yield parameters and combined soil quality and suitability scores (ALQC–ALSG index).
Regression models for ALSGs (Table 5) showed lower coefficients of determination than those for ALQCs, which may include multiple soil classes. In the experimental dataset, these models explained up to 20% of yield variability. The slope of linear regressions indicated that an increase of one point corresponded to a yield increase of approximately 0.066–0.072 t·ha−1, depending on the parameter.
The functions describing the effect of combined soil quality and suitability scores on winter wheat yield were developed using both the experimental dataset (one record per experiment) and the simplified dataset (one record per ALQC–ALSG combination), for illustrative purposes, after excluding poorly represented and clearly outlying combinations (ALQC I–ALSG 1, ALQC IIIa–ALSG 4, ALQC IIIb–ALSG 3, and ALQC IVa–ALSG 3).
Regression models for selected ALQC–ALSG combinations (Table 6) showed improved predictive performance compared with models based on ALSGs alone (Table 5), explaining up to 26% of yield variability (Q3) in the experimental dataset. In the simplified dataset, however, regression models based on combined indices showed lower coefficients of determination than those based solely on ALSGs for mean (R2 = 0.77–0.79 vs. 0.98–0.99), median (0.78–0.79 vs. 0.90), and Q3 (0.82 vs. 0.83), but higher values for P0.9 (0.85 vs. 0.80) and maximum yields (0.81 vs. 0.70–0.71).
3.4. Proposal of Attainable Yields
The results of this study indicate that winter wheat yields obtained in COBORU trials are strongly related to soil quality and suitability and can be used to estimate yields and yield gaps not only at the national level but also for specific soil units.
A key question is, which distribution parameter should be used to define attainable yield? Considering that attainable yields typically correspond to 70–80% of potential yields [1,4], this condition is satisfied not only by the 90th percentile (P0.9) and the third quartile (Q3), but in many cases also by the median. For example, if the P.0.9 median value from the experimental dataset is considered for ALQC-ALSG combinations, it amounts to between 88 and 97% of median of maximum yields from the same dataset. Respectively, the Q3 value corresponds to about 82–94% and the median to 73–86% of medians of maximum yields.
Another issue is whether attainable yields should be determined directly from observed data or derived from regression relationships with soil scores. A definitive answer requires more extensive and representative datasets. However, based on the present results, the median and P0.9 values were selected as the primary estimators of attainable yields, supplemented by regression-based estimates where necessary. In general, for well represented soil units with a standard error smaller than 0.05 (Tables S1–S3 and Table 7, bolded values), attainable yields were directly derived from Q3 and P0.9 values (Tables S1–S3). For less-represented units, linear regression models were applied, and regression-based estimates were used, as shown in Table 7, and are indicated with additional “r”. The only exception to this statistic rule is ALQC IVb with attainable yields based on dataset. The rationale for this decision is provided in Section 4.4.
Table 7.
Proposed attainable winter wheat yields (t ha−1) for selected arable land quality classes (ALQCs) and land suitability groups (ALSGs).
We do not propose any attainable yields for ALQC I, as the results from our dataset are not representative (1 experiment) and contradictory with information found in other sources from COBORU trials from 4 years ago [30] and for the soil units not represented in our dataset (ALQCs V and VI and ALSGs 6 and 8 and their respective combinations).
4. Discussion
4.1. Representativeness of the Dataset
The dataset covers most soil units recommended and used for winter wheat production in Poland. The distribution of ALQCs in the dataset with predominance of classes II, IIIa, and IIIb is consistent with agronomic recommendations for winter wheat production [5,28,29]. The weak representation (only one experiment) of the best soils (ALQC I), which are recommended for wheat production, is related to the very small area of these soils in Poland (0.5% of arable lands, Table A1). The relatively low share of medium-quality soils (ALQCs IVa and IVb) results from their lower suitability for winter wheat cultivation, although they are common in Poland (39%) and are also used for this purpose. Weak (ALQC V) and very weak soils (VI and VIz) were not represented in the dataset. These soils are also common in Poland (33%) but their absence is consistent with agricultural practice, as these soils are generally unsuitable for wheat due to severe water limitations (deficit or excess). Therefore, the distribution of ALQCs in the dataset (excluding class I) corresponds well with their share in the total arable land area in Poland and their practical use in wheat production (Figure 2a).
Similar to ALQCs, the ALSGs most suitable for wheat production are well represented in the dataset. In general, the land recommended [28,29] for wheat (ALSGS 1, 2, 3, 4), excluding mountain soils, consists of about 41% arable land in total (Table A2), and the ALGS represented in the datasets (1, 2 and 4) occupy up to 38%. The other soils frequently used for wheat production, belonging to ALSGs 5 and 8 occupy about 21%. Of these soils, the ALSG 5 (16%) has limited representation in the dataset, and ALSG 8 (4.5%) was not included, despite previous long-term studies indicating high productivity of this soil group [19]. Poorly represented units also include ALSG 3 but these soil units occupy relatively small areas of arable land in Poland (3.6%, Table A2). Other soil units of lower quality and suitability which were not included in the dataset (ALSGs 6, 7 and 9) are generally unsuitable for wheat production [28,29].
In summary, although not all arable land quality classes (ALQCs) and arable land suitability groups (ALSGs) were represented throughout the entire study period, about 80% of the land area recommended and used for wheat production in Poland is represented in the dataset. The ALQCs and ALSGs most recommended and most commonly used for winter wheat cultivation are well represented. Despite some temporal and structural imbalances, the dominance of key soil groups ensures that the dataset is representative of major wheat production environments.
4.2. Parameters of Yield Distribution and Point Scores
The distribution parameters of winter wheat yield (Tables S1 and S2 and Figure 3a,b) showed general consistency with point scores attributed to Witek et al. in 1981 [17] for particular ALQCs and ALSGs. Previous long-term studies [18,19] reported similar trends, although exceptionally high yields were observed for the ALSG 8 (strong cereal–fodder complex), exceeding those of ALSG 1. The ALSG 8 is characterized by fine-textured soils prone to excess moisture, which increases the risk of winter damage but may allow high yields under favorable conditions. The ALSG 8 may be composed of the most diverse ALQCs, namely IIIa, IIIb, IVa, and IVb and even V (Table A2), but particular ALQCs included in the experiment of Niewiadomski [19] were not mentioned; thus it is impossible to conclude on the reasons for the high winter wheat yields obtained on ALSG 8.
The distribution parameters of winter wheat yield showed visually worse agreement with the average point scores calculated for ALQCs within ALSGs (Table S3 and Figure 3), particularly for underrepresented soil units, such as ALQC I within ALSG 1, ALQC IIIa within ALSG 4, and ALQC IVa within ALSG 3 and ALQC IIIb within ALSG 3. We must also remember that the point scores were established from base cereal yields obtained in particular ALQCs and ALSGs [18] and the combination of both land units was not analyzed. Thus, the averaging of these point scores may not accurately reflect the actual value and productivity of these units.
4.3. Relationships Between Soil Scores and Winter Wheat Yields
Generally, the scatterplots (Figure 3) show a positive relationship between winter wheat yields obtained in COBORU trials and point scores assigned to ALQCs; however, this trend slightly decreases in better, more valuated soils. A similar pattern was previously reported by Witek [18], who noted that soils classified as ALQCs I–IIIb exhibited relatively small differences in cereal yields and could be treated as a homogeneous group of high-quality soils. The determination coefficients of linear regression based on the experimental dataset (155 records, Table 4) indicate that about 21–25% of winter wheat yield variability was explained by ALQC and this confirms soil quality as one of the important yield determinants. In Germany, Hennings et al. [10] reported correlations between soil quality indices and winter wheat yields ranging from 0.56 to 0.86 (R2 ≈ 0.31–0.74), depending on the season. These values were obtained on the databases of six or seven records and are lower than those obtained in this study for simple datasets (5 records for ALQCs with R2 of 0.98–0.99). The German Münchenberg Soil Quality Rating (M-SQR) is based on multiple soil properties and environmental factors, whereas the Polish point scores were directly derived from crop yields [17,18].
The regression models showing the effect of ALSGs on winter wheat yields (Table 5) are generally consistent with point scores attributed to Witek et al. [17], but have lower determination coefficients (0.17–0.20) compared to the corresponding models for ALQCs. This is due to greater heterogeneity of ALSGs compared to ALQCs, in terms of productivity. The slope of linear regressions indicated that an increase of one point was associated with a yield increase of approximately 0.062–0.088 t·ha−1, depending on the parameter. These values are consistent with previous estimates reported by Iwańska et al. [20,21].
The regression models showing the effect of ALQCs combined with ALSGs (Table 6) indicated about 22–25% of yield variability as explained by soil quality and suitability. Correlation coefficients reported in Germany [10] (0.70–0.92; corresponding to R2 = 0.51–0.81) indicate a weaker relationship between winter wheat yields and soil quality indices compared with those obtained in this study for combined ALQC–ALSG scores in the simple dataset with a comparatively low number of yield values (Table 6). A previous Polish study (2007) by Stuczyński et al. [22] reported a stronger relationship (R2 = 0.67) between cereal yields and the soil quality and suitability index, based on regional (gmina-level) data from Lower Silesia. The regression equation was Y = 0.3017X + 16.179, adjusted to dt ha−1 as yield unit, and represented the yields obtained by farmers during the years before 2007. These results were based on aggregated regional data with lower yield levels and likely lower variability than those observed in multi-environment COBORU trials used in this study. Additionally, detailed information on the dataset (e.g., number of observations, time period, and yield distribution parameters) was not provided.
4.4. Proposal of Attainable Yields: Limitations, Applications, and Future Research
Due to the underrepresentation or even inexistence of some soil units in the database, the attainable yields of winter wheat were not proposed in Table 7. However, the regression models from our study allow us to estimate yields for these units. Such estimates should be treated with caution, as soil scores were originally derived from average cereal yields and may not adequately represent current exploitable wheat productivity on these soils. For the best soils, for ALQC I, we suggest the values of attainable yields similar to those proposed for ALQC II, as it can be derived indirectly from other sources [30]. For ALSG 8 we recommend the attainable yields related to the ALQCs (IIIa-V) in this soil unit. For other underrepresented soil units, mainly those of lower quality (ALQC IVb) or suitability for wheat (ALSG 3) and some combinations of quality and suitability (QC-LS IIIa-4, IIIb-3, IVa-3, IVa-4, IVa-5, and IVb-5), attainable yields were proposed based on the general relationship between yields and point scores (Table 4, Table 5 and Table 6, see Table 7). Consequently, these values should be interpreted with more caution, as their underrepresentation in the dataset may affect the reliability of regression results, while values taken directly from the dataset may be unreliable, based on a few experiments. This is particularly relevant for combinations such as QC-LS IIIa-4 and IVa-3, where regression-based attainable yields (9–10 and 7.8–8.7 t ha−1, respectively, Table 7) are clearly higher than observed medians and P0.9 (6.4–7.6 and 6.1–6.7 t ha−1, Table S3) based on two or three experiments. By contrast, the attainable yields proposed in Table 7 for QC-LS IIIb-3 are clearly lower (8.2–9.2 t ha−1) than medians and P0.9 observed (12.2–13.6 t ha−1, Table S3). However, in both cases, the regression-based attainable yields seem more consistent with the quality and suitability of these very underrepresented soil units. In contrast, the attainable yields of winter wheat calculated and proposed in Table 7 for ALQC IVb (7.7–8.6) are slightly higher than those proposed for ALQC IVa (7.3–8.5) directly from the experiment results (Table S1). The respective median and P0.9 of wheat yield records from the ALQC IVb were fairly lower (6.4 and 7.5 t ha−1, Table S1) than the respective parameters derived from regression for IVb and align better with the general expectation of lower yields for ALQC IVb compared to IVa. ALQC IVb was only slightly underrepresented (740 yield records, 7 years and experiments from two locations), and due to the SE value exceeding the threshold of 0.05, the attainable yields for this unit should be excluded from the direct estimation from the dataset and replaced by results of regression. Finally, the attainable yields for ALQC IVb were proposed on the basis of median and P0.9 derived directly from the dataset (Table S3) and not from regression to assure logical consistency between attainable yields and point scores attributed to ALQCs IVa and IVb.
In general, the good representation of high-quality sites led to more reliable estimates of attainable yields for these soil units, except for ALQC I, which was underrepresented. In contrast, the underrepresentation of soils of lower quality and suitability led to lower reliability of attainable yields estimates provided in this paper.
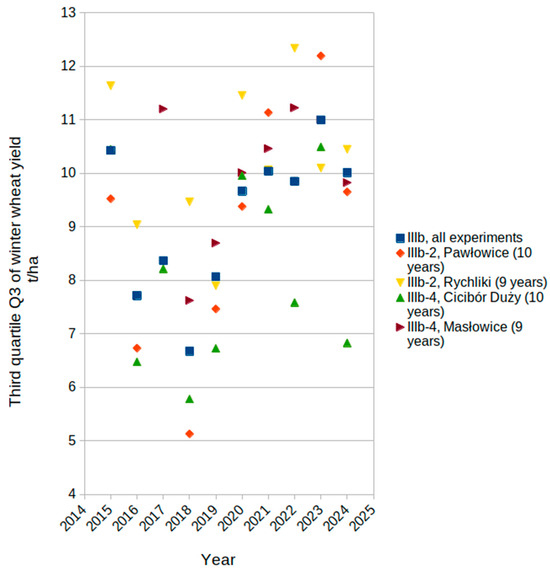
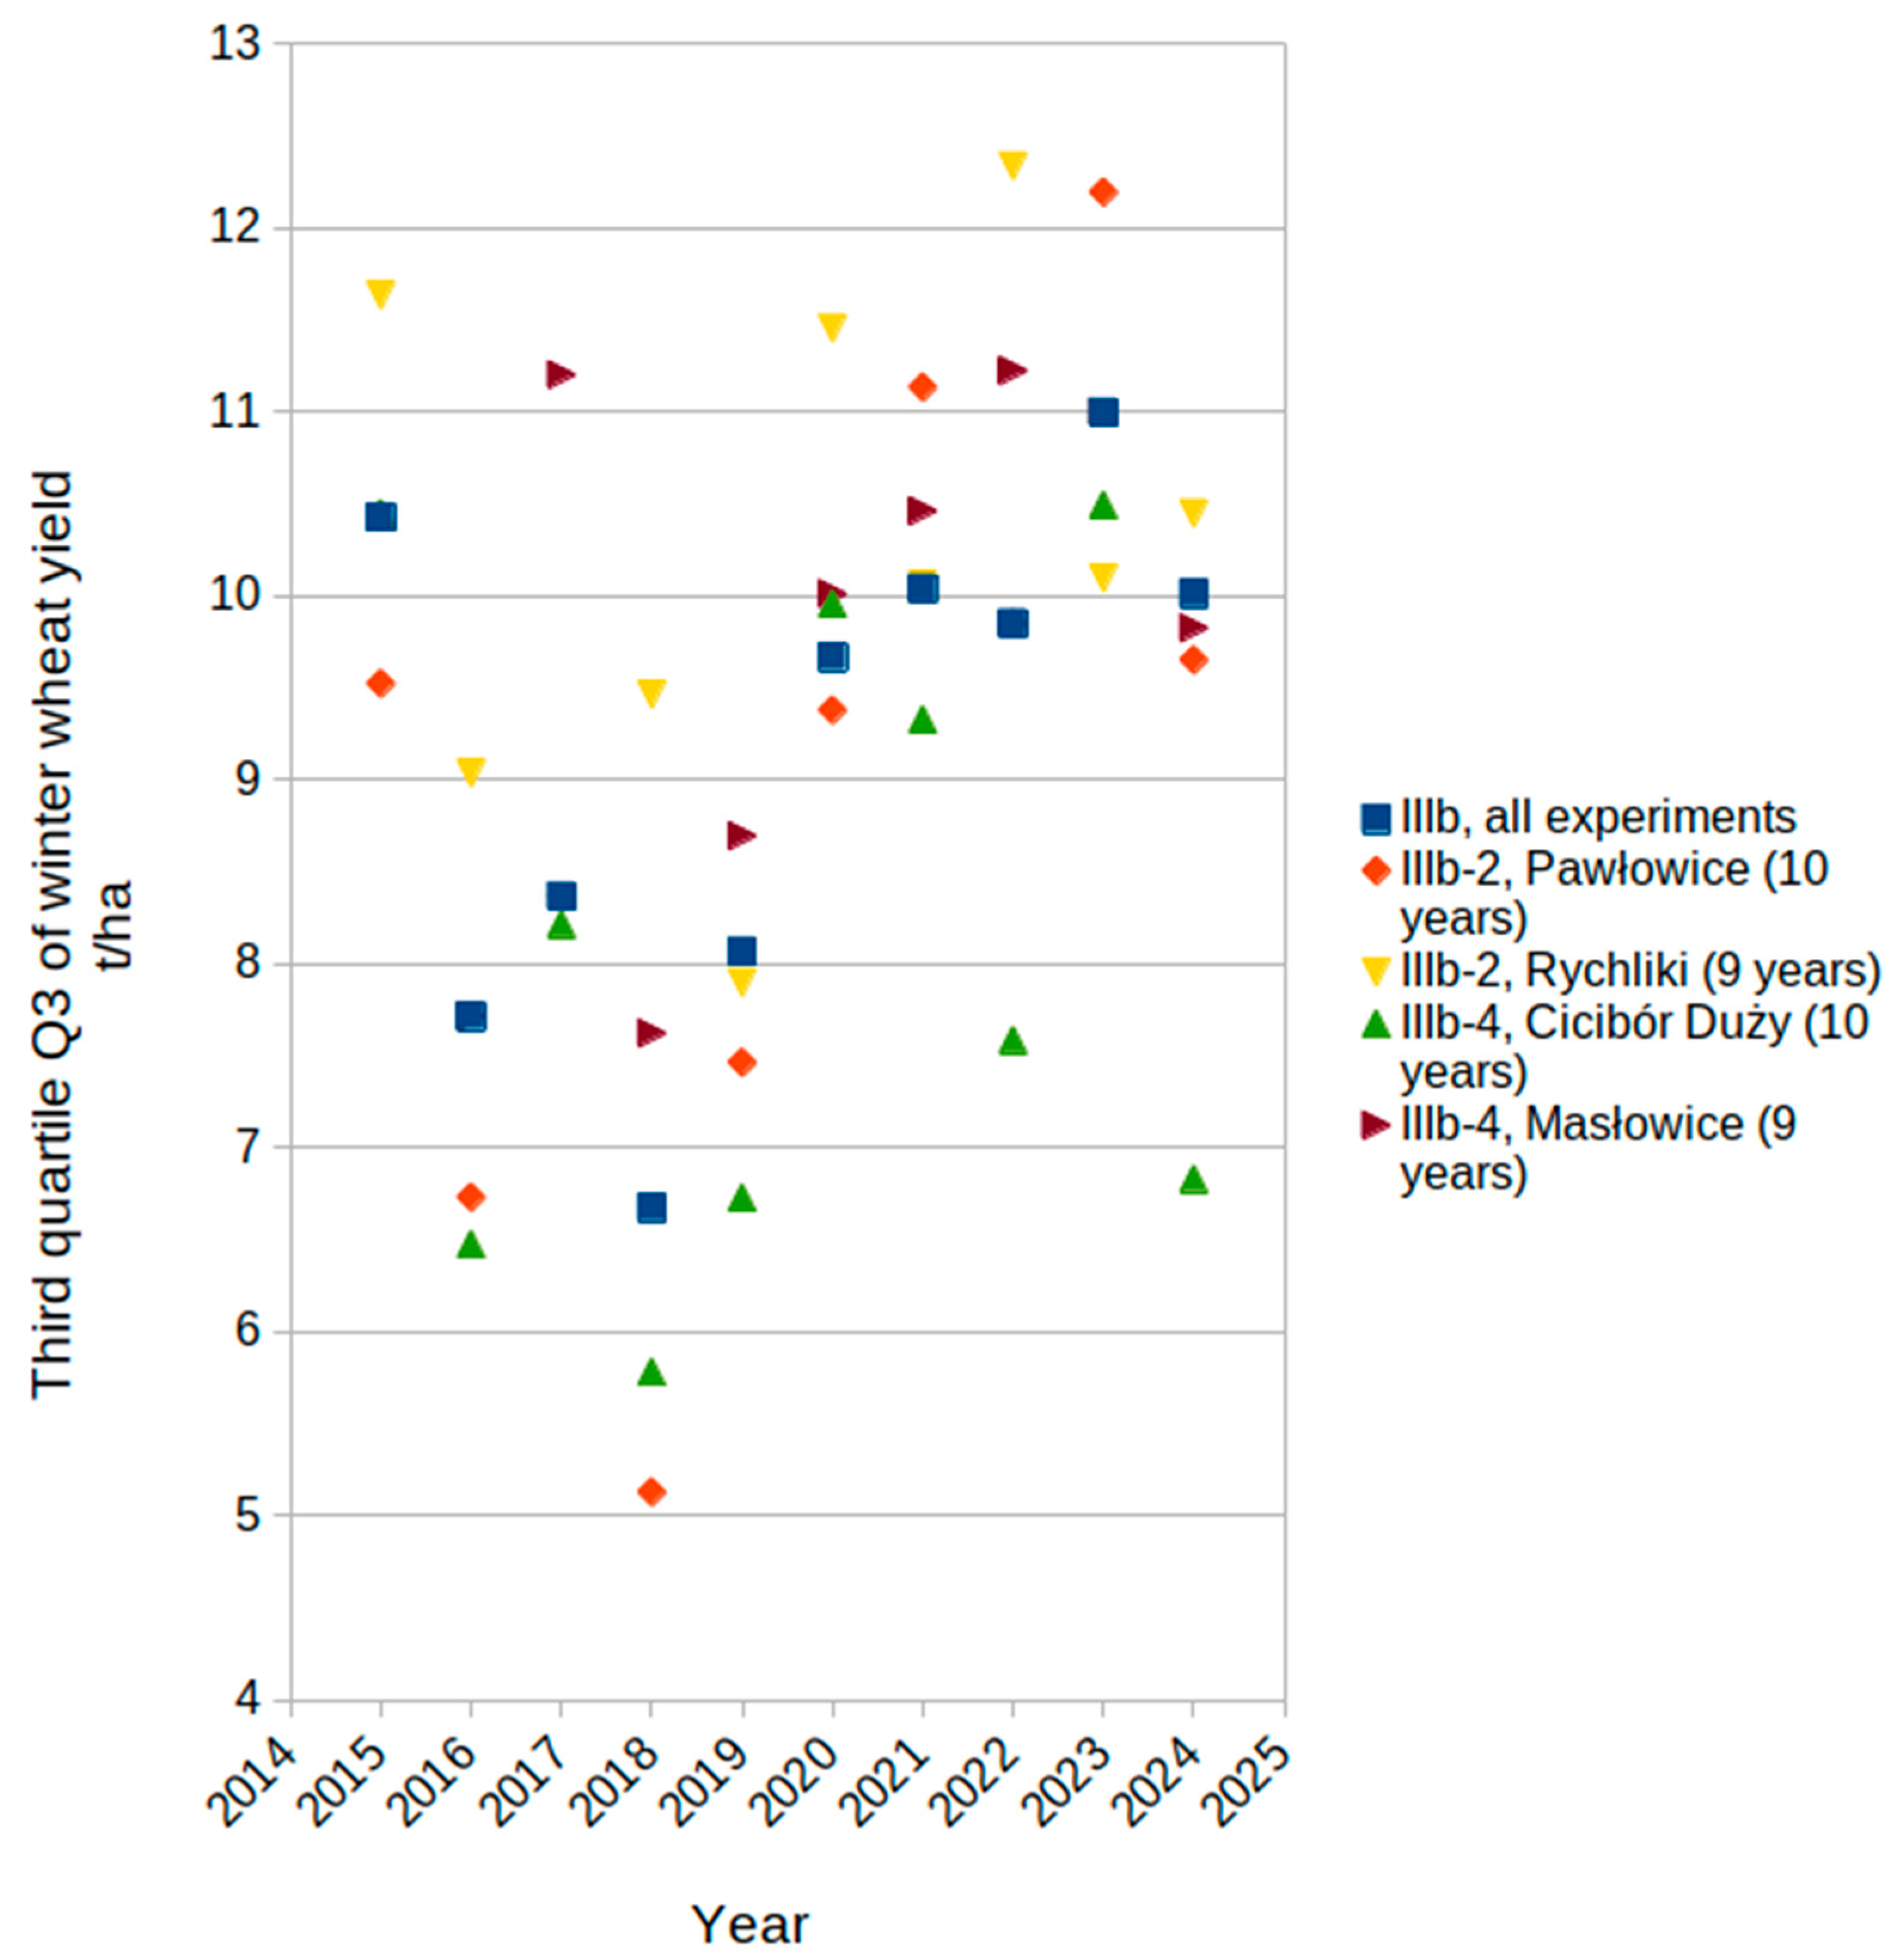
Another limitation arises from the experimental design of COBORU trials, which are conducted on relatively small and narrow plots (approximately 10 m × 1.5 m) [31]. Such plot geometry enhances edge (border) effects, leading to higher yields in outer rows compared with field conditions [32,33]. For this reason, maximum yield values were not considered appropriate estimators of attainable yields. Despite the inclusion of multiple years and locations, interannual weather variability remains a major source of yield variation. Importantly, the effect of year is not consistent across soil units and locations. As an example, an analysis of the third quartile (Q3) demonstrates substantial variability between locations and years (Figure 4). The highest Q3 values were observed in 2023 for the overall ALQC IIIb and in selected locations (Pawłowice and Cicibór Duży), whereas in other locations (Rychliki and Masłowice) the highest values occurred in 2022. Moreover, in a single location (Pawłowice), Q3 values ranged from 5 t·ha−1 (2018) to nearly 12.2 t·ha−1 (2023).
Figure 4.
Interannual variability of the third quartile (Q3) of winter wheat yield for ALQC IIIb soils and selected ALQC–ALSG combinations.
These findings indicate that weather conditions strongly influence attainable yields and vary both spatially and temporally [34]. Therefore, year should not be treated as a uniform factor at the national scale. Instead, attainable yields—and consequently yield gaps—should be considered variable and season-dependent. Similar conclusions were reported by Hennings et al. [10]. In practice, season-specific attainable yields can only be reliably estimated after the growing season.
The attainable yields proposed in Table 7 are derived from well-controlled COBORU experiments conducted using current cultivars and agronomic practices which are also available to farmers. The short examination of final and experimental datasets indicates the existence of an increasing yield trend between the years 2014–2024, similar to the respective trend observed in Figure 4. This trend may result from the advances in plant breeding, crop management and some weather trends. However, the estimation of this trend and its causes is not the aim of this paper, and we must be aware that the short, 10-year period is not reliable enough to estimate yield trend [35].
At regional and national levels, soil-adjusted attainable yields may support yield gap analysis and agricultural planning. Importantly, yield gaps should not be defined relative to the most productive soils, but rather in relation to the specific soil units present. Further refinement of yield potential and yield gap estimates should account for weather variability at regional and seasonal scales, which requires additional research.
5. Conclusions
The novelty of this study lies in the integration of long-term, multi-environment yield data with officially defined soil quality classes (ALQCs) and land suitability groups (ALSGs), enabling empirical estimation of attainable winter wheat yield within these classification units under current production conditions. To the best of our knowledge, this is the first study to estimate current attainable yields not only for ALQCs and ALSGs separately, but also for their combinations (ALQC–ALSG), allowing for more precise, soil-adjusted assessment of attainable yields and yield gaps. This study confirms the general validity of the point scores assigned in late 1979 to main soil ALQCs and ALSGs which are used for wheat production in Poland.
The methodology developed in this study can be extended to other crops evaluated in COBORU multi-environment trials in Poland and may be even useful, after respective adaptation, in other countries with comparable soil classification systems and experimental data infrastructure.
Supplementary Materials
The following supporting information can be downloaded at: https://www.mdpi.com/article/10.3390/agronomy16111118/s1, Table S1. Basic statistics of yields (t/ha) in arable land quality classes in all years of study. Table S2. Basic statistics of yields (t/ha) in arable land suitability groups in all years of study. Table S3. Basic statistics of yields (t/ha) in arable land quality classes (ALQC) within suitability groups (ALSG) in all years of study.
Author Contributions
Conceptualization, M.S. and M.I.; methodology, M.S.; software, M.S.; validation, M.S.; formal analysis, M.S.; data curation, M.S. and M.I.; writing—original draft preparation, M.S. and M.I.; writing—review and editing, M.S. and M.I.; visualization, M.S. All authors have read and agreed to the published version of the manuscript.
Funding
This research received no external funding.
Data Availability Statement
The final, experimental and simplified datasets are available upon request.
Acknowledgments
The authors acknowledge the Research Centre for Cultivar Testing (COBORU) for providing the data used in this study. The authors also thank Dariusz Gozdowski for providing extensive help regarding the extraction of meteorological data and many other aspects of manuscript preparation. The authors thank Jan Stępień for their valuable comments on the preparation of Figure 3. During the preparation of this manuscript, the authors used ChatGPT (GPT-5.5 version, OpenAI, 2026) to assist in summarization of the winter wheat national average yields provided by GUS (Tables S1–S3) and code generation for Figure 3 preparation. The Google Earth Engine platform was used to access meteorological data from the ERA 5 reanalysis dataset to provide information on meteorological conditions of each experimental location in Table 1. The artificial intelligence outputs were reviewed, verified and edited by the authors, who take full responsibility for the content of this publication.
Conflicts of Interest
The authors declare no conflicts of interest.
Abbreviations
The following abbreviations are used in this manuscript:
| ALQC | Arable Land Quality Class |
| ALSG | Arable Land Suitability Group |
| ALQS | Arable Land Quality and Suitability Index |
| COBORU | Research Centre for Cultivar Testing |
| GUS | Statistics Poland |
| Q1 | First Quartile |
| Q3 | Third Quartile |
| P0.1 | 10th Percentile |
| P0.9 | 90th Percentile |
| CAP | Common Agricultural Policy |
Appendix A. Soil Classification System in Poland
This appendix provides an overview of arable land quality classes (ALQCs) and arable land suitability groups (ALSGs) used in Poland, including their characteristics, point scores, and associated yield levels.
Table A1.
Arable land soil quality classes (ASQCs) defined in Poland, based on UTKG [36].
Table A2.
Arable land suitability groups (ALSGs) and their relationship with ALQCs in Poland, based on Witek 1973 [14].
References
- Lobell, D.B.; Cassman, K.G.; Field, C.B. Crop Yield Gaps: Their Importance, Magnitudes, and Causes. Annu. Rev. Environ. Resour. 2009, 34, 179–204. [Google Scholar] [CrossRef] [Scilit]
- Van Ittersum, M.K.; Cassman, K.G.; Grassini, P.; Wolf, J.; Tittonell, P.; Hochman, Z. Yield Gap Analysis with Local to Global Relevance—A Review. Field Crops Res. 2013, 143, 4–17. [Google Scholar] [CrossRef] [Scilit]
- Fischer, R.A. Definitions and Determination of Crop Yield, Yield Gaps, and of Rates of Change. Field Crops Res. 2015, 182, 9–18. [Google Scholar] [CrossRef] [Scilit]
- Kamkar, B.; Hoogenboom, G.; Alizadeh-Dehkordi, P.; Bazkiaee, P.A.; Nehbandani, A. Comprehensive Insights into Modeling Yield Gap in Agroecosystems: Definitions, Theoretical Framework, and Multidimensional Perspectives (a Review). Agric. Syst. 2025, 228, 104392. [Google Scholar] [CrossRef] [Scilit]
- Wójcik-Gront, E.; Iwańska, M.; Wnuk, A.; Oleksiak, T. The Analysis of Wheat Yield Variability Based on Experimental Data from 2008–2018 to Understand the Yield Gap. Agriculture 2021, 12, 32. [Google Scholar] [CrossRef] [Scilit]
- Mueller, L.; Schindler, U.; Mirschel, W.; Shepherd, T.G.; Ball, B.C.; Helming, K.; Rogasik, J.; Eulenstein, F.; Wiggering, H. Assessing the Productivity Function of Soils. A Review. Agron. Sustain. Dev. 2010, 30, 601–614. [Google Scholar] [CrossRef] [Scilit]
- Senapati, N.; Semenov, M.A. Large Genetic Yield Potential and Genetic Yield Gap Estimated for Wheat in Europe. Glob. Food Secur. 2020, 24, 100340. [Google Scholar] [CrossRef] [Scilit] [PubMed]
- Ali, A.; Martelli, R.; Lupia, F.; Barbanti, L. Assessing Multiple Years’ Spatial Variability of Crop Yields Using Satellite Vegetation Indices. Remote Sens. 2019, 11, 2384. [Google Scholar] [CrossRef] [Scilit]
- Ali, A.; Martelli, R.; Scudiero, E.; Lupia, F.; Falsone, G.; Rondelli, V.; Barbanti, L. Soil and Climate Factors Drive Spatio-Temporal Variability of Arable Crop Yields under Uniform Management in Northern Italy. Arch. Agron. Soil Sci. 2023, 69, 75–89. [Google Scholar] [CrossRef] [Scilit]
- Hennings, V.; Höper, H.; Mueller, L. Small-Scale Soil Functional Mapping of Crop Yield Potentials in Germany. In Novel Methods for Monitoring and Managing Land and Water Resources in Siberia; Mueller, L., Sheudshen, A.K., Eulenstein, F., Eds.; Springer Water; Springer International Publishing: Cham, Switzerland, 2016; pp. 597–617. [Google Scholar]
- Astrauskas, P.; Staugaitis, G.; Masevičienė, A.; Žičkienė, L. Variation of Winter Wheat Grain Yield and Its Quality in Fields with Different Soil Cover. Zemdirb.-Agric. 2022, 109, 297–304. [Google Scholar] [CrossRef] [Scilit]
- Washmon, C.N.; Solie, J.B.; Raun, W.R.; Itenfisu, D.D. Within-Field Variability in Wheat Grain Yields over Nine Years in Oklahoma. J. Plant Nutr. 2002, 25, 2655–2662. [Google Scholar] [CrossRef] [Scilit]
- Prawo Geodezyjne i Kartograficzne. Ustawa z dnia 17 maja 1989 r.–Prawo Geodezyjne i Kartograficzne (Geodetic and Cartographic Law) (Dz. U. 1989 Nr 30 poz. 163). Act of 17 May 1989. Available online: https://isap.sejm.gov.pl/isap.nsf/DocDetails.xsp?id=WDU19890300163 (accessed on 19 February 2026). (In Polish)
- Witek, T. Mapy glebowo-rolnicze oraz kierunki ich wykorzystania (Agricultural-Soil Maps and Their Applications); Instytut Uprawy, Nawożenia i Gleboznawstwa: Puławy, Poland; PWRiL: Warsaw, Poland, 1973; pp. 1–75. Available online: https://www.gov.pl/web/gugik/materialy-dotyczace-map-glebowo-rolniczych (accessed on 30 October 2024). (In Polish)
- Nawar, S.; Corstanje, R.; Halcro, G.; Mulla, D.; Mouazen, A.M. Delineation of Soil Management Zones for Variable-Rate Fertilization. In Advances in Agronomy; Elsevier: Amsterdam, The Netherlands, 2017; Volume 143, pp. 175–245. [Google Scholar]
- Abbasi, D.; Ashworth, A.J.; Owens, P.R.; Winzeler, H.E.; Kharel, T.; Zhou, Y. Leveraging Digital Soil Maps and Clustering Techniques to Enhance Soil Management Zone Delineation. Agron. J. 2025, 117, e70210. [Google Scholar] [CrossRef] [Scilit]
- Witek, T.; Górski, T.; Kern, H.; Bartoszewski, Z.; Biesiadzki, A.; Budzyńska, K.; Demidowicz, G.; Deputat, T.; Flaczyk, Z.; Gałecki, Z.; et al. Waloryzacja rolniczej przestrzeni produkcyjnej Polski wg gmin (Valorization of Productive Agricultural Area of Poland in Districts); IUNiG: Puławy, Poland, 1981; pp. 1–416. (In Polish) [Google Scholar]
- Witek, T. Wpływ jakości gleby na plonowanie roślin uprawnych (Influence of the quality of soils on yielding of crops). Zesz. Probl. Postęp. Nauk Rol. 1979, 224, 35–47. (In Polish) [Google Scholar]
- Niewiadomski, W.; Zawiślak, K.; Boreńska, Ł.; Krześlak, S.; Adamiak, J.; Hruszka, M.; Kasprzykowski, W.; Nożyński, A. Plonowanie Pszenicy Ozimej w Specjalistycznych Zmianowaniach i Monokulturach w Zróżnicowanych Warunkach Glebowych (Yielding of winter wheat in specialistic crop rotations and monocultures under different soil conditions). Zesz. Probl. Post. Nauk Rol. 1988, 1988, 77–91. Available online: https://bibliotekanauki.pl/search?q=Plonowanie%2520Pszenicy%2520Ozimej%2520w%2520Specjalistycznych%2520Zmianowaniach%2520i%2520Monokulturach%2520w%2520Zr%25C3%25B3%25C5%25BCnicowanych%2520Warunkach%2520Glebowych (accessed on 8 October 2025). (In Polish)
- Iwańska, M.; Paderewski, J.; Stępień, M.; Rodrigues, P.C. Adaptation of Winter Wheat Cultivars to Different Environments: A Case Study in Poland. Agronomy 2020, 10, 632. [Google Scholar] [CrossRef] [Scilit]
- Iwańska, M.; Paderewski, J.; Stępień, M.; Rodrigues, P.C. Winter Wheat Cultivar Recommendation Based on Expected Environment Productivity. Agriculture 2021, 11, 522. [Google Scholar] [CrossRef] [Scilit]
- Stuczyński, T.; Kozyra, J.; Łopatka, A.; Siebielec, G.; Jadczyszyn, J.; Koza, P.; Doroszewski, A.; Wawer, R.; Nowocień, E. Przyrodnicze uwarunkowania produkcji rolniczej w Polsce (The natural conditions affecting agricultural production in Poland). Stud. I Rap. IUNG-PIB 2007, 7, 77–115. Available online: https://www.iung.pl/studia-i-raporty-pib/ (accessed on 22 February 2026). (In Polish)
- Studnicki, M.; Derejko, A.; Wójcik-Gront, E.; Kosma, M. Adaptation Patterns of Winter Wheat Cultivars in Agro-Ecological Regions. Sci. Agric. (Piracicaba Braz.) 2019, 76, 148–156. [Google Scholar] [CrossRef] [Scilit]
- Barabasz, W.; Bednarek, R.; Gonet, S.S.; Baran, S.; Weber, J.; Kucharski, J.; Kabała, C.; Wyszkowska, J.; Marcinek, J.; Mocek, A.; et al. Gleboznawstwo (Soil Science), 1st ed.; PWN: Warsaw, Poland, 2015. (In Polish) [Google Scholar]
- Hersbach, H.; Bell, B.; Berrisford, P.; Hirahara, S.; Horányi, A.; Muñoz-Sabater, J.; Nicolas, J.; Peubey, C.; Radu, R.; Schepers, D.; et al. The ERA5 global reanalysis. Q. J. R. Meteorol. Soc. 2020, 146, 1999–2049. [Google Scholar] [CrossRef] [Scilit]
- Webb, R.A. Use of the boundary line in the analysis of biological data. J. Hortic. Sci. 1972, 47, 309–319. [Google Scholar] [CrossRef] [Scilit]
- Miti, C.; Milne, A.E.; Giller, K.E.; Lark, R.M. The concepts and quantification of yield gap using boundary lines. A review. Field Crops Res. 2024, 311, 109365. [Google Scholar] [CrossRef] [Scilit]
- Strzemski, M.; Siuta, J.; Witek, T. Przydatność Rolnicza Gleb Polski; Państwowe Wydawnictwo Rolnicze i Leśne (PWRiL), Warszawa (Warsaw, Poland): Warsaw, Poland, 1973. [Google Scholar]
- Kowalska, J.; Jończyk, K.; Holka, M. Instrukcja uprawy pszenicy ozimej ze szczególnym uwzględnieniem ochrony roślin w systemie ekologicznym. 2024. Available online: https://www.ior.poznan.pl/plik,4778,instrukcja-uprawy-pszenicy-ozimej-ze-szczegolnym-uwzglednieniem-ochrony-roslin-w-systemie-ekologicznym-pdf.pdf (accessed on 18 February 2026).
- Wyniki PDO-SDOO Cicibór Duży (Results of PDO_-SDO Cicibór Duży. Available online: https://cicibor.coboru.gov.pl/wyniki (accessed on 11 March 2026). (In Polish)
- Lisowski, J.; Żochowski, Ł.; Konarzewski, P. Porównanie lonowania żyta hybrydowego i populacyjnego w dwóćh okresach wegetacyjnych (Comparison of hybrid and population rye yields in two growing seasons). SJIAAS 2025, 94, 116–132. (In Polish) [Google Scholar] [CrossRef] [Scilit]
- Rudnicki, F.; Gałęzewski, L. Efekty Oddziaływań Brzegowych w Doświadczeniach z Owsem Wysiewanym w Różnych Gęstościach (Border effect in experimental study with sowing rate of oat). Biul. IHAR 2006, 73–83. (In Polish) [Google Scholar] [CrossRef] [Scilit]
- Stawiana-Kosiorek, A.; Gołaszewski, J.; Załuszki, D. Efekty Konkurencyjności Roślin Pszenżyta Ozimego w Doświadczeniach Polowych (Competition effects of winter triticale lants in field trials). Biul. IHAR 2007, 97–107. (In Polish) [Google Scholar] [CrossRef] [Scilit]
- Iwańska, M.; Stępień, M. The Effect of Soil and Weather Conditions on Yields of Winter Wheat in Multi-Environmental Trials. Biom. Lett. 2019, 56, 263–279. [Google Scholar] [CrossRef] [Scilit]
- Nielsen, R.L. Grain Yield Trend Lines: Don’t Be Fooled. Corny News Network. Available online: https://www.agry.purdue.edu/ext/corn/news/timeless/YieldTrendEstimation.html (accessed on 19 May 2026).
- UTKG. Urzędowa Tabela Klas Gruntów, załącznik do Rozporządzenia Rady Ministrów z dnia 12 września 2012 r. w sprawie gleboznawczej klasyfikacji gruntów (Official Table of Land Classes) (Dz.U. z 2012 r., poz. 1246). Available online: https://eli.sejm.gov.pl/eli/DU/2012/1246/ogl (accessed on 7 August 2025). (In Polish)
- Zawadzki, S.; Walczak, R.T.; Stępniewski, W.; Smyk, B.; Skawina, T.; Prusinkiewicz, Z.; Bednarek, R.; Białousz, S.; Dobrzański, B.; Gliński, J.; et al. (Eds.) Gleboznawstwo: Podręcznik Dla Studentów (Soil Science. Student’s Manual); Wydanie IV poprawione i uzupełnione; Państwowe Wydawnictwo Rolnicze i Leśne: Warsaw, Poland, 1999. [Google Scholar]

Disclaimer/Publisher’s Note: The statements, opinions and data contained in all publications are solely those of the individual author(s) and contributor(s) and not of MDPI and/or the editor(s). MDPI and/or the editor(s) disclaim responsibility for any injury to people or property resulting from any ideas, methods, instructions or products referred to in the content. |
© 2026 by the authors. Licensee MDPI, Basel, Switzerland. This article is an open access article distributed under the terms and conditions of the Creative Commons Attribution (CC BY) license.