


Abstract
This study investigates the effect of initial microstructure on the high-pressure mechanical properties of high-purity tin (Sn). Two Sn samples from the same commercial product were measured using high-pressure X-ray diffraction in diamond anvil cells. At ambient pressure, the two samples exhibited different initial crystallographic orientations; one showed random orientation, while the other exhibited preferred orientation (i.e., texture). In the low-pressure β-Sn phase, both samples exhibited the same bulk moduli with = 55.0 ± 0.4 and 55.0 ± 2.3 GPa, respectively. However, their compressional behavior diverged significantly after the phase transition from β-Sn to the body-centered tetragonal (BCT) phase. The measured bulk moduli for the BCT phase were 60.0 ± 0.9 GPa for the randomly oriented Sn and 91.3 ± 1.4 GPa for the textured one. These results indicate that the initial microstructure can significantly influence the compressional response of Sn under high pressure.
1. Introduction
Sn is a well-known metal for its excellent ductility and malleability as well as its superior corrosion resistance and soldering properties. Sn has been used as a major alloying element since ancient times, and it plays an important role in a wide range of applications in modern industry from soldering in the electronics industry to protective coatings [1,2].
Due to its technological importance, many studies have been conducted on physical and mechanical properties of Sn [3,4,5]. In particular, the equation of state (EOS) of Sn under pressure has been extensively investigated both experimentally and theoretically, often using a combination of diamond anvil cells (DACs) and X-ray diffraction (XRD) [6,7,8,9].
Sn exhibits complex phase-transition behavior under high pressure. Sn transforms from β-Sn (I41/amd) to the BCT (I4/mmm) phase at approximately 10 GPa [10,11,12,13,14,15,16,17]. Upon further compression, it undergoes a gradual transition toward the BCC (body-centered cubic, Imm) phase over a broad pressure range [11,12,13,14,15,16,17]. Furthermore, a transition to the hexagonal close-packed (HCP) phase has been reported above approximately 150–160 GPa [16,18]. The β-Sn to BCT transition has also been directly observed under shock compression using time-resolved X-ray diffraction [19]. The high-pressure structural stability and compressional behavior of Sn have also been extensively investigated using first-principles calculations and related theoretical approaches [20,21,22,23,24]. These theoretical predictions have been compared with experimental high-pressure results [9,15,16].
Meanwhile, there are variations in the bulk moduli for Sn reported in the literature [6,15]. These variations are thought to arise from differences in experimental conditions, such as the pressure-transmitting medium (PTM) and initial condition of the sample [9,17]. In addition to these experimental factors, the microstructure and crystallographic texture of the sample can also influence its physical and mechanical properties [25]. In this context, recent shock-compression experiments on single-crystal Sn have also examined the effect of crystallographic orientation on its mechanical response and β-Sn to BCT phase transition [26]. Owing to its low melting temperature, Sn can undergo recrystallization and grain growth even near room temperature [27]. Room-temperature crystal growth in thin Sn sheets has also been experimentally reported [28]. Therefore, variations in the initial microstructure of Sn may influence its high-pressure compressional response.
Two Sn foils obtained from the same commercial package were investigated by high-pressure synchrotron XRD in 2007 and 2026. The second sample, which had been stored at room temperature, exhibited a distinct crystallographic orientation compared with the first one. Thus, these two separate high-pressure XRD experiments provide a comparison of the structural and elastic properties of Sn foils with different crystallographic orientations. The crystal structures under high pressure were analyzed by Rietveld refinement, and their bulk moduli were determined by fitting the pressure–volume data using the Birch–Murnaghan equation of state model.
2. Materials and Methods
Two Sn foils with a purity of 99.99+% and a thickness of 25 µm were purchased from Goodfellow (Huntingdon, UK) and used in their original condition without any additional processing. The Sn foil samples were cut into pieces of a suitable size using a surgical knife and then loaded into the DAC.
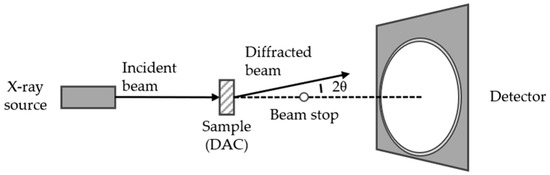
Synchrotron XRD was used to investigate the mechanical properties of Sn under high-pressure conditions, as schematically illustrated in Figure 1. The first high-pressure XRD experiment was performed at the High Flux Materials Science beamline, a wiggler beamline, whereas the second experiment was conducted at the 5A X-ray Scattering Beamline for Materials Science, an undulator beamline, at Pohang Accelerator Laboratory (PAL) in South Korea.
Figure 1.
X-ray diffraction schematic diagram.
In the first experiment, the X-ray energy was 18.0 keV, and the diffraction patterns were recorded using a Mar345 image plate detector (marXperts GmbH, Norderstedt, Germany). The distance between the sample and the detector was 248.6 mm, and the diameter of the double pinhole was 100 µm. The first high-pressure experiment was done in 2007 using a Mao-Bell diamond anvil cell. A pristine Sn sample was mounted in a stainless steel 301 gasket with a 235 µm-diameter hole between two opposing diamond anvils with 350 µm culets. Several tiny ruby chips were mounted to serve as pressure indicators [29], and pressure was measured by ruby fluorescence using a spectrometer equipped with a Triax 320 CCD detector (HORIBA Jobin Yvon Inc., Edison, NJ, USA). The standard deviation of pressure measured at 49.14 GPa was ±0.84 GPa.
In the second experiment, the X-ray energy of 17.9 keV was used, and diffraction patterns were also recorded using a Mar345 image plate detector. The sample-to-detector distance was 269.0 mm, and a single pinhole collimator with a diameter of 90 µm was used. The sample was mounted in a stainless steel 301 gasket with a 150 µm diameter hole between two opposing diamond anvils with 300 µm culets. The second high-pressure experiment was conducted in 2026 using a symmetric diamond anvil cell. Several tiny ruby spheres (RSA Le rubis SA, Grenoble, France) were mounted to serve as pressure markers [29], and the ruby spectra were measured using a QE-Pro spectrometer (Ocean Optics, Inc., Dunedin, FL, USA) equipped with a 1024-pixel high-sensitivity CCD detector capable of measuring a wavelength range of 680–750 nm and an 1800 grooves/mm grating. A liquid mixture of methanol and ethanol in a 4:1 ratio was used as the pressure-transmitting medium (PTM) in both experiments.
After the second high-pressure experiment, a field-emission scanning electron microscope (FE-SEM; Apreo LoVac, Waltham, MA, USA) equipped with an EDAX-TSL OIM™ EBSD system (Mahwah, NJ, USA) was used to characterize the microstructure of Sn [30]. The Sn foil surface was prepared by argon-ion (Ar+) milling at an ion-beam voltage of 0.8 kV and an incident angle of 10° for 5 min. Electron backscatter diffraction (EBSD) characterization was subsequently performed at an accelerating voltage of 20 kV and a magnification of 150×. The critical misorientation angle for grain identification was set to 10°.
3. Results
Rietveld refinement was applied to analyze the XRD data [31]. The sample-to-detector distance, detector center, tilt, and rotation were calibrated with the DIOPTAS program (version 0.5.0) [32], using LaB6 and CeO2 as standard reference materials (SRMs) for the first and second experiments, respectively. An instrumental function was independently obtained for each beamline using the SRM data and the TOPAS (version 6.0) program to deconvolute the XRD patterns [33,34], thereby removing the influence of instrumental differences on the refined lattice parameters. The XRD patterns of Sn were then analyzed. The crystal structure, lattice constants, and unit cell volume were determined with the TOPAS program. The structural analyses of Sn were done by referring to the inorganic crystal database [35].
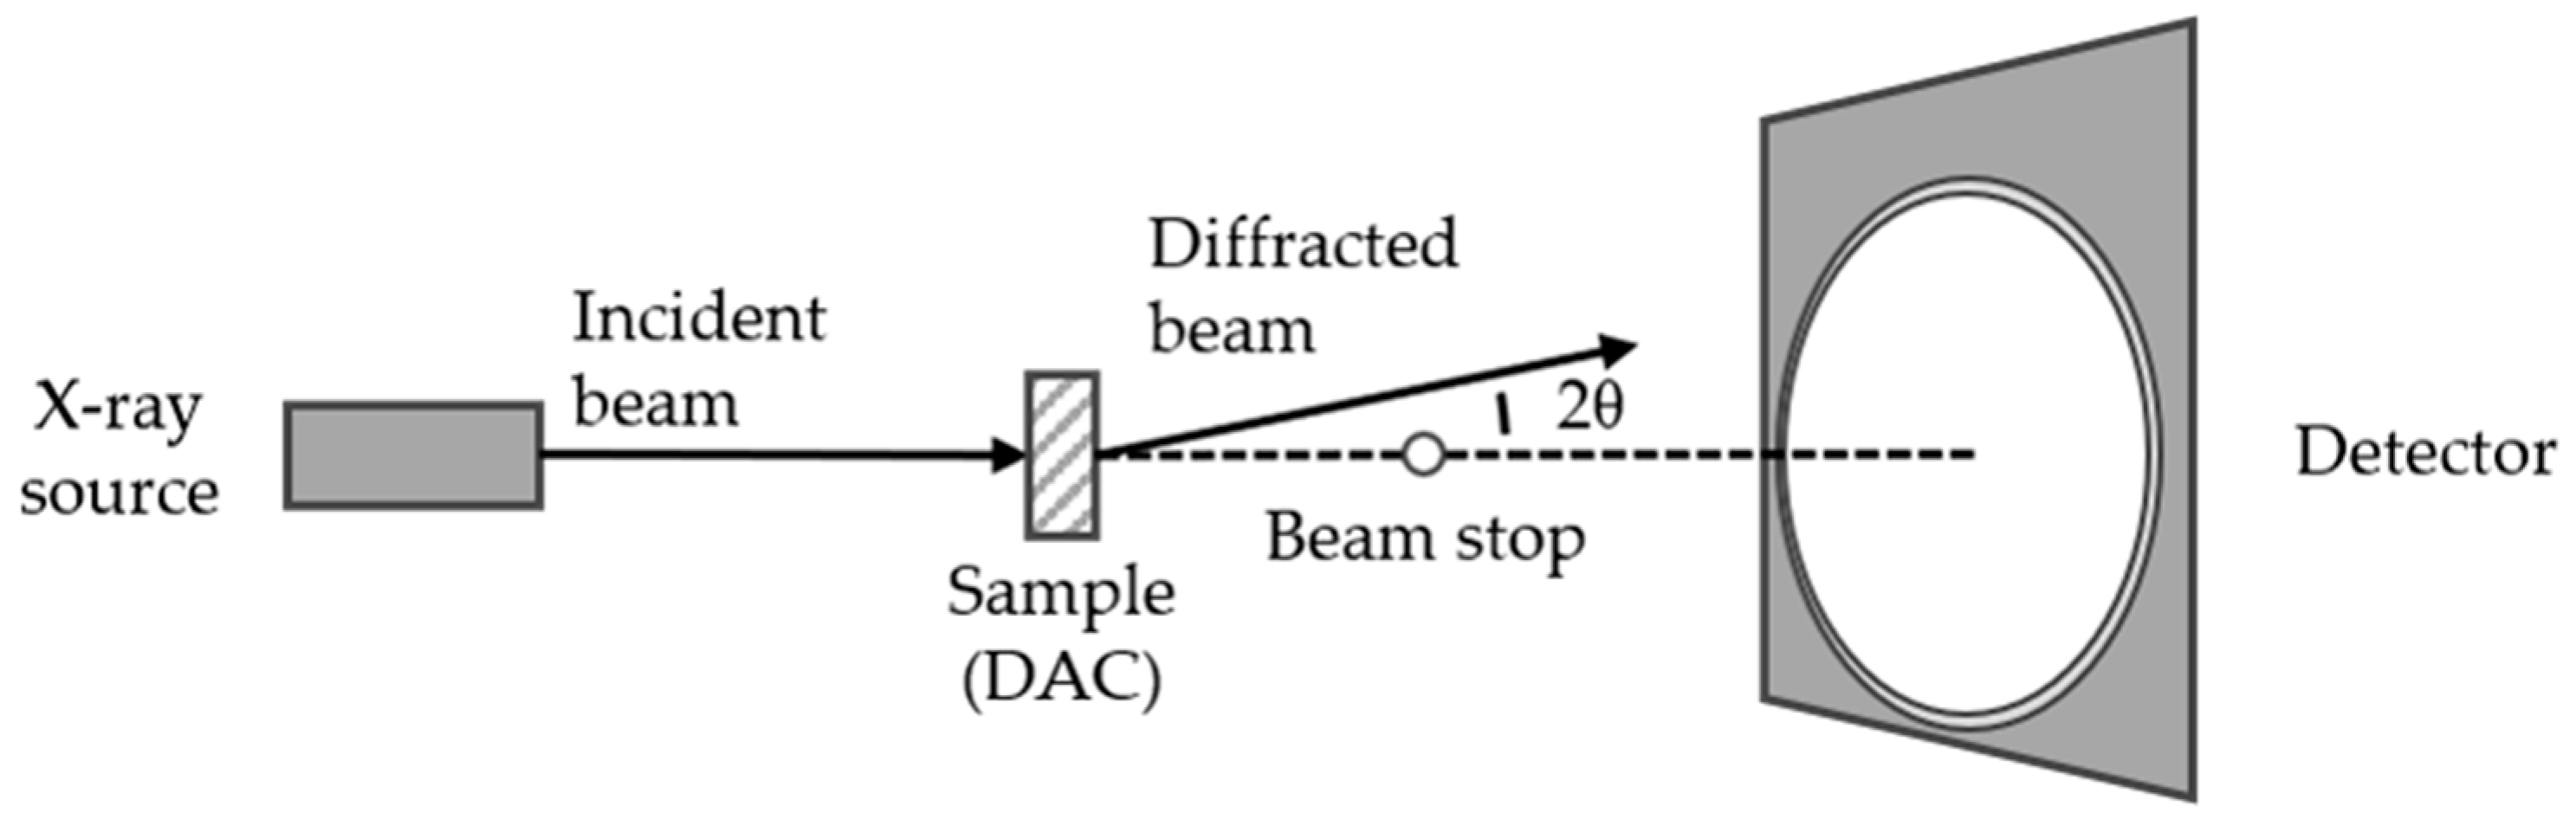
Figure 2 shows a comparison of the 2D XRD patterns of the two Sn samples at 0.0 GPa. In order to see a typical diffraction pattern of the Sn foil with texture, it was mounted on a slide glass using a 3M Scotch tape. In contrast to the first sample, which showed continuous Debye rings with nearly uniform intensity [36], shown in Figure 2a, the second sample, shown in Figure 2b, stored at room temperature from 2007 to 2026, exhibited discontinuous arc-shaped diffraction with a spotty appearance. This indicates that the latter displays preferred orientation (i.e., textured material) in contrast to normal polycrystalline Sn which exhibits random orientation [37].
Figure 2.
2D XRD patterns of (a) randomly oriented Sn of the first experiment, and (b) textured Sn of the second experiment.
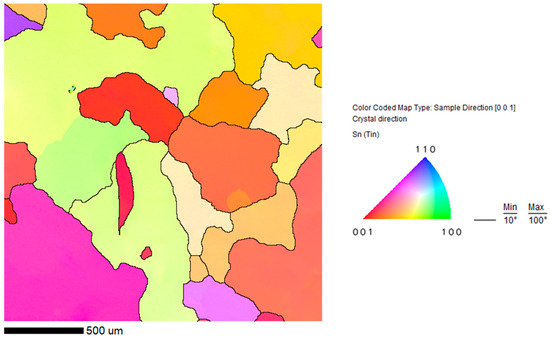
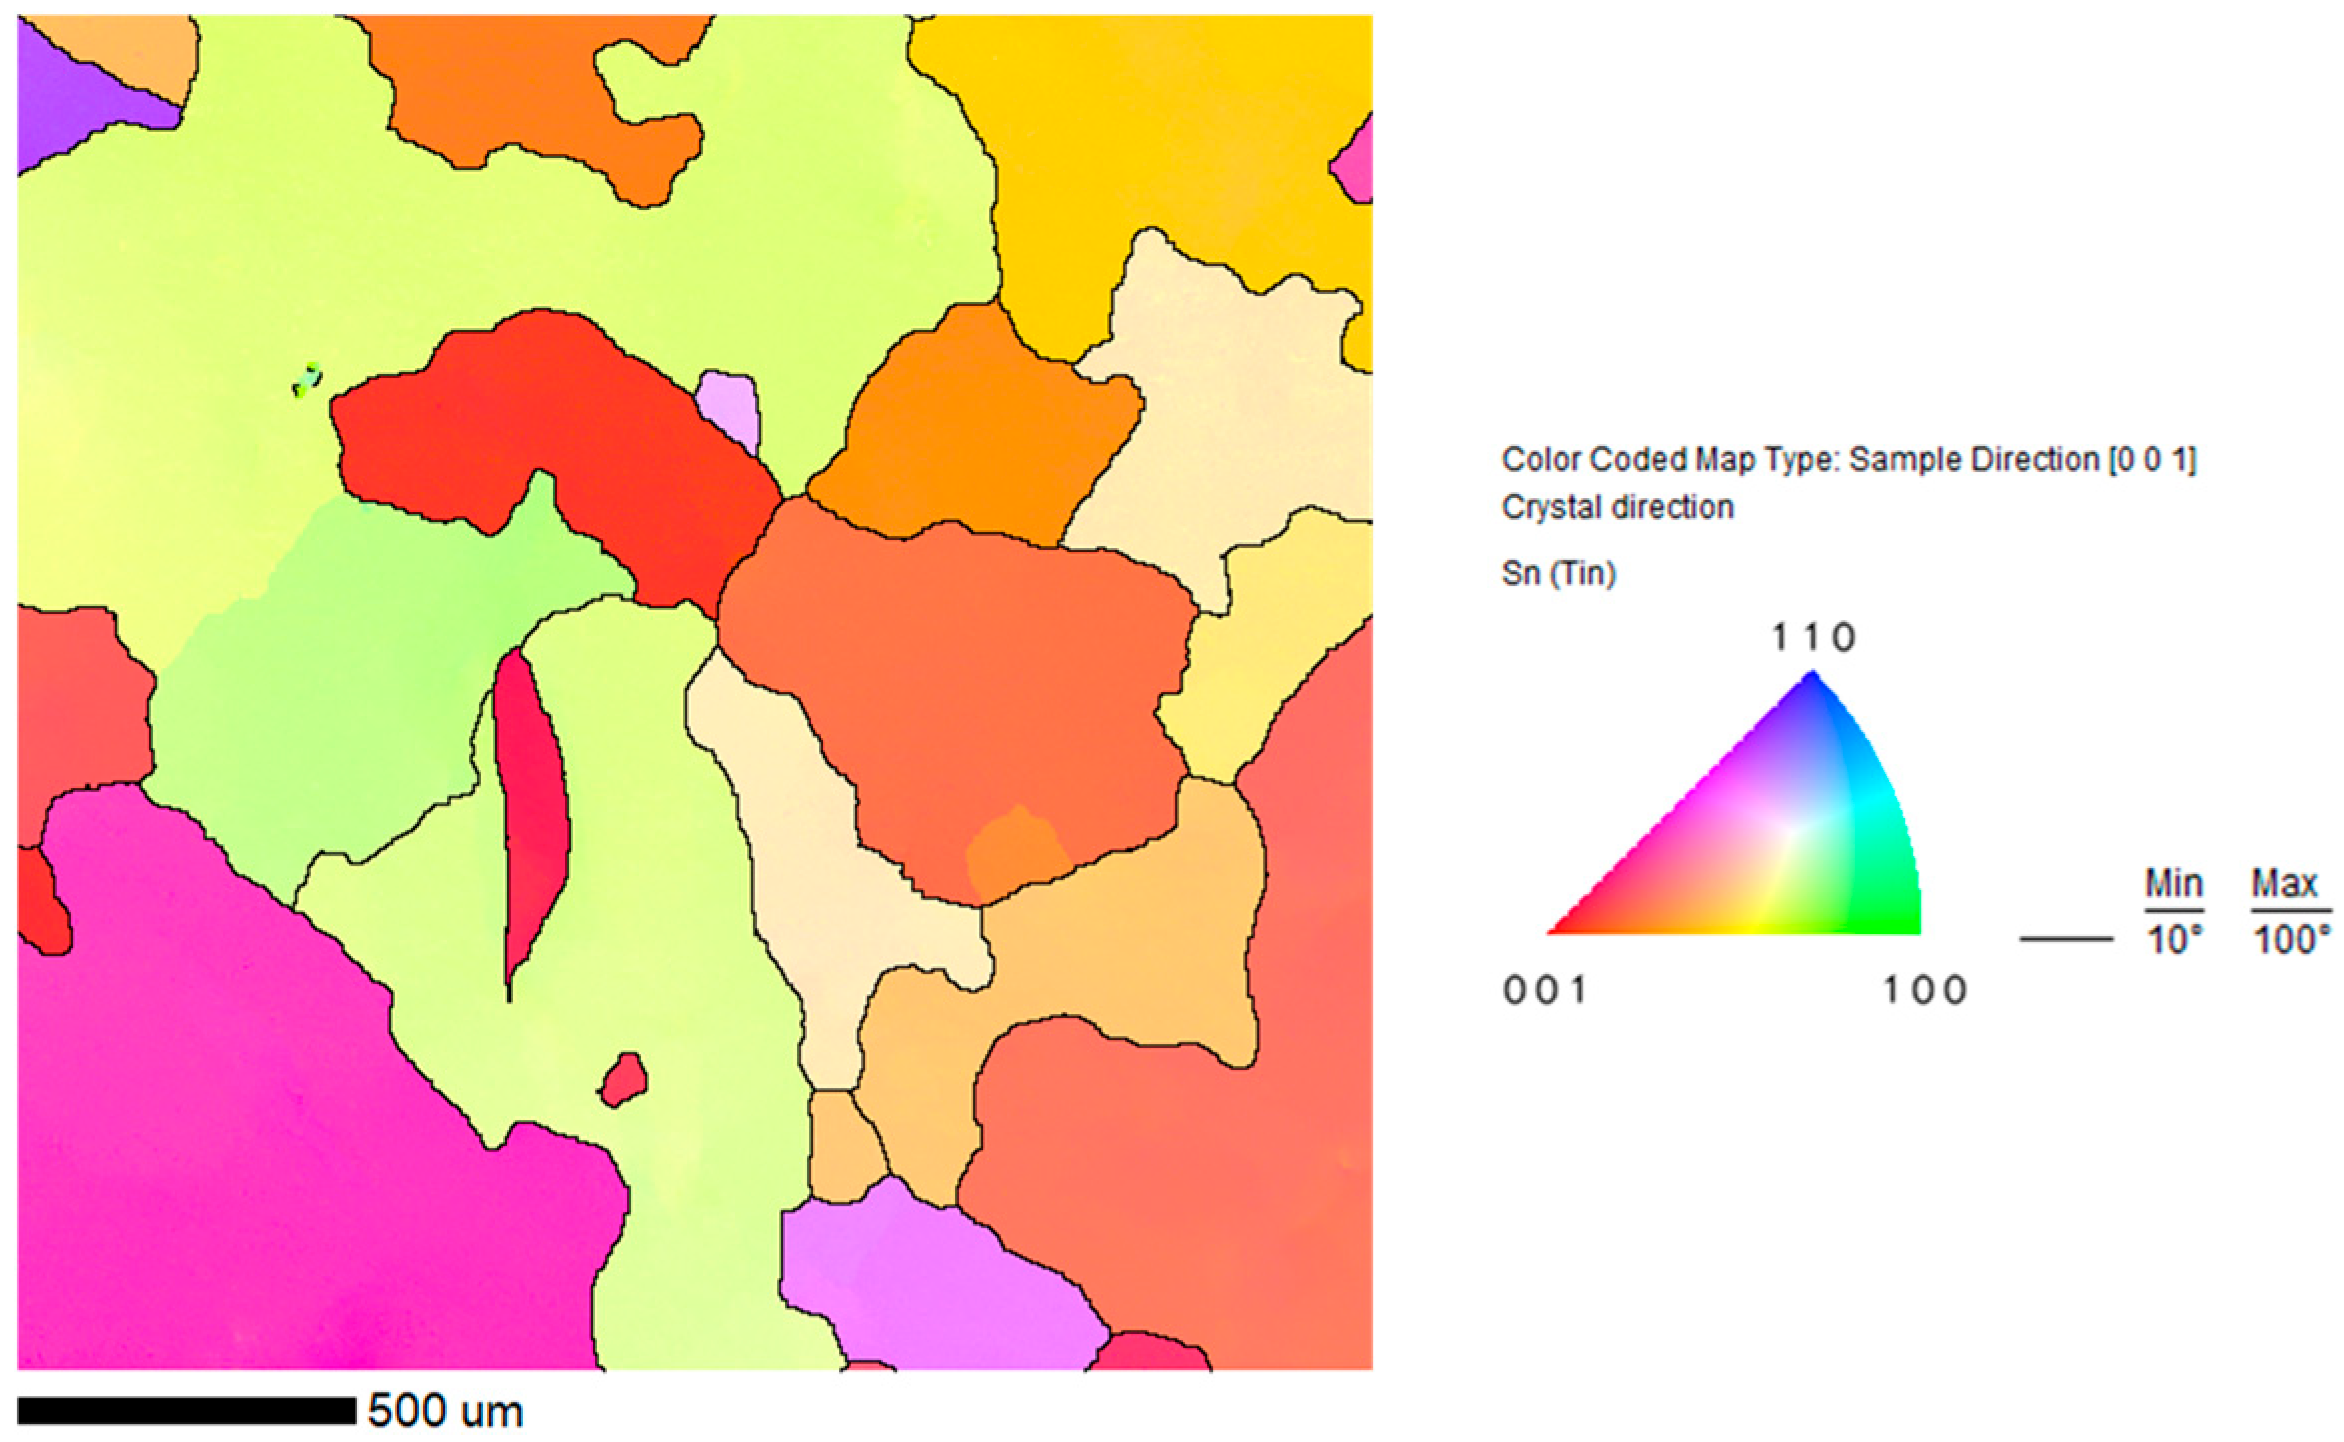
FE-SEM-based EBSD analysis was performed to confirm the presence of a textured microstructure suggested by the spotty diffraction pattern of the second Sn sample. As shown in Figure 3, the inverse pole figure (IPF) orientation map reveals coarse grains with preferred crystallographic orientations. The observed grains extend from several hundred micrometers to approximately the millimeter scale. Nishikawa and Asahara reported continuous crystal growth in a thin Sn sheet after storage at room temperature for 18 days [28]. The difference between the continuous Debye rings in Figure 2a and the spotty diffraction pattern in Figure 2b, together with the EBSD results, indicates substantial grain growth accompanied by the development of a textured microstructure.
Figure 3.
EBSD inverse pole figure (IPF) orientation map of textured Sn used in the second experiment. The colors indicate crystallographic orientations parallel to the sample [001] direction. Black lines indicate grain boundaries.
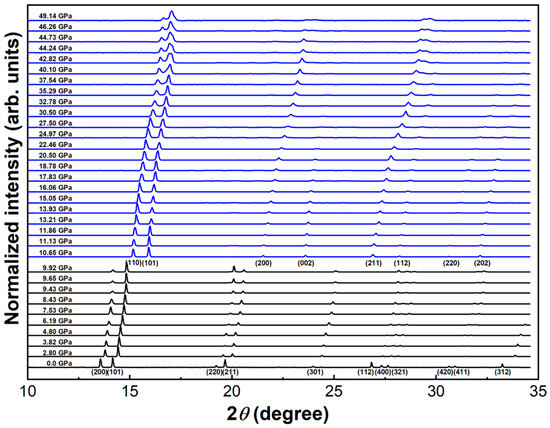
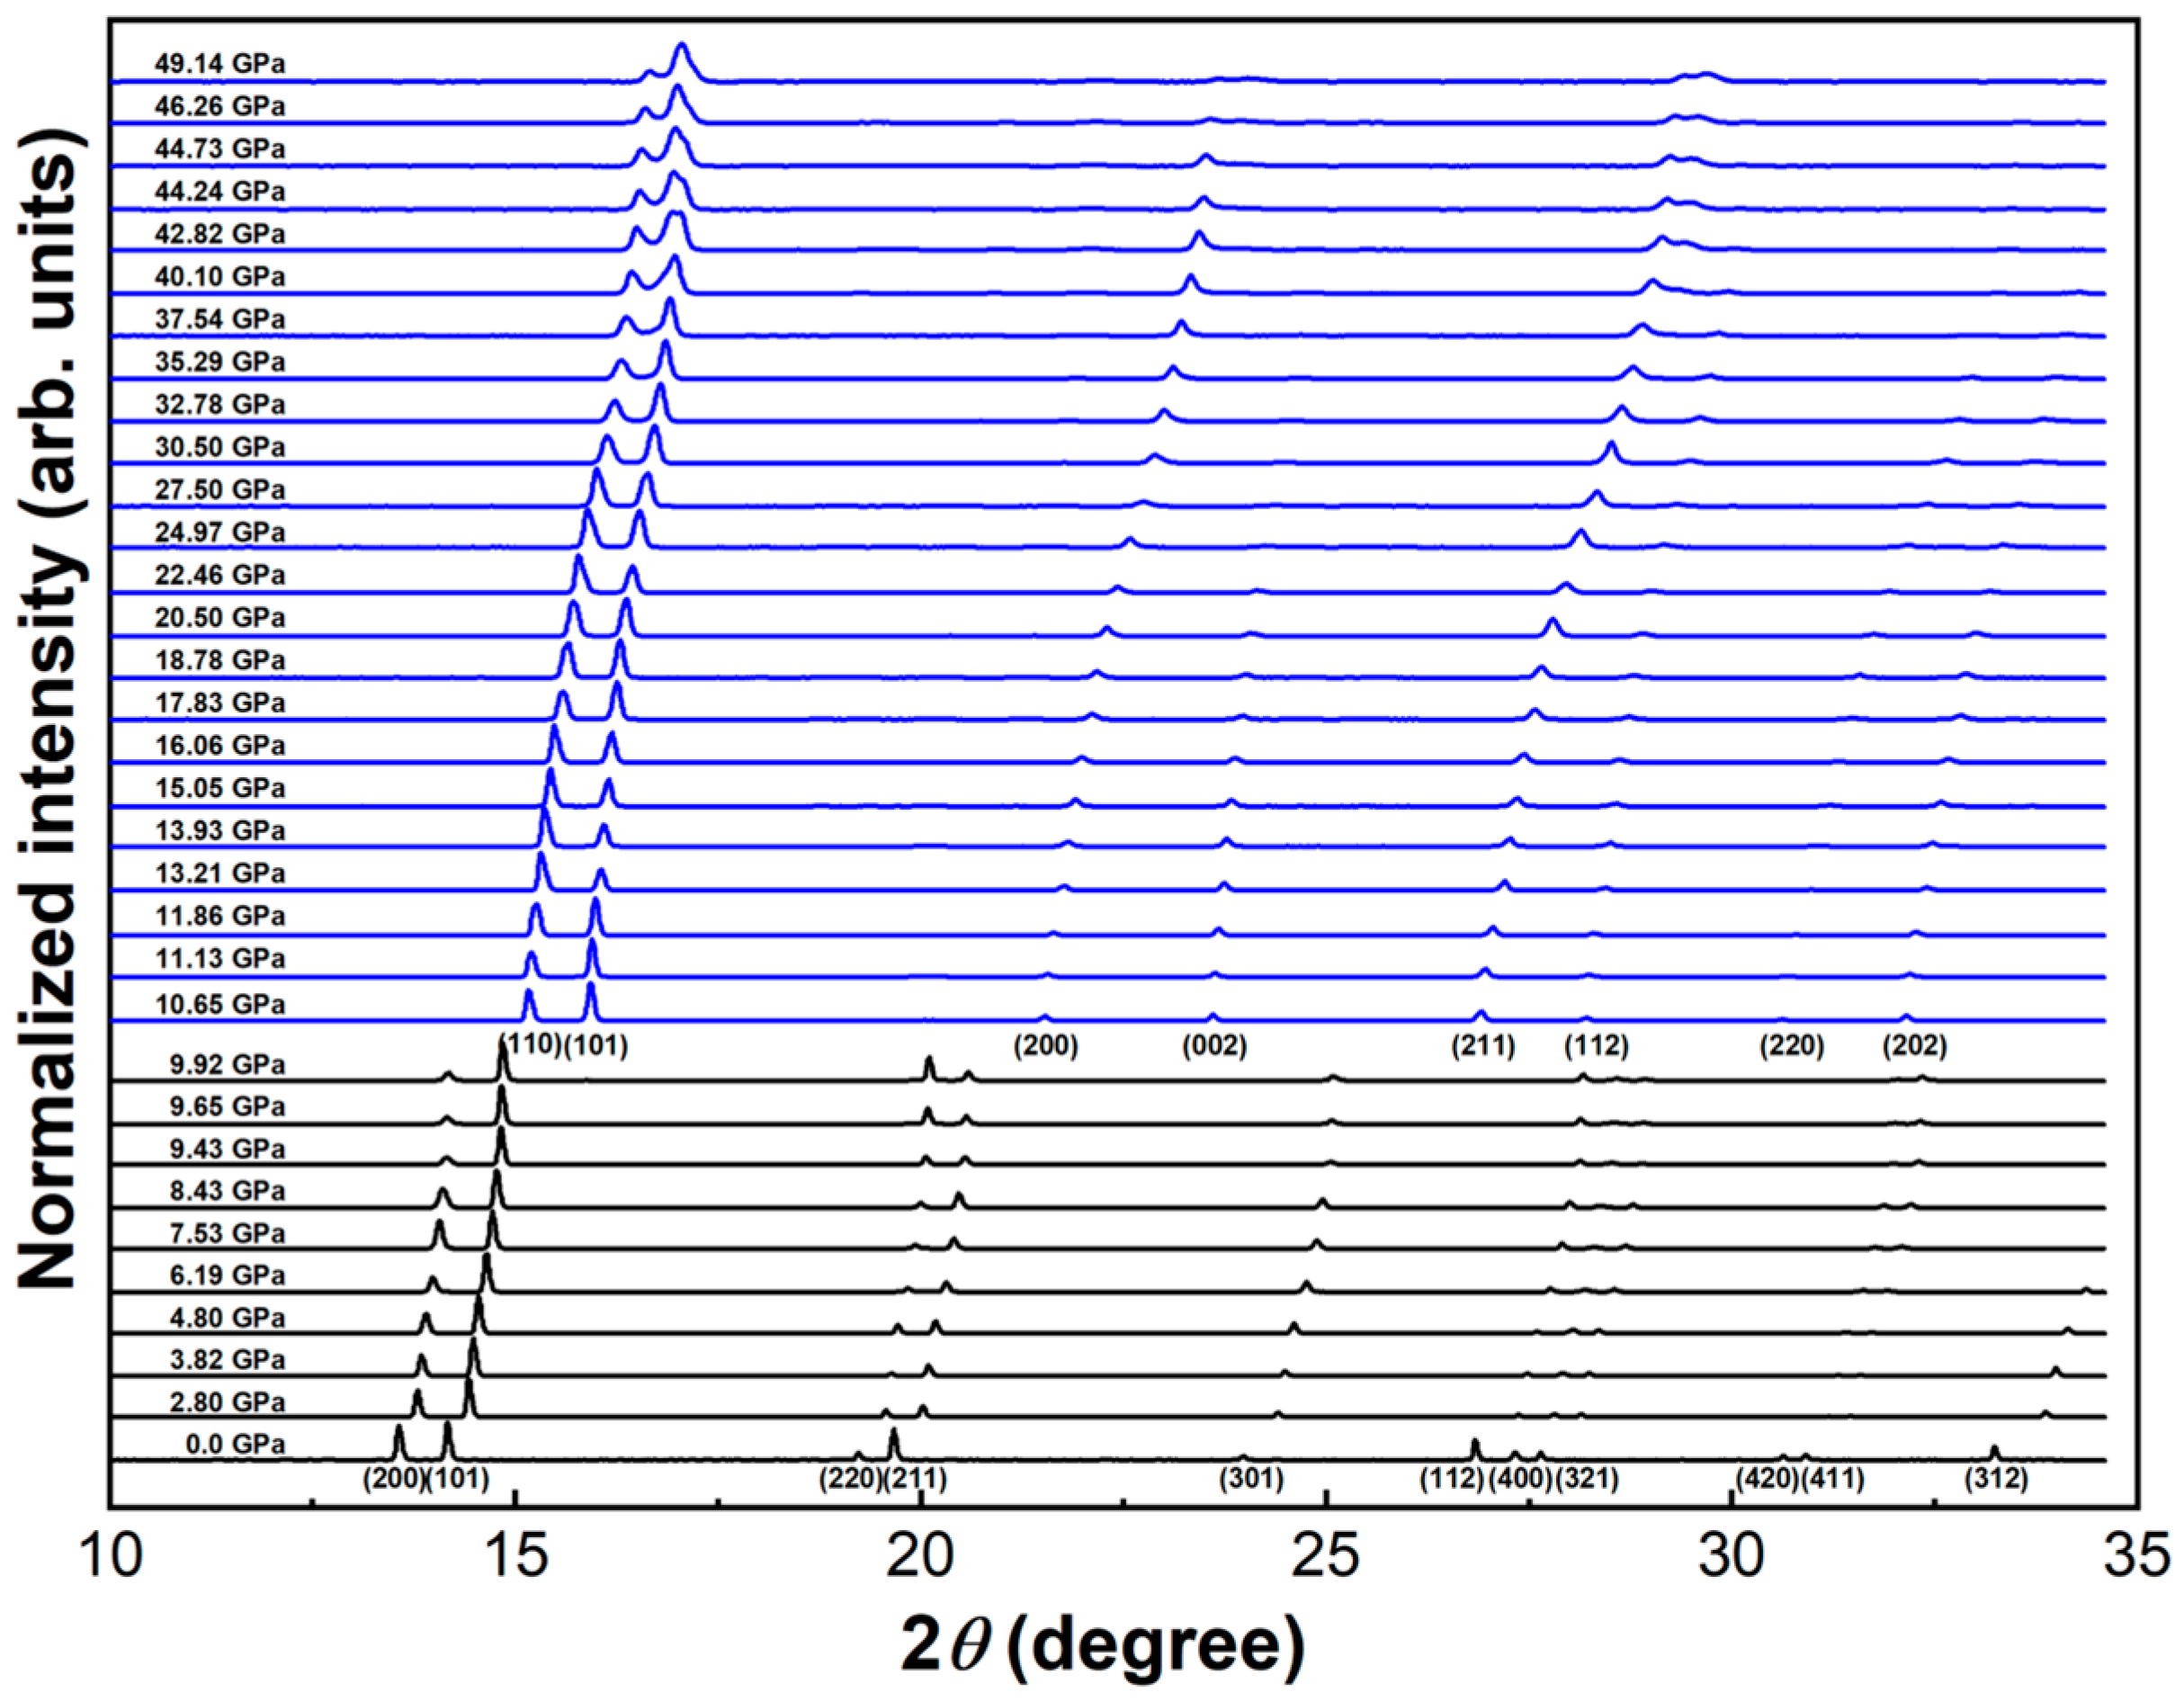
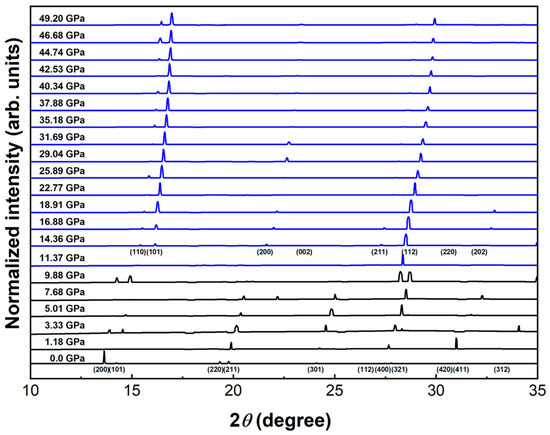
Figure 4 shows the results of the first high-pressure XRD experiment on the randomly oriented Sn sample. The 2D XRD images were angularly integrated into one-dimensional XRD patterns. As the applied pressure increased, the diffraction peaks shifted to higher angles. An abrupt peak shift was observed between 9.92 and 10.65 GPa, indicating a structural change associated with the pressure-induced phase transition. During compression up to 49.14 GPa, the randomly oriented Sn underwent sequential phase transition from the initial β-Sn through BCT phase and eventually to a region where the BCT and BCC phases coexist. This transition sequence was also confirmed by Rietveld refinement analyses. The experiment was conducted up to 49.14 GPa, which was the pressure limit of the DAC.
Figure 4.
XRD patterns of randomly oriented Sn with increasing pressure. Data are vertically offset for clarity. Black and blue lines represent the β-Sn and BCT phases, respectively. The corresponding reflections are indexed by their Miller indices (hkl).
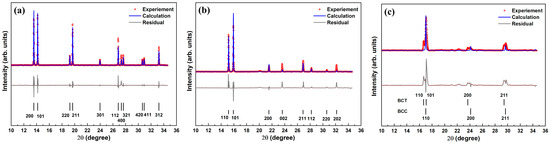
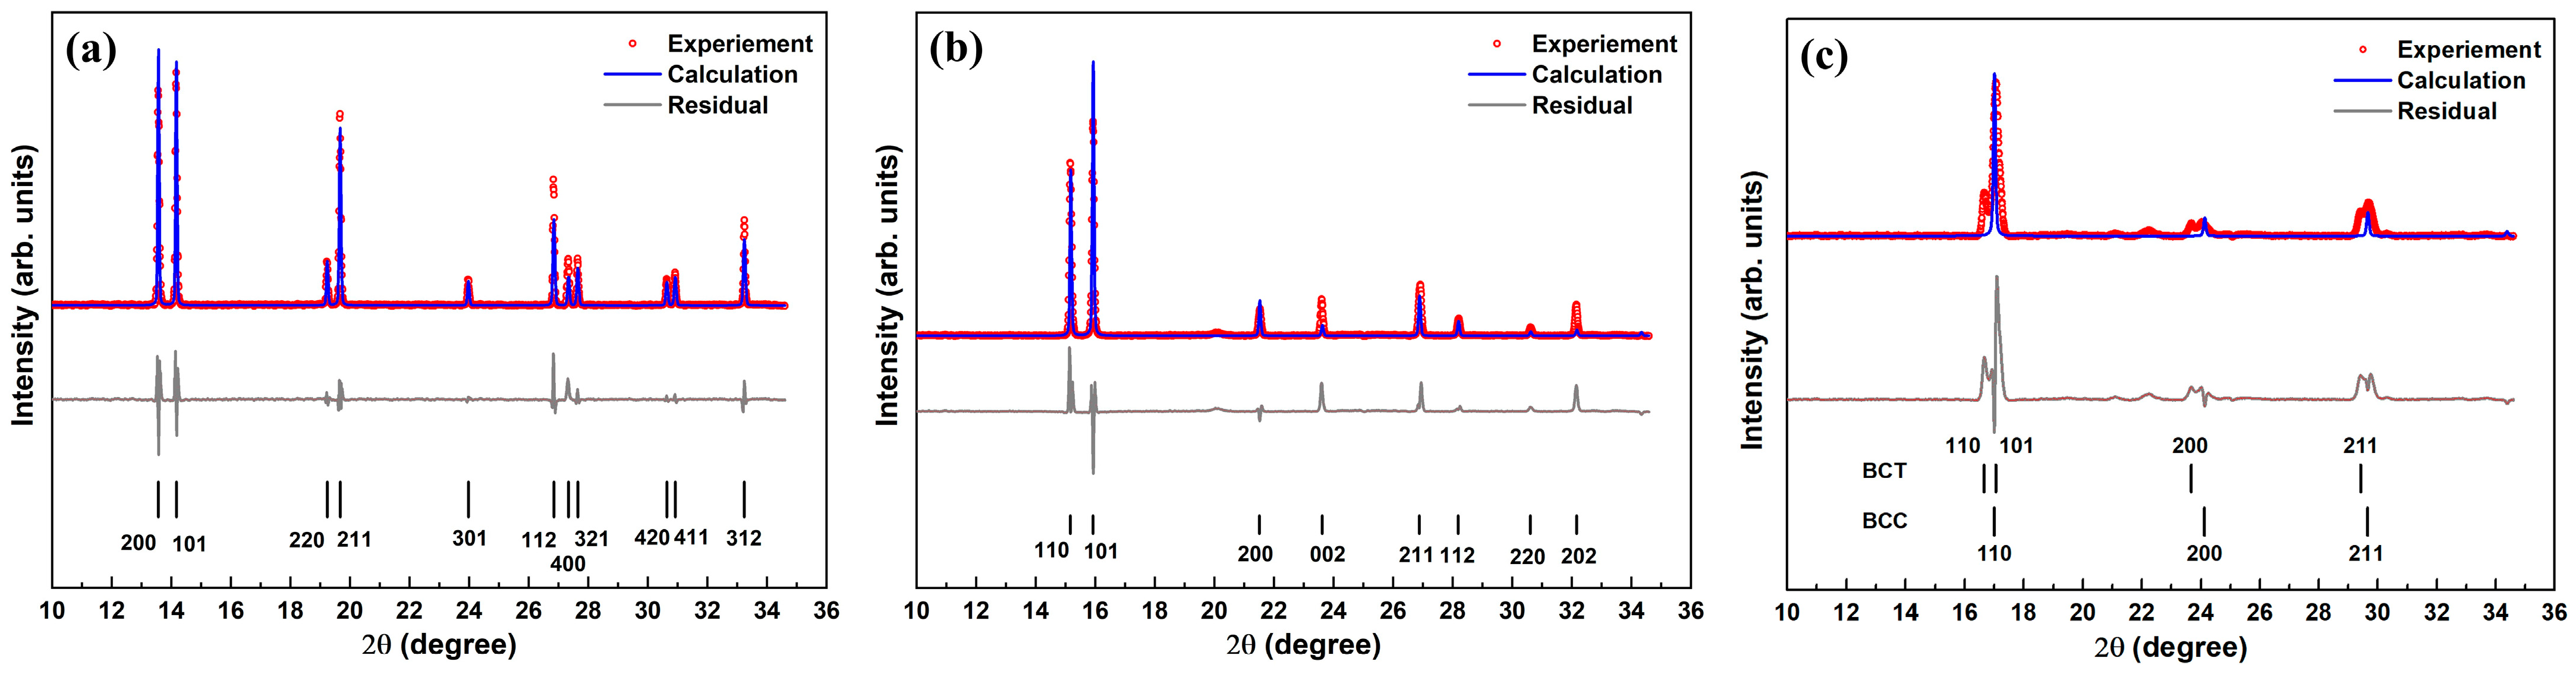
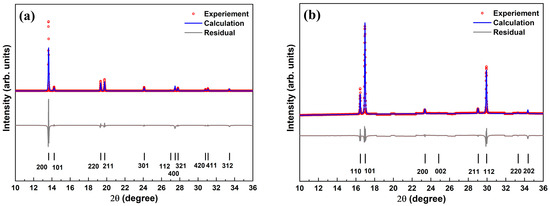
Figure 5a shows the results of the Rietveld analysis performed using space group I41/amd at 0.0 GPa. In Figure 5b, β-Sn transformed into the BCT phase at 10.65 GPa. The volume reduction associated with the β-Sn to BCT transition was calculated to be approximately 3%, indicating densification of Sn across the transition. At the maximum pressure of 49.14 GPa (Figure 5c), coexistence of the BCT and BCC phases was observed. Although diffraction peaks from both the BCT and BCC structures were superposed, the result of refinement with mixed phase was not good enough to give better one. Thus, the refinement was performed using only Imm phase. The lattice parameters obtained by Rietveld refinement at each pressure are summarized in Table 1.
Figure 5.
Rietveld refinement results of randomly oriented Sn at (a) 0.0 GPa, (b) 10.65 GPa, and (c) 49.14 GPa. The red dots are experimental data, the blue lines are calculated data, the gray lines are residual values, and the black bars indicate the peak positions.
Table 1.
Comparison of parameters obtained from the Rietveld refinement for Sn.
The observed phase sequence, β-Sn → BCT → BCC, was consistent with previous experimental and theoretical studies [11,12,13,14,15,16,17]. Salamat et al. reported that the (200) and (211) reflections of the BCT phase deviated from tetragonal constraints and exhibited orthorhombic distortion (Immm) above approximately 32 GPa [15], whereas Fréville et al. treated the corresponding high-pressure phase as BCT because of the similarity between the BCT and BCO diffraction patterns [16]. Based on the result of Fréville et al. and the fact that assigning the orthorhombic space group in place of tetragonal space group requires more observed diffraction peaks [38], the high-pressure phase was assigned as BCT. Although the precise onset pressure of the BCT → BCC transition was not determined in this study, coexistence of the BCT and BCC phases was confirmed at the maximum pressure. Table 2 summarizes the bulk modulus and its pressure derivative obtained in the first experiment together with previously reported experimental and calculated values, showing good agreement for both β-Sn and BCT-Sn.
Table 2.
Comparison of bulk moduli () and their pressure derivatives () for various phases of Sn with previous experimental and theoretical values.
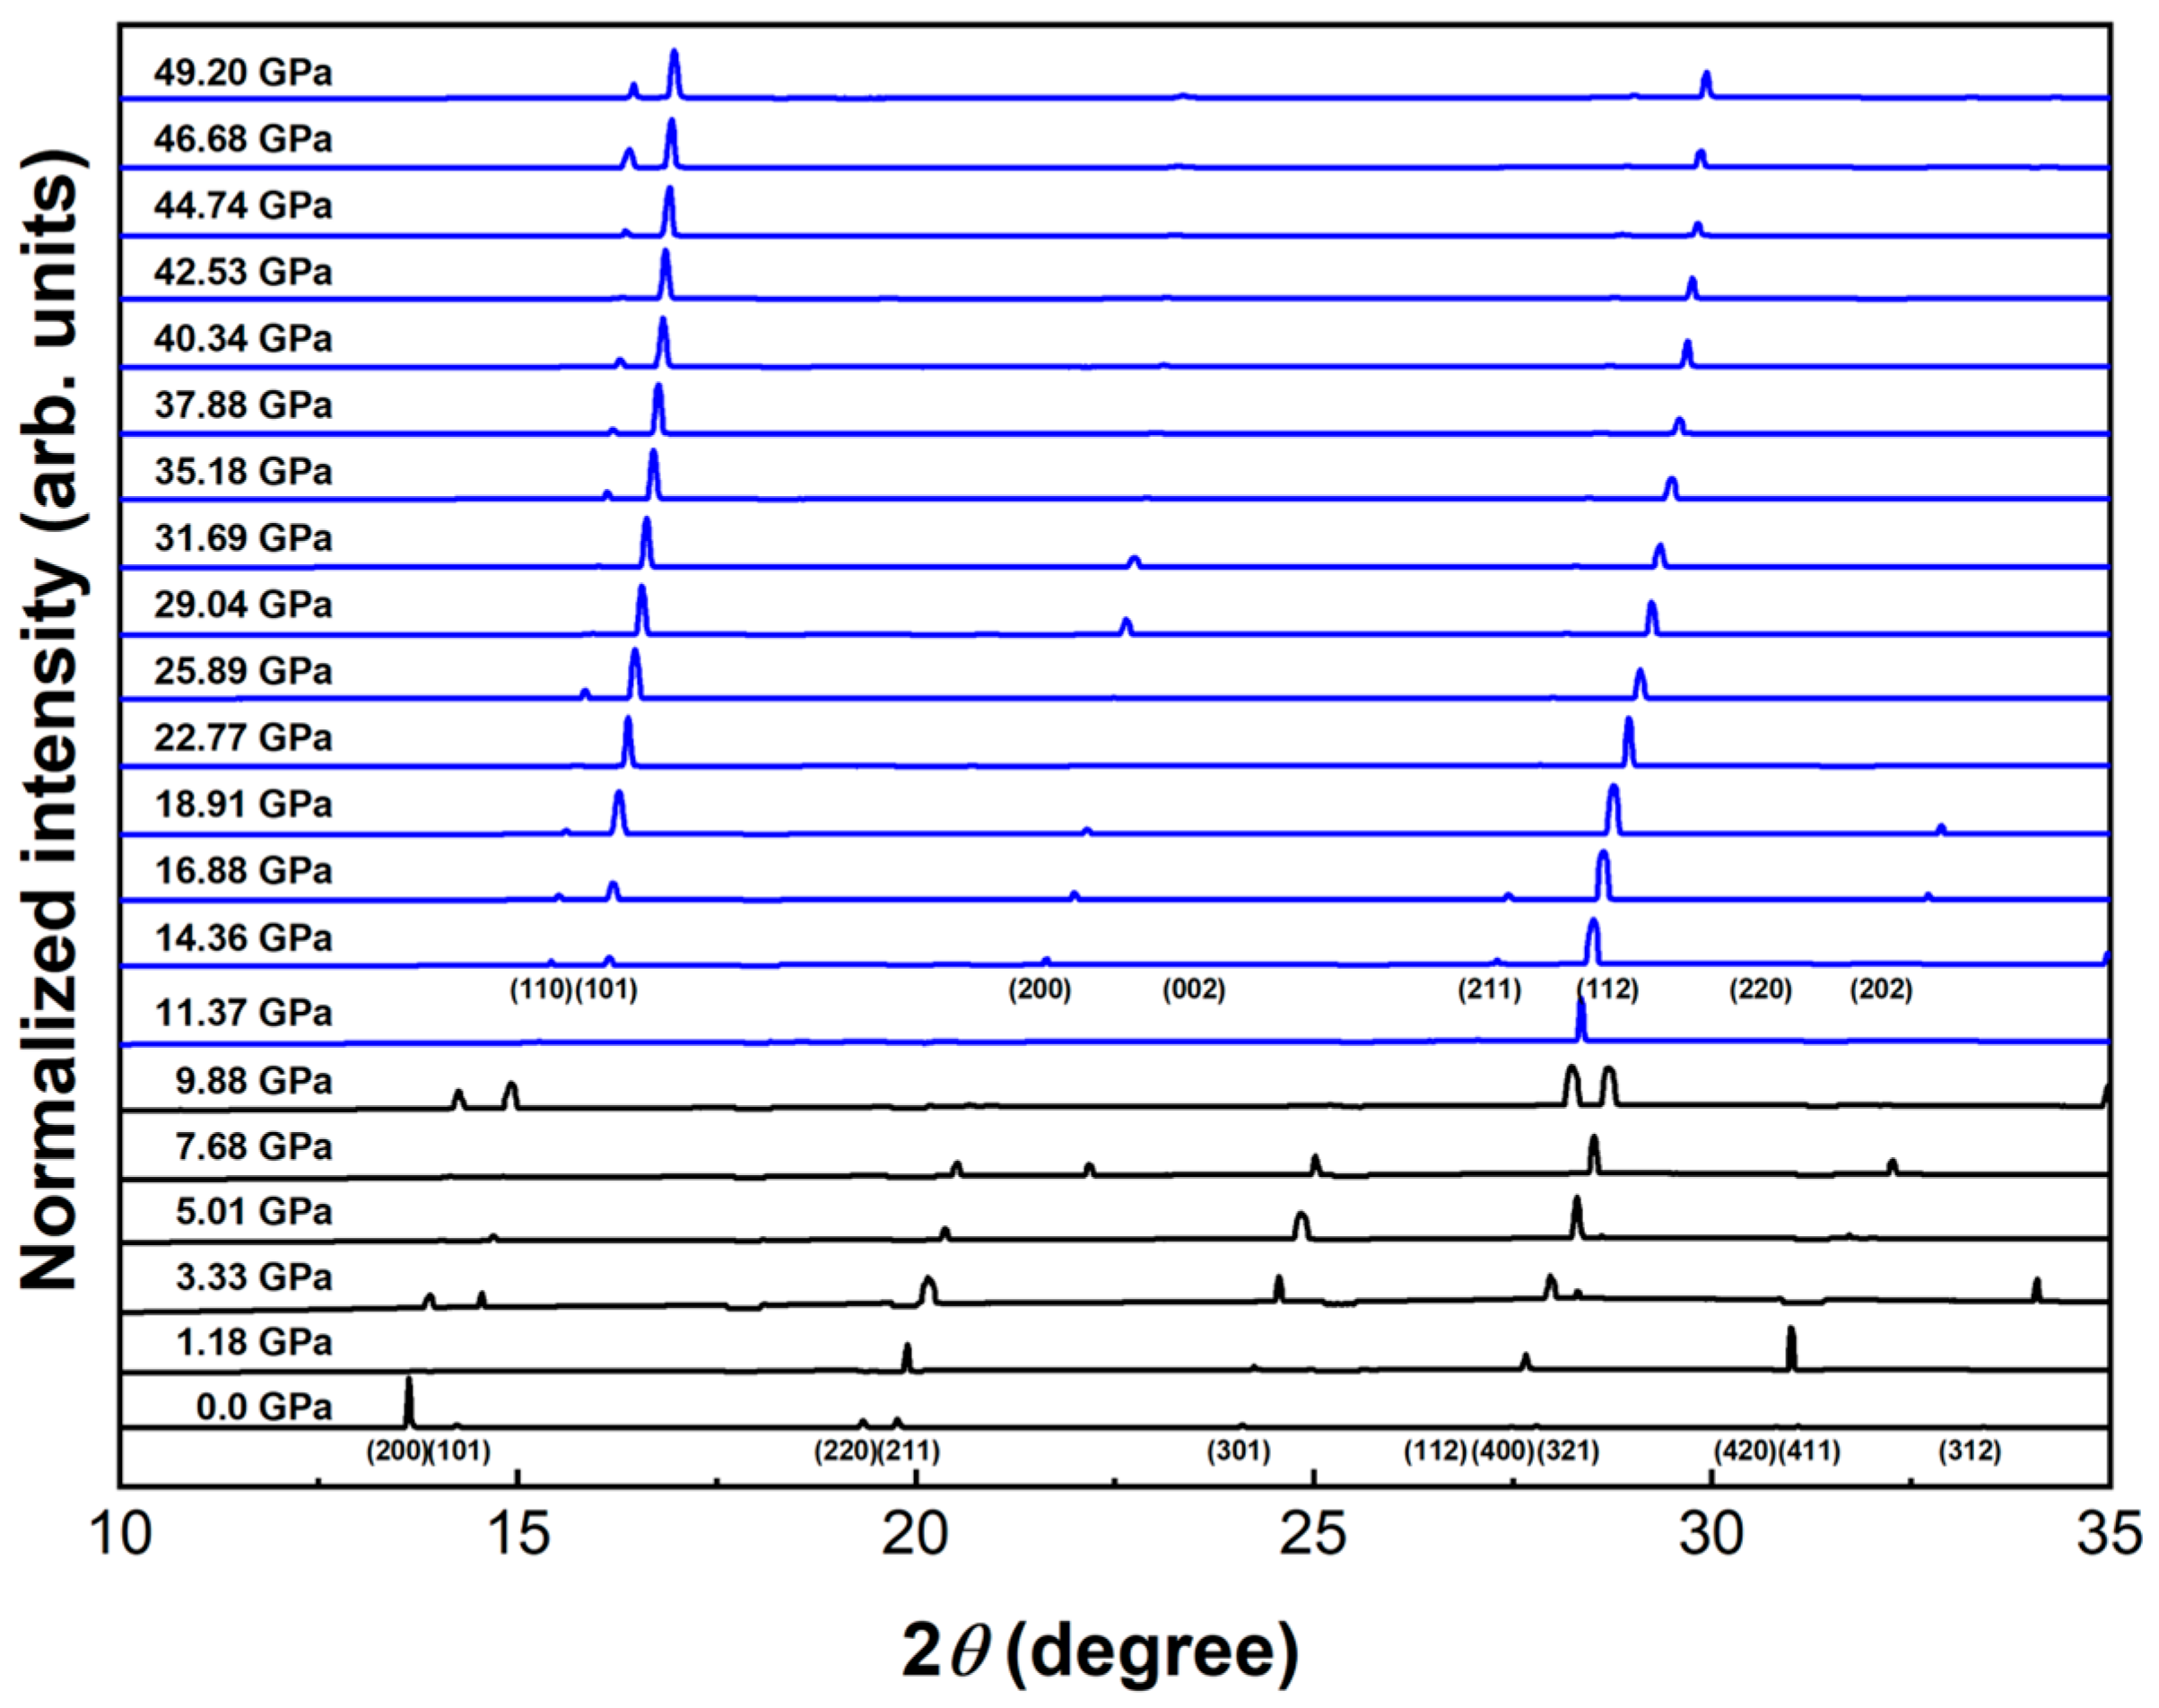
On the other hand, Figure 6 shows the high-pressure XRD patterns of the textured Sn from the second experiment. Unlike the previous experiment, the XRD patterns in the pressure range of 0.0 to 9.88 GPa exhibited different peak intensities with increasing pressure. These variations were likely related to the preferred crystallographic orientation of the sample. From 11.37 GPa up to the maximum pressure of 49.20 GPa, the diffraction patterns became more uniform than those of the β-Sn phase, accompanied by a continuous shift toward higher angles.
Figure 6.
XRD patterns of textured Sn with increasing pressure. Data are vertically offset for clarity. Black and blue lines represent the β-Sn and BCT phases, respectively. The corresponding reflections are indexed by their Miller indices (hkl).
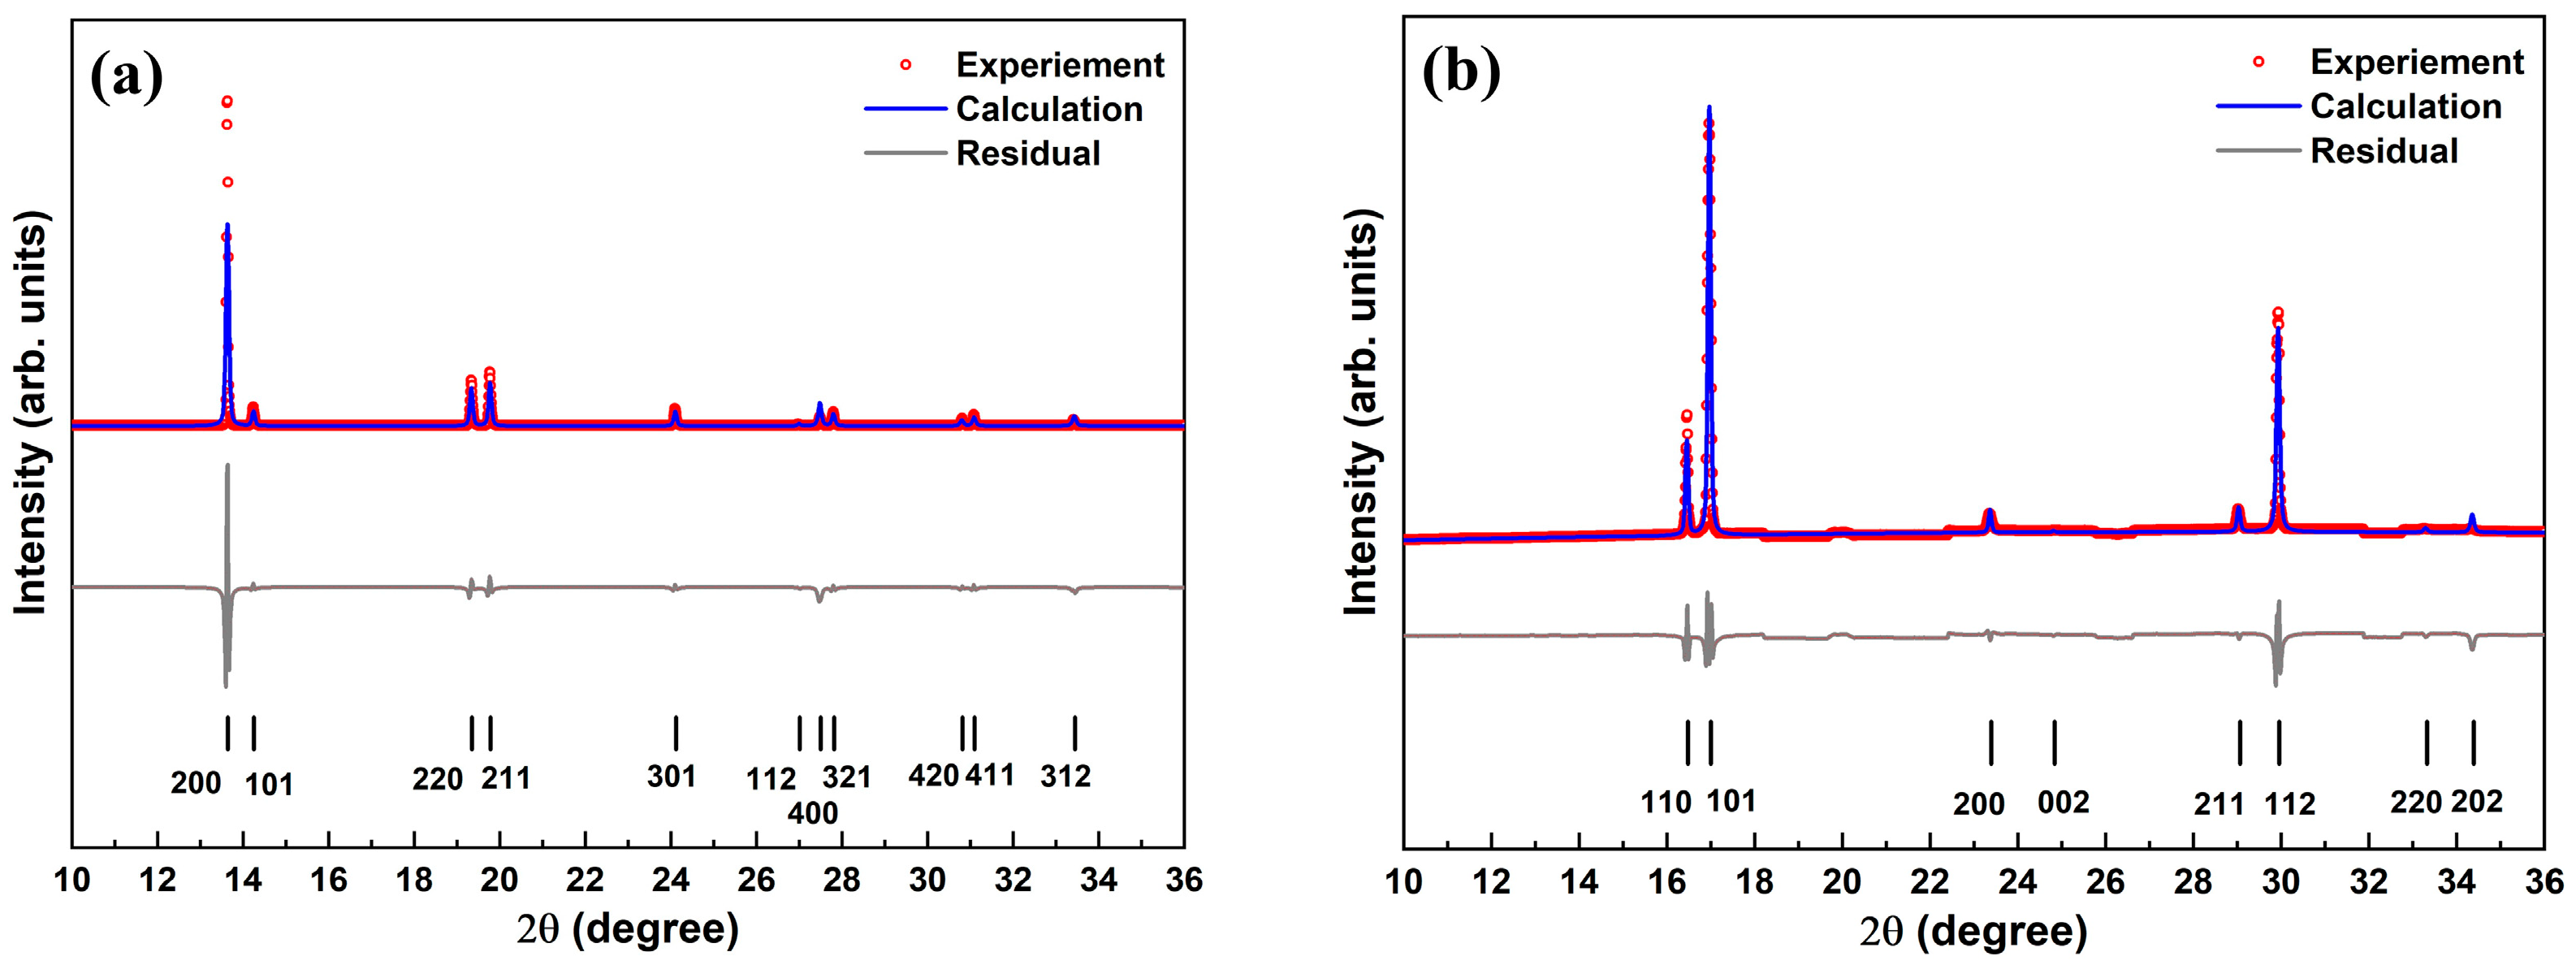
Figure 7 shows the Rietveld refinement results of the second experiment at both the initial and maximum pressures. Comparison of Figure 5a and Figure 7a shows that the diffraction peak positions were nearly identical, whereas a difference was observed in the relative intensity of the (200) reflection. This fact indicates the different initial crystallographic textures of the two samples. In Figure 7a the refinement was done without using March Dollase or spherical harmonics function to fit the preferred orientations, such as a (200) peak [39]. The presence of crystallographic texture in the second sample was independently confirmed by the 2D XRD and EBSD analyses. The relative intensities of diffraction peaks can also be influenced by deformation-induced changes in crystallographic texture, which may arise from inelastic deformation processes such as dislocation slip and mechanical twinning [40]. Comparison of Figure 5c and Figure 7b also shows that the two samples exhibited different results at similar maximum pressures of 49.14 and 49.20 GPa, respectively. In Figure 5c, the BCT and BCC phases coexisted, indicating an incomplete BCT to BCC phase transition, whereas only the BCT phase was observed in Figure 7b. The lattice parameters were primarily determined from the diffraction peak positions, and those obtained by Rietveld refinement at each pressure are summarized in Table 1. This difference in the high-pressure behavior of the two Sn samples is further discussed below through comparison of their EOS results.
Figure 7.
Results of Rietveld refinement on textured Sn at (a) 0.0 GPa, (b) 49.20 GPa. The red dots are experimental data, the blue lines are calculated data, the gray lines are residual values, and the black bars indicate the peak positions.
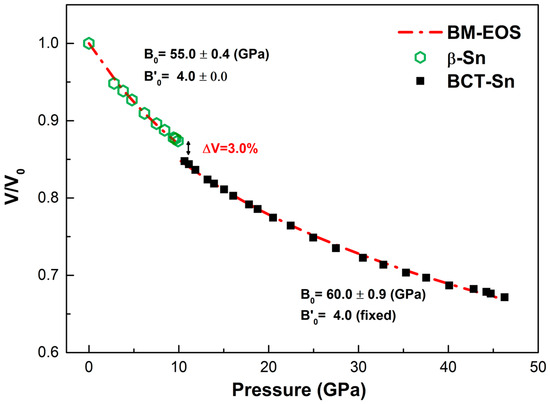
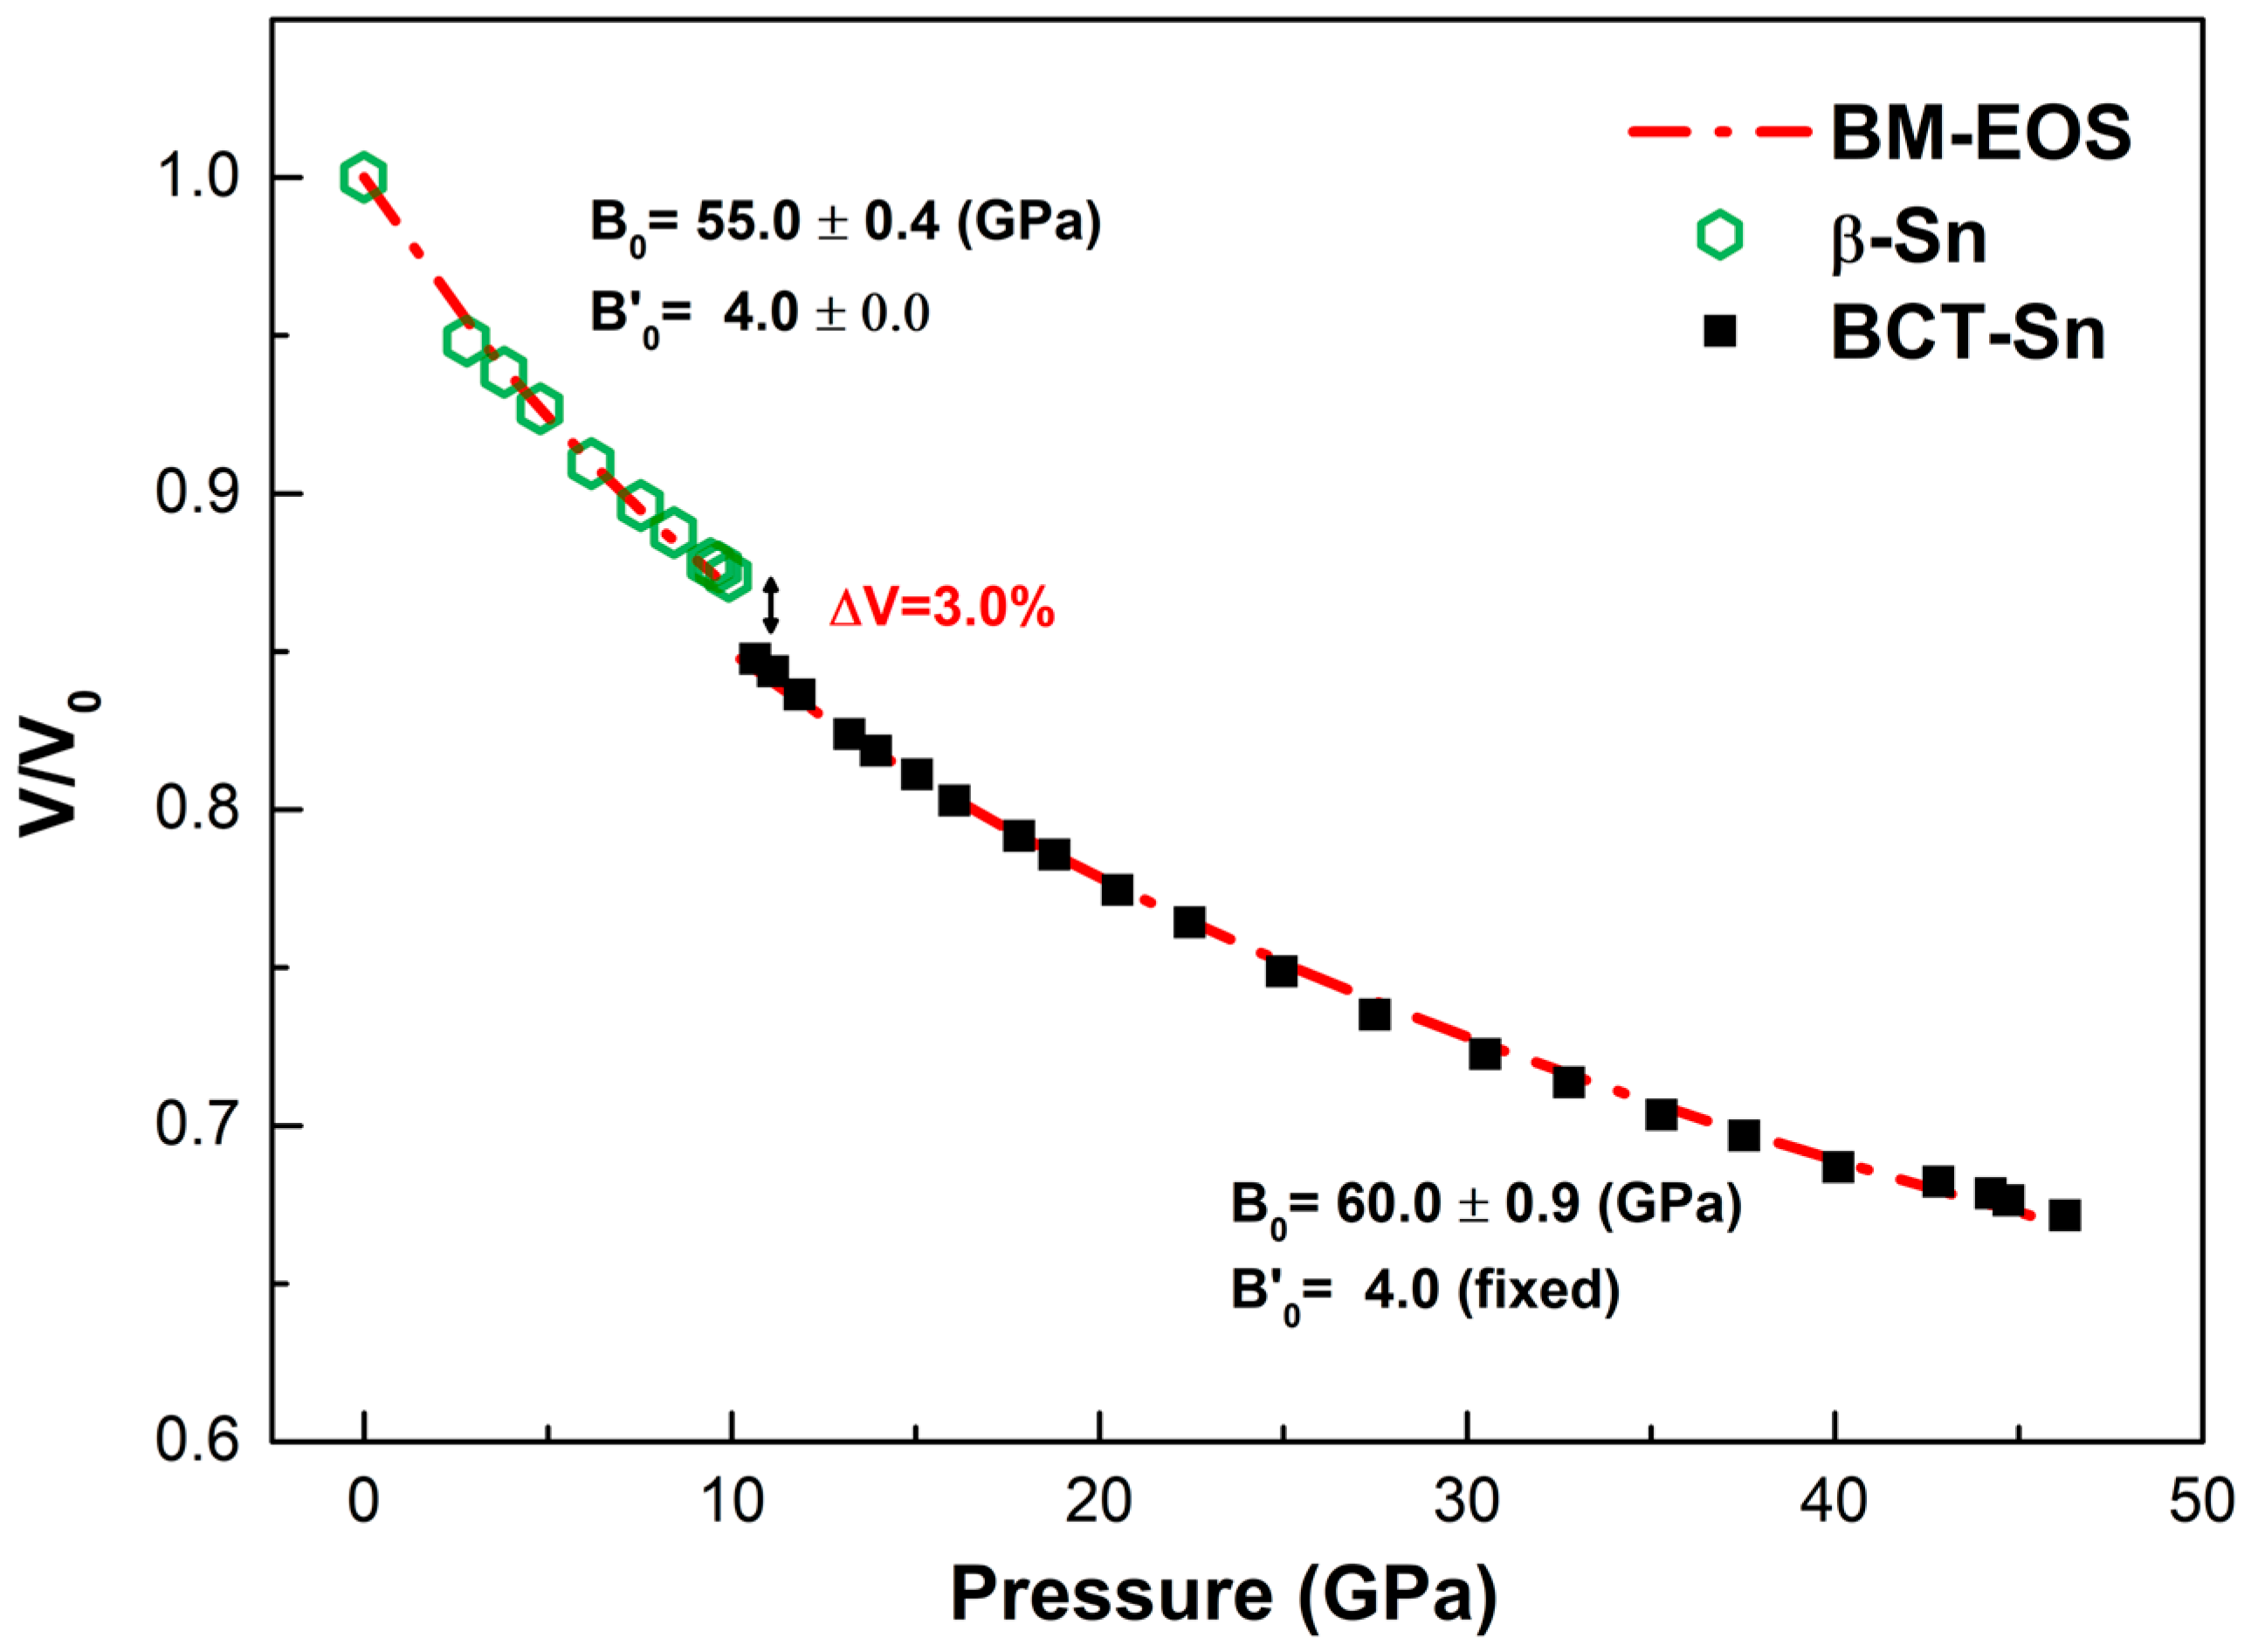
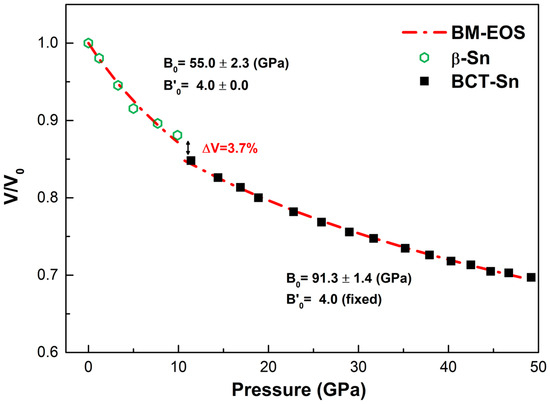
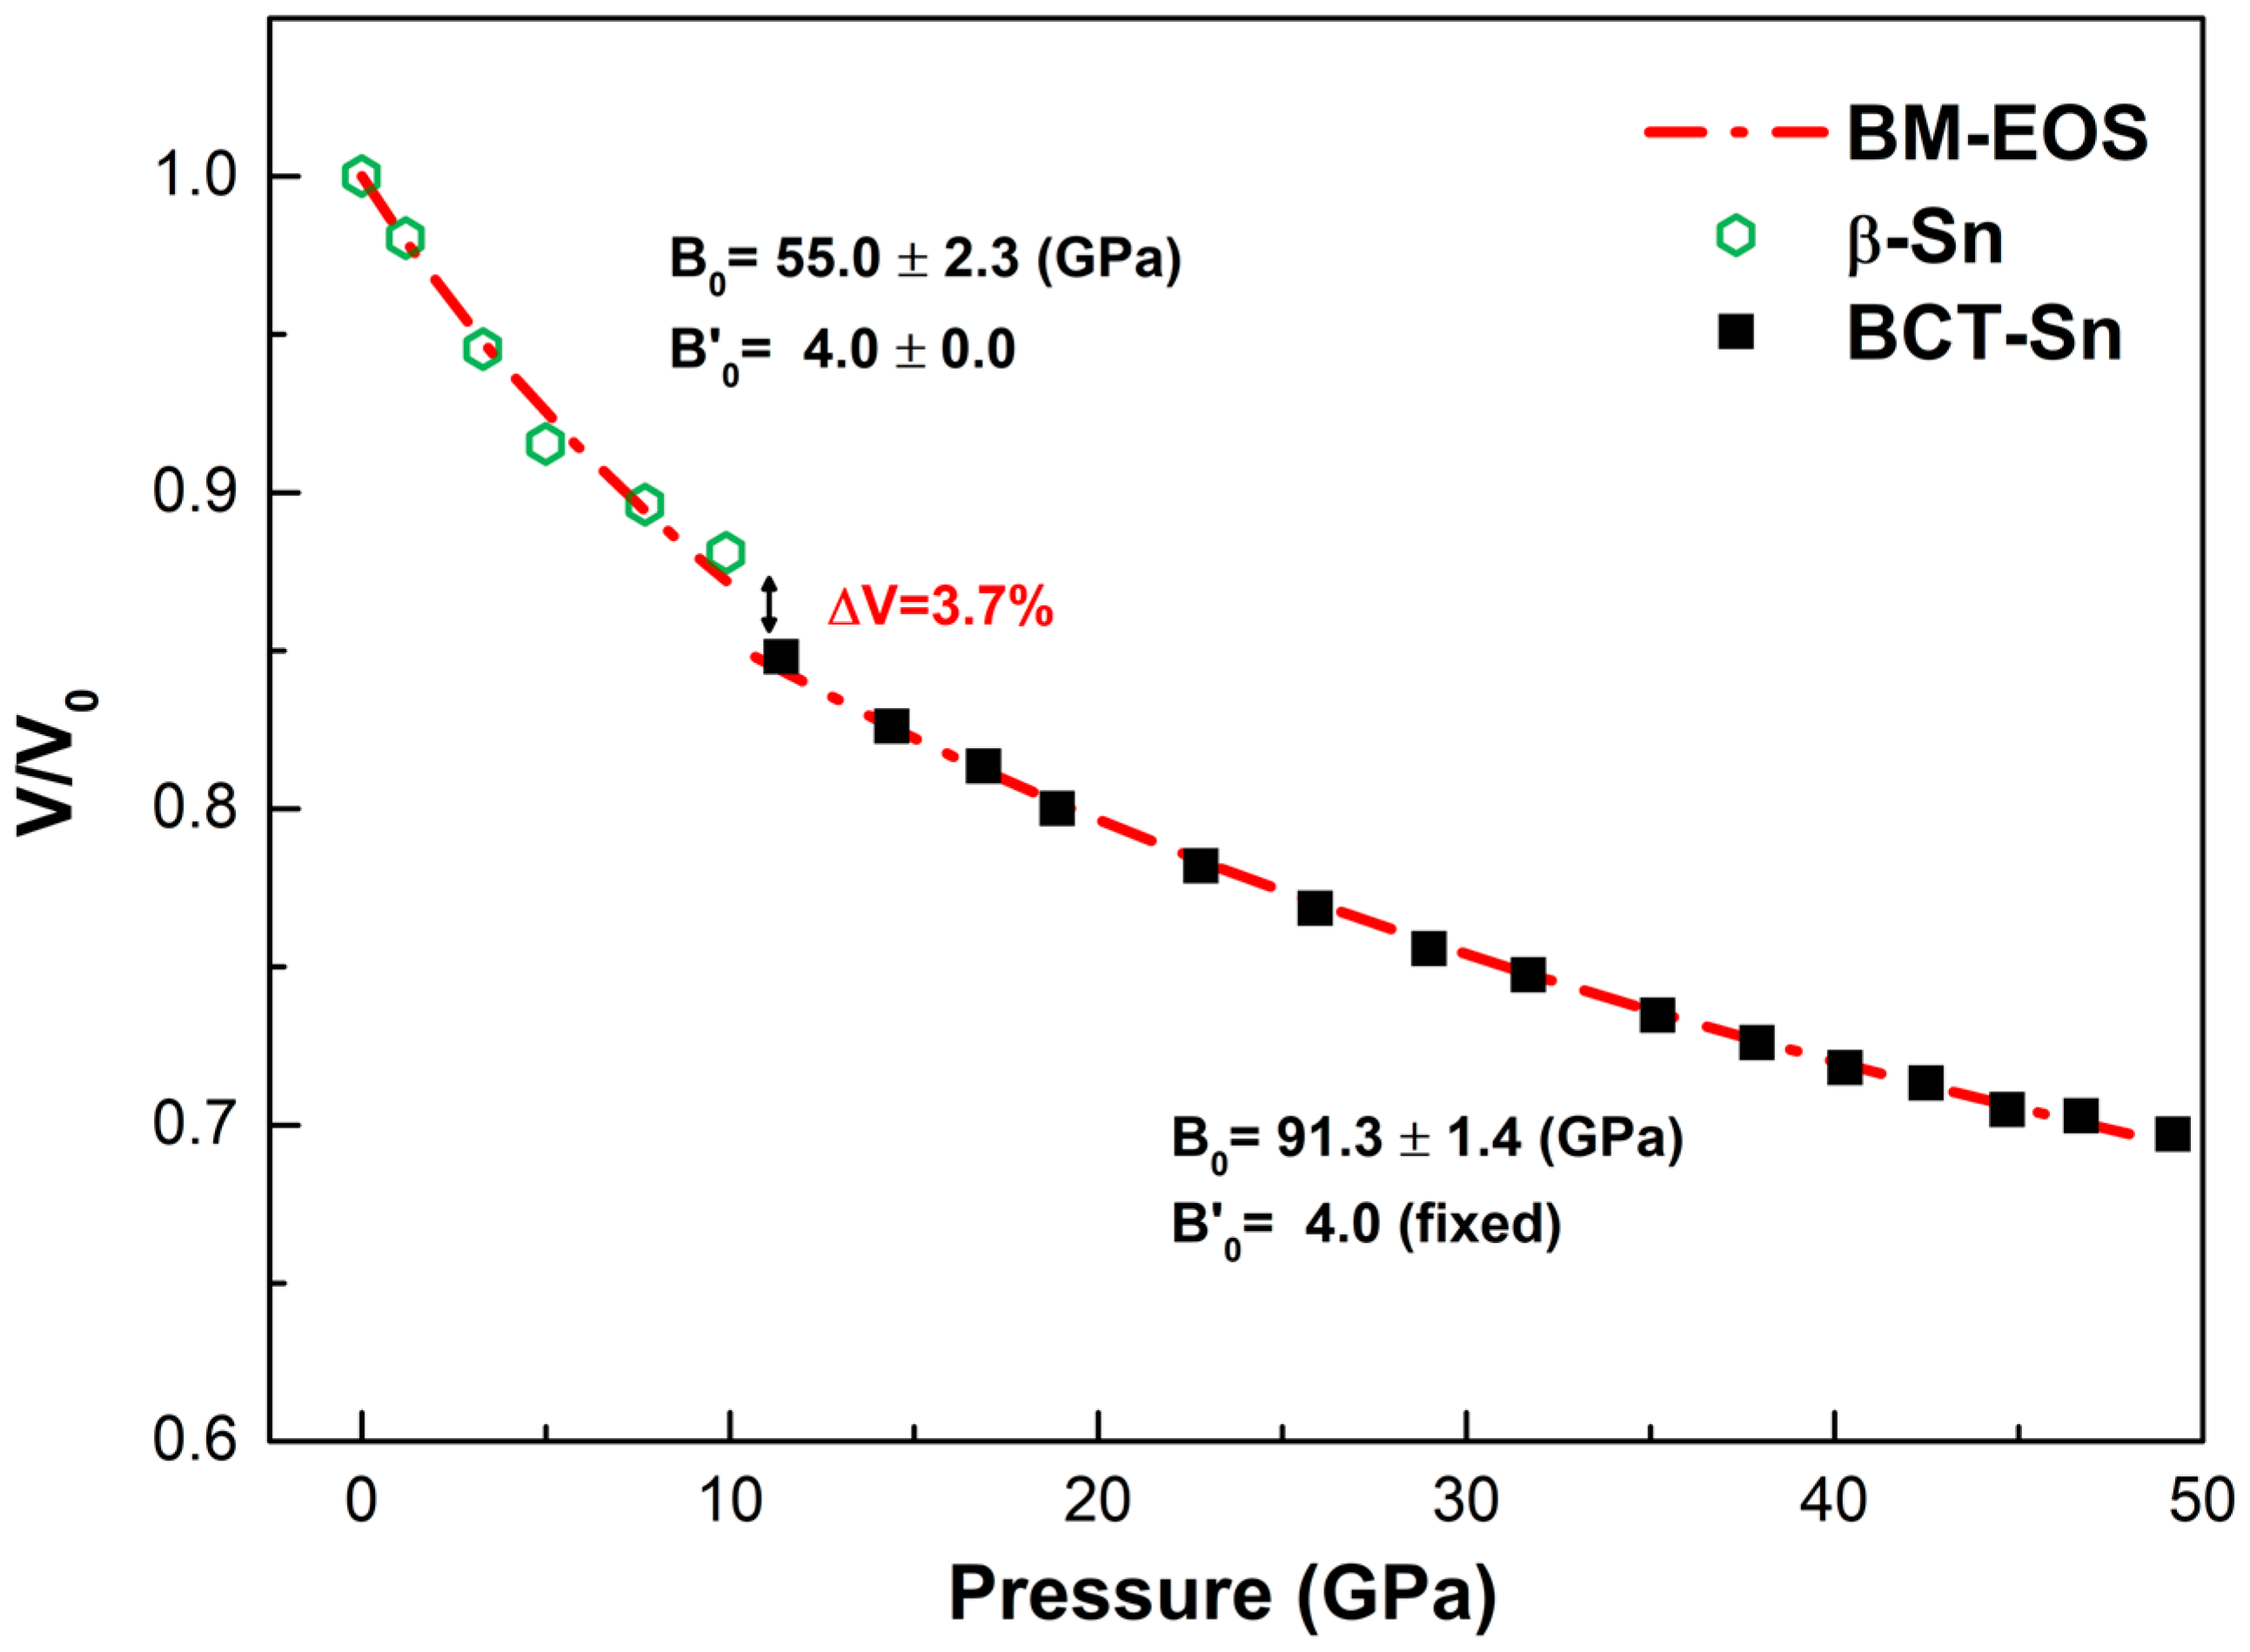
Figure 8 and Figure 9 show the measured P-V data obtained from the first and second experiments, respectively. The corresponding P-V data are provided in Tables S1 and S2 in the Supplementary Material. The data for each phase were fitted using the Birch-Murnaghan equation of state (EOS) (Equation (1)) [41,42].
where , are defined as (bulk modulus) = with being the unit cell volume at zero pressure.
Figure 8.
Birch-Murnaghan equation of state for randomly oriented Sn. The data were fitted separately for each phase. Green hexagons indicate the data for β-Sn phase and black squares represent the data for BCT phase.
Figure 9.
Birch-Murnaghan equation of state for textured Sn. The data were fitted separately for each phase. Green hexagons indicate the data for β-Sn phase and black squares represent the data for BCT phase.
In the first experiment (Figure 8) the values of and for β-Sn phase were determined to be 55.0 ± 0.4 GPa and 4.0 ± 0.0, respectively [43]. Sn underwent a phase transition at near 10.8 GPa, accompanied by a volume contraction approximately 3%, which caused a discontinuity in the EOS curves. This value is slightly larger than the 2% and 1.9% reported by Salamat et al. and Fréville et al., respectively [15,16]. After the phase transition, the and for the BCT phase were determined to be 60.0 ± 0.9 GPa and 4.0 (fixed). The was fixed at 4.0 for the determination of the zero-pressure volume and bulk modulus of the BCT phase from the high-pressure data [43,44,45].
Meanwhile, as shown in Figure 9, for the β-Sn phase in second experiment, the values of and were determined to be 55.0 ± 2.3 GPa and 4.0 ± 0.0, respectively. The phase transition was accompanied by a volume contraction of approximately 3.7%. After the phase transition, the bulk modulus for the BCT phase was determined to be 91.3 ± 1.4 GPa, representing an increase of approximately 52% compared with that obtained in the first experiment.
In a high-pressure experiment, a randomly oriented polycrystalline sample is generally expected to exhibit an isotropic macroscopic response [46]. In contrast, a textured material contains a nonrandom distribution of crystallographic orientations, which can influence its measured mechanical response [26,47]. Therefore, the present results provide experimental evidence that the initial crystallographic texture can significantly influence the high-pressure compressional response of Sn, as reflected by the marked difference in bulk modulus between the two samples. As in the previous analysis, the was fixed at 4.0 to extract the mechanical properties of the phase-transformed phase from high-pressure data [43,44,45].
4. Conclusions
The equation of state and high-pressure compressional properties of randomly oriented and textured Sn were investigated using synchrotron XRD and DACs. To further interpret the differences observed in the XRD patterns, EBSD analysis was performed to characterize the initial microstructure of the Sn foils. Structural phase transitions involving β-Sn, BCT, and BCC phases were identified by Rietveld refinement, consistent with previous studies. The isothermal bulk moduli of the β-Sn phase obtained from the two samples were equal, indicating the same compressibility prior to the phase transition. However, the bulk modulus of the BCT phase was significantly higher for textured Sn (91.3 ± 1.4 GPa) than for randomly oriented Sn (60.0 ± 0.9 GPa).
The higher bulk modulus of textured Sn indicates greater resistance to volumetric compression and suggests orientation-dependent compressibility in Sn. These results indicate that the initial microstructure of Sn, including its crystallographic texture, should be carefully considered when interpreting its high-pressure compressional behavior.
Supplementary Materials
The following supporting information can be downloaded at: https://www.mdpi.com/article/10.3390/cryst16090568/s1, Table S1: Pressure-volume data obtained at ambient temperature in the 2007 experiment; Table S2: Pressure-volume data obtained at ambient temperature in the 2026 experiment.
Funding
This research received no external funding.
Data Availability Statement
The data presented in this study are contained within the article.
Acknowledgments
The author expresses sincere gratitude to Young-Ho Ko from Agency for Defense Development (ADD) for his comprehensive guidance in the experimental design, data analysis, and manuscript preparation. The author also appreciates Keunho Lee from ADD for the EBSD measurement and analysis of Sn. During the preparation of this manuscript, the author utilized ChatGPT (OpenAI, GPT-5.6) and Gemini (Google, Gemini 3.7 Flash) to improve the grammar and language of the manuscript and to assist with English editing. All scientific content, data interpretation, and conclusions were developed and verified by the author. The author has carefully reviewed and edited all AI-assisted content and takes full responsibility for the content of this publication.
Conflicts of Interest
The author declares no conflicts of interest.
Abbreviations
The following abbreviations are used in this manuscript:
| EOS | Equation of state |
| DAC | Diamond anvil cell |
| XRD | X-ray diffraction |
| BCT | Body-centered tetragonal |
| BCC | Body-centered cubic |
| PTM | Pressure transmitting medium |
| FE-SEM | Field Emission-Scanning Electron Microscopy |
| EBSD | Electron backscatter diffraction |
| SRM | Standard reference material |
References
- Davis, J.R. Tin and Tin Alloys. In Metals Handbook Desk Edition, 2nd ed.; ASM International: Materials Park, OH, USA, 1998; pp. 598–601. [Google Scholar] [CrossRef] [Scilit]
- Walsh, F.C.; Low, C.T.J. A review of developments in the electrodeposition of tin. Surf. Coat. Technol. 2016, 288, 79–94. [Google Scholar] [CrossRef] [Scilit]
- Bridgman, P.W. Linear compressions to 30,000 Kg/Cm, including Relatively Incompressible Substances. Proc. Am. Acad. Arts Sci. USA 1949, 77, 189–234. [Google Scholar] [CrossRef] [Scilit]
- Gschneidner, K.A. Physical Properties and Interrelationships of Metallic and Semimetallic Elements. Solid State Phys. 1964, 16, 275–426. [Google Scholar] [CrossRef] [Scilit]
- Cannon, J.F. Behavior of the elements at high pressures. J. Phys. Chem. Ref. Data 1974, 3, 781–824. [Google Scholar] [CrossRef] [Scilit]
- Vaidya, S.N.; Kennedy, G.C. Compressibility of 18 metals to 45 kbar. J. Phys. Chem. Solids. 1970, 31, 2329–2345. [Google Scholar] [CrossRef] [Scilit]
- Chen, L.R.; Chen, Q.H. The test and comparison of three equations of state for solids. Commun. Theor. Phys. 1991, 16, 385–392. [Google Scholar] [CrossRef] [Scilit]
- Ihm, J.; Cohen, M.L. Equilibrium properties and the phase transition of grey and white tin. Phys. Rev. B 1981, 23, 1576–1584. [Google Scholar] [CrossRef] [Scilit]
- Deffrennes, G.; Faure, P.; Bottin, F.; Joubert, J.M.; Oudot, B. Tin (Sn) at high pressure: Review, X-ray diffraction, DFT calculations, and Gibbs energy modeling. J. Alloys Compd. 2022, 919, 165675. [Google Scholar] [CrossRef] [Scilit]
- Barnett, J.D.; Bean, V.E.; Hall, H.T. X-ray diffraction studies on tin to 100 kilobars. J. Appl. Phys. 1966, 37, 875–877. [Google Scholar] [CrossRef] [Scilit]
- Christensen, N.E. The body-centered tetragonal high-pressure phase of tin. Solid State Commun. 1993, 85, 151–154. [Google Scholar] [CrossRef] [Scilit]
- Olijnyk, H.; Holzapfel, W.B. Phase transitions in Si, Ge and Sn under pressure. J. Phys. Colloq. 1984, 45, C8-153–C8-156. [Google Scholar] [CrossRef] [Scilit]
- Liu, M.; Liu, L. Compressions and phase transitions of tin to half a megabar. High Temp. High Press. 1986, 18, 79–85. [Google Scholar]
- Desgreniers, S.; Vohra, Y.K.; Ruoff, A.L. Tin at high pressure: An energy-dispersive X-ray-diffraction study to 120 GPa. Phys. Rev. B 1989, 39, 10359. [Google Scholar] [CrossRef] [Scilit]
- Salamat, A.; Briggs, R.; Bouvier, P.; Petitgirard, S.; Dewaele, A.; Cutler, M.E.; Corà, F.; Daisenberger, D.; Garbarino, G.; McMillan, P.F. High-pressure structural transformations of Sn up to 138 GPa: Angle-dispersive synchrotron X-ray diffraction study. Phys. Rev. B 2013, 88, 104104. [Google Scholar] [CrossRef] [Scilit]
- Fréville, R.; Dewaele, A.; Guignot, N.; Faure, P.; Henry, L.; Garbarino, G.; Mezouar, M. High-pressure-high-temperature phase diagram of tin. Phys. Rev. B 2024, 109, 104116. [Google Scholar] [CrossRef] [Scilit]
- Jing, Q.-M.; Cao, Y.-H.; Zhang, Y.; Li, S.-R.; He, Q.; Hou, Q.-Y.; Liu, S.-G.; Liu, L.; Bi, Y.; Geng, H.-Y.; et al. Evidence of polymorphic transformations of Sn under high pressure. Chin. Phys. B 2016, 25, 120702. [Google Scholar] [CrossRef] [Scilit]
- Gavriliuk, A.G.; Troyan, I.A.; Ivanova, A.G.; Aksenov, S.N.; Starchikov, S.S.; Lyubutin, I.S.; Morgenroth, W.; Glazyrin, K.V.; Mezouar, M. Structural transitions in elemental tin at ultrahigh pressures up to 230 GPa. JETP Lett. 2017, 106, 733–738. [Google Scholar] [CrossRef] [Scilit]
- Briggs, B.; Torchio, R.; Sollier, A.; Occelli, F.; Videau, L.; Kretzschmar, N.; Wulff, M. Observation of the shock-induced β-Sn to b.c.t.-Sn transition using time-resolved X-ray diffraction. J. Synchrontron Rad. 2019, 26, 96–101. [Google Scholar] [CrossRef] [Scilit]
- Corkill, J.L.; Garcia, A.; Cohen, M.L. Theoretical study of high-pressure phases of tin. Phys. Rev. B 1991, 43, 9251–9254. [Google Scholar] [CrossRef] [Scilit]
- Cheong, B.H.; Chang, K.J. First-principles study of the structural properties of Sn under pressure. Phys. Rev. B 1991, 44, 4103–4108. [Google Scholar] [CrossRef] [Scilit]
- Cui, S.; Cai, L.; Feng, W.; Hu, H.; Wang, C.; Wang, Y. First-principles study of phase transition of tin and lead under high pressure. Phys. Stat. Solidi B 2008, 245, 53–57. [Google Scholar] [CrossRef] [Scilit]
- Chen, T.; Yuan, F.; Liu, J.; Geng, H.; Zhang, L.; Wang, H.; Chen, M. Modeling the high-pressure solid and liquid phases of tin from deep potentials with ab initio accuracy. Phys. Rev. Mater. 2023, 7, 053603. [Google Scholar] [CrossRef] [Scilit]
- Na, S.H.; Park, C.H. First-principles Study of Structural Phase Transition of Sn. J. Korean Phys. Soc. 2010, 56, 494–497. [Google Scholar] [CrossRef] [Scilit]
- Wassermann, G.; Grewen, J. Texturen Metallischer Werkstoffe, 2nd ed.; Springer: Berlin/Heidelberg, Germany, 1962. [Google Scholar]
- Threadingham, J.G.; Liang, X.; Leggett, E.; Smith, L.C.; Millett, J.C.F.; Whiteman, G.; Peçanha-Antonio, V.; Boothroyd, A.T.; Chapman, D.J.; Eakins, D.E. Effects of crystal orientation on the shock properties of single crystal tin. J. Appl. Phys. 2026, 139, 065902. [Google Scholar] [CrossRef] [Scilit]
- Horváth, B.; Illés, B.; Shinohara, T.; Harsányi, G. Whisker growth on annealed and recrystallized tin platings. Thin Solid Films 2012, 520, 5733–5740. [Google Scholar] [CrossRef] [Scilit]
- Nishikawa, S.; Asahara, G. Some studies of metals by means of X-rays. Phys. Rev. 1920, 15, 38–45. [Google Scholar] [CrossRef] [Scilit]
- Shen, G.; Wang, Y.; Dewaele, A.; Wu, C.; Fratanduono, D.E.; Eggert, J.; Klotz, S.; Dziubek, K.F.; Loubeyre, P.; Fat’yanov, O.V.; et al. Towards an international practical pressure scale: A proposal for an IPPS ruby gauge (IPPS-Ruby2020). High Press. Res. 2020, 40, 299–314. [Google Scholar] [CrossRef] [Scilit]
- Lee, K.; Woo, S.; Park, L. Dynamic Tensile Extrusion Behavior of Fine-Grained Copper Fabricated by Powder Injection Molding. Crystals 2022, 12, 147. [Google Scholar] [CrossRef] [Scilit]
- Cox, D.E. The Rietveld Method: International Union of Crystallography Monographs on Crystallography. J. Appl. Cryst. 1994, 27, 440–441. [Google Scholar] [CrossRef] [Scilit]
- Prescher, C.; Prakapenka, V.B. DIOPTAS: A Program for Reduction of Two-Dimensional X-ray Diffraction Data and Data Exploration. High Press. Res. 2015, 35, 223–230. [Google Scholar] [CrossRef] [Scilit]
- Cagliotti, G.; Paoletti, A.; Ricci, F.P. Choice of Collimators for a Crystal Spectrometer for Neutron Diffraction. Nucl. Instrum. 1958, 3, 223–228. [Google Scholar] [CrossRef] [Scilit]
- Bruker AXS. TOPAS V6.0: General Profile and Structure Analysis Software for Powder Diffraction Data—User Manual; Bruker AXS: Karlsruhe, Germany, 2009. [Google Scholar]
- Crystal Impact. Pearson’s Crystal Data: Crystal Structure Database for Inorganic Compounds; Crystal Impact: Bonn, Germany, 2007. [Google Scholar]
- Ko, N.Y.; Hwang, J.M.; Ko, Y.H. Behavior of Copper under High Pressure: Experimental and Theoretical Analyses. Curr. Appl. Phys. 2021, 31, 93–98. [Google Scholar] [CrossRef] [Scilit]
- He, B.B. Two-Dimensional X-Ray Diffraction, 2nd ed.; John Wiley & Sons: Hoboken, NJ, USA, 2018. [Google Scholar]
- Hareesh, C.; Ceretti, M.; Papet, P.; Bosak, A.; Meven, M.; Paulus, W. Synthesis and Structural Characterization of Layered Ni+1/+2 Oxides Obtained by Topotactic Oxygen Release on Nd2−xSrxNiO4−δ Single Crystals. Crystals 2023, 13, 1670. [Google Scholar] [CrossRef] [Scilit]
- March, A. Mathematische Theorie der Regelung nach der Korngestalt bei affiner Deformation. Z. Krist. 1932, 81, 285–297. [Google Scholar] [CrossRef] [Scilit]
- Wenk, H.-R.; Lonardelli, I.; Merkel, S.; Miyagi, L.; Pehl, J.; Speziale, S.; Tommaseo, C.E. Preferred orientation in materials deformed at high pressure. J. Phys. Condens. Matter 2006, 18, S933–S947. [Google Scholar] [CrossRef] [Scilit]
- Birch, F. Elasticity and Constitution of the Earth’s Interior. J. Geophys. Res. 1952, 57, 227–286. [Google Scholar] [CrossRef] [Scilit]
- Murnaghan, F.D. The Compressibility of Media under Extreme Pressures. Proc. Natl. Acad. Sci. USA 1944, 30, 244–247. [Google Scholar] [CrossRef] [Scilit]
- Jeanloz, R. Finite-strain equation of state for high-pressure phases. Geophys. Res. Lett. 1981, 8, 1219–1222. [Google Scholar] [CrossRef] [Scilit]
- Wang, J.; Yang, J.; Hu, T.; Chen, X.; Lang, J.; Wu, X.; Zhang, J.; Zhao, H.; Yang, J.; Cui, Q. Structural Phase Transition and Compressibility of CaF2 Nanocrystals under High Pressure. Crystals 2018, 8, 199. [Google Scholar] [CrossRef] [Scilit]
- Oh, K.H.; Ko, Y.H.; Kim, K.J. Investigation of the crystal structure of polymorphic KNbO3 nanowires by pressure. AIP Adv. 2019, 9, 045207. [Google Scholar] [CrossRef] [Scilit]
- Kalpakjian, S.; Schmid, S.R. Manufacturing Engineering and Technology in SI Units, 8th ed.; Pearson Education Limited: Harlow, UK, 2022. [Google Scholar]
- Roberts, W.T. Preferred Orientation and Anisotropy in Titanium. J. Less-Common Met. 1962, 4, 345–361. [Google Scholar] [CrossRef] [Scilit]

Disclaimer/Publisher’s Note: The statements, opinions and data contained in all publications are solely those of the individual author(s) and contributor(s) and not of MDPI and/or the editor(s). MDPI and/or the editor(s) disclaim responsibility for any injury to people or property resulting from any ideas, methods, instructions or products referred to in the content. |
© 2026 by the author. Licensee MDPI, Basel, Switzerland. This article is an open access article distributed under the terms and conditions of the Creative Commons Attribution (CC BY) license.