


Abstract
Heat-polymerized poly(methyl methacrylate) (PMMA) is widely used for denture bases but remains susceptible to surface deformation and sliding wear. This study evaluated the structure, chemistry, surface morphology, microhardness, and dry-sliding tribology of PMMA reinforced with 1, 3, and 5 wt.% cubic boron nitride (c-BN). Disk specimens (10 mm diameter × 2 mm thickness) were prepared; ten specimens per group were tested for Vickers microhardness and wear/coefficient of friction, while one representative specimen per group was examined by XRD, ATR-FTIR, and SEM/EDS before and after wear. The PMMA amorphous/semi-amorphous response and characteristic ester bands were retained, whereas c-BN-related diffraction features and B/N signals became more evident with reinforcement. Microhardness increased from 20.00 ± 0.70 to 45.00 ± 1.61 HV0.03. After 1000 m at 10 N and 1 m s−1, mass loss decreased from 32.4 to 9.8 mg and the overall coefficient of friction from 0.58 to 0.28. Post-wear SEM/EDS showed reduced grooving, smearing, and material detachment at higher c-BN contents. Statistical analysis confirmed large composition effects, and composition-window models reproduced the measured hardness and wear trends. Within the tested range, 5 wt.% c-BN provided the strongest surface-hardening and wear-suppression response under controlled dry-sliding conditions.
1. Introduction
Poly(methyl methacrylate) (PMMA) remains a principal material for conventional complete and partial denture bases because it combines low density, acceptable esthetics, straightforward powder–liquid processing, repairability, dimensional adaptability, and a long record of prosthodontic use. Its clinical utility is nevertheless constrained by moderate surface hardness, viscoelastic deformation, scratching, and progressive material removal during repeated contact and cleaning. Surface damage is relevant because grooves, pits, and roughened regions can impair polish retention and favor staining, plaque accumulation, and microbial colonization [1,2].
Inorganic and hybrid reinforcements have therefore been incorporated into PMMA to restrict matrix deformation and improve surface or bulk performance. The magnitude and direction of the response depend on particle chemistry, size, surface state, loading fraction, dispersion, matrix continuity, and particle retention. Low or intermediate filler contents may improve hardness and wear resistance, whereas agglomeration and weak interfaces can increase porosity, local stress concentration, particle pull-out, and property scatter [3,4,5].
Boron nitride provides several reinforcement pathways. Hexagonal BN has been examined in PMMA because of its layered structure, thermal stability, and potential contribution to mechanical or functional behavior, while BN/Ag and ZrO2/BN hybrid systems have been investigated for combined mechanical and biological performance. Recent work on nano-c-BN/PMMA further indicates that the cubic polymorph can improve selected physical and mechanical properties of dental prosthetic composites [6,7,8,9].
Tribological performance cannot be inferred from hardness alone. PMMA composites reinforced with ZrO2, hydroxyapatite, carbon nanotubes, PTFE, or other phases show that filler-dependent changes in contact area, matrix deformation, adhesive junctions, debris mobility, and transfer-layer development control both material loss and the coefficient of friction. Accordingly, cumulative wear, endpoint wear, friction evolution, and worn-surface morphology must be interpreted together [10,11,12,13,14].
Cubic boron nitride has a zincblende-type sp3-bonded structure and is among the hardest known ceramic materials. Its high hardness, thermal stability, and resistance to abrasive damage distinguish it from the low-shear mechanism commonly associated with layered h-BN. Within a PMMA matrix, c-BN is expected to act principally as a rigid load-bearing phase that limits counterface penetration and constrains deformation of the surrounding polymer, provided that the particles remain sufficiently dispersed and mechanically retained. Similar contact-stabilization effects have been reported for c-BN-containing coatings and fiber-reinforced polymer systems, and a comparable hard-particle framework was recently demonstrated for TiB2-reinforced heat-polymerized PMMA [15,16,17,18,19,20,21].
The specific gap addressed here is the integrated assessment of low-fraction c-BN in heat-polymerized denture-base PMMA using mutually supporting structural, chemical, morphological, mechanical, tribological, statistical, and composition-window evidence. The study therefore evaluated 0, 1, 3, and 5 wt.% c-BN using XRD, ATR-FTIR, pre- and post-wear SEM/EDS, Vickers microhardness, cumulative mass loss, coefficient of friction, inferential statistics, and response modeling. The null hypothesis was that c-BN content would not significantly affect the measured structural, surface, hardness, wear, friction, or model responses.
2. Materials and Methods
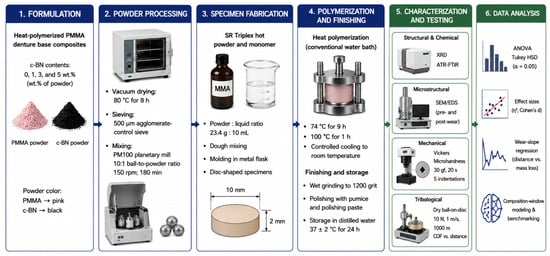
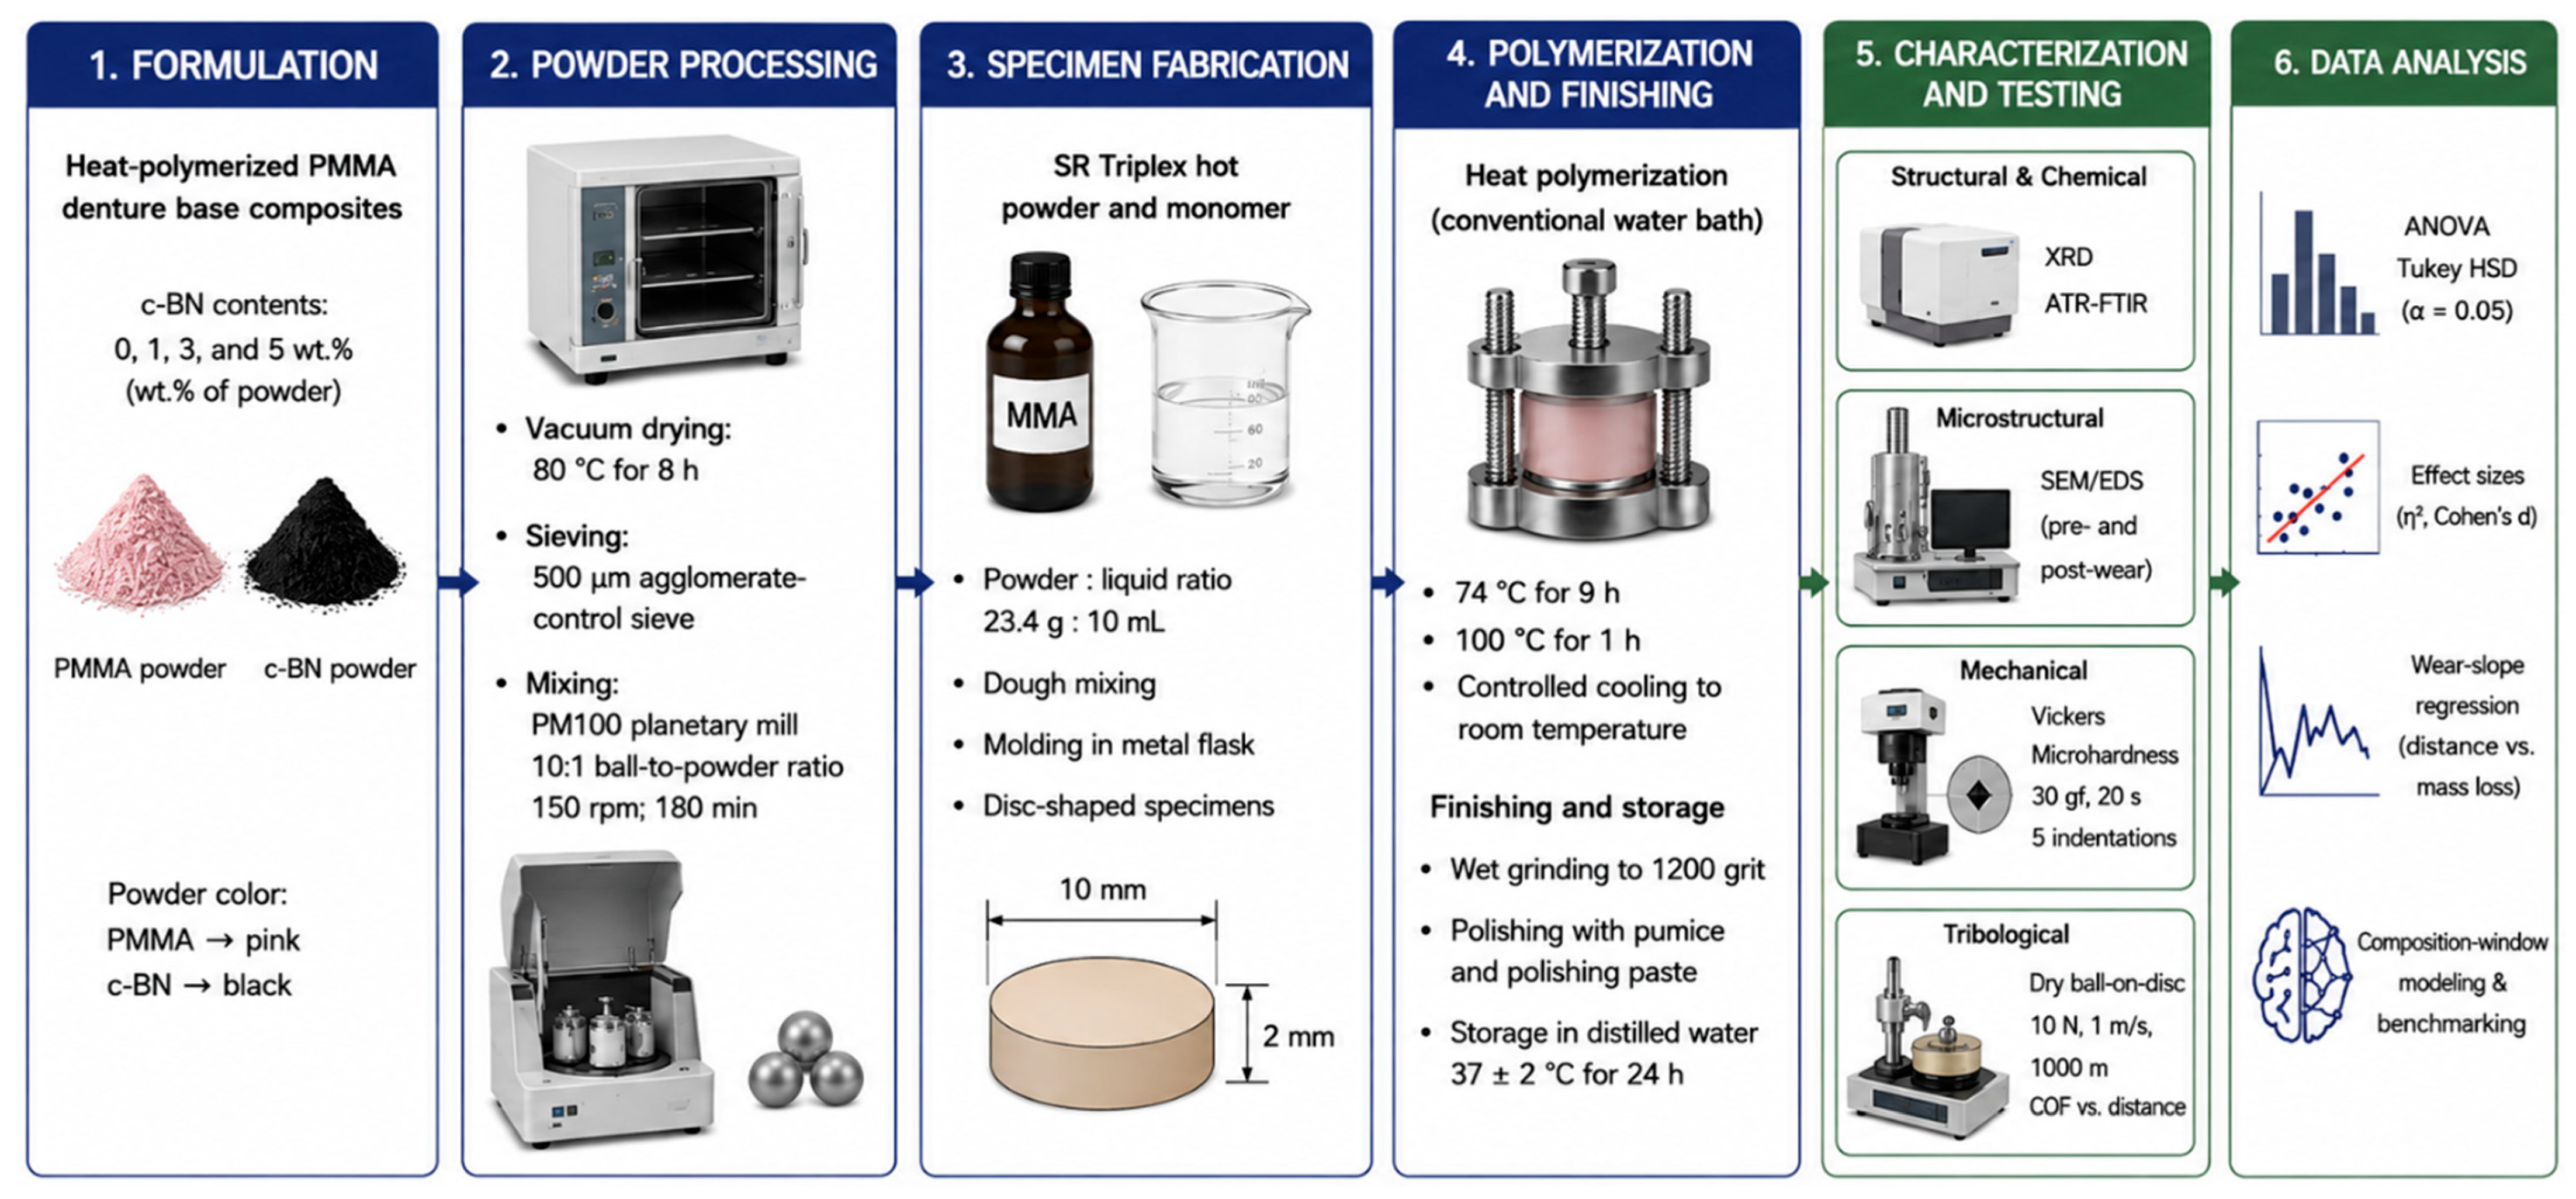
The experimental design and analytical sequence are summarized in Figure 1. Four compositions were processed under identical conditions so that the nominal c-BN fraction was the only intentionally varied material parameter.
Figure 1.
Experimental design, specimen allocation, fabrication route, characterization sequence, mechanical/tribological testing, and data analysis.
2.1. Specimen Preparation
The matrix was the commercial SR Triplex Hot heat-polymerized denture-base system (Ivoclar Vivadent AG, Schaan, Liechtenstein), comprising a pink PMMA-based powder and its corresponding liquid monomer. The reinforcement was black c-BN nanopowder (Nanografi Nano Technology, Ankara, Türkiye; APS < 250 nm; purity 99.5%; SKU NG04CO0304). Material identities and functions are listed in Table 1. The four groups contained 0, 1, 3, or 5 wt.% c-BN and were coded PMMA, PMMA-1cBN, PMMA-3cBN, and PMMA-5cBN. Test allocation is given in Table 2.
Table 1.
Materials used for PMMA/c-BN composite preparation and dry-sliding testing.
Table 2.
Nominal composition, group coding, and test allocation.
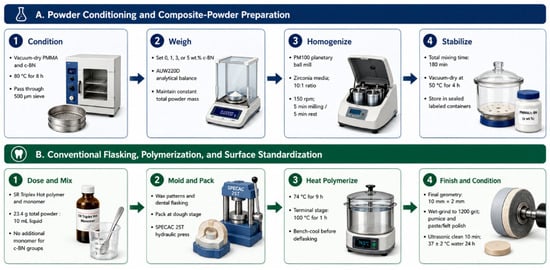
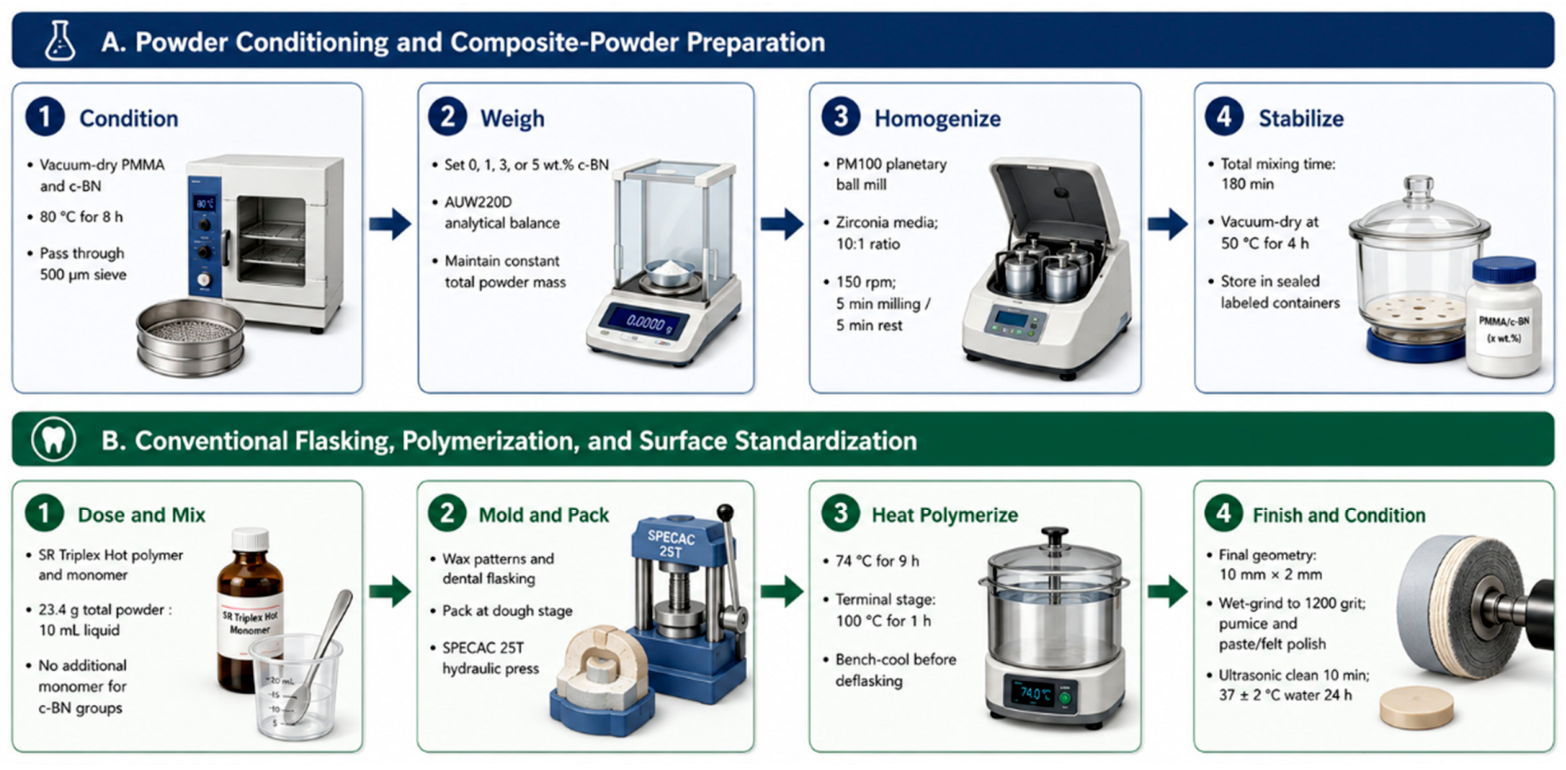
The PMMA and c-BN powders were vacuum-dried at 80 °C for 8 h in a Protherm laboratory vacuum oven (Protherm Furnaces, Ankara, Türkiye). Coarse secondary agglomerates were controlled by passage through a 500 µm stainless-steel analytical sieve (Retsch GmbH, Haan, Germany); the sieve aperture did not redefine the supplier-specified primary particle size. c-BN was substituted for an equivalent mass fraction of PMMA within the total powder. The commercial powder-to-liquid proportion was maintained at 23.4 g total powder per 10 mL SR Triplex Hot monomer for every group; no additional monomer was introduced for the reinforced formulations.
Powder homogenization was conducted before monomer addition using a PM100 planetary ball mill (Retsch GmbH, Haan, Germany) with zirconia media, a 10:1 ball-to-powder mass ratio, and a rotational speed of 150 rpm. Alternating cycles of 5 min milling and 5 min rest were applied for a total processing time of 180 min. The blended powders were subsequently vacuum-dried at 50 °C for 4 h and stored in sealed, composition-labeled containers until use.
Disk-shaped wax patterns (10 mm diameter × 2 mm thickness) were invested in dental flasks and eliminated to produce standardized mold cavities. Powder and monomer were mixed to the dough stage, packed into the molds, and pressed using a SPECAC 25T hydraulic press (Specac Ltd., Orpington, UK). Heat polymerization was performed in a thermostatically controlled water bath at 74 °C for 9 h followed by 100 °C for 1 h. The flasks were cooled gradually to room temperature before deflasking to limit residual stress and dimensional distortion [22].
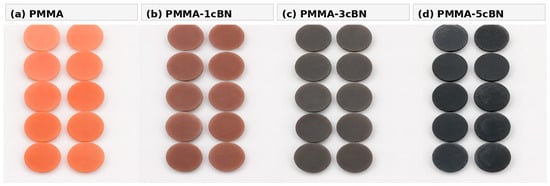
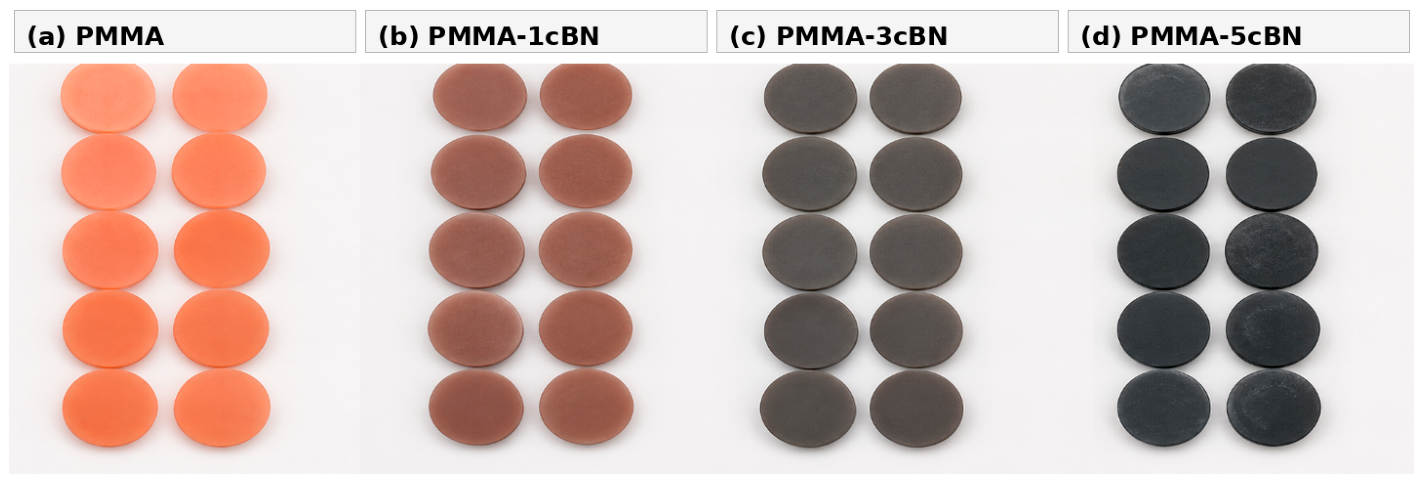
After deflasking, excess material was removed and the dimensions were verified. Specimens with visible porosity, edge fracture, warpage, incomplete filling, or surface defects were replaced. All accepted specimens were wet-ground sequentially with 100, 400, 800, and 1200 grit SiC papers under water irrigation, pre-polished with aqueous pumice, and finally polished using paste and a felt wheel. Identical abrasive sequences, polishing durations, applied pressures, and rotational conditions were used for all groups. The specimens were ultrasonically cleaned in distilled water for 10 min and stored in distilled water at 37 ± 2 °C for 24 h before testing [23,24,25]. The macroscopic appearance of the four groups is shown in Figure 2, and the complete preparation sequence is summarized in Figure 3.
Figure 2.
Macroscopic appearance of (a) PMMA, (b) PMMA-1cBN, (c) PMMA-3cBN, and (d) PMMA-5cBN. The pink control progressively darkened as the black c-BN fraction increased.
Figure 3.
Condensed specimen-preparation sequence showing raw-material conditioning, c-BN incorporation, powder homogenization, powder/liquid mixing, flasking, heat polymerization, finishing, and conditioning.
2.2. Characterization and Testing
The principal instruments and operating parameters are summarized in Table 3. One representative specimen from each group was used for each descriptive XRD, ATR-FTIR, and pre-/post-wear SEM/EDS assessment; these analyses were not treated as replicate-based inferential outcomes. Ten independently fabricated specimens per group were tested for microhardness and for wear/COF. The indentation and sliding protocols were aligned with ASTM E384-22 and ASTM G99-23, respectively [26,27].
Table 3.
Characterization, testing, and data-analysis protocol.
XRD patterns were recorded with an Empyrean diffractometer (Malvern Panalytical B.V., Almelo, The Netherlands) using Cu Kα radiation over 5–90° 2θ. The patterns were normalized for comparative presentation and interpreted qualitatively because PMMA was the dominant amorphous/semi-amorphous phase and the c-BN fraction was low. ATR-FTIR spectra were obtained with a Nicolet iS5 spectrometer equipped with an ATR accessory (Thermo Fisher Scientific Inc., Waltham, MA, USA) over 4000–500 cm−1. Spectral interpretation focused on the diagnostic PMMA C–H, ester C=O, and C–O/C–O–C bands; no degree of conversion value was calculated.
Pre- and post-wear surfaces were examined using an EVO MA10 SEM equipped with EDS (Carl Zeiss Microscopy GmbH, Jena, Germany) at 10 kV. General morphology was assessed at 500×, and localized particle- or damage-related features were examined at magnifications up to 20,000×. EDS spectra were acquired from representative matrix-rich or particle-rich regions. Because B and N are light elements and EDS probes a restricted interaction volume, the reported compositions were interpreted as local, semi-quantitative evidence rather than bulk formulation values or whole-surface dispersion maps [28,29,30,31,32].
Vickers microhardness was measured using an HVS-1000 tester (Mitech, supplied by Onalkon, Bursa, Türkiye) in accordance with ASTM E384-22 [26]. A 30 gf load (0.294 N) was applied for 20 s. Five valid indentations were made on each polished specimen with adequate separation from specimen edges and adjacent impressions. The mean of the five indentations represented the specimen-level HV0.03 value.
Dry-sliding tests were conducted using an ELKİMAK pin-on-disk tribometer (ELKİMAK, Elazığ, Türkiye) following the comparative principles of ASTM G99-23 [27]. The actual contact was ball-on-disk because a spherical 316L stainless-steel counterface of 5 mm diameter was used. Each specimen was tested at 10 N, 1 m s−1, and 1000 m under ambient dry laboratory conditions. Initial and interval masses were measured with an AUW220D analytical balance (Shimadzu, Kyoto, Japan; readability 0.0001 g). Cumulative mass loss was evaluated at 0, 50, 100, 500, 950, and 1000 m, while COF was recorded continuously. The dry steel-contact configuration was used as a controlled engineering-tribology screening condition and was not intended to reproduce saliva-lubricated intraoral contact directly.
2.3. Statistical Analysis and Composition-Window Modeling
Normality was examined with the Shapiro–Wilk test, variance homogeneity with Levene’s test, and group effects with one-way ANOVA followed by Tukey HSD comparisons at α = 0.05. Eta-squared and omega-squared were calculated as effect-size measures. Cumulative wear was additionally modeled using sliding distance (D), c-BN content (C), and the D × C interaction. Linear and quadratic composition-response equations were fitted for hardness, final mass loss, and COF. Multiple regression, support-vector regression, k-nearest neighbors, decision-tree, random-forest, extra-trees, gradient-boosting, AdaBoost, multilayer-perceptron, and Gaussian-process regressors were compared using MAE, MSE, RMSE, and R2. Because the design contained only four composition levels, these model metrics were interpreted as internal composition-window benchmarks rather than external validation or evidence of extrapolative performance [33,34,35,36,37,38,39,40,41,42,43,44,45,46].
3. Results
3.1. XRD Results
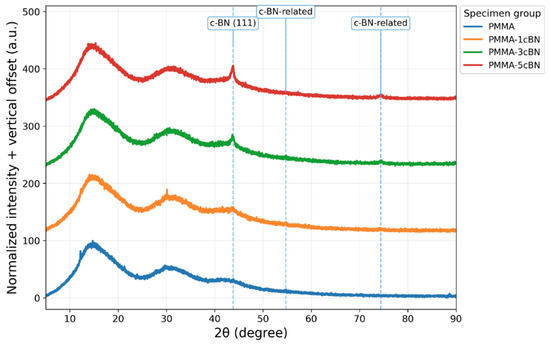
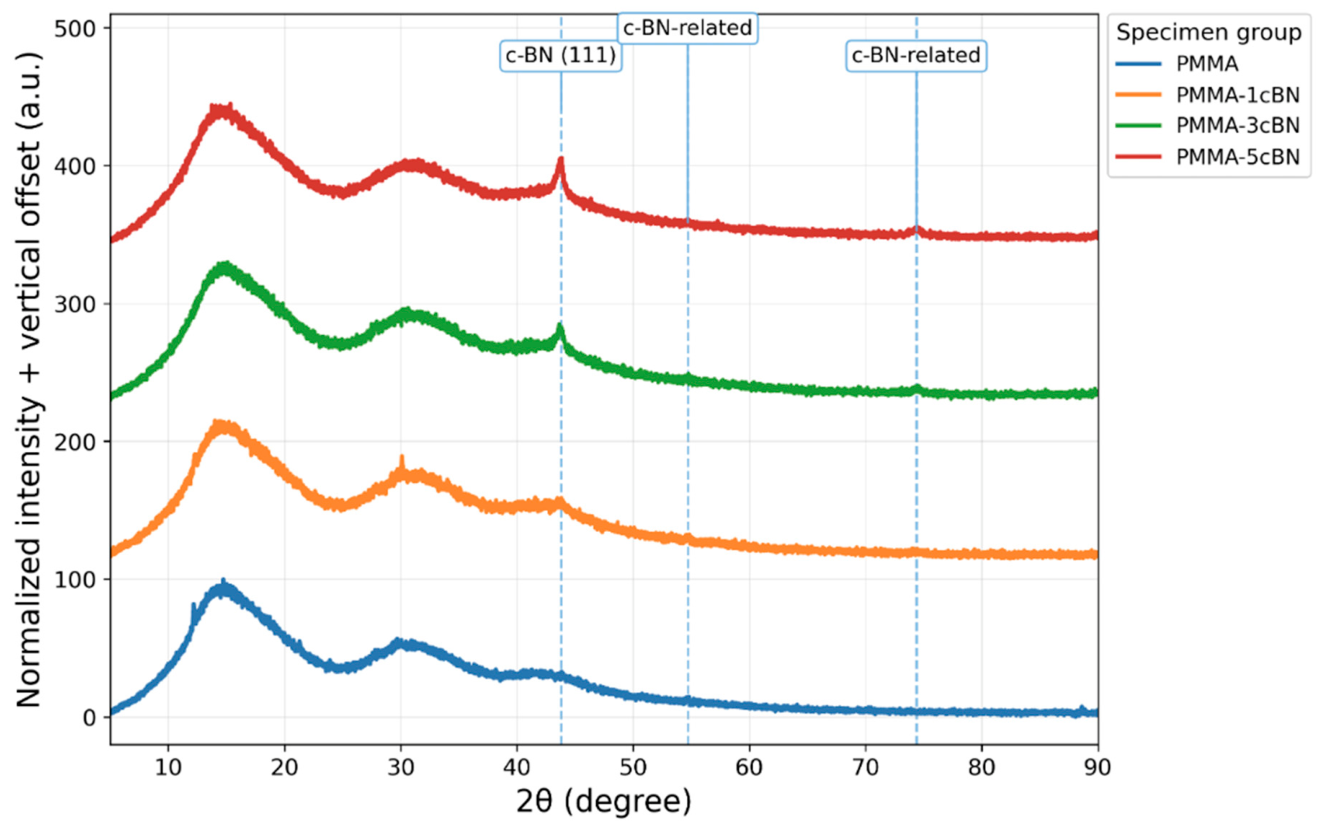
The normalized patterns are shown in Figure 4 and the main diffraction features are listed in Table 4. Unreinforced PMMA displayed a broad diffuse response centered near 14.3° 2θ with additional broad high-angle scattering. The PMMA halo remained dominant after reinforcement. A feature near 43.8° 2θ became progressively clearer with increasing c-BN content, and weak contributions near approximately 54.6–54.8° and 74.4° were most clearly visible in PMMA-3cBN and PMMA-5cBN.
Figure 4.
Normalized XRD patterns of PMMA and PMMA/c-BN composites. Dashed markers indicate high-angle regions associated with c-BN-related crystalline features.
Table 4.
Observed XRD features and structural description.
3.2. ATR-FTIR Results
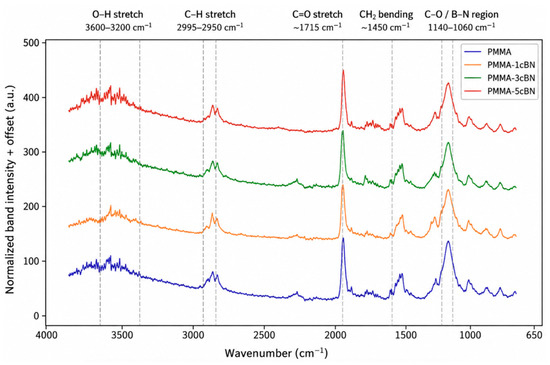
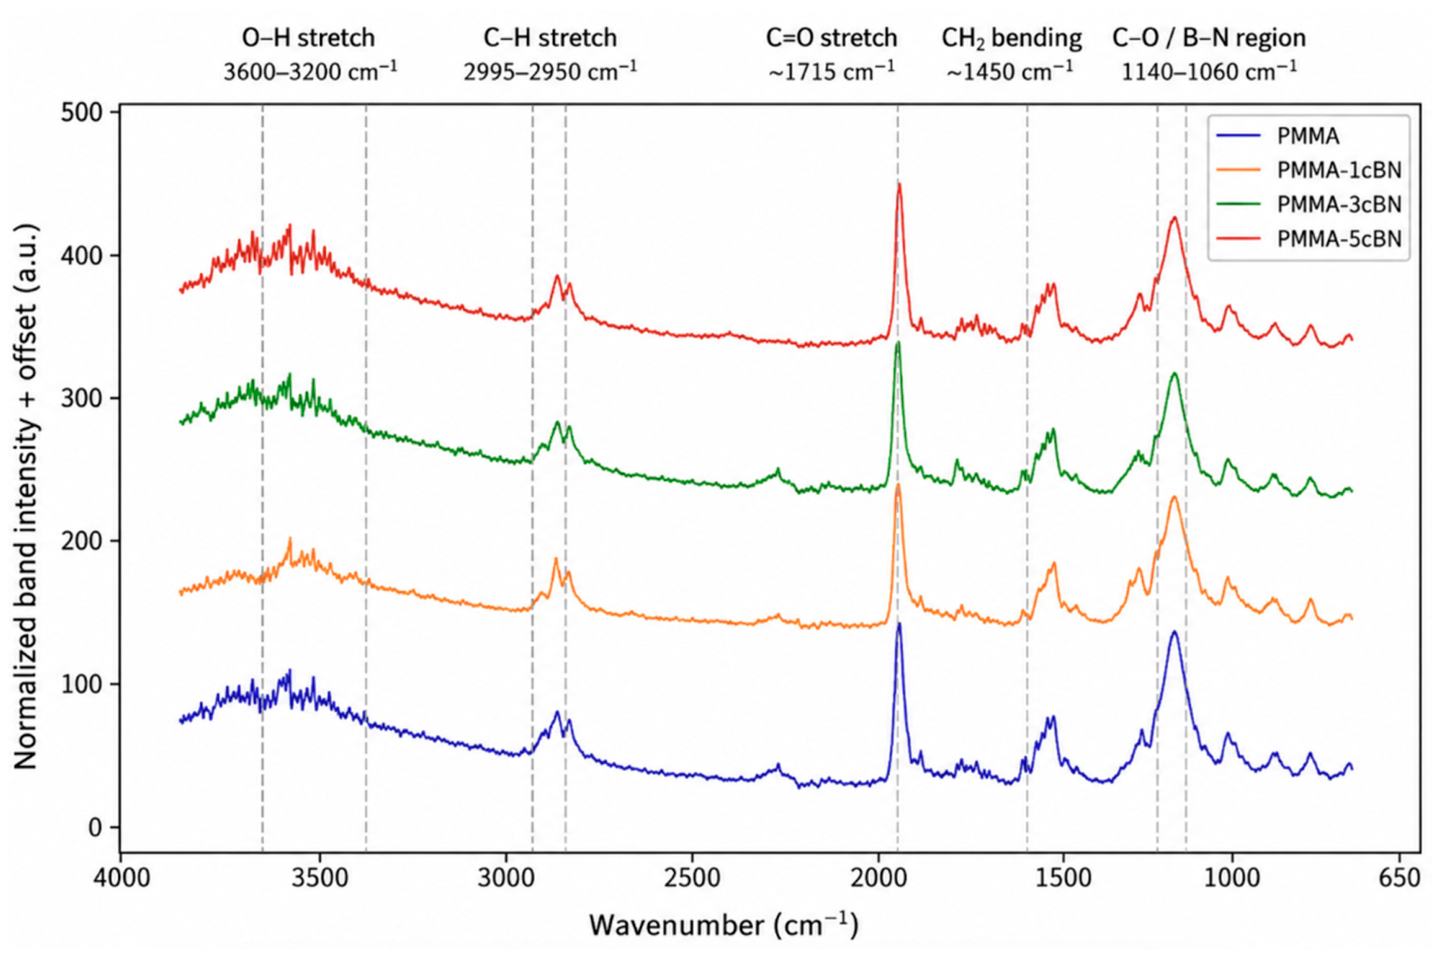
All groups retained the principal PMMA absorption bands (Figure 5; Table 5). The C–H stretching region at approximately 2995–2850 cm−1, the ester carbonyl band near 1720–1730 cm−1, CH3 deformation bands near 1450 and 1380 cm−1, and C–O/C–O–C bands in the 1260–1000 cm−1 region remained present. No isolated new dominant band or collapse of the ester-related response was observed. The overlapping fingerprint region prevented separate quantitative assignment of a weak c-BN contribution.
Figure 5.
Normalized ATR-FTIR spectra of PMMA and PMMA/c-BN composites.
Table 5.
Principal ATR-FTIR bands and observations.
3.3. Pre-Wear SEM/EDS Results
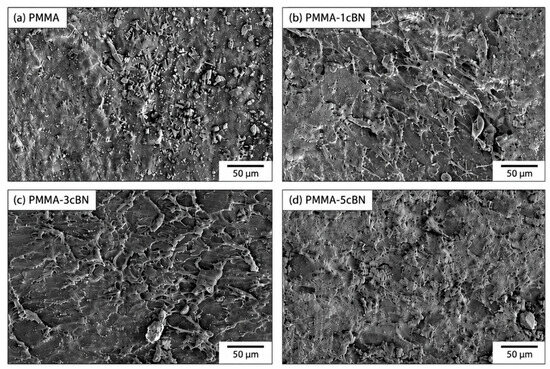
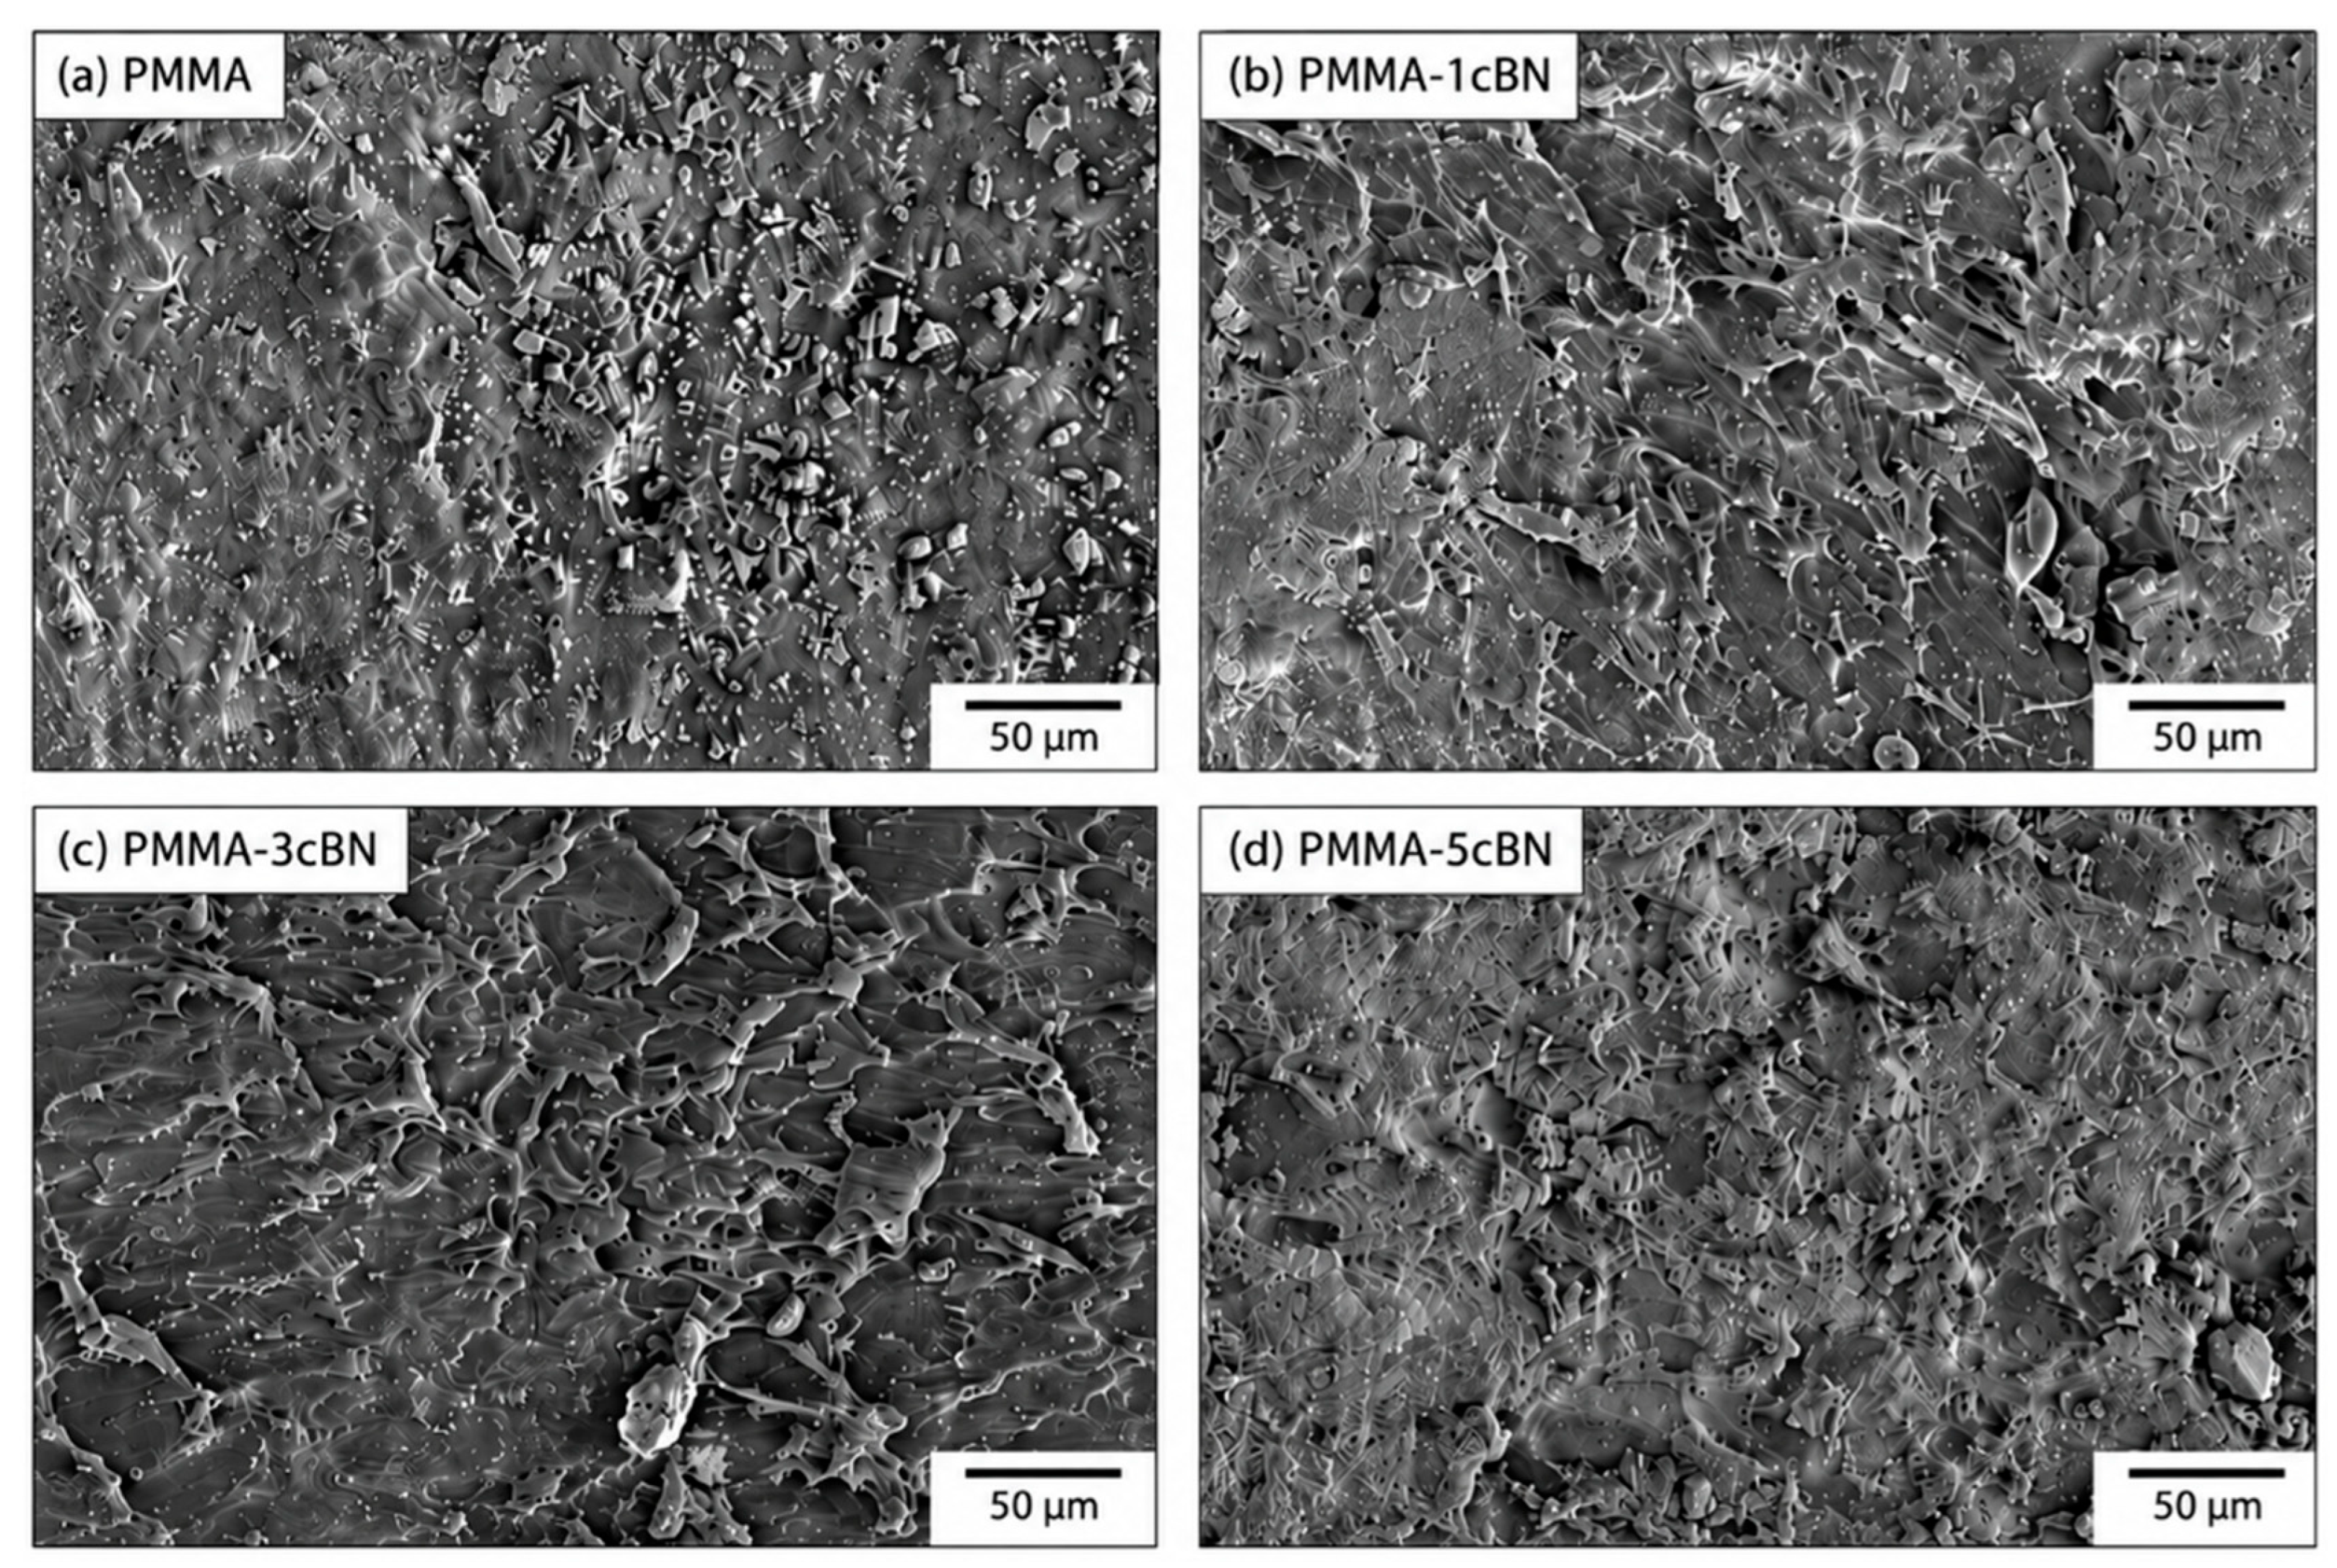
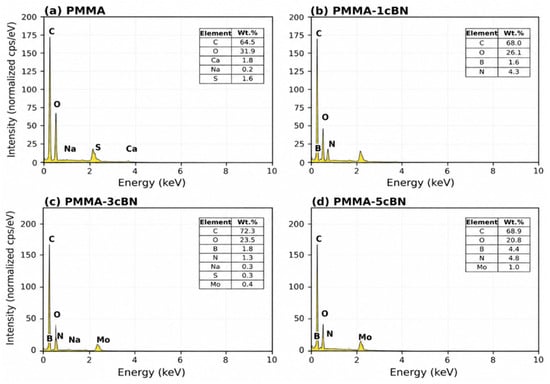
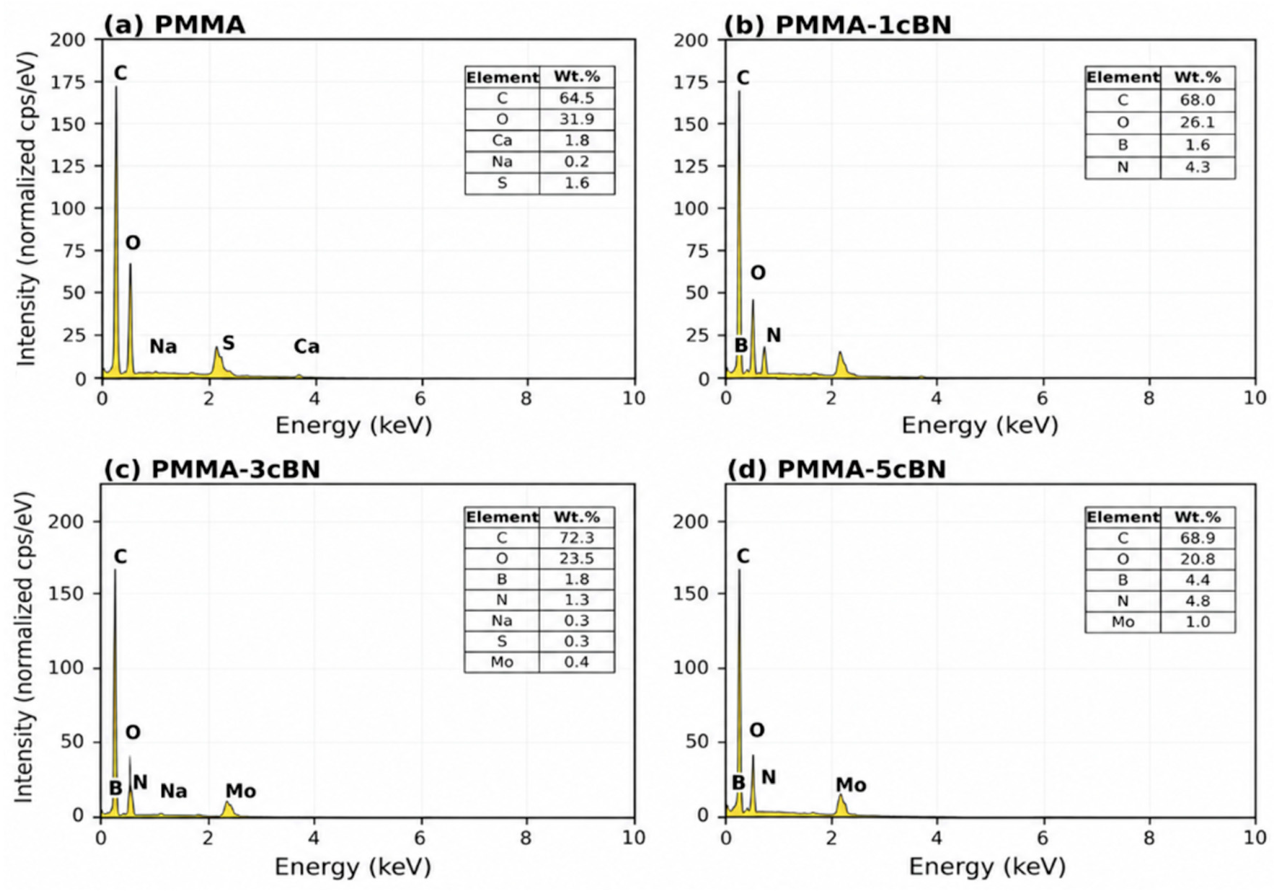
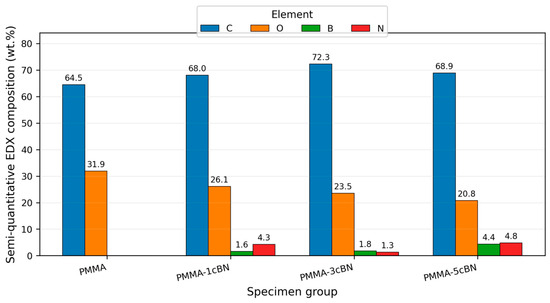
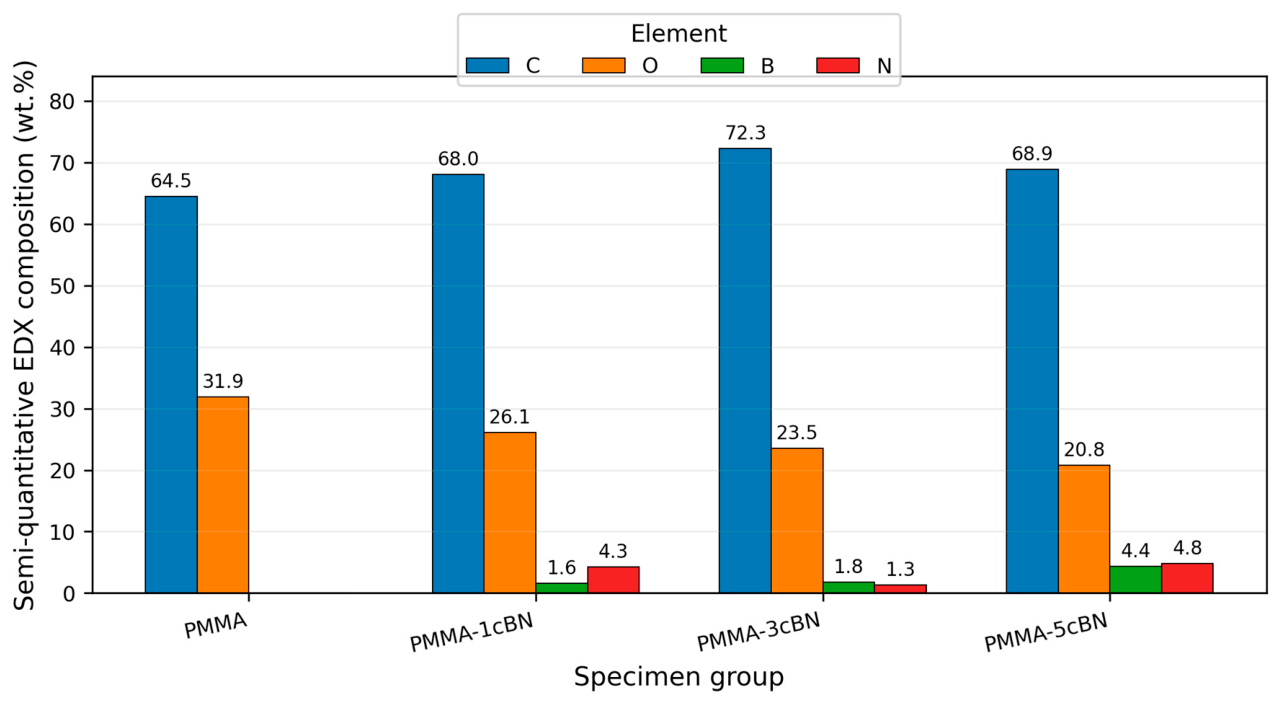
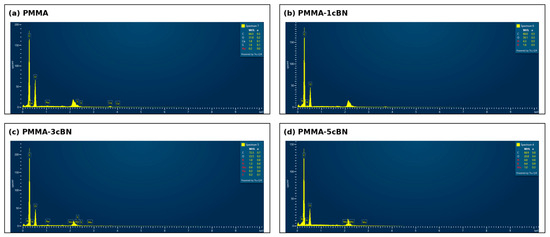
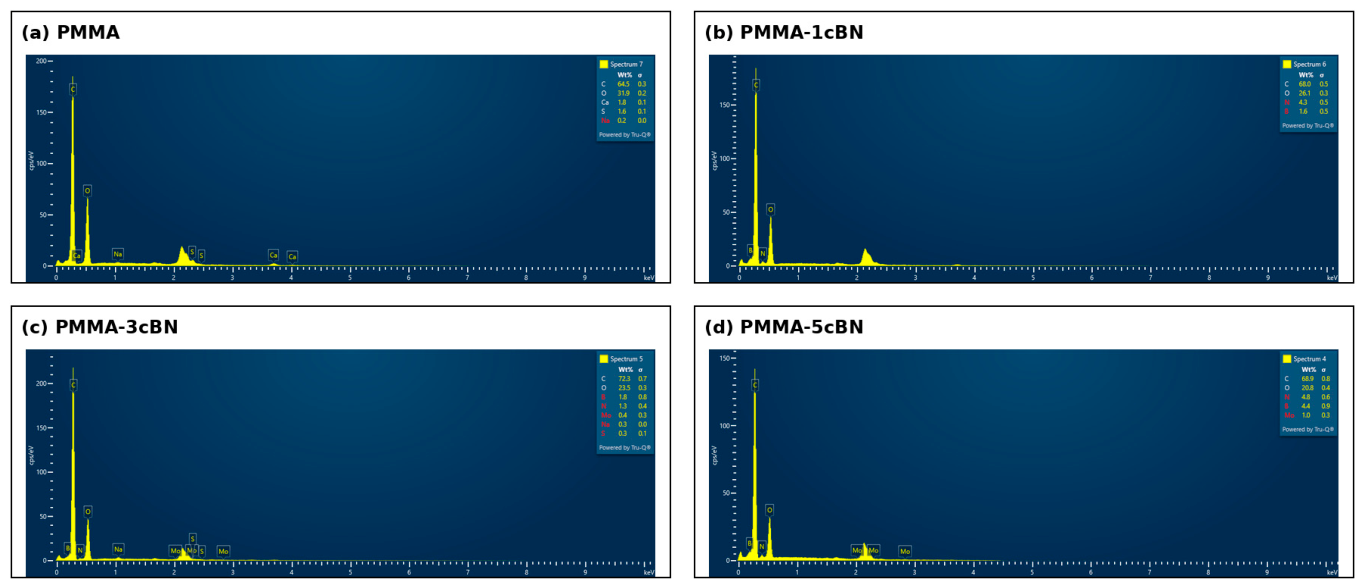
The polished PMMA control showed a matrix-dominated surface with preparation-related traces (Figure 6). Reinforced specimens showed progressively more frequent particle-associated contrast and local topographical heterogeneity. Representative EDS spectra (Figure 7), the elemental comparison (Figure 8), and Table 6 show carbon and oxygen as the dominant matrix-related elements and detectable B/N signals in the reinforced groups. The B and N contents were not proportional at every selected field; the highest selected-field values were obtained for PMMA-5cBN (4.4 wt.% B and 4.8 wt.% N).
Figure 6.
Representative pre-wear SEM morphologies of (a) PMMA, (b) PMMA-1cBN, (c) PMMA-3cBN, and (d) PMMA-5cBN.
Figure 7.
Representative pre-wear EDS spectra of PMMA and PMMA/c-BN groups.
Figure 8.
Semi-quantitative elemental composition measured in representative pre-wear EDS interaction volumes.
Table 6.
Local semi-quantitative EDS composition of representative pre-wear regions.
3.4. Vickers Microhardness Results
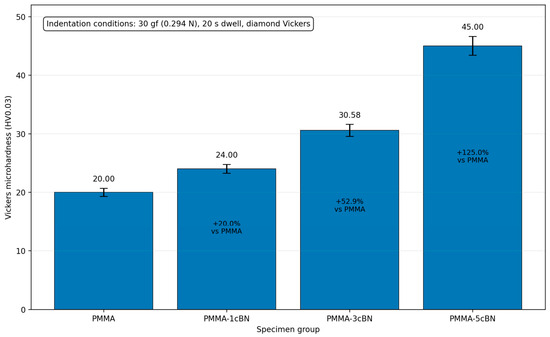
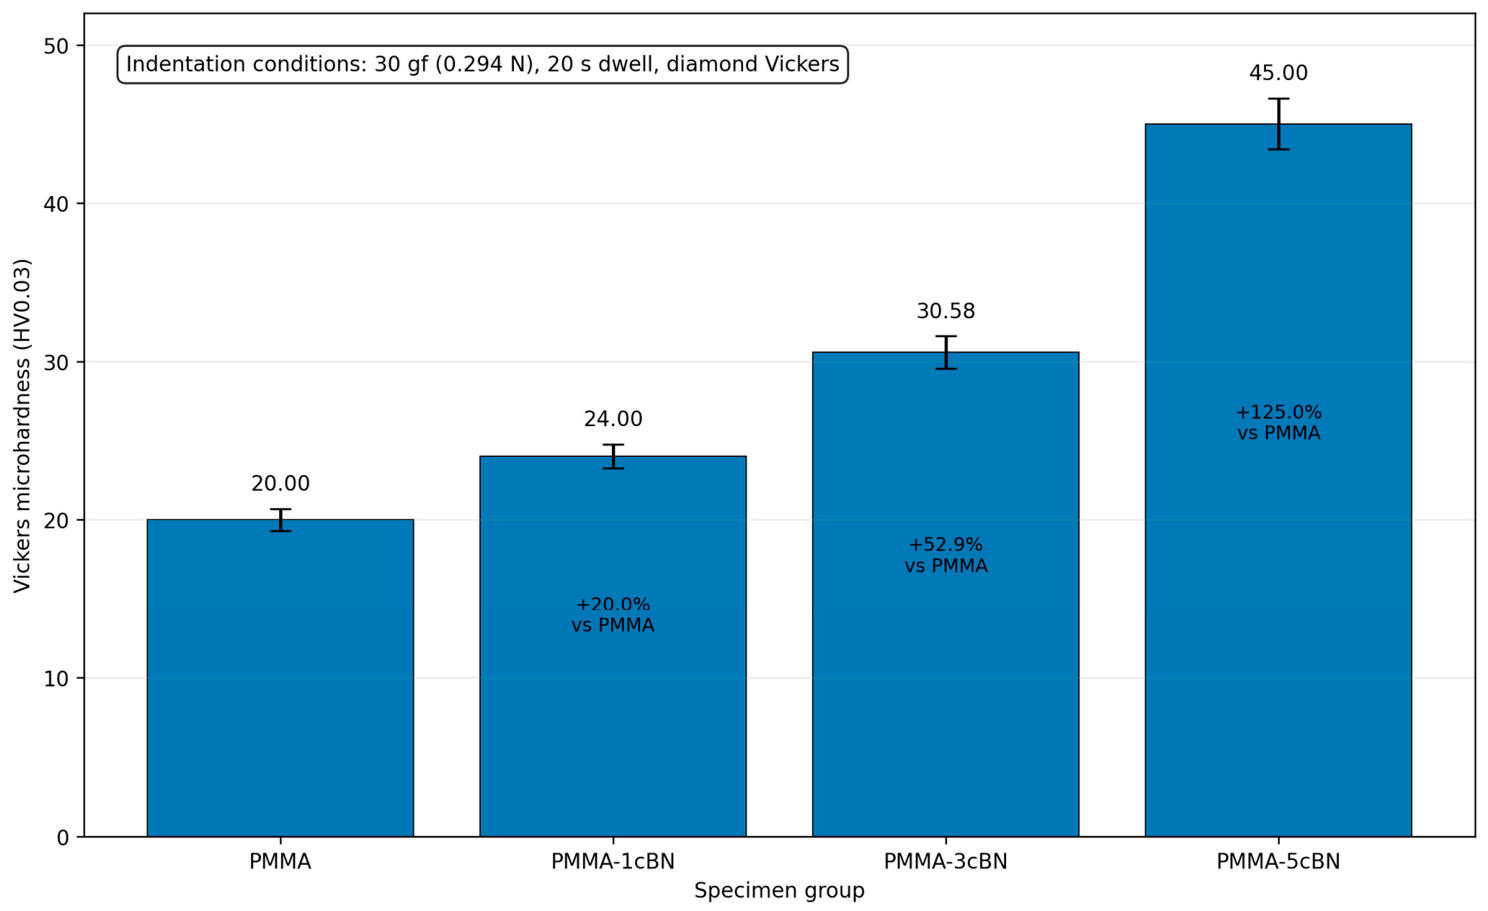
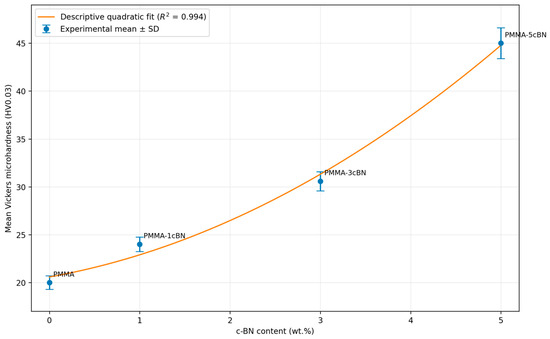
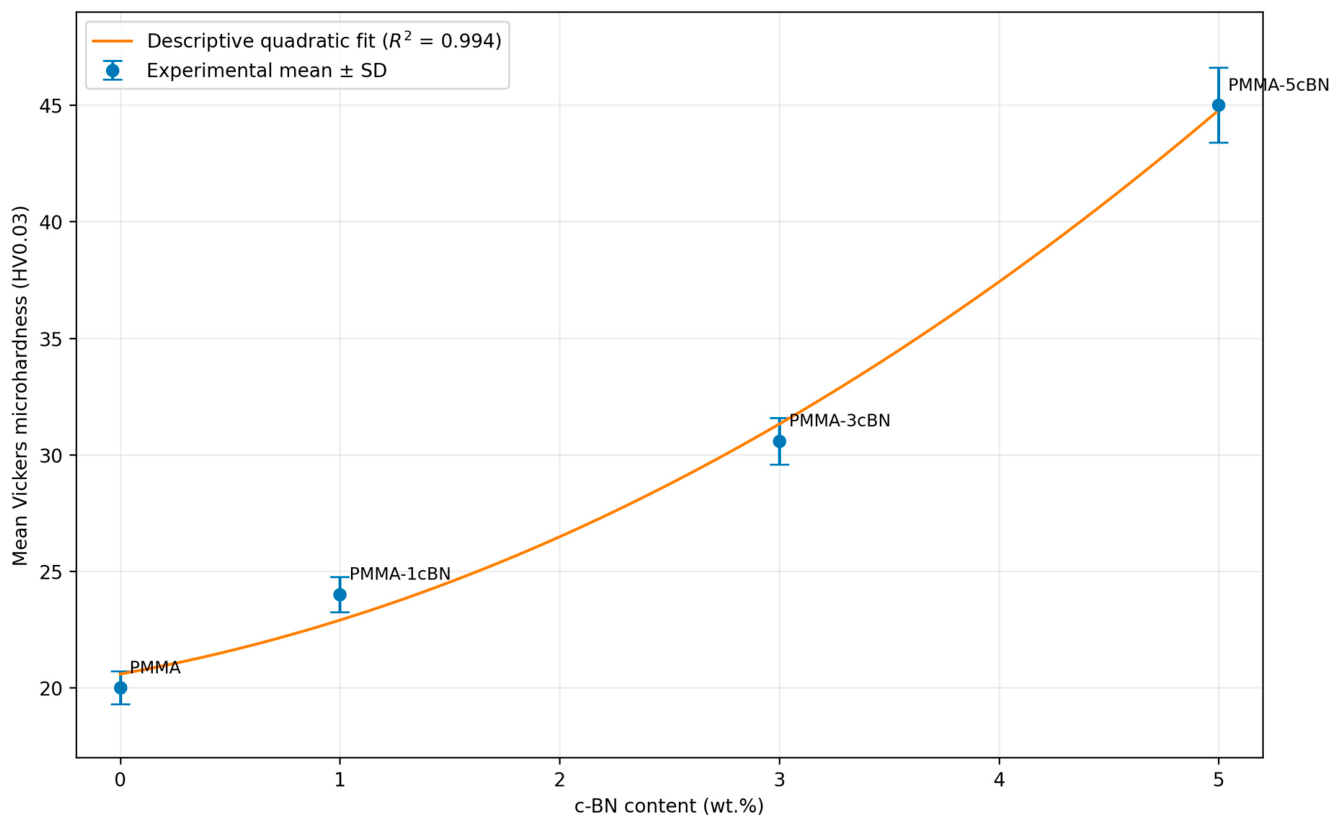
Microhardness increased monotonically with c-BN content (Figure 9 and Figure 10). Mean values were 20.00 ± 0.70, 24.00 ± 0.76, 30.58 ± 1.01, and 45.00 ± 1.61 HV0.03 for PMMA, PMMA-1cBN, PMMA-3cBN, and PMMA-5cBN, respectively. These values correspond to increases of 20.0%, 52.9%, and 125.0% relative to PMMA. Descriptive statistics and specimen-level values are reported in Table 7 and Table 8. ANOVA showed a significant group effect: F(3,36) = 1027.469, p = 6.445 × 10⁻³⁵, η2 = 0.988.
Figure 9.
Vickers microhardness of PMMA and PMMA/c-BN composites. Error bars show the standard deviation.
Figure 10.
Mean Vickers microhardness as a function of c-BN content. The curve is a descriptive fit within the measured compositional window.
Table 7.
Descriptive statistics for Vickers microhardness.
Table 8.
Specimen-level Vickers microhardness values (HV0.03).
3.5. Dry-Sliding Wear and Coefficient-of-Friction Results
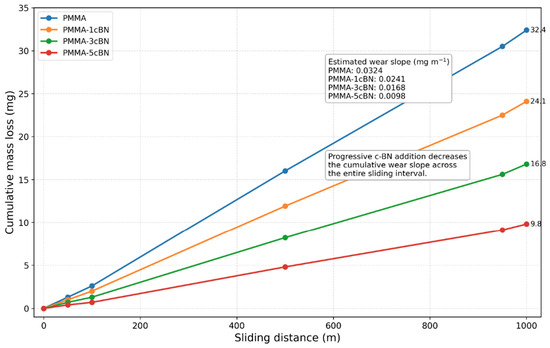
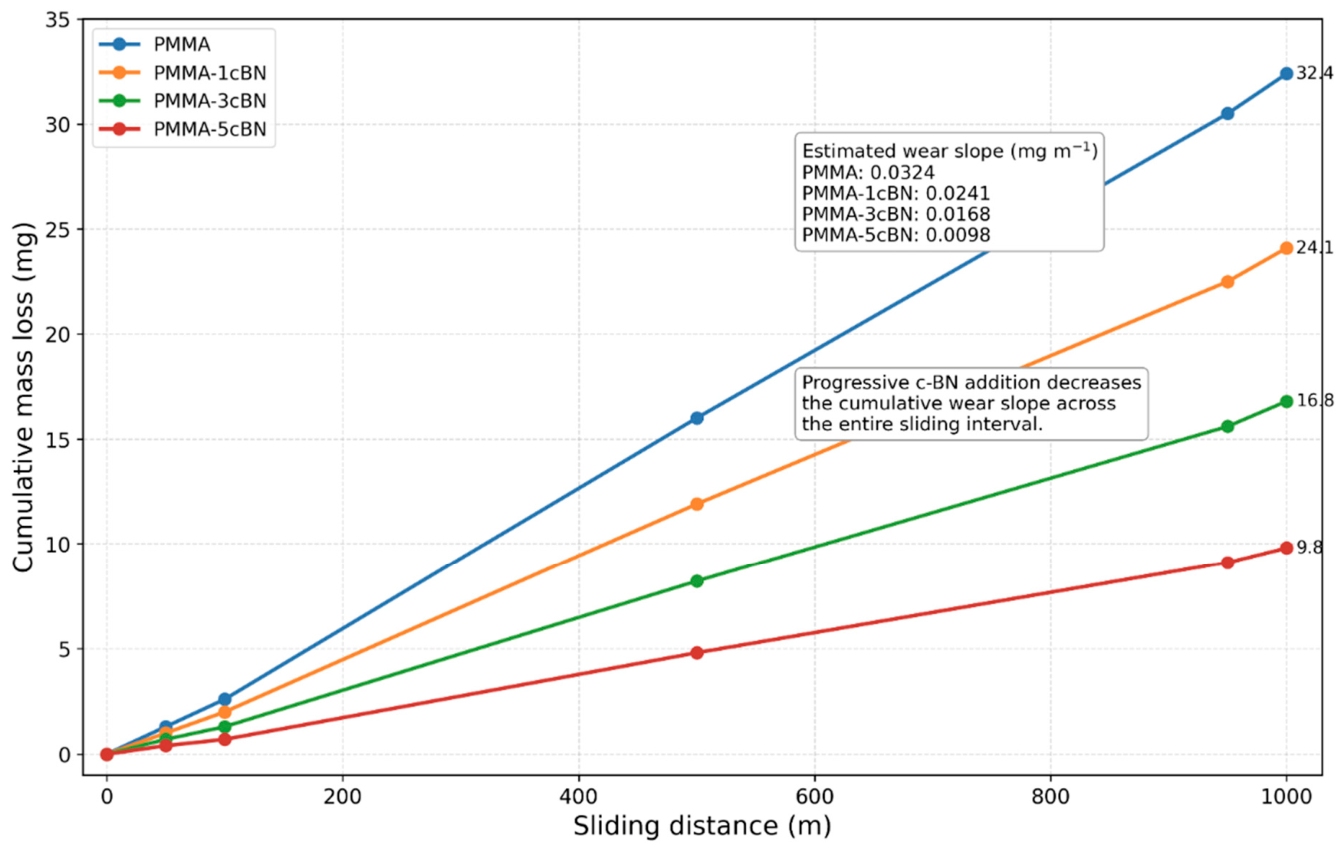
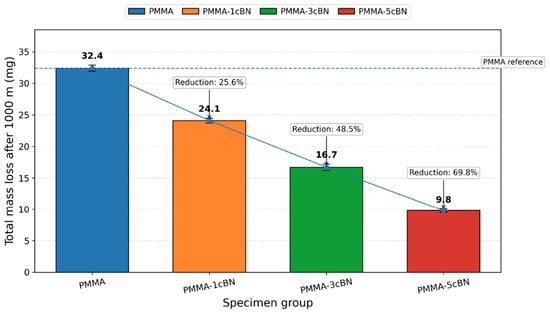
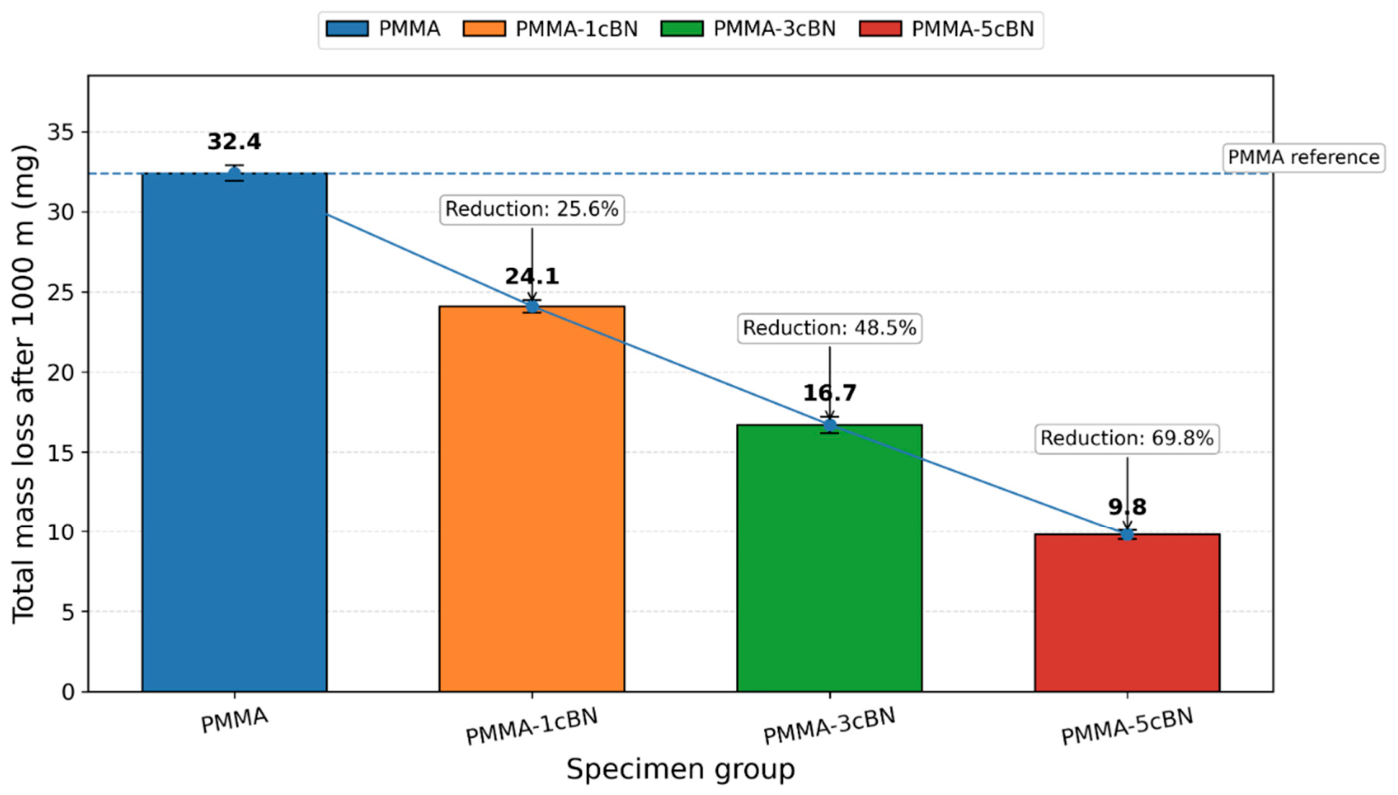
Cumulative mass loss increased with distance for all groups but remained lower at every measured distance as c-BN content increased (Figure 11; Table 9). At 1000 m, the cumulative profile reached 32.4, 24.1, 16.8, and 9.8 mg for PMMA, PMMA-1cBN, PMMA-3cBN, and PMMA-5cBN, respectively. Endpoint means from the independently tested specimens were 32.4 ± 0.53, 24.1 ± 0.44, 16.7 ± 0.45, and 9.8 ± 0.30 mg (Figure 12; Table 10 and Table 11), corresponding to reductions of 25.6%, 48.5%, and 69.8% relative to PMMA.
Figure 11.
Cumulative mass loss evolution as a function of sliding distance.
Table 9.
Cumulative mass loss as a function of sliding distance (mg).
Figure 12.
Final mass loss after 1000 m dry sliding. Error bars show standard deviation.
Table 10.
Final mass loss, reduction relative to PMMA, and estimated wear slope.
Table 11.
Specimen-level final mass-loss measurements after 1000 m.
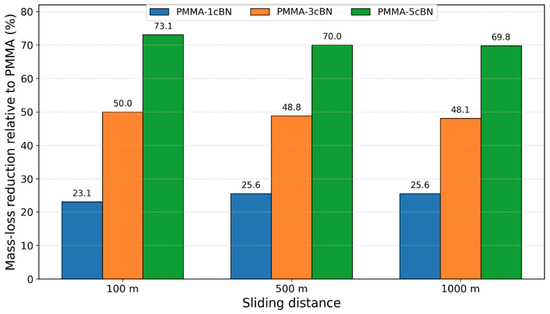
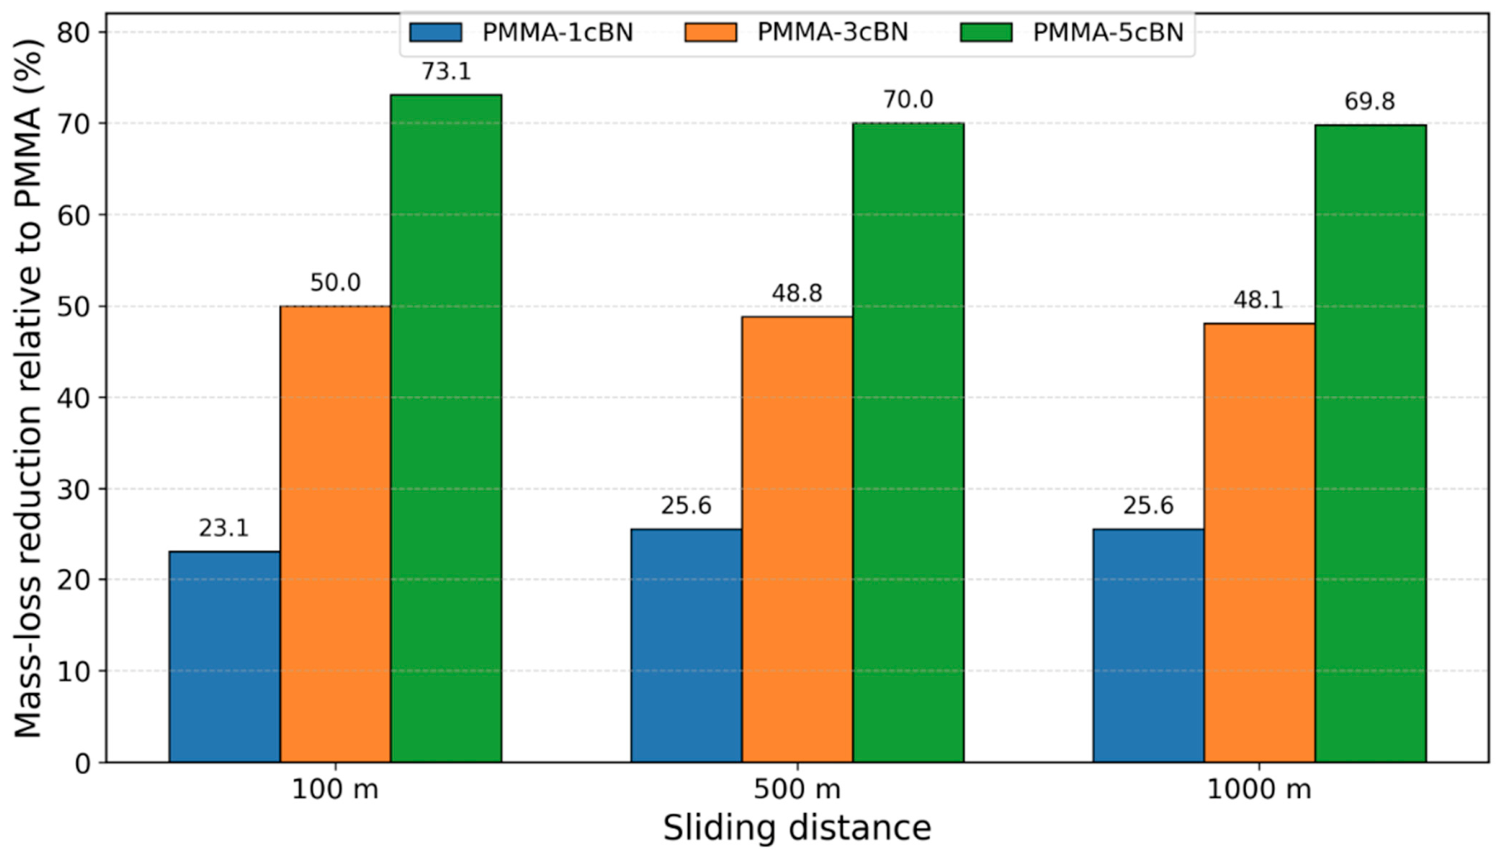
The relative wear-loss reductions at 100, 500, and 1000 m are shown in Figure 13. The estimated wear slope decreased from 0.03056 mg m−1 for PMMA to 0.02623, 0.01757, and 0.00891 mg m−1 for the 1, 3, and 5 wt.% groups, respectively. The distance × c-BN interaction was negative (β = −0.00433 mg m−1 per wt.% c-BN, p < 0.001), and the interaction model explained 99.1% of the cumulative-mass-loss variation.
Figure 13.
Mass-loss reduction in c-BN-reinforced PMMA relative to unreinforced PMMA at selected sliding distances.
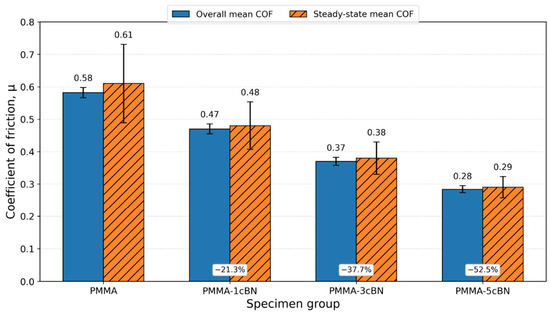
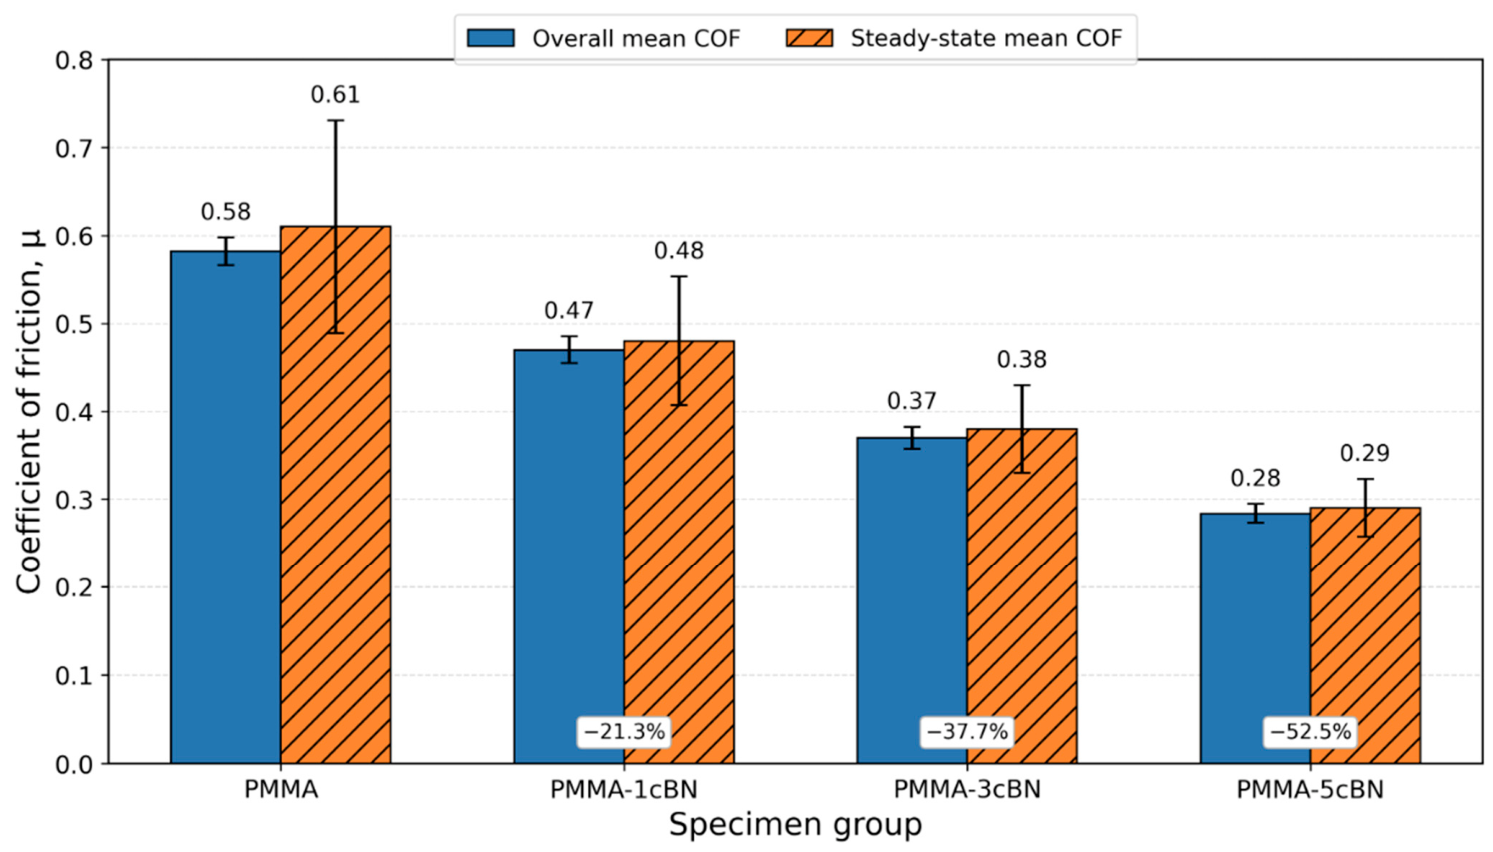
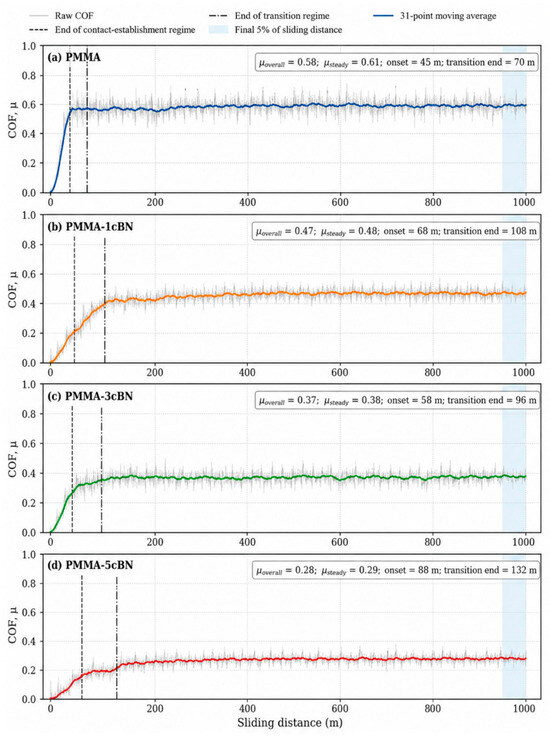
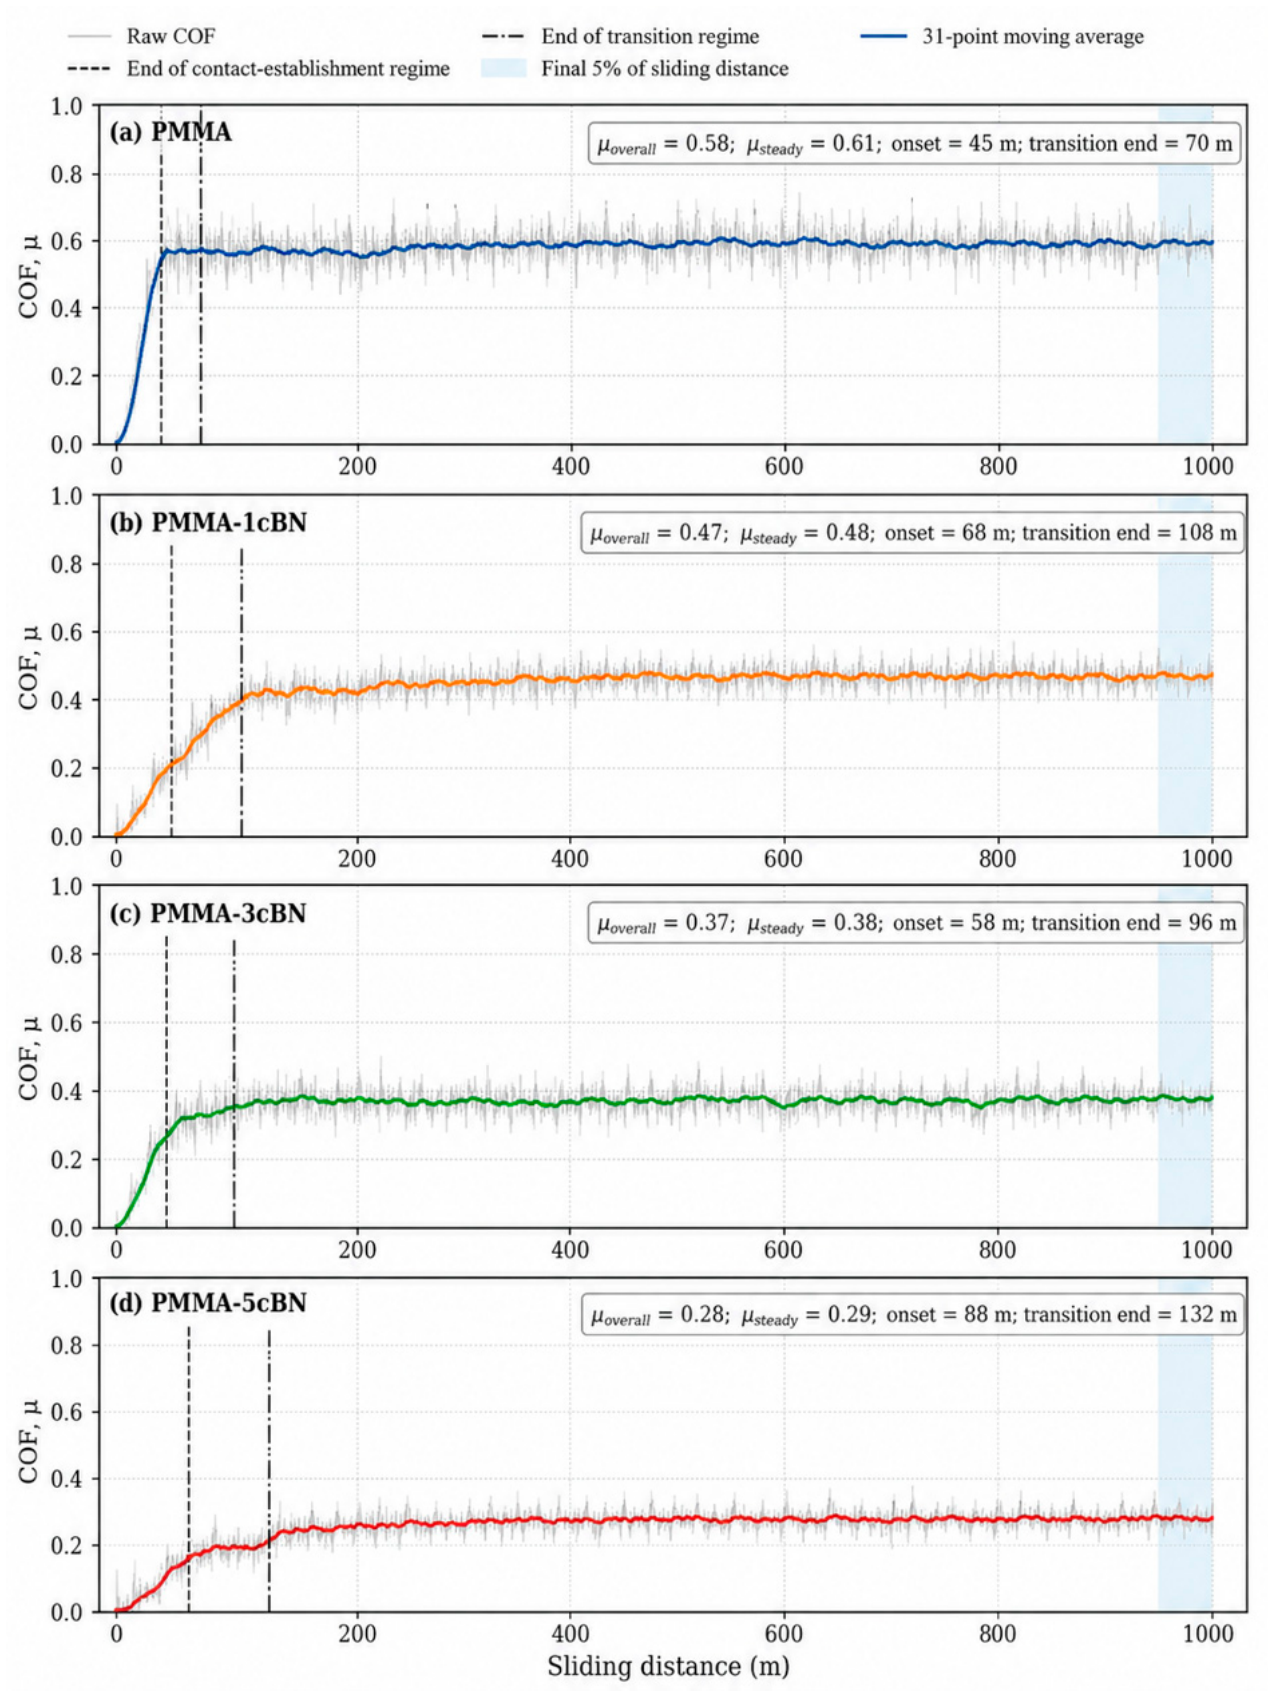
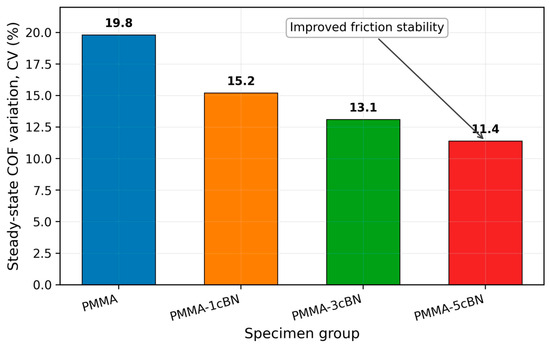
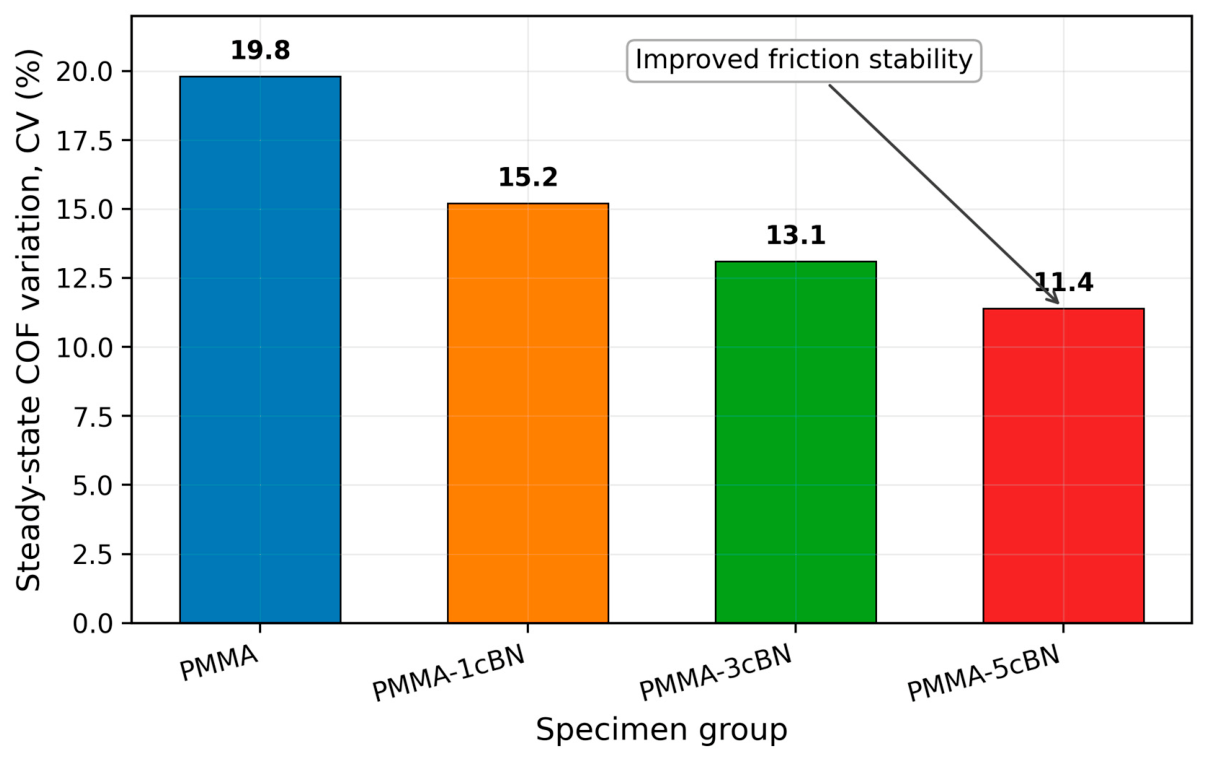
The overall mean COF decreased from 0.58 for PMMA to 0.47, 0.37, and 0.28 for PMMA-1cBN, PMMA-3cBN, and PMMA-5cBN, respectively (Figure 14). Steady-state COF values were 0.61, 0.48, 0.38, and 0.29. Distance-resolved traces and regime endpoints are shown in Figure 15 and Table 12. The steady-state coefficient of variation decreased from 19.8% to 15.2%, 13.1%, and 11.4% (Figure 16). Specimen-level overall COF values are listed in Table 13. ANOVA confirmed a significant COF group effect, F(3,36) = 901.291, p = 6.615 × 10⁻³⁴, η2 = 0.987.
Figure 14.
Overall and steady-state mean coefficients of friction for PMMA and PMMA/c-BN composites.
Figure 15.
Distance-resolved coefficient-of-friction evolution during 1000 m dry sliding. Raw signals, moving averages, regime boundaries, and the final steady-state evaluation interval are indicated.
Table 12.
Friction-regime and coefficient-of-friction parameters.
Figure 16.
Steady-state coefficient-of-friction variation, expressed as the coefficient of variation.
Table 13.
Specimen-level overall coefficient-of-friction values.
3.6. Post-Wear SEM/EDS Results
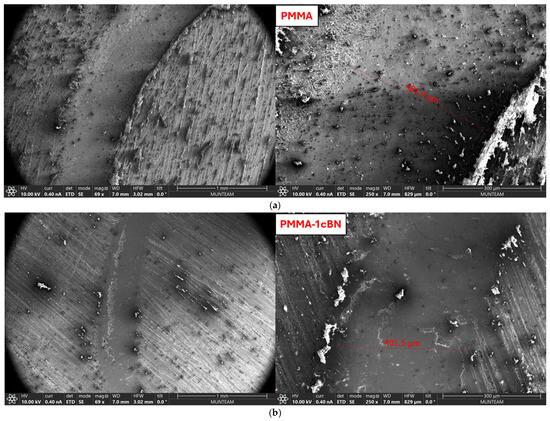
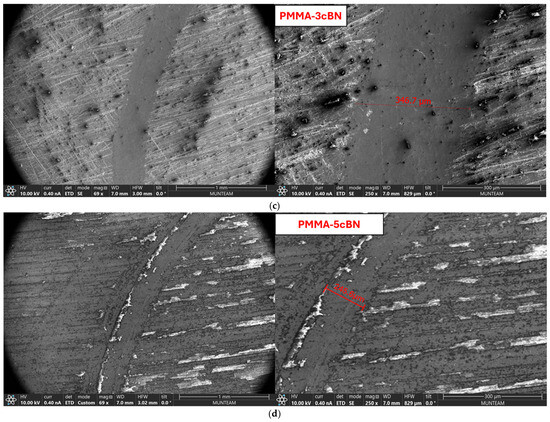
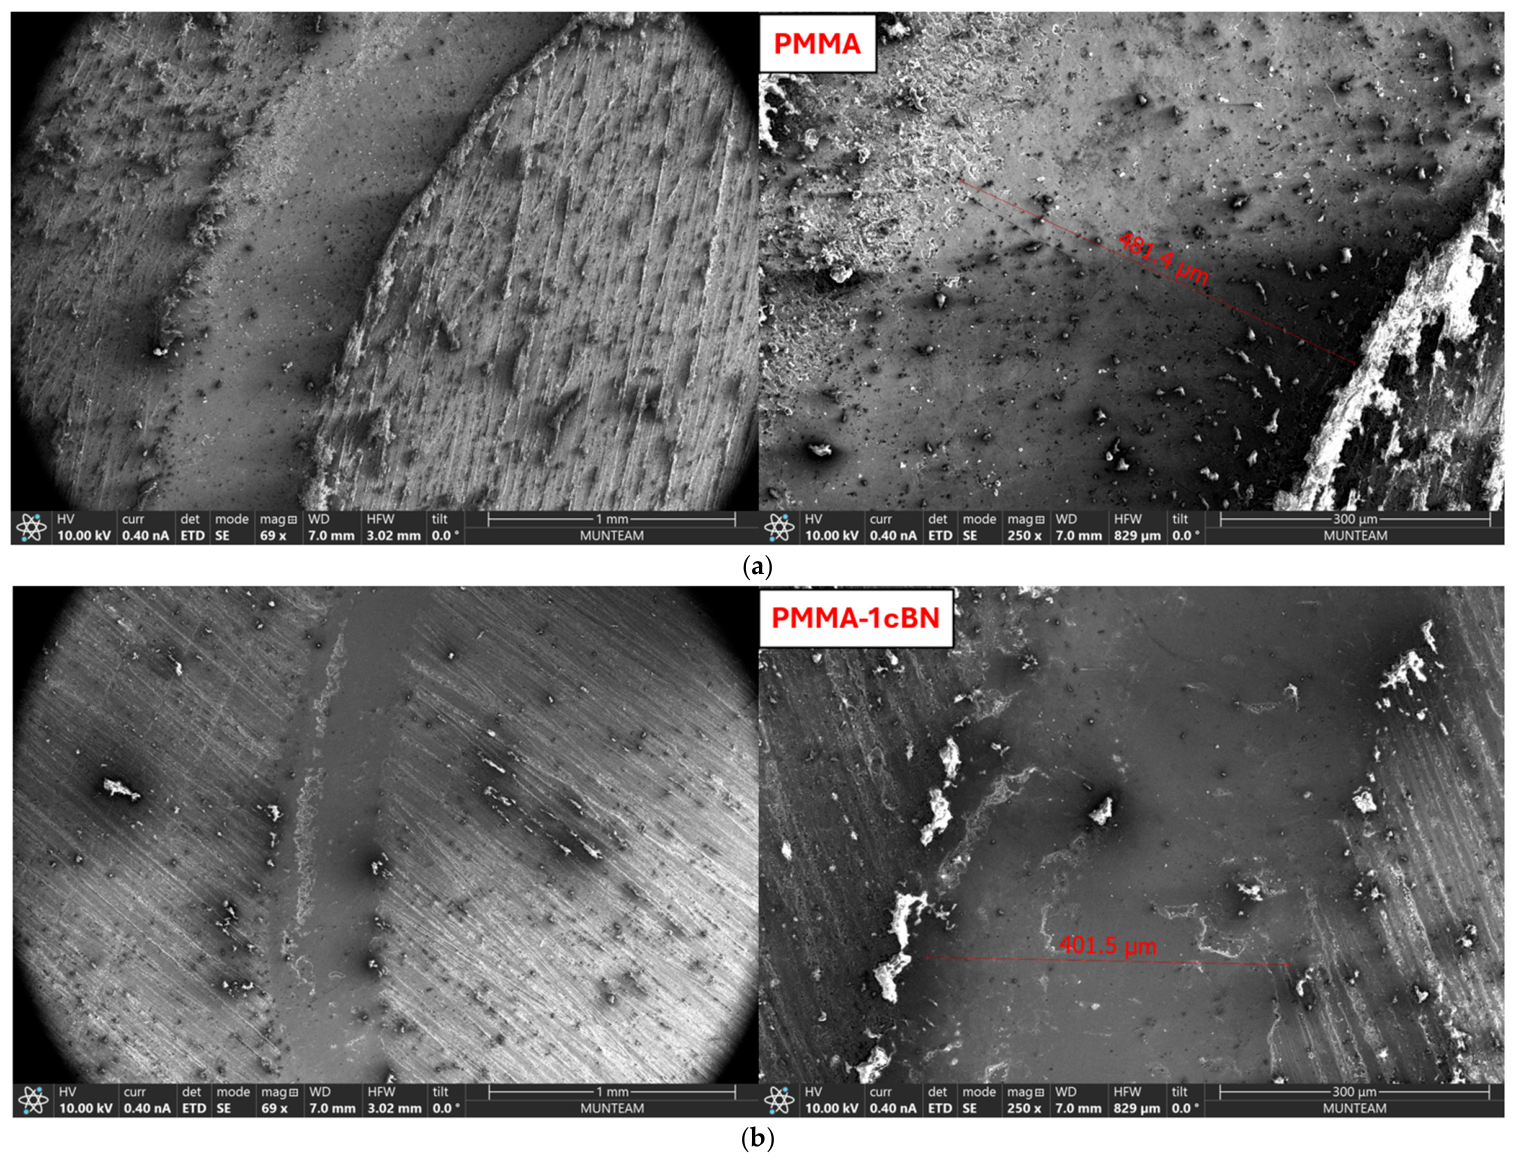
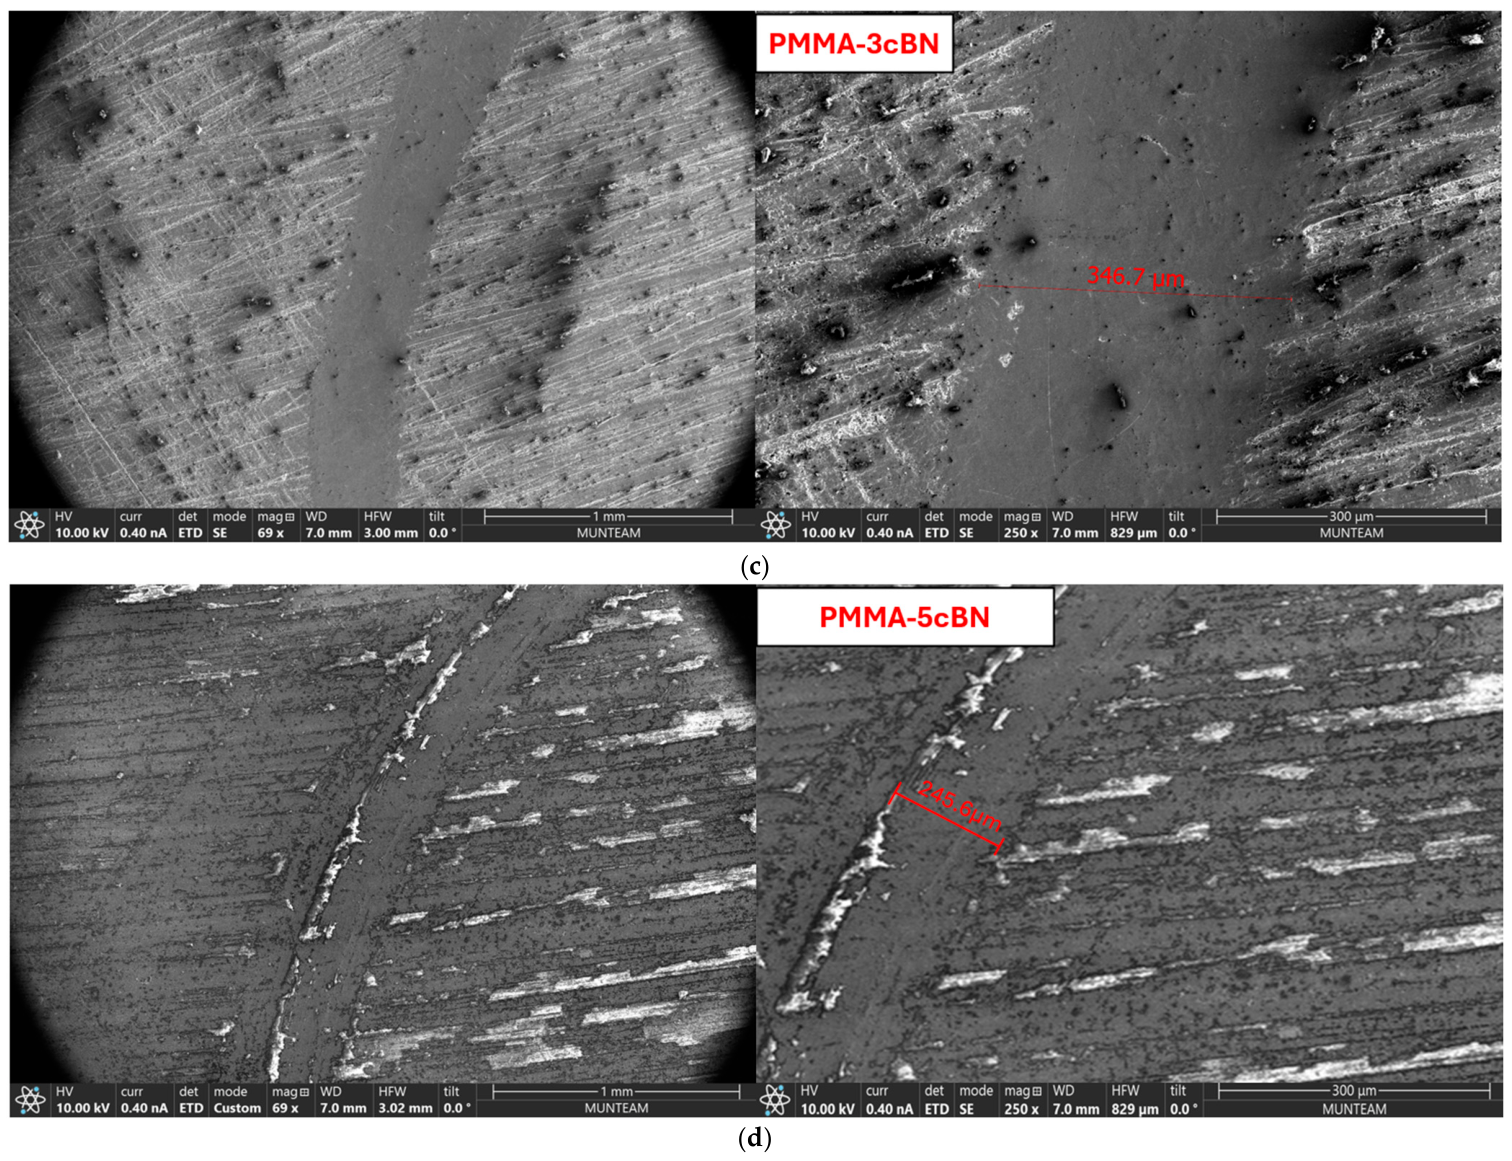
Post-wear SEM revealed broad smearing, grooves, debris accumulation, pits, and locally detached regions on the unreinforced PMMA track (Figure 17a). The reinforced groups retained grooves and localized damage, but the visible extent of smearing and material detachment decreased progressively from 1 to 5 wt.% c-BN (Figure 17b–d). PMMA-5cBN showed the most continuous worn surface and the least severe macroscopic damage among the tested groups. Representative post-wear EDS spectra (Figure 18) retained B/N signals in the reinforced wear tracks, with local values dependent on the selected interaction volume.
Figure 17.
Representative post-wear SEM morphologies after 1000 m of dry sliding: (a) PMMA, (b) PMMA-1cBN, (c) PMMA-3cBN, and (d) PMMA-5cBN.
Figure 18.
Representative post-wear EDS spectra from the wear-track regions of PMMA and PMMA/c-BN groups.
3.7. Statistical and Composition-Window Modeling Results
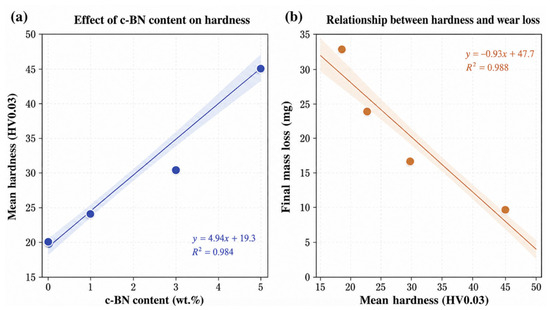
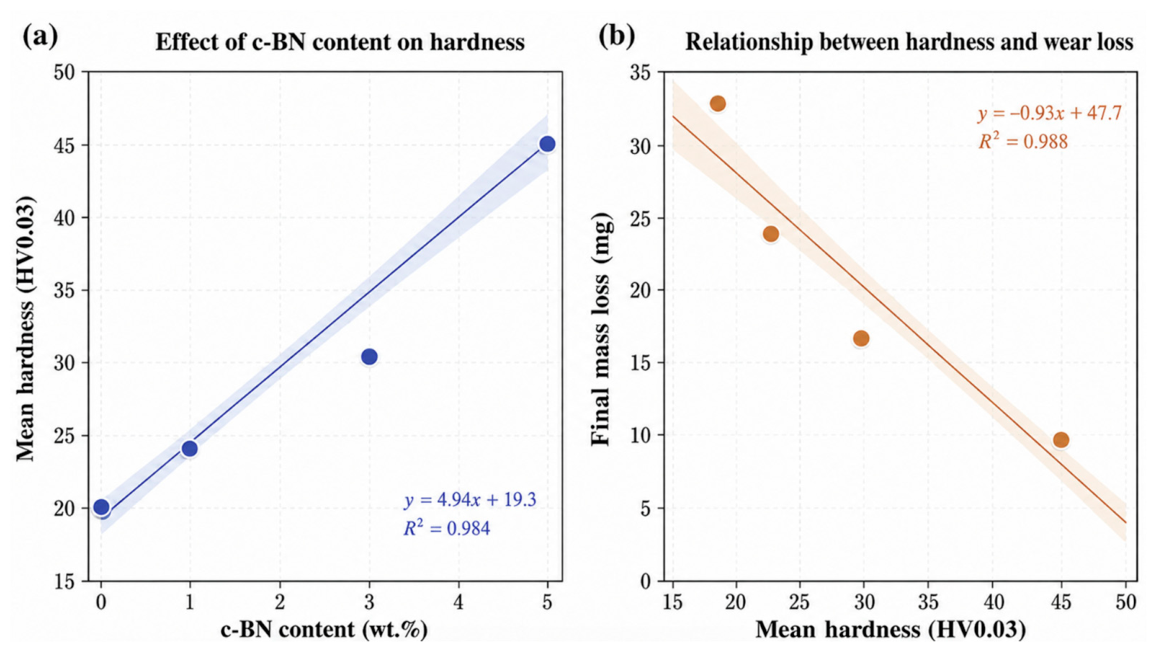
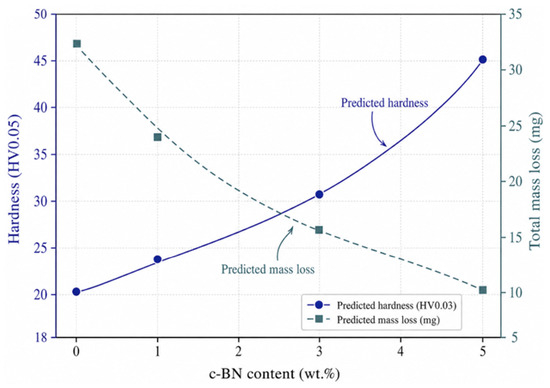
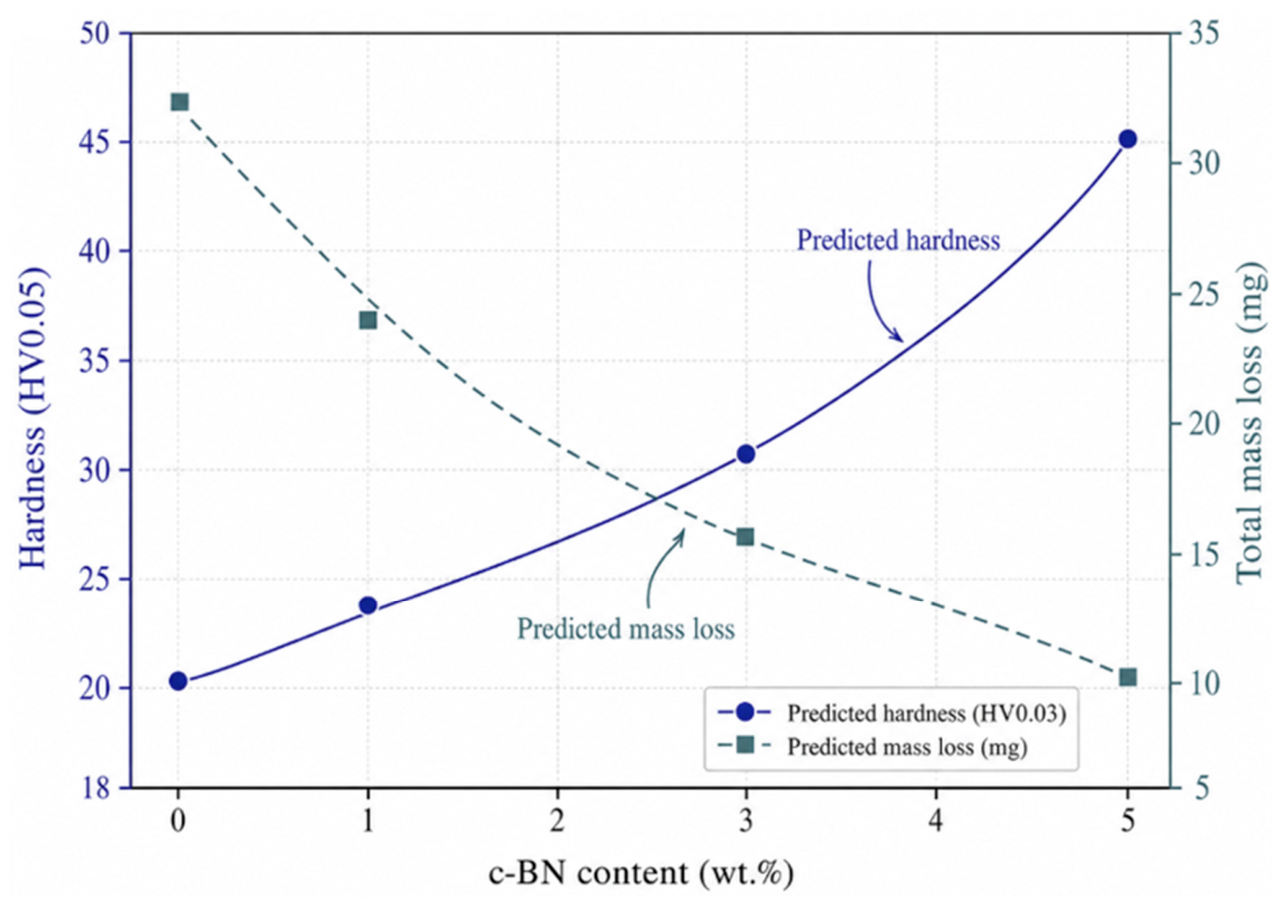
Figure 19 summarizes the positive relationship between c-BN content and hardness and the inverse relationships between hardness, mass loss, and COF. Figure 20 presents the fitted response curves within 0–5 wt.% c-BN. The principal inferential results are consolidated in Table 14. All Tukey comparisons between reinforced groups and PMMA were significant at adjusted p < 0.001. The associated model benchmarks and assumption diagnostics are presented in Table 15, Table 16 and Table 17, and the detailed Tukey contrasts are reported in Table 18.
Figure 19.
Statistical relationships among c-BN content, Vickers microhardness, final mass loss, and coefficient of friction.
Figure 20.
Composition-window response curves for predicted hardness, final mass loss, and coefficient of friction.
Table 14.
Statistical summary of the principal experimental responses.
Table 15.
Internal model-performance benchmarks for final mass-loss prediction after 1000 m.
Table 16.
Internal model-performance benchmarks for Vickers microhardness.
Table 17.
Assumption tests and effect size diagnostics for the principal endpoint responses.
Table 18.
Tukey HSD comparisons of reinforced groups versus unreinforced PMMA.
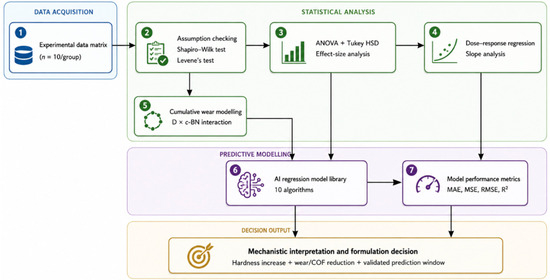
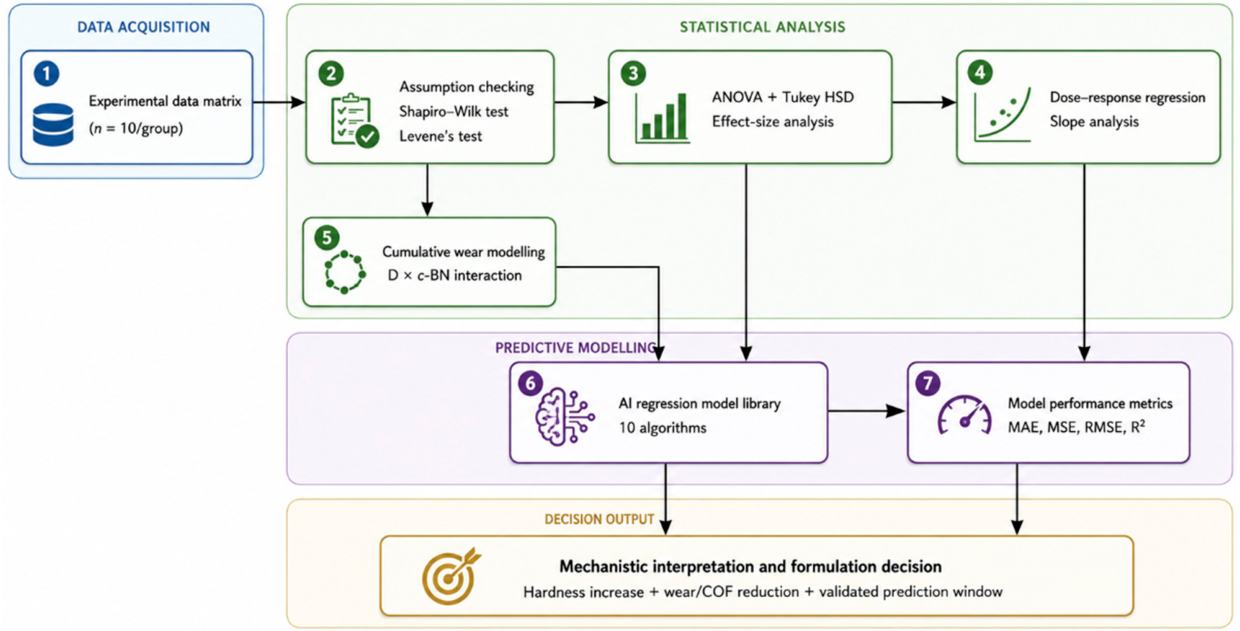
The descriptive algorithm benchmarks for final mass loss and hardness are listed in Table 15 and Table 16, respectively. Assumption tests and effect sizes are provided in Table 17. Linear and quadratic equations and the cumulative wear-interaction equation are reported in Table 19. Within the measured window, the quadratic equations gave R2 values of 0.994 for hardness, 0.989 for final mass loss, and 0.990 for COF. The complete analysis sequence is illustrated in Figure 21. These values quantify fit to the present dataset and do not constitute external model validation.
Table 19.
Regression equations and dose–response interpretation for 0–5 wt.% c-BN. C is c-BN content (wt.%) and D is sliding distance (m).
Figure 21.
Statistical and composition-window modeling workflow linking assumption testing, effect sizes, post hoc comparisons, regression, model benchmarking, and response interpretation.
4. Discussion
4.1. Structural, Chemical, and Surface Evidence
The combined XRD and ATR-FTIR results support a physically reinforced two-phase interpretation. The broad PMMA scattering response remained dominant, while c-BN-related high-angle features became easier to detect as filler content increased. Simultaneously, the diagnostic ester carbonyl and C–O/C–O–C vibrations remained present. The data therefore indicate preservation of the principal PMMA structural and functional-group framework rather than filler-induced crystallization or formation of a new dominant reaction product. Band retention does not quantify the degree of conversion or residual monomer, and no such claim is made from the present spectra [28,29,30,31].
The SEM/EDS observations complement the diffraction evidence by locating reinforcement-associated contrast and B/N signals in selected surface volumes. The non-proportional EDS values among individual fields are expected because light-element quantification is sensitive to absorption, detector efficiency, surface relief, and the fractions of polymer and filler within the interaction volume. Consequently, these spectra verify local c-BN-containing regions but do not establish bulk stoichiometry, nanoscale dispersion uniformity, or chemical interfacial bonding [32].
4.2. Hardening Response and Reinforcement Mechanism
The 125.0% increase in HV0.03 at 5 wt.% c-BN is consistent with a hard-particle constraint mechanism. Under indentation, the unreinforced polymer accommodates load through chain mobility, viscoelastic displacement, and local plastic flow. c-BN-containing domains increase the resistance of the affected volume to penetration, transfer part of the applied load, and constrain deformation of the surrounding matrix. The accelerated response between 3 and 5 wt.% suggests that the probability of an indentation intersecting multiple reinforcement-rich regions increased within this composition interval. The accompanying increase in absolute standard deviation is also consistent with localized sampling of matrix-rich, particle-rich, and interfacial regions.
Direct ranking against other PMMA fillers must remain protocol-specific because the curing route, specimen geometry, load, dwell time, surface finish, and hardness scale differ across studies. Nevertheless, the literature on ceramic-filled PMMA shows that ZrO2 and TiO2 can increase hardness and modify wear, while optical changes may accompany the mechanical benefits [47,48,49]. The present result therefore demonstrates a strong surface-hardening response under the stated HV0.03 protocol, not universal superiority across all denture-base requirements.
4.3. Wear Suppression and Friction Stabilization
The simultaneous decrease in cumulative mass loss, endpoint mass loss, mean COF, steady-state COF, and frictional variation indicates that c-BN affected both damage accumulation and interfacial stability. The negative D × C coefficient is physically meaningful because it shows that each increase in c-BN content reduces the rate of mass-loss accumulation with distance. This response is consistent with lower counterface penetration, a smaller deformable-polymer contribution to the real contact area, and reduced plowing and adhesive-junction growth. c-BN is not interpreted as a solid lubricant; the friction reduction is attributed to mechanical stabilization of the contact [50,51,52].
Post-wear morphology supports this interpretation. The control track contained extensive smearing, grooves, debris, and detached regions, whereas reinforcement produced progressively milder damage. Retained c-BN domains can support load and interrupt polymer-dominated material removal. Conversely, locally released hard particles could act as third-body abrasives. The monotonic reduction in mass loss and COF through 5 wt.% indicates that retained-particle reinforcement dominated over any adverse third-body contribution within the tested range. Further increases in filler content should not be assumed to remain beneficial because agglomeration and pull-out can reverse the trend [53,54,55,56].
4.4. Relation of the Dry-Sliding Test to Oral Service
The ball-on-disk experiment is an engineering-tribology screening test rather than a direct simulation of denture function. The 316L steel counterface, dry interface, constant normal load, constant sliding speed, and long unidirectional distance create a reproducible and deliberately severe baseline for comparing formulations. Intraoral service instead involves saliva and proteins, intermittent and multidirectional contact, temperature and pH fluctuations, food-particle abrasion, denture cleaning, contact with mucosa or opposing enamel/ceramic/composite surfaces, and time-dependent water uptake. These factors can modify adhesion, debris transport, transfer-layer formation, and friction. The present ranking therefore identifies the intrinsic response under one controlled contact condition and must be validated with simulated saliva, thermal cycling, cleaning abrasion, and clinically relevant counterfaces before clinical translation.
4.5. Esthetic Relevance, Scope, and Further Qualification
The raw PMMA powder was pink and the c-BN powder was black; consequently, the specimens darkened progressively with reinforcement, as visible in Figure 2. Because color match and translucency are important for visible denture-base regions, the 3 and 5 wt.% formulations cannot be considered esthetically acceptable on the basis of the present mechanical data. Spectrophotometric color difference (ΔE00), translucency parameters, color stability after water/cleanser aging, and patient-relevant visual thresholds are required. Lower c-BN fractions or use in non-visible functional zones may prove more practical, but these possibilities require dedicated optical assessment [49].
Additional limitations define the current scope. XRD, ATR-FTIR, and SEM/EDS were descriptive evaluations of one representative specimen per group; quantitative phase fraction, multi-field dispersion statistics, elemental mapping, and fracture-surface/TEM interface analysis were not performed. Surface roughness was controlled through a common finishing protocol but was not measured by profilometry. Degree of conversion, residual monomer, flexural strength/modulus, impact resistance, fatigue, water sorption/solubility, biofilm adhesion, cytocompatibility, and ion/particle release were outside the experimental design. These measurements are necessary before the material can be qualified as a complete denture-base formulation.
The statistical models should be interpreted with the same restraint. Four composition levels are sufficient to quantify the strong monotonic trends observed here, but they do not establish general prediction beyond 0–5 wt.% c-BN. The high internal fit values partly reflect the structured composition-dependent dataset and repeated measurements. Future models should use independent batches, additional filler levels, grouped composition-wise validation, quantitative roughness and dispersion descriptors, and wet/aged tribological outcomes.
5. Conclusions
Within the investigated 0–5 wt.% c-BN range, reinforcement preserved the dominant PMMA XRD and ATR-FTIR response while producing progressively stronger surface hardening and dry-sliding wear suppression. PMMA-5cBN reached 45.00 ± 1.61 HV0.03, a 125.0% increase over PMMA, and reduced final mass loss from 32.4 to 9.8 mg and overall COF from 0.58 to 0.28. The negative distance × composition interaction and the post-wear morphology show that c-BN reduced the rate and severity of polymer removal throughout sliding. These conclusions apply to the controlled dry 316L ball-on-disk screening configuration. Optical acceptability, saliva-mediated wear, clinically relevant counterfaces, bulk mechanical performance, aging, and biological safety must be established before clinical use; the progressive darkening caused by black c-BN is a particularly important translational constraint.
Author Contributions
Conceptualization, A.S., E.F.H. and C.K.M.; methodology, A.S., E.F.H., C.K.M. and S.T.; investigation and specimen preparation, A.S., E.F.H., S.T. and U.U.U.; microstructural/elemental characterization, C.K.M., S.T. and U.U.U.; mechanical and tribological testing, C.K.M. and U.U.U.; statistical analysis and composition-window modeling, C.K.M.; prosthodontic interpretation, A.S. and E.F.H.; biomedical-safety and translational interpretation, validation, and critical manuscript review, F.O.; writing—original draft preparation, A.S., E.F.H. and C.K.M.; writing—review and editing, all authors; visualization, C.K.M.; supervision, A.S., E.F.H. and C.K.M.; project administration, A.S. and S.T.; funding acquisition, A.S. and C.K.M. All authors have read and agreed to the published version of the manuscript.
Funding
This research was funded by the Fırat University Scientific Research Projects Coordination Unit (FUBAP), project number DHF.26.05.
Institutional Review Board Statement
Not applicable. This in vitro materials study did not involve human participants, human tissues, animals, or clinical intervention.
Informed Consent Statement
Not applicable.
Data Availability Statement
The experimental data, characterization results, tribological measurements, and analysis outputs are available from the corresponding author upon reasonable request.
Acknowledgments
The authors acknowledge the institutional and technical support provided by Fırat University during specimen preparation, characterization, mechanical testing, tribological evaluation, and data analysis.
Conflicts of Interest
The authors declare no conflicts of interest.
References
- Zafar, M.S. Prosthodontic applications of polymethyl methacrylate (PMMA): An update. Polymers 2020, 12, 2299. [Google Scholar] [CrossRef] [Scilit] [PubMed]
- Gad, M.M.; Fouda, S.M.; Al-Harbi, F.A.; Näpänkangas, R.; Raustia, A. PMMA denture base material enhancement: A review of fiber, filler, and nanofiller addition. Int. J. Nanomed. 2017, 12, 3801–3812. [Google Scholar] [CrossRef] [Scilit] [PubMed]
- Nejatian, T.; Nathwani, N.; Taylor, L.; Sefat, F. Denture base composites: Effect of surface-modified nano- and micro-particulates on mechanical properties of polymethyl methacrylate. Materials 2020, 13, 307. [Google Scholar] [CrossRef] [Scilit] [PubMed]
- Alhotan, A.; Yates, J.; Zidan, S.; Haider, J.; Silikas, N. Flexural strength and hardness of filler-reinforced PMMA targeted for denture base application. Materials 2021, 14, 2659. [Google Scholar] [CrossRef] [Scilit] [PubMed]
- Vojdani, M.; Bagheri, R.; Khaledi, A.A.R. Effects of aluminum oxide addition on the flexural strength, surface hardness, and roughness of heat-polymerized acrylic resin. J. Dent. Sci. 2012, 7, 238–244. [Google Scholar] [CrossRef] [Scilit]
- Alqahtani, M. Effect of hexagonal boron nitride nanopowder reinforcement and mixing methods on physical and mechanical properties of self-cured PMMA for dental applications. Materials 2020, 13, 2323. [Google Scholar] [CrossRef] [Scilit] [PubMed]
- Alqahtani, M. Mechanical properties enhancement of self-cured PMMA reinforced with zirconia and boron nitride nanopowders for high-performance dental materials. J. Mech. Behav. Biomed. Mater. 2020, 110, 103937. [Google Scholar] [CrossRef] [Scilit] [PubMed]
- Li, M.; Wang, S.; Li, R.; Wang, Y.; Fan, X.; Gong, W.; Ma, Y. The mechanical and antibacterial properties of boron nitride/silver nanocomposite enhanced polymethyl methacrylate resin for application in oral denture bases. Biomimetics 2022, 7, 138. [Google Scholar] [CrossRef] [Scilit] [PubMed]
- Nageib, F.Y.; Fouad, R.A.; El-Sayed Seleman, M.M. A study on the influence of nano-c-BN on the physical and mechanical characteristics of PMMA biocomposites used in dental prosthetics. J. Thermoplast. Compos. Mater. 2026, 39, 532–554. [Google Scholar] [CrossRef] [Scilit]
- Akinci, A.; Sen, S.; Sen, U. Friction and wear behavior of zirconium oxide reinforced PMMA composites. Compos. Part B Eng. 2014, 56, 42–47. [Google Scholar] [CrossRef] [Scilit]
- Patel, V.; Joshi, U.; Joshi, A.; Matanda, B.K.; Chauhan, K.; Oza, A.D.; Burduhos-Nergis, D.P.; Burduhos-Nergis, D.D. Multi-walled carbon-nanotube-reinforced PMMA nanocomposites: An experimental study of their friction and wear properties. Polymers 2023, 15, 2785. [Google Scholar] [CrossRef] [Scilit] [PubMed]
- Fouly, A.; Alnaser, I.A.; Assaifan, A.K.; Abdo, H.S. Effect of low hydroxyapatite loading fraction on the mechanical and tribological characteristics of poly(methyl methacrylate) nanocomposites for dentures. Polymers 2021, 13, 857. [Google Scholar] [CrossRef] [Scilit] [PubMed]
- Gu, D.; Zhang, L.; Chen, S.; Song, K.; Liu, S. Significant reduction of the friction and wear of PMMA based composite by filling with PTFE. Polymers 2018, 10, 966. [Google Scholar] [CrossRef] [Scilit] [PubMed]
- Abdo, M.S.; Shar, M.A.; Fouly, A.; Dar, M.A.A.; Abdo, H.S. Experimental investigation on the tribo-mechanical behavior of PMMA reinforced by solid lubricant filler for dental implant applications. AIP Adv. 2024, 14, 095210. [Google Scholar] [CrossRef] [Scilit]
- Mirkarimi, P.B.; McCarty, K.F.; Medlin, D.L. Review of advances in cubic boron nitride film synthesis. Mater. Sci. Eng. R Rep. 1997, 21, 47–100. [Google Scholar] [CrossRef] [Scilit]
- Tian, Y.; Xu, B.; Yu, D.; Ma, Y.; Wang, Y.; Jiang, Y.; Hu, W.; Tang, C.; Gao, Y.; Luo, K.; et al. Ultrahard nanotwinned cubic boron nitride. Nature 2013, 493, 385–388. [Google Scholar] [CrossRef] [Scilit] [PubMed]
- Solozhenko, V.L.; Chernyshev, V.V.; Fetisov, G.V.; Rybakov, V.B.; Petrusha, I.A. Structure analysis of the cubic boron nitride crystals. J. Phys. Chem. Solids 1990, 51, 1011–1012. [Google Scholar] [CrossRef] [Scilit]
- Huang, Z.; Zhao, W.; Zhao, W.; Ci, X.; Li, W. Tribological and anti-corrosion performance of epoxy resin composite coatings reinforced with differently sized cubic boron nitride particles. Friction 2021, 9, 104–118. [Google Scholar] [CrossRef] [Scilit]
- Uzay, Ç. Effects of cubic boron nitride nanoparticle addition on the wear properties of carbon-fiber-reinforced polymer composites. Mater. Test. 2023, 65, 43–51. [Google Scholar] [CrossRef] [Scilit]
- Uzay, Ç. Studies on mechanical and thermal properties of cubic boron nitride nanoparticle-filled carbon-fiber-reinforced polymer composites. Polym.-Plast. Technol. Mater. 2022, 61, 1439–1455. [Google Scholar] [CrossRef] [Scilit]
- Hıdır, E.F.; Sincar, A.; Macit, C.K.; Tekin, S.; Uçar, U.U. Hard-particle surface stabilization and data-driven wear prediction in TiB2-reinforced heat-polymerized PMMA denture base composites. Crystals 2026, 16, 494. [Google Scholar] [CrossRef] [Scilit]
- Polychronakis, N.; Dimitriadi, M.; Ioannidis, A.; Papadopoulos, T. The effect of different cooling procedures on mechanical properties of denture base materials measured by instrumented indentation testing. J. Prosthodont. Res. 2020, 64, 326–331. [Google Scholar] [CrossRef] [Scilit] [PubMed]
- Kuhar, M.; Funduk, N. Effects of polishing techniques on the surface roughness of acrylic denture base resins. J. Prosthet. Dent. 2005, 93, 76–85. [Google Scholar] [CrossRef] [Scilit] [PubMed]
- Berger, J.C.; Driscoll, C.F.; Romberg, E.; Luo, Q.; Thompson, G. Surface roughness of denture base acrylic resins after processing and after polishing. J. Prosthodont. 2006, 15, 180–186. [Google Scholar] [CrossRef] [Scilit] [PubMed]
- Takahashi, Y.; Hamanaka, I.; Shimizu, H. Flexural properties of denture base resins subjected to long-term water immersion. Acta Odontol. Scand. 2013, 71, 716–720. [Google Scholar] [CrossRef] [Scilit] [PubMed]
- ASTM E384-22; Standard Test Method for Microindentation Hardness of Materials. ASTM International: West Conshohocken, PA, USA, 2022.
- ASTM G99-23; Standard Test Method for Wear Testing with a Pin-on-Disk Apparatus. ASTM International: West Conshohocken, PA, USA, 2023.
- Willis, H.A.; Zichy, V.J.I.; Hendra, P.J. The laser-Raman and infra-red spectra of poly(methyl methacrylate). Polymer 1969, 10, 737–746. [Google Scholar] [CrossRef] [Scilit]
- Dirlikov, S.; Koenig, J.L. Infrared spectra of poly(methyl methacrylate) labeled with oxygen-18. Appl. Spectrosc. 1979, 33, 551–555. [Google Scholar] [CrossRef] [Scilit]
- Dirlikov, S.K.; Koenig, J.L. Assignment of the carbon-hydrogen stretching and bending vibrations of poly(methyl methacrylate) by selective deuteration. Appl. Spectrosc. 1979, 33, 555–561. [Google Scholar] [CrossRef] [Scilit]
- Gielisse, P.J.; Mitra, S.S.; Plendl, J.N.; Griffis, R.D.; Mansur, L.C.; Marshall, R.; Pascoe, E.A. Lattice infrared spectra of boron nitride and boron monophosphide. Phys. Rev. 1967, 155, 1039–1046. [Google Scholar] [CrossRef] [Scilit]
- Newbury, D.E.; Ritchie, N.W.M. Performing elemental microanalysis with high accuracy and high precision by SEM/SDD-EDS. J. Mater. Sci. 2015, 50, 493–518. [Google Scholar] [CrossRef] [Scilit] [PubMed]
- Shapiro, S.S.; Wilk, M.B. An analysis of variance test for normality: Complete samples. Biometrika 1965, 52, 591–611. [Google Scholar] [CrossRef] [Scilit]
- Gastwirth, J.L.; Gel, Y.R.; Miao, W. The impact of Levene’s test of equality of variances on statistical theory and practice. Stat. Sci. 2009, 24, 343–360. [Google Scholar] [CrossRef] [Scilit]
- Tukey, J.W. Comparing individual means in the analysis of variance. Biometrics 1949, 5, 99–114. [Google Scholar] [CrossRef] [Scilit]
- Lakens, D. Calculating and reporting effect sizes to facilitate cumulative science: A practical primer for t-tests and ANOVAs. Front. Psychol. 2013, 4, 863. [Google Scholar] [CrossRef] [Scilit] [PubMed]
- Chicco, D.; Warrens, M.J.; Jurman, G. The coefficient of determination R-squared is more informative than SMAPE, MAE, MAPE, MSE and RMSE in regression analysis evaluation. PeerJ Comput. Sci. 2021, 7, e623. [Google Scholar] [CrossRef] [Scilit] [PubMed]
- Chai, T.; Draxler, R.R. Root mean square error or mean absolute error? Arguments against avoiding RMSE in the literature. Geosci. Model Dev. 2014, 7, 1247–1250. [Google Scholar] [CrossRef] [Scilit]
- Cortes, C.; Vapnik, V. Support-vector networks. Mach. Learn. 1995, 20, 273–297. [Google Scholar] [CrossRef] [Scilit]
- Breiman, L. Random forests. Mach. Learn. 2001, 45, 5–32. [Google Scholar] [CrossRef] [Scilit]
- Geurts, P.; Ernst, D.; Wehenkel, L. Extremely randomized trees. Mach. Learn. 2006, 63, 3–42. [Google Scholar] [CrossRef] [Scilit]
- Freund, Y.; Schapire, R.E. A decision-theoretic generalization of on-line learning and an application to boosting. J. Comput. Syst. Sci. 1997, 55, 119–139. [Google Scholar] [CrossRef] [Scilit]
- Friedman, J.H. Greedy function approximation: A gradient boosting machine. Ann. Stat. 2001, 29, 1189–1232. [Google Scholar] [CrossRef] [Scilit]
- Rumelhart, D.E.; Hinton, G.E.; Williams, R.J. Learning representations by back-propagating errors. Nature 1986, 323, 533–536. [Google Scholar] [CrossRef] [Scilit]
- Sacks, J.; Welch, W.J.; Mitchell, T.J.; Wynn, H.P. Design and analysis of computer experiments. Stat. Sci. 1989, 4, 409–423. [Google Scholar] [CrossRef] [Scilit]
- Ramprasad, R.; Batra, R.; Pilania, G.; Mannodi-Kanakkithodi, A.; Kim, C. Machine learning in materials informatics: Recent applications and prospects. npj Comput. Mater. 2017, 3, 54. [Google Scholar] [CrossRef] [Scilit]
- El-Tamimi, K.M.; Bayoumi, D.A.; Ahmed, M.M.Z.; Albaijan, I.; El-Sayed, M.E. The effect of salinized nano-ZrO2 particles on the microstructure, hardness, and wear behavior of acrylic denture tooth nanocomposite. Polymers 2022, 14, 302. [Google Scholar] [CrossRef] [Scilit] [PubMed]
- Naji, S.A.; Behroozibakhsh, M.; Jafarzadeh Kashi, T.S.; Eslami, H.; Masaeli, R.; Mahgoli, H.; Tahriri, M.; Ghavvami Lahiji, M.; Rakhshan, V. Effects of incorporation of 2.5 and 5 wt.% TiO2 nanotubes on fracture toughness, flexural strength, and microhardness of denture base PMMA. J. Adv. Prosthodont. 2018, 10, 113–121. [Google Scholar] [CrossRef] [Scilit] [PubMed]
- Altaie, S.F. Tribological, microhardness and color stability properties of a heat-cured acrylic resin denture base after reinforcement with different nanofiller particles. Dent. Med. Probl. 2023, 60, 295–302. [Google Scholar] [CrossRef] [Scilit] [PubMed]
- Friedrich, K.; Zhang, Z.; Schlarb, A.K. Effects of various fillers on the sliding wear of polymer composites. Compos. Sci. Technol. 2005, 65, 2329–2343. [Google Scholar] [CrossRef] [Scilit]
- Briscoe, B.J.; Sinha, S.K. Wear of polymers. Proc. Inst. Mech. Eng. Part J. J. Eng. Tribol. 2002, 216, 401–413. [Google Scholar] [CrossRef] [Scilit]
- Myshkin, N.K.; Petrokovets, M.I.; Kovalev, A.V. Tribology of polymers: Adhesion, friction, wear, and mass-transfer. Tribol. Int. 2005, 38, 910–921. [Google Scholar] [CrossRef] [Scilit]
- Bahadur, S. The development of transfer layers and their role in polymer tribology. Wear 2000, 245, 92–99. [Google Scholar] [CrossRef] [Scilit]
- Hooke, C.J.; Kukureka, S.N.; Liao, P.; Rao, M.; Chen, Y.K. The friction and wear of polymers in non-conformal contacts. Wear 1996, 200, 83–94. [Google Scholar] [CrossRef] [Scilit]
- Lancaster, J.K. Abrasive wear of polymers. Wear 1969, 14, 223–239. [Google Scholar] [CrossRef] [Scilit]
- Benabdallah, S.H. The running-in and steady-state coefficient of friction of some engineering thermoplastics. Polym. Eng. Sci. 1993, 33, 70–74. [Google Scholar] [CrossRef] [Scilit]

Disclaimer/Publisher’s Note: The statements, opinions and data contained in all publications are solely those of the individual author(s) and contributor(s) and not of MDPI and/or the editor(s). MDPI and/or the editor(s) disclaim responsibility for any injury to people or property resulting from any ideas, methods, instructions or products referred to in the content. |
© 2026 by the authors. Licensee MDPI, Basel, Switzerland. This article is an open access article distributed under the terms and conditions of the Creative Commons Attribution (CC BY) license.