


Abstract
In the failure analysis of metallic materials, the observation of fracture-surface morphology by scanning electron microscopy (SEM) is an important means of determining the fracture mechanisms. In practice, however, interpretation of fracture-surface images relies heavily on expert experience and is readily affected by subjective factors when large batches of images must be examined. To address this issue, this paper proposes a classification model based on You Only Look Once version 8 (YOLOv8) and the convolutional block attention module (CBAM) for SEM images of metal fracture surfaces, aiming to identify four typical fracture-surface categories: cleavage, fatigue, dimple, and intergranular fracture. Considering that SEM images are mostly grayscale texture images, the model emphasizes the preservation of brightness, local texture, and edge-contour information during input processing and training augmentation, and introduces CBAM to optimize the channel and spatial responses of feature maps. Experimental results showed that at an input resolution of 1024, the YOLOv8-CBAM model achieved a Top-1 accuracy of 97.92% with only 1.53 M parameters. The proposed model achieved a favorable balance between observed classification performance and model complexity compared with the evaluated convolutional neural network (CNN) baselines. In addition, the gradient-weighted class activation mapping (Grad-CAM) results showed correspondence between the high-response regions of the model and certain fracture-surface morphology regions.
1. Introduction
Metallic materials may be subjected to tensile loading, bending, impact, fatigue, corrosion, high temperature, or coupled multi-factor effects during service, ultimately resulting in fracture failure [1]. Fracture-surface morphology is direct evidence left on the material surface by the fracture process and can reflect information such as crack initiation sites, propagation paths, loading modes, and material microstructural state [2]. Therefore, fractographic analysis has long been a key technical approach in material failure analysis, the reliability assessment of engineering components, and tracing the causes of accidents [3].
Scanning electron microscopy provides high resolution, large depth of field, and strong capability for surface-morphology characterization, enabling the observation of fine fracture features that are difficult to resolve by optical microscopy [4]. In metal fractography, SEM images are commonly used to identify cleavage river patterns, dimples and tear ridges, fatigue striations, and intergranular grain contours [5]. These morphological features have clear materials-science significance and provide learnable discriminative cues for image classification models [6].
However, interpretation of real fracture-surface images is far from as straightforward as recognizing a single pattern. Actual fracture surfaces often contain morphological features at multiple scales and in different regions, and some features are mutually similar [7]. For example, grain-boundary cracking in intergranular fractures may resemble secondary cracks in fatigue fractures, while quasi-cleavage regions may simultaneously contain cleavage steps and local dimples [8]. Experts therefore usually need to combine multiple fields of view with the overall morphology in the images to make a comprehensive judgment. When the number of images is large, or repeated screening of the same batch of samples is required, manual interpretation is easily affected by differences in experience, selection of regions of interest, and fatigue, making it difficult to balance efficiency and consistency.
These bottlenecks provide an opportunity for the application of deep learning. Compared with traditional methods that rely on manually designed texture descriptors or empirical criteria, convolutional neural networks can hierarchically learn edges, textures, morphological structures, and their combined features directly from raw images, and can establish the mapping between image features and material categories through end-to-end training [9,10,11]. In recent years, deep learning and machine learning methods have gradually been applied to materials microstructure analysis and have achieved favorable results in tasks such as steel microstructure classification, microscopic texture characterization, and microstructure recognition. For example, Azimi et al. used deep learning to classify steel microstructures and verified the effectiveness of convolutional features in recognizing complex microstructural morphologies [12]; DeCost et al. analyzed ultrahigh-carbon steel microstructures using image texture representations, showing that local texture information in microscopic images can be used to characterize different microstructural states [13]; and Chowdhury et al. studied image-driven machine learning methods for microstructure recognition, demonstrating that data-driven models can extract morphology features with classification significance from material images [14]. In addition, related studies and reviews further indicate that machine learning has been used for material microstructure characterization, reconstruction, and property analysis, and is gradually becoming an important tool for the quantitative analysis of material images [15].
Although previous studies have demonstrated the potential of deep learning in microstructure recognition, directly applying it to SEM fracture-surface image classification still faces several difficulties [16]. First, SEM fracture-surface images are usually grayscale images and lack the color information and complete object contours commonly found in natural images; inter-class differences mainly appear in fine-grained features such as the orientation of fatigue striations, continuity of grain boundaries, dimple edges, cleavage steps, and local crack morphology [17]. Second, similar local structures may appear among different fracture mechanisms, while fracture surfaces of the same class may be affected by material state, magnification, and imaging conditions, leading to large intra-class variation and indistinct inter-class boundaries. Third, non-fractographic information such as scale bars, text, black borders, noise, and brightness variation may become shortcuts that the model can exploit, causing it to learn overall grayscale distributions or image edges rather than local morphology related to fracture mechanisms. For SEM datasets with limited sample sizes, these issues may further increase the risk of overfitting and insufficient cross-device generalization. Therefore, SEM fracture-surface image recognition requires not only strong fine-grained feature extraction capability, but also targeted design in input processing, local-region attention, and model interpretability.
Accordingly, this study focuses on image-level preliminary screening of representative SEM fracture-surface images rather than the comprehensive determination of fracture mechanisms in heterogeneous fracture surfaces. Specifically, the proposed method aims to address three practical issues: interference from non-fractographic image information, subtle and localized morphological differences among fracture categories, and the need for a lightweight model for efficient batch screening. The overall research approach comprised the following three aspects.
First, a four-class dataset of metal fracture-surface SEM images was constructed, with images divided into cleavage, fatigue, dimple, and intergranular fracture classes. Considering that SEM images mainly derive information from grayscale texture, weak-contrast structures, and edge contours, targeted processing was applied to the input images to reduce the influence of non-fractographic factors such as scale bars, borders, noise, and brightness differences.
Second, the YOLOv8 classification branch was selected as the base model. The task in this paper was the classification of whole fracture-surface images and did not involve bounding-box annotation or local-region localization; after passing through the classification network, each input image directly outputs the probabilities of the four fracture-surface classes. On this basis, the convolutional block attention module (CBAM) was introduced into the middle- and high-level feature stages of the YOLOv8 classification network [18]. CBAM reweights feature responses through channel attention and spatial attention, thereby enhancing the representation of local morphologies such as fatigue striations, grain-boundary contours, dimple edges, and cleavage steps in middle- and high-level features, while retaining the lightweight characteristics of the model.
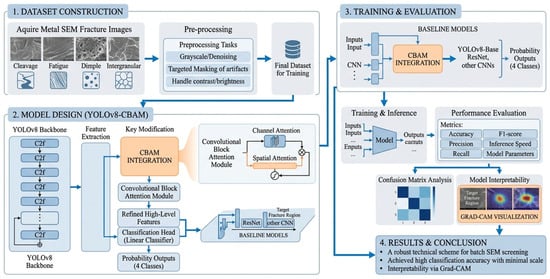
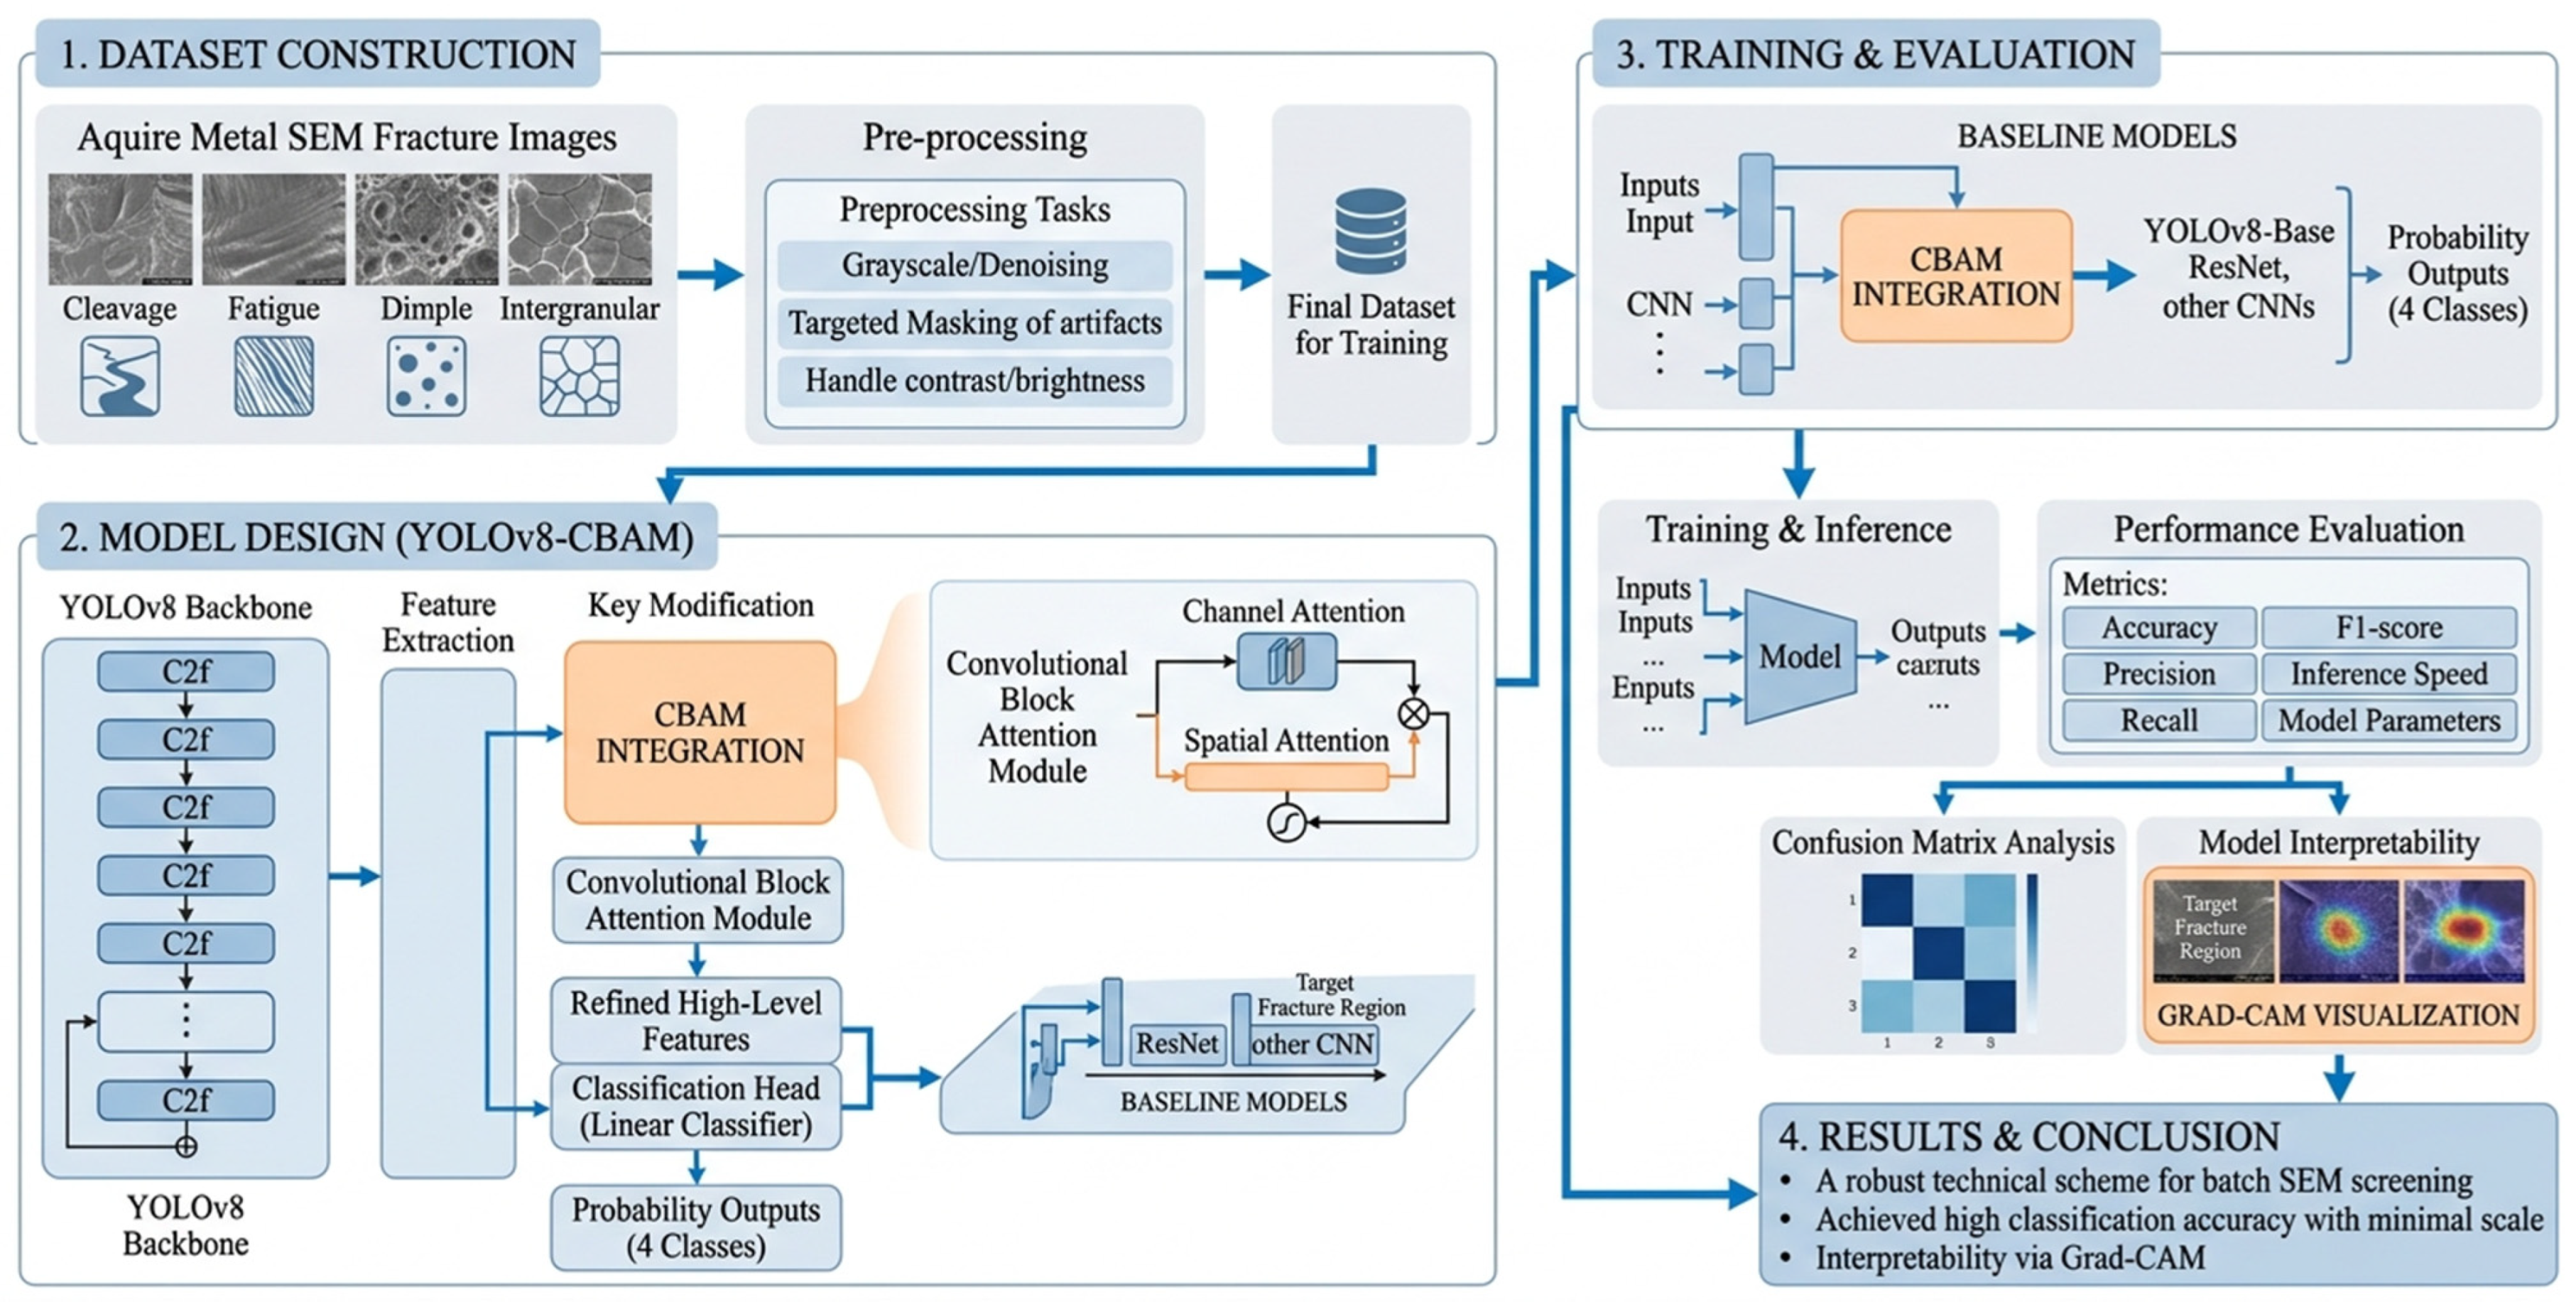
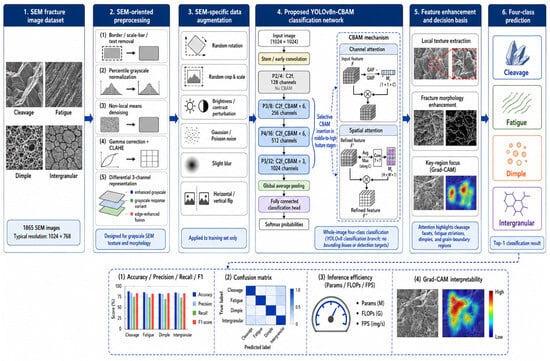
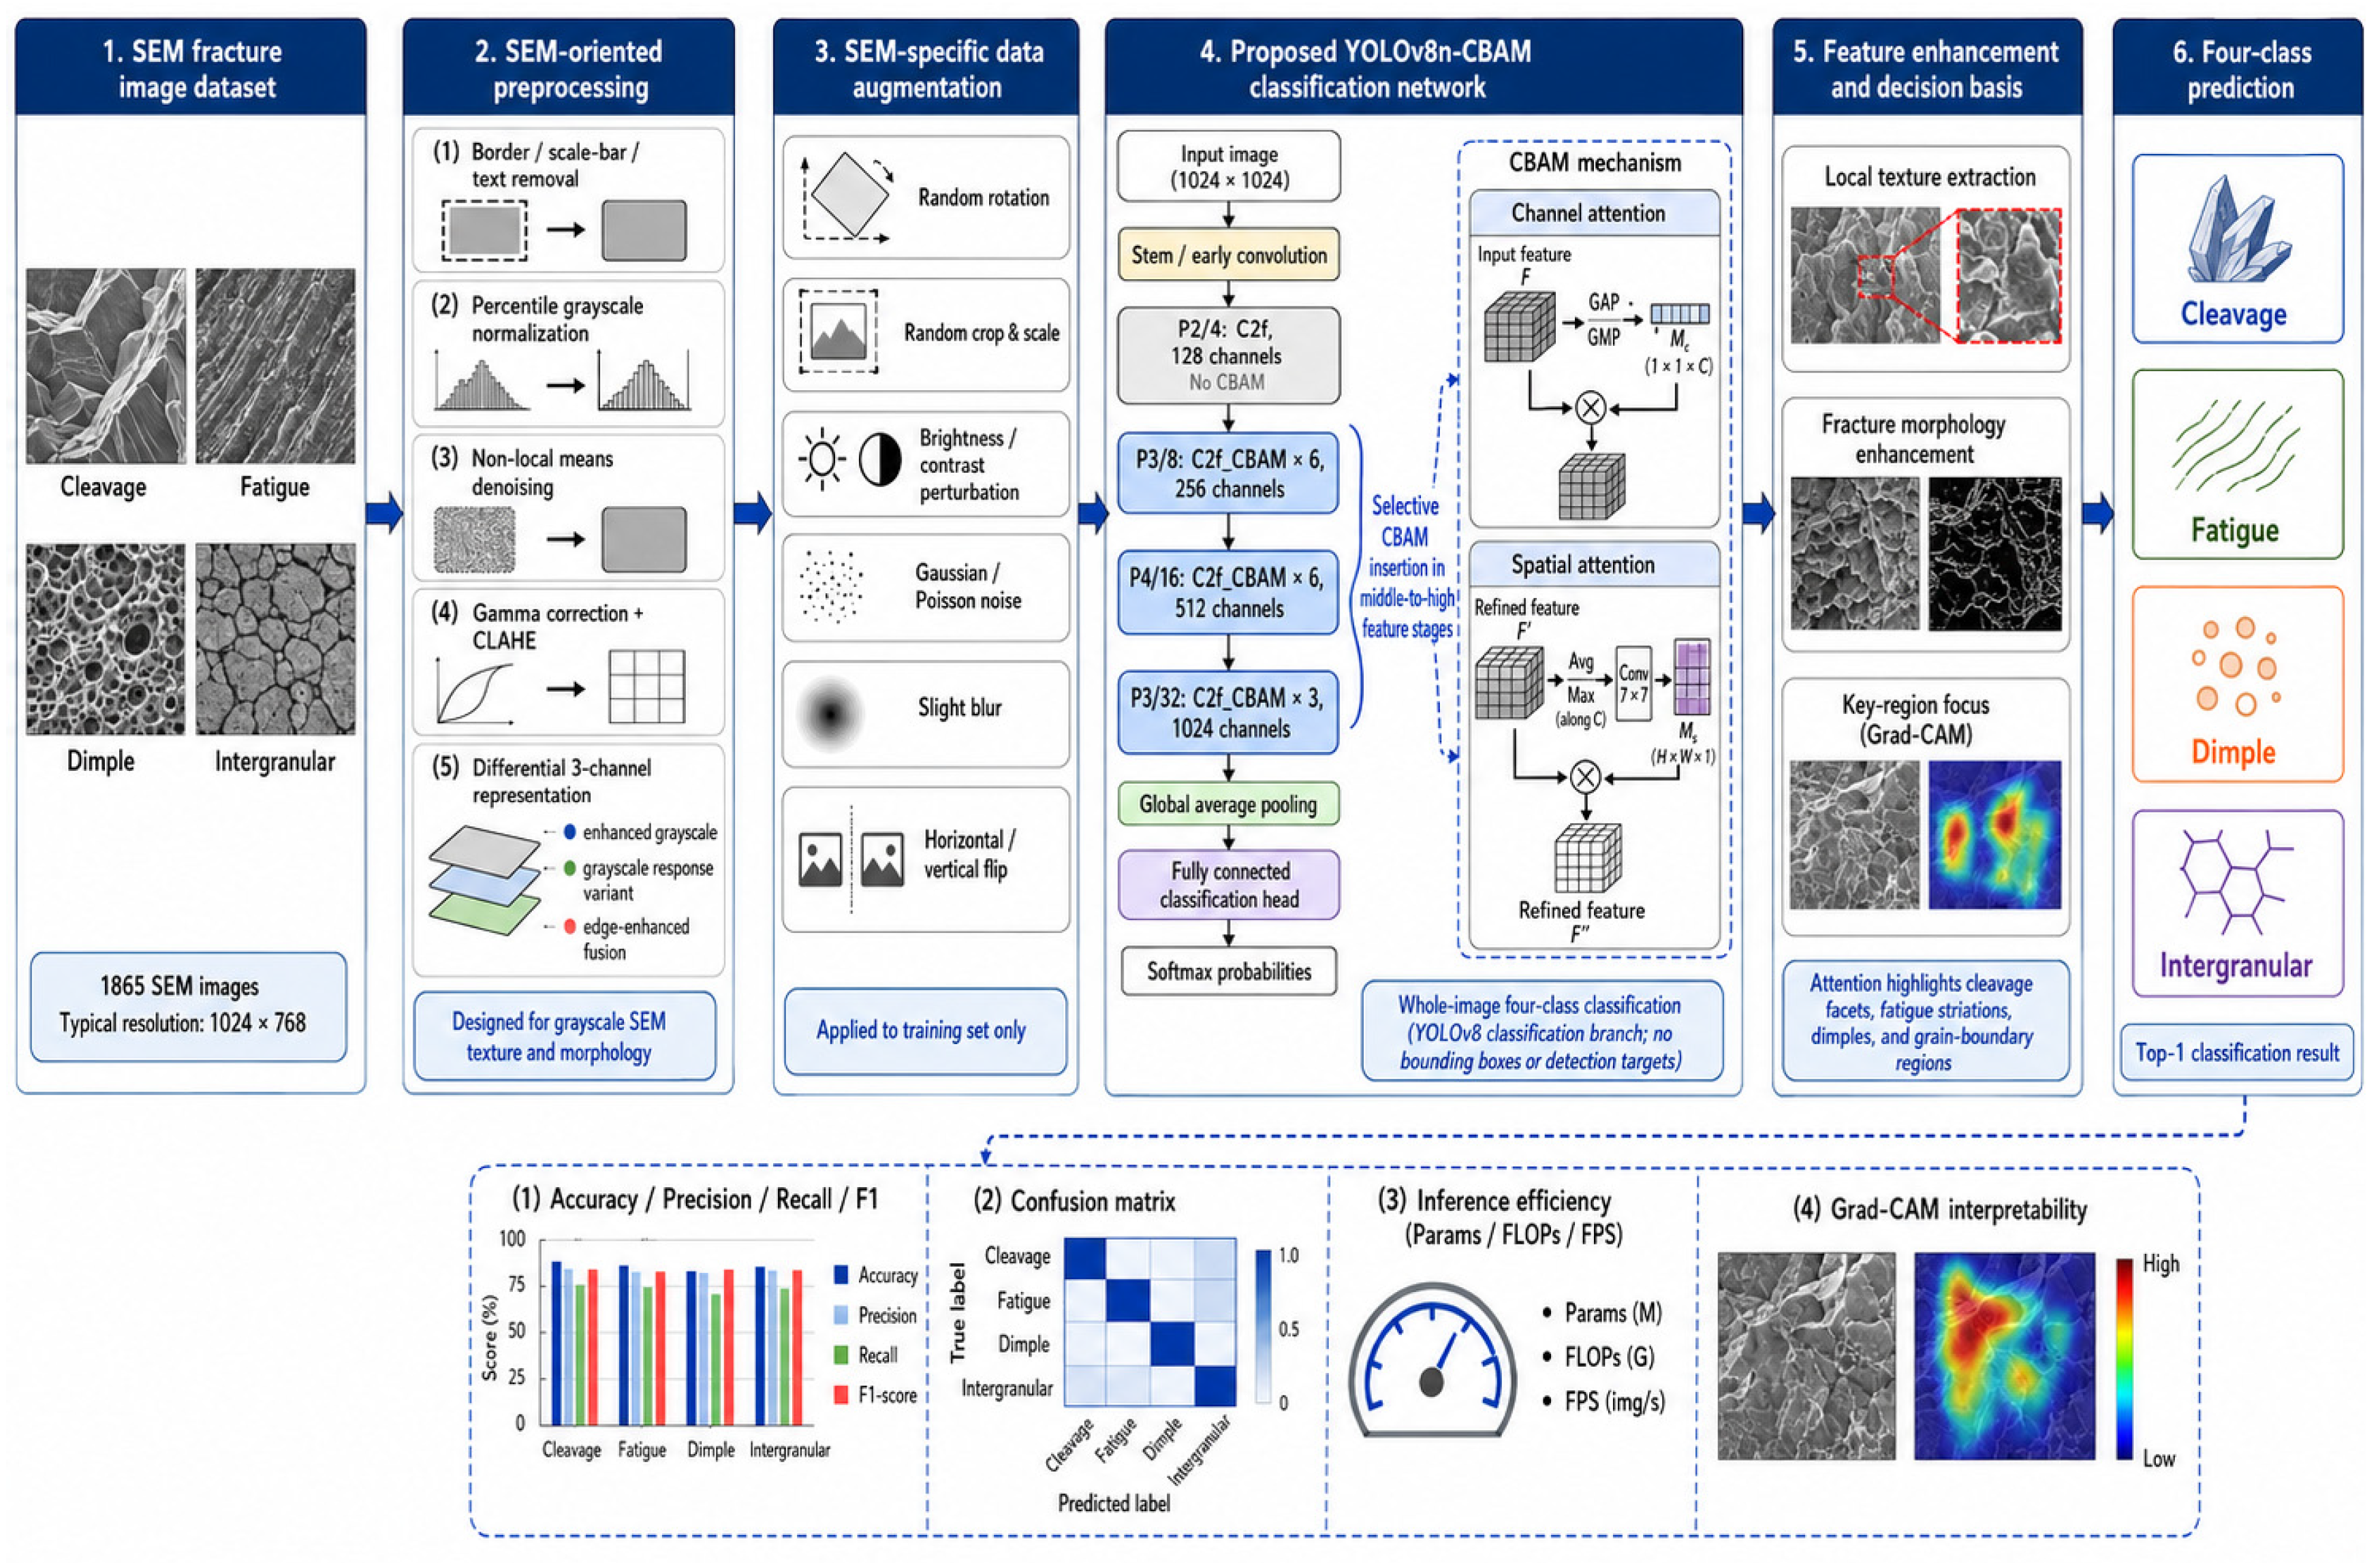
Finally, comparative experiments involving YOLO-series models, different attention modules, ResNet, and ImageNet-pretrained CNNs were conducted to evaluate the constructed model in terms of classification performance, number of model parameters, and inference efficiency. The classification behavior and attended regions were further analyzed using confusion matrices and Grad-CAM. This study aims to provide a technical solution for batch screening and assisted interpretation of SEM fracture-surface images that balances recognition accuracy, model size, and engineering deployment requirements. The performance demonstrated in this study is limited to the present dataset and experimental conditions, and no claim is made regarding robustness to substantially different imaging conditions, SEM devices, or material batches without further external validation. The overall architecture is shown in Figure 1.
Figure 1.
Experimental research workflow for metallic fracture SEM image classification via YOLOv8-CBAM.
2. Materials and Methods
2.1. Dataset and SEM Fracture Categories
Key equipment in nuclear power plants serve in long-term, complex operating environments. Load-bearing and connecting components such as valve stems, bolts, and flange joints are prone to fracture failure under the combined action of alternating stress, corrosive media, and material aging. These parts are made of various carbon and alloy steels, and their micro-fracture morphologies carry critical information for revealing material failure mechanisms.
All fracture specimens in this dataset were retrieved from real-world failed nuclear-power components (valve stems, bolts, flange joints and other metallic parts), mainly including carbon steels, 304 stainless steel, 316L stainless steel, and other ferrous alloys. The fractures formed naturally during long-term service under high-temperature and high-pressure water environments, rather than being artificially generated via laboratory tests. Prior to SEM observation, specimens were only ultrasonically cleaned to remove surface contaminants without destructive mechanical reprocessing that would alter the native fracture morphology. Imaging was conducted on a ZEISS Sigma 300 field-emission scanning electron microscope (Carl Zeiss Microscopy GmbH, Oberkochen, Baden-Württemberg, Germany) using secondary-electron mode at an accelerating voltage of 20 kV, with a working distance of 8–20 mm and magnification ranging from 20× to 5000×. Most training-set images were captured at 500× magnification or higher; for delicate features such as fatigue striations, images obtained at ≥1000× were preferentially selected to guarantee distinguishable micro-morphology.
The dataset contained 475 independent fracture specimens. Approximately 3–4 representative fields of view were acquired for each sample, averaging 3.9 SEM images per specimen. To eliminate information leakage caused by highly correlated images, the dataset was partitioned at the specimen level: 373 specimens for training, 70 for validation, and 32 for testing. All images collected from one specimen were assigned exclusively to a single subset, so micrographs from adjacent regions or different magnifications of the same sample would never be split across the training, validation, and test sets. Experienced fractographic analysts selected representative fields of view to reduce adverse effects from inappropriate viewing angles. Nevertheless, the dataset was not acquired with a standardized multi-angle or specimen-tilting scheme, and the quantitative influence of surface orientation on model performance remains unevaluated. Since the data were retrospectively compiled from practical failure cases with complicated service histories, complete operating-condition and metallurgical records were not available for every specimen.
Image screening and labeling were completed independently by two fractography experts with over 10 years of experience, following classical fractographic atlases and standard morphological criteria. High-quality micrographs with typical fracture features and minimal contamination or imaging artifacts were retained. Disagreements on annotations were reconciled through cross-checking, and samples were finally categorized into four fracture types: cleavage fracture, fatigue fracture, dimple fracture and intergranular fracture. This dataset supports whole-image single-label classification instead of pixel- or region-wise segmentation for mixed-morphology fractures. The model predicts the dominant fracture mechanism within one SEM field of view and cannot quantify the area fraction of multiple co-existing fracture modes. Only images with a clearly predominant fracture morphology were preserved; samples with severely mixed features without a dominant category were excluded. After data cleaning, 1865 qualified images were obtained (Table 1): 500 cleavage-fracture, 384 fatigue-fracture, 475 dimple-fracture, and 506 intergranular-fracture samples, accounting for 26.81%, 20.59%, 25.47% and 27.13%, respectively. The relatively balanced category distribution effectively mitigates training bias from data imbalance. The grayscale micrographs have a typical resolution of 1024 × 768 pixels.
Table 1.
Dataset distribution of SEM fracture images.
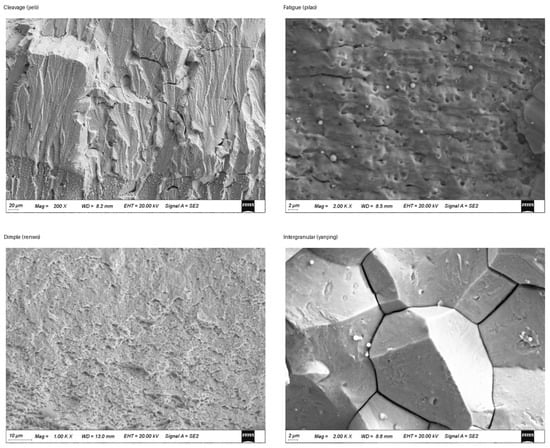
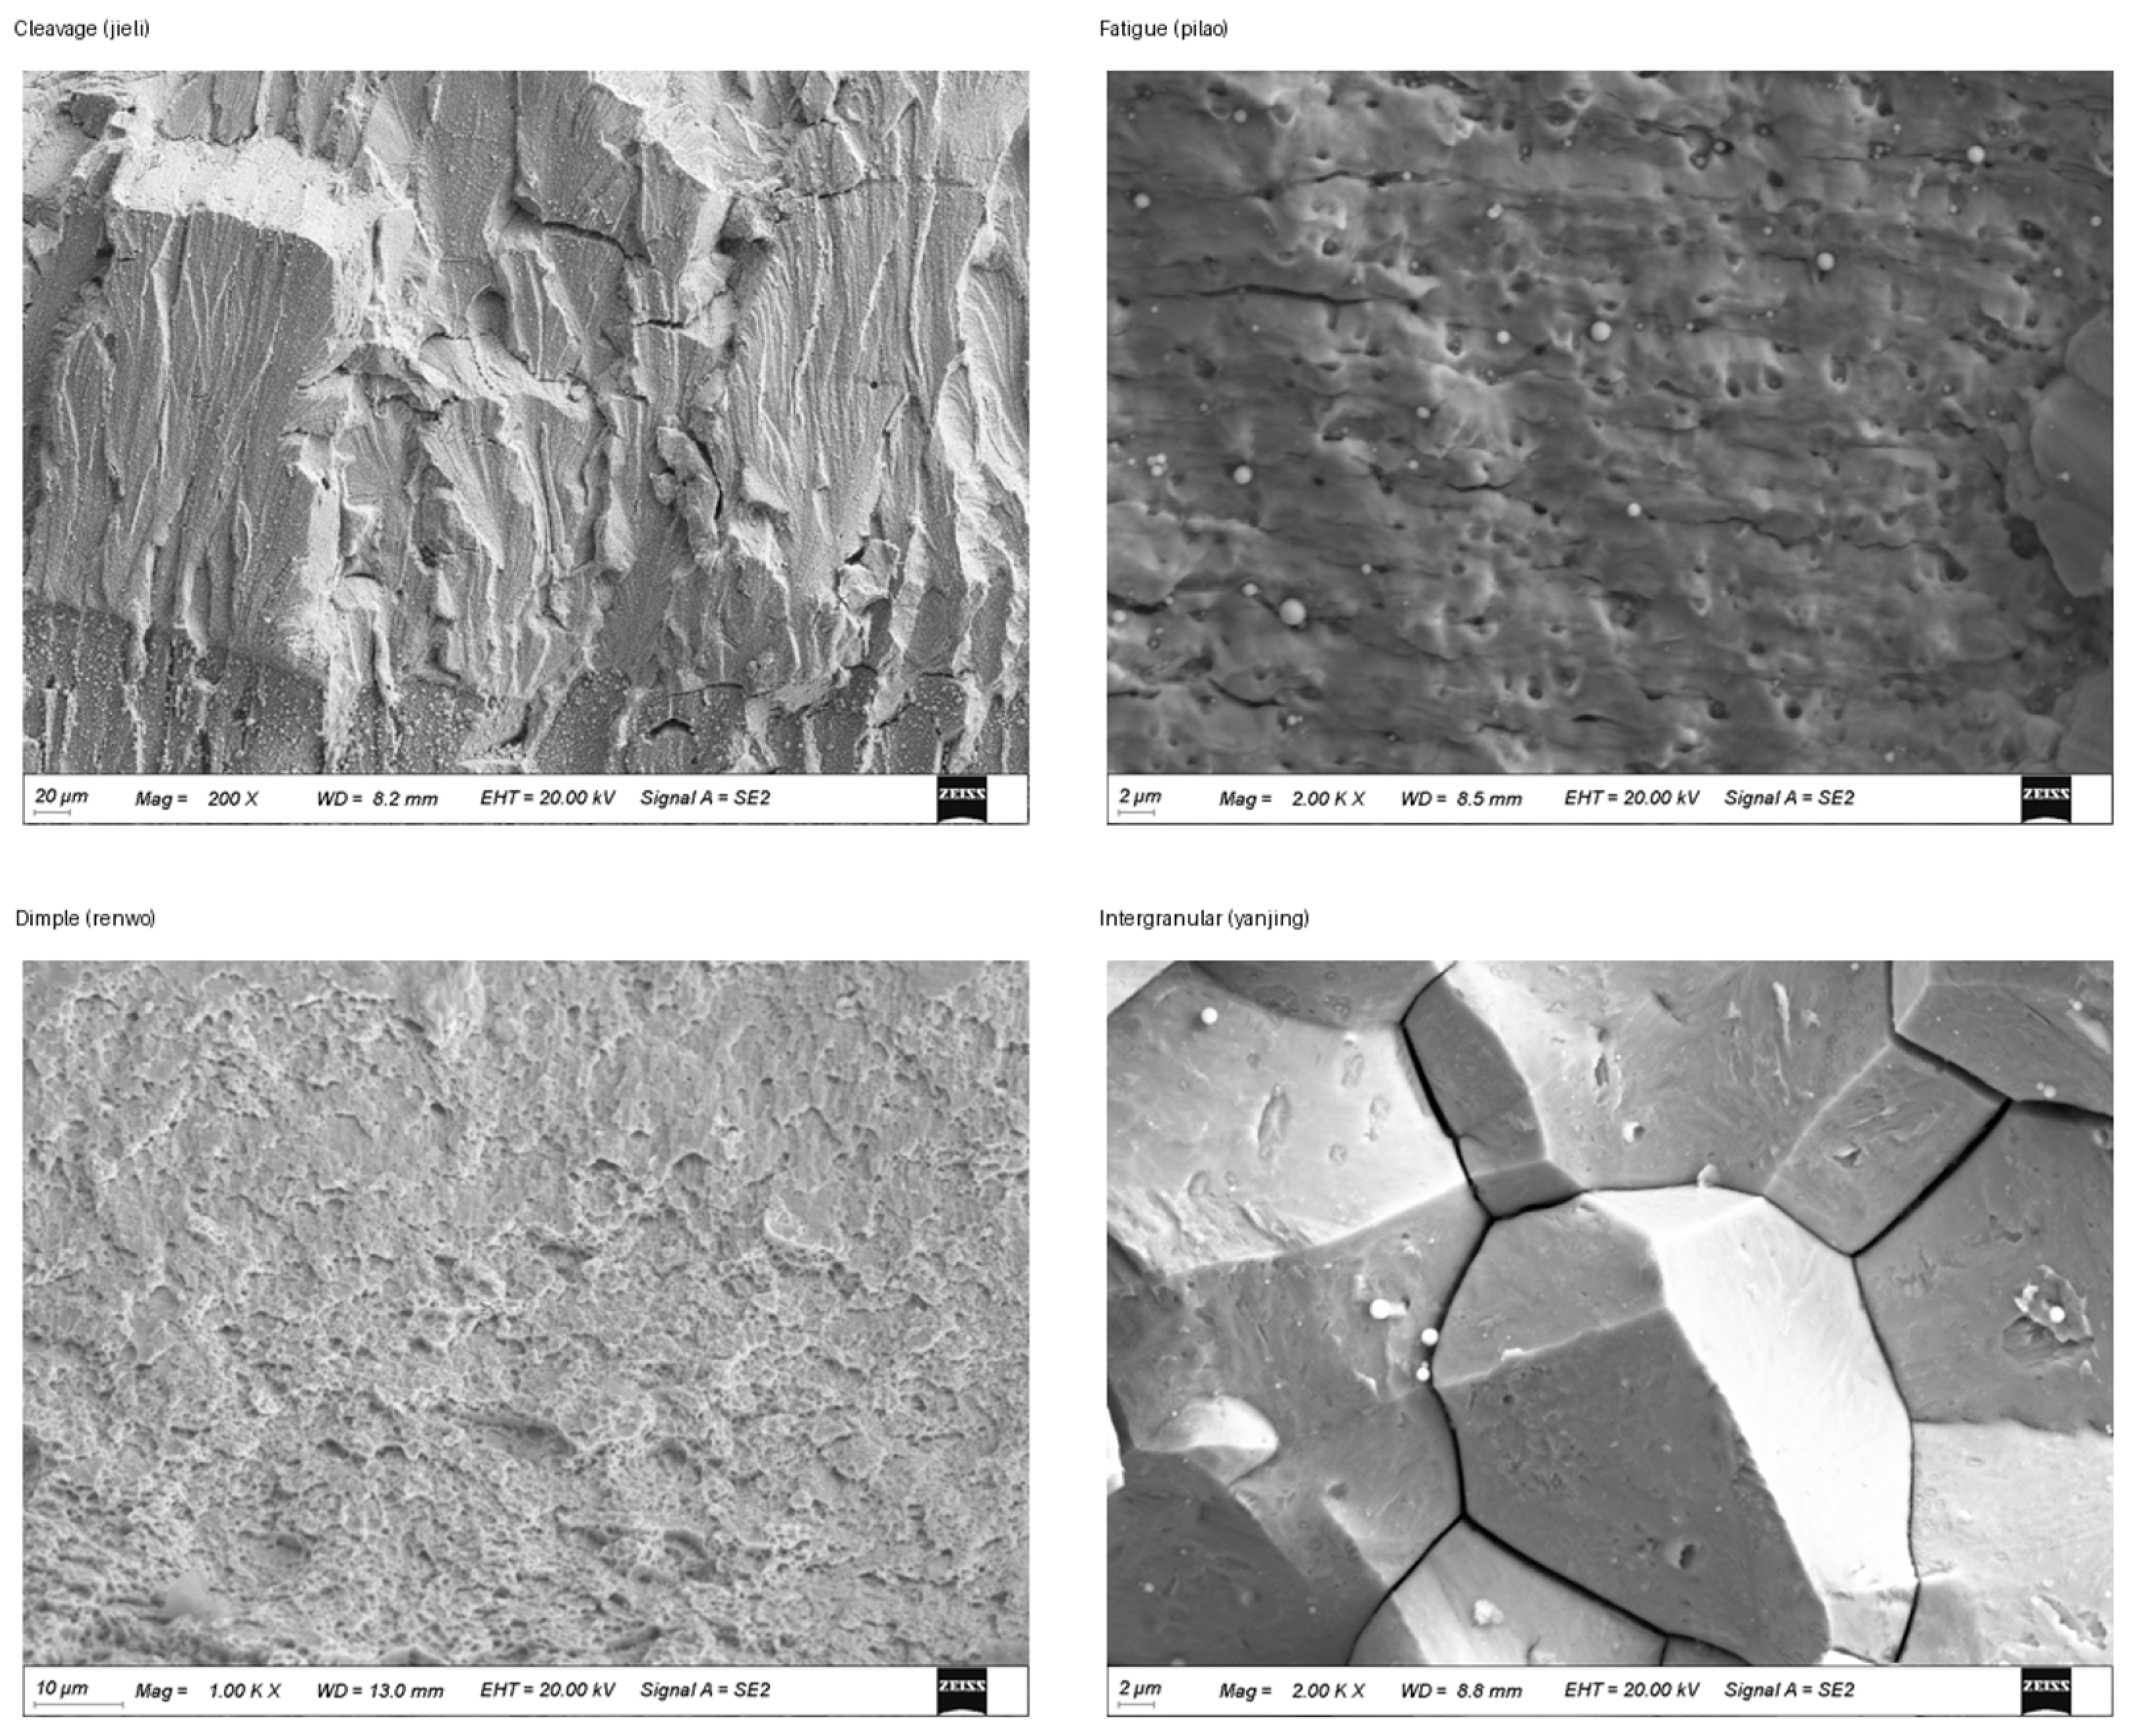
Derived from real nuclear-component failure-analysis scenarios, this dataset possesses high engineering representativeness. Restricted to ferrous alloys, the current model cannot be directly generalized to aluminum, copper, or other non-ferrous materials; external independent datasets are required for transferability verification. Moreover, this four-class annotation scheme does not subdivide fine sub-types such as quasi-cleavage, quasi-ductile fracture, or different fatigue stages. Fatigue labels only describe the dominant visible morphology rather than distinguishing high-/low-cycle fatigue or crack-propagation phases. Accordingly, the proposed model is intended for rapid four-category screening and cannot replace detailed manual fractographic analysis. Representative micrographs are illustrated in Figure 2.
Figure 2.
Representative SEM images of the four fracture categories.
2.2. SEM-Oriented Image Preprocessing
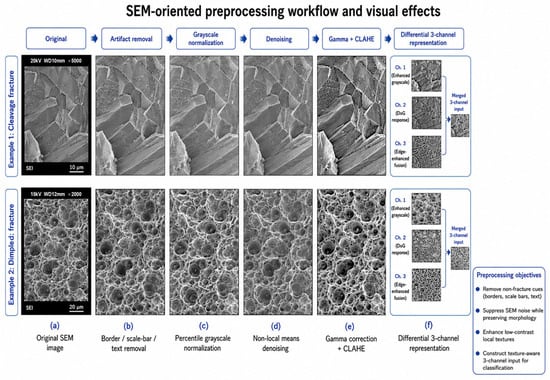
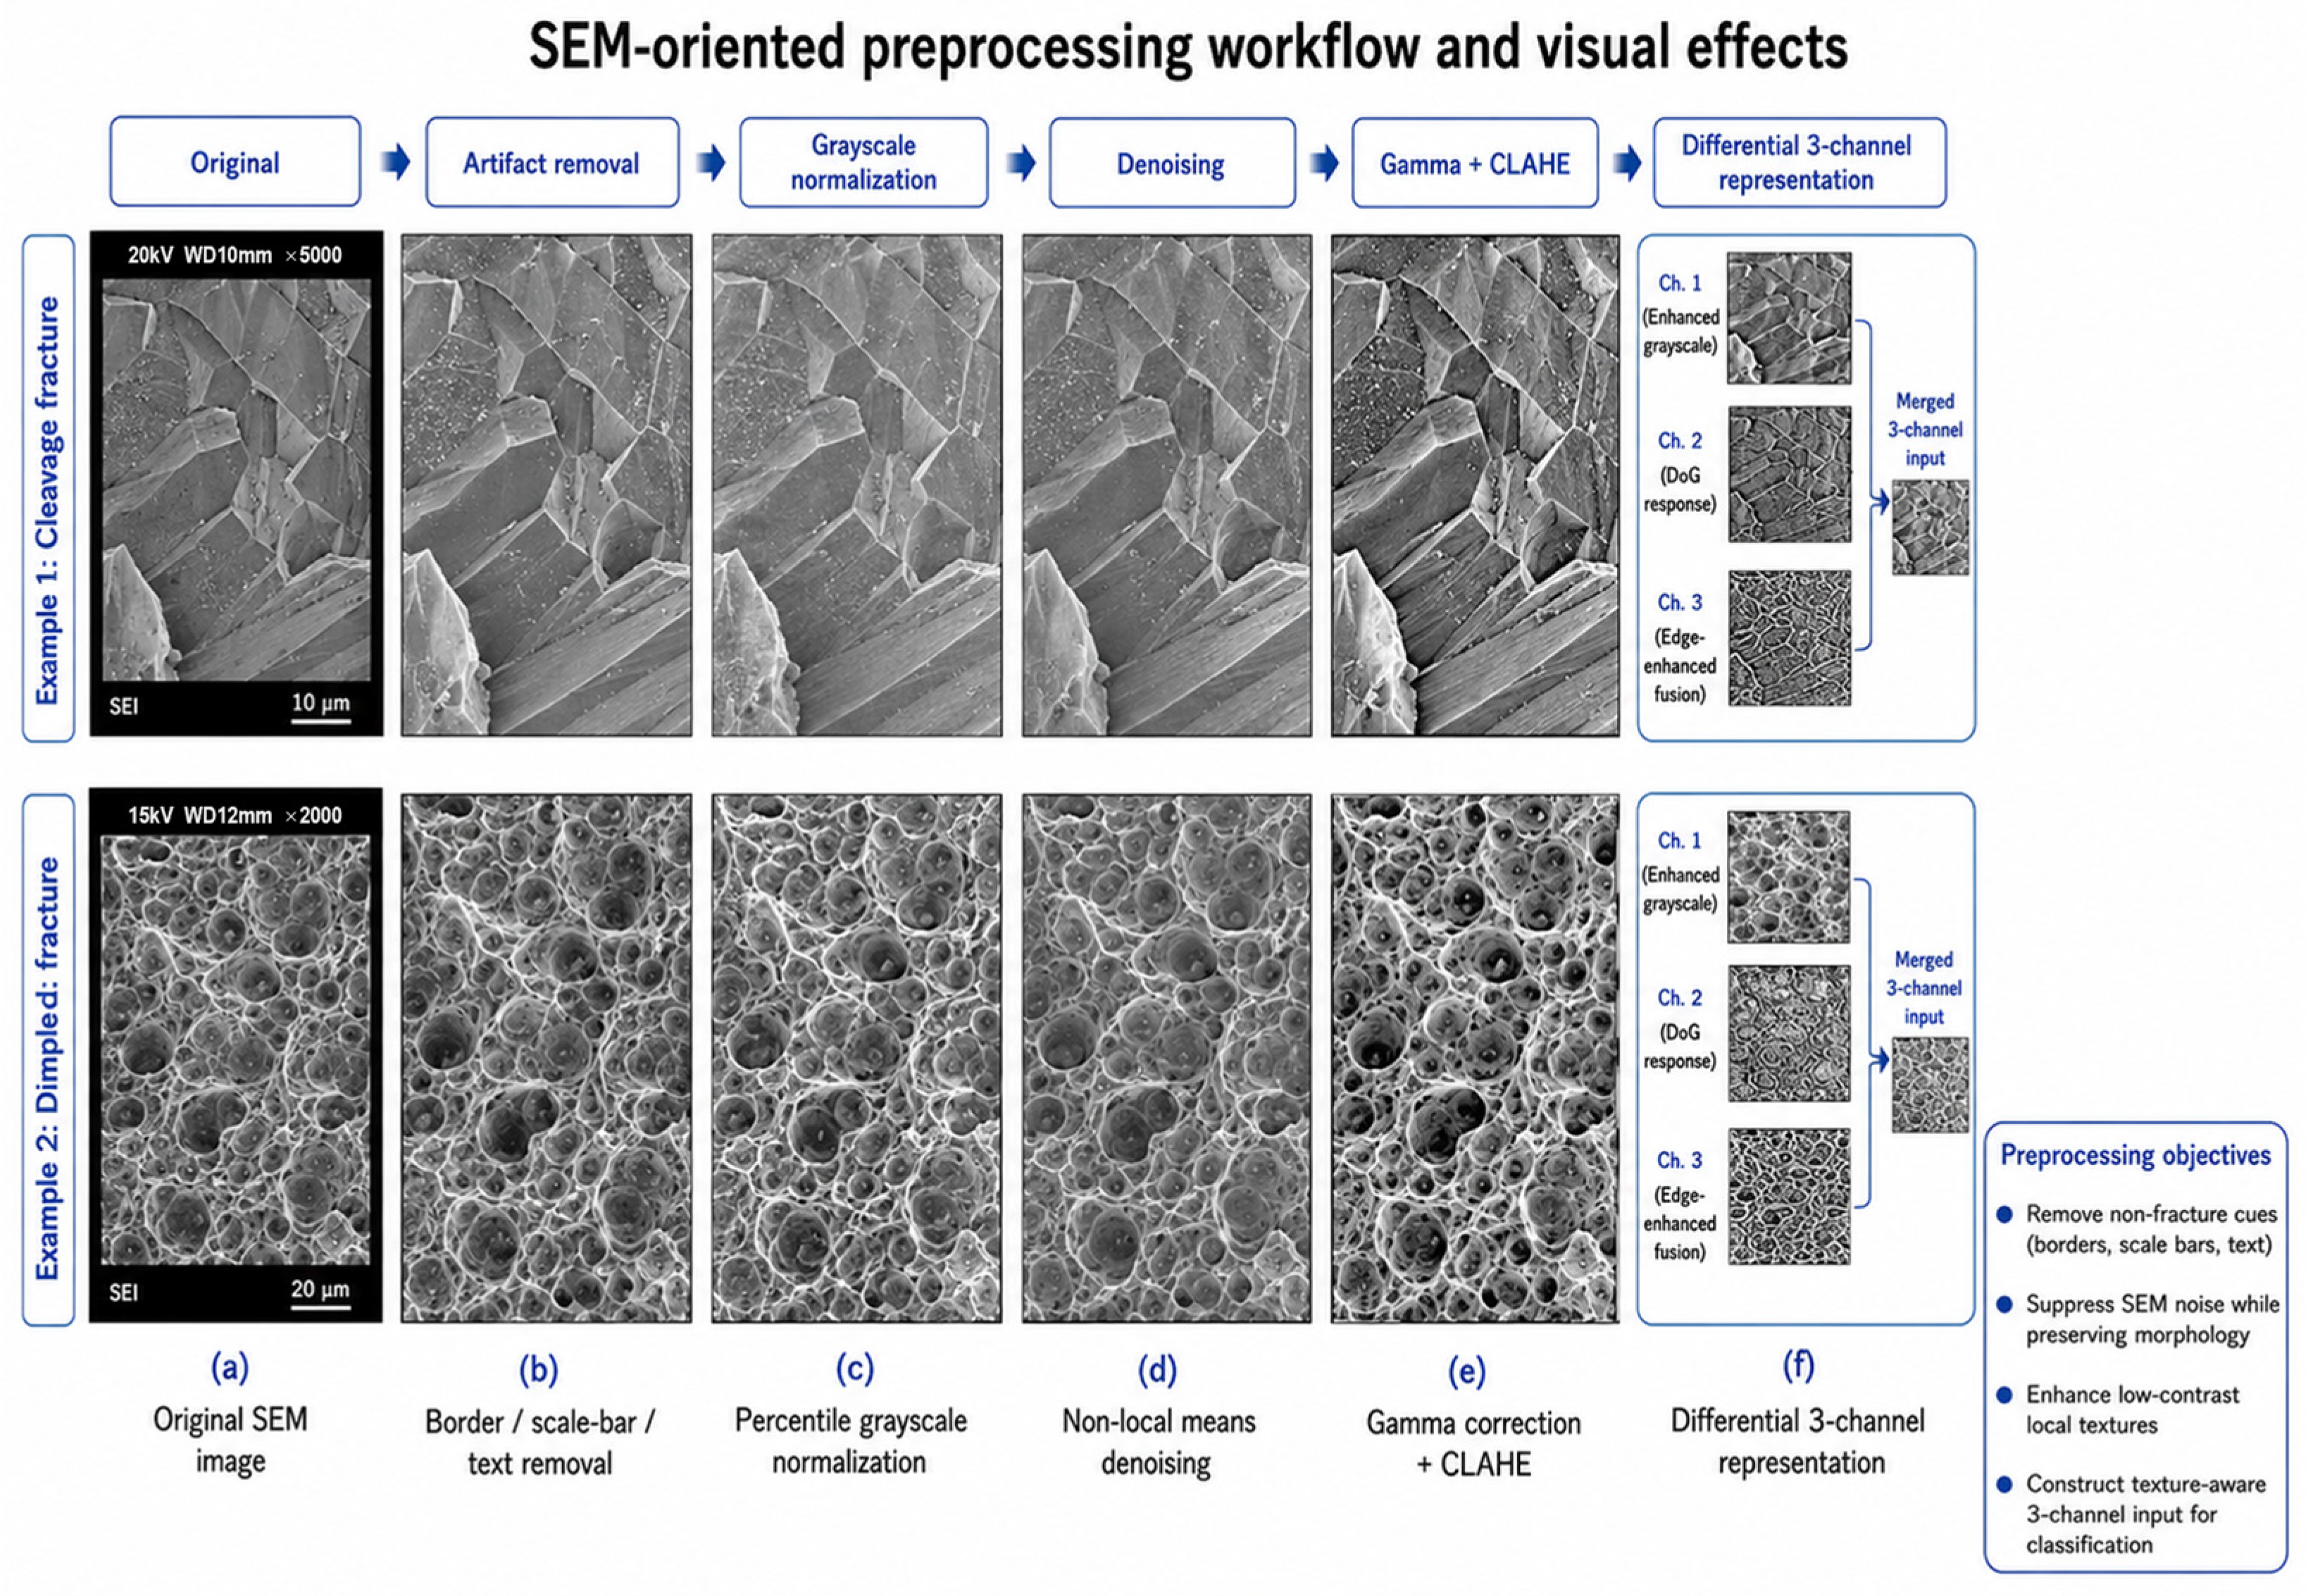
SEM fracture-surface images differ markedly from natural images in imaging information and discriminative features. Such images usually use grayscale, local texture, and surface morphology as their primary information sources, with weak color information. Meanwhile, some original images may contain black borders, scale bars, text annotations, and electronic noise, and differences in brightness, contrast, and magnification may also exist among different fields of view. Without unified processing, classification models may learn features unrelated to fracture mechanisms, such as scale bars, borders, or overall brightness, thereby affecting recognition of the true fracture-surface morphology. Therefore, this paper set up a standardized preprocessing workflow tailored to SEM image characteristics before model training, in order to reduce interference from acquisition conditions and image-layout differences on the classification results.
First, invalid image borders and possible scale-bar and text regions were removed to reduce the possibility that the model uses non-morphological information for classification [19]. The grayscale range was then standardized to reduce the influence of abnormal bright spots, locally dark regions, and different imaging brightness levels on the input distribution. For images with low contrast, local contrast enhancement was further performed so that weak texture structures such as fatigue striations, grain-boundary contours, dimple edges, and cleavage steps became clearer in the input images [20]. After processing, grayscale distributions and contrast differences among images were unified to a certain extent, while local texture and boundary features related to fracture mechanisms were preserved and enhanced. In this paper, the above steps were used as the data standardization workflow. A separate ablation experiment on preprocessing methods was not conducted; therefore, their independent contribution is not distinguished from that of the model-structure improvement [21].
Because most original SEM images are single-channel grayscale images, directly copying the same grayscale image into three channels can satisfy the input requirements of pretrained networks, but the three channels contain exactly the same information and cannot fully exploit the network’s multi-channel feature extraction capability. Therefore, this paper adopted a differentiated three-channel input construction method: the first channel retains the enhanced grayscale image to represent the overall grayscale distribution and surface texture; the second channel uses a grayscale-response variant to highlight weak-contrast regions and local grayscale variation; and the third channel introduces edge-enhancement information to strengthen contour features such as grain boundaries, dimple-hole edges, fatigue striations, and cleavage steps. This input design enables the network to receive overall texture, local grayscale variation, and boundary information simultaneously, reducing information redundancy caused by complete duplication across the three channels. The images before and after processing are shown in Figure 3.
Figure 3.
SEM-oriented preprocessing workflow and visual effects.
2.3. Related Framework
To evaluate the performance of the proposed method in metal fracture-surface SEM image classification, this paper selected the YOLOv8 classification network as the base framework and introduced typical convolutional neural networks, including ResNet, InceptionV3, and MobileNetV2, as comparison models [22,23,24,25]. All of these models can perform whole-image classification, but they differ substantially in network depth, feature transmission, model size, and computational complexity [11]. By comparing different classification frameworks, the overall performance of YOLOv8-CBAM in terms of classification accuracy, number of model parameters, and inference efficiency can be analyzed.
2.3.1. YOLOv8 Classification Framework
The YOLO series was originally proposed for object detection [26,27,28,29]. It is characterized by an end-to-end network that directly performs image feature extraction and prediction, offering considerable advantages in detection speed and engineering deployment. With the development of network structures, the YOLO framework has gradually been extended to tasks such as image classification, instance segmentation, and pose estimation. YOLOv8 further provides an independent image classification branch [30] that directly maps input images to probabilities for different categories; thus, it can be used to classify whole SEM fracture-surface images without bounding-box annotation or local-region localization.
The YOLOv8 classification network is mainly composed of a convolutional feature extraction network and a classification head. After an input image passes through multiple convolutional layers and feature extraction modules, the spatial resolution gradually decreases while the channel dimension increases, allowing the network to learn image information at different levels from shallow to deep. Shallow features mainly describe grayscale variation, edges, and local textures, whereas middle- and high-level features can represent texture combinations and morphology distributions over larger ranges. After global feature aggregation, the classification head outputs the predicted probability for each class, and the class with the maximum probability is taken as the final classification result.
YOLOv8 uses the C2f module as its main feature extraction unit [30]. This module achieves multi-level feature transmission through feature splitting, convolutional transformation, and channel concatenation, preserving feature information at different levels while reducing computational cost. Compared with traditional serial convolutional structures, the C2f module helps improve feature reuse and gradient propagation, enabling the network to obtain strong feature extraction capability with fewer parameters. For SEM fracture-surface images, this multi-level feature fusion helps retain morphological information at different scales, including fatigue striations, dimple edges, grain-boundary contours, and cleavage steps.
This paper used the nano and small variants of YOLOv8 for the experiments. The nano model has fewer parameters and is more suitable for lightweight and real-time processing scenarios, whereas the small model has higher feature capacity and can be used to analyze the effect of model-size variation on classification results. The core model in this paper is based on the YOLOv8n classification network and introduces CBAM into the middle- and high-level feature extraction stages to enhance the model response to local fracture-surface morphology. By comparing it with YOLOv8n and YOLOv8s without attention mechanisms, the effect of CBAM at different model scales can be evaluated.
2.3.2. ResNet Framework
ResNet is a representative deep convolutional neural network in image classification. Its core idea is to alleviate gradient vanishing and feature degradation as the network deepens through residual connections [22]. Traditional convolutional networks usually learn a nonlinear mapping directly from input features to output features, whereas residual modules introduce identity mappings so that the network instead learns the residual relationship between input and output.
This structure allows low-level information to be transmitted directly to subsequent networks through skip connections, facilitating the construction of deeper feature extraction models. As the number of network layers increases, ResNet can form a larger receptive field and stronger high-level semantic representation capability, and it has therefore been widely used for classification tasks involving natural images, microstructure images, and material surface images.
This paper used ResNet-50 and ResNet-101 as deep CNN comparison models. They contain different numbers of residual modules; ResNet-101 has greater network depth and more parameters, allowing it to learn more complex feature representations, but its computational cost and storage requirements also increase accordingly. By comparing YOLOv8n-CBAM with ResNet-50 and ResNet-101, performance differences between a lightweight model and large deep networks in SEM fracture-surface classification can be analyzed.
2.3.3. ImageNet Pretraining and CNN Baselines
SEM fracture-surface data usually need to be acquired with specialized equipment and classified and annotated by experienced personnel. The cost of data acquisition is therefore high, and the dataset size is often smaller than that of natural-image datasets. Under limited-sample conditions, training deep networks from random initialization is prone to slow convergence, insufficient parameter learning, and overfitting. Transfer learning uses pretrained parameters obtained on large-scale datasets to provide relatively stable initial feature representations for the target task, and is a common training strategy for small- and medium-scale material image classification.
ImageNet-1k is a large-scale natural-image dataset widely used in image classification research and contains many categories and visual scenes. Although natural images and SEM images differ in color, texture, and imaging mechanism, edges, corners, directional textures, and local structures learned by shallow layers of pretrained networks still have a certain degree of generality. After ImageNet pretrained weights are used as model initialization parameters, the network can further learn high-level features related to fracture-surface morphology on this basis, thereby reducing the training difficulty caused by insufficient target data.
This paper initialized YOLOv8, ResNet, InceptionV3, and MobileNetV2 with ImageNet pretrained weights. YOLOv8 uses the corresponding classification pretrained weights, while ResNet, InceptionV3, and MobileNetV2 use ImageNet-1K pretrained parameters provided by public frameworks. The original classification layers of the models were replaced according to the four-class fracture-surface task in this paper, and the models were fine-tuned on the metal fracture-surface SEM dataset.
InceptionV3 extracts features in parallel through convolutional branches at different scales, enabling image information under different receptive fields to be obtained simultaneously [23]. For fracture-surface images that contain fine striations, pore edges, and larger grain contours at the same time, the multi-scale convolutional structure has certain applicability. However, this model has a relatively complex structure, and its parameter size and computational cost are significantly higher than those of lightweight networks. MobileNetV2 uses depthwise separable convolutions and an inverted residual structure to reduce model computational complexity, and is characterized by a small number of parameters and convenient deployment on mobile devices. Using it as a lightweight baseline makes it possible to determine whether the performance improvement of YOLOv8n-CBAM is solely due to differences in model size. At the same time, MobileNetV2 and YOLOv8n-CBAM have relatively similar parameter scales, so their comparison can more directly reflect the feature extraction capabilities of different lightweight network structures in SEM fracture-surface classification.
In summary, this paper set up three types of comparison frameworks: YOLOv8n and YOLOv8s were used to analyze the effects of model size and attention mechanisms within the same series; ResNet-50 and ResNet-101 represented traditional deep residual networks; and InceptionV3 and MobileNetV2 depicted a multi-scale CNN and a lightweight CNN, respectively. Through unified data partitioning and evaluation metrics, the classification accuracy, parameter size, and inference efficiency of each model were comprehensively evaluated, providing a basis for analyzing the applicability of YOLOv8-CBAM to the automatic classification of SEM fracture-surface images.
Compared with deeper CNNs such as ResNet-101, YOLOv8n provides a more lightweight feature-extraction backbone and lower model complexity, making it more suitable for batch SEM image screening. InceptionV3 has advantages in multi-scale feature extraction but introduces higher structural complexity and parameter cost, while MobileNetV2 is lightweight but showed relatively weaker classification performance on the present dataset. The proposed YOLOv8n-CBAM model aims to combine the lightweight characteristics of YOLOv8n with channel-spatial feature reweighting, so as to improve the representation of localized fracture-surface morphology without substantially increasing model complexity.
2.4. CBAM Attention Mechanism
CBAM is a lightweight convolutional attention module composed of channel attention and spatial attention connected sequentially [18]. Channel attention generates channel descriptors through global pooling and learns importance weights for different channels, thereby enhancing feature responses that contain effective fracture-surface texture information. Spatial attention generates a spatial descriptor through average pooling and max pooling along the channel dimension, and then obtains a spatial weight map through convolution, enabling the model to focus more on local regions with discriminative significance in the image.
In SEM fracture-surface classification, channel attention may improve feature responses related to grayscale texture, edge contours, and local morphology, whereas spatial attention may enhance activation intensity in certain discriminative regions of the feature map. Attention weights are not equivalent to materials-science semantic annotations, and the model cannot directly ‘recognize’ dimples, grain boundaries, or fatigue striations. In this paper, CBAM was used as a feature reweighting module, and its effect was observed through classification results and Grad-CAM visualization.
2.5. YOLOv8-CBAM Model Design
The model design was guided by the two requirements of this task: preserving fine-grained and localized fracture-surface features, and maintaining low computational complexity for batch screening. Therefore, YOLOv8n was selected as the lightweight baseline, and CBAM was selectively introduced into the middle- and high-level feature stages.
YOLOv8-CBAM was constructed on the basis of the YOLOv8 classification network. The core idea of this paper was not simply to append an attention module at the back end of the network, but rather to guide the feature extraction process in a targeted manner according to the morphological discrimination characteristics of SEM fracture-surface images. In the original YOLOv8 backbone, the C2f module mainly performs lightweight feature extraction and feature fusion [30]. This module maintains good feature representation capability while controlling the number of parameters through feature splitting, bottleneck transformation, and channel fusion. In this paper, CBAM was embedded into selected C2f modules to form C2f_CBAM modules. Specifically, C2f first completes multi-branch feature fusion, after which CBAM further recalibrates the fused feature maps. Channel attention emphasizes ‘which types of feature responses are more important’, while spatial attention emphasizes ‘which regions in the image are more discriminative’. Through this joint channel and spatial constraint, the model can generate more concentrated responses to local morphologies related to fracture mechanisms, such as grain-boundary separation, dimple clustering, fatigue striations, and cleavage steps.
CBAM was not inserted into all feature extraction layers. This design was based on the hierarchical nature of feature representation in convolutional neural networks. Shallow features usually describe low-level visual information such as edges, abrupt grayscale changes, local contrast, and general texture. For SEM images, these shallow responses may include useful fracture-surface edges, but may also include black borders, contamination, preparation marks, scale-bar residues, or imaging noise. If attention mechanisms are introduced at excessively shallow levels, the model may amplify signals unrelated to fracture mechanisms and thus form unstable classification shortcuts. In contrast, middle- and high-level features have larger receptive fields and stronger abstraction capability, making them better suited to expressing composite morphologies related to fracture mechanisms such as grain-boundary networks in intergranular fracture, dimple distributions in ductile fracture, striation directionality in fatigue fracture, and stepped cleavage planes in cleavage fracture. Therefore, this paper mainly placed CBAM in the middle- and high-level stages of the YOLOv8 backbone, so that the attention mechanism acts more on morphologies with fractographic discriminative significance rather than on isolated grayscale edges.
In the YOLOv8 backbone, P3/8, P4/16, and P5/32 denote feature stages with different downsampling ratios. Here, ‘P’ can be understood as different levels in the feature pyramid, and the number after the slash indicates the spatial downsampling factor of the feature map relative to the input image. For example, P3/8 means that the spatial size of the feature map at this stage is approximately 1/8 of the input image; P4/16 indicates 16-fold downsampling; and P5/32 indicates 32-fold downsampling. As the network deepens from P3 to P5, the spatial resolution of feature maps gradually decreases, while the number of channels and the receptive field gradually increase. In other words, P3 retains more local texture details, P4 combines local morphology with overall structural information, and P5 contains deeper and more abstract expressions of fracture-surface patterns. For SEM fracture-surface classification, these three stages can describe texture-morphology composite features in fracture-surface images at different scales.
Specifically, this paper retained the standard C2f module in the shallow P2/4 stage without introducing CBAM, in order to maintain stable extraction of basic edge and texture information. At the three middle- and high-level scales of P3/8, P4/16, and P5/32, the original C2f modules were replaced with C2f_CBAM modules. In the P3 stage, the number of channels was 256 and the module was repeated 6 times; in the P4 stage, the number of channels was 512 and the module as repeated 6 times; and in the P5 stage, the number of channels was 1024 and the module was repeated 3 times. This insertion strategy causes the attention mechanism to act primarily on middle- and high-level feature maps that already have a certain degree of semantic abstraction, thereby enhancing local texture and morphology expressions related to fracture mechanisms while avoiding indiscriminate recalibration of shallow edge features. The resulting YOLOv8-CBAM network improves the model’s ability to attend to fine-grained local morphology in SEM fracture-surface images while retaining the lightweight and efficient inference advantages of YOLOv8. The model architecture is shown in Figure 4.
Figure 4.
Overall technical workflow and selective CBAM insertion strategy of YOLOv8n-CBAM for SEM fracture image classification.
2.6. Training Strategy
The core model was YOLOv8n-CBAM, with an input resolution of 1024, a batch size of 6, a maximum of 100 training epochs, and an early-stopping patience of 15. The input size of 1024 × 1024 was selected primarily to preserve fine-scale morphological information in the SEM images, such as fatigue striations, cleavage steps, grain-boundary contours, and dimple edges. The original SEM images typically had a resolution of approximately 1024 × 768 pixels; therefore, using a 1024-pixel input reduced the degree of spatial downsampling compared with conventional lower-resolution classification inputs and helped retain high-frequency texture information. However, increasing the input resolution also increased the number of pixels processed by the network and consequently increased the computational cost, graphics processing unit (GPU) memory consumption, and inference time. Thus, the selected resolution represents a trade-off between the preservation of fine fracture-surface morphology and computational efficiency. Training was initialized with an ImageNet-pretrained model, but no SEM-specific pretraining was used. To ensure a fair comparison, all comparison models used the same training, validation, and test partitions, and the same SEM-oriented preprocessing procedure was applied to all images. The same data augmentation strategy was used during training. All models were trained under the same maximum number of epochs and early-stopping criterion. AdamW was used as the optimizer for all models, and the best-performing checkpoint was selected according to the validation-set performance using the same model-selection criterion. Apart from model-specific input-size settings required by the corresponding architectures, the remaining training and evaluation conditions were kept consistent as far as possible. The optimizer was automatically selected by Ultralytics as AdamW, with an initial learning rate of 0.01 and a final learning-rate factor of 0.01. Considering that SEM images are grayscale texture images, hue and saturation augmentation were disabled during training (hsv_h = 0, hsv_s = 0), while brightness perturbation was retained (hsv_v = 0.2).
The hardware and software environment for training was as follows: NVIDIA GeForce RTX 2060 GPU (6 GB), compute unified device architecture (CUDA) 10.2, PyTorch 1.10.0, Ultralytics 8.2.71/8.2.74, Python 3.8.19, and Windows 10/11. The experimental parameters were set as shown in Table 2.
Table 2.
Training settings used or retained for the YOLOv8-CBAM model.
2.7. Evaluation Metrics
This paper used Top-1 accuracy, precision, recall, F1-score, and the confusion matrix to evaluate model classification performance, and used macro-averaged F1-score (Macro-F1) to measure the overall balanced performance of the model across the four fracture-surface classes. Model complexity and inference efficiency were evaluated using the number of parameters, giga floating-point operations (GFLOPs), frames per second (FPS), and average inference time per image. In addition, Grad-CAM was used to qualitatively analyze the high-response regions of the model in different fracture-surface images.
For the i-th fracture-surface class, precision and recall are defined as:
Among them, represents the number of correctly identified samples in class i, represents the number of incorrectly predicted samples in other classes as class i, and represents the number of incorrectly predicted samples in class i as other classes.
The F1-score is the harmonic mean of precision and recall and is calculated as:
As this study was a four-class classification task, Macro-F1 was used to perform equal weight averaging:
Among which . Macro-F1 is not directly affected by differences in the number of samples among classes and can be used to evaluate the classification balance of the model on cleavage, fatigue, dimple, and intergranular fracture surfaces.
The confusion matrix was used to represent the correspondence between true classes and predicted classes. The elements on the main diagonal indicate the number of correctly classified samples, while the off-diagonal elements indicate misclassification among different fracture-surface classes. The confusion matrix enabled further analysis of the main confusion relationships among intergranular, fatigue, cleavage, and dimple fractures.
The number of model parameters was used to measure network size, and GFLOPs were used to measure the floating-point operations required for one forward pass. To ensure comparability among different models, this paper calculated the number of parameters and GFLOPs for each model under a unified input size and identical statistical conditions. FPS denotes the number of images the model can process per unit time, while average inference time per image reflects the response speed of the model for a single sample. All of the above efficiency metrics were tested under the same hardware and software environment.
Grad-CAM calculates the weights of different channels according to the gradients of the target-class score with respect to the convolutional feature maps, and generates a class-response heatmap [31], expressed as:
Among them, represents the k-th feature map and represents the contribution weight of that feature map to class c, respectively. In this paper, Grad-CAM was used to observe whether the high-response regions of the model were located near fracture-surface morphologies such as grain-boundary contours, fatigue striations, dimple-dense regions, and cleavage steps; however, the heatmaps were not used directly as criteria for determining the fracture mechanisms.
3. Results
3.1. Dataset Statistics
Table 3 presents the final dataset partitioning. To prevent information leakage between highly correlated SEM images, the dataset was grouped and divided at the specimen level rather than by randomly splitting individual images. Of the 475 independent specimens, 373 were assigned to the training set, 70 to the validation set, and 32 to the test set. All images originating from the same specimen were retained within the same subset. This specimen-level grouping resulted in 1491, 278, and 96 images in the training, validation, and test sets, respectively, corresponding approximately to an image-level ratio of 80%/15%/5%. Because the fatigue class had relatively fewer samples, its sample-size difference should be considered when interpreting class recall.
Table 3.
Specimen-grouped dataset split for training, validation, and testing.
3.2. Training Process
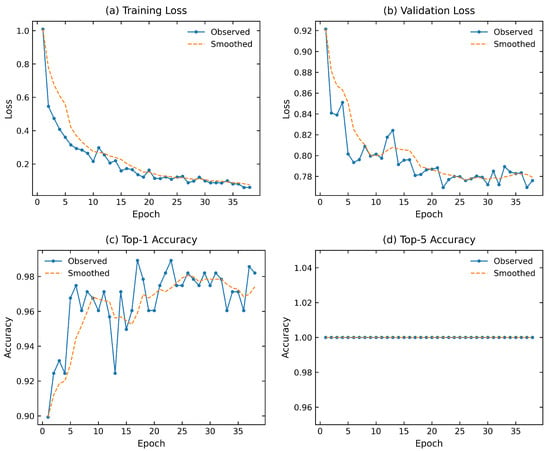
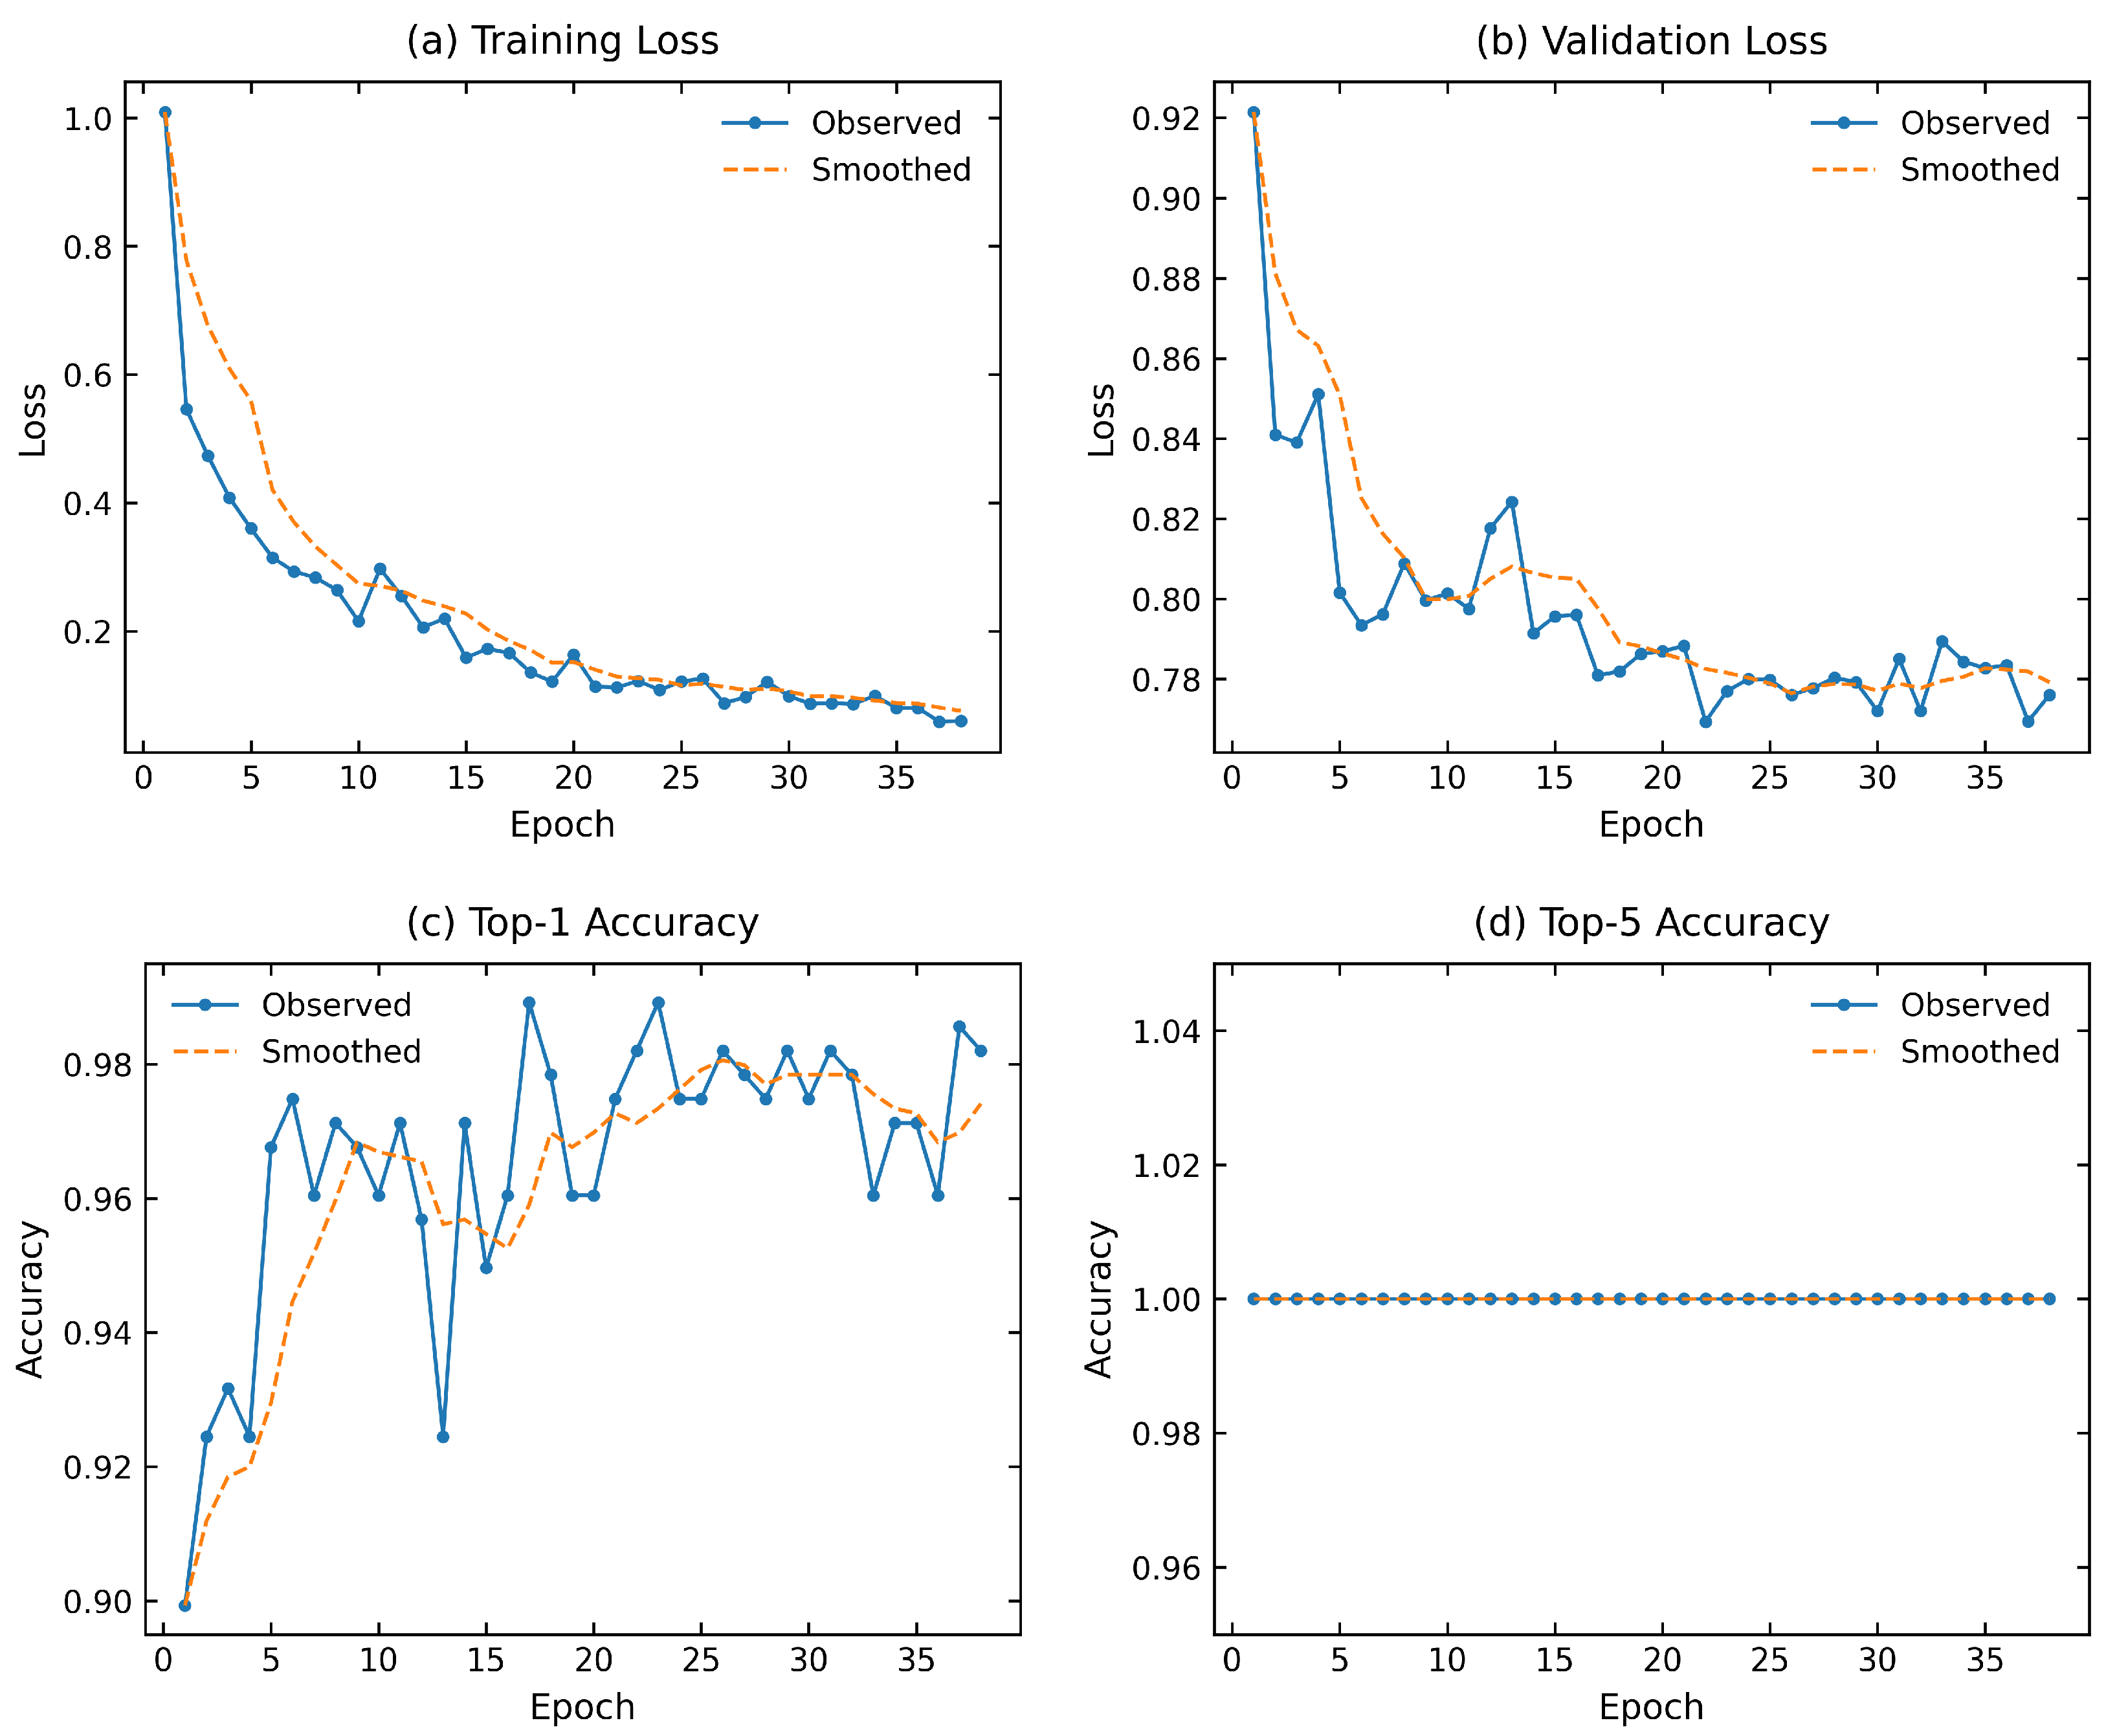
Figure 5 shows the training process of the core YOLOv8n-CBAM model, including the changes in training loss, validation loss, Top-1 accuracy, and Top-5 accuracy with epoch. The model converged rapidly in the early stage, and validation performance reached the optimum around epochs 37–38, after which early stopping was triggered. With the combined effect of ImageNet-pretrained initialization and SEM-optimized data augmentation, the model was able to adapt quickly to the fracture-surface image classification task.
Figure 5.
Training curves of the YOLOv8n-CBAM model: (a) training loss; (b) validation loss; (c) Top-1 accuracy; and (d) Top-5 accuracy.
3.3. Comparison with YOLO Series and Attention Variants
Unless otherwise stated, the results reported in the comparative tables correspond to individual training runs rather than averages over multiple independent runs. Therefore, the reported differences should be interpreted as observed results under the present experimental configuration rather than as estimates of statistical significance. Table 4 presents the comparison results for the YOLO-series models and several typical convolutional neural networks. Considering that discrimination among SEM fracture-surface classes mainly depends on fine-grained morphologies such as fatigue striations, grain-boundary contours, dimple edges, and cleavage steps, the YOLOv8-series models use imgsz = 1024 during training and testing to reduce the loss of high-frequency textures during downsampling, while ResNet-50 and ResNet-101 use the 224 × 224 input size commonly used by ImageNet-pretrained classification models [22]. Under the current dataset and experimental settings, YOLOv8n-CBAM achieved a test Top-1 accuracy of 97.92%. The corresponding test accuracies of YOLOv8n, ResNet-50, and ResNet-101 were 96.20%, 96.88%, and 97.92%, respectively. Thus, the observed differences relative to YOLOv8n-CBAM were 1.72, 1.04, and 0.00 percentage points, respectively. Although YOLOv8n-CBAM and ResNet-101 yielded the same rounded Top-1 accuracy on the current test set, this numerical observation should not be interpreted as evidence of statistically equivalent classification performance because repeated-run statistical testing was not performed.
Table 4.
Comparison of YOLO-based and ResNet models on SEM fracture image classification.
This result may be related to the different feature extraction mechanisms of the two types of networks. ResNet-101 obtains strong high-level semantic representation capability by increasing the number of residual modules and network depth [24], but its larger network size also introduces more parameters. In a task involving only four fracture-surface classes and a limited sample size, excessive model capacity may not continuously translate into higher test accuracy, and some redundant parameters may increase the model’s dependence on specific texture distributions in the training data. In contrast, YOLOv8n uses a lightweight backbone scaled in width and depth, and employs C2f modules for feature splitting, bottleneck transformation, and channel fusion, preserving texture information at different levels with fewer parameters [30]. On this basis, CBAM performs channel and spatial reweighting on middle- and high-level features, enabling local textures related to fracture classes to obtain higher responses during feature fusion. Therefore, the advantage of YOLOv8n-CBAM is mainly reflected in maintaining high classification performance under lower model complexity. The experimental results are shown in Table 4. These results indicate that the main advantage of YOLOv8n-CBAM is not simply a higher classification accuracy, but a more favorable balance among classification performance, parameter scale, and inference efficiency. Its novelty in the present application lies in the selective integration of CBAM into the middle- and high-level feature stages of a lightweight YOLOv8 classification framework for SEM fracture-surface image screening.
3.4. Classification Report and Confusion Matrix
Table 5 presents the classification results on the current test set. The test set contained 96 images, which is relatively small. The model achieved a Top-1 accuracy of 97.92%, with only two misclassified images, together with a Macro-F1 of 0.9787 and a weighted-F1 of 0.9793. The reported values therefore represent the performance observed on the current test set. Intergranular fracture and cleavage fracture both achieved 100% recall on this test set; the recall values for fatigue fracture and dimple fracture were 0.9500 and 0.9583, respectively. It should be emphasized that the reported classification metrics were obtained from a single experimental run on a relatively small test set of 96 images. Therefore, the observed accuracy, precision, recall, and F1-score may be sensitive to a small number of misclassified samples. Because repeated independent runs were not performed, the present study does not provide estimates of the mean, standard deviation, or confidence intervals for these metrics. Accordingly, the reported values should be interpreted as observed performance under the current experimental configuration rather than as statistically stable estimates of model performance.
Table 5.
Classification report of YOLOv8n-CBAM on the test set.
3.5. Computational Complexity and Inference Latency
Table 6 presents the number of parameters, FLOPs, memory usage, and inference speed of the core model and the main comparison models. YOLOv8n-CBAM had 1.53 M parameters, an inference speed of 96.5 FPS, and an inference time of approximately 10.4 ms per image.
Table 6.
Model complexity and inference speed.
3.6. Comparison with ImageNet-Pretrained CNN Baselines
Table 7 presents the results of InceptionV3 and MobileNetV2 after loading ImageNet pretrained weights. The test accuracy of InceptionV3 was 97.16%, and that of MobileNetV2 was 95.70%. YOLOv8n-CBAM achieved a test Top-1 accuracy of 97.92%, corresponding to observed differences of 0.76 and 2.22 percentage points relative to InceptionV3 and MobileNetV2, respectively. These differences describe the performance observed on the current test set only. Given the relatively small test-set size and the absence of repeated-run statistical analysis, these differences should not be interpreted as statistically significant.
Table 7.
Accuracy of ImageNet-pretrained InceptionV3 and MobileNetV2 on SEM fracture image classification.
The InceptionV3 four-class model had approximately 21.8 M parameters and achieves high accuracy, but its model size was clearly larger than that of YOLOv8n-CBAM. The MobileNetV2 four-class model had approximately 2.23 M parameters and was relatively lightweight, but its test accuracy was lower than that of YOLOv8n-CBAM. Thus, the pretrained CNNs provide strong baseline performance. Under the current experimental setting, YOLOv8n-CBAM combined a test Top-1 accuracy of 97.92% with a parameter count of 1.53 M, indicating a favorable balance between observed classification performance and model complexity.
3.7. Ablation Analysis of Attention Mechanisms
From the perspective of attention variants, the performance of squeeze-and-excitation (SE), efficient channel attention (ECA), coordinate attention (CA), and CBAM is not completely consistent [18,32,33,34]. SE and ECA mainly recalibrate channel responses, CA introduces positional information, whereas CBAM jointly performs channel and spatial feature reweighting. Under the current experimental setting, the YOLOv8n baseline achieved a test Top-1 accuracy of 96.20%, while YOLOv8n-CBAM achieved 97.92%, corresponding to an improvement of 1.72 percentage points. This baseline comparison indicates that the selective introduction of CBAM into the middle- and high-level feature stages contributes positively to the classification performance of the nano-scale model. However, the results obtained with different attention mechanisms and model scales were not uniformly improved, indicating that the effectiveness of attention depends on both the attention mechanism and the backbone configuration. Combined with the subsequent Grad-CAM visualization, the results suggest that joint channel-spatial reweighting may help the model utilize local fracture-surface textures and their spatial distributions more effectively. It should be noted that the SEM-oriented preprocessing workflow was applied consistently to all models, and no separate preprocessing ablation experiment was conducted. Therefore, the independent contribution of preprocessing cannot be quantitatively separated from that of the network-structure modification in the present study.
3.8. Attention Visualization Analysis
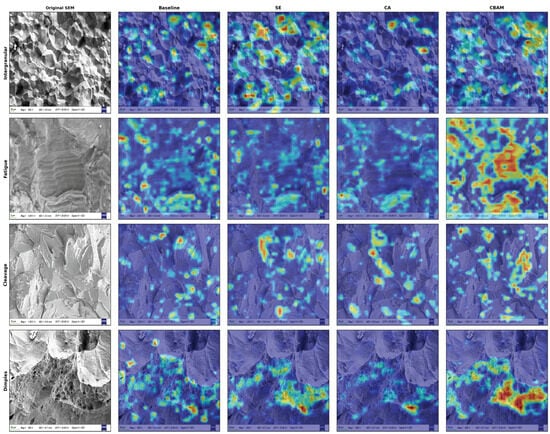
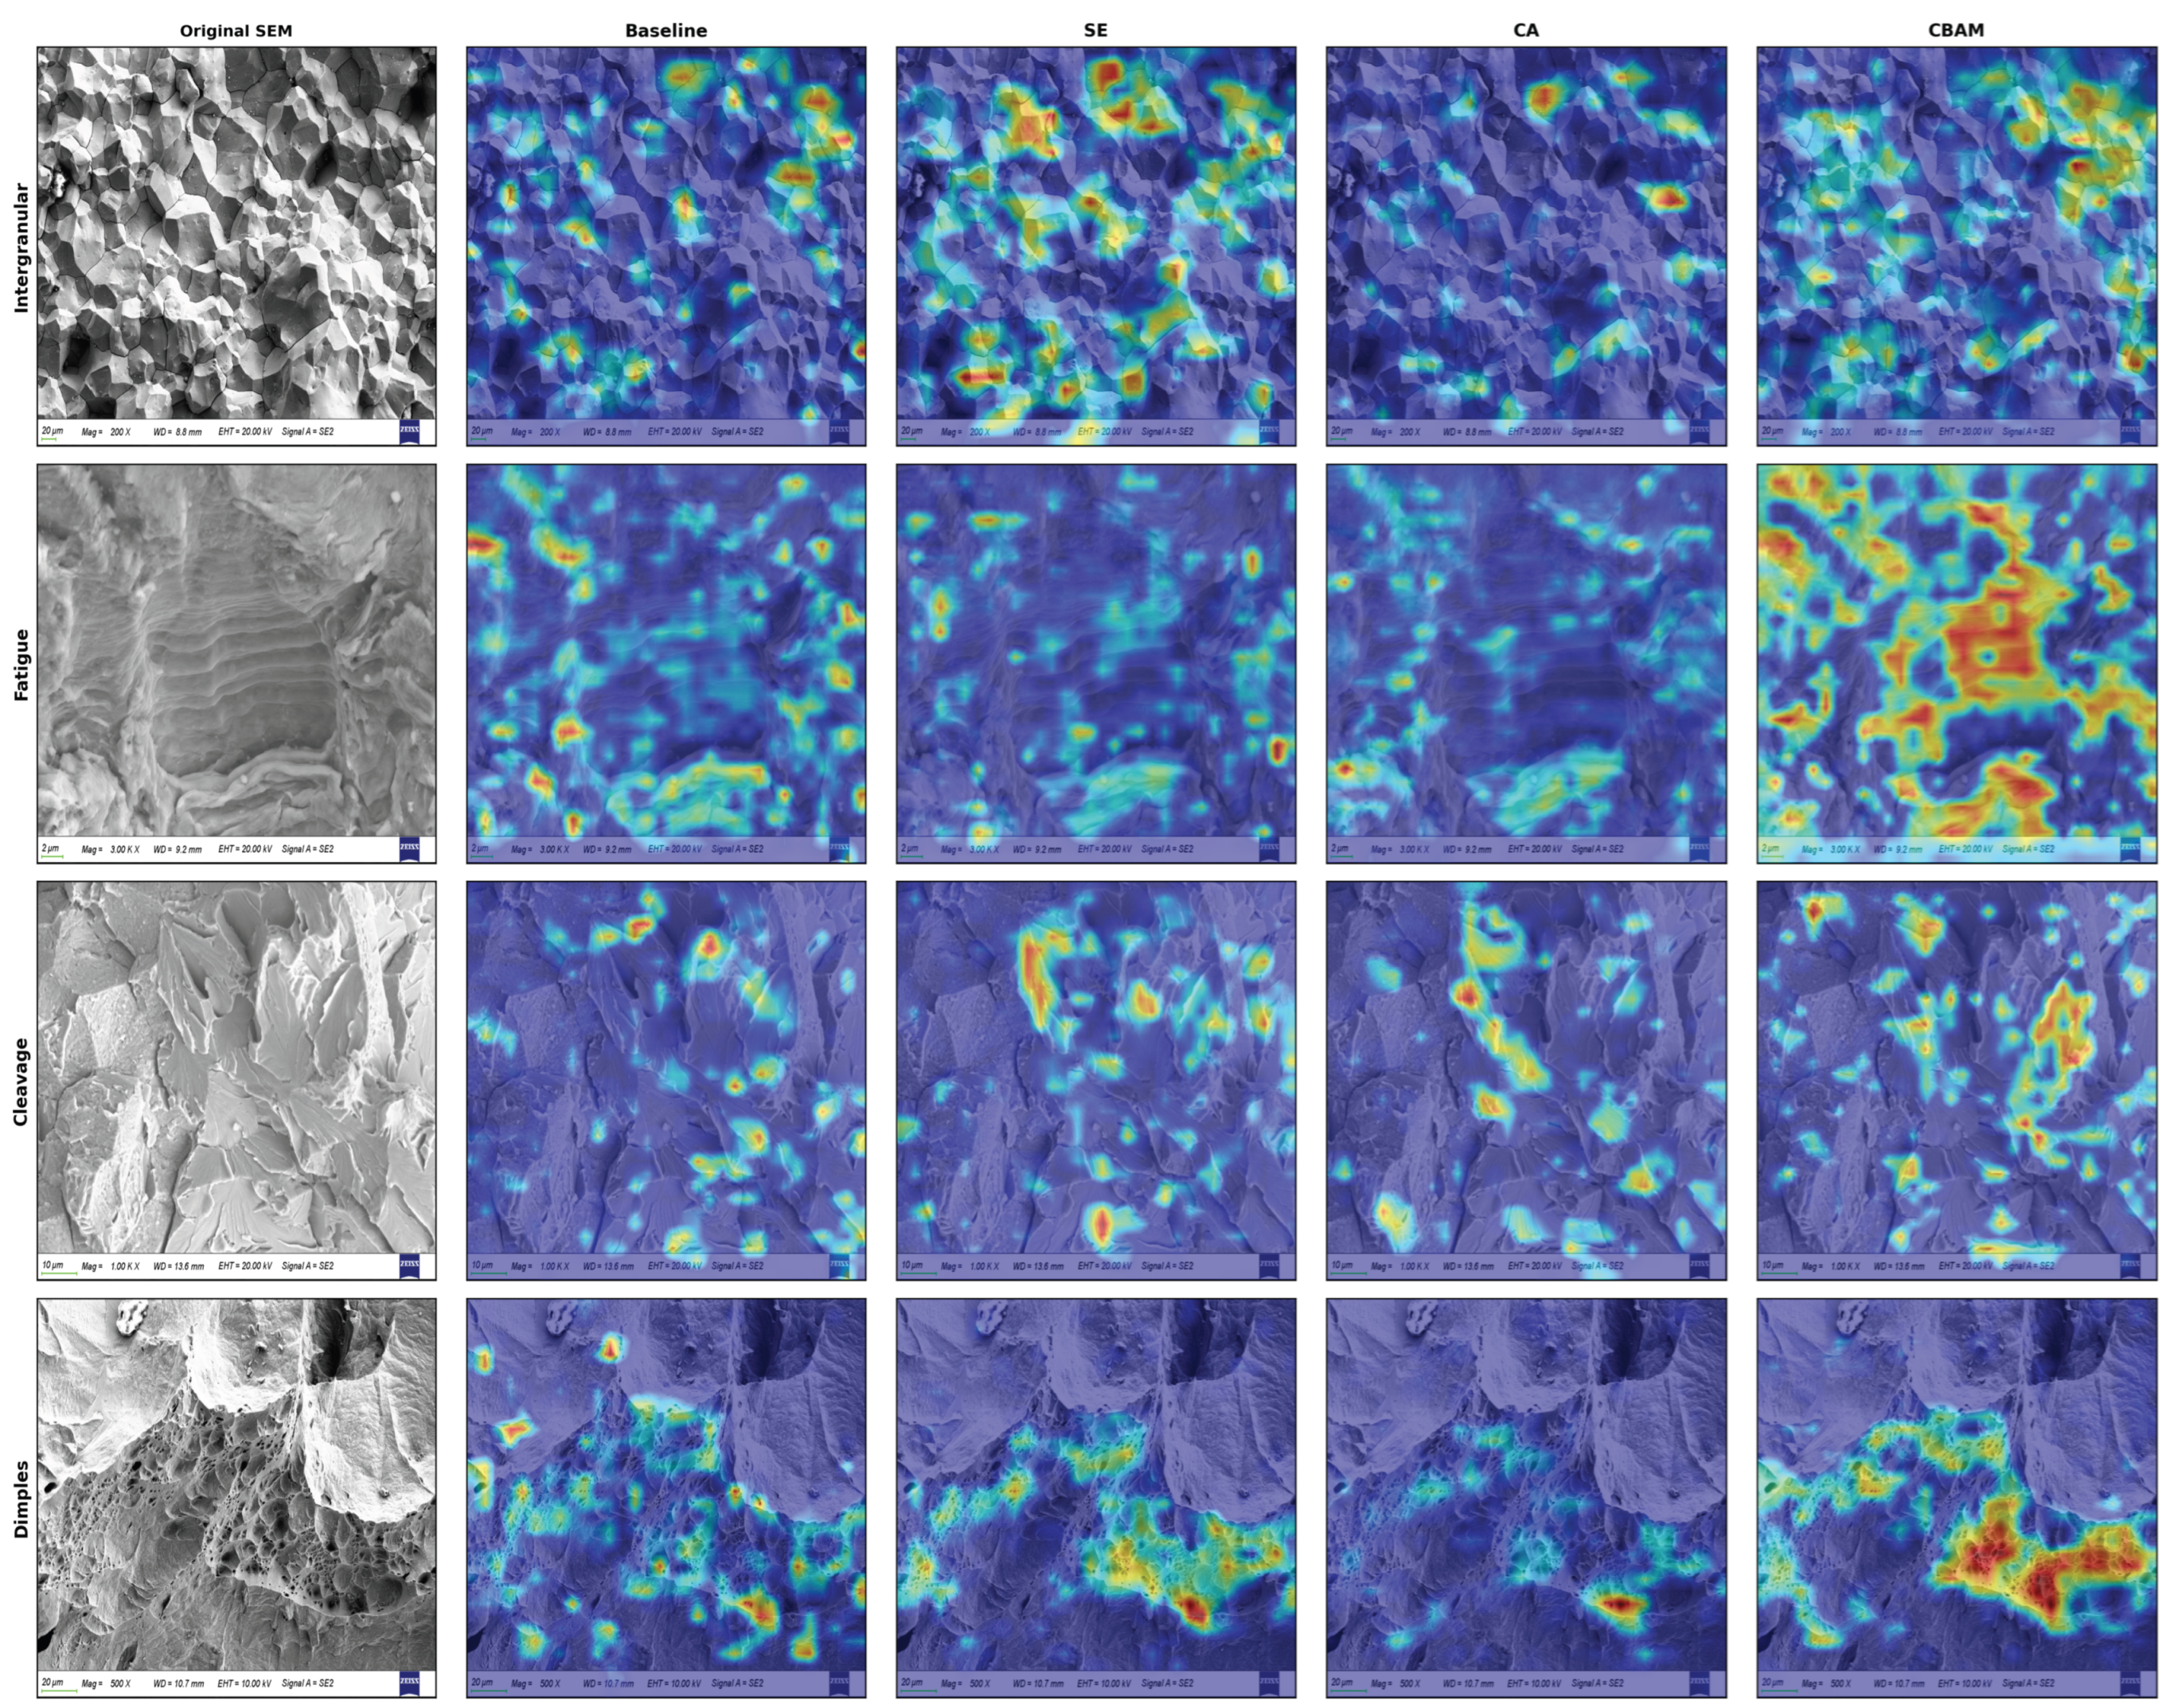
Figure 6 presents the Grad-CAM visualization results for the baseline, SE, CA, and CBAM models on intergranular, fatigue, cleavage, and dimple fracture-surface images. Red and yellow regions indicate areas that contribute more strongly to the current class prediction, while blue regions indicate relatively low responses. The different models showed visible differences in response range and spatial concentration. In some representative images, the high-response regions showed a certain visual correspondence with typical fracture-surface morphologies. However, because no expert-annotated regions or quantitative overlap metrics were used in the present study, this correspondence should be interpreted qualitatively rather than as evidence that the model has accurately localized physically meaningful fracture features.
Figure 6.
Grad-CAM visualization results of the baseline, SE, CA, and CBAM models for the four SEM fracture categories.
For intergranular fracture, the high-response regions of the baseline were relatively scattered, with some activations appearing inside grains and along image edges. This indicates that although the model can use local grayscale and texture information to complete classification, its attention range lacks clear structural selectivity. After SE enhanced some texture features through channel attention, the coverage of high-response regions expanded, but the distribution remained scattered across multiple points. After CA introduced positional information, the response regions were relatively concentrated at some grain-boundary intersections, but the overall coverage was small. In contrast, CBAM formed a relatively continuous response distribution along multiple grain boundaries and grain-boundary connection regions, showing a certain correspondence with the morphological feature that cracks propagate along grain boundaries in intergranular fracture.
For fatigue fracture, the high-response regions of the baseline, SE, and CA were mainly concentrated at local high-contrast positions, with weak continuous coverage of striation regions. CBAM had a relatively broader response range, covering striated textures and their surrounding regions simultaneously and showing a certain directional continuity. This suggests that joint channel and spatial reweighting may help the model comprehensively use the direction, spacing, and neighboring crack morphology of fatigue striations, rather than relying only on a few local bright spots or high-grayscale regions.
For cleavage fracture, the activation regions of the baseline were relatively scattered and mainly distributed at local edges and abrupt grayscale changes; SE produced strong responses to some cleavage-plane edges, but the spatial distribution remained discontinuous; and CA tended to focus on a small number of steps or tear ridges with obvious positional features. The high-response regions of CBAM were distributed around multiple sheet-like cleavage planes and their boundaries, showing strong responses to the combined structures of cleavage steps, river-like textures, and adjacent cleavage planes. This phenomenon indicates that adjusting only channel responses or introducing only positional information may be insufficient to simultaneously describe the local texture and spatial combination relationships of cleavage morphology, whereas joint channel-spatial attention is more conducive to forming a relatively complete regional representation.
For dimple fracture, all four models produced certain responses to pore-dense regions, but their attention patterns differed. The response of the baseline was relatively scattered and included some non-primary regions; the high-response regions of SE and CA were mainly concentrated around local pore edges; and CBAM formed a wider and relatively continuous response in the dimple-dense region while simultaneously covering some pore edges and pore-clustering areas. This response pattern is relatively consistent with the characteristic that dimple fractures are discriminated based on pore shape, size, and spatial distribution.
From the mechanisms of the different attention modules, the baseline does not explicitly filter feature responses and can easily activate local textures that are both related and unrelated to the fracture class. SE mainly adjusts feature strength along the channel dimension and can highlight effective texture channels, but it lacks direct constraints on spatial position, so high-response regions may still be relatively scattered. CA embeds positional information into channel encoding, which helps preserve directional and coordinate information, but its attention representation mainly unfolds along horizontal and vertical directions and remains limited in jointly describing complex two-dimensional morphology regions. CBAM sequentially performs channel attention and spatial attention: it first selects feature channels related to classification and then redistributes response regions according to spatial position. Overall, CBAM tends to produce more concentrated or continuous activation patterns in regions that visually overlap with grain-boundary-like structures, striated textures, cleavage-plane-like regions, and dimple-dense areas in the representative examples examined. These observations provide qualitative interpretability for the classification behavior of the model. However, because the high-response regions were not compared with expert-annotated regions using quantitative metrics, the Grad-CAM results should not be regarded as direct evidence that the model accurately identifies physically relevant fracture features.
The above visualization results provide two implications for future research. First, the discriminative information in SEM fracture-surface images is often not an isolated texture point, but is jointly composed of local texture, morphological boundaries, and spatial distribution. Future model designs may further consider multi-scale spatial attention, local-region guidance, or morphology-prior constraints to enhance joint representation of fracture-surface features at different scales. Second, the high-response regions from Grad-CAM can be quantitatively compared with grain-boundary, striation, dimple, or cleavage-plane regions annotated by materials experts, using metrics such as intersection over union, regional overlap rate, or directional evaluation indices to examine the consistency between model-attended regions and expert criteria. On this basis, region-level detection, multi-label classification, and mixed fracture morphology recognition can be further developed [35,36], enabling the model to gradually expand from whole-image class judgment to local fracture-feature localization and assisted analysis of fracture mechanisms.
4. Conclusions
This study addressed three practical challenges in the preliminary classification of representative scanning electron microscopy (SEM) fracture-surface images: interference from non-fractographic image information, confusion among subtle and localized fracture morphologies, and the need for an efficient lightweight model for batch image analysis. The main findings are summarized as follows.
First, SEM images accumulated from material failure analysis, fracture-surface examination, and related research projects were systematically collected and organized to construct a four-class dataset comprising cleavage, fatigue, dimple, and intergranular fracture morphologies, with a total of 1865 images. Considering that SEM fracture-surface images are primarily characterized by grayscale textures, weak-contrast structures, and edge contours, a dedicated preprocessing workflow was designed, including the removal of invalid borders and scale-bar regions, grayscale-range standardization, local contrast enhancement, and differentiated three-channel construction. This strategy enabled the network to simultaneously capture global grayscale texture, local intensity variation, and edge-contour information.
Second, based on the You Only Look Once version 8 (YOLOv8) classification framework, the convolutional block attention module (CBAM) was selectively introduced into the middle- and high-level feature stages P3/8, P4/16, and P5/32 to construct C2f_CBAM feature-extraction modules. These modules reweight fused features through channel and spatial attention while preserving the ability of shallow C2f modules to extract basic edges and local textures. Compared with the indiscriminate insertion of attention modules throughout the network, this hierarchical strategy allows CBAM to operate primarily on feature maps with larger receptive fields and greater morphological abstraction, thereby strengthening the representation of local fracture-surface patterns such as fatigue striations, grain-boundary contours, dimple edges, and cleavage steps.
Third, comparative experiments were conducted using YOLO-series models, different attention mechanisms, ResNet architectures, and ImageNet-pretrained convolutional neural network (CNN) baselines. At an input resolution of 1024, YOLOv8n-CBAM achieved a test Top-1 accuracy of 97.92%, a macro-averaged F1-score (Macro-F1) of 0.9787, a parameter count of 1.53 M, and an inference speed of 96.5 frames per second (FPS). Its parameter count was approximately 1/29 that of ResNet-101, which also yielded a rounded Top-1 accuracy of 97.92% on the current test set. However, because these results were obtained from a relatively small test set and were not supported by repeated-run statistical analysis, they should not be interpreted as evidence of statistically equivalent performance. Compared with InceptionV3 and MobileNetV2, the proposed model maintained high classification accuracy with a smaller parameter scale, indicating a favorable balance between classification performance and model complexity. These findings should therefore be interpreted as performance observed under the current dataset and experimental configuration rather than as evidence of robustness to unseen imaging devices, material batches, or substantially different acquisition conditions.
Finally, gradient-weighted class activation mapping (Grad-CAM) visualization revealed differences in response range and spatial distribution among the baseline, squeeze-and-excitation (SE), coordinate attention (CA), and CBAM models. Compared with the other models, CBAM exhibited relatively continuous responses along grain-boundary connection regions in some intergranular-fracture images, broader coverage of striated textures in fatigue images, and stronger responses to sheet-like cleavage planes and pore-dense regions in cleavage and dimple images, respectively. These observations suggest that joint channel-spatial reweighting may alter the spatial distribution of model responses and generate activation patterns that show qualitative correspondence with representative fracture-surface morphologies. However, this interpretation remains qualitative and does not constitute quantitative evidence that the model attends to the same regions considered relevant by fractography experts.
From an engineering perspective, YOLOv8n-CBAM combines a small parameter count, high inference speed, and a simple whole-image classification workflow. It can therefore be used as an auxiliary tool for batch preliminary screening and the class prompting of large numbers of SEM fracture-surface images, helping analysts rapidly identify images that require focused review. The proposed method should be regarded as an image-level screening tool rather than a complete system for determining fracture mechanisms in heterogeneous fracture surfaces. At present, it is most applicable to representative SEM fracture-surface images acquired under conditions similar to those of the current dataset. Its applicability to mixed fracture morphologies, other alloy systems, different SEM devices, and substantially different imaging conditions remains to be established.
The present results demonstrate the feasibility of the proposed method under the current dataset and experimental conditions. However, the model has not been evaluated using an independent external dataset, and its robustness to variations in noise, contrast, brightness, resolution, SEM magnification, microscope type, and material batch has not been systematically assessed. Therefore, its generalization performance under substantially different acquisition conditions remains unverified, and the current findings should not be interpreted as evidence of general performance on arbitrary unseen data. Although the dataset contained 1865 SEM images collected from actual failure-analysis cases, its overall scale remains relatively limited for deep-learning-based classification, and the relatively small test set of 96 images represents an additional limitation. Future work will expand the number of independent specimens and include repeated evaluations, confidence-interval analysis, and cross-validation to more rigorously assess statistical stability and generalization performance. Independent external validation will also be conducted using images acquired with different SEM devices, from different material batches, and under different imaging conditions, together with controlled robustness tests under varying acquisition conditions. In addition, the present image-level classification framework will be extended toward region-level fracture-feature detection and semantic segmentation. By identifying and segmenting different fracture morphologies within the same fracture surface, the spatial area fraction of each morphology can be quantitatively estimated, forming a progressive technical route from image classification to local detection/segmentation and ultimately to quantitative morphology-fraction analysis. Future work will also refine the label hierarchy to include quasi-cleavage, quasi-ductile fracture, fatigue crack-growth regions, and fatigue modes under different loading conditions, including high-cycle and low-cycle fatigue. Surface orientation and projection dependence will also be investigated through controlled specimen-tilting or multi-view SEM imaging, with the aim of evaluating robustness to different observation directions and exploring multi-view feature fusion for more comprehensive three-dimensional fracture-surface characterization.
Author Contributions
Conceptualization, Z.L.; Methodology, Z.L. and P.W.; Validation, Z.L. and P.W.; Formal Analysis, P.W.; Investigation, Z.L. and P.W.; Resources, Z.C.; Data Curation, X.C.; Writing—Original Draft Preparation, Z.L.; Writing—Review and Editing, Q.P. and X.L.; Visualization, X.C.; Project Administration, X.L.; Funding Acquisition, X.L. All authors have read and agreed to the published version of the manuscript.
Funding
This research was funded by the Special Project for High-Quality Development of the Ministry of Industry and Information Technology (Grant No. CEIEC-2025-ZM02-0020).
Data Availability Statement
Restrictions apply to the datasets. The datasets presented in this article are not readily available because the data are part of an ongoing study. Requests to access the datasets should be directed to lizhihui869@163.com.
Conflicts of Interest
The authors declare no conflicts of interest.
Abbreviations
The following abbreviations are used in this manuscript:
| SEM | Scanning Electron Microscopy |
| YOLO/YOLOv8 | You Only Look Once/You Only Look Once version 8 |
| CBAM | Convolutional Block Attention Module |
| CNN | Convolutional Neural Network |
| FPS | Frames Per Second |
| Grad-CAM | Gradient-Weighted Class Activation Mapping |
| GPU | Graphics Processing Unit |
| CUDA | Compute Unified Device Architecture |
| GFLOPs | Giga Floating-Point Operations |
| SE | Squeeze-and-Excitation |
| ECA | Efficient Channel Attention |
| CA | Coordinate Attention |
| Macro-F1 | Macro-Averaged F1-Score |
References
- ASM International. ASM Handbook, Volume 12: Fractography; ASM International: Materials Park, OH, USA, 1987. [Google Scholar]
- Hull, D. Fractography: Observing, Measuring and Interpreting Fracture Surface Topography; Cambridge University Press: Cambridge, UK, 1999. [Google Scholar]
- Anderson, T.L. Fracture Mechanics: Fundamentals and Applications, 4th ed.; CRC Press: Boca Raton, FL, USA, 2017. [Google Scholar]
- Suresh, S. Fatigue of Materials, 2nd ed.; Cambridge University Press: Cambridge, UK, 1998. [Google Scholar]
- Goldstein, J.I.; Newbury, D.E.; Michael, J.R.; Ritchie, N.W.M.; Scott, J.H.J.; Joy, D.C. Scanning Electron Microscopy and X-Ray Microanalysis, 4th ed.; Springer: New York, NY, USA, 2018. [Google Scholar]
- Pantazopoulos, G.A. A Short Review on Fracture Mechanisms of Mechanical Components Operated under Industrial Process Conditions: Fractographic Analysis. Metals 2019, 9, 148. [Google Scholar] [CrossRef] [Scilit]
- Callister, W.D.; Rethwisch, D.G. Materials Science and Engineering: An Introduction, 10th ed.; Wiley: Hoboken, NJ, USA, 2018. [Google Scholar]
- Broek, D. Elementary Engineering Fracture Mechanics, 4th ed.; Martinus Nijhoff: Dordrecht, The Netherlands, 1986. [Google Scholar]
- LeCun, Y.; Bengio, Y.; Hinton, G. Deep learning. Nature 2015, 521, 436–444. [Google Scholar] [CrossRef] [Scilit] [PubMed]
- Goodfellow, I.; Bengio, Y.; Courville, A. Deep Learning; MIT Press: Cambridge, MA, USA, 2016. [Google Scholar]
- Dosovitskiy, A.; Beyer, L.; Kolesnikov, A.; Weissenborn, D.; Zhai, X.; Unterthiner, T.; Dehghani, M.; Minderer, M.; Heigold, G.; Gelly, S.; et al. An Image is Worth 16 × 16 Words: Transformers for Image Recognition at Scale. In Proceedings of the International Conference on Learning Representations, Vienna, Austria, 3–7 May 2021. [Google Scholar]
- Azimi, S.M.; Britz, D.; Engstler, M.; Fritz, M.; Muecklich, F. Advanced Steel Microstructural Classification by Deep Learning Methods. Sci. Rep. 2018, 8, 2128. [Google Scholar] [CrossRef] [Scilit] [PubMed]
- DeCost, B.L.; Francis, T.; Holm, E.A. Exploring the microstructure manifold: Image texture representations applied to ultrahigh carbon steel microstructures. Acta Mater. 2017, 133, 30–40. [Google Scholar] [CrossRef] [Scilit]
- Chowdhury, A.; Kautz, E.; Yener, B.; Lewis, D. Image driven machine learning methods for microstructure recognition. Comput. Mater. Sci. 2016, 123, 176–187. [Google Scholar] [CrossRef] [Scilit]
- Bostanabad, R.; Zhang, Y.; Li, X.; Kearney, T.; Brinson, L.C.; Apley, D.W.; Liu, W.K.; Chen, W. Computational microstructure characterization and reconstruction: Review of the state-of-the-art techniques. Prog. Mater. Sci. 2018, 95, 1–41. [Google Scholar] [CrossRef] [Scilit]
- Butler, K.T.; Davies, D.W.; Cartwright, H.; Isayev, O.; Walsh, A. Machine learning for molecular and materials science. Nature 2018, 559, 547–555. [Google Scholar] [CrossRef] [Scilit] [PubMed]
- Wei, J.; Chu, X.; Sun, X.Y.; Xu, K.; Deng, H.X.; Chen, J.; Wei, Z.; Lei, M. Machine learning in materials science. InfoMat 2019, 1, 338–358. [Google Scholar] [CrossRef] [Scilit]
- Woo, S.; Park, J.; Lee, J.Y.; Kweon, I.S. CBAM: Convolutional Block Attention Module. In Proceedings of the European Conference on Computer Vision, Munich, Germany, 8–14 September 2018; pp. 3–19. [Google Scholar] [CrossRef] [Scilit]
- Otsu, N. A threshold selection method from gray-level histograms. IEEE Trans. Syst. Man Cybern. 1979, 9, 62–66. [Google Scholar] [CrossRef] [Scilit]
- Zuiderveld, K. Contrast Limited Adaptive Histogram Equalization. In Graphics Gems IV; Heckbert, P.S., Ed.; Academic Press: San Diego, CA, USA, 1994; pp. 474–485. [Google Scholar]
- Buades, A.; Coll, B.; Morel, J.M. A non-local algorithm for image denoising. In Proceedings of the IEEE Computer Society Conference on Computer Vision and Pattern Recognition, San Diego, CA, USA, 20–26 June 2005; pp. 60–65. [Google Scholar] [CrossRef] [Scilit]
- He, K.; Zhang, X.; Ren, S.; Sun, J. Deep Residual Learning for Image Recognition. In Proceedings of the IEEE Conference on Computer Vision and Pattern Recognition, Las Vegas, NV, USA, 27–30 June 2016; pp. 770–778. [Google Scholar] [CrossRef] [Scilit]
- Szegedy, C.; Vanhoucke, V.; Ioffe, S.; Shlens, J.; Wojna, Z. Rethinking the Inception Architecture for Computer Vision. In Proceedings of the IEEE Conference on Computer Vision and Pattern Recognition, Las Vegas, NV, USA, 27–30 June 2016; pp. 2818–2826. [Google Scholar] [CrossRef] [Scilit]
- Tan, M.; Le, Q. EfficientNet: Rethinking Model Scaling for Convolutional Neural Networks. In Proceedings of the International Conference on Machine Learning, Long Beach, CA, USA, 9–15 June 2019; pp. 6105–6114. [Google Scholar]
- Howard, A.; Sandler, M.; Chu, G.; Chen, L.C.; Chen, B.; Tan, M.; Wang, W.; Zhu, Y.; Pang, R.; Vasudevan, V.; et al. Searching for MobileNetV3. In Proceedings of the IEEE/CVF International Conference on Computer Vision, Seoul, Republic of Korea, 29 October–1 November 2019; pp. 1314–1324. [Google Scholar] [CrossRef] [Scilit]
- Redmon, J.; Divvala, S.; Girshick, R.; Farhadi, A. You Only Look Once: Unified, Real-Time Object Detection. In Proceedings of the IEEE Conference on Computer Vision and Pattern Recognition, Las Vegas, NV, USA, 27–30 June 2016; pp. 779–788. [Google Scholar] [CrossRef] [Scilit]
- Redmon, J.; Farhadi, A. YOLO9000: Better, Faster, Stronger. In Proceedings of the IEEE Conference on Computer Vision and Pattern Recognition, Honolulu, HI, USA, 21–26 July 2017; pp. 7263–7271. [Google Scholar] [CrossRef] [Scilit]
- Bochkovskiy, A.; Wang, C.Y.; Liao, H.Y.M. YOLOv4: Optimal Speed and Accuracy of Object Detection. arXiv 2020, arXiv:2004.10934. [Google Scholar]
- Wang, C.Y.; Bochkovskiy, A.; Liao, H.Y.M. YOLOv7: Trainable bag-of-freebies sets new state-of-the-art for real-time object detectors. In Proceedings of the IEEE/CVF Conference on Computer Vision and Pattern Recognition, Vancouver, BC, Canada, 18–22 June 2023; pp. 7464–7475. [Google Scholar] [CrossRef] [Scilit]
- Jocher, G.; Chaurasia, A.; Qiu, J. Ultralytics YOLOv8. Available online: https://github.com/ultralytics/ultralytics (accessed on 6 July 2026).
- Selvaraju, R.R.; Cogswell, M.; Das, A.; Vedantam, R.; Parikh, D.; Batra, D. Grad-CAM: Visual Explanations from Deep Networks via Gradient-Based Localization. In Proceedings of the IEEE International Conference on Computer Vision, Venice, Italy, 22–29 October 2017; pp. 618–626. [Google Scholar] [CrossRef] [Scilit]
- Hu, J.; Shen, L.; Sun, G. Squeeze-and-Excitation Networks. In Proceedings of the IEEE Conference on Computer Vision and Pattern Recognition, Salt Lake City, UT, USA, 18–22 June 2018; pp. 7132–7141. [Google Scholar] [CrossRef] [Scilit]
- Wang, Q.; Wu, B.; Zhu, P.; Li, P.; Zuo, W.; Hu, Q. ECA-Net: Efficient Channel Attention for Deep Convolutional Neural Networks. In Proceedings of the IEEE/CVF Conference on Computer Vision and Pattern Recognition, Seattle, WA, USA, 13–19 June 2020; pp. 11534–11542. [Google Scholar] [CrossRef] [Scilit]
- Hou, Q.; Zhou, D.; Feng, J. Coordinate Attention for Efficient Mobile Network Design. In Proceedings of the IEEE/CVF Conference on Computer Vision and Pattern Recognition, Nashville, TN, USA, 20–25 June 2021; pp. 13713–13722. [Google Scholar] [CrossRef] [Scilit]
- Ronneberger, O.; Fischer, P.; Brox, T. U-Net: Convolutional Networks for Biomedical Image Segmentation. In Proceedings of the Medical Image Computing and Computer-Assisted Intervention, Munich, Germany, 5–9 October 2015; pp. 234–241. [Google Scholar] [CrossRef] [Scilit]
- Sinha, A.; Suresh, K.S. Deep Learning Based Dimple Segmentation for Quantitative Fractography. arXiv 2020, arXiv:2007.02267. [Google Scholar]

Disclaimer/Publisher’s Note: The statements, opinions and data contained in all publications are solely those of the individual author(s) and contributor(s) and not of MDPI and/or the editor(s). MDPI and/or the editor(s) disclaim responsibility for any injury to people or property resulting from any ideas, methods, instructions or products referred to in the content. |
© 2026 by the authors. Licensee MDPI, Basel, Switzerland. This article is an open access article distributed under the terms and conditions of the Creative Commons Attribution (CC BY) license.