


Abstract
Many materials can be cleaved to produce ideal atomically flat surfaces. However, for many perovskite oxides it was observed that a well-defined concentration of adatoms remains on one of the crack surfaces, mirrored by an equivalent amount of vacancies on the other side, even though this violates the charge neutrality of the created surfaces. In this work, we show for three prototypical oxide perovskites, SrTiO3, BaTiO3, and KTaO3, that these materials develop a large dielectric polarization by ferroelectric displacements of the atoms under the large strain at the crack tip. Upon fracture, the polarization creates a surface charge on the emerging surfaces, which is maintained by the transfer of ions between the crack surfaces and the formation of adatoms and vacancies. By quantifying the strain-induced ferroelectric atomic displacements at the point of fracture using density-functional theory calculations, we find a very good agreement between the surface charge from the evolving polarization and the experimentally observed concentration of adatoms, which are therefore a remnant of the cleaving process. When predicting results of fracture experiments, this strain-induced ferroelectric transition developing during fracture has to be taken into account even for oxide perovskites that are not intrinsically ferroelectric at room temperature.
1. Introduction
The material family of perovskite oxides, with the general formula ABO3, has garnered substantial attention in recent years due to its versatility. The high tunability of their physical and chemical properties makes them highly suitable for catalytic applications like water splitting [1,2,3,4], as well as for electron-transporting and light-absorbing layers in solar cells [5,6,7]. Most of these applications depend on the structure of their surfaces and the terminating layers at interfaces. Even though the ternary perovskites allow for many different surface terminations, most experimental and theoretical studies use a (1 × 1) bulk-terminated surface. These surfaces are most commonly prepared using a combination of etching and subsequent annealing in order to remove adsorbates [8,9,10]. However, wet chemical preparation procedures can also lead to amorphous surface phases [11] as well as unintentional doping [12].
Cleaving a bulk crystal under ultra-high vacuum (UHV) conditions offers another way of realizing a pristine surface, ensuring adsorbate-free surfaces as long as the material has a natural cleavage plane [13]. While this is not generally the case for perovskite oxides, Guisinger et al. [14] have shown that it is still possible when extra care is taken during the fracture process. Multiple groups have since successfully generated as-cleaved surfaces suitable for STM and AFM measurements [15,16,17,18,19]. When cleaving the cubic perovskite oxide SrTiO3, Sokolović et al. [17,18,19] found a well-defined concentration of % Sr2+ adatoms and Sr2+ vacancies on mirroring positions on the (001) surfaces of the as-cleaved crystal. They propose that the strain along the [001]-direction during the fracture process sufficiently elongates the c-axis to allow for a ferroelectric phase transition. This in turn would induce a dielectric polarization perpendicular to the surface, leading to a surface charge on the as-cleaved surface, which is compensated by the formation of the aforementioned adatom and vacancy point defects. Though plausible, this hypothesis has not yet been tested quantitatively, and it remains unclear whether the strain-induced polarization is large enough to account for the experimentally observed adatom and vacancy concentration.
This paper investigates the strain-induced spontaneous dielectric polarization of perovskite oxides during fracture computationally using first-principles density-functional theory (DFT) calculations. To this end, we focus on three representatives of the class of perovskite oxides: the cubic SrTiO3, the ferroelectric BaTiO3 with a tetragonal structure at room temperature, and the cubic polar KTaO3 with charged (001) planes. We first derive an estimate of the strain experienced by the crystal at the crack tip at the point of fracture. Then, we investigate the structural changes in the crystal unit cell due to the strain and determine the dielectric polarization using Berry-phase calculations. In the last step, we determine the necessary charge compensation on the as-cleaved surface, which is then compared to the experimentally observed concentration of adatoms and vacancies. We show that this strain-induced polarization cannot be neglected when interpreting the results of fracture experiments, even in perovskite oxides that are not intrinsically ferroelectric at room temperature.
2. Methods
Atomic structures were relaxed using density-functional theory (DFT). The calculations were carried out with the plane-wave code PWScf of the Quantum Espresso (QE) software package version 7.0 [20], utilizing the PBEsol exchange-correlation functional [21,22] and Vanderbilt ultrasoft pseudopotentials [23]. A plane-wave basis set with a kinetic energy cutoff of 30 Ry and a corresponding charge-density cutoff of 120 Ry was used throughout. Structures were considered relaxed once residual forces fell below 5 meV/Å. Monkhorst–Pack k-point grids with a density of (8,8,8) with respect to a primitive cubic perovskite unit cell were chosen throughout the investigation. In the Berry-phase calculations of the induced polarization, the sampling along the direction of the polarization was increased to 20 k-points to ensure rigorous numerical convergence. For calculations in which the cell dimensions were relaxed in addition to the atomic positions, the QE default pressure convergence threshold of 0.5 kbar was chosen. With this setup, we obtained bulk lattice parameters of a = 3.893 Å for cubic SrTiO3, a = 3.962 Å, c = 4.058 Å for the tetragonal phase of BaTiO3, and a = 3.981 Å for cubic KTaO3.
3. Results and Discussion
3.1. Determination of the Maximum Strain
A material fractures once the force acting upon it exceeds a critical threshold. Estimating the critical maximum strain experienced by a crystal during fracture is a challenging problem. Its exact solution requires modeling the atomic details of multiple crack-tip geometries at different loading conditions, since cracks propagate by the breaking of individual chemical bonds between atoms at the tip.
Following the standard classification of Irwin [24], we distinguish Mode I fracture, driven by tensile stress normal to the crack plane, from Mode II fracture, driven by in-plane shear stress. A first estimate for the critical maximum strain can be obtained by using continuum theory. By solving the anisotropic linear elasticity equations, we derive the displacements of the atoms at a crack tip for a given stress intensity factor [25,26,27]. The critical stress intensity factor, at which the material fails, we determine by Griffith’s criterion, which states that a crack propagates when the release of elastic energy upon crack advancement outweighs the energy required to create the two new surfaces [28].
As input for this approach, we only need the elastic constants and the cleavage energy of the crystal for the considered crack orientation [25]. With our DFT setup, we obtain for SrTiO3 values of = 352 GPa, = 105 GPa, and = 113 GPa for the three cubic elastic constants and = 2.29 J m−2 for the cleavage energy along the (001) lattice plane. By using Equation(4.51) of [25] for crystals with cubic symmetry, these values result in a Griffith critical stress intensity factor of = 0.84 MPa for Mode I fracture on the (001) cleavage plane with crack propagation along the [100]-direction and a [010] crack front, which is in very good agreement with recent experimental results [29].
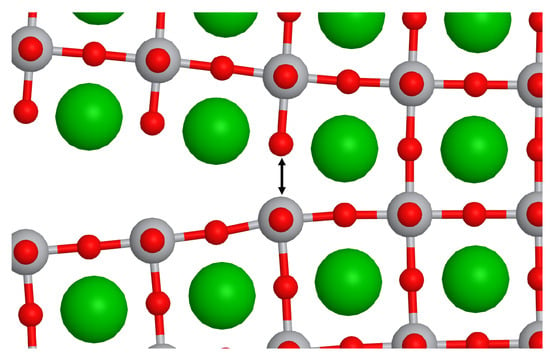
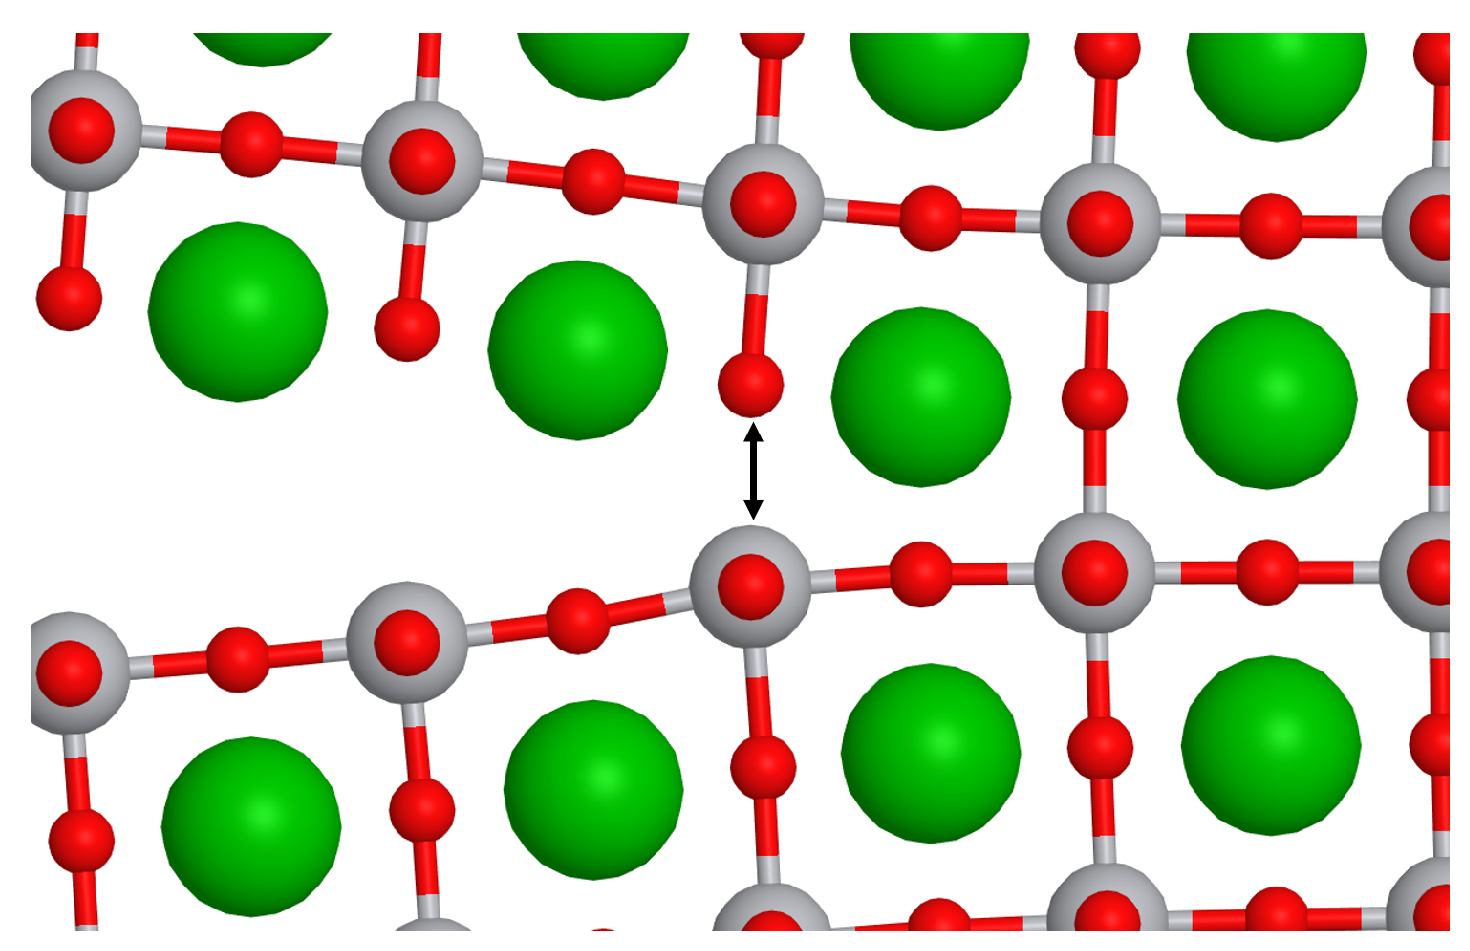
Figure 1 shows the atomic displacements at the crack tip for this crack orientation and the critical stress intensity factor as calculated by anisotropic linear elasticity theory [25,26,27]. The bonds across the cleavage plane are inhomogeneously strained. The largest elongation is observed for the last intact bond marked by a double arrow in Figure 1, and its elongation = 0.403 Å relative to its equilibrium length d = a/2 = 1.947 Å can be interpreted as the critical maximum strain = = 20.6% in the crystal at the point of fracture.
Figure 1.
Atomic displacements for a Mode I crack in SrTiO3 for cleavage along the (001) plane in [100]-direction separating a SrO and a TiO2 layer at the critical stress intensity factor as calculated by anisotropic linear elasticity theory. The center of the strain field is in the middle of the last intact bond marked by the double arrow. Sr, Ti, and O are shown in green, gray, and red, respectively.
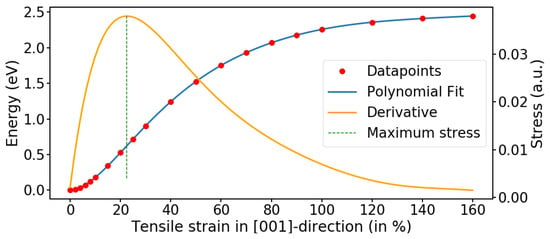
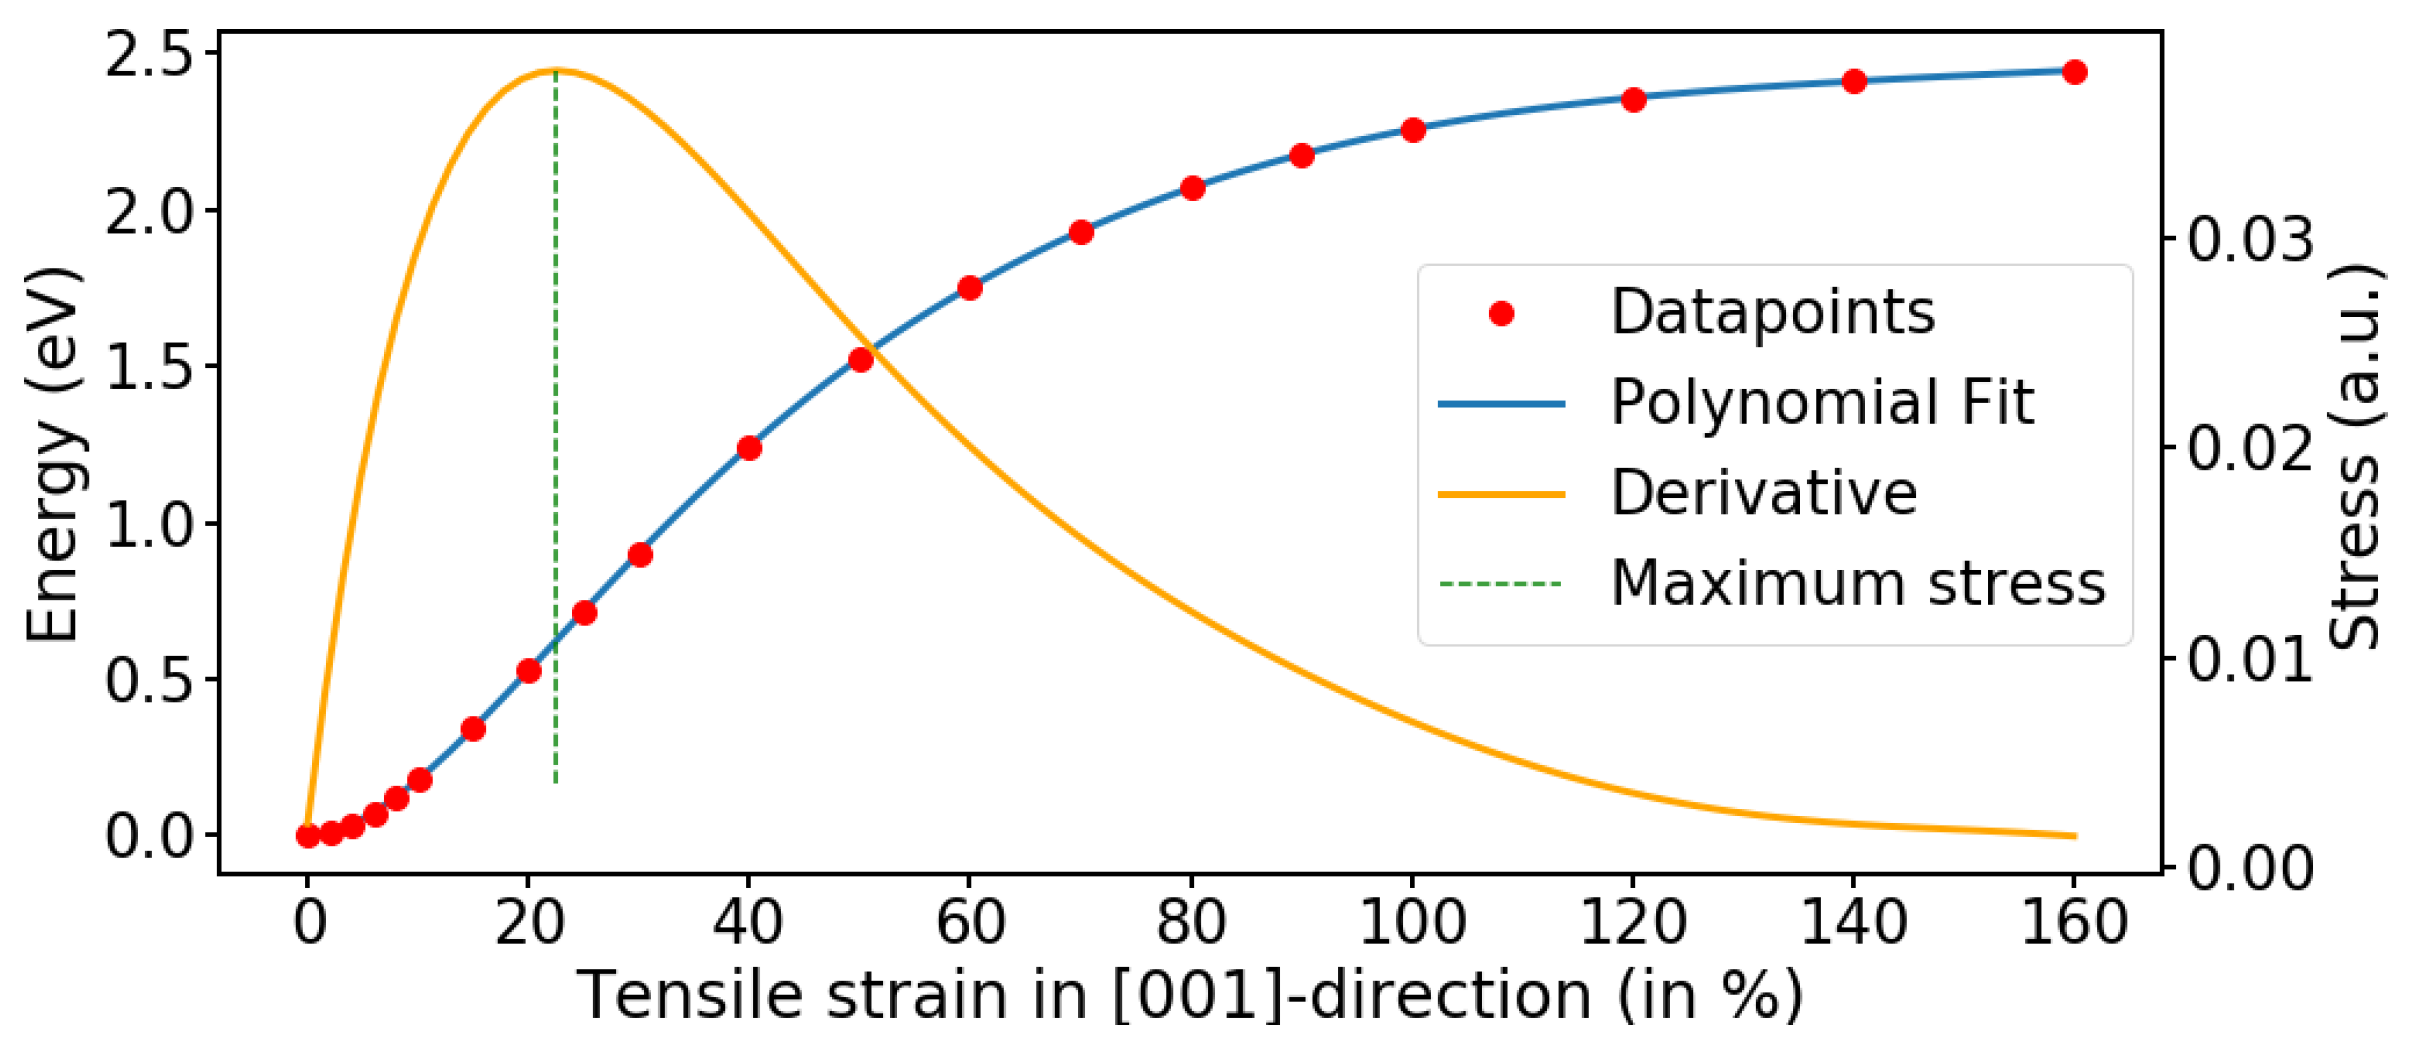
Another way of estimating the critical maximum strain at the point of fracture is by calculating so-called traction–separation or stress–strain curves [30,31]. For Mode I fracture in SrTiO3 and a (001) cleavage plane, the stress–strain curve was determined by calculating the energy of a tetragonal () supercell when incrementally increasing the distance between a SrO and a TiO2 layer along the [001]-direction without relaxation of the atoms. Figure 2 shows the energy change in the supercell with respect to the distance between the two layers given as fraction of the equilibrium distance of d = 1.947 Å. As expected, the energy converges for large layer separations towards the (unrelaxed) (001) cleavage energy of the crystal [32,33]. The derivative of the energy–strain curve gives the stress needed for separating the two layers. The maximum of the stress–strain curve in Figure 2 gives the critical strain, for which we obtain = 22.6%.
Figure 2.
Relative energy and its derivative from static DFT calculations of SrTiO3 with increasing separation of a SrO and a TiO2 layer in the [001]-direction. The critical strain at 22.6% is marked by a vertical dotted line.
This value agrees well with the result of 20.6% obtained by anisotropic linear elasticity continuum theory, showing that despite the different underlying assumptions, both independent approaches converge to a similar order of magnitude for the critical maximum strain at fracture. Since stress–strain curves are much easier to calculate than to evaluate the continuum equations, we use this approach in the following for estimating the critical maximum strains for the other fracture modes and the other materials.
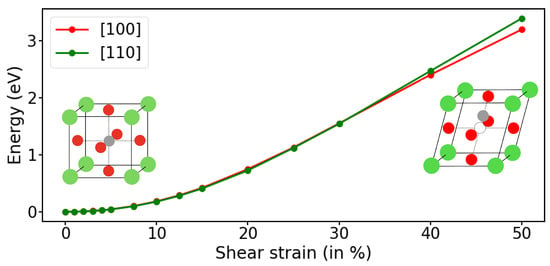
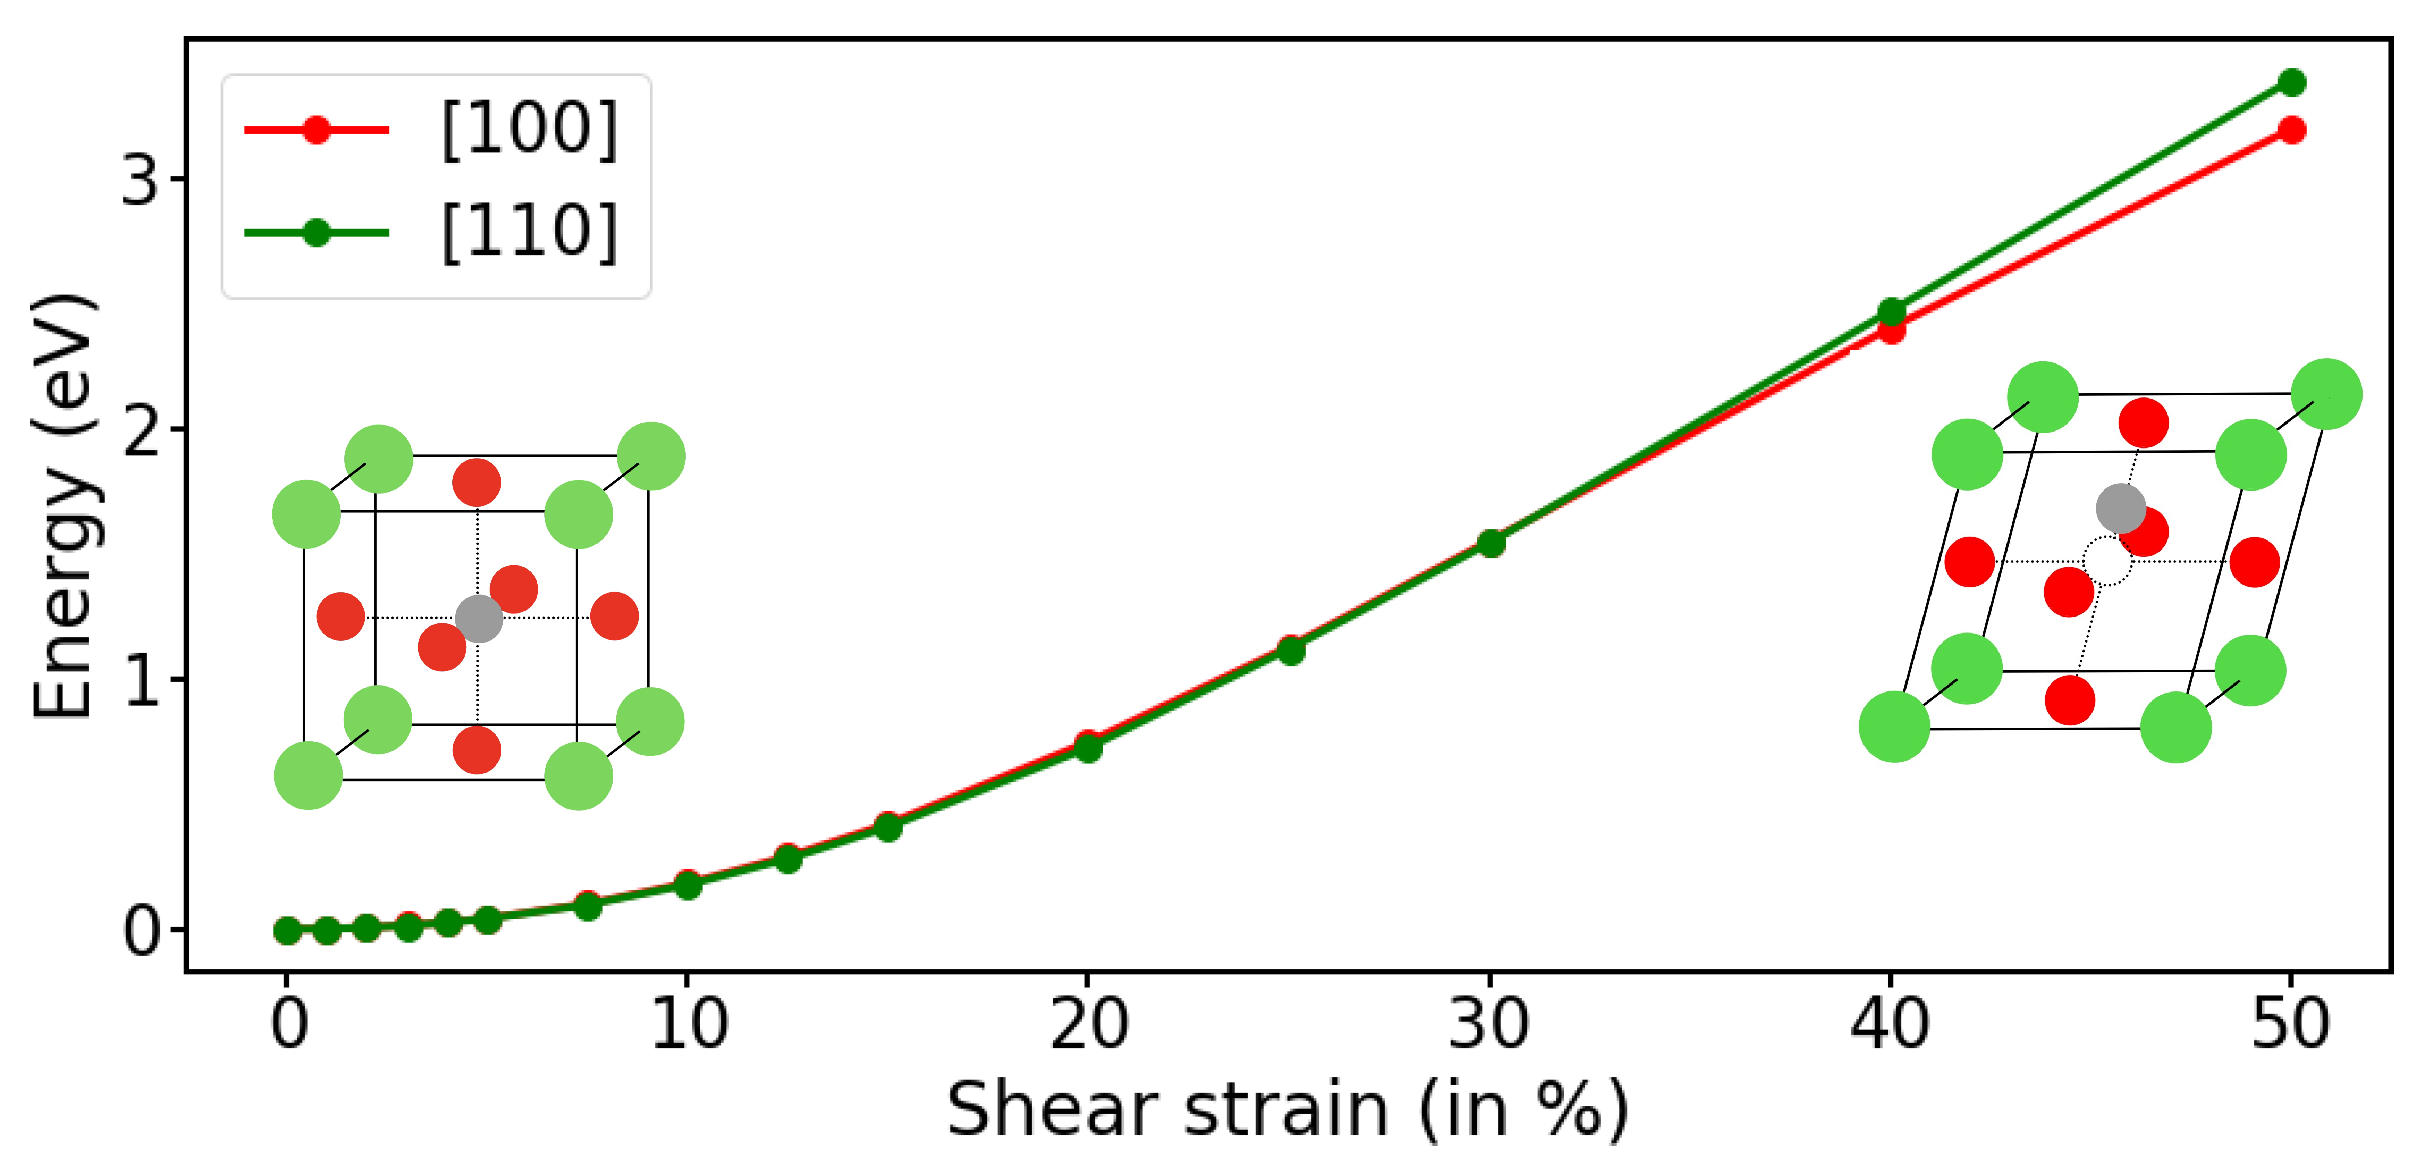
For Mode II fracture, instead of increasing the interlayer distance between two neighboring atomic planes and thereby elongating the supercell along the [001]-direction, the two planes are sheared horizontally either along the [100]- or the [110]-direction. This is done by using the same () tetragonal supercell but now tilting the third supercell vector by adding an x-component (for shear along [100]) or an equal x- and y-component (for shear along [110]), which changes the cell from tetragonal to monoclinic. As before, atoms are not relaxed and all other atomic planes remain in their ideal stacking of the cubic lattice. However, in contrast to Mode I fracture, by shearing two neighboring atomic planes, atoms will come very close to each other, leading to strong electrostatic and Pauli repulsion. The energy of a repulsive sheared configuration can be even larger than the cleavage energy of the crystal, representing two fully separated, non-interacting surfaces. To eliminate this overestimation of the energy, we optimized the separation of the two sheared layers in the [001]-direction. At each shear distance, several calculations for different layer separations were performed and the equilibrium distance at the lowest energy was determined by a polynomial fit to the energy curve.
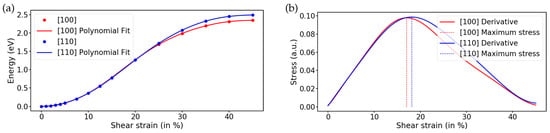
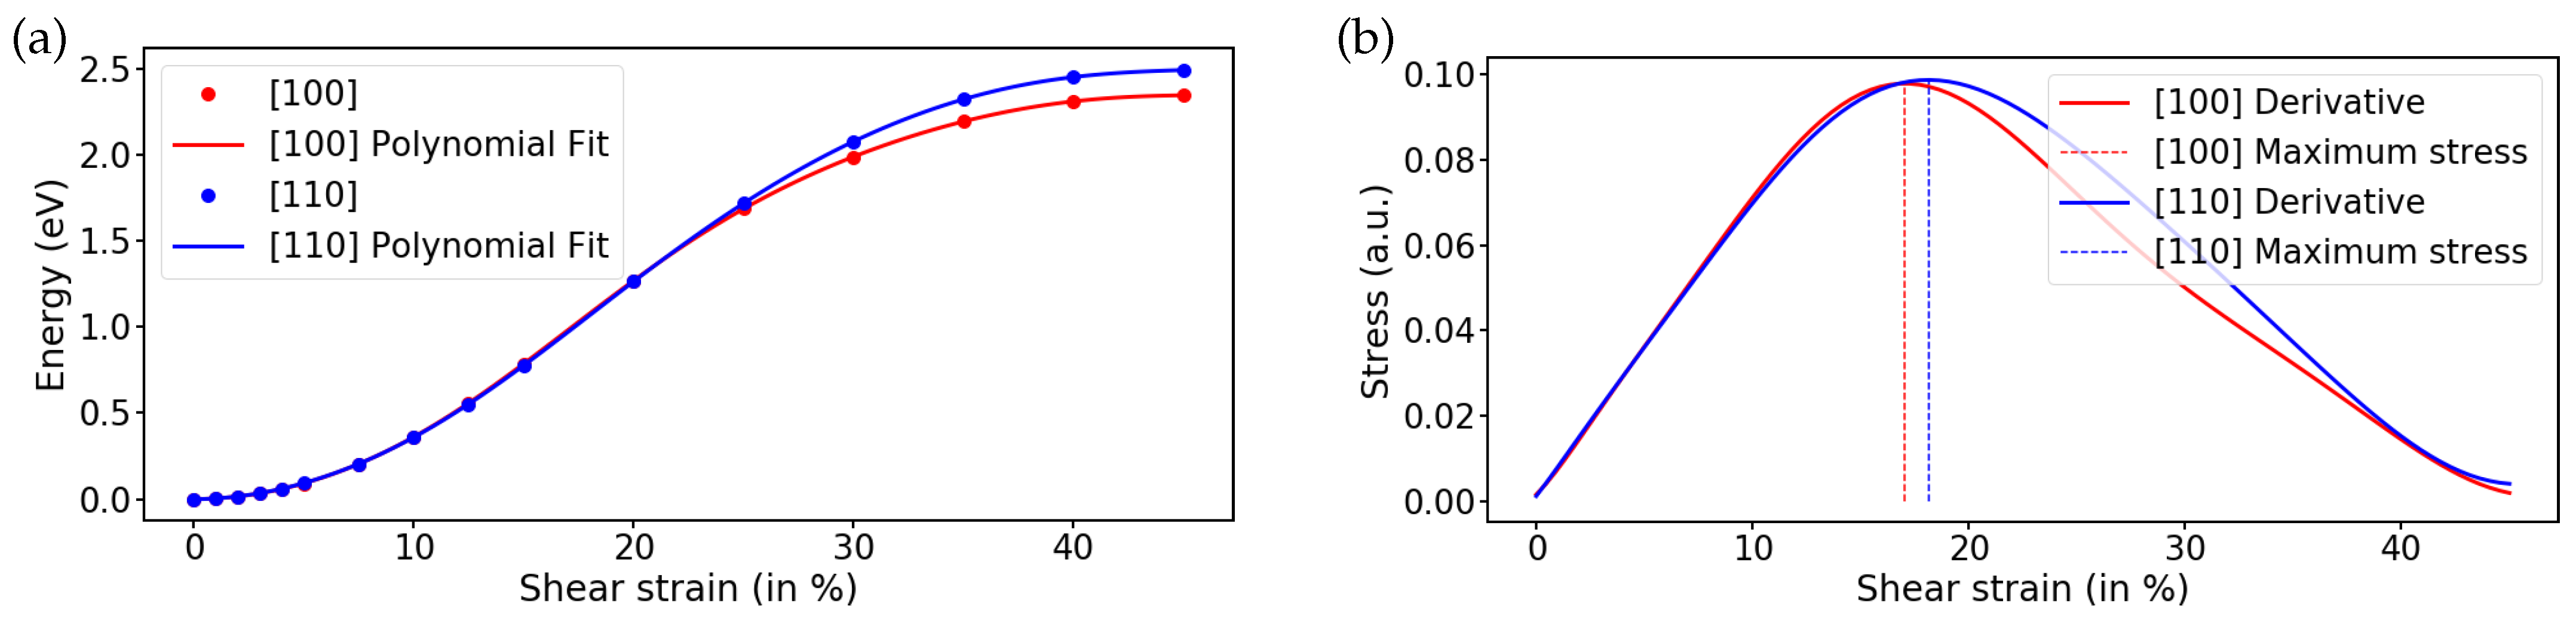
We first consider the case of shear in the [100]-direction. The shear strain = is defined as the ratio of the shear distance in the [100]-direction and the SrTiO3 lattice constant a. At a shear strain of = 100%, the two atomic planes are sheared exactly by one lattice constant and thus identical to the starting position. The energy–strain curve is therefore periodic and has a sinusoidal shape with a maximum at a shear strain of 50%. The calculated energy–strain curve is shown in Figure 3a. At the shear strain of 50% it approaches the cleavage energy of two separated surfaces, indicating that at this shear displacement the interaction between the atomic planes is purely repulsive. The derivative, shown in Figure 3b, yields a maximum stress at the strain value of 17.0%, which we take as the critical maximum strain for shear fracture of the material along the [100]-direction.
Figure 3.
(a) Relative energy from static DFT calculations of SrTiO3 with increasing [100] and [110] shear of a SrO and a TiO2 layer while optimizing the layer separation in [001]-direction. (b) Stress as derivative of the energy. The critical strain is marked by vertical dotted lines.
For the other Mode II shear direction, [110], we decided to define the strain also with respect to the cubic lattice constant a as for the shear in [100]-direction, even though the atomic layers are displaced along the diagonal of the square layer unit cell. Consequently, the sinusoidal energy–strain curve repeats after % and the maximum is at %. This definition of the strain was chosen so that the same strain value represents the same absolute shear distance, hence making comparison between the two shear directions easier. Figure 3 shows the calculated energy–strain curve as well as the derivative, yielding a critical maximum strain of 18.1% at the point of fracture for the [110]-direction.
The calculations were repeated in the same way for BaTiO3, which yields a critical maximum strain of 22.8% for Mode I fracture, and 15.1% and 15.0% for Mode II fracture in the [100]-direction and [110]-direction, respectively. The corresponding energy–strain and stress–strain curves are given in Figures S1 and S2 of the Supplementary Materials.
The estimation of the critical strain for Mode I fracture of KTaO3, however, needs more consideration, since the (001) layers are not charge neutral. KO layers carry a single negative charge, while the TaO2 layers have the opposite formal charge of . Cleavage between a KO and a TaO2 plane would create Tasker-type III surfaces, which are electrostatically unstable [34,35,36]. Consequently, Mode I fracture occurs in such a way that half of the KO layer remains attached to the upper TaO2 layer, while the other half remains attached to the lower TaO2 layer, as demonstrated by recent experiments [16]. In this way, the otherwise emerging polar catastrophe is avoided and the polarity of the created crack surfaces is quenched.
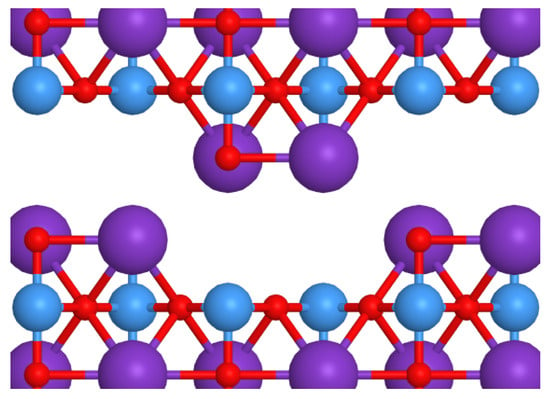
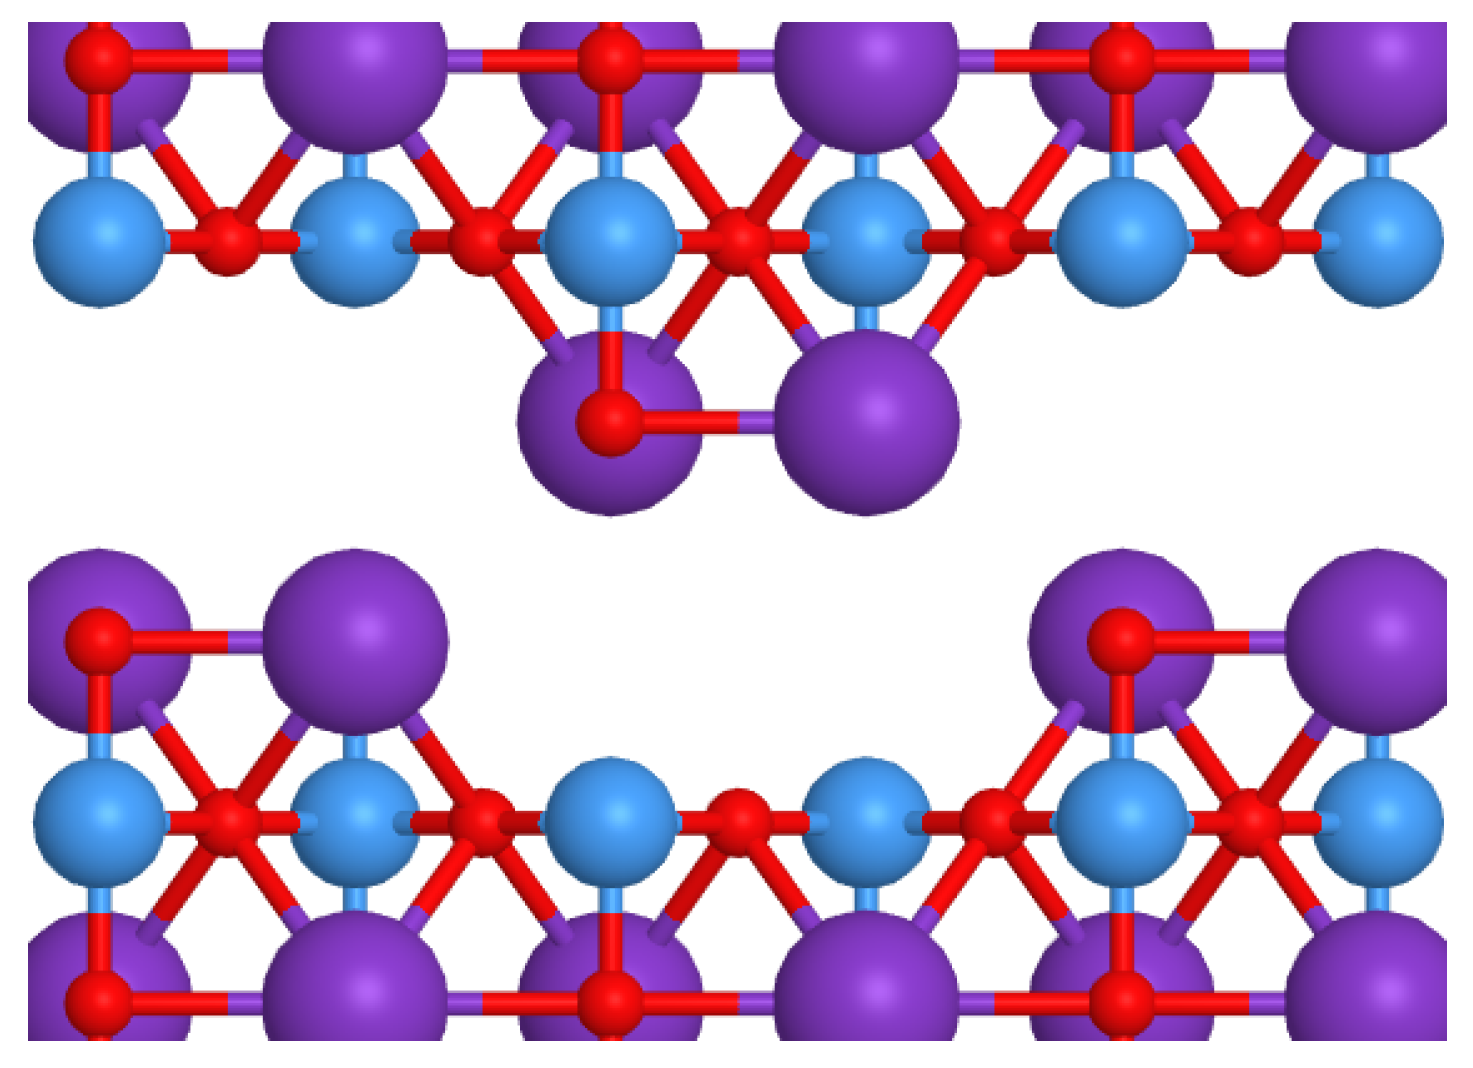
To capture this structure of the crack surfaces in the DFT calculations for the Mode I stress–strain curves, we used a () supercell as shown in Figure 4, which allows us to split the KO plane in half without creating polar step edges. Even though the observed width of the KO stripes and trenches in experiments is somewhat larger than in our setup [16], previous DFT calculations have shown that the cleavage energy does not depend strongly on the choice of width [16] and therefore has only a small impact on the calculated stress–strain curve. With this setup, we obtained critical strains for KTaO3 of 24.1% for Mode I fracture as well as 20.4% and 22.1% for Mode II fracture in the [100]- and [110]-directions, respectively. The calculated energy–strain and stress–strain curves are shown in Figures S3 and S4, and the estimated critical maximum strains for all materials and fracture modes are summarized in Table 1.
Figure 4.
Atomic structure of the upper and lower crack surface after fracture along (001) lattice planes in KTaO3. Charge compensation is ensured by splitting the KO layer during cleavage. K, Ta, and O are shown in purple, blue, and red, respectively.
Table 1.
Estimated critical maximum strain at the point of fracture for different materials and fracture modes as obtained by static DFT calculations of stress–strain curves.
3.2. Optimized Strained Geometries
At the point of fracture, a material is inhomogeneously strained at the crack tip, as shown by the solution of the anisotropic linear elasticity equations in Figure 1. However, the full atomistic treatment of the atomic relaxations at a crack tip is very demanding, in particular with first-principles quantum-mechanical calculations, due to the long range of the elastic interactions. Instead, we determine a possibly evolving dielectric polarization during fracture by applying an incrementally increasing homogeneous strain until the critical maximum value is reached. This will give us an upper limit for the induced polarization since only very few bonds at the crack tip are strained up to the critical value.
Tensile loading along the [001]-direction for Mode I fracture is easily applied by enlarging the lattice constant in that direction, making a cubic unit cell tetragonal. The imposed tensile strain induces an in-plane stress and a lateral contraction as quantified by the Poisson ratio. This is taken into account by optimizing the in-plane lattice constant for each applied tensile strain. The energy was calculated for several in-plane lattice constants and the equilibrium value at the lowest energy was determined by a polynomial fit.
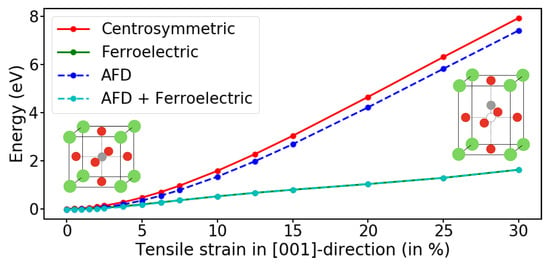
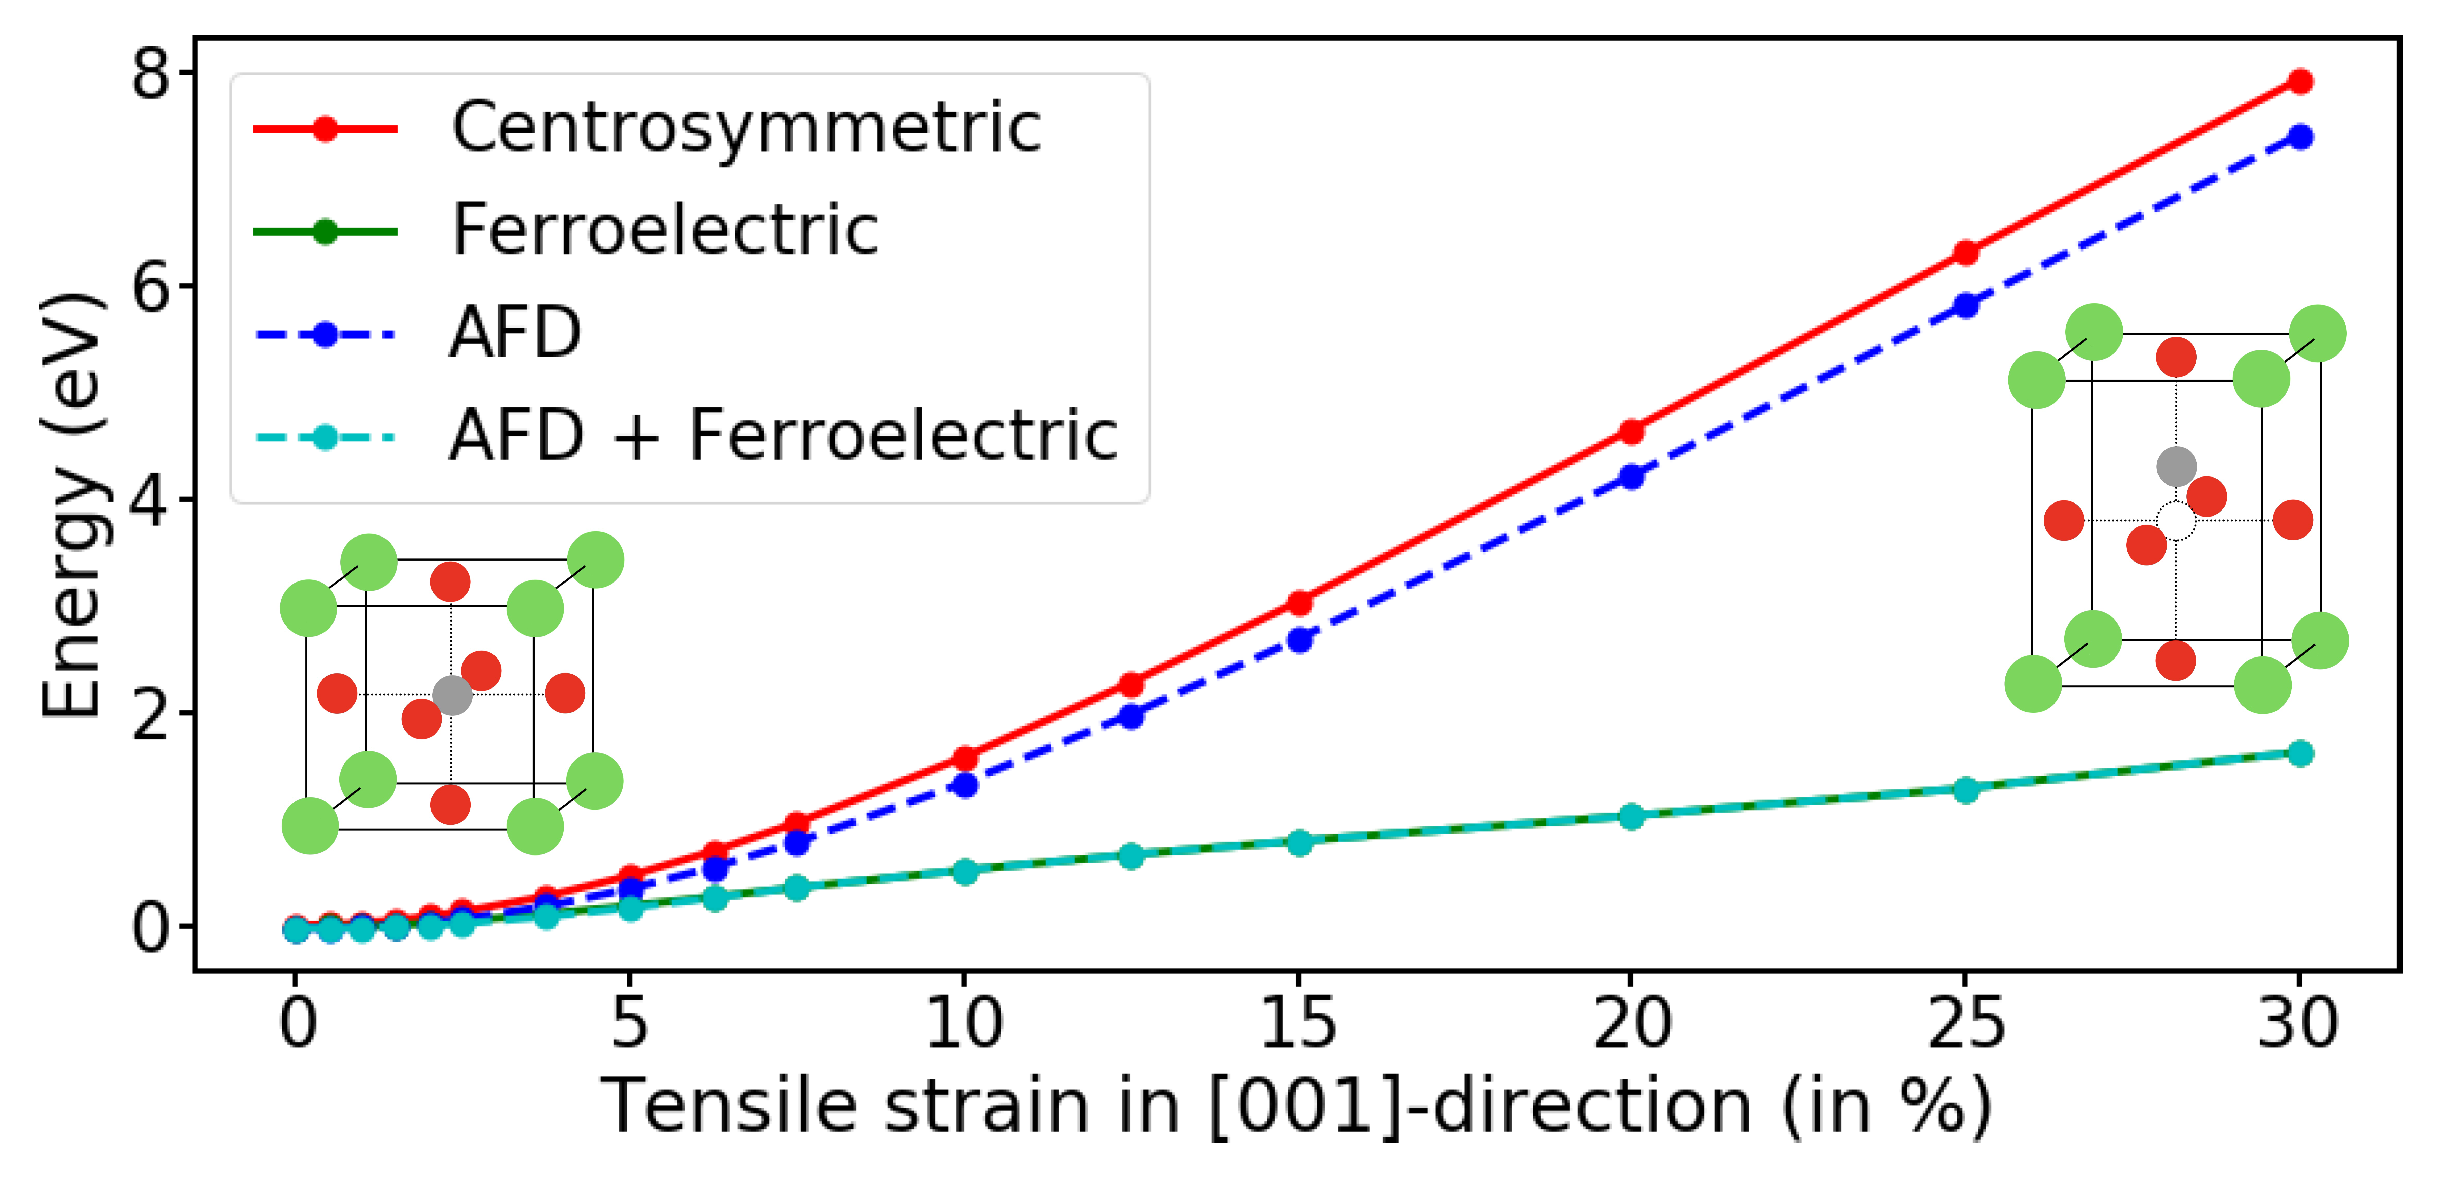
In a first set of calculations, all atoms were kept at their centrosymmetric positions, prohibiting any rotations or shifts in the atoms against each other. The resulting energy curve for SrTiO3 is shown in red in Figure 5. In this case, of course, the evolution of a spontaneous polarization is suppressed. The same calculation was repeated, but now a symmetry-breaking perturbation was applied by slightly displacing the atoms along the [001]-direction in the starting structure of the geometry optimization. This breaks the horizontal mirror plane of the original centrosymmetric unit cell while keeping the tetragonal symmetry with a 4-fold rotation axis along the [001]-direction. Anions and cations can shift in opposite directions during the structure optimization, which introduces a spontaneous polarization. As shown by the green graph in Figure 5, this lifting of the horizontal mirror symmetry strongly reduces the energy, especially for higher strains. The relaxed structures represent a ferroelectric state, because the reversal of the anion and cation shifts results in an equivalent configuration with the same energy but an opposite direction of the spontaneous polarization.
Figure 5.
Relative energies per perovskite unit cell of SrTiO3 with increasing tensile strain in the [001]-direction. In the calculations for the four graphs, the atomic relaxations were restricted by enforcing different symmetries, see text.
SrTiO3 undergoes a nonpolar antiferrodistortive (AFD) phase transition from cubic to tetragonal symmetry at 105 K, and it is close to a ferroelectric transition with polar displacements of the anions and cations at zero temperature [37,38,39]. In fact, it has been suggested that the ferroelectric transition is suppressed by the preceding AFD phase transition and by quantum fluctuations in the atoms [40,41]. However, SrTiO3 can be easily made ferroelectric by applying a small strain [41,42,43].
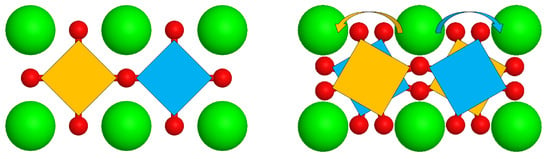
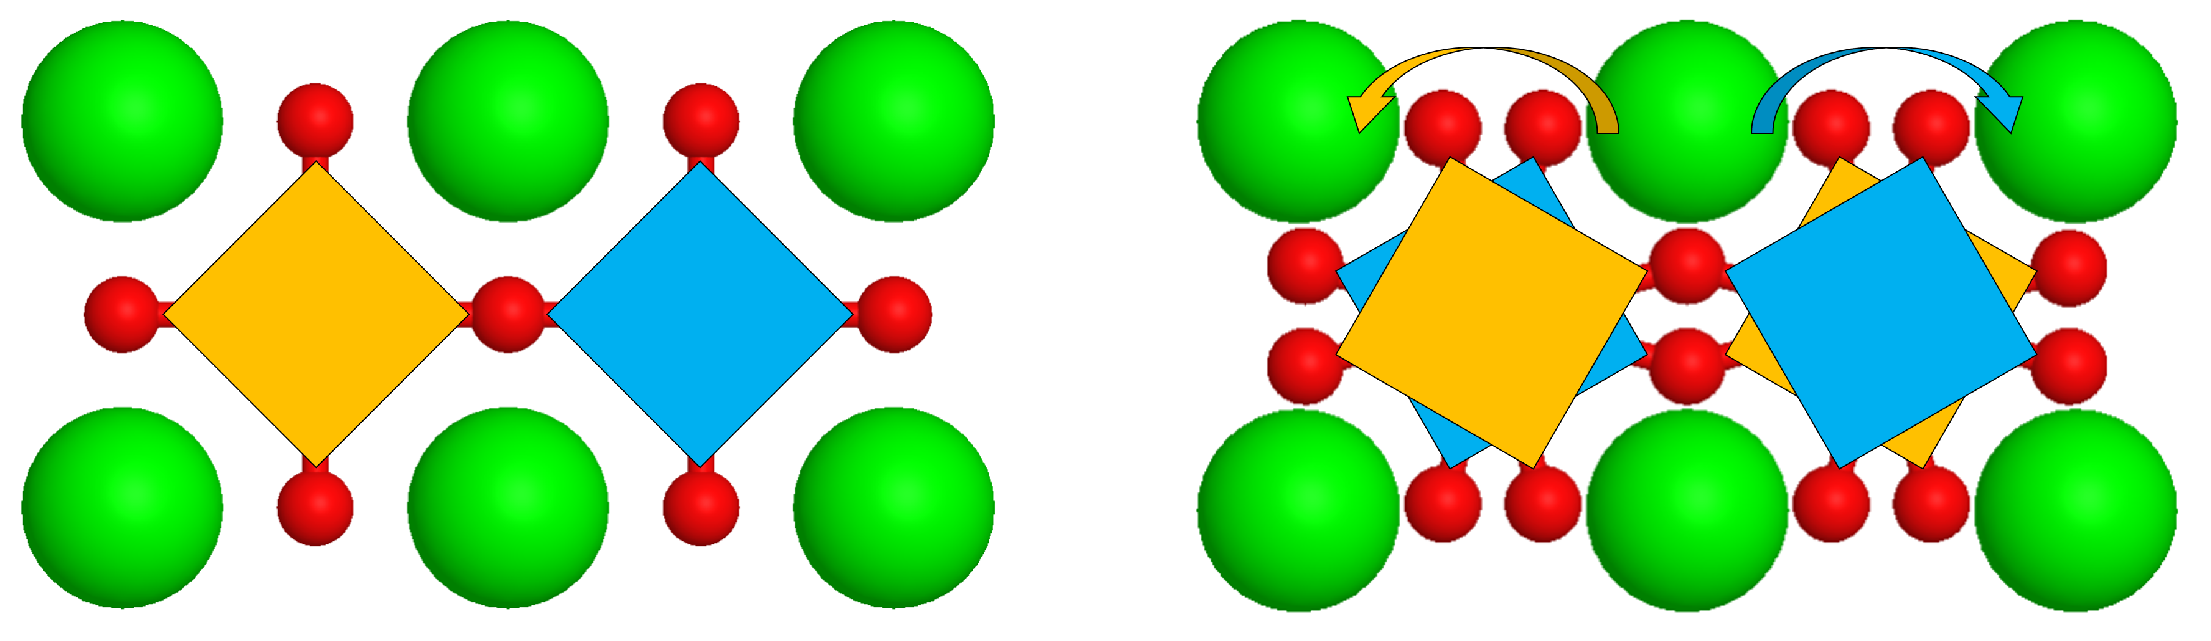
In the AFD structure, the oxygen octahedra around the central Ti ions within the (001) layers are rotated about the [001]-axis in opposite directions in a checkerboard-like pattern as sketched in Figure 6, while the rotation direction is reversed along the [001]-direction between subsequent (001) layers [39]. The structure remains tetragonal with a 4-fold rotation axis along [001] and is nonpolar with a horizontal mirror plane. To enable the AFD rotation of the oxygen octahedra in the DFT calculations, a larger () supercell has to be used and the octahedra have to be pre-rotated in the starting structure of the geometry optimization to break the cubic symmetry. The dark blue graph in Figure 5 shows that the AFD rotations indeed slightly lower the energy compared to the centrosymmetric configuration. In this calculation, the vertical ferroelectric displacement of the atoms in the [001]-direction was suppressed by maintaining the horizontal mirror symmetry.
Figure 6.
Antiferrodistortive relaxations in SrTiO3.
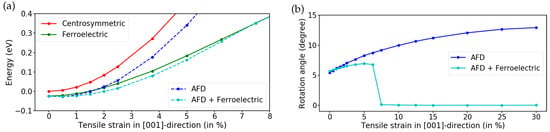
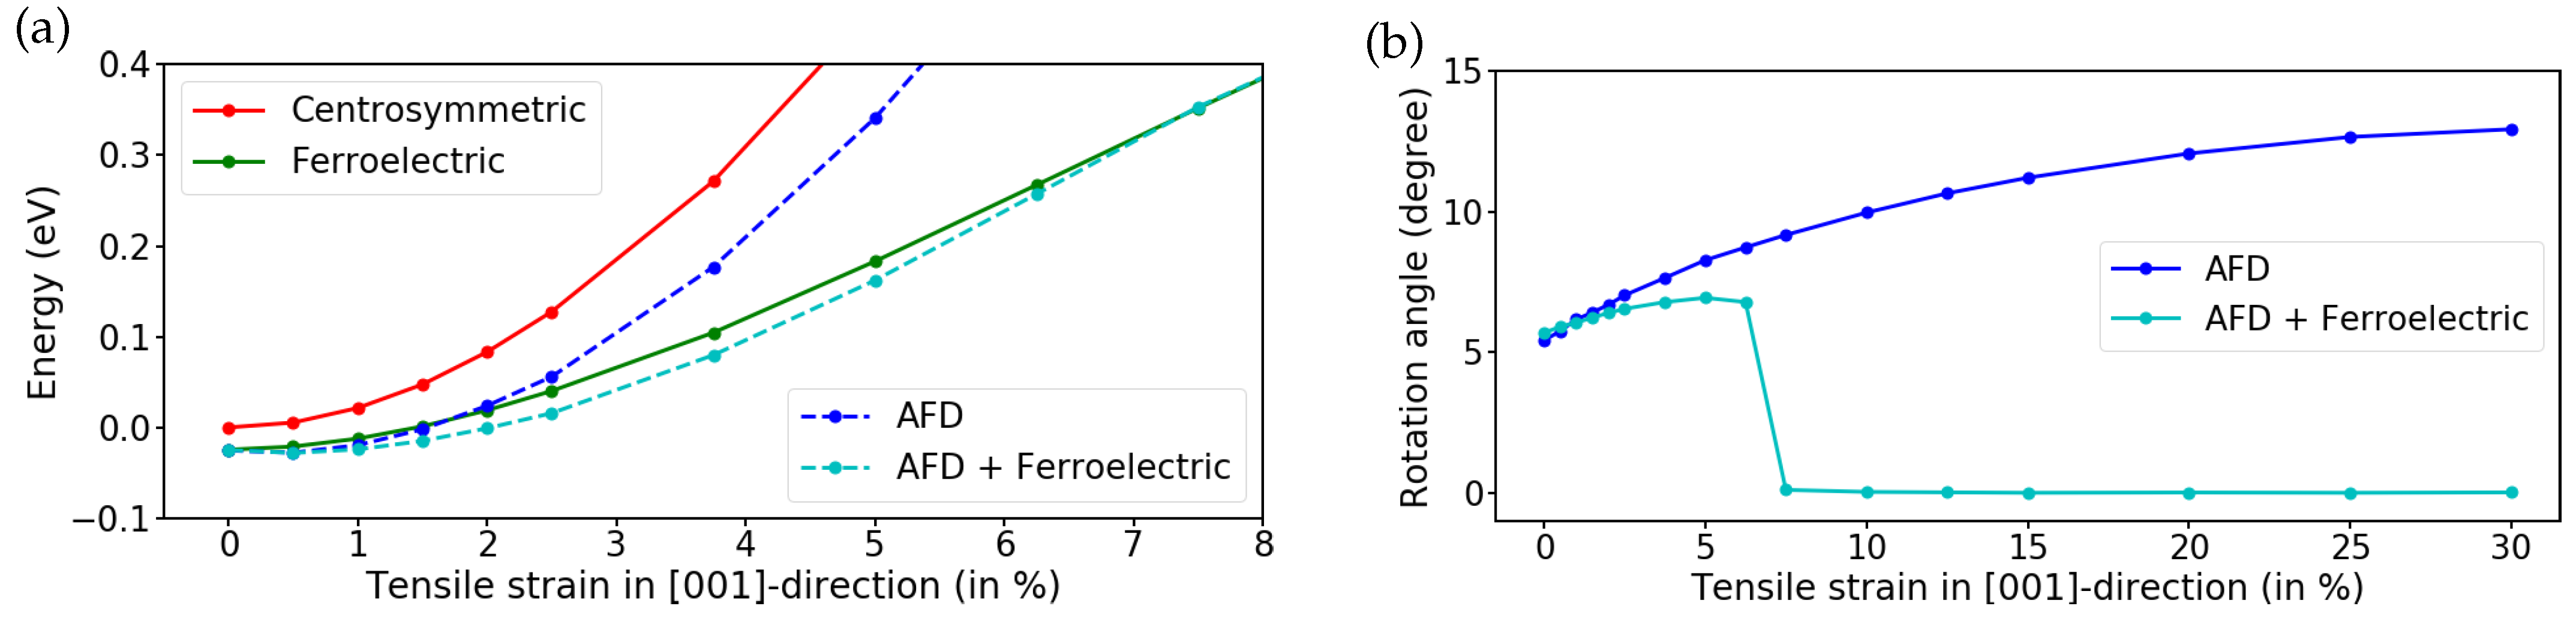
Finally, the cyan graph in Figure 5 encapsulates both atomic relaxations by allowing both the ferroelectric displacement of the atoms along the [001]-direction and the AFD rotation of the octahedra. At first glance, the energy, and thus the structure, seems identical to that obtained when including only the ferroelectric shifts. On closer inspection, however, Figure 7a shows that the AFD rotations also lower the energy of the tetragonal ferroelectric structure at lower strains. The octahedra rotate by 5–7° (see Figure 7b), but above a strain of about 7% the rotations of the octahedra collapse and the AFD distortion becomes energetically unfavorable. This collapse of the AFD rotations is consistent with the mechanism of competing instabilities identified by Aschauer and Spaldin [39], who showed that AFD distortions lower the energy of SrTiO3 mainly by optimizing the Sr–O coordination. However, the same bonding benefit also stabilizes the ferroelectric displacements. Therefore, at low strain, close to a cubic unit cell, the AFD rotation is the more efficient way to lower the energy, simultaneously suppressing the ferroelectric distortions. However, as strain increases, the growing tetragonal distortion of the cell strengthens the ferroelectric instability [39], which in turn diminishes the additional energy gain from rotating the octahedra. Above a strain of about 7% it no longer outweighs the elastic cost of the rotation and the AFD distortion vanishes. In contrast, in the centrosymmetric case, when the ferroelectric shifts were suppressed by imposing a horizontal mirror symmetry, the AFD rotations lower the energy at all imposed strains and the rotation angle increases up to 13°.
Figure 7.
(a) Enlarged cut-out of the energy curves in Figure 5 at low strain values. The different colored graphs represent calculations that differ by the imposed symmetries during structure optimization. (b) Rotation angle of the oxygen octahedra around Ti ions with increasing strain.
The tetragonal symmetry of the ferroelectric structures with or without AFD rotations is broken from the moment a shear strain is applied. Therefore, all calculations for Mode II fracture were done from the beginning with the larger () supercell and the geometry optimizations were initialized with pre-rotated octahedra and displaced atoms along the [001]-direction. Furthermore, a combined relaxation of the atomic positions and the cell dimensions in the plane perpendicular to the shear direction was performed until the atomic forces and the corresponding components of the stress tensor vanished. The calculated energy–strain curves for shear in both the [100]- and [110]-directions are shown in Figure 8. As in Mode I fracture, the AFD distortions are predominantly present at lower strains and vanish at higher strains (see Figure S7b in the Supplementary Materials).
Figure 8.
Relative energies per perovskite unit cell of SrTiO3 with increasing shear strain in the [100]- or [110]-direction.
The calculations for Mode I and Mode II fracture were repeated for the other two investigated materials BaTiO3 and KTaO3. For BaTiO3, which is already ferroelectric at zero strain, the ferroelectric displacements lower the energy across all strains (Figures S5 and S8 in the Supplementary Materials). As for SrTiO3, the AFD rotations only play a role at low strains, however, to a much smaller extent, and they are absent in the centrosymmetric structures. KTaO3 behaves somewhat differently from SrTiO3 and BaTiO3. The AFD distortions are absent at all strains. The ferroelectric distortions also lower the energy in the strained structures, but to an even more pronounced extent than in the other two materials (Figures S6 and S9).
3.3. Polarization and Surface Charge
In the next step, the introduced spontaneous dielectric polarization was calculated for all optimized structures under homogeneous strain. This was done using the Berry-phase approach based on the so-called modern theory of polarization [44]. For an infinite bulk crystal, the polarization is a multi-valued quantity and is only defined modulo a polarization quantum [44]. Therefore, results must be corrected by adding or subtracting this quantum so that the resulting polarization curve is smooth and continuous and starts at zero polarization for zero strain (or, more precisely, at the known value of the bulk polarization for ferroelectric BaTiO3).
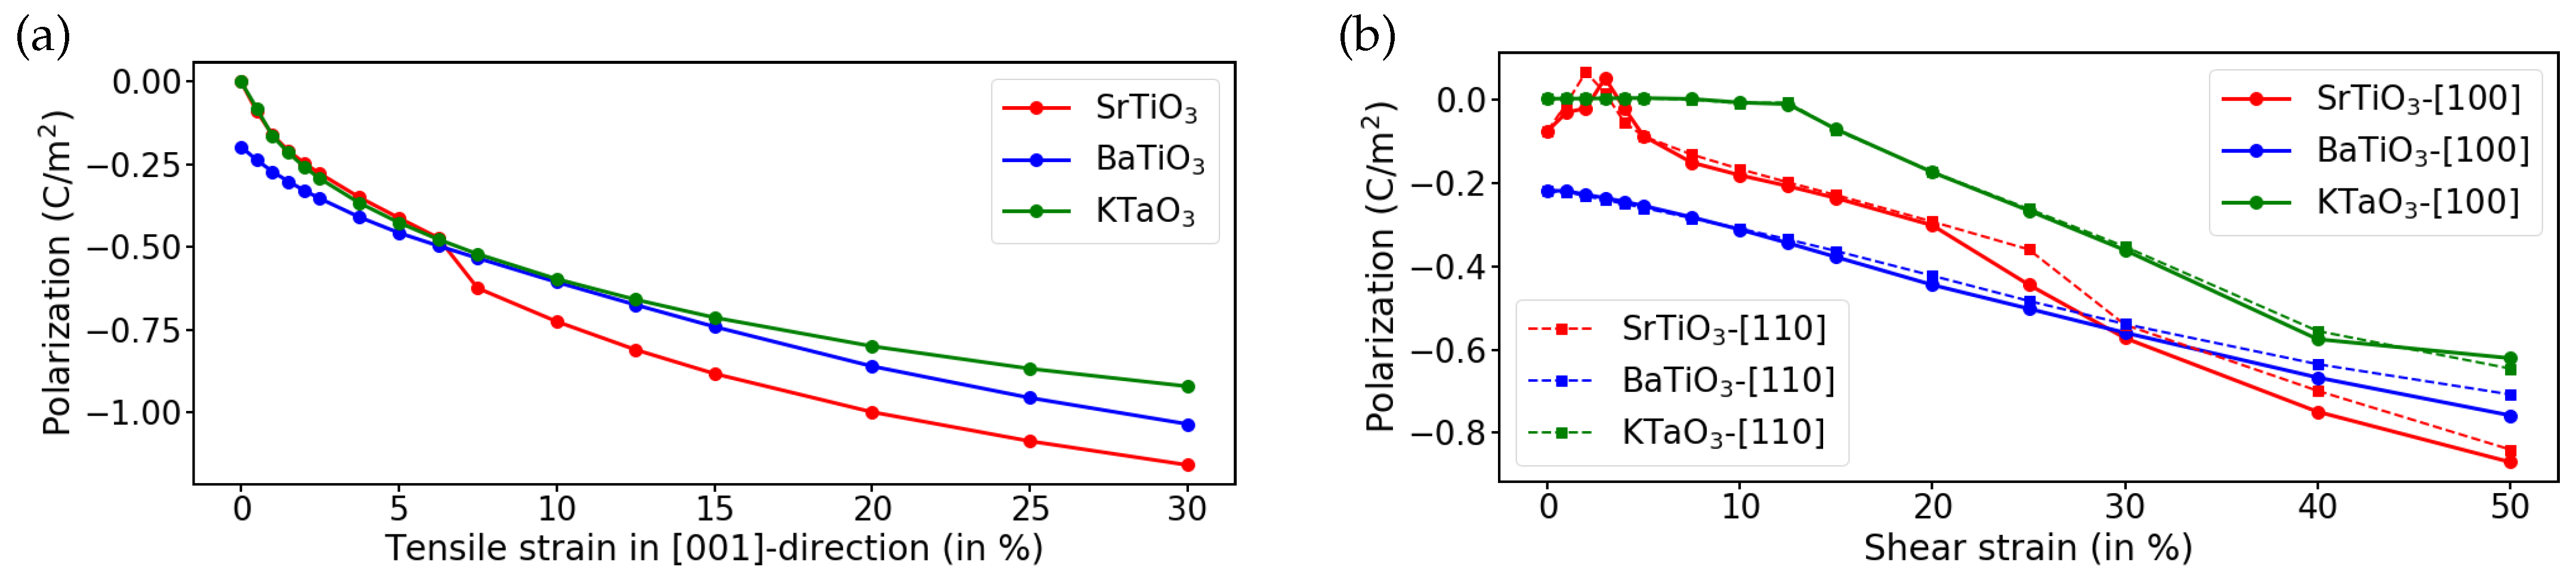
Applying this procedure to Mode I fracture, i.e., to the optimized tensile-strained configurations, yields the results shown in Figure 9a for the three investigated materials. As expected for a cubic material, SrTiO3 and KTaO3 show no polarization at zero strain. At the onset of the tensile strain, the structure with ferroelectric atomic displacements becomes lower in energy than the centrosymmetric configuration, introducing a spontaneous polarization which increases continuously with strain. Interestingly, the point at which SrTiO3 switches from an antiferrodistortively perturbed geometry to a purely ferroelectrically displaced structure at a strain of about 7% is visible as a jump in the polarization. This underlines that the AFD rotations at lower strains have suppressed the ferroelectric displacements [37,39]. Also for BaTiO3, a known ferroelectric at room temperature, the polarization increases with increasing tensile strain. However, at strains beyond the collapse of the AFD rotations, the polarization of SrTiO3 exceeds that of BaTiO3. KTaO3 shows the lowest polarization at the maximum computed strain of 30%, as well as over the whole range of investigated strains.
Figure 9.
Dielectric spontaneous polarization as calculated by the Berry-phase approach for different materials (a) at increasing tensile strain in [001]-direction and (b) at increasing shear strain in [100]- and [110]-direction.
The calculated polarizations for the optimized sheared structures for Mode II fracture are shown in Figure 9b. For SrTiO3, in contrast to Mode I fracture, the polarization remains close to zero at low strains and only starts to increase above a shear strain of 5%. A distinct kink marking the disappearance of the AFD rotation is also visible here, occurring at a shear strain of about 20%. Interestingly, the polarization of KTaO3 remains zero for much larger strains and only starts to increase at a shear strain of 15%.
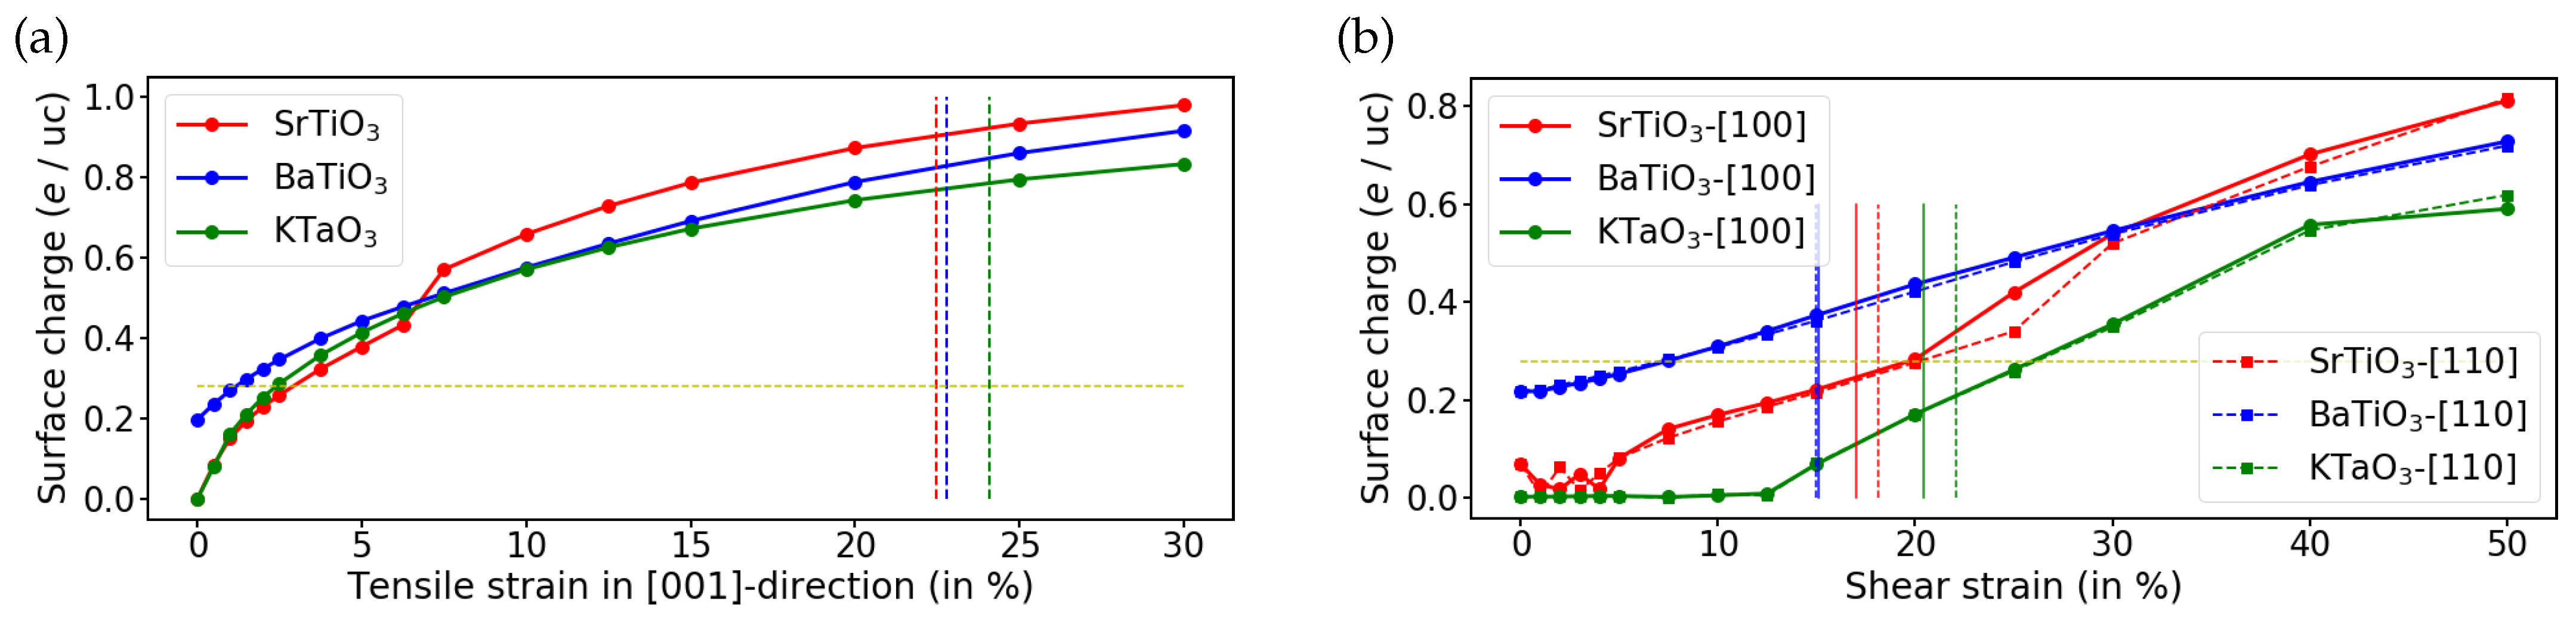
These results demonstrate that, during fracture, the previously non-ferroelectric SrTiO3 and KTaO3 develop a polarization normal to the (001) fracture plane in the [001]-direction, and the polarization of ferroelectric BaTiO3 increases significantly. At the point of fracture, when new surfaces are created, this polarization induces a surface charge , where is the normal vector to the surface. In Figure 10, the surface charge is plotted in units of electrons per surface unit cell by multiplying the normal component of the calculated polarization in Figure 9 by the surface area of a perovskite (001) surface unit cell. The graphs in Figure 9 and Figure 10 look quite similar (except for the flip of sign), since the size of the surface unit cell differs only marginally between the three materials. In addition, Figure 10 shows the critical maximum strains determined in Section 3.1 and summarized in Table 1 by vertical dotted lines. Finally, the surface charges per unit cell at the point of fracture as given by the critical strain are collected in Table 2 for all three materials.
Figure 10.
Surface charge per perovskite (001) surface unit cell calculated for different materials (a) at increasing tensile strain in [001]-direction and (b) at increasing shear strain in [100]- and [110]-direction. The vertical lines indicate the critical maximum strains at the point of fracture listed in Table 1. The yellow horizontal line represents the surface charge observed for SrTiO3 in experiments [17].
Table 2.
Surface charge (in units of electron charge e per perovskite (001) surface unit cell) created by the induced dielectric polarization at the point of fracture for each material.
The overview in Table 2 makes the stark contrast between the two fracture modes apparent. The induced polarization, and thus the surface charge per unit cell, is much larger for Mode I than for Mode II fracture, even though the critical strains are not much different (22–24% for Mode I and 15–22% for Mode II, see Table 1). In Mode I, the induced polarization with increasing strain is very similar for the three materials (Figure 9) so that the difference in the surface charge per unit cell during fracture is quite small with values of about 0.8–0.9 e. In contrast, the differences between the materials are much more pronounced for Mode II fracture. SrTiO3 fractures while AFD rotations are still present, resulting in a reduced polarization at the critical strain due to suppressed ferroelectric displacements of the atoms. As a consequence, BaTiO3 shows a surface charge per unit cell during fracture that is about twice as large as for SrTiO3, due to both its intrinsic polarization and the larger strain-induced polarization in the absence of AFD rotations. KTaO3, however, behaves differently again. It shows the largest difference between Mode I and Mode II fracture, since ferroelectric distortions have become favorable at strains just before the point of fracture and thus KTaO3 shows a surface charge per unit cell of only 0.07 e.
Finally, we compare our results to the observations in the cleaving experiments of Sokolović et al. [17] for SrTiO3. A notched single crystal was mounted between two clamps and was pre-strained by applying a tensile force. Then, a strong shear force was applied to cleave the crystal [17,18,19]. On the cleaved surfaces they observed a well-defined concentration of % Sr2+ adatoms on the TiO2-terminated side and the same amount of Sr2+ vacancies on the opposite SrO surface, corresponding to a surface charge per unit cell of 0.28 e [17]. This value was included as a horizontal yellow dashed line in Figure 10. The surface charge calculated for Mode I fracture overestimates this value by a factor of 3, however, the charge calculated for Mode II fracture matches it closely. This is in very good agreement with the experimental observation since a mixed Mode I/Mode II loading was applied in the cleavage device, but the shear strain was the dominant force for cleavage [17,18,19].
In this comparison, it also has to be taken into account that our calculations, based on applying a homogeneous strain, only provide an upper limit for the induced polarization, since the strain decreases rapidly from the critical maximum value at the last intact bond with increasing distance from the crack tip, as demonstrated by the linear elastic displacement field displayed in Figure 1. Figure 10 shows that for Mode I fracture the surface charge has largely saturated well below the estimated critical strain, whereas for Mode II it still rises steeply in the strain range immediately preceding . Therefore, we can expect that the overestimation of the induced surface charges is more sensitive for Mode II than Mode I fracture. Furthermore, our calculations are for a perfect, defect-free single crystal. Crystal defects, such as vacancies, dislocations, or grain boundaries, significantly weaken the fracture toughness of a crystal and reduce the maximum critical strain and the induced dielectric polarization.
For the other two materials, our calculations predict a much stronger effect for BaTiO3 and a higher concentration of adatoms/vacancies on the as-cleaved surfaces than for SrTiO3. However, this result would only apply to ferroelectric domains with a ferroelectric polarization perpendicular to the crack surfaces. On the other hand, for KTaO3, the effect is predicted to be much smaller. It also has to be taken into account that the calculated surface charge of 0.07 e for Mode II fracture comes on top of the equal split of the KO layer due to the polarity of KTaO3 [16]. Instead of a 50:50 split of the KO layer, our calculations predict a slightly asymmetric ratio of 43:57, however, this small deviation is well within the uncertainty of the evaluation of the surface structures in the experiment [16].
4. Conclusions
The cubic perovskite oxides SrTiO3 and KTaO3 are prone to ferroelectric displacements under strain. Both develop an increasing dielectric polarization when subjected to tensile and shear loads as present in Mode I and Mode II fracture conditions. Also, the polarization of the room-temperature ferroelectric BaTiO3 shows a strong increase close to a crack tip. On the other hand, antiferrodistortive rotations of the oxygen octahedra only play a role in SrTiO3 under shear and at low tensile strains, but are largely suppressed in BaTiO3 and are completely absent in KTaO3.
At the point of fracture, when newly exposed surfaces are created, this dielectric polarization leads to a surface charge, which is maintained by the transfer of ions between the crack surfaces. Such formation of adatoms and vacancies on opposite sides of as-cleaved SrTiO3 crystal surfaces was reported by Sokolović et al. [17,18,19]. Furthermore, the calculated surface charge closely matches the experimentally observed adatom concentration. This supports the hypothesis of Sokolović et al. [17] that the formation of adatoms and vacancies on the as-cleaved surfaces is driven by a strain-induced polarization at the point of fracture. Strain-induced ferroelectric displacements must therefore be accounted for when modeling the fracture of any perovskite oxide.
Supplementary Materials
The following supporting information can be downloaded at: https://www.mdpi.com/article/10.3390/cryst16100611/s1, Figures S1–S4: Energy–strain and stress–strain curves for BaTiO3 and KTaO3; Figures S5–S9: Energy of homogeneously strained configurations.
Author Contributions
Conceptualization, C.L.R. and B.M.; methodology, C.L.R. and B.M.; validation, C.L.R., T.J. and B.M.; formal analysis, C.L.R.; investigation, C.L.R. and T.J.; resources, B.M.; data curation, C.L.R.; writing—original draft preparation, C.L.R.; writing—review and editing, C.L.R. and B.M.; visualization, C.L.R.; supervision, B.M.; project administration, B.M.; funding acquisition, B.M. All authors have read and agreed to the published version of the manuscript.
Funding
This research was funded by the Deutsche Forschungsgemeinschaft (DFG) through Graduate School GRK 2423 “Fracture Across Scales” (Frascal), project number 377472739.
Data Availability Statement
All data supporting the reported results are included in the article and the Supplementary Materials. Further inquiries can be directed to the corresponding author.
Conflicts of Interest
The authors declare no conflicts of interest.
References
- Chen, H.C.; Huang, C.W.; Wu, J.C.; Lin, S.T. Theoretical investigation of the metal-doped SrTiO3 photocatalysts for water splitting. J. Phys. Chem. C 2012, 116, 7897–7903. [Google Scholar] [CrossRef] [Scilit]
- Townsend, T.K.; Browning, N.D.; Osterloh, F.E. Overall photocatalytic water splitting with NiOx–SrTiO3: A revised mechanism. Energy Environ. Sci. 2012, 5, 9543–9550. [Google Scholar] [CrossRef] [Scilit]
- Wang, W.; Xu, M.; Xu, X.; Zhou, W.; Shao, Z. Perovskite oxide based electrodes for high-performance photoelectrochemical water splitting. Angew. Chem. Int. Ed. 2020, 59, 136–152. [Google Scholar] [CrossRef] [Scilit] [PubMed]
- Wang, Y.; Wang, L.; Zhang, K.; Xu, J.; Wu, Q.; Xie, Z.; An, W.; Liang, X.; Zou, X. Electrocatalytic water splitting over perovskite oxide catalysts. Chin. J. Catal. 2023, 50, 109–125. [Google Scholar] [CrossRef] [Scilit]
- Bera, A.; Wu, K.; Sheikh, A.; Alarousu, E.; Mohammed, O.F.; Wu, T. Perovskite oxide SrTiO3 as an efficient electron transporter for hybrid perovskite solar cells. J. Phys. Chem. C 2014, 118, 28494–28501. [Google Scholar] [CrossRef] [Scilit]
- Haque, M.A.; Sheikh, A.D.; Guan, X.; Wu, T. Metal oxides as efficient charge transporters in perovskite solar cells. Adv. Energy Mater. 2017, 7, 1602803. [Google Scholar] [CrossRef] [Scilit]
- Sheikh, M.S.; Sakhya, A.P.; Maity, R.; Dutta, A.; Sinha, T. Narrow band gap and optical anisotropy in double perovskite oxide Sm2NiMnO6: A new promising solar cell absorber. Sol. Energy Mater. Sol. Cells 2019, 193, 206–213. [Google Scholar] [CrossRef] [Scilit]
- Ohnishi, T.; Shibuya, K.; Lippmaa, M.; Kobayashi, D.; Kumigashira, H.; Oshima, M.; Koinuma, H. Preparation of thermally stable TiO2-terminated SrTiO3(100) substrate surfaces. Appl. Phys. Lett. 2004, 85, 272–274. [Google Scholar] [CrossRef] [Scilit]
- Silly, F.; Newell, D.T.; Castell, M.R. SrTiO3(001) reconstructions: The (2×2) to c(4×4) transition. Surf. Sci. 2006, 600, 219–223. [Google Scholar] [CrossRef] [Scilit]
- Biswas, A.; Rossen, P.; Yang, C.H.; Siemons, W.; Jung, M.H.; Yang, I.; Ramesh, R.; Jeong, Y. Universal Ti-rich termination of atomically flat SrTiO3 (001), (110), and (111) surfaces. Appl. Phys. Lett. 2011, 98, 051904. [Google Scholar] [CrossRef] [Scilit]
- Herger, R.; Willmott, P.; Bunk, O.; Schlepütz, C.; Patterson, B.; Delley, B.; Shneerson, V.; Lyman, P.; Saldin, D. Surface structure of SrTiO3(001). Phys. Rev. B 2007, 76, 195435. [Google Scholar] [CrossRef] [Scilit]
- Chambers, S.A.; Droubay, T.C.; Capan, C.; Sun, G. Unintentional F doping of SrTiO3(001) etched in HF acid-structure and electronic properties. Surf. Sci. 2012, 606, 554–558. [Google Scholar] [CrossRef] [Scilit]
- Schultz, R.A.; Jensen, M.C.; Bradt, R.C. Single crystal cleavage of brittle materials. Int. J. Fract. 1994, 65, 291–312. [Google Scholar] [CrossRef] [Scilit]
- Guisinger, N.P.; Santos, T.S.; Guest, J.R.; Chien, T.Y.; Bhattacharya, A.; Freeland, J.W.; Bode, M. Nanometer-scale striped surface terminations on fractured SrTiO3 surfaces. ACS Nano 2009, 3, 4132–4136. [Google Scholar] [CrossRef] [Scilit] [PubMed]
- Sitaputra, W.; Skowronski, M.; Feenstra, R.M. Topographic and electronic structure of cleaved SrTiO3(001) surfaces. J. Vac. Sci. Technol. A 2015, 33, 031402. [Google Scholar] [CrossRef] [Scilit]
- Setvin, M.; Reticcioli, M.; Poelzleitner, F.; Hulva, J.; Schmid, M.; Boatner, L.A.; Franchini, C.; Diebold, U. Polarity compensation mechanisms on the perovskite surface KTaO3(001). Science 2018, 359, 572–575. [Google Scholar] [CrossRef] [Scilit] [PubMed]
- Sokolović, I.; Schmid, M.; Diebold, U.; Setvin, M. Incipient ferroelectricity: A route towards bulk-terminated SrTiO3. Phys. Rev. Mater. 2019, 3, 034407. [Google Scholar] [CrossRef] [Scilit]
- Sokolović, I.; Franceschi, G.; Wang, Z.; Xu, J.; Pavelec, J.; Riva, M.; Schmid, M.; Diebold, U.; Setvín, M. Quest for a pristine unreconstructed SrTiO3(001) surface: An atomically resolved study via noncontact atomic force microscopy. Phys. Rev. B 2021, 103, L241406. [Google Scholar] [CrossRef] [Scilit]
- Sokolović, I.; Schmid, M.; Diebold, U.; Setvín, M. How to cleave cubic perovskite oxides. Rev. Sci. Instrum. 2025, 96, 035113. [Google Scholar] [CrossRef] [Scilit] [PubMed]
- Giannozzi, P.; Baroni, S.; Bonini, N.; Calandra, M.; Car, R.; Cavazzoni, C.; Ceresoli, D.; Chiarotti, G.L.; Cococcioni, M.; Dabo, I.; et al. QUANTUM ESPRESSO: A modular and open-source software project for quantum simulations of materials. J. Phys. Condens. Matter 2009, 21, 395502. [Google Scholar] [CrossRef] [Scilit] [PubMed]
- Perdew, J.P.; Burke, K.; Ernzerhof, M. Generalized gradient approximation made simple. Phys. Rev. Lett. 1996, 77, 3865–3868. [Google Scholar] [CrossRef] [Scilit] [PubMed]
- Perdew, J.P.; Ruzsinszky, A.; Csonka, G.I.; Vydrov, O.A.; Scuseria, G.E.; Constantin, L.A.; Zhou, X.; Burke, K. Restoring the density-gradient expansion for exchange in solids and surfaces. Phys. Rev. Lett. 2008, 100, 136406, Erratum in Phys. Rev. Lett. 2009, 102, 039902. https://doi.org/10.1103/PhysRevLett.100.136406.. [Google Scholar] [CrossRef] [Scilit] [PubMed]
- Vanderbilt, D. Soft self-consistent pseudopotentials in a generalized eigenvalue formalism. Phys. Rev. B 1990, 41, 7892–7895. [Google Scholar] [CrossRef] [Scilit] [PubMed]
- Irwin, G.R. Analysis of stresses and strains near the end of a crack traversing a plate. J. Appl. Mech. 1957, 24, 361–364. [Google Scholar] [CrossRef] [Scilit]
- Sih, G.C.; Liebowitz, H. Mathematical Theories of Brittle Fracture. In Fracture: An Advanced Treatise, Vol. 2–Mathematical Fundamentals; Liebowitz, H., Ed.; Academic Press: New York, NY, USA, 1968; pp. 67–190. [Google Scholar]
- Pérez, R.; Gumbsch, P. An ab initio study of the cleavage anisotropy in silicon. Acta Mater. 2000, 48, 4517–4530. [Google Scholar] [CrossRef] [Scilit]
- Buze, M.; Kermode, J.R. Numerical-continuation-enhanced flexible boundary condition scheme applied to mode-I and mode-III fracture. Phys. Rev. E 2021, 103, 033002. [Google Scholar] [CrossRef] [Scilit] [PubMed]
- Griffith, A.A. VI. The phenomena of rupture and flow in solids. Philos. Trans. R. Soc. Lond. Ser. A Contain. Pap. A Math. Phys. Character 1921, 221, 163–198. [Google Scholar] [CrossRef] [Scilit]
- Sumigawa, T.; Shimada, T.; Huang, K.; Mizuno, Y.; Hagiwara, Y.; Ozaki, N.; Kitamura, T. Ultrasmall-Scale Brittle Fracture Initiated from a Dislocation in SrTiO3. Nano Lett. 2022, 22, 2077–2084. [Google Scholar] [CrossRef] [Scilit] [PubMed]
- Barenblatt, G.I. The Mathematical Theory of Equilibrium Cracks in Brittle Fracture. In Advances in Applied Mechanics, Volume 7; Elsevier: Amsterdam, The Netherlands, 1962; pp. 55–129. [Google Scholar] [CrossRef] [Scilit]
- Park, K.; Paulino, G.H. Cohesive Zone Models: A Critical Review of Traction-Separation Relationships Across Fracture Surfaces. Appl. Mech. Rev. 2011, 64, 060802. [Google Scholar] [CrossRef] [Scilit]
- Meyer, B.; Padilla, J.; Vanderbilt, D. Theory of PbTiO3, BaTiO3, and SrTiO3 surfaces. Faraday Discuss. 1999, 114, 395–405. [Google Scholar] [CrossRef] [Scilit]
- Meyer, B.; Vanderbilt, D. Ab initio study of BaTiO3 and PbTiO3 surfaces in external electric fields. Phys. Rev. B 2001, 63, 205426. [Google Scholar] [CrossRef] [Scilit]
- Tasker, P.W. The stability of ionic crystal surfaces. J. Phys. C Solid State Phys. 1979, 12, 4977–4984. [Google Scholar] [CrossRef] [Scilit]
- Noguera, C. Polar oxide surfaces. J. Phys. Condens. Matter 2000, 12, R367–R410. [Google Scholar] [CrossRef] [Scilit]
- Ebensperger, C.; Meyer, B. First-principles study of the reconstruction and hydroxylation of the polar NiO(111) surface. Phys. Status Solidi (B) 2011, 248, 2229–2241. [Google Scholar] [CrossRef] [Scilit]
- Zhong, W.; Vanderbilt, D. Competing Structural Instabilities in Cubic Perovskites. Phys. Rev. Lett. 1995, 74, 2587–2590. [Google Scholar] [CrossRef] [Scilit] [PubMed]
- Sai, N.; Vanderbilt, D. First-principles study of ferroelectric and antiferrodistortive instabilities in tetragonal SrTiO3. Phys. Rev. B 2000, 62, 13942–13950. [Google Scholar] [CrossRef] [Scilit]
- Aschauer, U.; Spaldin, N.A. Competition and cooperation between antiferrodistortive and ferroelectric instabilities in the model perovskite SrTiO3. J. Phys. Condens. Matter 2014, 26, 122203. [Google Scholar] [CrossRef] [Scilit] [PubMed]
- Shin, D.; Latini, S.; Schäfer, C.; Sato, S.A.; De Giovannini, U.; Hübener, H.; Rubio, A. Quantum paraelectric phase of SrTiO3 from first principles. Phys. Rev. B 2021, 104, L060103. [Google Scholar] [CrossRef] [Scilit]
- Li, Y.L.; Choudhury, S.; Haeni, J.H.; Biegalski, M.D.; Vasudevarao, A.; Sharan, A.; Ma, H.Z.; Levy, J.; Gopalan, V.; Trolier-McKinstry, S.; et al. Phase transitions and domain structures in strained pseudocubic (100) SrTiO3 thin films. Phys. Rev. B 2006, 73, 184112. [Google Scholar] [CrossRef] [Scilit]
- Hashimoto, T.; Nishimatsu, T.; Mizuseki, H.; Kawazoe, Y.; Sasaki, A.; Ikeda, Y. Ab initio Study of Strain-Induced Ferroelectricity in SrTiO3. Jpn. J. Appl. Phys. 2005, 44, 7134. [Google Scholar] [CrossRef] [Scilit]
- Antons, A.; Neaton, J.B.; Rabe, K.M.; Vanderbilt, D. Tunability of the dielectric response of epitaxially strained SrTiO3 from first principles. Phys. Rev. B 2005, 71, 024102. [Google Scholar] [CrossRef] [Scilit]
- Spaldin, N.A. A beginner’s guide to the modern theory of polarization. J. Solid State Chem. 2012, 195, 2–10. [Google Scholar] [CrossRef] [Scilit]

Disclaimer/Publisher’s Note: The statements, opinions and data contained in all publications are solely those of the individual author(s) and contributor(s) and not of MDPI and/or the editor(s). MDPI and/or the editor(s) disclaim responsibility for any injury to people or property resulting from any ideas, methods, instructions or products referred to in the content. |
© 2026 by the authors. Licensee MDPI, Basel, Switzerland. This article is an open access article distributed under the terms and conditions of the Creative Commons Attribution (CC BY) license.