


Abstract
The imaging performance of a Lissajous scanning two-photon microscopy system employing an ultra-compact electrostatic MEMS mirror depends critically on the stability of the scanning trajectory. However, asymmetry in driving circuit parameters and the response of the MEMS mirror introduce amplitude error and phase delay, resulting in trajectory distortion and degraded imaging performance. We establish an experimental characterization platform to evaluate the amplitude and phase responses of the driving circuit and the MEMS mirror. The frequency response of the MEMS mirror under sinusoidal excitation further reveals the phase delay between the driving signal and the mechanical motion. A two-photon microscopy imaging system is constructed to experimentally validate and correct image distortions induced by the driving circuit and response of the MEMS mirror. The research establishes a systematic framework for the realization of low-distortion Lissajous scanning in two-photon microscopy and miniaturized endoscopic imaging systems.
1. Introduction
Two-photon microscopy (TPM) employs a near-infrared femtosecond laser to excite two-photon fluorescence [1,2]. It offers deep tissue penetration and optical sectioning, as well as minimal photodamage and photobleaching, thereby enabling high-resolution fluorescence imaging in deep biological tissues [3,4,5]. Consequently, the development of miniaturized and endoscopic TPM has become a critical research direction, enabling imaging in freely moving animals and offering potential for early diagnosis of deep-tissue diseases such as cancer [6,7,8,9,10].
Micro-Electro-Mechanical System (MEMS) mirrors are key beam-scanning components for the miniaturization of TPM, featuring compact form factors, low power consumption, and rapid dynamic response [11,12,13]. Based on the principle of electromechanical coupling, MEMS mirrors achieve dynamic deflection of microscale reflective mirrors under externally applied driving fields. Depending on the actuation mechanism, MEMS mirrors are primarily categorized into piezoelectric [14], electrothermal [15], electromagnetic [16], and electrostatic [17] types. Electrostatic actuation enables large scan angles and low power consumption at high operating frequencies, whereas electromagnetic actuation requires external magnets that increase device size, and electrothermal actuation suffers from relatively slow response speeds [18,19]. The scanning patterns of MEMS mirrors primarily include raster scanning, spiral scanning, and Lissajous scanning [20]. Lissajous scanning has been extensively integrated into ultra-compact probes, owing to high scanning uniformity, flexible trajectory parameter selection, and strong robustness [21].
However, Lissajous scanning is sensitive to drive signals and device characteristics, leading to critical non-ideal factors in dual-axis MEMS mirror scanning applications [22]. Inconsistencies in the amplitude–frequency responses of the driving circuit, together with phase and amplitude deviations between the dual-axis driving signals, can disrupt the ideal Lissajous trajectory. In addition, the MEMS mirror cannot respond instantaneously to the applied excitation because of its mechanical dynamics, including inertia, elasticity, and damping. Under parametric resonance excitation, the frequency-dependent electromechanical response of the MEMS mirror can further introduce variations in scanning amplitude and phase delay [23]. The combined influence of these factors can distort the ideal Lissajous trajectory, thereby causing geometric image distortion and loss of the effective field of view (FOV).
Previous studies have improved Lissajous scanning through trajectory optimization, actuator monitoring, and image-based correction. Birla et al. proposed an image-metric-based method for phase estimation and registration correction [24]. Manosalvas-Kjono et al. developed an integrated amplitude–phase monitor for direct measurement of actuator response [25]. Zhang et al. investigated Lissajous trajectory optimization and error compensation in MEMS scanning systems [26], and subsequently combined feedforward control with image reconstruction in a quasi-static MEMS-based TPM system [27]. The image-based method starts with a global phase search, the actuator-monitoring approach uses dedicated sensing electronics, and the measurement-based TPM correction was demonstrated with a quasi-static MEMS mirror. However, for parametrically resonant electrostatic MEMS mirrors, it remains unclear how measured circuit amplitude errors can guide drive adjustment and how measured circuit and mirror phase delays can narrow the image-based phase search.
Thus, we investigate amplitude error and phase delay in an ultra-compact electrostatic MEMS mirror used in a Lissajous scanning TPM imaging system through both theoretical analysis and experimental validation. First, we analyze the amplitude–frequency response characteristics of the driving circuit under parametric resonance conditions and identify the error sources in the dual-axis driving signals. Second, the resonant response and phase delay of the MEMS mirror under sinusoidal excitation are experimentally measured. Finally, we establish a TPM imaging platform and perform imaging using a fluorescent target and pollen granules to validate the impact of trajectory error on imaging quality and the effectiveness of the proposed correction method. This study presents a measurement-based approach to characterizing and correcting trajectory errors in parametrically resonant MEMS Lissajous scanning: circuit amplitude measurements guide drive adjustment, while measured circuit and mirror phase delays narrow the image-based search before images of the fluorescent target are used to determine the final compensation phases.
2. Materials and Methods
2.1. Principle of Lissajous Scanning
In 2D optical scanning imaging, Lissajous scanning is a trajectory generated by simultaneously applying continuous sine or cosine drive signals along two orthogonal axes (X and Y). The corresponding kinematic model can be expressed as follows:
where and denote the spatial positions of the scanning point in the Cartesian coordinate system at time t. and represent the scanning amplitudes, which directly determine the FOV. and denote the scanning frequencies along the X- and Y-axes, while and denote the initial phases.
The morphology, geometric complexity, and temporal characteristics of a Lissajous scanning trajectory are fundamentally determined by the relationship between the scanning frequencies and . When and are positive integers with a greatest common divisor , Equation (2) holds [28]. The parameters and denote the lobe numbers, which represent the elapsed number of the X-axis or Y-axis periods [29].
If the time variable t in Equation (1) is eliminated, the trajectory equation can be obtained as
The Lissajous trajectory is governed by the parameter . In TPM systems, the phases and of the Lissajous scanning trajectory are primarily influenced by several factors, including the initial phases of the driving signals, the phase delay of the MEMS mirror, and the time delay introduced during signal transmission in the driving circuit. Therefore, accurate analysis and characterization of the phase relationship within the system are essential to ensure consistency between the actual and theoretical scanning trajectories. Furthermore, such analysis and characterization also play a critical role in reducing reconstruction artifacts and distortion, thereby improving overall imaging quality.
The frame rate (FR) of Lissajous scanning is defined as the inverse of the pattern repetition period, expressed as FR = . The imaging quality strongly depends on the trajectory line density within a single frame. The scanning pattern number of lobes, denoted by N, determines the trajectory density. For given phases and , and under the constraint of the maximum achievable operating frequency, increasing leads to a higher scanning density.
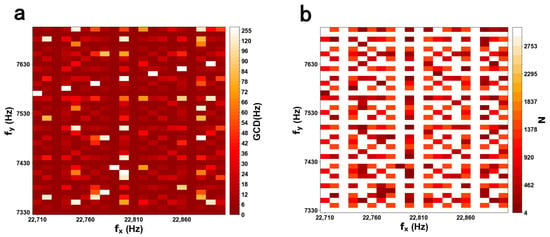
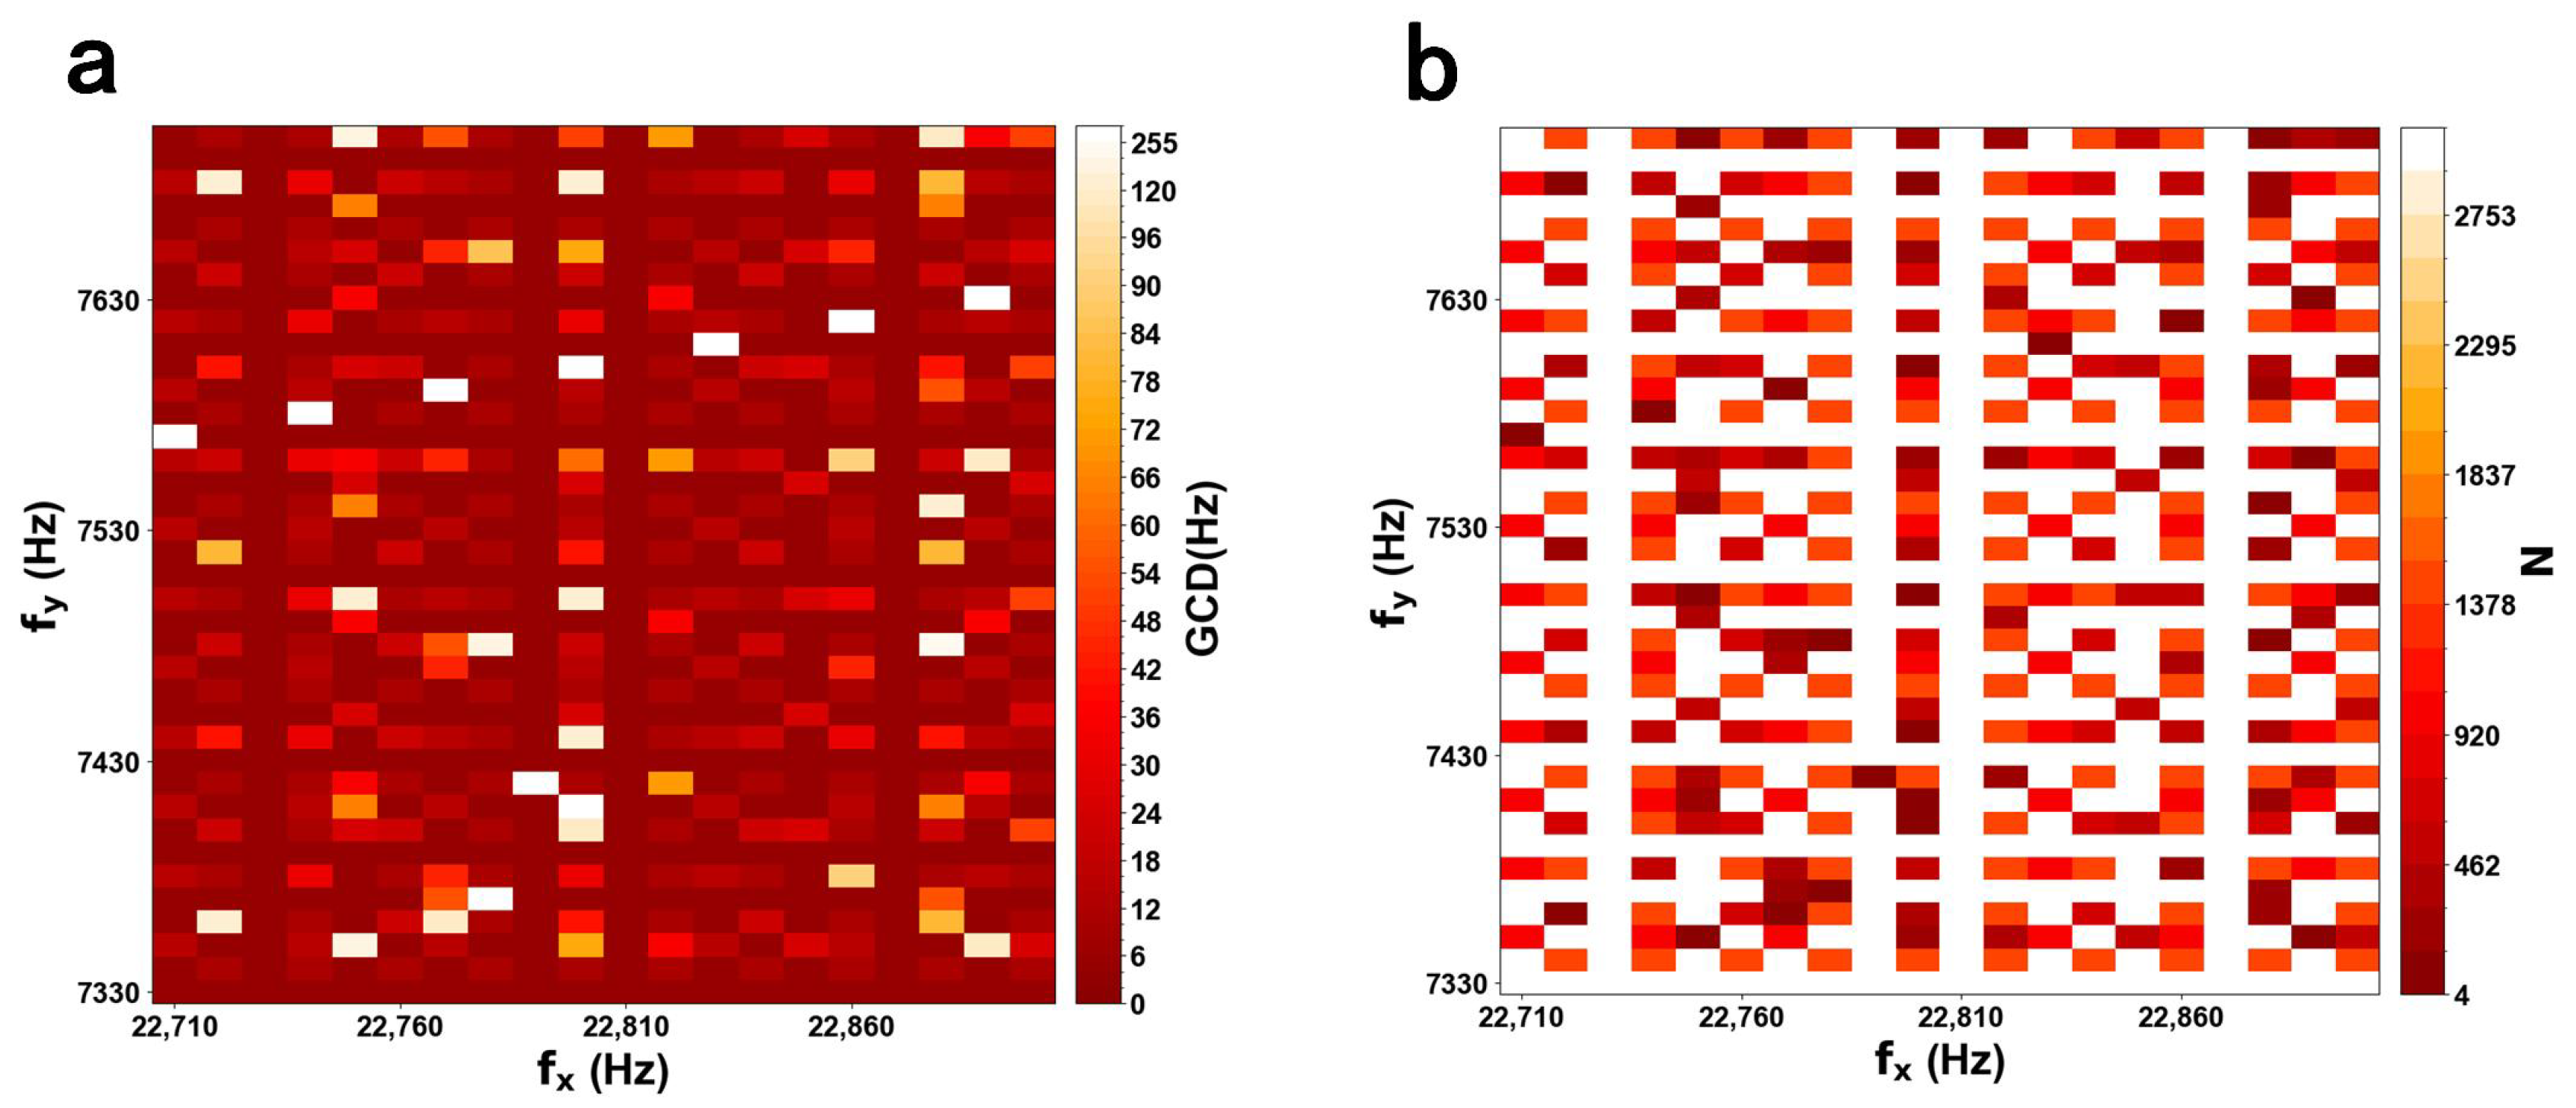
According to Equation (4), an inherent trade-off exists between N and , indicating that scanning density and FR are mutually constrained. Suitable values for and should be chosen to balance scanning density and FR. Figure 1a shows the color map of the GCD based on different scanning frequencies. Figure 1b shows a color map of the number of lobes N for an X-axis frequency range of 22,710–22,900 Hz and a Y-axis frequency range of 7330–7700 Hz. The maximum () and minimum () values correspond to white and red, respectively.
Figure 1.
(a) Color mapping of the greatest common divisor (GCD). (b) Color map of the total lobe number (N), with the colormap ranging from red (minimum, ) to white (maximum, ).
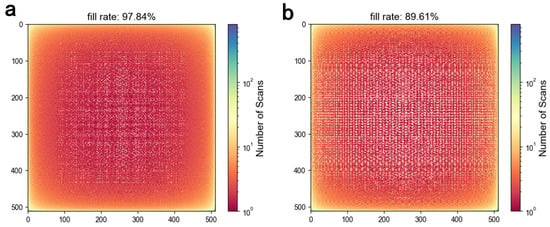
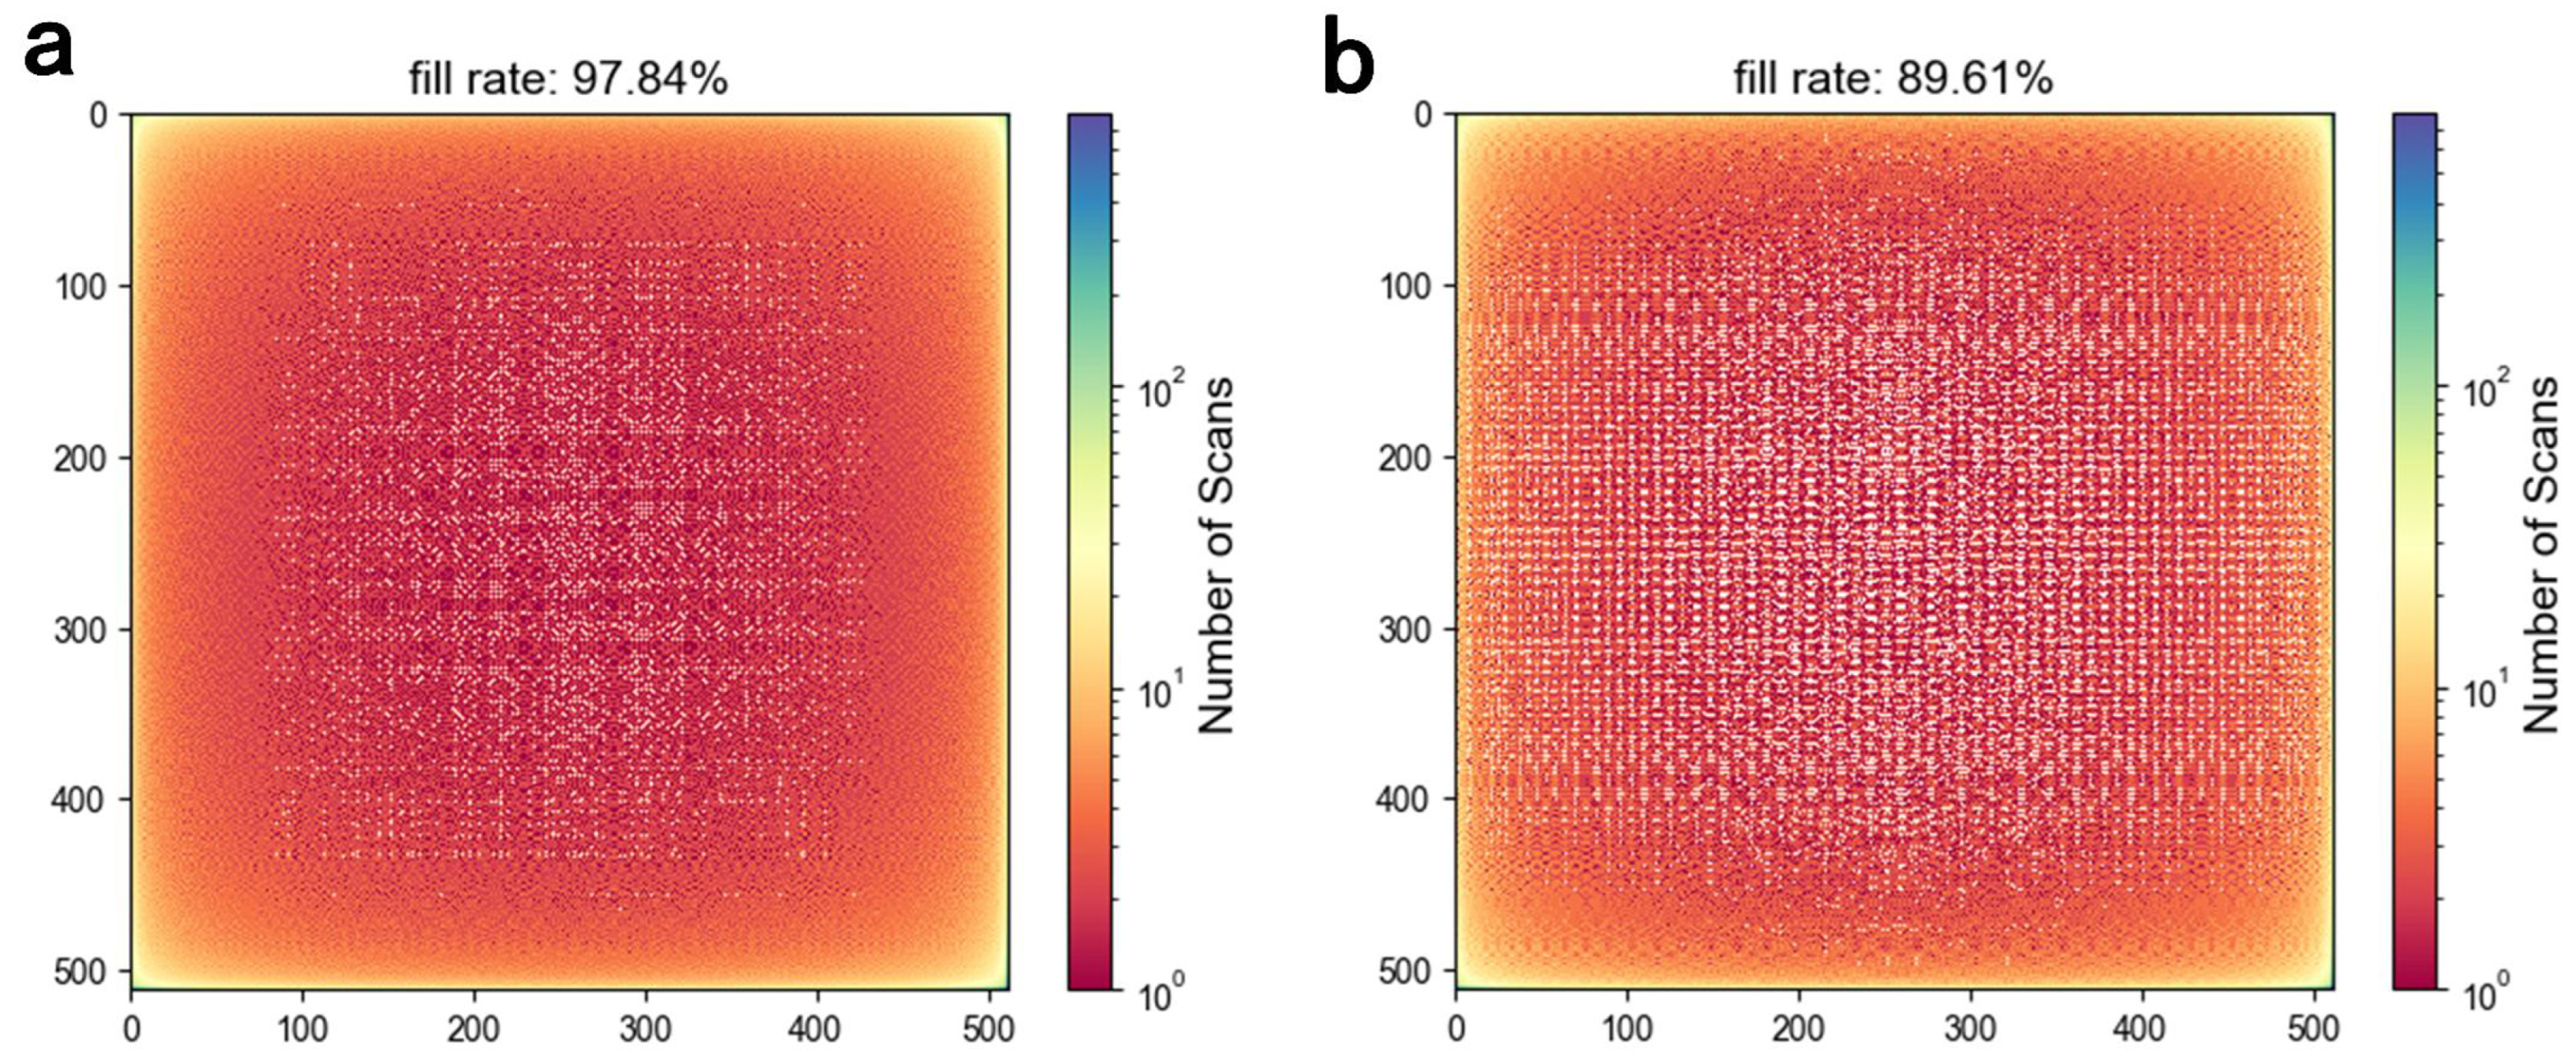
Lissajous scanning is employed to generate a pixel image. Whenever the trajectory passes through a pixel location, a counter is incremented. The fill factor is calculated by checking whether the counter at each pixel is non-zero. For the frequency pair of 22,720 Hz and 7420 Hz used in the simulation, the initial phases were set to with sampling points. The fill factor in a pixel grid was 97.84%, corresponding to an imaging FR of 10 fps. When the Y-axis phase shifts from to , the fill factor decreases to 89.61%, as shown in Figure 2. For the parametrically resonant MEMS mirror used in this work, the mechanical scanning frequency is one-half of the corresponding electrical driving frequency, as described in Section 2.2.
Figure 2.
Simulated fill factor of Lissajous scanning with sampling points and an image size of pixels. (a) , , , , with a fill factor of 97.84%. (b) , , , , with a fill factor of 89.61%.
2.2. Principle of an Ultra-Compact Electrostatic MEMS Mirror
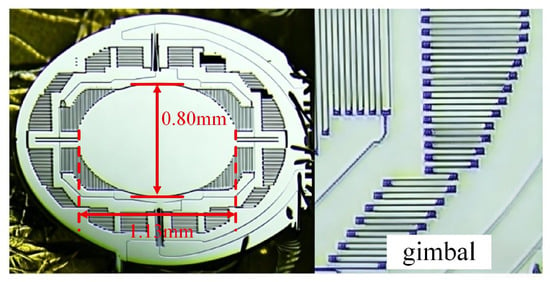
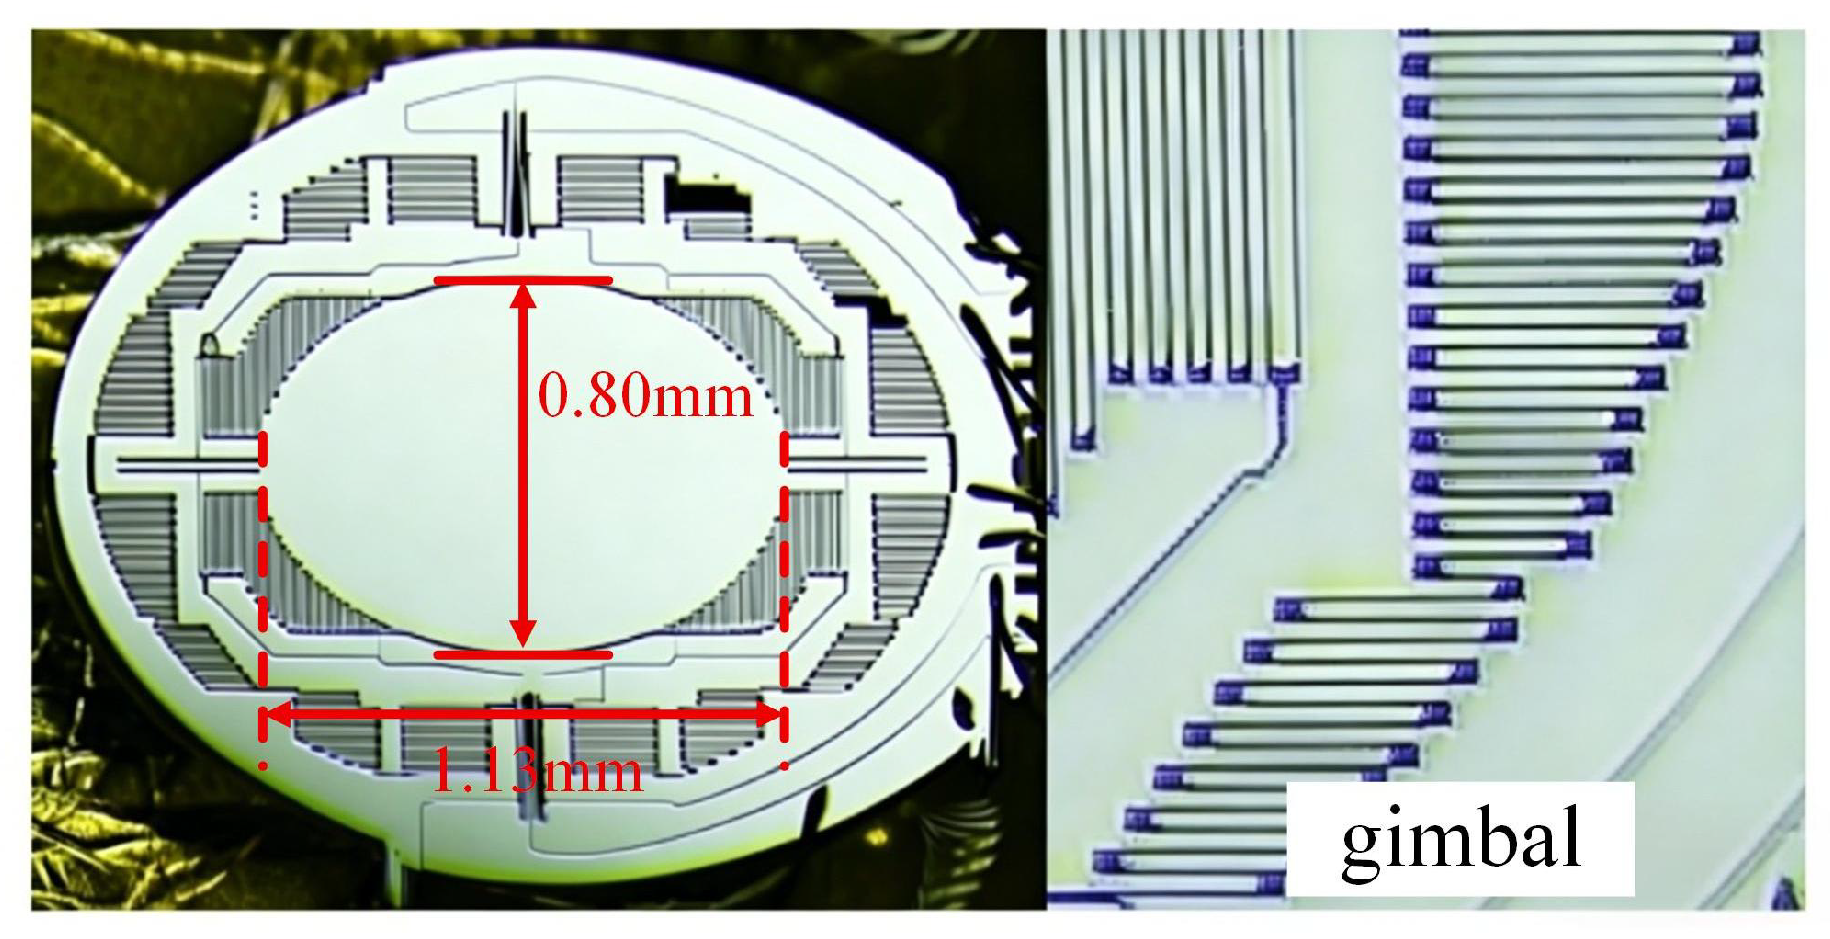
Figure 3 illustrates the schematic of the ultra-compact 2D electrostatic MEMS mirror. The device operates under parametric resonance and is driven by the nonlinear torque arising from electrostatic comb drives. Applying a driving voltage generates a driving torque due to the capacitance gradient relative to the rotation angle . The orthogonal axes are actuated by separate comb-drive sets and operate in well-separated frequency bands, allowing their responses to be modeled independently under the selected operating conditions. For , the equation of motion is given by:
where is the moment of inertia, is the damping coefficient, and is the torsional spring constant, while is the rotation angle of the torsion bar. is the driving torque applied to the corresponding axis. The driving torque in the comb drive structure originates from the electrostatic energy gradient with respect to the rotation angle. The resulting torque can be expressed as:
where denotes the capacitance gradient, and is the applied voltage. The driving voltage is typically expressed as:
where denotes the driving voltage amplitude, represents the driving frequency, and is the phase of the driving voltage. denotes the natural resonance frequency of the corresponding mechanical mode. According to the Mathieu equation, when the driving frequency approaches (typically ), the MEMS mirror enters an unstable region (Mathieu Tongues), leading to large-amplitude oscillations [30].
Figure 3.
Schematic diagram of the MEMS mirror and an enlarged view of a partial structure.
The MEMS mirror can be modeled as a second-order mechanical vibration system characterized by inertia, elasticity, and damping. When an external signal periodically modulates the system parameters via electrostatic force, the system fails to synchronize instantaneously with the driving signal. Instead, it requires a finite energy accumulation period to establish a steady-state oscillation, leading to a temporal delay in angular displacement that manifests as a phase delay. Environmental conditions also affect the dynamic response of the MEMS mirror. For example, temperature variations may alter the elastic modulus and structural stress of the material, while changes in air pressure and humidity influence air damping characteristics. In addition, external mechanical disturbances or vibrations may affect the transient response of the system. Therefore, in a Lissajous scanning system based on the MEMS mirror, phase delay is inherent and exhibits nonlinear characteristics.
The electrical driving path includes digital-to-analog conversion (DAC) and high-voltage amplification for MEMS actuation. Signal propagation through these stages introduces a finite time delay , resulting in a frequency-dependent phase delay in the electrical excitation.
The Lissajous trajectory of the laser scan can be expressed by Equation (9):
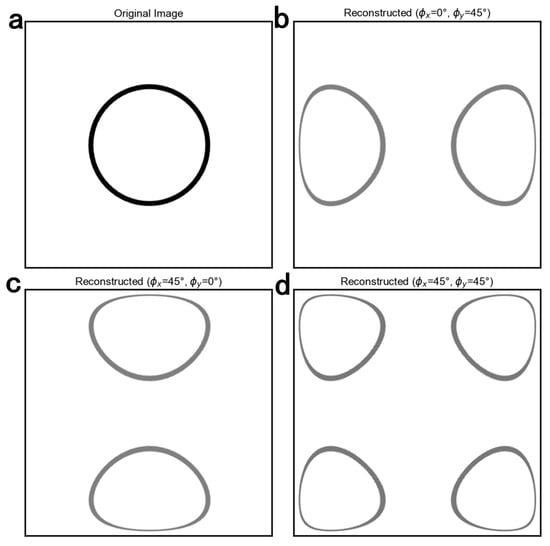
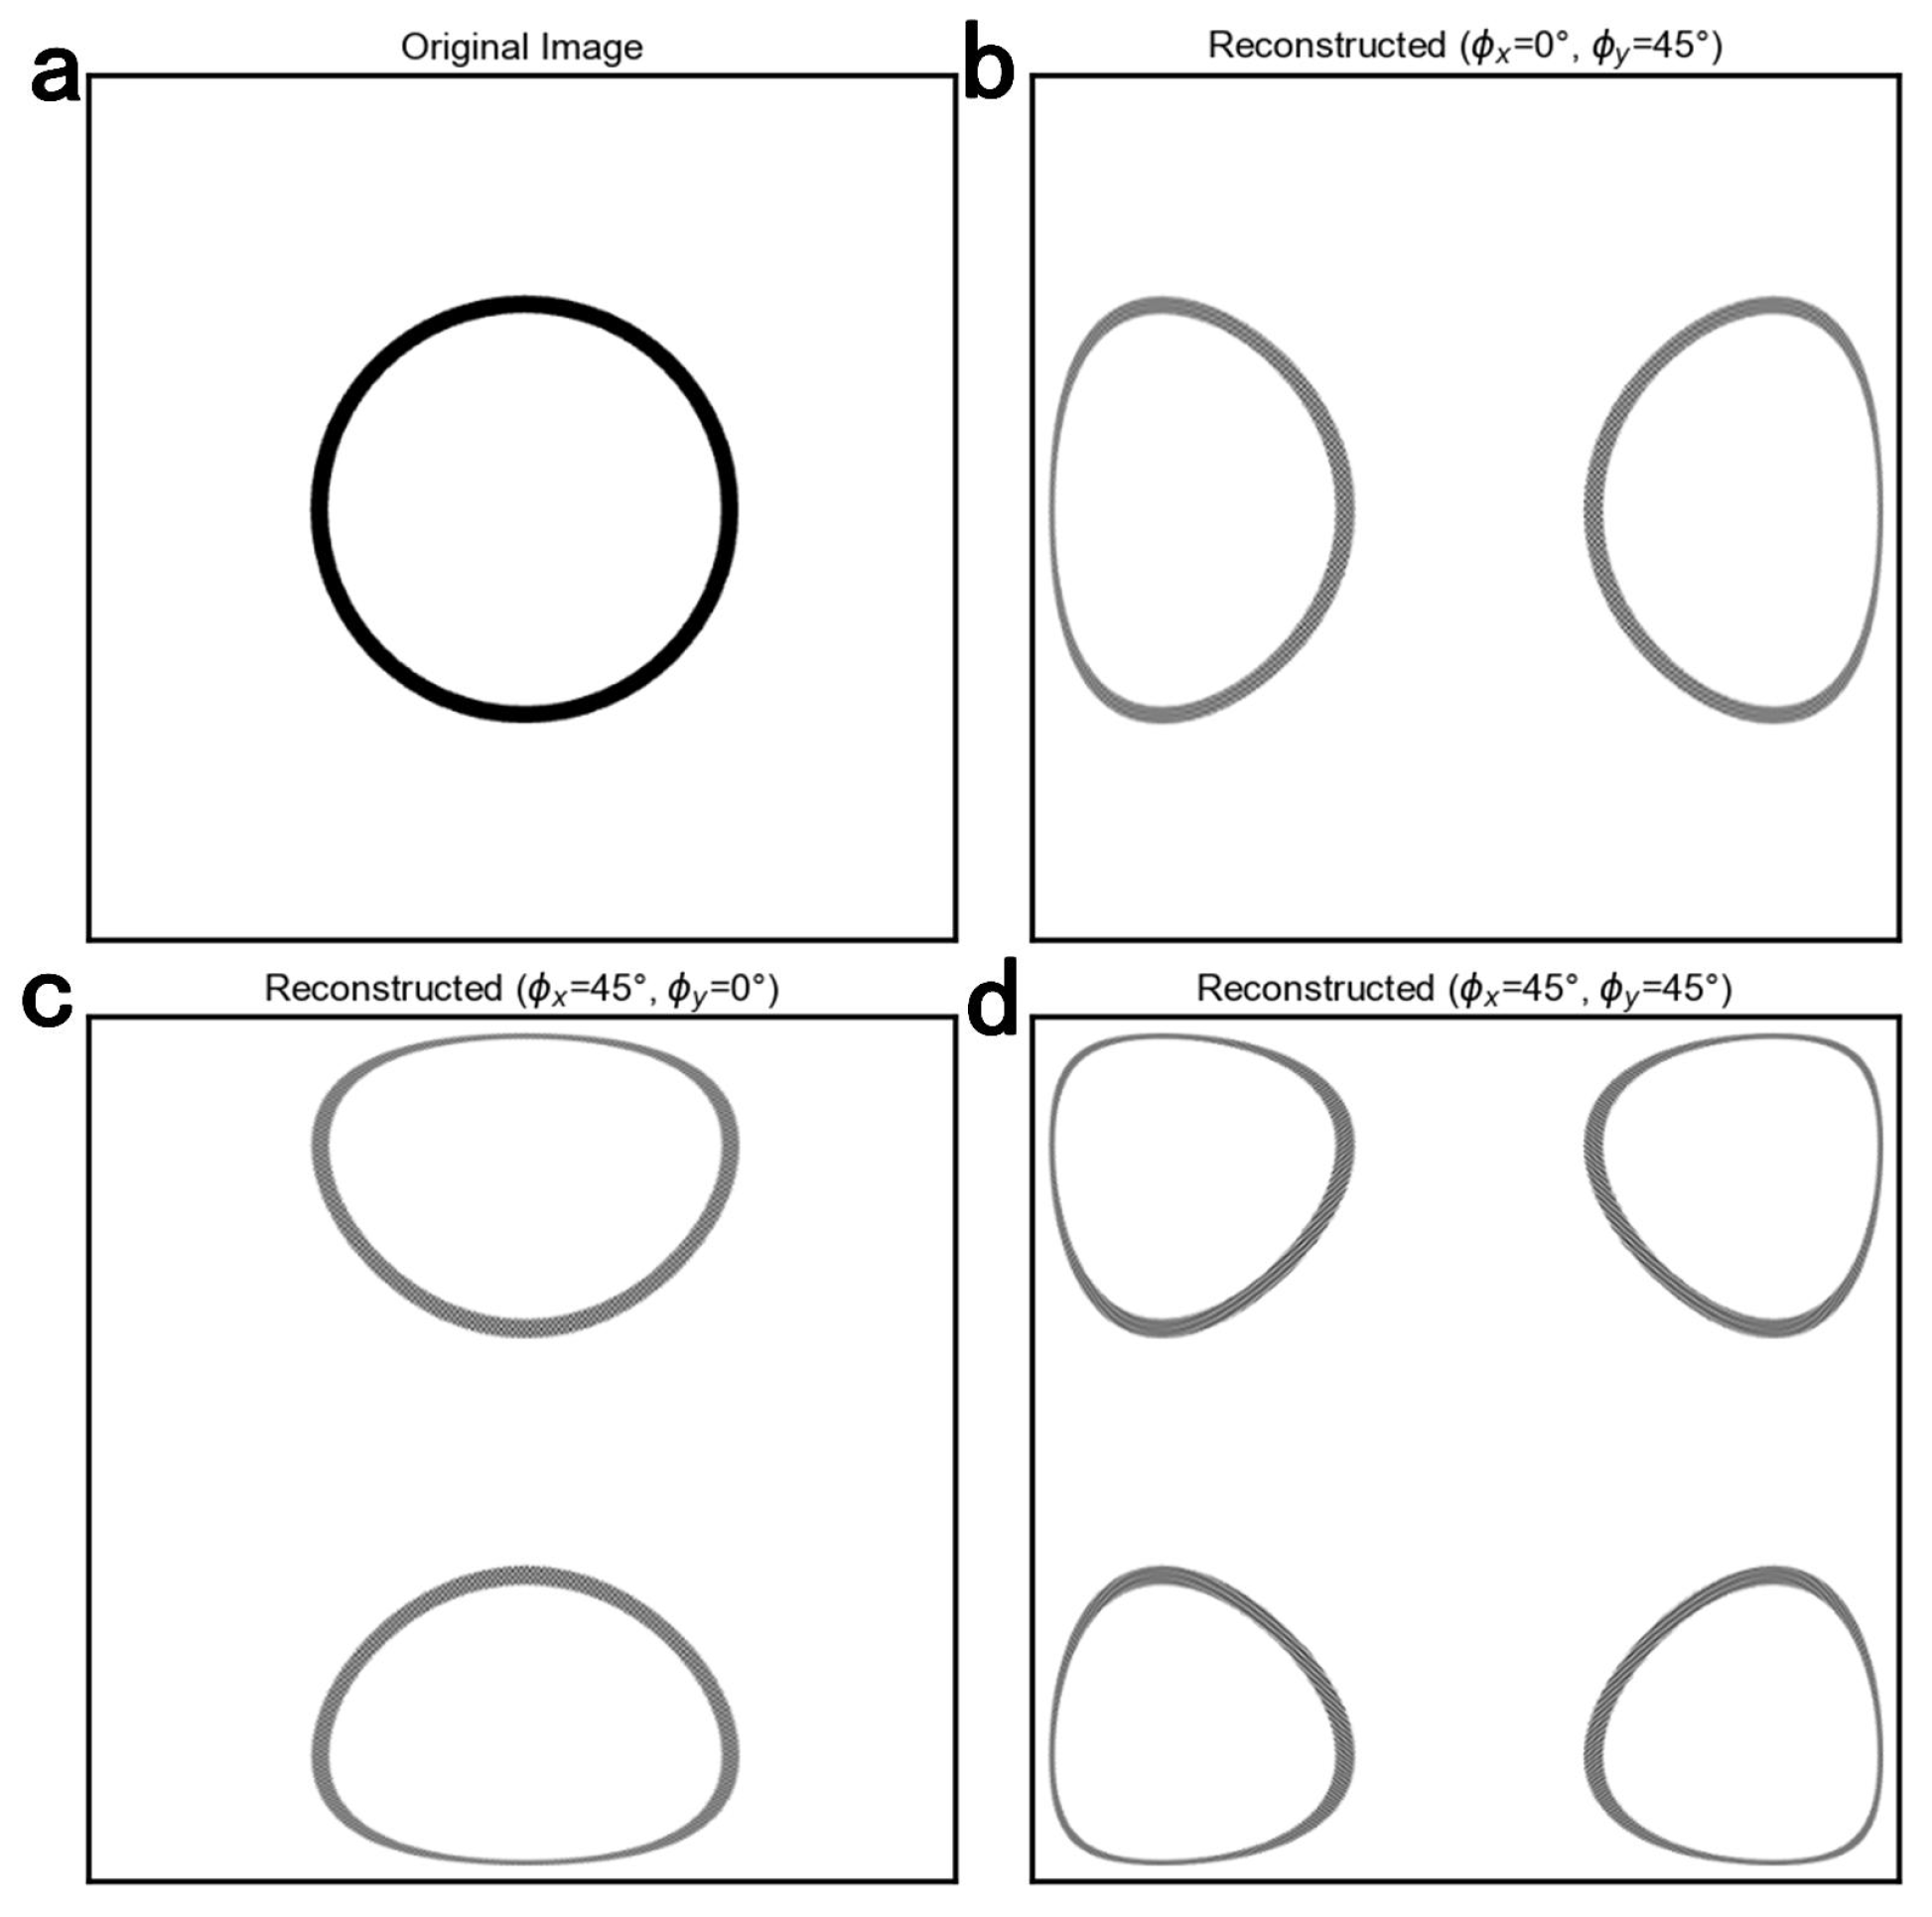
where represents the actual scanning position along a single axis, is the maximum scanning amplitude, and is the driving frequency, while and denote the positive phase delays introduced by the driving circuit and the MEMS mirror response, respectively. Throughout this manuscript, a positive phase delay denotes a lag relative to the nominal trajectory; therefore, both delay terms appear with negative signs in Equation (9). According to Lissajous scanning theory, the frequencies of the two axes determine the scanning density, while the phases affect the trajectory shape. Phase delay causes the actual scanning trajectory to diverge from its ideal path, resulting in spatial mapping errors during the image reconstruction process. To evaluate the impact of phase on image reconstruction quality, we generated a Lissajous scanning trajectory via numerical simulation. In the simulation, the driving frequencies were set to = 22,720 Hz and = 7420 Hz, with both initial phases set to , and discrete sampling was performed at a rate of samples/s. Upon incorporating a phase offset into each scanning axis, the resulting reconstructed image exhibits pronounced overlapping artifacts, as illustrated in Figure 4.
Figure 4.
(a) Original image. (b) Image reconstruction with a phase delay of on the driving signal of the MEMS mirror Y-axis. (c) Image reconstruction with a phase delay of on the driving signal of the MEMS mirror X-axis. (d) Image reconstruction with 45° phase offsets applied to both scanning axes.
3. MEMS Mirror Scanning System Measurement
3.1. Frequency Response of the MEMS Mirror
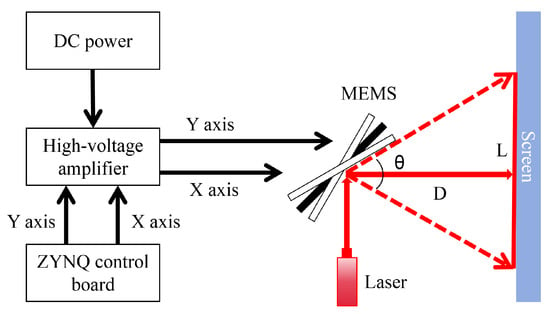
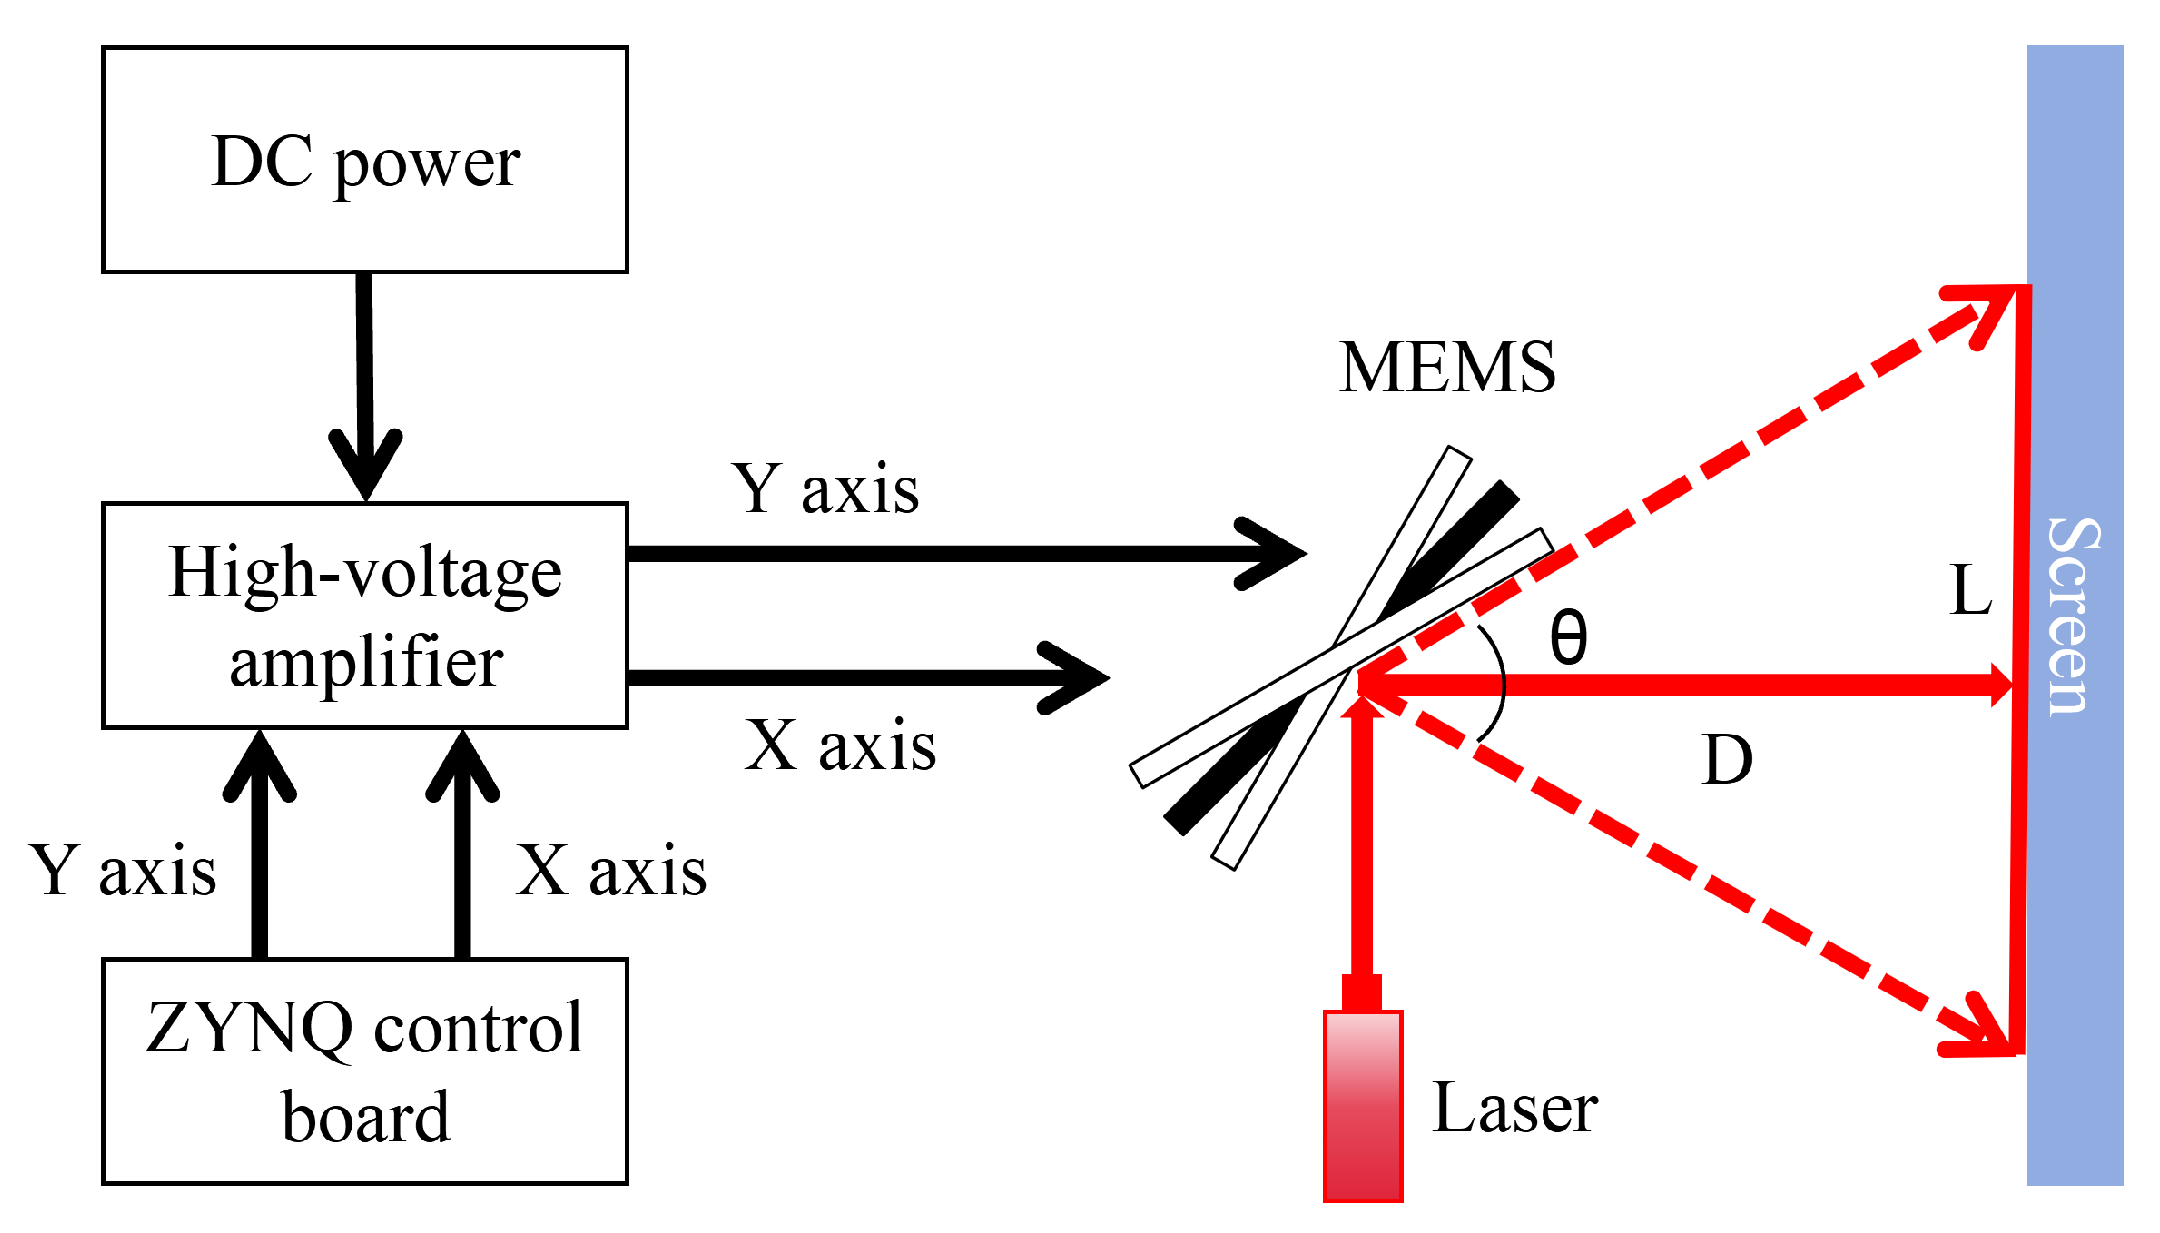
We constructed an experimental setup to characterize the dynamic response of the MEMS mirror, as illustrated in Figure 5. The measurement system uses a ZYNQ control board (Beijing Transcend Vivoscope Biotech Co., Ltd., Beijing, China) to generate two channels of driving signals. A PDu150 high-voltage amplifier (PiezoDrive, Newcastle, NSW, Australia; bandwidth: 180 kHz; output noise: RMS) amplifies the drive signals for the MEMS mirror. The amplifier output was a continuously applied sinusoidal voltage with a DC offset. The MEMS mirror driving voltages reported in this study refer to the peak-to-peak values measured at the amplifier output; at 60 V, the electrode voltage varied from 0 to 60 V, corresponding to a 30 V DC offset and a 30 V sinusoidal amplitude. The laser beam was incident on the stationary MEMS mirror at an angle of to its surface normal, and the screen was positioned perpendicular to the reflected beam in this stationary configuration. The scan angle was measured with one axis driven at a time. As the mirror oscillated, the instantaneous incidence angle changed, and the two extreme positions of the reflected beam formed a laser line on the screen. The full optical scan angle was calculated as:
where D is the distance from the mirror to the screen along the stationary reflected beam, and L is the separation between the two extreme positions of the reflected beam on the screen. This expression assumes that these positions are approximately symmetric about the stationary beam position.
Figure 5.
Schematic diagram of the frequency response measurement system for the MEMS mirror.
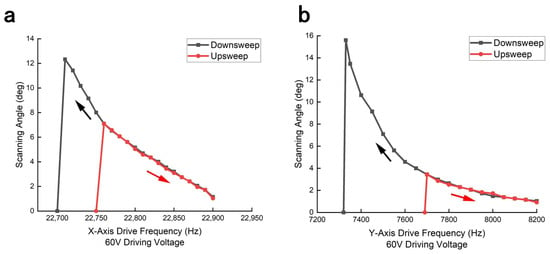
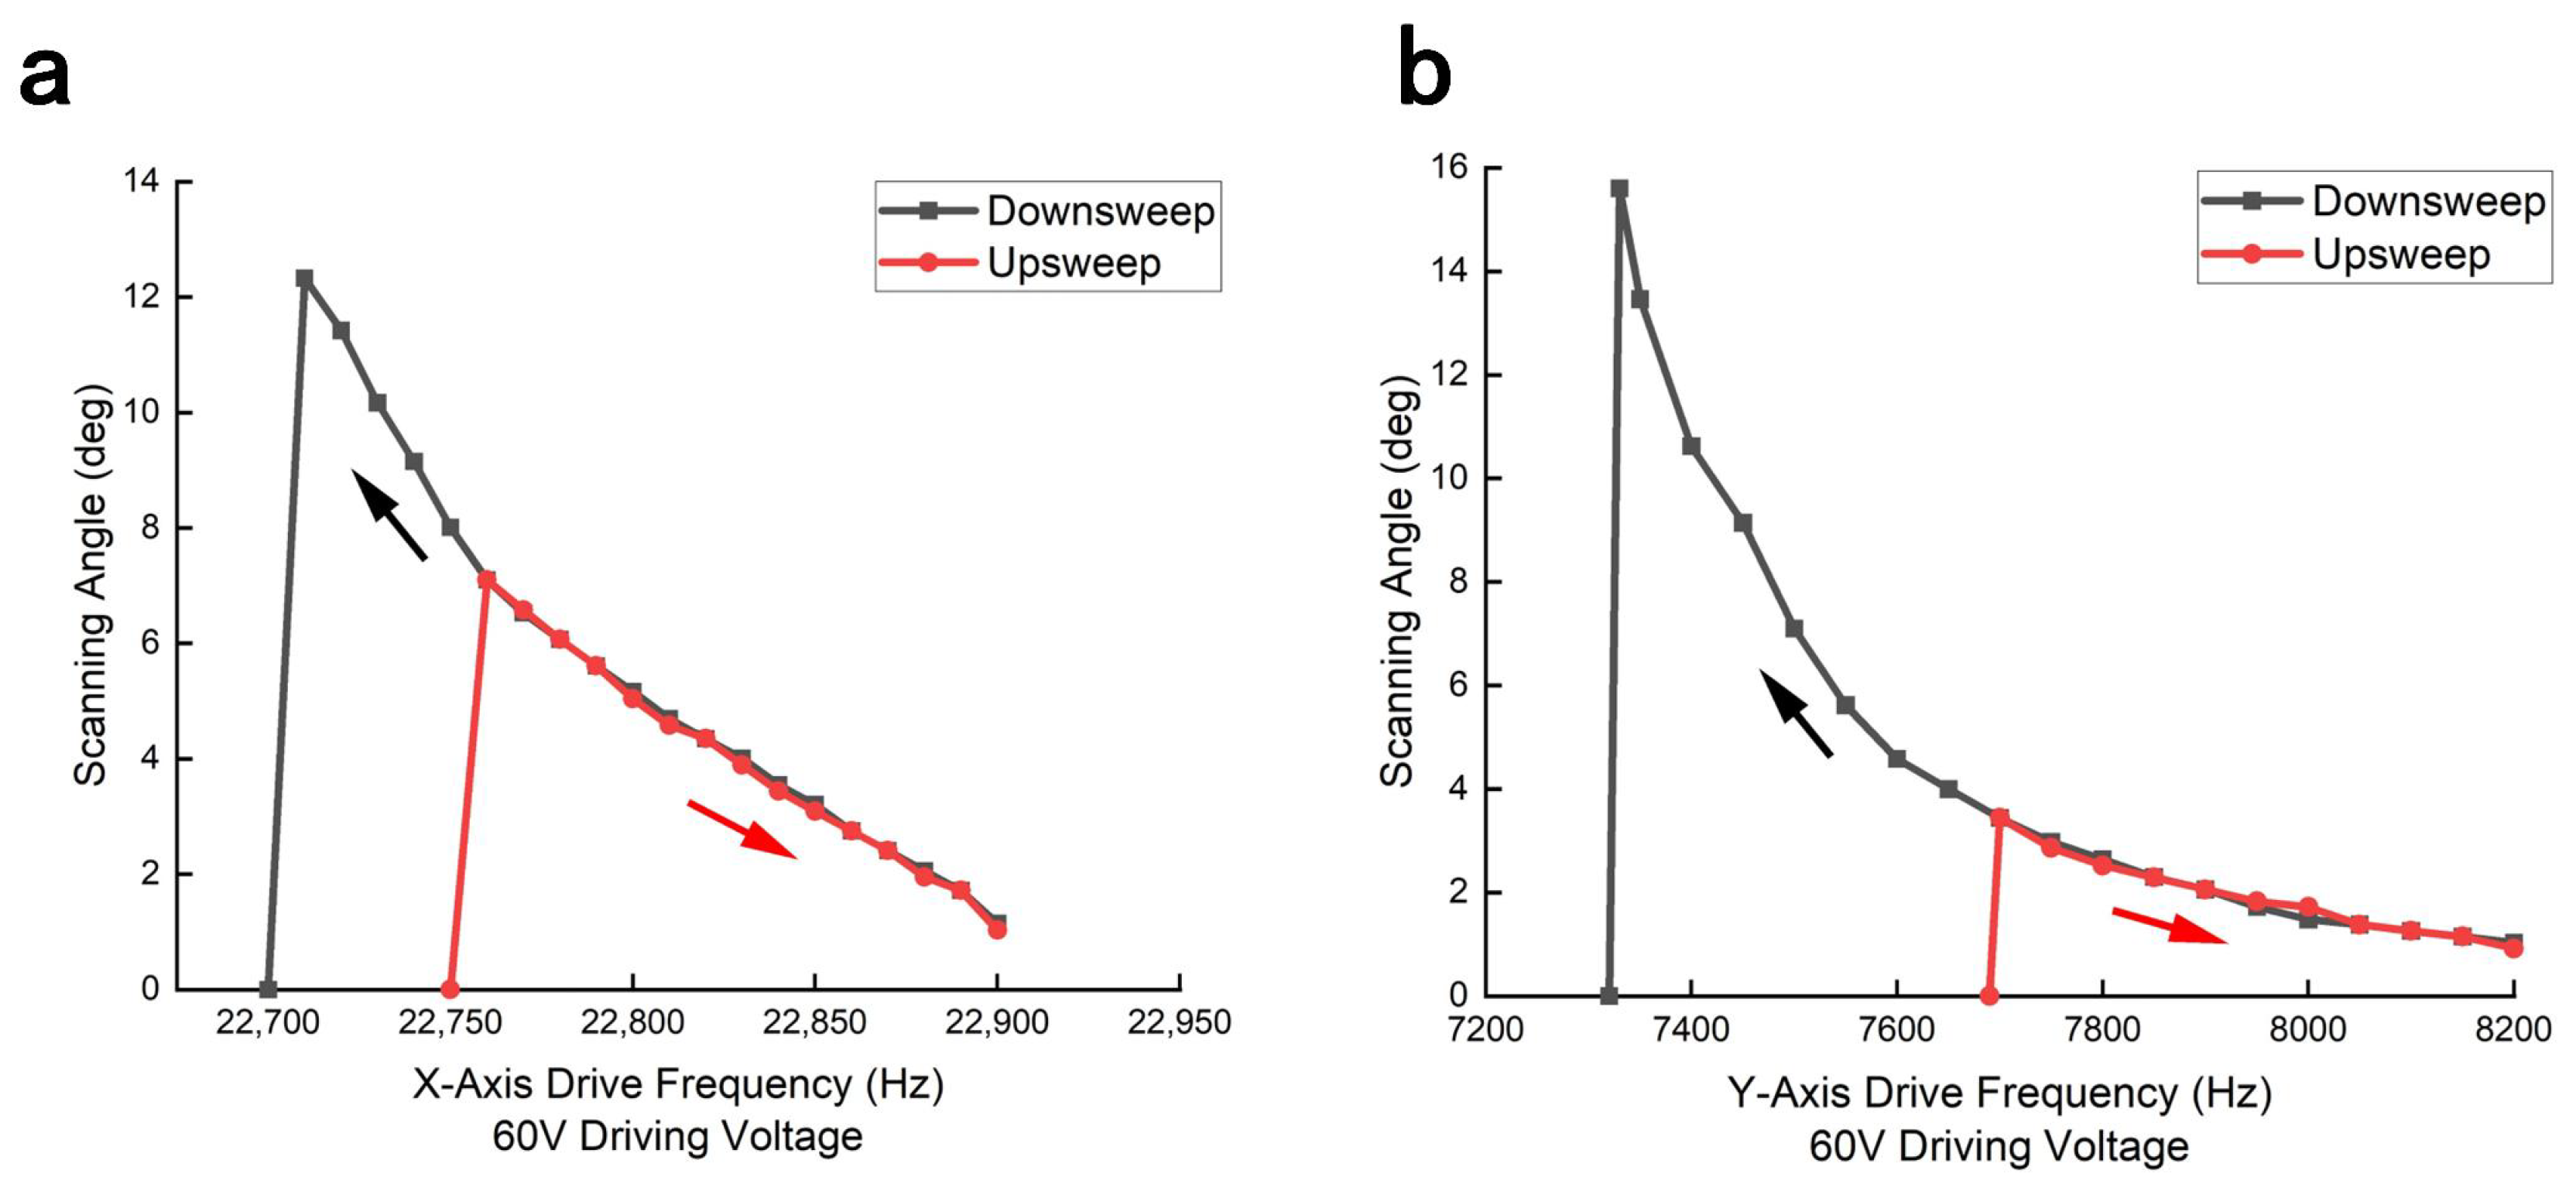
We characterized the scan angle of the MEMS mirror as a function of driving frequency at 60 V. Each target frequency was measured in a separate sweep. Before each sweep, the drive was switched off until the projected laser line disappeared and the mirror stopped oscillating. The X- and Y-axis downsweep started at 23,500 and 8500 Hz, respectively, whereas the upsweep started at 22,650 and 7000 Hz, respectively. The driving frequency was stepped toward each target in 2 Hz increments, with the waveform applied for 100 electrical cycles at each frequency step. After reaching the target frequency, the drive was maintained until the projected laser-line length appeared stable. The line length was then measured once, and the corresponding optical scan angle was calculated using Equation (10). The resulting characteristics are depicted in Figure 6.
Figure 6.
(a) Scanning characteristics of the MEMS mirror along the X-axis under a sinusoidal driving voltage of 60 V. (b) Scanning characteristics of the MEMS mirror along the Y-axis under a sinusoidal driving voltage of 60 V. The reported angles are full optical scan angles derived from the projected laser-line lengths. The black and red arrows indicate the frequency downsweep and upsweep directions, respectively.
Experimental results indicate that at a driving voltage of 60 V, the MEMS mirror exhibits pronounced oscillation during the downsweep mode. As the frequency approaches approximately 22,710 Hz, the full optical scan angle reaches a maximum of , whereas the peak angle is limited to in the upsweep mode. Under the same conditions, the maximum scan angles of the Y-axis are and in downsweep and upsweep modes, respectively. Leveraging the enhanced scan angles attained during downsweep mode, we can select driving frequencies that simultaneously satisfy FOV and FR constraints while ensuring imaging stability.
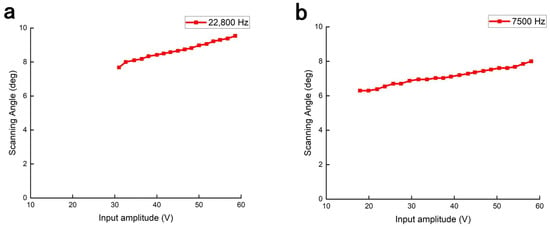
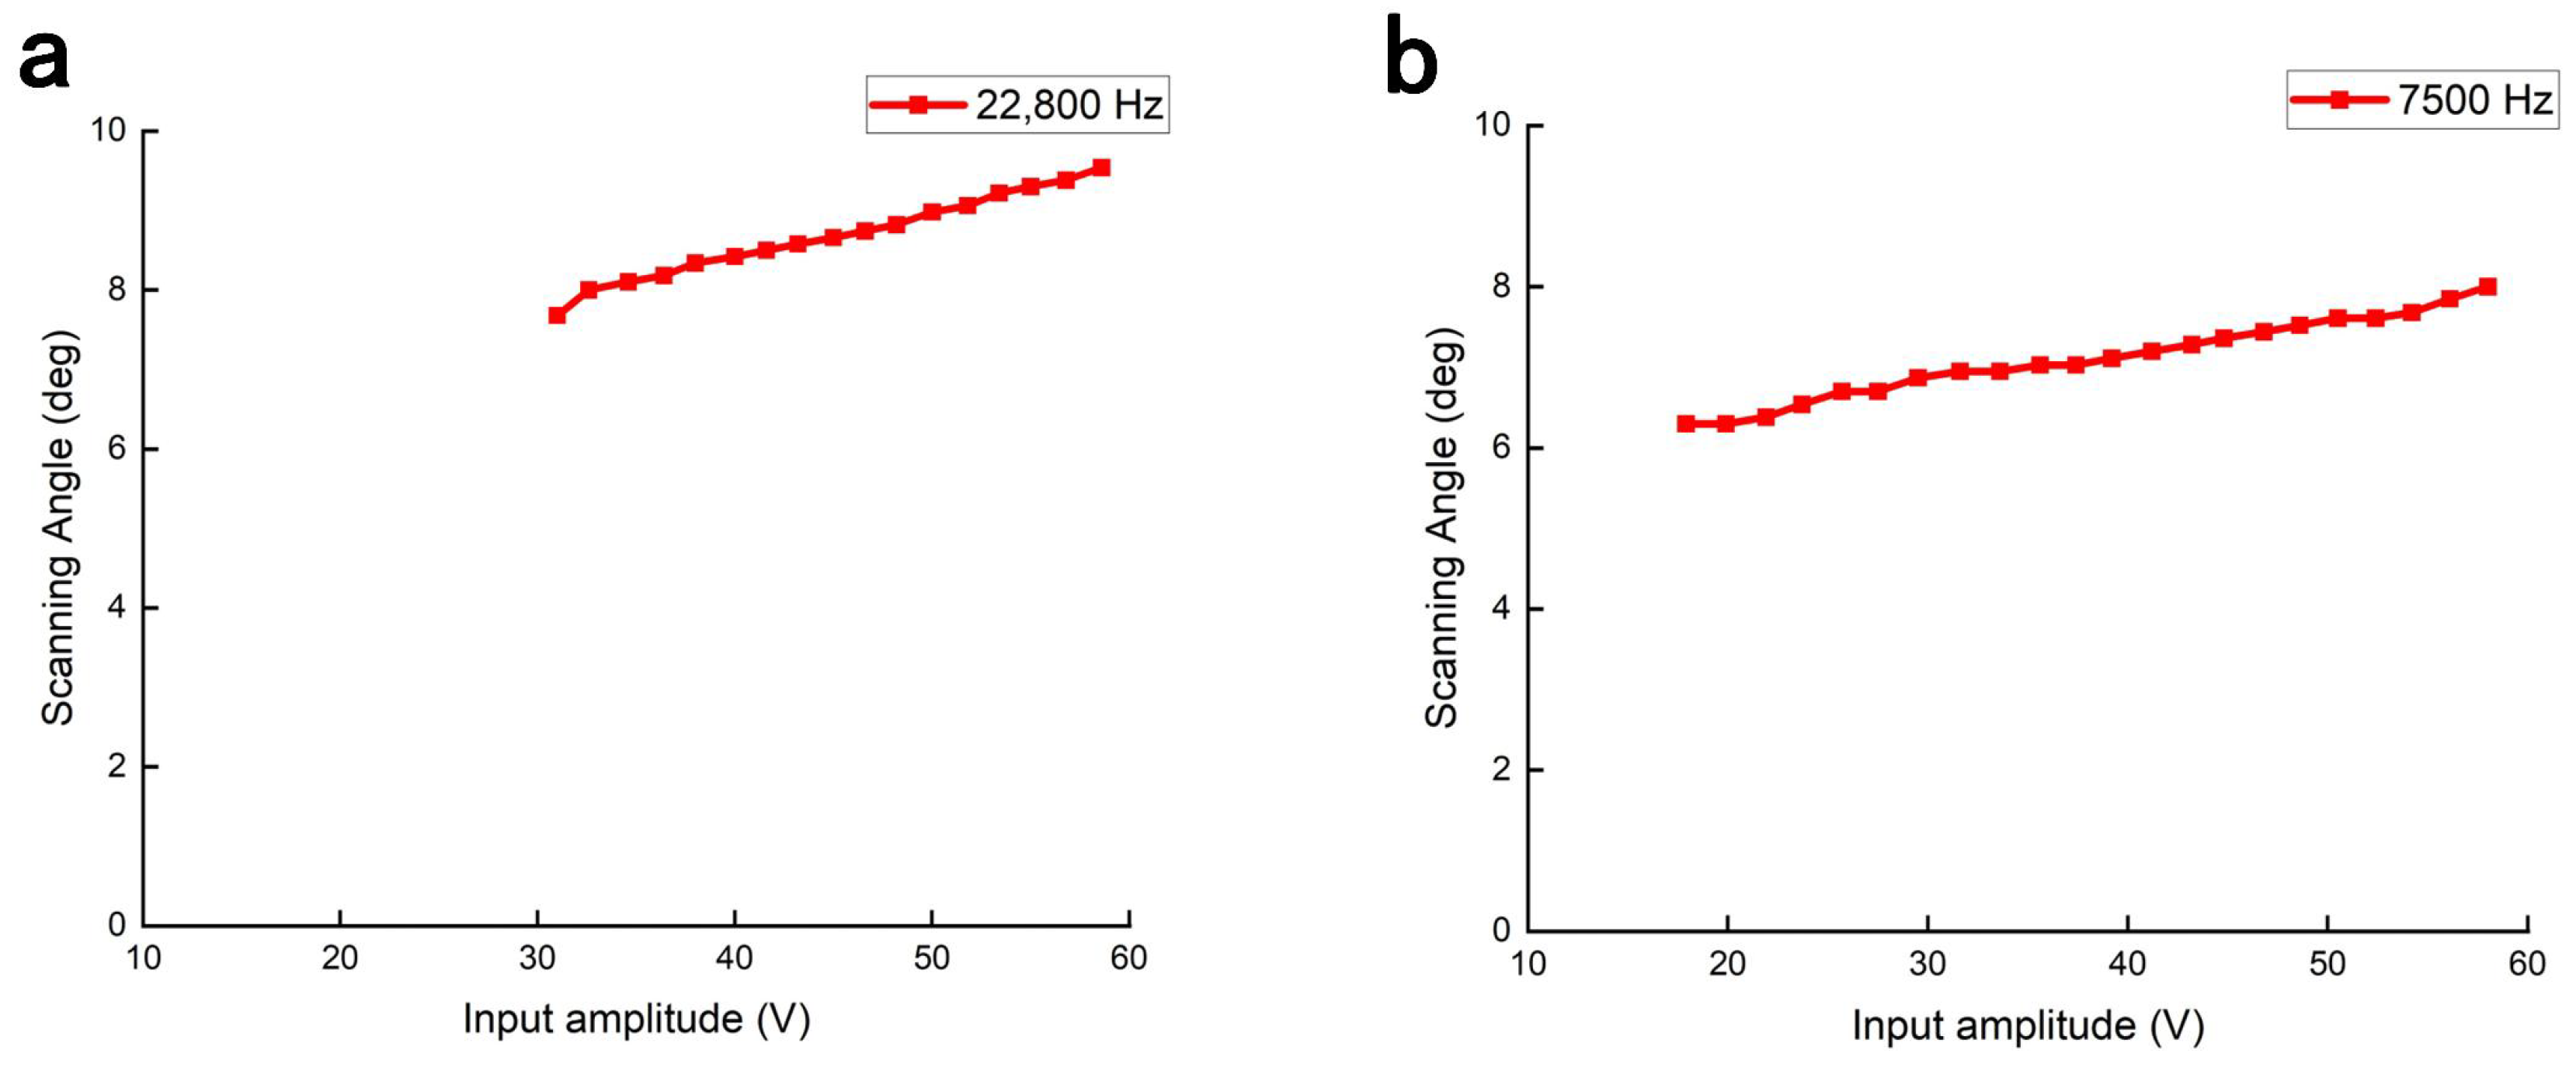
We measured the full optical scan angle at different driving voltages while holding the driving frequency at 22,800 Hz for the X-axis and 7500 Hz for the Y-axis. As shown in Figure 7, the X-axis scan angle increased from to as the voltage increased from 31 to . The Y-axis scan angle increased from to as the voltage increased from 18 to . No clear saturation plateau was observed within these measured voltage ranges.
Figure 7.
(a) Relationship between driving voltage and scan angle of the X-axis at a driving frequency of 22,800 Hz. (b) Relationship between driving voltage and scan angle of the Y-axis at a driving frequency of 7500 Hz. The lines connect individual measurements and do not represent a fitted response model.
According to Lissajous scanning theory, a trade-off exists between scanning density and FR. At a driving voltage of 60 V, the MEMS mirror exhibits an operating frequency range of 22,710–22,900 Hz along the X-axis and 7330–8200 Hz along the Y-axis. At an image acquisition rate of 10 fps, three driving-frequency pairs were selected within the measured downsweep response to compare how frequency-dependent scan angles affect the imaging FOV, as summarized in Table 1. In general, the selection of frequency pairs that balance FR and scanning density near the maximum scan angle leads to optimal imaging performance.
Table 1.
Selected operating parameters for Lissajous imaging. The dash indicates that the FOV was not measured for the 22,720/7422 Hz frequency pair.
3.2. Amplitude and Phase Errors in the Driving Circuit
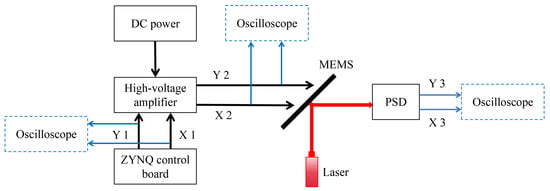
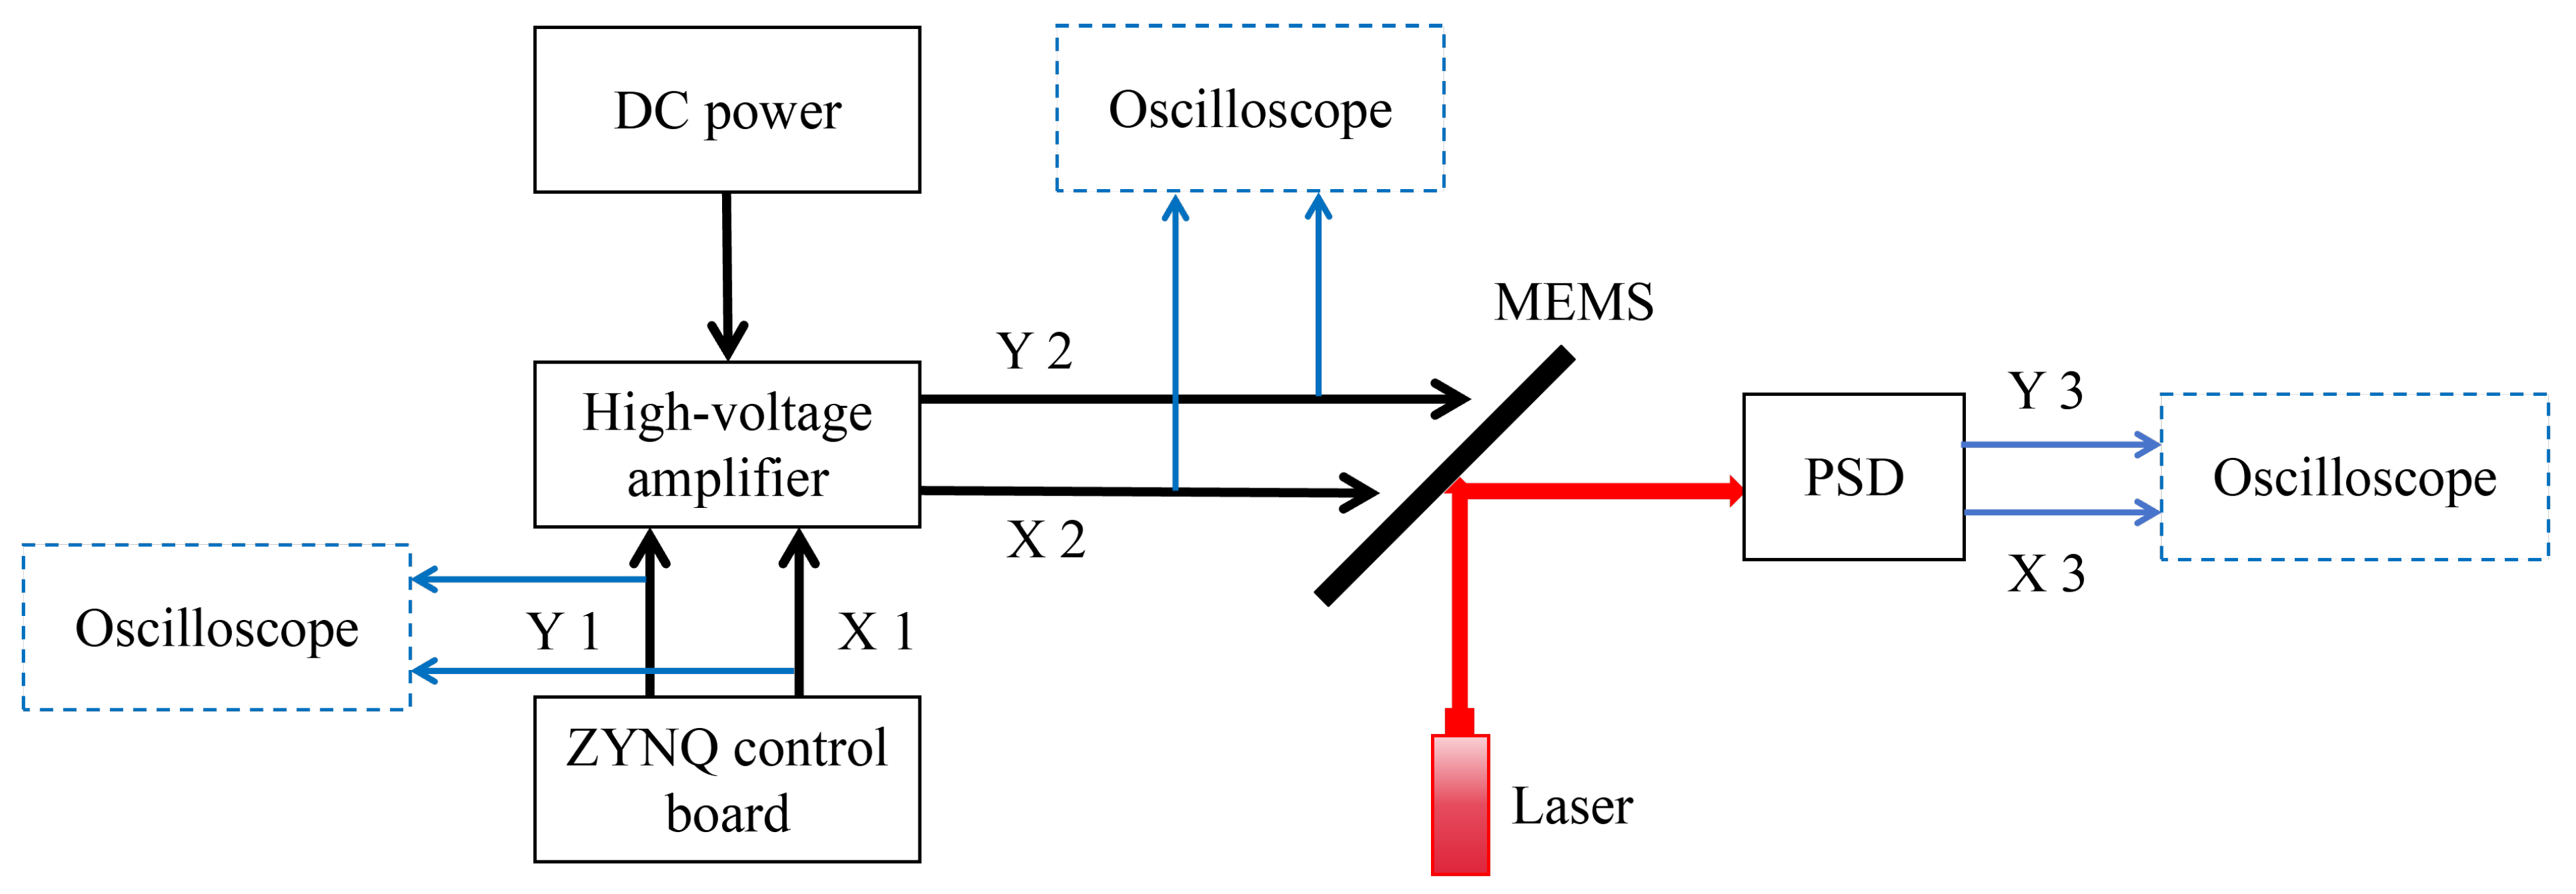
As shown in Figure 8, we constructed an experimental setup to measure the system phase delay and amplitude error of the driving circuit. The setup consists of a driving signal generator, a MEMS mirror, a position-sensitive detector (PSD, PDQ80A, Thorlabs, Newton, NJ, USA), and an oscilloscope. The PSD has a spectral response range of 400–, a manufacturer-recommended beam diameter of –, a nominal bandwidth of , and a nominal transimpedance gain of . An oscilloscope was used to simultaneously acquire the original driving signals (X1/Y1) from the ZYNQ control board and the amplified signals (X2/Y2) from the high-voltage amplifier, enabling measurement of the amplitude and phase delay introduced by the high-voltage amplifier. The measured peak-to-peak voltage of the amplified signal was approximately ten times that of the ZYNQ output under the tested conditions. A 635 nm laser (GCI-07-635-20, DHC, Beijing, China) illuminated the MEMS mirror at an incidence angle of . The mirror aperture limited the portion of the incident beam reflected toward the detector, and the reflected spot was positioned within the detector’s active area. The PSD generated differential analog signals (X3/Y3) from the quadrant photocurrents, and these outputs were connected directly to the oscilloscope. The electrode-drive signals (X2/Y2) served as the references for the corresponding PSD outputs (X3/Y3), and the response phase delays were determined using the procedure described in Section 3.3. The PSD signals were used for phase measurement without conversion to absolute spot position or mechanical angular displacement. The full optical scan angle was measured independently using the screen-based method described in Section 3.1.
Figure 8.
Schematic diagram of the Lissajous trajectory measurement platform based on a MEMS mirror. PSD: position-sensitive detector. DC power: direct current power supply.
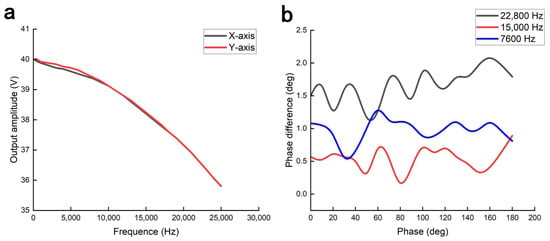
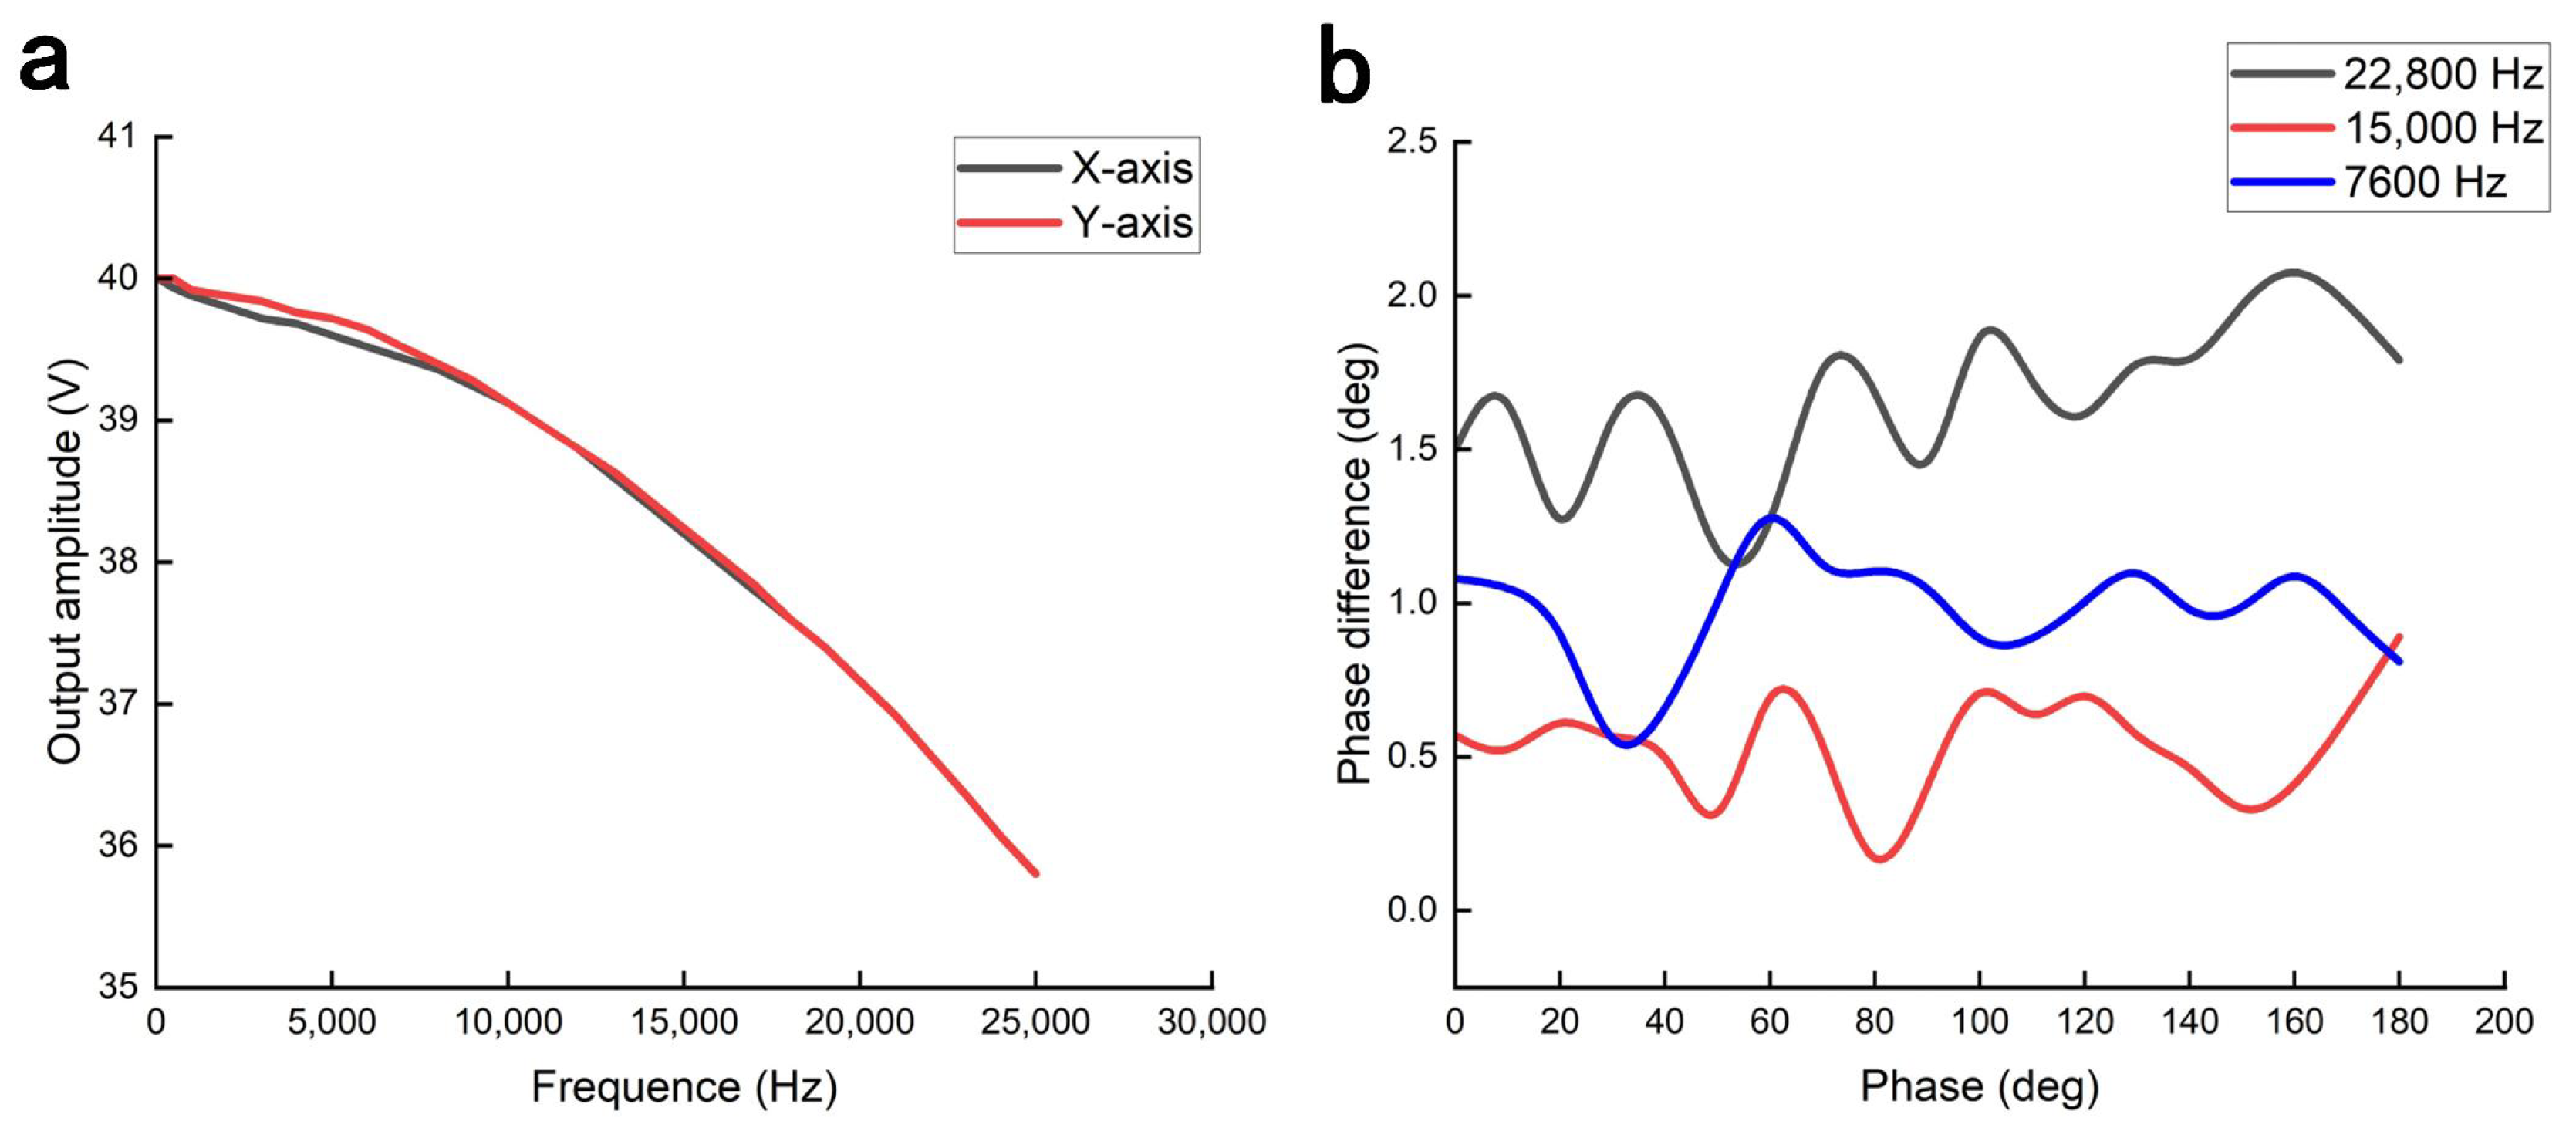
We used an oscilloscope to measure the output driving signals (X2/Y2) of the high-voltage amplifier. As shown in Figure 9a, the signal amplitudes were recorded at different frequencies to characterize the frequency response of the driving circuit. The phase difference between the X-axis and Y-axis driving signals is shown in Figure 9b. Comparison between input and output waveforms quantified specific propagation delays of 740 ns and 910 ns for the X-axis and Y-axis, respectively. These delays result in a frequency-dependent phase delay, providing a basis for subsequent phase compensation.
Figure 9.
(a) Frequency response of the driving circuit. (b) Phase difference between the X- and Y-axis driving signals.
Guided by the previously characterized amplitude error and phase delay, the experiment implemented a sinusoidal excitation at 22,776 Hz (X-axis) and 7884 Hz (Y-axis). An oscilloscope tracked the real-time output signals of the high-voltage amplifier. In X–Y mode, the Lissajous trajectory without compensation is shown in Figure S1a, whereas the trajectory after applying amplitude (3.8 V) and phase () compensation is shown in Figure S1b.
3.3. Phase Delay of the MEMS Mirror
We characterized the phase delay of the PSD-detected MEMS mirror response using the experimental configuration depicted in Figure 8. A laser beam illuminated the MEMS mirror at a incidence angle, and the PSD converted the reflected-beam position into an electrical signal. The electrode-drive voltage (X2/Y2) and the corresponding PSD output (X3/Y3) were acquired simultaneously using an oscilloscope and selected as the first and second sources, respectively, for its automatic phase measurement. Acquisition was performed at in normal mode with DC coupling and rising-edge triggering. Automatic phase measurements were evaluated in the main time-base window spanning . The phase reading was calculated from the relative timing of the selected rising edges and normalized to the electrical driving period. Because the mechanical scanning period was twice the electrical driving period, this reading was divided by two to express the phase delay in terms of the mechanical scanning period. The appropriate phase branch, among two branches separated by , was selected from the waveform alignment relative to a fixed synchronized half-frequency reference. The resulting phase delays are reported in the range , with positive values denoting lag relative to this reference. This procedure used waveform timing without sinusoidal fitting or separate extraction of the fundamental component. The reported phase delays include any contribution from the PSD and its internal electronics.
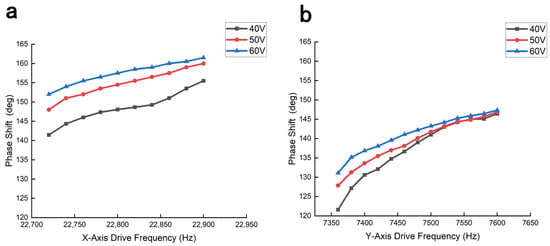
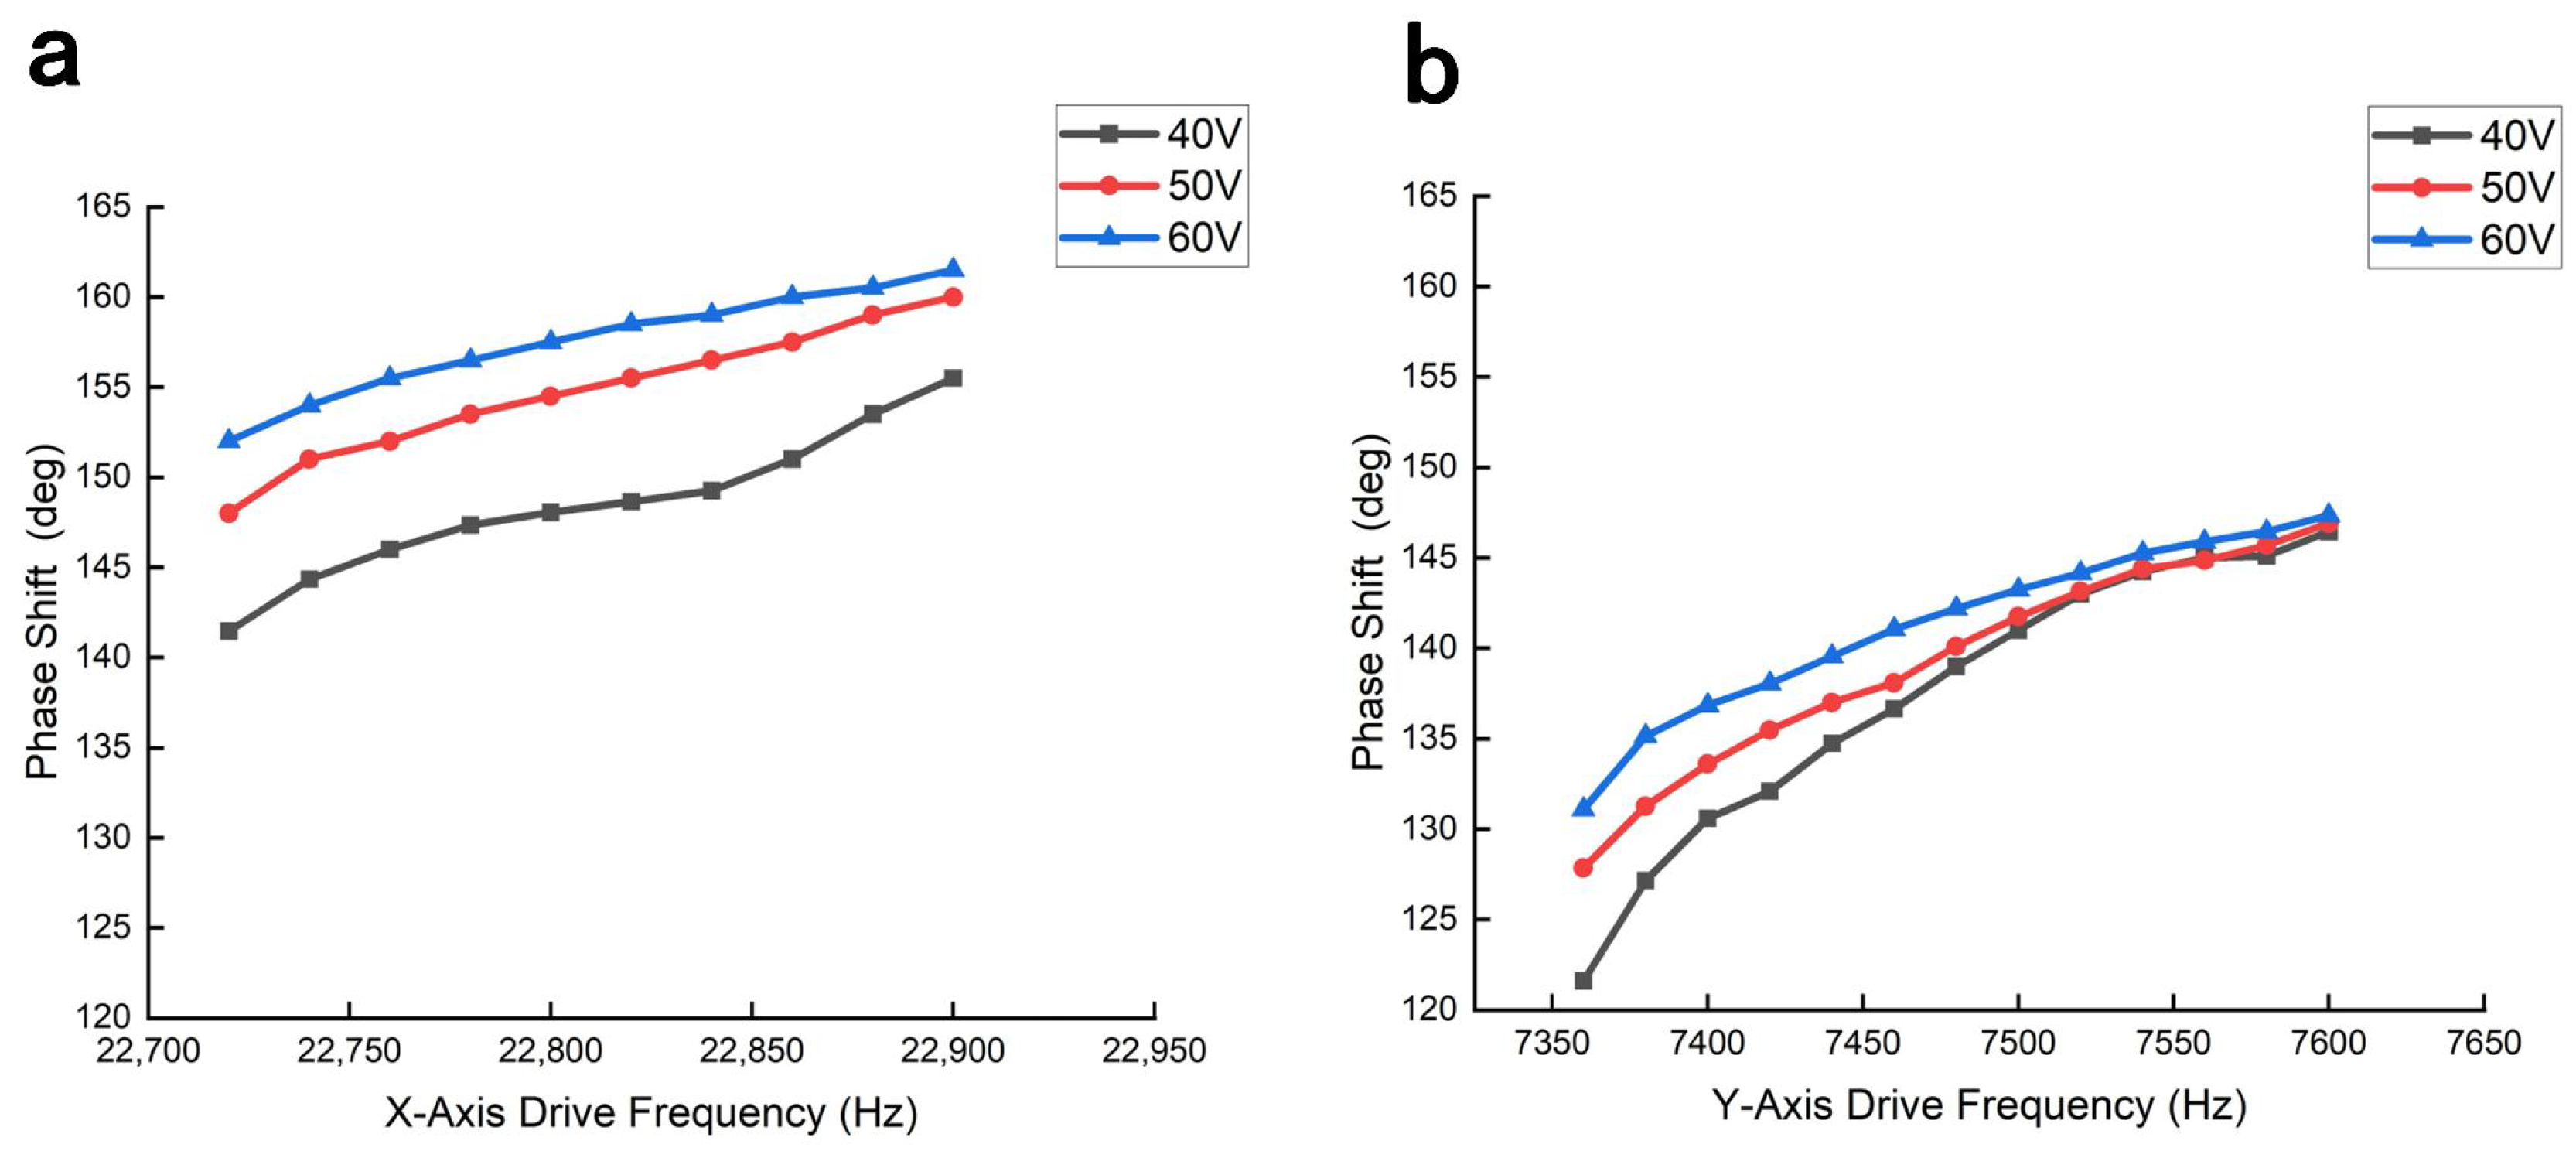
For each axis and driving voltage, each target frequency was reached through a separate downsweep, and the phase delay was measured once at that target frequency. The phase delay in downsweep mode is shown in Figure 10, revealing that the phase delay correlates positively with both driving voltage and frequency. To compare the phase delays at 40, 50, and 60 V, the frequency intervals were restricted to those at which a measurable response was obtained at all three voltages; these common intervals are narrower than the 60 V downsweep ranges shown in Figure 6. Specifically, at a peak-to-peak driving voltage of 60 V, the phase delay ranges from to for the X-axis (22,720–22,900 Hz) and to for the Y-axis (7360–7600 Hz).
Figure 10.
(a) Phase delay of the MEMS mirror X-axis response under driving voltages of 40–. (b) Corresponding phase delay of the Y-axis response.
To evaluate how phase delay influences the MEMS scanning trajectory, we drove the X- and Y-axes at 22,800 Hz and 7600 Hz, respectively. This 3:1 driving-frequency ratio produces a relatively simple Lissajous trajectory, making phase-induced changes in the projected laser pattern easier to observe. An oscilloscope monitored the driving signals (X2/Y2) in X–Y mode to establish the reference Lissajous trajectory shown in Figure S2a. The driving signals were applied to the MEMS mirror, and the reflected laser beam generated a scanning trajectory on the screen. Owing to the intrinsic phase delay in the MEMS response, the phase relationship between the X-axis and Y-axis vibrations changed, resulting in significant distortion of the Lissajous trajectory, as shown in Figure S2b. Finally, applying phase compensation of and to the X-axis and Y-axis, respectively, successfully rectified the scanning trajectory, as shown in Figure S2c.
4. Imaging Results
4.1. TPM Imaging System
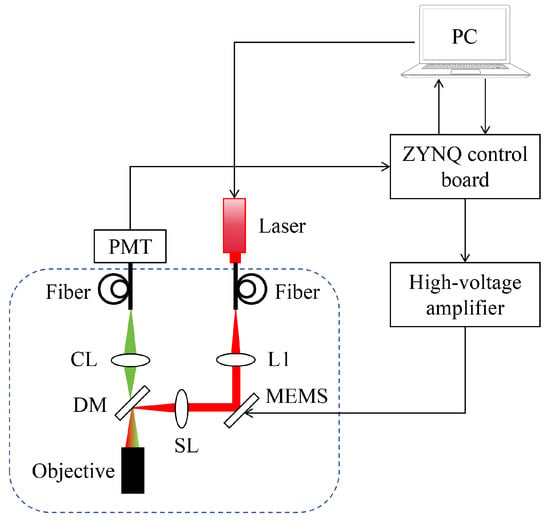
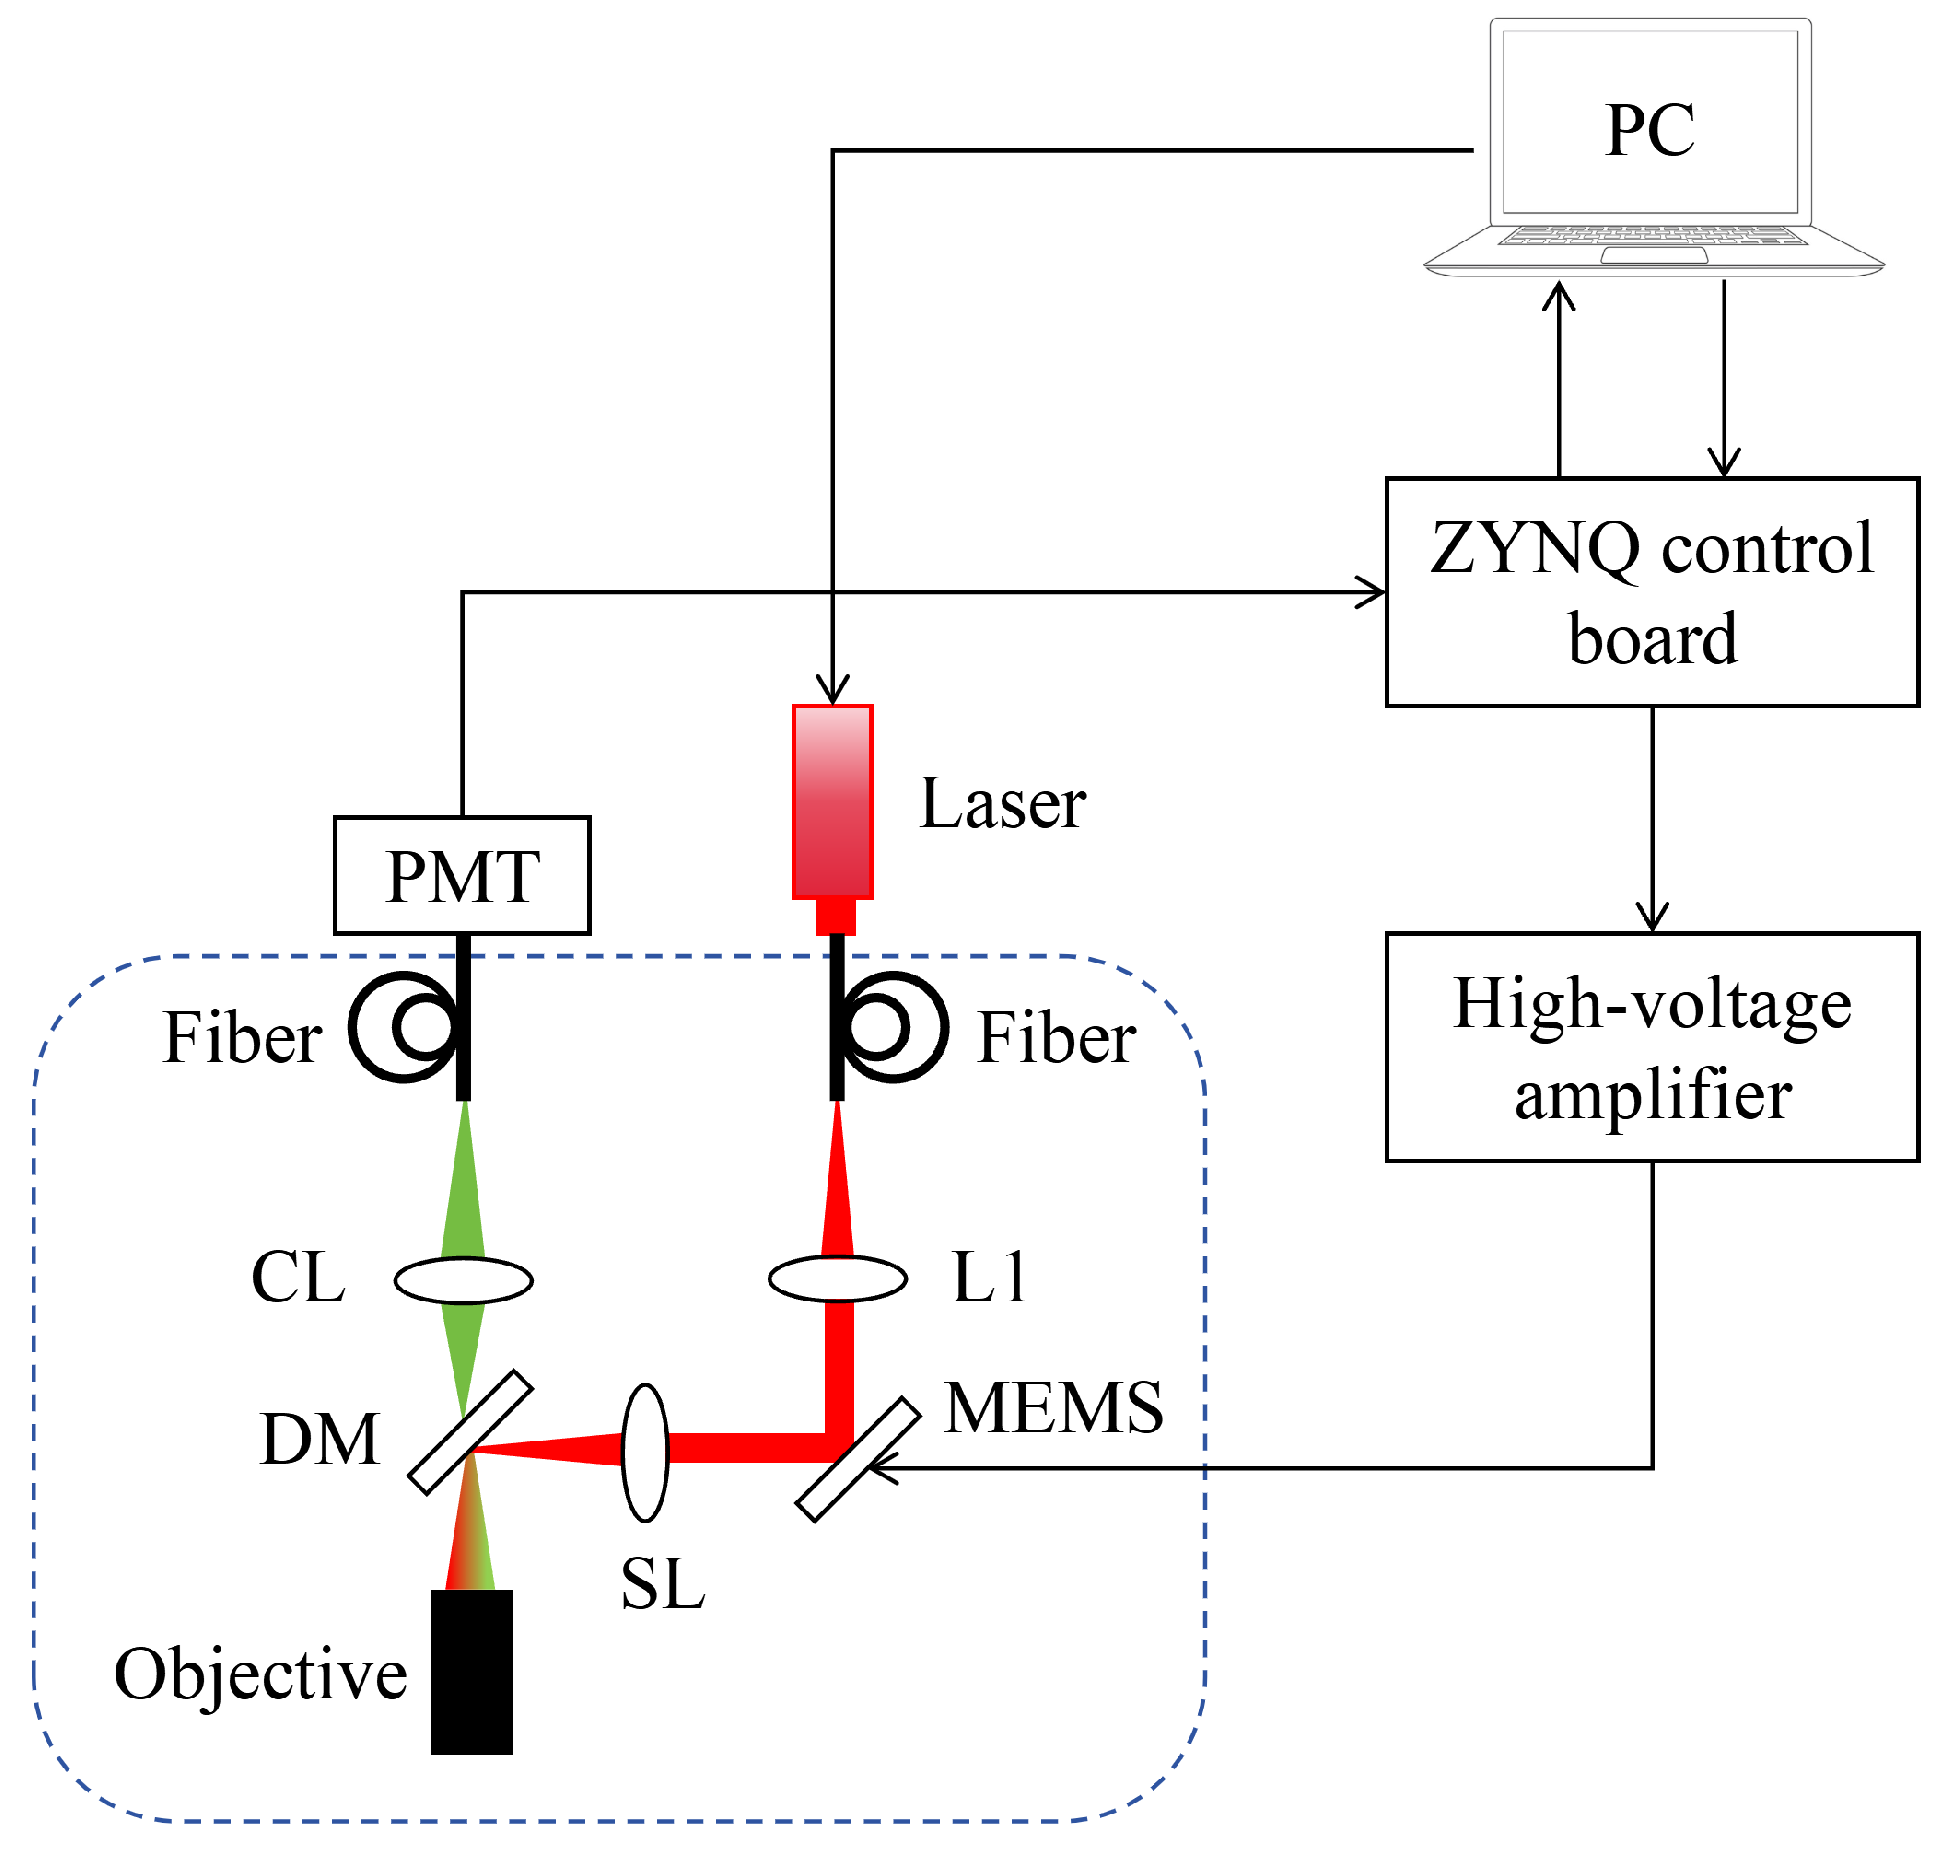
Figure 11 illustrates the schematic of the TPM system integrated with an electrostatic MEMS mirror. A 780-nm femtosecond laser serves as the excitation source, the beam of which is fiber-delivered and collimated via lens L1 before being directed onto the MEMS mirror. The MEMS mirror facilitates 2D scanning by modulating the incident beam trajectory. The scanned beam is subsequently relayed through a scan lens (SL) and reflected by a dichroic mirror (DM) into the objective lens, which focuses the light onto the specimen. The induced two-photon fluorescence (420–580 nm) is captured through the same objective, coupled into a collection fiber via lens CL, and detected by a photomultiplier tube (PMT). For signal acquisition, the PMT photocurrent is transduced into a voltage signal (±1 V) using a transimpedance amplifier (60 MHz bandwidth) and specialized conditioning circuitry.
Figure 11.
Schematic diagram of the TPM imaging system based on a two-dimensional MEMS mirror. (L1, collimator; SL, scan lens; CL, collection lens; DM, dichroic mirror.)
The ZYNQ control board consists of a driving circuit, a data acquisition (DAQ) circuit, and an Ethernet communication circuit. The MEMS driving circuit includes a DAC conversion circuit and a bias adjustment circuit. A high-voltage amplifier drives the MEMS mirror by amplifying the output signals. The DAQ circuit (12 MS/s sampling rate, 16-bit resolution, V input range) records fluorescence signals from the PMT. The Ethernet communication circuit enables communication and control between the PC and the imaging system, while the PC performs Lissajous scanning control and image reconstruction.
4.2. Imaging Performance Evaluation
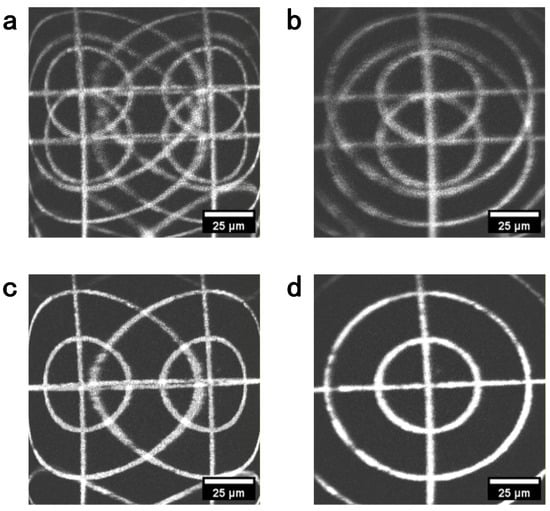
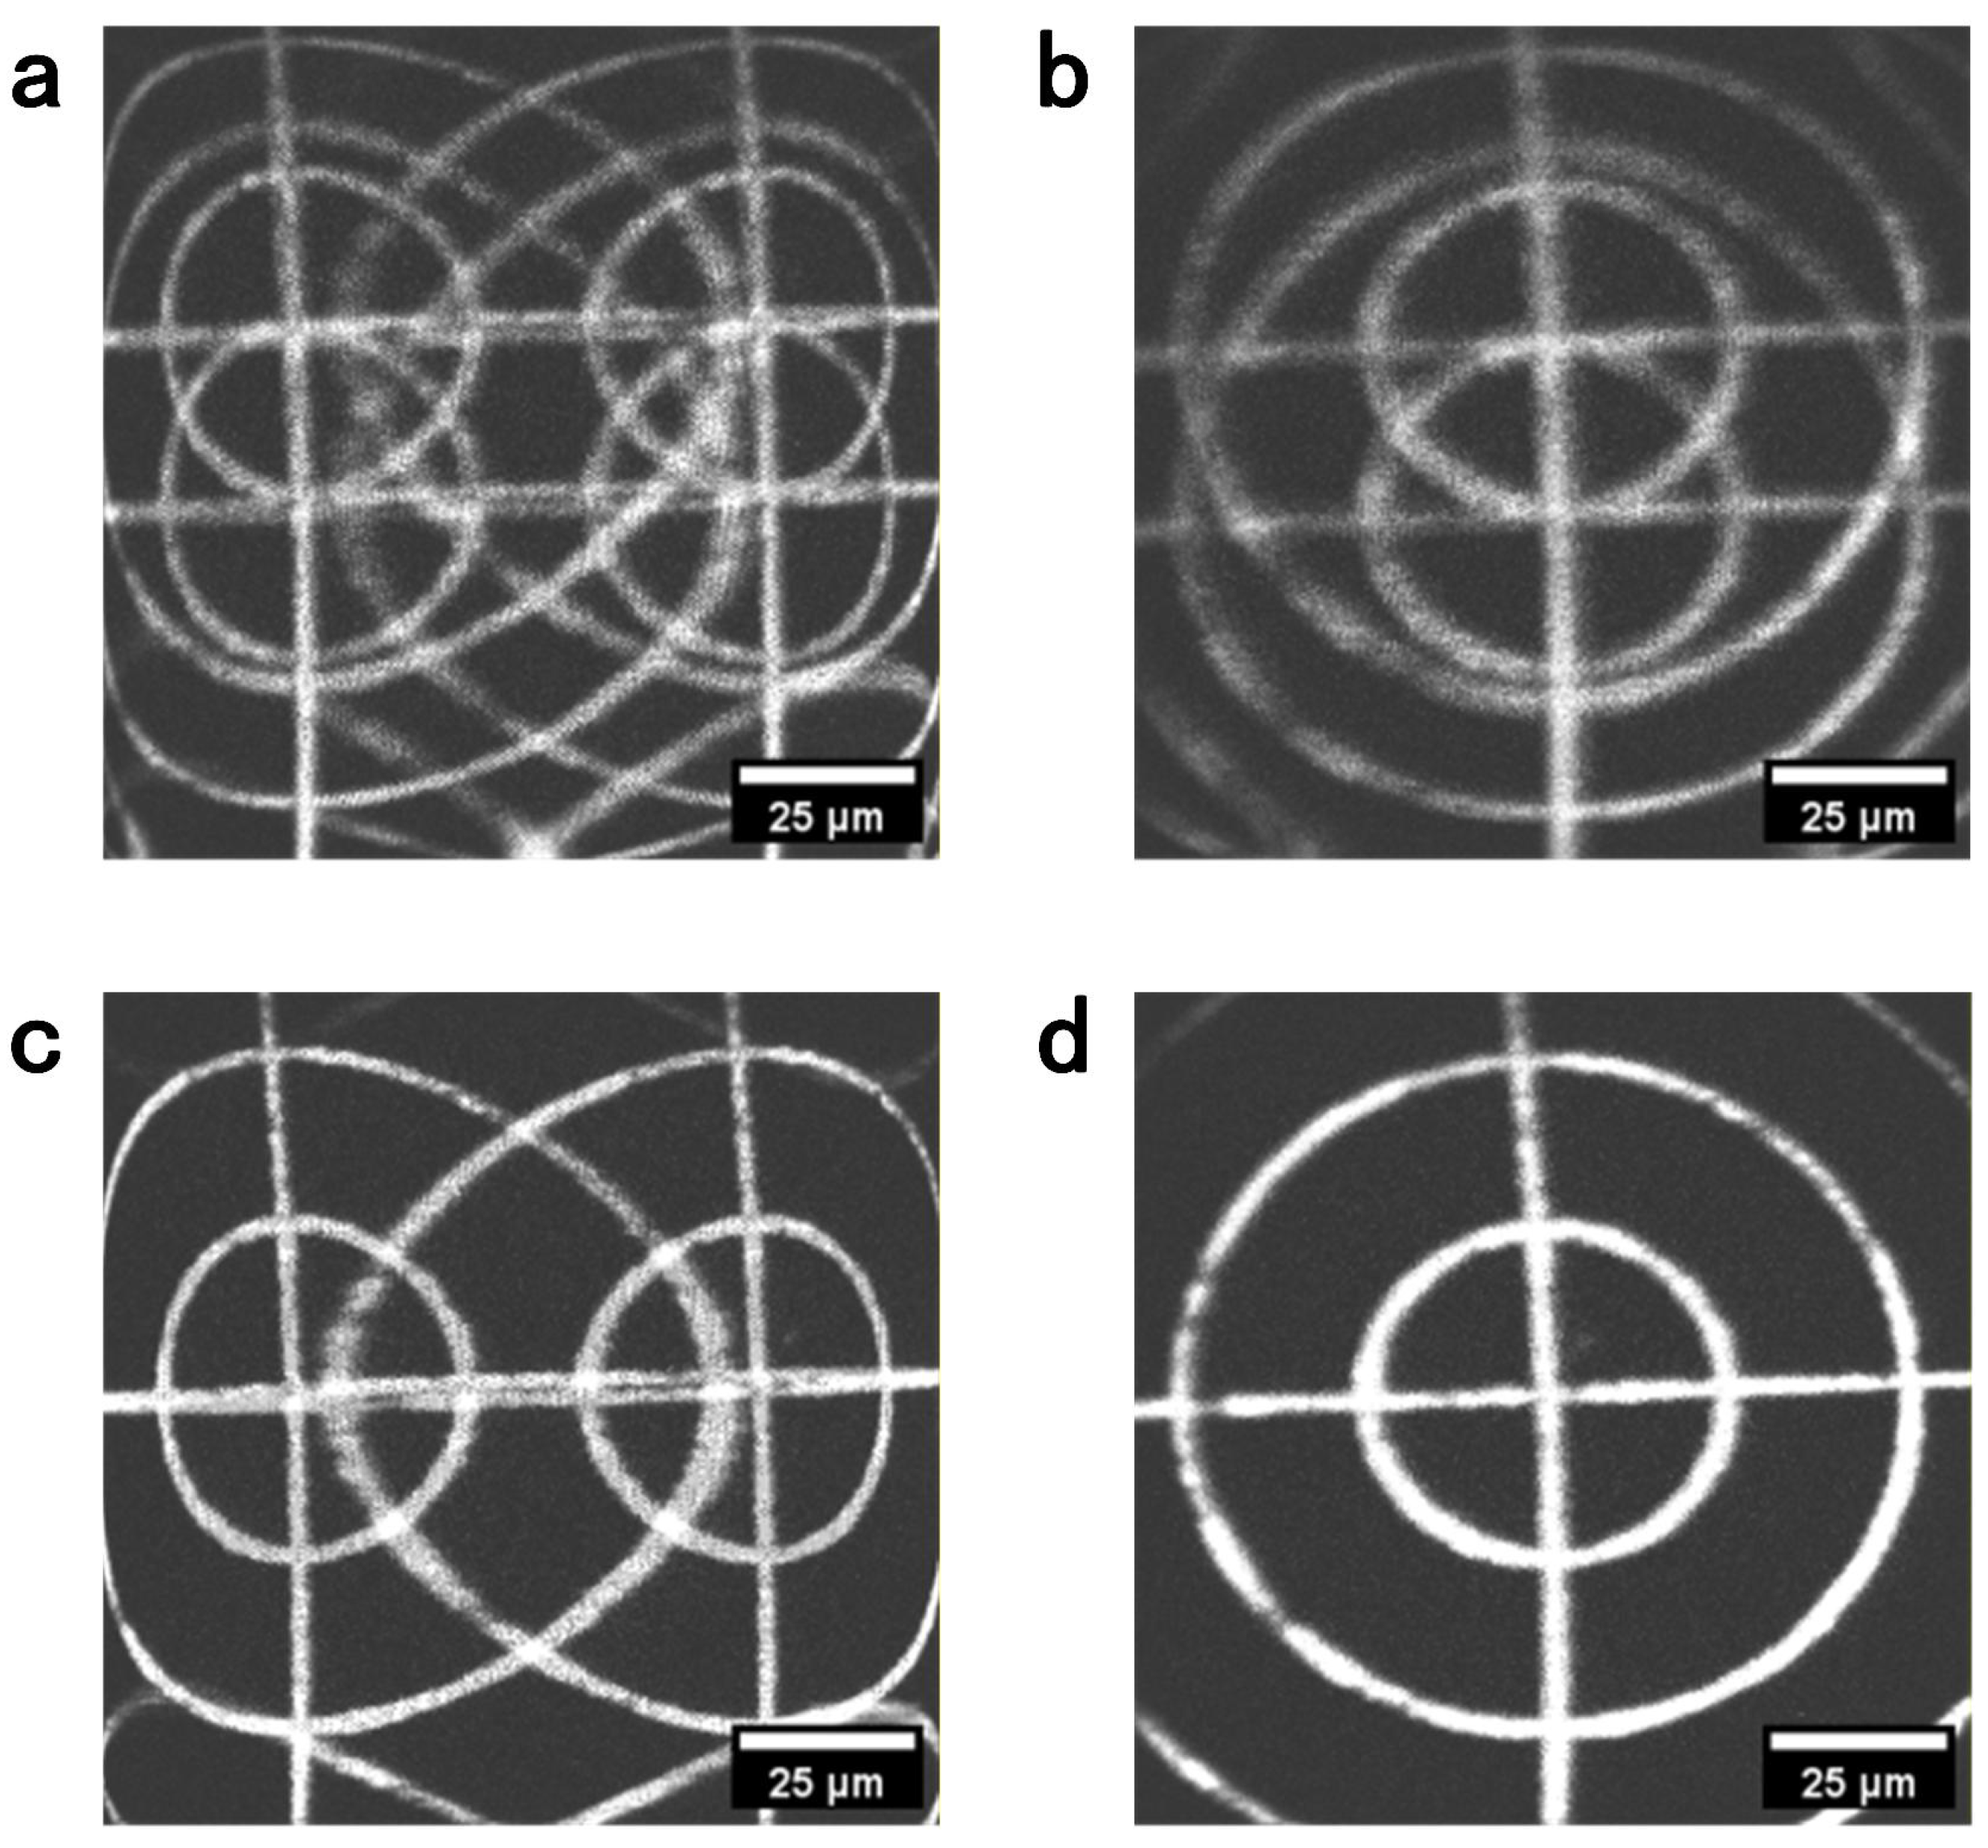
The calibrated MEMS mirror was integrated into a TPM probe with a numerical aperture (NA) of 0.6 and a working distance of . To rectify FOV distortion, we used the fluorescent target to calibrate the scan phases employed in image reconstruction. At electrical driving frequencies of 22,720 Hz for the X-axis and 7420 Hz for the Y-axis, reconstruction phase offsets of and , respectively, substantially reduced image distortion. Here, a positive effective phase delay denotes a lag of the sampled trajectory relative to the nominal reconstruction trajectory. The compensation offset is added to the phase argument of the sinusoidal reconstruction coordinate and expressed within :
Both delays and offsets are expressed with respect to the corresponding mechanical scanning periods. Thus, the reconstruction offsets of and correspond to effective delays of and , respectively. Figure 12 compares the images obtained without compensation, with single-axis compensation, and with compensation on both axes.
Figure 12.
TPM images of the fluorescent target reconstructed with different phase offsets. (a) No reconstruction phase compensation. (b) Y-axis reconstruction phase offset of only. (c) X-axis reconstruction phase offset of only. (d) Both reconstruction phase offsets applied.
The driving circuit introduced phase delays of for the X-axis at 22,720 Hz and for the Y-axis at 7420 Hz. The corresponding phase delays obtained from the PSD-detected MEMS response were and , respectively. The sums of these measured delays were for the X-axis and for the Y-axis, differing from the image-derived effective delays by and , respectively. The measured and image-derived delays, their equivalent time representations, and the characterization status of the individual contributions are summarized in Table S1 of the Supplementary Materials. These residual discrepancies may reflect the different timing responses of the PSD detection chain used for calibration and the fluorescence-detection and data-acquisition chain used for imaging, together with variations in environmental and operating conditions. The independently measured delays provide initial estimates that narrow the phase-search range, while the final reconstruction offsets are determined empirically from the fluorescent target images.
To quantify the image improvement shown in Figure 12, we measured the spreading of the two straight lines in the fluorescent target. For each condition, a mean-intensity projection was calculated from the corresponding raw grayscale TIFF stack. Intensity profiles perpendicular to the vertical and horizontal target lines were then obtained by taking the median along each line. The width describes the horizontal spreading of the vertical line, whereas describes the vertical spreading of the horizontal line. After background subtraction, the target line and its duplicate, when present, were included in the calculation. For either direction , the intensity-weighted centroid and line-spread width were calculated as:
where , is the background-corrected intensity profile, and contains the pixels associated with the target line and any detected duplicate. Both and are expressed in pixels.
As shown in Table 2, compensating only one scanning axis reduced line spreading predominantly in one image direction, whereas substantial spreading remained in the other direction. With compensation applied to both axes, decreased from 140.52 to 5.81 pixels and decreased from 51.00 to 5.38 pixels relative to the uncompensated image. These measurements quantitatively support the reduction in crosshair ghosting and line broadening visible in Figure 12.
Table 2.
Crosshair line-spread widths measured from the mean-intensity projections of the raw TIFF stacks corresponding to Figure 12.
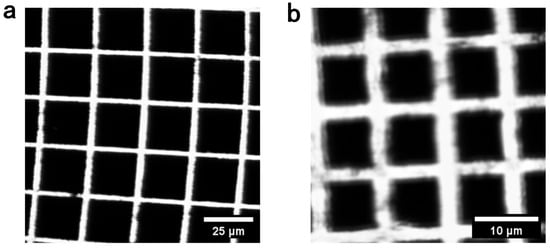
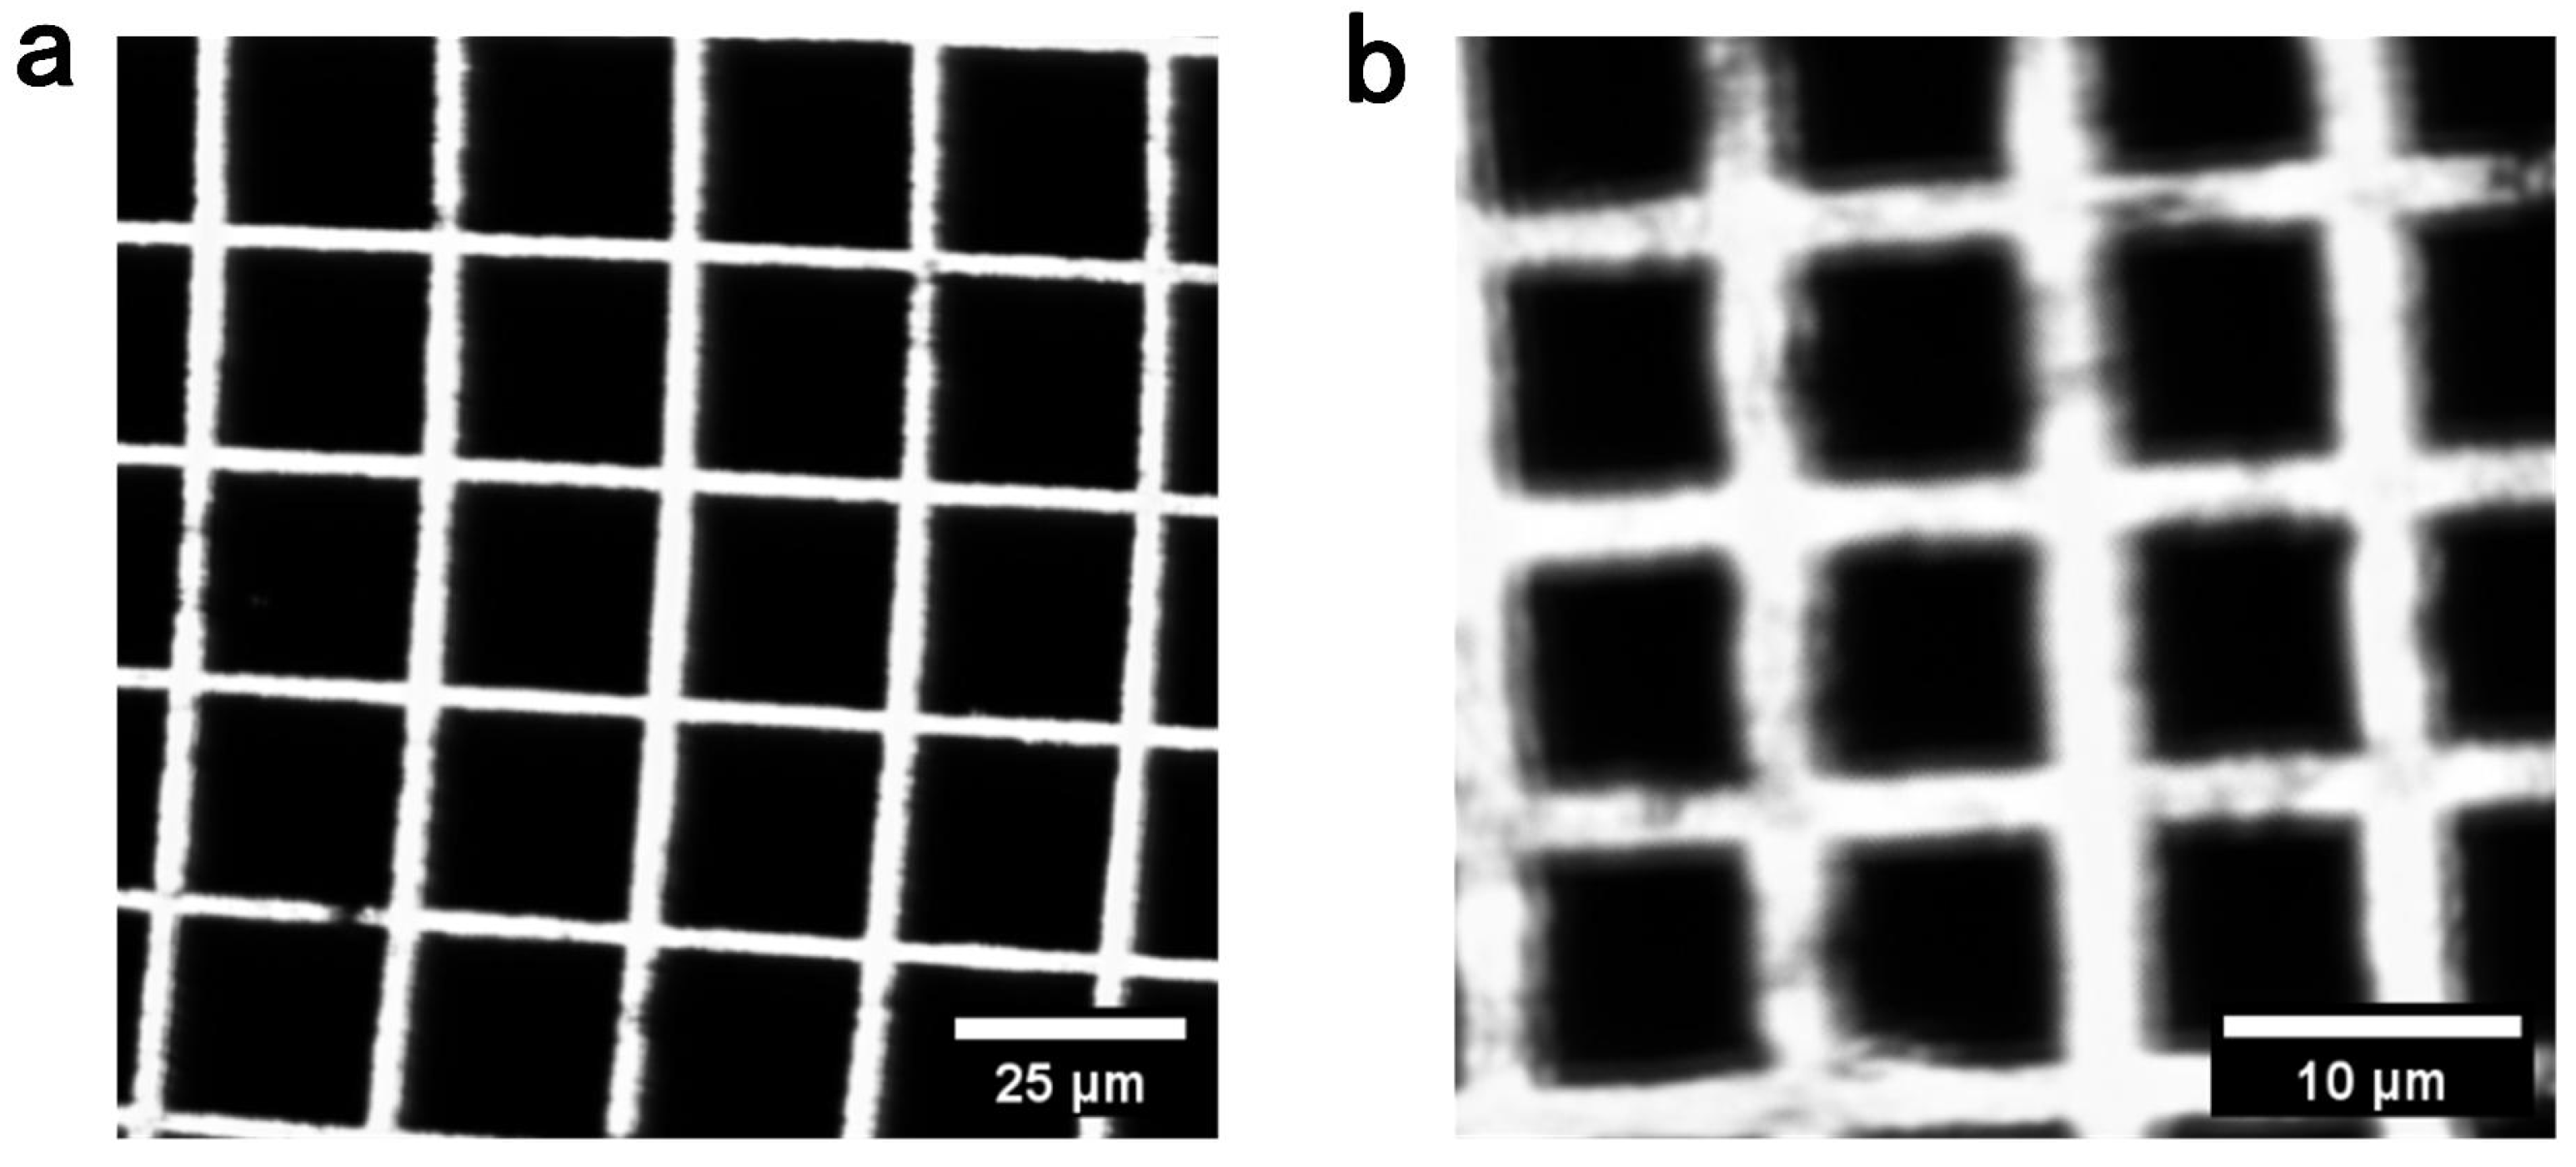
The imaging FOV was characterized using a custom fluorescent target containing square-grid features with dimensions of and . The physical extent of each reconstructed image was determined from the number of resolved grid intervals and their known dimensions. Because the optical scan angle of the MEMS mirror varies with the driving frequency, different frequency pairs produce different imaging FOVs at the sample plane. At X/Y electrical driving-frequency pairs of 22,720/7420 Hz, 22,760/7520 Hz, and 22,860/7760 Hz, the measured imaging FOVs were approximately , , and , respectively. Representative FOV measurements at driving-frequency pairs of 22,720/7420 Hz and 22,860/7760 Hz are shown in Figure 13. For images reconstructed on a grid, these values correspond to nominal pixel spacings of approximately , , and , respectively. Here, the imaging FOV is defined as the physical extent covered by the reconstructed image of the fluorescent target at the sample plane.
Figure 13.
(a) FOV measurement with X-axis driving frequency of 22,720 Hz and Y-axis driving frequency of 7420 Hz. Scale bar: . (b) FOV measurement with X-axis driving frequency of 22,860 Hz and Y-axis driving frequency of 7760 Hz. Scale bar: .
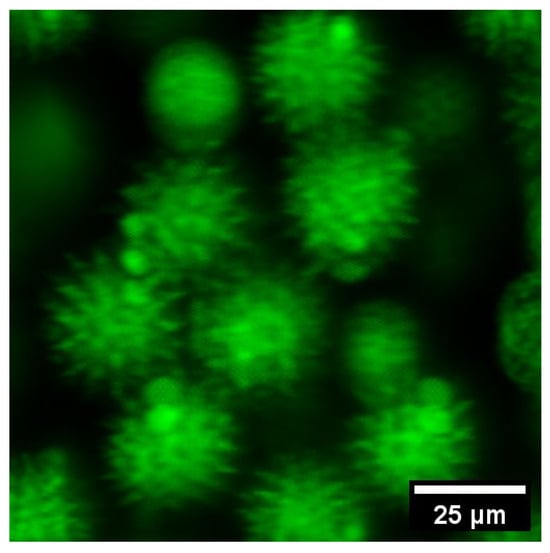
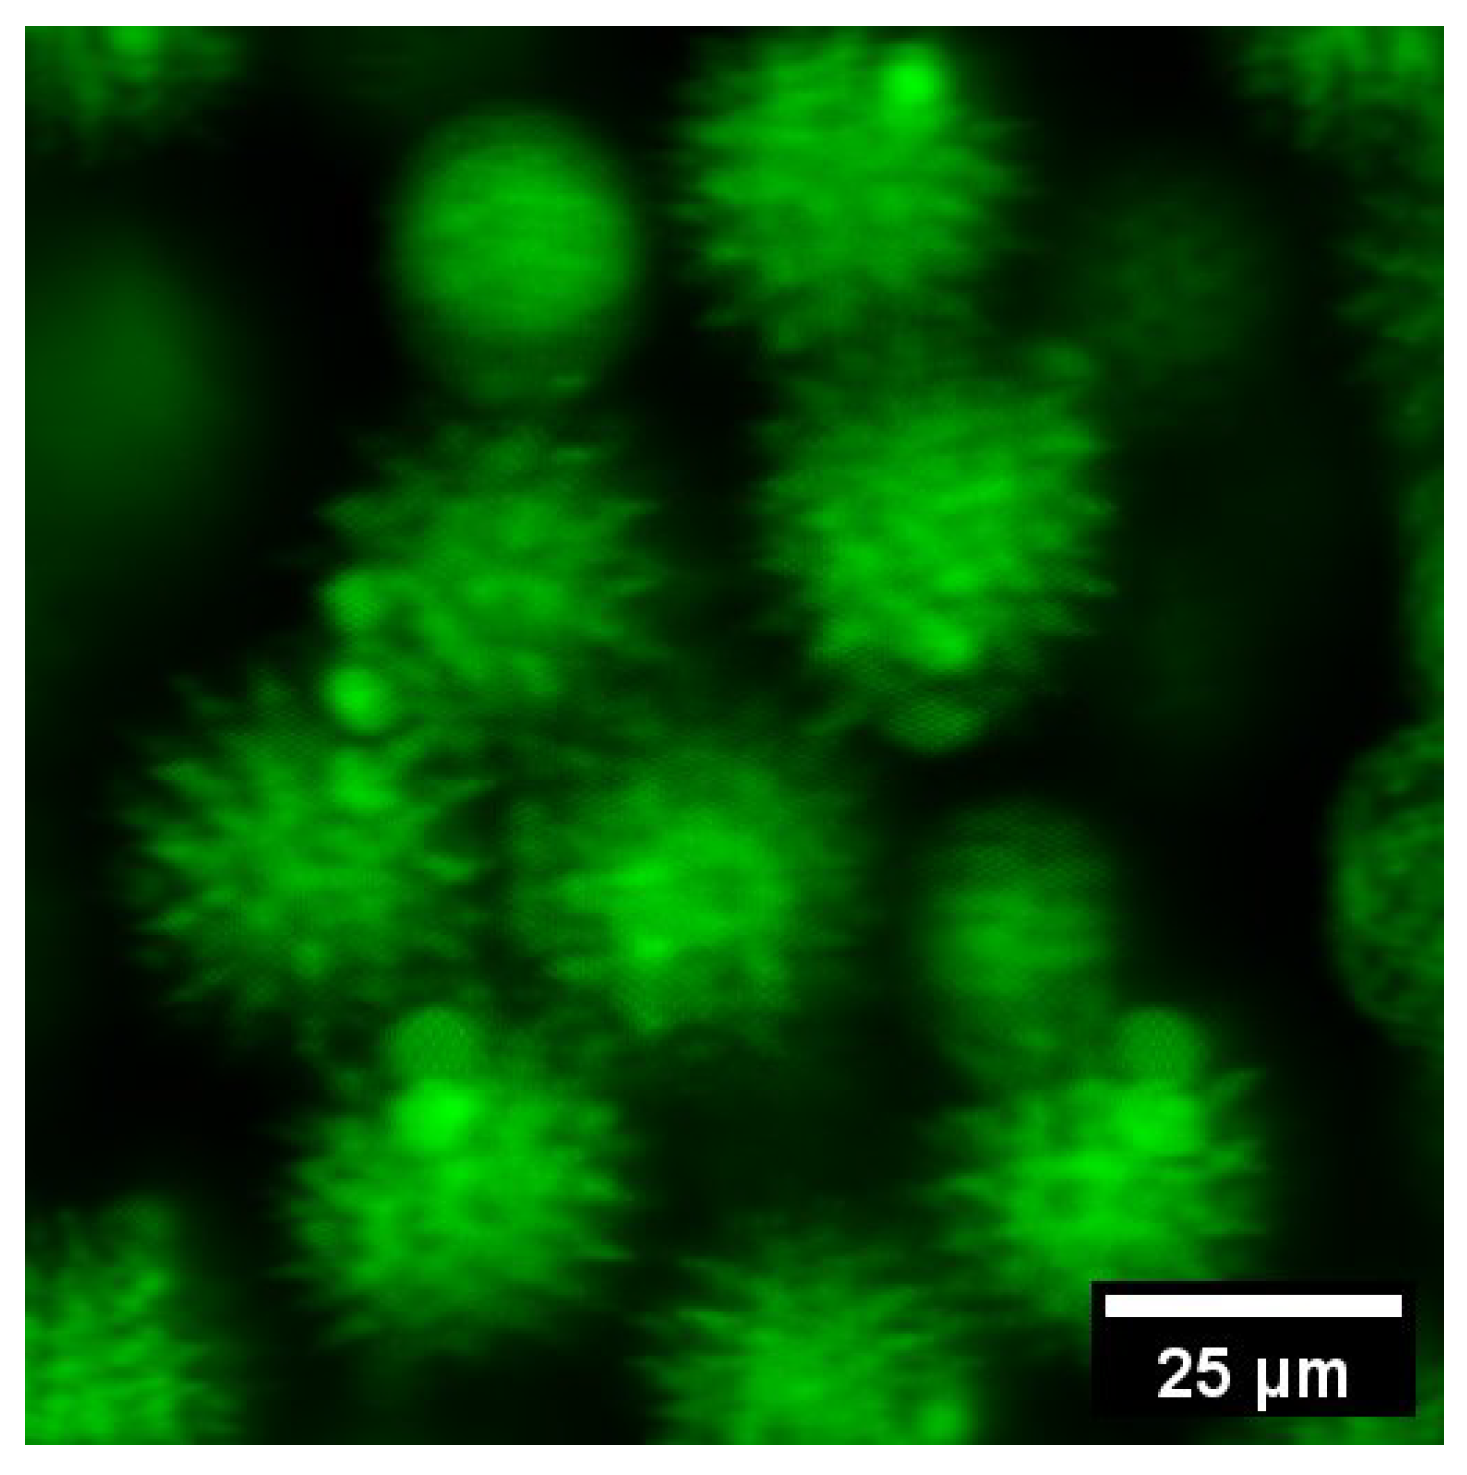
To demonstrate imaging performance, the phase-corrected system was used to image pollen granules at driving frequencies of 22,720 Hz and 7420 Hz. Figure 14 illustrates the resulting two-photon image, which incorporates the calibrated phase compensations of (X-axis) and (Y-axis) to ensure spatial fidelity. The reconstructed image demonstrates the effectiveness of the proposed compensation method in mitigating scanning-induced artifacts.
Figure 14.
Two-photon image of pollen granules after phase compensation (FOV: ).
5. Conclusions
This study presents an experimental characterization of amplitude and phase errors in an ultra-compact electrostatic MEMS-based Lissajous TPM system. Analytical characterization reveals that circuit parameter asymmetry and the frequency response of the driving circuit induce significant signal deviations. The MEMS mirror exhibits typical second-order dynamic behavior under sinusoidal excitation, characterized by a substantial phase delay relative to the driving input. A dedicated measurement system was developed to quantify the electromechanical response delay, providing an effective reference for phase compensation. Experimental validation through TPM imaging of fluorescent target and pollen granules confirms that the proposed compensation framework effectively suppresses geometric distortion and enhances spatial fidelity. Consequently, this study establishes a practical measurement-based methodology for characterizing and compensating phase errors in parametrically resonant MEMS-based Lissajous scanning systems. Future research will extend this approach to high-filling-density Lissajous endoscopy, aiming to improve imaging efficiency and reduce the computational burden of data acquisition.
Supplementary Materials
The following supporting information can be downloaded at https://www.mdpi.com/article/10.3390/mi17111212/s1, Figure S1: (a) Lissajous scanning trajectory of the driving circuit before amplitude and phase compensation. (b) Lissajous scanning trajectory after amplitude and phase compensation. Figure S2: (a) Output trajectory of the driving signals. (b) Lissajous scanning trajectory of the MEMS mirror before phase compensation. (c) Lissajous scanning trajectory of the MEMS mirror after phase compensation. Table S1: Measured and derived delays at electrical driving frequencies of 22,720 Hz for the X-axis and 7420 Hz for the Y-axis.
Author Contributions
S.M.: writing—review and editing, writing—original draft, validation, software, methodology, conceptualization; B.Y.: writing—original draft, visualization, methodology; H.L. (Haijun Li): methodology; Y.H.: software; J.W.: methodology; C.Z.: writing—original draft; Z.L.: writing—original draft; X.Z.: methodology; H.L. (Huilan Liu): writing—review and editing, supervision; L.F.: writing—review and editing, supervision, funding acquisition; D.L.: writing—review and editing, supervision, funding acquisition, conceptualization; A.W.: writing—review and editing, supervision; C.W.: writing—original draft, visualization, methodology, funding acquisition. All authors have read and agreed to the published version of the manuscript.
Funding
This work was supported in part by the National Natural Science Foundation of China (32327802 and 62475008), Beijing Nova Program (20220484045), and China Postdoctoral Science Foundation (2025T180233).
Institutional Review Board Statement
Not applicable.
Informed Consent Statement
Not applicable.
Data Availability Statement
Data underlying the results presented in this study are not publicly available at this time but may be obtained from the authors upon reasonable request.
Acknowledgments
The authors thank Linshuang Li, Yanliang He, Jie Wang, Cong He and Xilong Xiao from Beijing Transcend Vivoscope Biotech Co., Ltd., for their technical support.
Conflicts of Interest
Authors Yanhui Hu and Junjie Wang were employed by the company Beijing Transcend Vivoscope Biotech Co., Ltd. The remaining authors declare that the research was conducted in the absence of any commercial or financial relationships that could be construed as a potential conflict of interest.
Abbreviations
The following abbreviations are used in this manuscript:
| TPM | Two-photon microscopy |
| MEMS | Micro-electro-mechanical system |
| FOV | Field of view |
| DAC | Digital-to-analog converter |
| ADC | Analog-to-digital converter |
| PSD | Position-sensitive detector |
| DAQ | Data acquisition |
| PMT | Photomultiplier tube |
References
- Denk, W.; Strickler, J.H.; Webb, W.W. Two-photon laser scanning fluorescence microscopy. Science 1990, 248, 73–76. [Google Scholar] [CrossRef] [Scilit] [PubMed]
- Zipfel, W.R.; Williams, R.M.; Webb, W.W. Nonlinear magic: Multiphoton microscopy in the biosciences. Nat. Biotechnol. 2003, 21, 1369–1377. [Google Scholar] [CrossRef] [Scilit] [PubMed]
- Helmchen, F.; Denk, W. Deep tissue two-photon microscopy. Nat. Methods 2005, 2, 932–940. [Google Scholar] [CrossRef] [Scilit] [PubMed]
- Liang, W.; Hall, G.; Messerschmidt, B.; Li, M.J.; Li, X. Nonlinear optical endomicroscopy for label-free functional histology in vivo. Light Sci. Appl. 2017, 6, e17082. [Google Scholar] [CrossRef] [Scilit] [PubMed]
- Kučikas, V.; Werner, M.P.; Schmitz-Rode, T.; Louradour, F.; van Zandvoort, M.A.M.J. Two-photon endoscopy: State of the art and perspectives. Mol. Imaging Biol. 2023, 25, 3–17. [Google Scholar] [CrossRef] [Scilit] [PubMed]
- Engelbrecht, C.J.; Johnston, R.S.; Seibel, E.J.; Helmchen, F. Ultra-compact fiber-optic two-photon microscope for functional fluorescence imaging in vivo. Opt. Express 2008, 16, 5556–5564. [Google Scholar] [CrossRef] [Scilit] [PubMed]
- Wang, C.; Liu, H.; Cui, H.; Ma, J.; Li, Y.; Tian, J.; Jin, C.; Chen, Y.; Gao, Y.; Fu, Q.; et al. Two-photon endomicroscopy with microsphere-spliced double-cladding antiresonant fiber for resolution enhancement. Opt. Express 2022, 30, 26090–26101. [Google Scholar] [CrossRef] [Scilit] [PubMed]
- Zhao, C.; Chen, S.; Zhang, L.; Zhang, D.; Wu, R.; Hu, Y.; Zeng, F.; Li, Y.; Wu, D.; Yu, F.; et al. Miniature three-photon microscopy maximized for scattered fluorescence collection. Nat. Methods 2023, 20, 617–622. [Google Scholar] [CrossRef] [Scilit] [PubMed]
- Wu, R.; Zhao, C.; Qiu, S.; Zhu, Y.; Zhang, L.; Fu, Q.; Hu, Y.; Wu, D.; Yu, F.; Zhou, F.; et al. A versatile miniature two-photon microscope enabling multicolor deep-brain imaging. Nat. Methods 2025, 22, 1935–1943. [Google Scholar] [CrossRef] [Scilit] [PubMed]
- Wang, C.; Yan, B.; Ma, S.; Li, H.; Feng, T.; Zhang, X.; Li, D.; Feng, L.; Wang, A. Advances in distal-scanning two-photon endomicroscopy for biomedical imaging. Photonics 2025, 12, 546. [Google Scholar] [CrossRef] [Scilit]
- Tadigadapa, S.A.; Najafi, N. Developments in microelectromechanical systems (MEMS): A manufacturing perspective. J. Manuf. Sci. Eng. 2003, 125, 816–823. [Google Scholar] [CrossRef] [Scilit]
- Kumar, J.S.J.; Tetteh, E.A.; Braineard, E.P. A study of why electrostatic actuation is preferred and a simulation of an electrostatically actuated cantilever beam for MEMS applications. Int. J. Eng. Sci. Emerg. Technol. 2014, 6, 441–446. [Google Scholar]
- Yang, S.; Xu, Q. A review on actuation and sensing techniques for MEMS-based microgrippers. J. Micro-Bio Robot. 2017, 13, 1–14. [Google Scholar] [CrossRef] [Scilit]
- Choi, J.; Wang, T.; Oldham, K. Dynamics of thin-film piezoelectric microactuators with large vertical stroke subject to multi-axis coupling and fabrication asymmetries. J. Micromech. Microeng. 2018, 28, 015014. [Google Scholar] [CrossRef] [Scilit] [PubMed]
- Mehidine, H.; Pinot, L.; Li, M.; Bouvet, F.; Esnault, C.; Xie, H.; Abi Haidar, D. An in vivo two photon fluorescence endomicroscopic probe based on a 2-axis electrothermal MEMS mirror. In Proceedings of the European Conference on Biomedical Optics, Munich, Germany, 23–25 June 2019. Paper 11079_14. [Google Scholar] [CrossRef] [Scilit]
- Mansoor, H.; Zeng, H.; Chen, K.; Yu, Y.; Zhao, J.; Chiao, M. Vertical optical sectioning using a magnetically driven confocal microscanner aimed for in vivo clinical imaging. Opt. Express 2011, 19, 25161–25172. [Google Scholar] [CrossRef] [Scilit] [PubMed]
- Li, G.; Duan, X.; Lee, M.; Birla, M.; Chen, J.; Oldham, K.R.; Wang, T.D.; Li, H. Ultra-compact microsystems-based confocal endomicroscope. IEEE Trans. Med. Imaging 2020, 39, 2406–2414. [Google Scholar] [CrossRef] [Scilit] [PubMed]
- Shahid, W.; Qiu, Z.; Duan, X.; Li, H.; Wang, T.D.; Oldham, K.R. Modeling and simulation of a parametrically resonant micromirror with duty-cycled excitation. J. Microelectromech. Syst. 2014, 23, 1440–1453. [Google Scholar] [CrossRef] [Scilit] [PubMed]
- Frangi, A.; Guerrieri, A.; Carminati, R.; Mendicino, G. Parametric resonance in electrostatically actuated micromirrors. IEEE Trans. Ind. Electron. 2017, 64, 1544–1551. [Google Scholar] [CrossRef] [Scilit]
- Hwang, K.; Seo, Y.H.; Jeong, K.H. Microscanners for optical endomicroscopic applications. Micro Nano Syst. Lett. 2017, 5, 1. [Google Scholar] [CrossRef] [Scilit]
- Kim, D.Y.; Hwang, K.; Ahn, J.; Seo, Y.H.; Kim, J.B.; Lee, S.; Yoon, J.H.; Kong, E.; Jeong, Y.; Jon, S.; et al. Lissajous scanning two-photon endomicroscope for in vivo tissue imaging. Sci. Rep. 2019, 9, 3560. [Google Scholar] [CrossRef] [Scilit] [PubMed]
- Zhang, Y.; Liu, Y.; Wang, L.; Su, Y.; Zhang, Y.; Yu, Z.; Zhu, W.; Wang, Y.; Wu, Z. Resolution adjustable Lissajous scanning with piezoelectric MEMS mirrors. Opt. Express 2023, 31, 2846–2859. [Google Scholar] [CrossRef] [Scilit] [PubMed]
- Yoo, H.W.; Riegler, R.; Brunner, D.; Albert, S.; Thurner, T.; Schitter, G. Experimental evaluation of vibration influence on a resonant MEMS scanning system for automotive lidars. IEEE Trans. Ind. Electron. 2022, 69, 3099–3108. [Google Scholar] [CrossRef] [Scilit]
- Birla, M.; Duan, X.; Li, H.; Lee, M.; Li, G.; Wang, T.D.; Oldham, K.R. Image processing metrics for phase identification of a multiaxis MEMS scanner used in single pixel imaging. IEEE/ASME Trans. Mechatron. 2021, 26, 1445–1454. [Google Scholar] [CrossRef] [Scilit] [PubMed]
- Manosalvas-Kjono, S.N.; Quan, R.; Solgaard, O. Integrated amplitude and phase monitor for micro-actuators. Micromachines 2022, 13, 1360. [Google Scholar] [CrossRef] [Scilit] [PubMed]
- Zhang, X.; Wang, C.; Han, Y.; Wang, J.; Hu, Y.; Wang, J.; Fu, Q.; Wang, A.; Feng, L.; Hu, X. Analysis of error sources in the Lissajous scanning trajectory based on two-dimensional MEMS mirrors. Photonics 2023, 10, 1123. [Google Scholar] [CrossRef] [Scilit]
- Zhang, X.; Han, Y.; Liu, H.; Xiao, X.; Hu, Y.; Fu, Q.; Feng, L.; Hu, X.; Wang, C.; Wang, J.; et al. MEMS-based two-photon microscopy with Lissajous scanning and image reconstruction under a feed-forward control strategy. Opt. Express 2024, 32, 1421–1437. [Google Scholar] [CrossRef] [Scilit] [PubMed]
- Wang, J.; Zhang, G.; You, Z. Design rules for dense and rapid Lissajous scanning. Microsyst. Nanoeng. 2020, 6, 101. [Google Scholar] [CrossRef] [Scilit] [PubMed]
- Brunner, D.; Yoo, H.W.; Schroedter, R.; Schitter, G. Adaptive Lissajous scanning pattern design by phase modulation. Opt. Express 2021, 29, 27989–28004. [Google Scholar] [CrossRef] [Scilit] [PubMed]
- Turner, K.L.; Miller, S.A.; Hartwell, P.G.; MacDonald, N.C.; Strogatz, S.H.; Adams, S.G. Five parametric resonances in a microelectromechanical system. Nature 1998, 396, 149–152. [Google Scholar] [CrossRef] [Scilit]

Disclaimer/Publisher’s Note: The statements, opinions and data contained in all publications are solely those of the individual author(s) and contributor(s) and not of MDPI and/or the editor(s). MDPI and/or the editor(s) disclaim responsibility for any injury to people or property resulting from any ideas, methods, instructions or products referred to in the content. |
© 2026 by the authors. Licensee MDPI, Basel, Switzerland. This article is an open access article distributed under the terms and conditions of the Creative Commons Attribution (CC BY) license.