


Abstract
In this paper, we analyze by means of numerical simulations the device design implications on the RON×QOSS Figure of Merit (FOM) in p-GaN power HEMTs to be employed in soft-switching converters. During switching, p-GaN power HEMTs experience dynamic RON increase but also dynamic QOSS reduction, effectively establishing a trade-off between the two device parameters. This trade-off stems from the physical mechanism of hole redistribution within the C-doped buffer. Device design choices such as field plate length, channel and buffer thickness as well as C-doping concentration influence both parameters; however, the relative variation of the two parameters is not necessarily symmetric. Simulations are therefore carried out to identify the best device design choices depending on the target trade-off between RON and QOSS.
1. Introduction
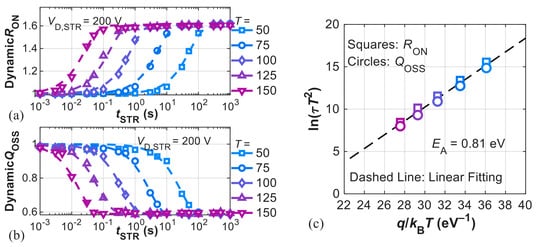
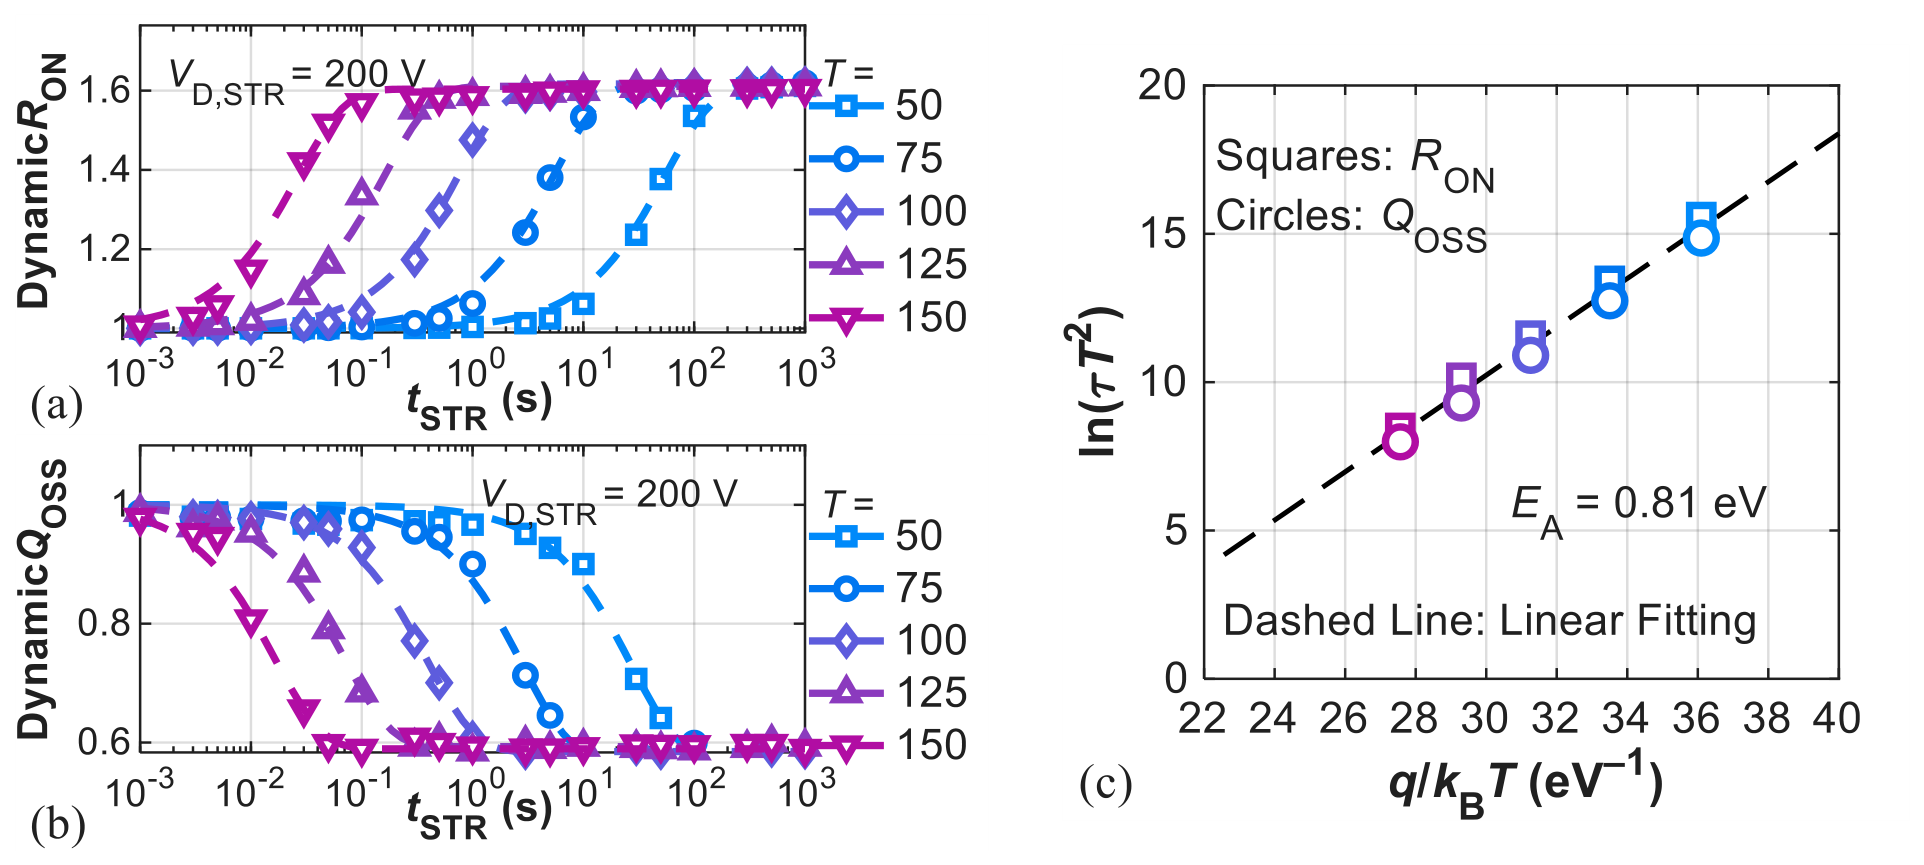
Gallium Nitride (GaN) has established its presence among wide-band-gap semiconductors for applications mainly in the power electronics and RF domains [1,2,3]. The advantages of GaN-based devices over other material systems stem from its excellent intrinsic material properties but also from the High Electron Mobility Transistor (HEMT) structure, which effectively enables high-voltage and high-frequency operation. From a device point of view, GaN-based HEMTs offer both low conduction losses (i.e., low RON) and low switching losses (i.e., low QG), with E-mode p-GaN HEMTs having the best RON×QG figure of merit amongst commercial devices [4]. Notwithstanding these merits, GaN-based devices suffer from significant dispersion effects related to trapping that affect their stability and reliability during operation [5]. One of the primary sources for dispersion is the traps in the buffer introduced by C-doping in the buffer [1], which are energetically located at about 0.9 eV above the GaN valence band [6]. The cause of dispersion is essentially the exchange of holes with the valence band, a process which exhibits a long time constant, typically in the order of tens of seconds at T = 30 °C [1,6,7]. The emission and redistribution of holes within the buffer modulate the number of ionized traps in the buffer itself, in turn modulating the two-dimensional electron gas (2DEG) concentration and therefore affecting the ON-state resistance (RON) [6]. Recently, we showed how the hole redistribution in the buffer also modulates the output charge (QOSS = QGD + QDS) as this quantity also depends on 2DEG concentration (i.e., the non-linear, non-constant output capacitance COSS = CGD + CDS varies if 2DEG varies) [8,9]. The correlation between dynamic RON and QOSS was first attributed to C-related traps in the buffer by the experimental study of Cioni et al. [8]. In the study, a simultaneous on-the-fly characterization of the two parameters was performed under switching conditions at 200 V. It was shown how dynamic RON increased with time while dynamic QOSS decreased, and more specifically it was observed how the variation of the two parameters followed an exponential evolution over time with approximately equal time constants in a wide temperature range from 25 to 150 °C. This behavior was reproduced with numerical simulations in our previous work, where it was shown how both dynamic RON increase and dynamic QOSS decrease could be explained with the hole redistribution model [9]. Figure 1 summarizes these findings by showing how the activation energy (EA) of dynamic RON (QOSS) increase (decrease) is 0.81 eV, which correlates with the C-related trap energy level (0.9 eV). Dynamic RON and QOSS are defined as relative values with respect to the value prior to stress, i.e., dynamic RON = RON(t)/RON(0), dynamic QOSS = QOSS(t)/QOSS(0).
Figure 1.
Dynamic (a) RON and (b) QOSS transients. Simulations were carried out at VD,STR = 200 V at different temperatures, T = 50–150 °C (ΔT = 25 °C). Dashed lines are the stretched-exponential fitting curves of the data. (c) Arrhenius plot extracted from the dynamic RON and QOSS transients. The dashed line is the linear fitting of the data, from which an EA = 0.81 eV was extracted in both cases, correlating with the CN trap level (0.9 eV).
In this work, we build upon the findings of [9] to show the effects of different design choices on the relative trade-off between RON and QOSS. Therefore, while the conference paper in ref. [9] focuses on clarifying the physical mechanism behind dynamic RON and QOSS correlation, namely the hole redistribution due to C-related traps, here the focus is on the design implications on the trade-off mentioned above, and on the possible strategies to minimize the FOM RON×QOSS, as discussed in the following.
We employ numerical simulations to show the sensitivity of both RON and QOSS on channel, barrier, and buffer thickness, carbon concentration, field plate(s) length, and passivation(s) thickness. Here, we focus on QOSS = QGD + QDS rather than QG (or QGD only) because in soft-switching converters QOSS is more detrimental to losses than QG, especially at high voltage ratings [10], and switching losses are almost absent (conversely, in hard-switching conditions, QGD is the limiting factor). More specifically, in soft-switching and resonant converters, switching losses are almost completely removed by including a dead-time interval during the period to ensure zero-voltage switching (ZVS) conditions. However, longer dead-time duration leads to higher conduction losses as the RMS current needed to transfer power to the output has to increase if the duty cycle reduces [10]. Dead-time duration is limited by QOSS (i.e., it corresponds to the time taken to discharge the non-linear output capacitance COSS), since the transistor drain-to-source voltage needs to be brought to zero volts in order to have ZVS. Therefore, design of GaN HEMTs for power converters working in soft-switching conditions should aim to minimize RON×QOSS [10,11,12].
2. Simulation Setup
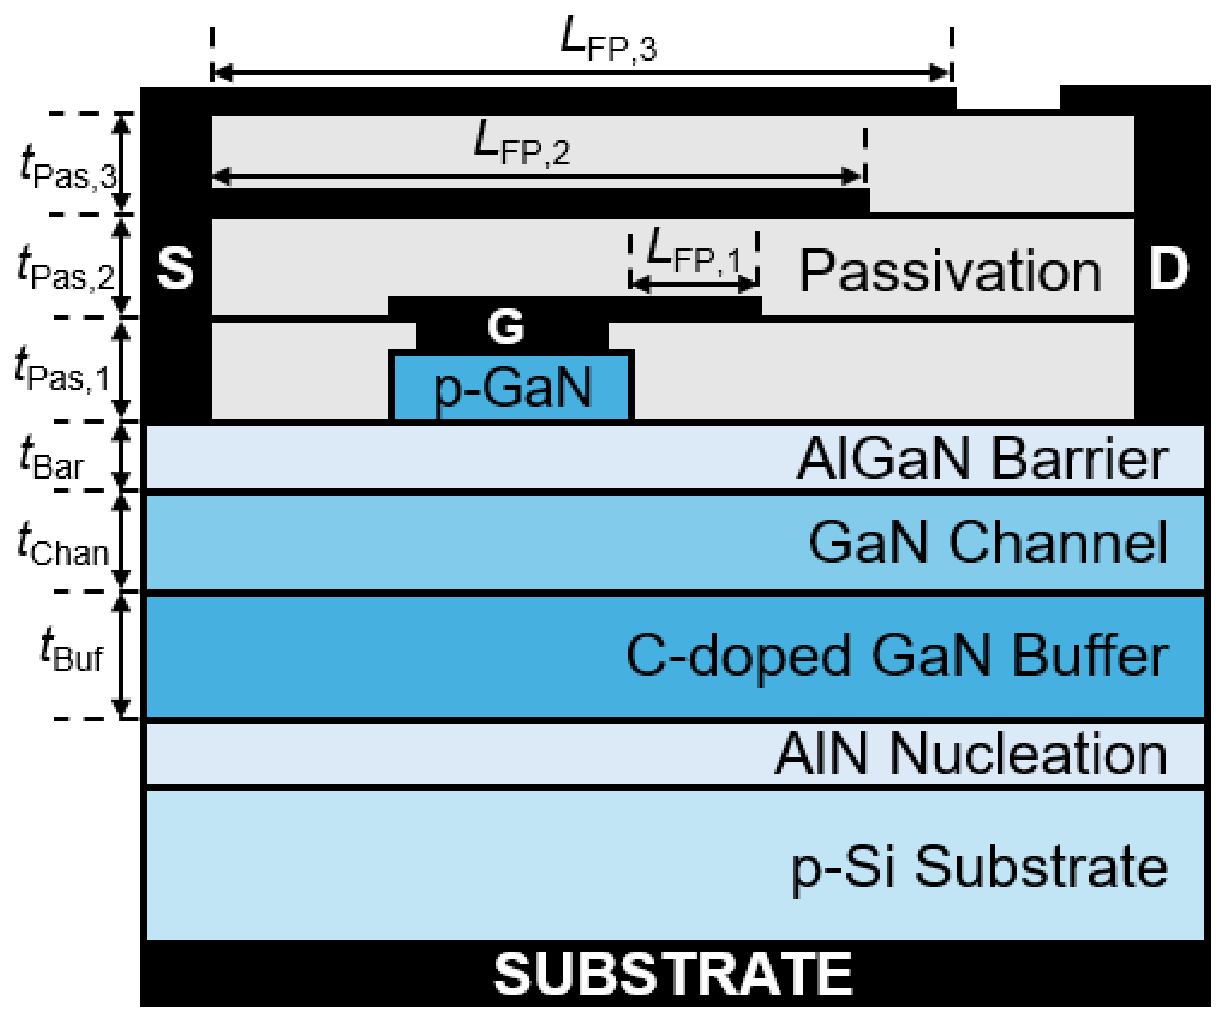
In this section we describe the numerical simulation setup in terms of device structure, models, and main simulation parameters. The structure is shown in Figure 2, which resembles a typical p-GaN HEMT for power applications. Note in particular the three separate field plates used to shield the drain edge of the gate terminal from large electric field peaks [13]. Note that field plate 1 is connected to the gate terminal, whereas field plates 2 and 3 are connected to the source terminal. The drain overhang is used to reduce the electric field peak at the drain terminal occurring at very large reverse voltages. Consistent with the structure in [7], which served as a template for the simulated device, the substrate was realized out of conductive p-type silicon, which is short-circuited to the source and thus grounded to the reference potential (0 V).
The numerical model is described as follows. The 2D numerical device simulations were carried out with the SDevice simulator (Synopsys Inc., Sunnyvale, CA, USA). Drift-diffusion was the model used to account for charge transport. Mobility was set to 1800 cm2/Vs in the 2DEG, exponentially decaying with temperature. Piezoelectric polarization charge was included at the AlGaN/GaN interface by using the default strain model of the simulator, leading to a 2DEG concentration of ≈7 × 1012 cm−2. Note that at the passivation/barrier interface, the polarization model was deactivated (i.e., we assumed that the negative polarization charge at this interface is completely compensated by an equal positive surface charge). Incomplete ionization of Mg-related acceptors in the p-GaN gate region was included in the model (the Mg ionization energy was set to 0.16 eV above the GaN valence band edge). Gate leakage was accounted for through hole tunneling across the Schottky junction formed by the gate metal contact and the p-GaN region. Source and drain contacts were modeled as Schottky junctions, with a similar approach to that discussed in [14]. Impact ionization was modeled with Chynoweth’s law. To model the vertical leakage conduction through the substrate and nucleation layers, we employed a similar strategy to that discussed in [15]. Dynamic effects related to C-doping traps were accounted for by adding one Shockley–Read–Hall (SRH) trap-balance equation for each distinct trap. Carbon doping in the GaN buffer was modeled by considering two different trap levels: a dominant deep acceptor trap at EV + 0.9 eV and a shallow donor trap at EC − 0.11 eV. The nominal trap concentrations were 4.3 × 10¹⁷ and 4 × 1017 cm−3 for C-related acceptors and donors, respectively. This corresponds to an effective acceptor density (NC,Eff) of 3 × 1016 cm−3. This particular choice is in line with what was done in ref. [7] to have a quantitative agreement with experimental results regarding dynamic RON. Table 1 collects the relevant parameter values used for the reference device.
Table 1.
Relevant parameter values used in the simulations for the reference device.
Figure 2.
Cross-section of the simulated 2D device. The geometrical parameters subject to variation in the analysis are indicated.
3. Numerical Simulation Results
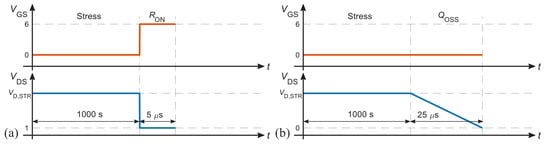
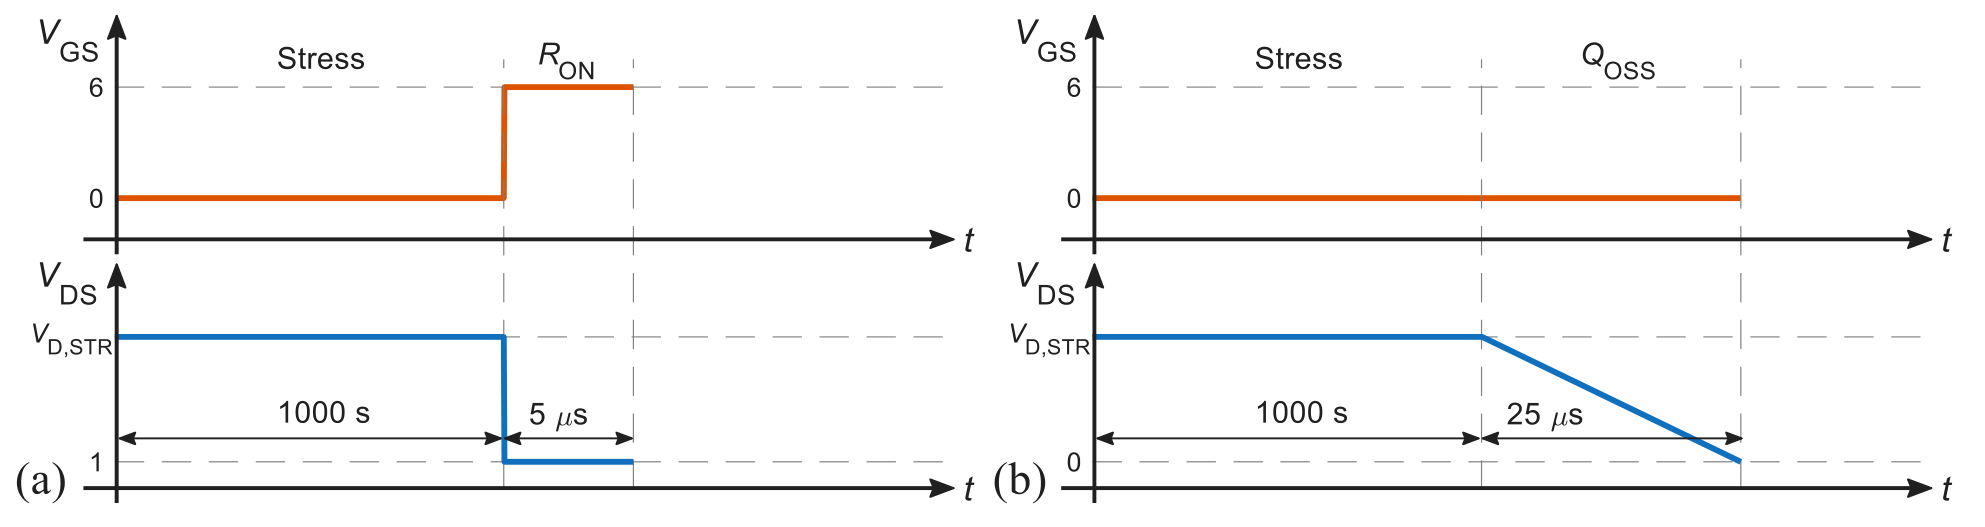
The results described in the following are obtained from numerical simulations that mimicked the experimental conditions used in [8] to characterize dynamic RON and QOSS. The simulated experiment consisted of the OFF-state stress condition applied for 1000 s, after which RON and QOSS were evaluated. RON was probed by switching the device ON (i.e., VGS = 6 V, VDS = 1 V) for 5 μs. QOSS was instead probed by switching VDS from the stress value to 0 V within a 25 μs time window, during which QOSS was obtained by integrating ID over time. Specifically,
The QOSS thus defined represents the total output charge. Because the QOSS is taken while the output capacitance discharges, the sign of the current ID is negative (and thus also QOSS); therefore, the absolute value is taken.
Figure 3 shows a sketch of the waveforms employed in the simulations to assess RON and QOSS during the simulated experiments. The on-pulse duration of 5 µs to monitor RON and the 25 µs-long ramp to bring VDS from VDS,STR to 0 V were set in agreement with the experimental setup defined in [8]. While the on-pulse duration is exactly the same as that in [8], the ramp duration agrees with the typical ramp duration in the experiments, which, however, is not defined a priori, because the drain potential is set by an external generator through a series resistance which is used to monitor the current during the switch-OFF. In the simulations, however, the drain potential is set directly; therefore, the ramp duration is given as an input. Nonetheless, neither the on-pulse nor the ramp time influences the RON and QOSS probing as long as their duration is well below the time constant of the hole emission process which defines the trap charge state (at T = 30 °C, the time constant is typically in the order of tens of seconds; therefore, this requirement is satisfied by the waveform durations set in the simulations). Stress duration of 1000 s was set in agreement with experimental conditions used in [8].
Figure 3.
Sketch of VGS and VDS waveforms applied during simulations to extract (a) RON and (b) QOSS after stress. After application of OFF-state stress conditions for 1000 s, (a) assessment of RON is carried out in the ON-state for 5 µs, and (b) assessment of QOSS is carried out during switching of VDS to 0 V for 25 µs. The time diagrams are not to scale and are for illustration only.
RON and QOSS were also evaluated after applying stress only for 10 µs in order to compare the RON×QOSS with commercial devices. We refer to the values extracted in this way as ‘prior to stress’, since C-related traps are well known to cause negligible dispersion effects at such short time scales at T = 30 °C, see for instance [6,7]. Therefore, RON and QOSS extracted in this way are only affected by the electrostatics of the device and not by dynamic effects associated with traps.
Table 2 shows the comparison with state-of-the-art GaN HEMTs rated at 650 V. In the simulations, RON is extracted at VGS = 6 V, VDS = 1 V. QOSS is extracted instead at VGS = 0 V, VDS = 400 V. The RON×QOSS extracted from the simulations is in the range of reported commercial technologies, providing a useful benchmark for the simulated device. Notice that the simulated device has a width of 1 mm; therefore, to make the simulated RON value comparable with those of commercial devices, a scaling factor of 200 (commercial devices have widths as large as hundreds or thousands of mm) was used to divide RON; QOSS was then obtained by multiplying by the same factor of 200. Nevertheless, RON×QOSS remains unaffected by scaling.
The nominal breakdown voltage (VBR) of the simulated device is 877 V. However, generally commercial devices are de-rated with respect to their actual VBR for reliability concerns; therefore, the simulated device should be considered as a 26% de-rated 650 V device. Even so, the comparison with commercial technology is intended as a technology benchmark for RON×QOSS rather than a direct device-to-device comparison.
Table 2.
Comparison of RON×QOSS of different commercial devices (values obtained from datasheets of vendors) rated for 650 V. The value extracted from the simulated device is in line with the state of the art.
3.1. Results After 1000-s Stress
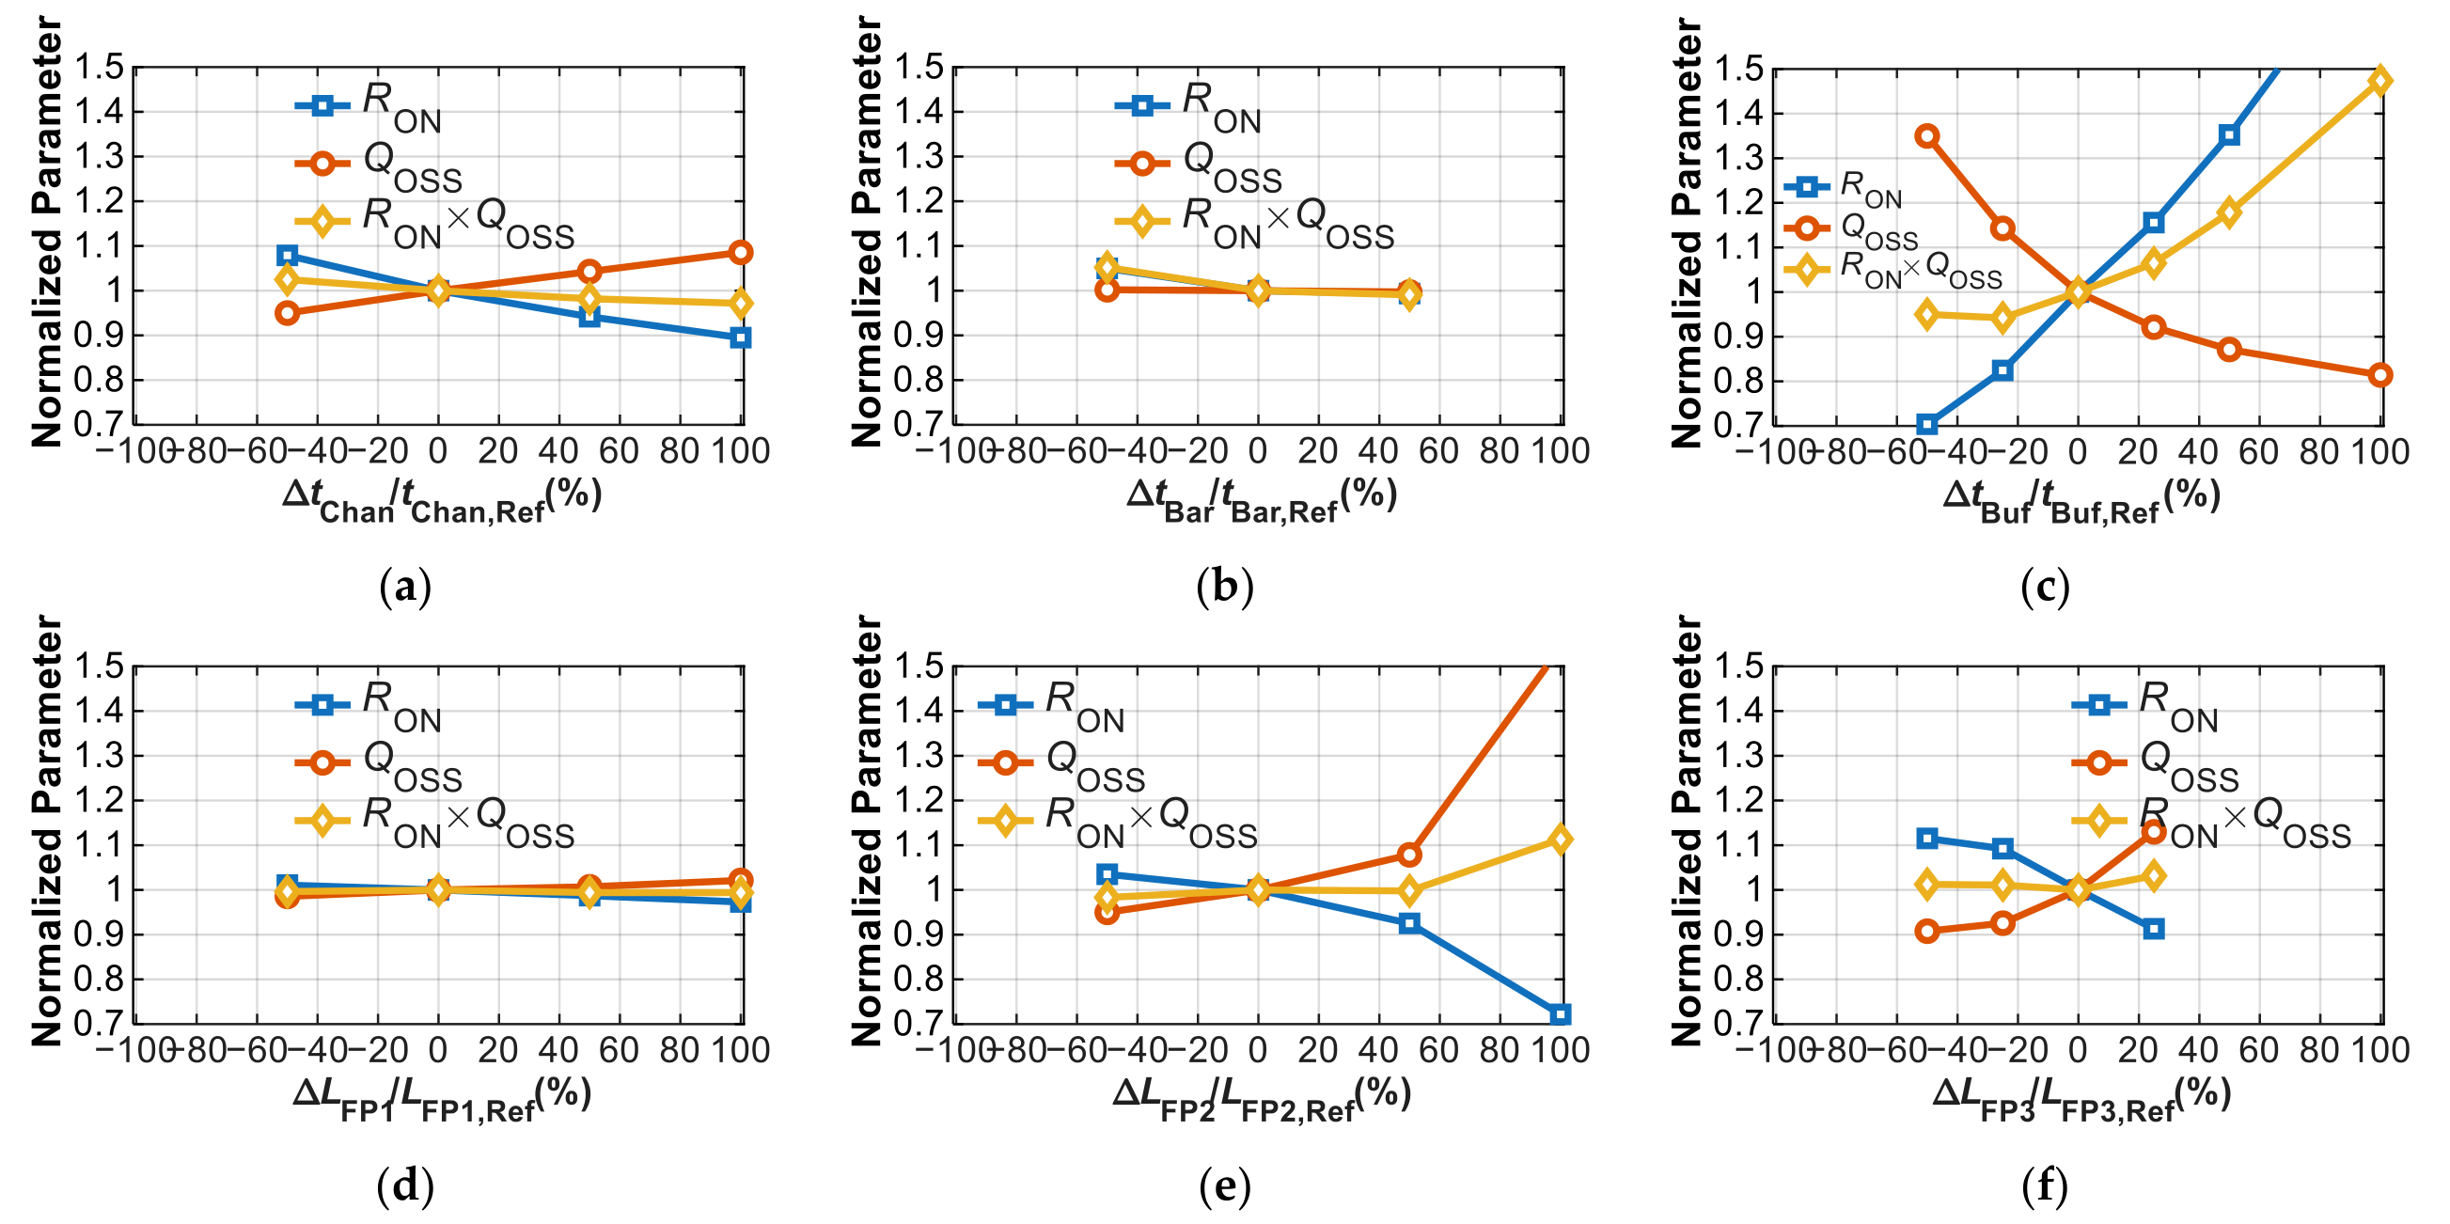
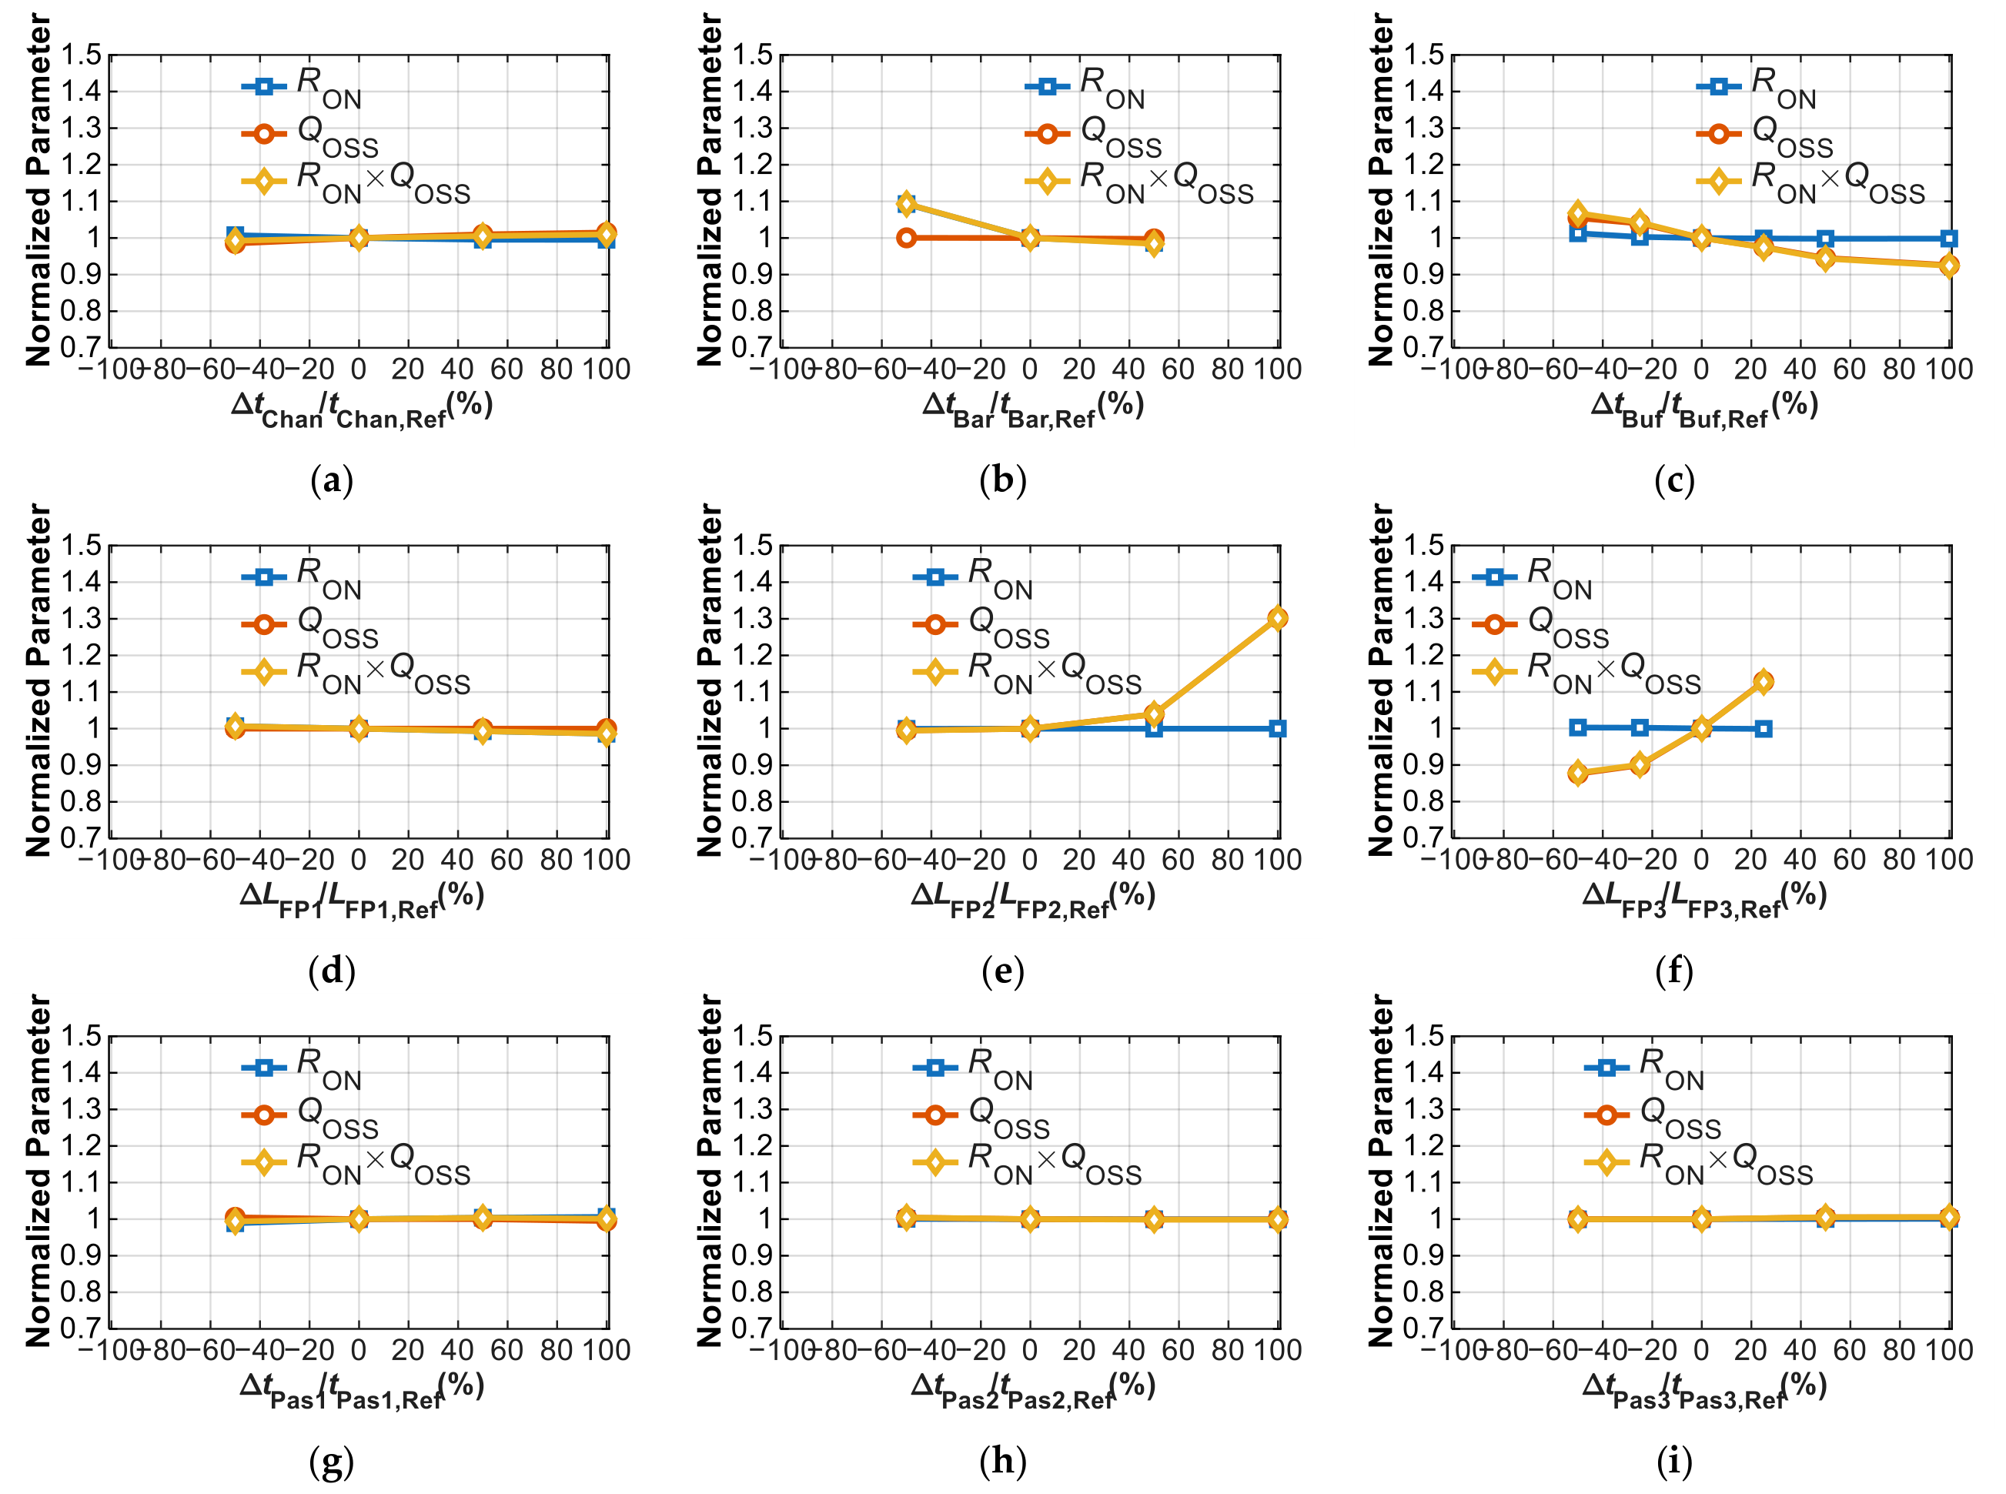
Results of the sensitivity analysis are presented in Figure 4. Each panel shows the dependence of RON, QOSS, and RON×QOSS on a single geometric parameter (all the others were kept fixed at their nominal value, reported in Table 1). The values are normalized to that of the reference device for a more immediate comparison. The values reported in Figure 4 are those taken at the end of the stress experiment illustrated in Figure 3 (the values prior to the stress experiment are reported in Section 3.2).
Figure 4a shows the effect of channel thickness (tChan) variation: tChan increase moves the C-related traps away from the 2DEG, thereby reducing their influence on the channel electrons, hence RON decreases and at the same time QOSS increases. This leads to an almost constant RON×QOSS (it decreases by about 3%). By the same token, a thinner tChan increases RON and decreases QOSS as the C-related traps are more effective in reducing the 2DEG concentration. Again, reducing tChan leads to an almost constant RON×QOSS, as the decrease in QOSS is almost completely mirrored by an RON increase.
Figure 4b shows that barrier thickness (tBar) increase only negligibly affects RON and QOSS, while its reduction causes RON to slightly increase, therefore leading to a small RON×QOSS increase of about 5% with a 50% reduction of tBar. The fact that RON increases also prior to stress as shown in Figure 6b indicates that the increase due to tBar reduction is caused by an electrostatic effect (barrier thickness reduction causes a decrease in 2DEG concentration, due to a larger difference between the conduction band and the Fermi level at a given bias [1]).
Interestingly, Figure 4c shows that both RON and QOSS vary significantly with buffer thickness (tBuf). When tBuf decreases, RON is reduced because for a given trap concentration the number of traps that become negatively charged is lower (because the volume is lower); therefore, the modulation of 2DEG by traps in the buffer is weaker and RON reduces. Opposite considerations apply when tBuf increases. Regarding QOSS, on top of the previous considerations about the variation of buffer traps, tBuf reduction also increases COSS; therefore, an additional increase of QOSS is observed; tBuf increase instead reduces QOSS by about 20%. The effect of tBuf on QOSS due to COSS modulation can be inferred from Figure 6c, which again shows results prior to stress (and thus allows one to appreciate the electrostatic contribution to the parameter variation). Overall, decreasing tBuf causes an RON×QOSS reduction of less than 10%; on the other hand, RON×QOSS increases with increasing tBuf up to almost 50% for a 100% tBuf increase. Therefore, while reducing tBuf might be beneficial to reduce RON, increasing it leads to an overall penalty in device performance, because RON increase is more severe than QOSS reduction.
Figure 4d–f show the sensitivity on the length of the three field plates present in the structure (see Figure 2). Figure 4d shows that field plate 1 length (LFP,1) variations cause negligible variation of both RON and QOSS. The slight RON reduction (QOSS increase) with increasing LFP,1 is attributed to the fact that a longer field plate increases the shielding effect of the ground bias (applied on the gate terminal in the OFF-state) against electric field peaks, thereby reducing the effect of trapped charge in the regions below the field plate itself. However, these variations are within 3% of the reference value, so little gain is to be expected from increasing LFP,1. Instead, when considering variations of field plate 2 length (LFP,2) as shown in Figure 4e, we can observe a more complex picture. Within ±50% LFP,2 variations, RON and QOSS vary symmetrically and by almost the same amount, as indicated by the fact that RON×QOSS remains almost constant. However, increasing LFP,2 by 100% causes RON and QOSS to vary more considerably. While RON reduction is explained by the shielding effect discussed before for LFP,1, the considerable QOSS increase is mainly due to the increased coupling between the source and drain terminals, which increases CDS (recall that this field plate is connected to the source terminal, see Figure 2). We conclude therefore that the effect of capacitive coupling between source and drain is more relevant to QOSS variation than the electric field shielding effect, as confirmed by the fact that RON×QOSS increases. Again, the electrostatic increase of CDS inducing QOSS increase can be appreciated from the results prior to stress, see Figure 6e. The effect of LFP,3 variations leads to similar results to those of the other field plates, as shown in Figure 4f. In this case, we also observe how RON×QOSS remains almost constant (LFP,3 was not increased by more than 50% because further increase would cause an overlap of field plate 3 with the drain overhang shown in Figure 2).
As a general remark, we observe how field plates should be designed keeping in mind two constraints: on the one hand, field plates provide the beneficial effect of shielding from electric field peaks in the off-state; on the other hand, they increase the gate–drain and source–drain coupling (i.e., CGD and CDS), which affect dynamic performance. Therefore, design of field plates is constrained by this trade-off, and depending on the target application either reducing or increasing field plate length might be more beneficial. Still, these considerations mostly apply to field plates 2 and 3, since field plate 1 is significantly shorter than the other ones, and much closer to the active region, therefore acting more as an electric field shield than anything else.
Concerning the modulation of the passivation thicknesses (tPas,1–tPas,3), Figure 4g–i show that both RON and QOSS variations are limited. Therefore, no significant advantage can be obtained from the variation of passivation thickness (provided that leakage is kept under control).
Figure 4.
Sensitivity of RON, QOSS, and RON×QOSS on variation of geometric parameters: (a) channel thickness, tChan; (b) barrier thickness, tBar; (c) buffer thickness, tBuf; (d) field plate 1 length (LFP,1); (e) field plate 2 length (LFP,2); (f) field plate 3 length (LFP,3); (g) passivation 1 thickness, tPas,1; (h) passivation 2 thickness, tPas,2; (i) passivation 3 thickness, tPas,3. Parameters were evaluated at the end of the stress phase, with VD,STR = 400 V applied for 1000 s at T = 30 °C.
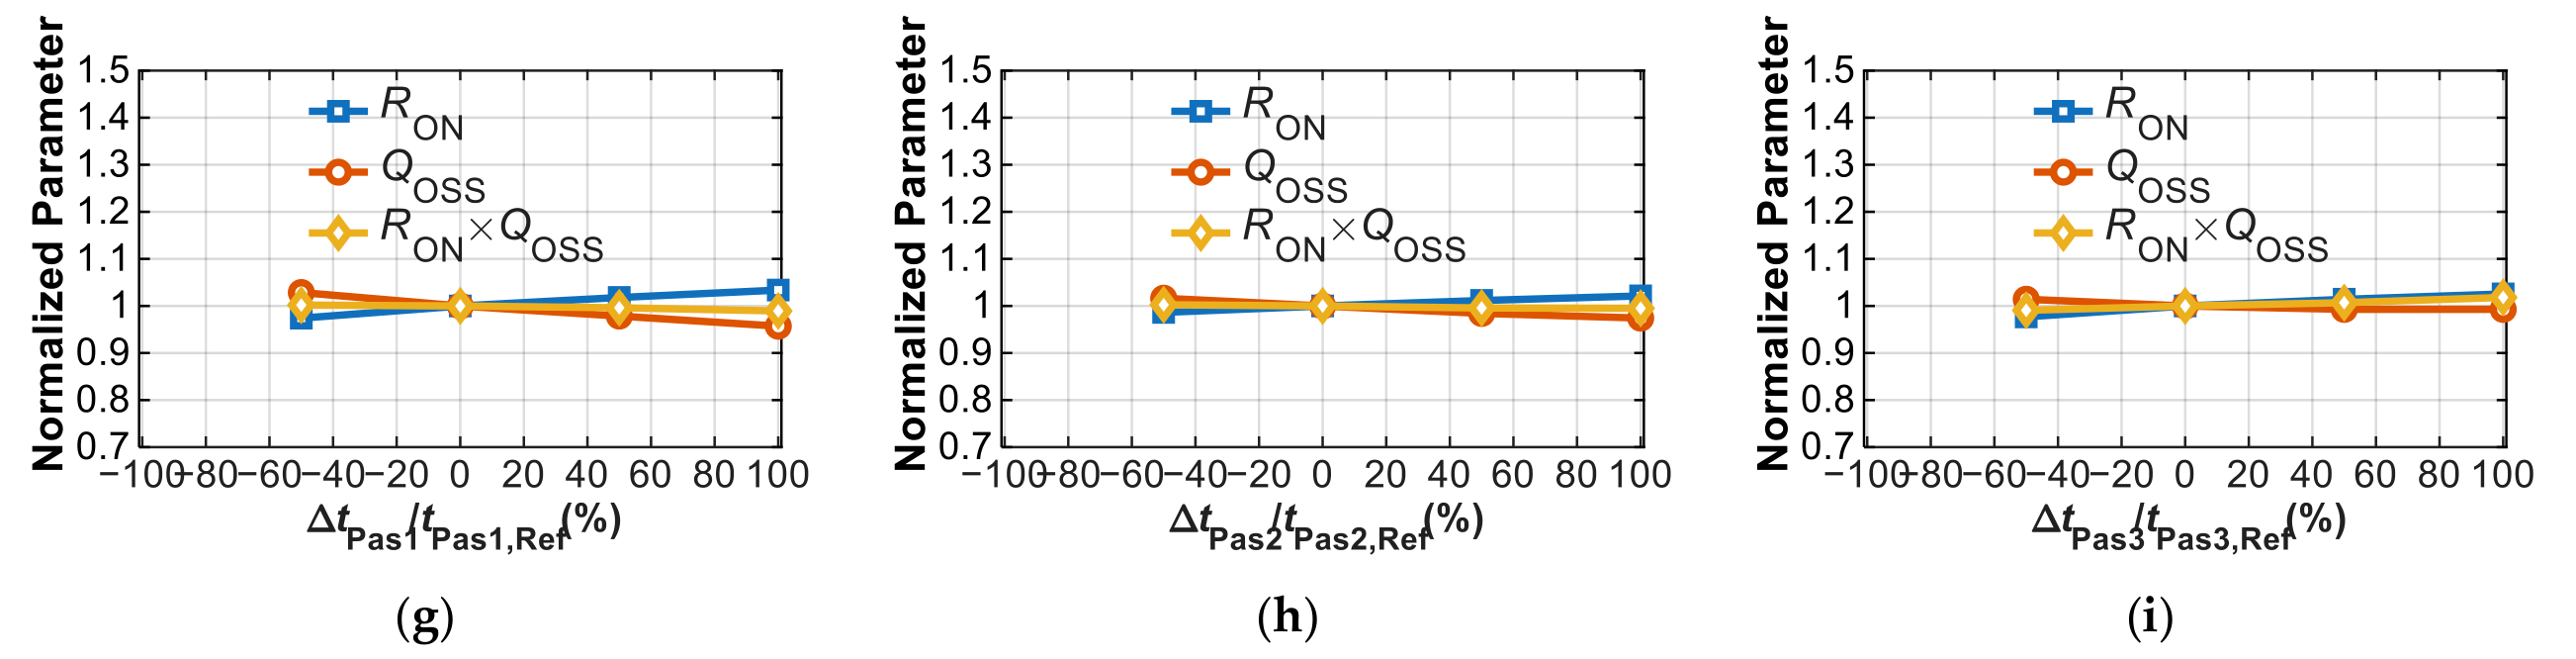
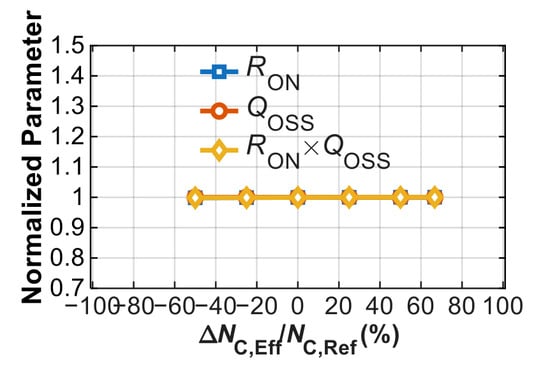
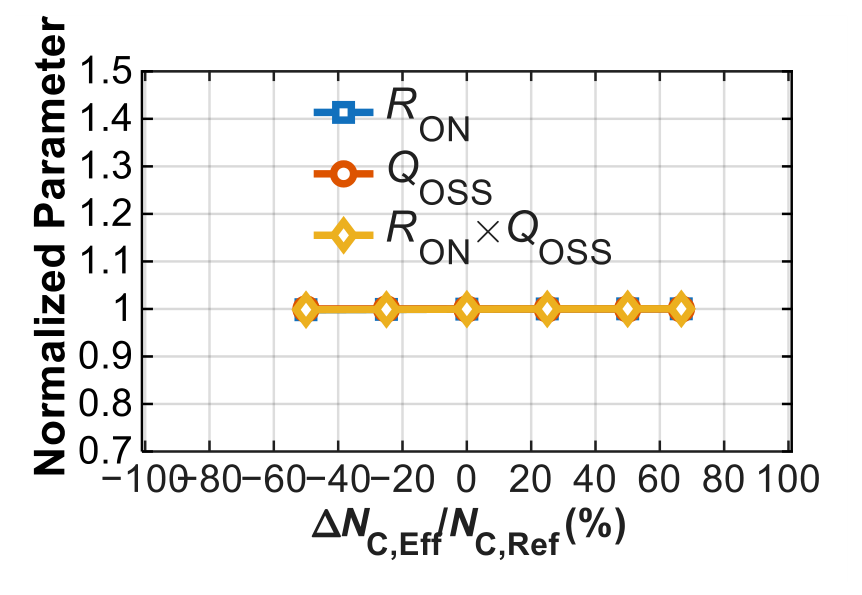
Another important parameter that causes significant variation on RON and QOSS is the concentration of C-related traps in the buffer (NC,Eff). Variation of NC,Eff is shown in Figure 5. An increase (decrease) in effective trap concentration increases (decreases) RON and decreases (increases) QOSS; these results are expected since C-related traps affect both RON and QOSS as established in [8,9]. We notice how RON×QOSS follows NC,Eff variations; therefore, it would be advisable to reduce NC,Eff as much as possible, provided that requirements on leakage and breakdown voltage are satisfied. We would like to point out that the picture above holds true as long as the increase in effective acceptor trap concentration occurs with increasing C-doping concentration. This might not hold true for very high C-doping concentration (i.e., higher than 1019 cm−3) for which the compensation by donors might also increase, overall leading to a reduced effective acceptor trap concentration [16].
Results in Figure 4 and Figure 5 were obtained at T = 30 °C and for a single VDS,STR = 400 V. Temperature is known to accelerate dynamic RON and QOSS degradation, in the sense that at a given time, variation of both parameters is larger in magnitude compared to the T = 30 °C case. However, after 1000 s stress, as can be appreciated from Figure 2, dynamic RON and QOSS have reached a steady-state condition; therefore, from a qualitative point of view the trends in Figure 4 and Figure 5 are expected to remain unaffected by temperature. Regarding VDS,STR variation, the picture is more complex as one has to consider that both dynamic RON and QOSS vary non-monotonically with VDS,STR, as reported in [8,9]. Therefore, the choice of VDS,STR will change the magnitude of degradation of both parameters, but not the qualitative behavior.
Figure 5.
Sensitivity of RON, QOSS, and RON×QOSS on variation of effective C-doping-related traps in the buffer (NC,Eff). VD,STR = 400 V at T = 30 °C. Parameters were evaluated at the end of the stress phase.
Results in Figure 4 and Figure 5 are obtained with the substrate grounded. The expected impact of having a floating substrate is to exacerbate the magnitude of dynamic RON (and consequently QOSS), as suggested in [17]. Having the substrate grounded, the device configuration in this work resembles that of a low-side device in a half-bridge configuration. While not specifically addressed in this work, in the case of monolithic integration of a half-bridge on a single substrate, the high-side device is expected to experience worse degradation in magnitude compared to the low-side one [18,19].
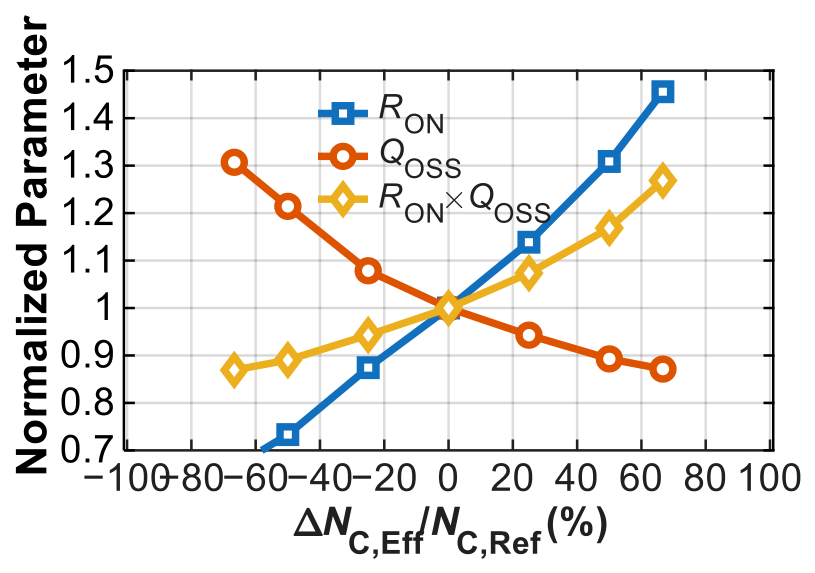
Figure 6.
Sensitivity of RON, QOSS, and RON×QOSS on variation of geometric parameters: (a) channel thickness, tChan; (b) barrier thickness, tBar; (c) buffer thickness, tBuf; (d) field plate 1 length (LFP,1); (e) field plate 2 length (LFP,2); (f) field plate 3 length (LFP,3); (g) passivation 1 thickness, tPas,1; (h) passivation 2 thickness, tPas,2; (i) passivation 3 thickness, tPas,3. Parameters were evaluated prior to the stress phase at T = 30 °C.
3.2. Results Prior to Stress
Figure 6 reports the simulation results of the sensitivity analysis on RON and QOSS obtained prior to the stress test (i.e., as specified in Section 2, these results are obtained after applying stress for 10 μs, which is short enough not to induce any measurable effect of dynamic RON and QOSS at T = 30 °C). This data complements the one shown in Figure 4, and the comparison allows assessing the effect of prolonged operation on RON, QOSS, and on the RON×QOSS FOM. Generally, we observe from Figure 6 how RON and QOSS are much less affected by parameter variations compared to Figure 4. This is attributed to the fact that the effect of C-related traps manifests itself only with the passing of time; therefore, RON and QOSS variations prior to stress (for instance, with tBar variation) have only to do with the electrostatics of the device, and not with C-related trapping effects. However, in some cases QOSS variation is significant even prior to stress due to electrostatics, see for instance Figure 6c,e,f. These variations have to do with device capacitance modulation induced by geometric parameter variations.
Lastly, Figure 7 shows the influence on the parameters of NC,Eff variation prior to the stress phase. Interestingly, both RON and QOSS remain almost insensitive to variations because the trap time constant is longer than the evaluation time window (i.e., carbon has little effect on RON and QOSS prior to stress). In practice, data presented in Figure 4 and Figure 5 are more important to the designer as the device will inevitably incur degradation during operation.
Figure 7.
Sensitivity of RON, QOSS, and RON×QOSS on variation of effective C-doping-related traps in the buffer (NC,Eff). Parameters were evaluated prior to the stress phase at T = 30 °C.
3.3. Discussion
From the results obtained so far, we observe that reducing RON×QOSS is possible by increasing channel thickness, decreasing buffer thickness, reducing source-connected field plate length, or reducing effective carbon doping concentration. Table 3 summarizes the variations obtained in terms of RON, QOSS, and RON×QOSS when performing the above variations. A comparison of the values obtained after and prior to stress allows one to immediately quantify how much of the variation is due to trapping effects or to electrostatic effects. In Table 3, we add a comparison of the breakdown voltage (VBR) and leakage current (ID,Leak) variation obtained with respect to the nominal case for each of the main parameters of interest identified with the previous analysis. VBR was defined as the VDS at which ID = 1 mA/mm when VGS = 0 V (for the nominal case, VBR = 877 V), whereas ID,Leak was taken at VDS = 650 V (for the nominal case, ID,Leak = 1.33 nA/mm). From Table 3 we can observe how increasing tChan or LFP,2 length gives negligible variation in VBR, and reduction of NC,Eff leads to about 5% reduction in VBR. Only when reducing tBuf by 50% does VBR reduce significantly by 39%. Concerning ID,Leak instead, increasing tChan leads to about 1.44 nA/mm leakage current, whereas reducing LFP,2 almost leaves ID,Leak unaffected. When decreasing tBuf by 50%, ID,Leak is not defined as the device breaks down below 650 V; for reduced NC,Eff instead ID,Leak increases by about 26 times to 35.9 nA/mm (this increase is in line with the difference between typical and maximum leakage current of commercial devices listed in Table 2). These indications give a clear picture to a designer of the trade-off between RON×QOSS, VBR, and ID,Leak upon critical parameter variations.
4. Conclusions
We analyzed by means of numerical simulations the device design implications on the RON×QOSS Figure of Merit (FOM) in p-GaN power HEMTs to be employed in soft-switching converters. RON and QOSS are strongly affected by C-related traps in the buffer; hence, device design can significantly affect their values by varying the amount of modulated negative trapped charge in the buffer. The analysis reveals that reducing RON×QOSS is possible by either: increasing channel thickness, decreasing buffer thickness, reducing source-connected field plate length, or reducing effective carbon doping concentration. These indications stem from the investigated device structure and parameter ranges, therefore they should be intended as simulation trends rather than general optimization rules.
Author Contributions
Conceptualization, N.Z. and A.C.; methodology, N.Z. and A.C.; formal analysis, N.Z., G.V., and A.C.; data curation, N.Z.; writing—original draft preparation, N.Z.; writing—review and editing, N.Z., G.V., and A.C.; funding acquisition, N.Z. and A.C. All authors have read and agreed to the published version of the manuscript.
Funding
This research received funding from the University of Modena and Reggio Emilia, FAR-DIP-2025-DIEF-ZAGNI E93C25000370005. This research was also supported by the Wide Bandgap (WBG) Pilot line, which is funded jointly by the Chips Joint Undertaking, through the European Union’s Digital Europe programme and Horizon Europe programme, as well as by the participating states Italy, Sweden, Poland, Finland, Austria, France, and Germany, under Grant Agreement n. 101183211. Funded by the European Union. Views and opinions expressed are however those of the author(s) only and do not necessarily reflect those of the European Union or the Chips JU. Neither the European Union nor the Chips JU can be held responsible for them.
Institutional Review Board Statement
Not applicable.
Informed Consent Statement
Not applicable.
Data Availability Statement
The original contributions presented in this study are included in the article. Further inquiries can be directed to the corresponding author.
Conflicts of Interest
The authors declare no conflicts of interest.
References
- Meneghini, M.; De Santi, C.; Abid, I.; Buffolo, M.; Cioni, M.; Khadar, R.A.; Nela, L.; Zagni, N.; Chini, A.; Medjdoub, F.; et al. GaN-based power devices: Physics, reliability, and perspectives. J. Appl. Phys. 2021, 130, 181101. [Google Scholar] [CrossRef] [Scilit]
- Iannaccone, G.; Sbrana, C.; Morelli, I.; Strangio, S. Power Electronics Based on Wide-Bandgap Semiconductors: Opportunities and Challenges. IEEE Access 2021, 9, 139446–139456. [Google Scholar] [CrossRef] [Scilit]
- Zanoni, E.; De Santi, C.; Gao, Z.; Buffolo, M.; Fornasier, M.; Saro, M.; De Pieri, F.; Rampazzo, F.; Meneghesso, G.; Meneghini, M.; et al. Microwave and Millimeter-Wave GaN HEMTs: Impact of Epitaxial Structure on Short-Channel Effects, Electron Trapping, and Reliability. IEEE Trans. Electron Devices 2023, 71, 1396–1407. [Google Scholar] [CrossRef] [Scilit]
- Buffolo, M.; Favero, D.; Marcuzzi, A.; De Santi, C.; Meneghesso, G.; Zanoni, E.; Meneghini, M. Review and Outlook on GaN and SiC Power Devices: Industrial State-of-the-Art, Applications, and Perspectives. IEEE Trans. Electron Devices 2024, 71, 1344–1355. [Google Scholar] [CrossRef] [Scilit]
- del Alamo, J.A.; Lee, E.S. Stability and Reliability of Lateral GaN Power Field-Effect Transistors. IEEE Trans. Electron Devices 2019, 66, 4578–4590. [Google Scholar] [CrossRef] [Scilit]
- Zagni, N.; Chini, A.; Puglisi, F.M.; Meneghini, M.; Meneghesso, G.; Zanoni, E.; Pavan, P.; Verzellesi, G. ‘Hole Redistribution’ Model Explaining the Thermally Activated RON Stress/Recovery Transients in Carbon-Doped AlGaN/GaN Power MIS-HEMTs. IEEE Trans. Electron Devices 2021, 68, 697–703. [Google Scholar] [CrossRef] [Scilit]
- Cioni, M.; Zagni, N.; Iucolano, F.; Moschetti, M.; Verzellesi, G.; Chini, A. Partial Recovery of Dynamic RON Versus OFF-State Stress Voltage in p-GaN Gate AlGaN/GaN Power HEMTs. IEEE Trans. Electron Devices 2021, 68, 4862–4868. [Google Scholar] [CrossRef] [Scilit]
- Cioni, M.; Chini, A.; Cappellini, G.; Giorgino, G.; Moschetti, M.; Miccoli, C.; Wakrim, T.; Lombardo, D.M.; Strano, S.; Cerantonio, V.; et al. On the Correlation Between Dynamic-QOSS and Dynamic-RON in GaN-Based HEMTs. IEEE Trans. Electron Devices 2025, 72, 5727–5731. [Google Scholar] [CrossRef] [Scilit]
- Zagni, N.; Chini, A.; Verzellesi, G. Dynamic RON and QOSS in P-GaN Power HEMTs Explained with the Hole Redistribution Model. In Proceedings of the 2026 IEEE International Reliability Physics Symposium (IRPS), Tucson, AZ, USA, 22–26 March 2026; pp. 1–4. [Google Scholar] [CrossRef] [Scilit]
- Reusch, D.; Strydom, J. Evaluation of gallium nitride transistors in high frequency resonant and soft-switching DC-DC converters. In Proceedings of the 2014 IEEE Applied Power Electronics Conference and Exposition—APEC 2014, Fort Worth, TX, USA, 16–20 March 2014; pp. 464–470. [Google Scholar] [CrossRef] [Scilit]
- Porter, M.; Yang, X.; Gong, H.; Wang, B.; Yang, Z.; Zhang, Y. Switching figure-of-merit, optimal design, and power loss limit of (ultra-) wide bandgap power devices: A perspective. Appl. Phys. Lett. 2024, 125, 110501. [Google Scholar] [CrossRef] [Scilit]
- Huang, A.Q. Power Semiconductor Devices for Smart Grid and Renewable Energy Systems. Proc. IEEE 2017, 105, 2019–2047. [Google Scholar] [CrossRef] [Scilit]
- Ronchi, N.; Bakeroot, B.; You, S.; Hu, J.; Stoffels, S.; Wu, T.-L.; De Jaeger, B.; Decoutere, S. Optimization of the source field-plate design for low dynamic RDS-ON dispersion of AlGaN/GaN MIS-HEMTs. Phys. Status Solidi A 2017, 214, 1600601. [Google Scholar] [CrossRef] [Scilit]
- Joshi, V.; Soni, A.; Tiwari, S.P.; Shrivastava, M. A Comprehensive Computational Modeling Approach for AlGaN/GaN HEMTs. IEEE Trans. Nanotechnol. 2016, 15, 947–955. [Google Scholar] [CrossRef] [Scilit]
- Borga, M.; De Santi, C.; Stoffels, S.; Bakeroot, B.; Li, X.; Zhao, M.; Van Hove, M.; Decoutere, S.; Meneghesso, G.; Meneghini, M.; et al. Modeling of the Vertical Leakage Current in AlN/Si Heterojunctions for GaN Power Applications. IEEE Trans. Electron Devices 2020, 67, 595–599. [Google Scholar] [CrossRef] [Scilit]
- Cioni, M.; Chini, A.; Zagni, N.; Verzellesi, G.; Giorgino, G.; Cappellini, G.; Miccoli, C.; Toulon, G.; Wakrim, T.; Castagna, M.E.; et al. On the Dynamic RON, Vertical Leakage and Capacitance Behavior in pGaN HEMTs with Heavily Carbon-Doped Buffers. IEEE Electron Device Lett. 2024, 45, 1437–1440. [Google Scholar] [CrossRef] [Scilit]
- Feng, W.; Shen, L.; Zhou, X.; Tian, Y.; Su, H.; Hu, Y.; Zheng, L.; Cheng, X. Dynamic Performance Analysis of p-GaN HEMTs with Floating Substrates by Substrate Capacitance Coupling Model. IEEE Trans. Electron Devices 2025, 72, 2201–2206. [Google Scholar] [CrossRef] [Scilit]
- Wang, D.; Zheng, L.; Cheng, X.; Shen, L.; Liu, X.; Liu, S.; Tian, Y.; Feng, J.; Yu, Y. Substrate Biasing Effect in a High-Voltage Monolithically-Integrated GaN-on-SOI Half Bridge with Partial Recessed-Gate HEMTs. IEEE Trans. Electron Devices 2023, 70, 2975–2980. [Google Scholar] [CrossRef] [Scilit]
- Modica, L.; Zagni, N.; Cioni, M.; Cappellini, G.; Castagna, M.E.; Giorgino, G.; Iucolano, F.; Chini, A. Analysis of Dynamic-Ron and VTH shift in on-wafer 100-V p-GaN HEMTs Emulating Monolithically Integrated Half-Bridge Circuits. IEEE J. Emerg. Sel. Top. Power Electron. 2025, 13, 7679–7686. [Google Scholar] [CrossRef] [Scilit]

Disclaimer/Publisher’s Note: The statements, opinions and data contained in all publications are solely those of the individual author(s) and contributor(s) and not of MDPI and/or the editor(s). MDPI and/or the editor(s) disclaim responsibility for any injury to people or property resulting from any ideas, methods, instructions or products referred to in the content. |
© 2026 by the authors. Licensee MDPI, Basel, Switzerland. This article is an open access article distributed under the terms and conditions of the Creative Commons Attribution (CC BY) license.