


Abstract
Background: Children and adolescents with overweight or obesity are at increased risk of insulin resistance, prediabetes, and type 2 diabetes mellitus (T2DM). A 1 h plasma glucose (1 h-PG) concentration ≥ 133 mg/dL during the oral glucose tolerance test (OGTT) has emerged as a potential marker of dysglycaemia and cardiometabolic risk. This study evaluated the glucometabolic profile of these children according to 1 h-PG and prediabetes status. Methods: This retrospective cross-sectional study included 347 children and adolescents with overweight or obesity undergoing the OGTT at a tertiary paediatric endocrinology centre. Participants were classified as having normal glucose tolerance (NGT), isolated 1 h-PG ≥ 133 mg/dL without prediabetes, prediabetes or T2DM. Participants with T2DM were excluded from comparative analyses. Results: Among the 347 participants, 219 (63.1%) had NGT, 72 (20.7%) isolated 1 h-PG ≥ 133 mg/dL, 53 (15.3%) prediabetes and three (0.9%) T2DM. As expected from the group definitions, glucose concentrations differed between groups at all OGTT time points. Participants with isolated 1 h-PG ≥ 133 mg/dL exhibited greater insulin resistance and impaired β-cell compensation compared with the NGT group, with significant differences in the homeostasis model assessment for insulin resistance, the Matsuda index, and the oral disposition index after adjustment for age, sex, ethnicity, pubertal status, and body mass index standard deviation score, whereas these indices did not differ significantly from those of participants with prediabetes. Significant between-group differences were also observed in triglycerides, total cholesterol, low-density lipoprotein cholesterol, and alanine aminotransferase levels. Conclusions: Children and adolescents with overweight or obesity and isolated 1 h-PG ≥ 133 mg/dL, although not meeting conventional criteria for prediabetes, exhibit insulin resistance and impaired β-cell compensation approaching those observed in prediabetes, together with a less favourable cardiometabolic profile. Assessment of 1 h-PG during the OGTT may help identify these children, but prospective studies are needed to establish its prognostic value.
1. Introduction
Childhood obesity has become one of the most important public health challenges worldwide, with its prevalence increasing dramatically over the past decades in both developed and developing countries [1,2,3]. According to the World Health Organization (WHO), obesity is defined as an abnormal or excessive accumulation of body fat that impairs health [1]. In children and adolescents, excess adiposity is associated with an increased risk of several metabolic complications, including hypertension, dyslipidaemia, metabolic dysfunction-associated steatotic liver disease (MASLD), and type 2 diabetes mellitus (T2DM) [4,5]. Among obesity-related complications, insulin resistance represents the key pathophysiological mechanism leading to glucose dysregulation [6]. Because obesity acquired during childhood frequently persists into adulthood, early identification of cardiometabolic risk factors has become a major clinical priority [3,4,5]. Initially, pancreatic β-cells compensate for reduced insulin sensitivity by increasing insulin secretion, thereby maintaining normal glucose concentrations [7]. However, progressive β-cell dysfunction may eventually result in prediabetes and T2DM [8]. Importantly, metabolic and vascular abnormalities may already be present before the onset of overt diabetes, supporting the need for strategies capable of identifying children at increased metabolic risk during the earliest stages of dysglycaemia [9,10].
Current guidelines from the American Diabetes Association (ADA) and the International Society for Pediatric and Adolescent Diabetes (ISPAD) recommend metabolic screening in children and adolescents with overweight or obesity who present additional risk factors for T2DM [11,12]. Among the available diagnostic tools, the oral glucose tolerance test (OGTT) remains a key tool for assessing glucose metabolism because it provides a dynamic evaluation of glucose homeostasis that cannot be obtained from fasting plasma glucose or glycated haemoglobin (HbA1c) alone [13]. Traditionally, glucose tolerance has been classified according to fasting and 2 h plasma glucose concentrations [13]. Nevertheless, these conventional parameters may fail to identify subjects with early abnormalities of glucose metabolism despite significant insulin resistance and impaired β-cell compensation [14,15]. Over the last decade, increasing attention has focused on plasma glucose measured one hour after glucose loading during the OGTT, termed 1 h plasma glucose (1 h-PG), as an early marker of dysglycaemia [16]. In adults, elevated 1 h-PG has consistently been associated with insulin resistance, impaired β-cell function, adverse cardiometabolic risk profiles, and an increased risk of progression to prediabetes and T2DM, even among individuals with normal fasting and 2 h glucose concentrations [17,18,19]. These findings suggest that 1 h-PG may detect metabolic impairment earlier than conventional glycaemic indices and therefore improve risk stratification before the development of overt glucose intolerance [17,18,19]. Similar findings have emerged in paediatric populations. Several studies conducted in children and adolescents with overweight or obesity have shown that elevated 1 h-PG is associated with greater insulin resistance, impaired β-cell compensation, higher triglyceride concentrations, and a more adverse cardiometabolic profile despite normal fasting and 2 h glucose values [20,21,22,23,24]. Based on the findings of Manco et al. [24], a 1 h-PG threshold of 133 mg/dL (7.4 mmol/L) has been proposed to identify children and adolescents at increased metabolic risk. Subsequent prospective studies have confirmed that children and adolescents with 1 h-PG ≥ 133 mg/dL exhibit impaired insulin sensitivity, reduced β-cell function, and an increased risk of progression to prediabetes despite normal fasting and 2 h glucose concentrations [25,26,27]. Although this cut-off has demonstrated promising diagnostic and prognostic performance, it has not yet been incorporated into current international guidelines, and additional evidence is required to clarify its clinical utility [11,12,24,25,26,27]. Recently, Deligozoglu et al. characterised OGTT-derived phenotypes in youth with obesity and showed that those with normal glucose tolerance and 1 h-PG ≥ 155 mg/dL already exhibit reduced insulin sensitivity and early β-cell dysfunction [28]. However, it remains unclear whether children with isolated 1 h-PG ≥ 133 mg/dL show a degree of metabolic impairment closer to that of normal glucose tolerance (NGT) or to that of prediabetes defined by ADA criteria, including HbA1c [24,25,26,27]. Better characterisation of this subgroup may help clarify its clinical relevance.
Therefore, the aim of the present study was to characterise the glucometabolic profile of children and adolescents with overweight or obesity undergoing the OGTT and to compare children with isolated 1 h-PG ≥ 133 mg/dL with both NGT and prediabetes, to determine whether their degree of insulin resistance and β-cell impairment is closer to NGT or to prediabetes, independently of age, sex, ethnicity, pubertal status, and body mass index standard deviation score (BMI SDS).
2. Materials and Methods
2.1. Objective of the Study
The primary objective of this study was to compare insulin sensitivity and β-cell function in children and adolescents with overweight or obesity and isolated 1 h-PG ≥ 133 mg/dL with those of participants with NGT and with prediabetes (Pre-DM), to determine whether their degree of metabolic impairment is closer to NGT or to Pre-DM, independently of age, sex, ethnicity, pubertal status, and BMI SDS. The secondary objective was to compare anthropometric, clinical, and biochemical characteristics, including cardiometabolic risk markers, between the three groups.
2.2. Study Design and Participants
This retrospective, observational, single-centre study included children and adolescents aged 6–19 years who attended the Paediatric Endocrinology Unit of the IRCCS Azienda Ospedaliero-Universitaria di Bologna, Policlinico di Sant’Orsola, for the evaluation of overweight or obesity between January 2018 and October 2025. A total of 347 participants (196 males and 151 females) were included. Overweight and obesity were diagnosed according to the Italian Society for Paediatric Endocrinology and Diabetology (SIEDP) reference standards [29]. In children and adolescents with overweight, the OGTT was performed when additional clinical or biochemical risk factors for glucose dysregulation were present, including evidence of insulin resistance. Inclusion criteria were age between 6 and 19 years, diagnosis of overweight or obesity, no previous diagnosis of glucose metabolism disorders, and availability of a complete five-point OGTT (0, 30, 60, 90, and 120 min), with the exception of one participant whose 90 min sample was haemolysed (see Section 2.4). Exclusion criteria included secondary forms of obesity, endocrine or chronic diseases affecting glucose metabolism, and treatment with drugs known to interfere with glucose homeostasis. Clinical and laboratory data were retrospectively collected from the institutional electronic medical records. Based on OGTT results, participants were classified as having NGT, isolated 1 h-PG ≥ 133 mg/dL, Pre-DM, or T2DM according to the definitions described below. Three participants met the diagnostic criteria for T2DM and were excluded from comparative analyses because of their limited number. Therefore, comparative analyses were performed in 344 participants.
2.3. Clinical and Biochemical Assessment
Demographic variables included age, sex, ethnicity (categorised as Caucasian or non-Caucasian), and family history of diabetes, defined as T2DM in first-degree (parents or siblings) or second-degree relatives (grandparents, aunts or uncles), or maternal gestational diabetes. Participants with maternal gestational diabetes were assigned to this category, including those who also had relatives with T2DM. Anthropometric evaluation comprised body weight, height, body mass index (BMI), BMI SDS, waist circumference, and waist-to-height ratio (WHtR). Height was measured using a Harpenden wall-mounted stadiometer, while body weight was measured using a calibrated mechanical beam scale with participants wearing light clothing and no shoes. BMI was calculated as weight divided by height squared (kg/m2), and BMI SDS was determined according to Italian reference standards [29]. Pubertal development was assessed according to Tanner staging [30,31] and categorised as prepubertal (Tanner stage 1) or pubertal (Tanner stage ≥ 2, defined by breast bud development in girls and testicular volume ≥ 4 mL in boys). Blood pressure was measured after at least 5 min of rest using an appropriately sized cuff, and the average of two measurements was recorded [32]. Blood pressure was categorised as < 130/80 or ≥ 130/80 mmHg. Fasting biochemical measurements included plasma glucose, insulin, HbA1c, total cholesterol, high-density lipoprotein (HDL) cholesterol, low-density lipoprotein (LDL) cholesterol, triglycerides, alanine aminotransferase (ALT), aspartate aminotransferase (AST), uric acid, thyroid-stimulating hormone (TSH), and free thyroxine (fT4), the latter two measured to exclude hypothyroidism as a secondary cause of obesity. LDL cholesterol was calculated using the Friedewald formula. Insulin sensitivity and β-cell function were evaluated using validated surrogate indices, including the homeostasis model assessment for insulin resistance (HOMA-IR), the homeostasis model assessment for insulin sensitivity (HOMA-S) [33], the Matsuda insulin sensitivity index [34], the insulinogenic index (IGI) [35], and the oral disposition index (ODI) [36]. Insulin values at 30 min obtained from haemolysed samples, which were lower than fasting values owing to haemolysis-related underestimation, were treated as missing; a sensitivity analysis retaining these values was also performed. IGI and ODI were not calculated when plasma glucose did not increase between 0 and 30 min.
2.4. Oral Glucose Tolerance Test and Definitions
All participants underwent a standard OGTT after an overnight fast of at least 8 h. Glucose was administered orally at a dose of 1.75 g/kg body weight (maximum 75 g) [12]. Venous blood samples for plasma glucose and insulin measurements were obtained at 0, 30, 60, 90, and 120 min after glucose administration. In one participant, plasma glucose at 90 min could not be measured because the sample was haemolysed; as this value was not required for glucose tolerance classification, the participant was retained, and the Matsuda index and ODI were not calculated. Conventional glucose tolerance categories were defined according to ADA criteria [11]. Prediabetes was diagnosed in the presence of impaired fasting glucose (100–125 mg/dL), impaired glucose tolerance (2 h plasma glucose 140–199 mg/dL), and/or HbA1c between 5.7% and 6.4%. T2DM was diagnosed in the presence of fasting plasma glucose ≥ 126 mg/dL, 2 h plasma glucose ≥ 200 mg/dL, or HbA1c ≥ 6.5%. HbA1c was recorded as a categorical variable according to these ADA thresholds (<5.7%, 5.7–6.4%, and ≥6.5%). For the purposes of the present study, participants without prediabetes or T2DM were further classified according to 1 h-PG. NGT was defined as fasting plasma glucose < 100 mg/dL, 2 h plasma glucose < 140 mg/dL, HbA1c <5.7%, and 1 h-PG < 133 mg/dL. Isolated elevated 1 h-PG was defined as a 1 h-PG concentration ≥ 133 mg/dL (7.4 mmol/L) in participants who did not meet ADA criteria for prediabetes or T2DM, using the threshold proposed by Manco et al. [24].
2.5. Statistical Analysis
Statistical analyses were performed using Jamovi (version 2.7.13.0; The jamovi project, Sydney, Australia). Continuous variables are presented as mean ± standard deviation (SD) or median and interquartile range (IQR), as appropriate, whereas categorical variables are reported as frequencies and percentages. Data distribution was assessed using the Shapiro–Wilk test. Comparisons of continuous variables between the three study groups were performed using the Kruskal–Wallis test. When a significant overall difference was detected, pairwise post hoc comparisons were performed using the Dwass–Steel–Critchlow–Fligner test. Categorical variables were compared using Pearson’s χ2 test. When a significant overall association was detected, post hoc pairwise comparisons were performed using 2 × 2 χ2 tests with Bonferroni adjustment for multiple comparisons. To assess whether differences in key metabolic indices were independent of potential confounders, multivariable linear regression models were performed for log-transformed HOMA-IR, Matsuda index, and ODI, adjusting for age, sex, ethnicity, pubertal status, and BMI SDS. Both age and pubertal status were included as covariates, as puberty is associated with a physiological reduction in insulin sensitivity independently of chronological age [37]. Robust standard errors were used, and results were expressed as adjusted geometric mean ratios with 95% confidence intervals (CIs). Models were based on complete cases for each outcome. Because the Matsuda index and ODI incorporate post-load glucose concentrations, an additional model was fitted for log-transformed fasting insulin, which is independent of the criteria used to define the groups, adjusting for the same covariates and for fasting plasma glucose. In a sensitivity analysis, the comparison between participants with isolated 1 h-PG ≥ 133 mg/dL and those with Pre-DM was repeated after excluding participants who met the HbA1c criterion only (n = 7). A two-sided p-value < 0.05 was considered statistically significant.
3. Results
3.1. Cohort Description
A total of 347 children and adolescents with overweight or obesity were included in the study (Table 1). The study population comprised 196 males (56.5%) and 151 females (43.5%), with a mean age of 12.8 ± 2.6 years (range 6–19 years). Overall, 31 participants (8.9%) were younger than 10 years, 182 (52.4%) were aged 10–13 years, and 134 (38.6%) were aged 14 years or older. Pubertal participants had a mean age of 13.5 ± 2.3 years and prepubertal participants of 10.2 ± 1.7 years. Overall, 87 participants (25.1%) were classified as overweight, 227 (65.4%) as having obesity, and 33 (9.5%) as having severe obesity. The cohort was predominantly Caucasian (68.9%), whereas 31.1% of participants were of non-Caucasian ethnicity. According to conventional ADA criteria, participants were initially classified as having NGT, Pre-DM, or T2DM. The distribution of glucose metabolism status differed significantly across BMI categories (p = 0.003), with a lower proportion of NGT and a higher prevalence of glucose abnormalities among participants with greater BMI severity (Table 2). Three participants (0.9%) met the ADA diagnostic criteria for T2DM and were excluded from subsequent comparative analyses because of their limited number. The remaining 344 participants were classified according to the study definitions into three groups: NGT, isolated 1 h-PG ≥ 133 mg/dL without Pre-DM, and Pre-DM. Among the 53 participants with Pre-DM, 14 (26.4%) met the criterion for impaired fasting glucose only, 22 (41.5%) for impaired glucose tolerance only, and seven (13.2%) for HbA1c only, whereas 10 (18.9%) met more than one criterion.
Table 1.
Demographic and anthropometric characteristics of the study population.
Table 2.
Distribution of conventional glucose tolerance according to BMI category.
3.2. Clinical and Anthropometric Characteristics
The clinical characteristics of the study population are summarised in Table 3. No significant differences were observed between the three groups regarding sex distribution, gestational age, birth weight, acanthosis nigricans, waist-to-height ratio, BMI category, or systolic and diastolic blood pressure. No significant differences were observed in pubertal status between the three groups (p = 0.161). Significant differences were observed for ethnicity (p = 0.039), with a significantly greater proportion of non-Caucasian participants in the isolated 1 h-PG ≥ 133 mg/dL group than in the NGT group (41.7% vs. 26.5%; post hoc adjusted p = 0.045). Family history of diabetes also differed significantly between groups (p = 0.007). Post hoc analyses showed a significant difference between the NGT and Pre-DM groups (adjusted p = 0.004). Compared with participants with NGT, those with Pre-DM less frequently reported no family history of diabetes (32.1% vs. 57.1%; adjusted p = 0.003) and more frequently reported a second-degree family history (41.5% vs. 24.2%; adjusted p = 0.034) or maternal gestational diabetes (9.4% vs. 2.3%; adjusted p = 0.039).
Table 3.
Baseline demographic and clinical characteristics according to glucose metabolism group (NGT, isolated 1 h-PG ≥ 133 mg/dL, Pre-DM).
Anthropometric characteristics are reported in Table 4. Age differed significantly between groups (p = 0.023), with post hoc analysis showing that participants with isolated 1 h-PG ≥ 133 mg/dL were significantly older than those with NGT (p = 0.026). Waist circumference also differed significantly between groups (p = 0.006), with significantly higher values in participants with Pre-DM than in those with NGT (post hoc p = 0.006). Abdominal circumference differed significantly in the overall comparison (p = 0.041), although post hoc pairwise comparisons did not reach statistical significance. No significant differences were found for height, body weight, BMI, BMI SDS, hip circumference, or blood pressure.
Table 4.
Anthropometric characteristics according to glucose metabolism group.
3.3. Glucose Metabolism and Biochemical Characteristics
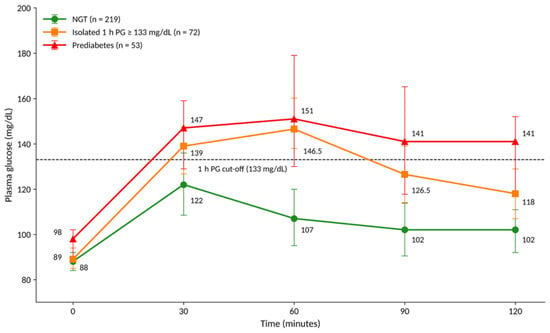
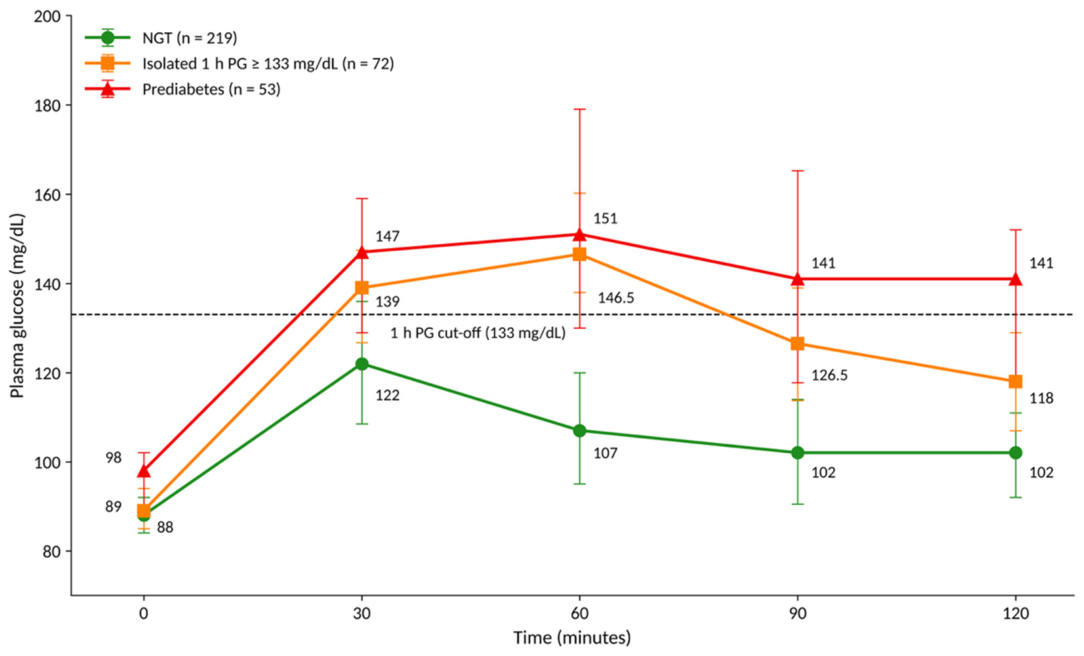
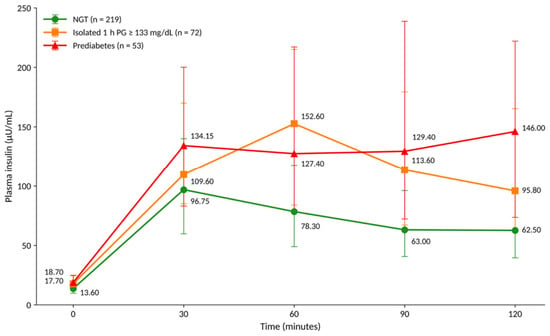
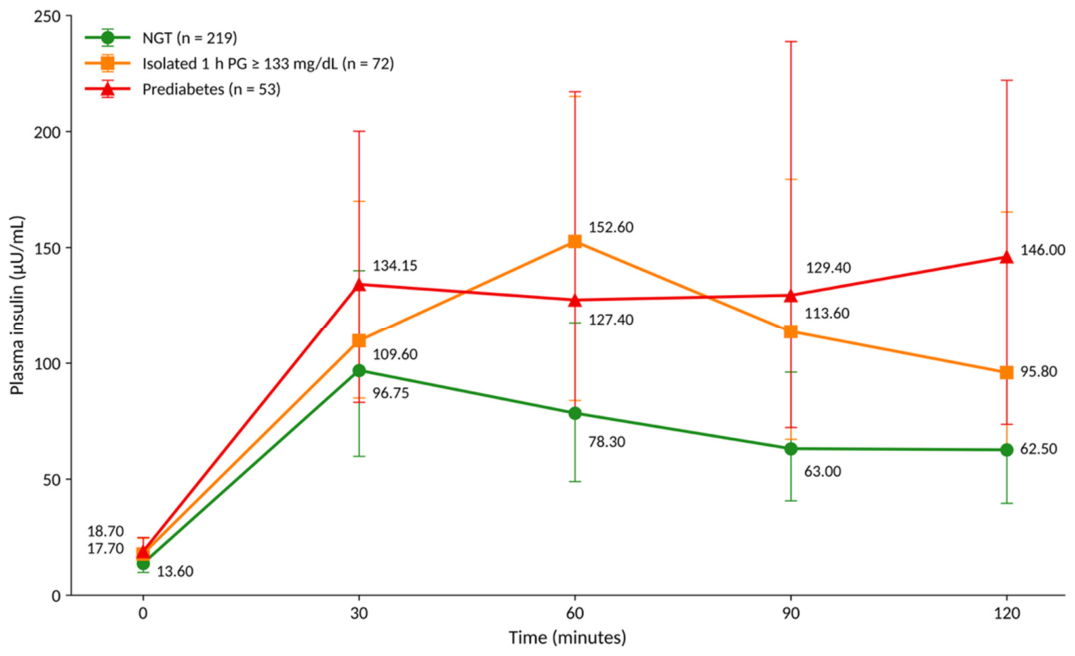
Glucose metabolism parameters are summarised in Table 5, whereas the plasma glucose and insulin profiles during the OGTT are shown in Figure 1 and Figure 2, respectively.
Table 5.
Glucose metabolism, insulin secretion, insulin sensitivity, and biochemical characteristics according to glucose metabolism group.
Figure 1.
Plasma glucose profiles during the oral glucose tolerance test according to glucose metabolism group. Values are presented as median and interquartile range (IQR). The dashed horizontal line indicates the proposed 1 h plasma glucose cut-off of 133 mg/dL. NGT, normal glucose tolerance; 1 h-PG, 1 h plasma glucose; Pre-DM, prediabetes.
Figure 2.
Plasma insulin profiles during the oral glucose tolerance test according to glucose metabolism group. Values are presented as median and interquartile range (IQR). NGT, normal glucose tolerance; 1 h-PG, 1 h plasma glucose; Pre-DM, prediabetes.
As expected, plasma glucose concentrations at fasting and at all OGTT time points differed significantly between the three groups (all p < 0.001). Plasma glucose concentrations generally increased from NGT to isolated 1 h-PG ≥ 133 mg/dL and Pre-DM across the OGTT. Median 1 h-PG increased across the three groups, from 107 mg/dL (IQR 95–120) in NGT to 146.5 mg/dL (IQR 138–160.25) in isolated 1 h-PG ≥ 133 mg/dL and 151 mg/dL (IQR 130–179) in Pre-DM. Similarly, fasting and post-load insulin concentrations differed significantly between the three groups, with generally higher concentrations in participants with isolated 1 h-PG ≥ 133 mg/dL and Pre-DM than in those with NGT, consistent with greater insulin resistance in the two dysglycaemic groups. No significant differences in insulin concentrations were observed between the isolated 1 h-PG ≥ 133 mg/dL and Pre-DM groups at any OGTT time point, although median insulin concentrations at 90 and 120 min were numerically higher in the Pre-DM group (Figure 2). This pattern was further supported by indices of insulin resistance and β-cell compensation. HOMA-IR was significantly higher, whereas HOMA-S, the Matsuda index, and ODI were significantly lower in both the isolated 1 h-PG ≥ 133 mg/dL and Pre-DM groups than in the NGT group (all post hoc p ≤ 0.001). No significant differences in these indices were observed between the isolated 1 h-PG ≥ 133 mg/dL and Pre-DM groups. No significant differences were observed for IGI (p = 0.252). Differences in HOMA-IR, the Matsuda index, and ODI remained significant after adjustment for age, sex, ethnicity, pubertal status, and BMI SDS. Compared with NGT, participants with isolated 1 h-PG ≥ 133 mg/dL had a 28% higher adjusted HOMA-IR (ratio 1.28, 95% CI 1.08–1.51; p = 0.004), a 35% lower Matsuda index (ratio 0.65, 95% CI 0.55–0.76; p < 0.001), and a 46% lower ODI (ratio 0.54, 95% CI 0.44–0.66; p < 0.001). These results were unchanged when 30 min insulin values from haemolysed samples were retained (Matsuda index ratio 0.65, 95% CI 0.56–0.76; ODI ratio 0.54, 95% CI 0.44–0.66; both p < 0.001). No significant adjusted differences were observed between the isolated 1 h-PG ≥ 133 mg/dL and Pre-DM groups. Fasting plasma glucose was similar in the NGT and isolated 1 h-PG ≥ 133 mg/dL groups (median 88 [IQR 84–92] vs. 89 [IQR 85–94] mg/dL), whereas fasting insulin was higher in the latter (13.6 [IQR 9.8–19.0] vs. 17.7 [IQR 13.0–24.5] µU/mL). After adjustment for age, sex, ethnicity, pubertal status, BMI SDS and fasting plasma glucose, fasting insulin remained 25% higher in participants with isolated 1 h-PG ≥ 133 mg/dL than in those with NGT (ratio 1.25, 95% CI 1.05–1.47; p = 0.010), and did not differ significantly from that of participants with Pre-DM (ratio 0.93, 95% CI 0.76–1.14; p = 0.48). In the sensitivity analysis restricted to Pre-DM defined by glucose criteria (n = 46), participants with isolated 1 h-PG ≥ 133 mg/dL had a lower HOMA-IR than those with Pre-DM (ratio 0.81, 95% CI 0.66–1.00; p = 0.047), with a similar trend for the Matsuda index (ratio 1.24, 95% CI 0.99–1.54; p = 0.056), whereas ODI did not differ (ratio 1.20, 95% CI 0.92–1.56; p = 0.18).
Biochemical findings are presented in Table 5. Triglyceride, total cholesterol and LDL cholesterol concentrations were significantly higher in participants with isolated 1 h-PG ≥ 133 mg/dL than in those with NGT (post hoc p = 0.048, p = 0.004 and p = 0.007, respectively), whereas ALT concentrations were significantly higher in participants with Pre-DM than in those with NGT (post hoc p = 0.003). No significant differences were observed between the isolated 1 h-PG ≥ 133 mg/dL and Pre-DM groups for these parameters. In contrast, HDL cholesterol, uric acid, AST, and TSH did not differ significantly between the three groups. Overall, participants with isolated 1 h-PG ≥ 133 mg/dL displayed glucose concentrations intermediate between those of the NGT and Pre-DM groups, as expected from the group definitions, whereas indices of insulin resistance and β-cell compensation were significantly impaired compared with NGT and did not differ significantly from those observed in Pre-DM.
4. Discussion
In this retrospective study including 347 children and adolescents with overweight or obesity who underwent an OGTT, we found that individuals with isolated 1 h-PG ≥ 133 mg/dL, although not meeting conventional criteria for prediabetes, exhibited insulin resistance and impaired β-cell compensation approaching those observed in children with prediabetes, while their glucose concentrations during the OGTT were, as expected from the group definitions, intermediate between those of the NGT and prediabetes groups. These children displayed increased insulin resistance, reduced insulin sensitivity, impaired β-cell compensation, and a less favourable lipid profile. These findings suggest that isolated elevation of 1 h-PG identifies children with a degree of metabolic impairment that is not detected by conventional glycaemic criteria [19,38,39]. Our findings are consistent with the growing evidence supporting the role of 1 h-PG as a marker of dysglycaemia in children and adolescents with overweight or obesity. While fasting plasma glucose and 2 h plasma glucose remain the cornerstone of current diagnostic criteria, several studies have shown that an elevated 1 h-PG identifies subjects with substantial metabolic impairment despite normal conventional OGTT results [20,23,39,40]. In particular, Di Bonito et al. demonstrated that a 1 h-PG threshold of 133 mg/dL provides greater sensitivity than the recently proposed 155 mg/dL cut-off for identifying children with impaired glucose tolerance and an unfavourable cardiometabolic profile [23]. Our findings extend these observations by specifically characterising children with isolated 1 h-PG ≥ 133 mg/dL who do not fulfil conventional criteria for prediabetes, showing that their metabolic impairment approaches that observed in children with prediabetes. Similarly, Marcovecchio et al. reported that obese youth with elevated 1 h-PG exhibit reduced insulin sensitivity and impaired β-cell compensation, supporting the concept that alterations in glucose homeostasis are already present before conventional criteria for prediabetes are fulfilled [40]. More recently, in a cohort of 726 youths with obesity, Deligozoglu et al. reported that those with normal glucose tolerance and 1 h-PG ≥ 155 mg/dL had a lower Matsuda index, greater insulin exposure and lower early insulin secretion indices than those with 1 h-PG < 155 mg/dL [28]. Our findings extend these observations to the lower 133 mg/dL threshold and show that, after adjustment for age, sex, ethnicity, pubertal status and BMI SDS, insulin resistance and β-cell compensation in this subgroup do not differ significantly from those of children with prediabetes. Our assessment of insulin sensitivity and β-cell function further strengthens this concept. Children with isolated 1 h-PG ≥ 133 mg/dL exhibited higher HOMA-IR values together with a lower HOMA-S, Matsuda index, and ODI than those with NGT, indicating the presence of both hepatic and peripheral insulin resistance accompanied by inadequate β-cell compensation. Importantly, differences in HOMA-IR, Matsuda index, and ODI remained significant after adjustment for age, sex, ethnicity, pubertal status, and BMI SDS, suggesting that the adverse metabolic phenotype associated with isolated 1 h-PG elevation was not explained by these potential confounders. Differences in post-load glucose concentrations, particularly at 60 min, largely reflect the criteria used to define the groups and cannot by themselves support the existence of a distinct phenotype; our interpretation therefore relies mainly on insulin-based indices. In this regard, fasting plasma glucose was similar in the NGT and isolated 1 h-PG ≥ 133 mg/dL groups, so the higher HOMA-IR observed in the latter mainly reflected higher fasting insulin concentrations. This fasting hyperinsulinaemia persisted after adjustment for fasting plasma glucose, BMI SDS and the other covariates, suggesting that the greater insulin resistance observed in this subgroup is not merely a consequence of the group definition. Conversely, differences in the Matsuda index and ODI, which incorporate post-load glucose concentrations, should be interpreted with caution in this respect. Notably, these indices did not differ significantly between children with isolated 1 h-PG ≥ 133 mg/dL and those with prediabetes, in either unadjusted or adjusted analyses. This suggests that, with respect to insulin sensitivity and β-cell function, isolated 1 h-PG elevation may not represent a distinct intermediate stage, but rather a degree of metabolic impairment approaching that of prediabetes, which is not detected by conventional diagnostic criteria. Nevertheless, the absence of statistically significant differences does not imply equivalence, and the relatively small size of the prediabetes group may have limited the power to detect smaller differences. Indeed, when prediabetes was restricted to fasting or 2 h glucose criteria, children with isolated 1 h-PG ≥ 133 mg/dL showed slightly lower insulin resistance than those with prediabetes, with a similar trend for insulin sensitivity, suggesting that their metabolic impairment approaches, but may be less pronounced than, that of glucose-defined prediabetes. According to the hyperbolic relationship between insulin sensitivity and insulin secretion, a decline in disposition index reflects one of the earliest manifestations of β-cell dysfunction and predicts progression toward impaired glucose tolerance and T2DM [36,41,42]. These findings are consistent with the concept that glucose dysregulation is a continuum rather than a set of discrete diagnostic categories. Figure 2 shows the insulin profiles of the three groups: median insulin concentrations at 90 and 120 min were numerically higher in participants with prediabetes than in those with isolated 1 h-PG ≥ 133 mg/dL, although these differences were not statistically significant.
Unlike most previous studies, we compared three mutually exclusive glycaemic groups—NGT, isolated 1 h-PG ≥ 133 mg/dL, and prediabetes—rather than simply subjects with and without elevated 1 h-PG. This approach allowed us to show that children with isolated 1 h-PG ≥ 133 mg/dL, although having lower glucose concentrations at most OGTT time points than children with prediabetes, show a degree of insulin resistance and impaired β-cell compensation approaching theirs. Collectively, these findings indicate that isolated 1 h-PG elevation identifies children with an unfavourable metabolic phenotype that is not captured by current diagnostic criteria [20,22,23,39,40].
Family history of diabetes was also associated with glucose metabolism status in our cohort. The prevalence of a positive family history was highest among participants with prediabetes, with post hoc analyses showing a significant difference between the NGT and Pre-DM groups, particularly for second-degree family history and maternal gestational diabetes. This finding is consistent with previous evidence indicating that familial diabetes is associated with reduced insulin sensitivity, impaired β-cell compensation, and an increased risk of T2DM already during childhood and adolescence [11,43,44]. Our results therefore support the hypothesis that a positive family history identifies children with overweight or obesity in whom prediabetes is more frequent. Although genetic susceptibility undoubtedly contributes to the development of T2DM, family history should not be interpreted exclusively as a marker of inherited risk. Indeed, familial clustering of diabetes also reflects the influence of shared environmental and behavioural factors, including unhealthy dietary habits, sedentary lifestyle, obesity-promoting home environments, and socioeconomic determinants, all of which contribute to the early development of insulin resistance [11,44,45]. Consequently, family history should be regarded as an easily obtainable clinical marker that integrates both genetic predisposition and exposure to modifiable environmental risk factors.
Another noteworthy finding was the higher prevalence of non-Caucasian ethnicity among children with isolated 1 h-PG ≥ 133 mg/dL compared with those with NGT. Similar observations have been reported in paediatric cohorts, in which children of South Asian, Hispanic, African, and other minority ethnic backgrounds exhibit a greater susceptibility to insulin resistance and dysglycaemia than their Caucasian peers despite comparable degrees of adiposity [46,47]. However, these ethnic differences are unlikely to be explained solely by genetic factors. Increasing evidence suggests that social determinants of health—including socioeconomic disadvantage, reduced access to healthcare, differences in nutrition, and fewer opportunities for physical activity—substantially contribute to the higher metabolic risk observed in these populations [11,48]. Therefore, ethnicity should be interpreted as a complex determinant of metabolic health that reflects the interaction between biological susceptibility and environmental influences.
We also observed that children with isolated 1 h-PG ≥ 133 mg/dL were slightly older than those with NGT, whereas no significant age difference was observed between the Pre-DM and NGT groups. Although pubertal status did not differ significantly between groups (p = 0.161), puberty is characterised by a transient physiological reduction in insulin sensitivity mediated by hormonal changes, including increased growth hormone and sex steroid secretion. In children already affected by overweight or obesity, this physiological insulin resistance may contribute to the development of dysglycaemia, particularly in genetically susceptible individuals [11,37]. Although BMI and obesity severity did not differ significantly between the three glycaemic groups, waist circumference differed significantly overall, with significantly higher values in children with prediabetes than in those with NGT and intermediate values in those with isolated 1 h-PG ≥ 133 mg/dL. This pattern suggests that central adiposity, rather than overall obesity severity, may play a more relevant role in glucose dysregulation. Visceral adipose tissue is metabolically active and promotes insulin resistance through increased free fatty acid flux, chronic low-grade inflammation, and altered adipokine secretion, thereby contributing to impaired glucose homeostasis [7,49,50,51]. Interestingly, waist-to-height ratio, when analysed as a categorical variable, did not significantly differ between groups. This is likely explained by a ceiling effect, as almost all participants with available measurements (95.4%) had a waist-to-height ratio ≥ 0.5, whereas waist circumference analysed as a continuous variable retained discriminatory power. Similar observations have been reported in paediatric populations, where waist circumference has been shown to correlate more closely than BMI with insulin resistance, ectopic fat accumulation, and future cardiometabolic risk [52,53,54].
In contrast, the prevalence of acanthosis nigricans was comparable across the three groups. Although acanthosis nigricans is traditionally considered a clinical marker of insulin resistance, evidence suggests that its presence is more strongly associated with obesity itself than with the severity of metabolic impairment. Consequently, while acanthosis remains a useful bedside sign for identifying children at increased metabolic risk, it may have limited ability to discriminate between different stages of glucose dysregulation among youths with overweight or obesity [55,56,57]. Our findings are consistent with this interpretation, as approximately half of the participants in each group presented acanthosis nigricans despite marked differences in insulin resistance and glucose metabolism. Taken together, these observations reinforce the concept that body fat distribution is more informative than overall adiposity in identifying children at increased metabolic risk.
Beyond glucose metabolism, children with isolated 1 h-PG ≥ 133 mg/dL also exhibited a less favourable cardiometabolic profile than those with NGT. In particular, this group had significantly higher triglyceride, total cholesterol and LDL cholesterol concentrations than the NGT group, whereas participants with prediabetes had significantly higher ALT concentrations. These findings are consistent with previous paediatric studies demonstrating that elevated 1 h-PG is associated not only with impaired glucose regulation but also with a clustering of cardiometabolic risk factors, including dyslipidaemia, hepatic steatosis, and insulin resistance [22,23,58,59]. Hypertriglyceridaemia is a well-recognised consequence of insulin resistance and reflects increased hepatic very-low-density lipoprotein production together with impaired triglyceride clearance [60]. Likewise, high ALT concentrations may represent an indirect marker of MASLD, a condition frequently associated with paediatric obesity and closely linked to hepatic insulin resistance [61,62]. The differences observed in lipid concentrations further support the concept that isolated elevation of 1 h-PG identifies children with a less favourable cardiometabolic profile despite normal conventional OGTT results.
Conversely, HDL cholesterol, uric acid, AST, and TSH concentrations were comparable among the three groups. These findings suggest that not all metabolic abnormalities are present to the same extent across glycaemic groups, although the cross-sectional design does not allow conclusions on the temporal sequence of these alterations. Longitudinal studies are warranted to clarify this aspect.
From a clinical perspective, our findings suggest that assessment of 1 h-PG during the OGTT may help identify children and adolescents with overweight or obesity who present an unfavourable metabolic phenotype despite normal fasting and 2 h glucose concentrations. In our cohort, these children accounted for approximately one in four (72/291, 24.7%) of those classified as having normal glucose metabolism according to conventional ADA criteria. Current diagnostic criteria rely primarily on fasting and 2 h plasma glucose concentrations, potentially overlooking individuals who present significant insulin resistance and impaired β-cell compensation despite normal conventional OGTT results [38,39]. Although our study does not support replacing current diagnostic criteria, it indicates that children with isolated 1 h-PG ≥ 133 mg/dL represent a subgroup with an unfavourable metabolic phenotype, although whether they would benefit from closer clinical monitoring remains to be established. However, owing to the cross-sectional design, our data describe a metabolic phenotype and do not demonstrate the prognostic value of isolated 1 h-PG elevation. Therefore, prospective longitudinal studies are required to determine whether this phenotype independently predicts progression to prediabetes, T2DM, MASLD, and cardiovascular complications.
The present study has several strengths. It includes a relatively large paediatric cohort in which children with isolated 1 h-PG ≥ 133 mg/dL were compared directly with those with prediabetes defined by fasting glucose, 2 h glucose, and HbA1c. All participants underwent a standardised multipoint OGTT, allowing a comprehensive assessment of glucose and insulin dynamics together with multiple validated surrogate indices of insulin resistance, insulin sensitivity, and β-cell function.
Several limitations should also be acknowledged. First, the retrospective cross-sectional design and lack of longitudinal follow-up preclude establishing causal relationships and determining whether isolated elevation of 1 h-PG predicts progression to prediabetes or T2DM over time. Moreover, we did not assess whether 1 h-PG provides incremental predictive value beyond conventional clinical and glycaemic parameters. In addition, the Matsuda index and ODI incorporate post-load glucose concentrations and are therefore not fully independent of the 1 h-PG-based group definition. Second, this was a single-centre study, potentially limiting the generalisability of the findings to other populations. Third, owing to the retrospective design, data on dietary habits, physical activity, sedentary behaviour, menstrual cycle phase, renal function, and inflammatory markers were not systematically available. Fourth, the non-Caucasian group was heterogeneous in terms of geographic origin, preventing analyses of specific ethnic subgroups; larger multicentre studies are needed to confirm the observed ethnic differences. Fifth, participants were recruited from a tertiary paediatric endocrinology centre, and the OGTT was performed in children with overweight only in the presence of additional risk factors, which may have led to the selection of a population at higher metabolic risk. Finally, the relatively small size of the Pre-DM group may have limited the statistical power to detect differences between this group and children with isolated 1 h-PG ≥ 133 mg/dL.
5. Conclusions
Children and adolescents with overweight or obesity presenting isolated 1 h-PG ≥ 133 mg/dL, despite not fulfilling current diagnostic criteria for prediabetes, exhibit insulin resistance and impaired β-cell compensation approaching those observed in prediabetes, together with a less favourable lipid profile. These findings indicate that 1 h-PG assessment during the OGTT may help identify children with an unfavourable metabolic phenotype that is not detected by conventional diagnostic criteria. However, given the cross-sectional design, the prognostic value of this phenotype remains to be established, and prospective studies are needed to determine whether it predicts long-term deterioration of glucose metabolism and whether early targeted interventions can modify its clinical trajectory.
Author Contributions
Conceptualisation, G.M. (Giulio Maltoni) and L.B.; methodology, G.M. (Giulio Maltoni), L.B., and A.S.; validation, G.M. (Giulio Maltoni) and M.L.; formal analysis, G.M. (Giulio Maltoni) and L.B.; investigation, G.M. (Giulio Maltoni), L.B., A.S., and G.M. (Giulia Montanari); resources, G.M. (Giulio Maltoni) and M.L.; data curation, L.B., A.S., F.C., and G.M. (Giulia Montanari); writing—original draft preparation, L.B., F.C., and A.S.; writing—review and editing, G.M. (Giulio Maltoni), L.B., G.M. (Giulia Montanari), and M.L.; visualisation, L.B. and A.S.; supervision, G.M. (Giulio Maltoni) and M.L.; project administration, G.M. (Giulio Maltoni). All authors have read and agreed to the published version of the manuscript.
Funding
This research received no external funding.
Institutional Review Board Statement
This retrospective study was conducted in compliance with Regulation (EU) 2016/679 (GDPR) and the Italian Privacy Code (Legislative Decree 196/2003, Art. 110, as amended by Legislative Decree 101/2018 and PNRR-bis, April 2024), which allow the use of anonymised health data for retrospective scientific research without Ethics Committee approval. All patient data were processed in anonymised form in accordance with the Italian Data Protection Authority guidelines.
Informed Consent Statement
Informed consent for participation was not required as per local legislation (Regulation (EU) 2016/679, Recital 26), as this retrospective study used exclusively anonymised data collected during routine clinical care.
Data Availability Statement
The de-identified data presented in this study are available on request from the corresponding author, subject to institutional and data-protection regulations.
Conflicts of Interest
The authors declare no conflicts of interest.
Abbreviations
The following abbreviations are used in this manuscript:
| 1 h-PG | 1 h plasma glucose |
| ADA | American Diabetes Association |
| AGA | appropriate for gestational age |
| ALT | alanine aminotransferase |
| AST | aspartate aminotransferase |
| BMI | body mass index |
| BMI SDS | body mass index standard deviation score |
| CI | confidence interval |
| fT4 | free thyroxine |
| HbA1c | glycated haemoglobin |
| HDL | high-density lipoprotein |
| HOMA-IR | homeostasis model assessment for insulin resistance |
| HOMA-S | homeostasis model assessment for insulin sensitivity |
| IGI | insulinogenic index |
| IQR | interquartile range |
| ISPAD | International Society for Pediatric and Adolescent Diabetes |
| LDL | low-density lipoprotein |
| LGA | large for gestational age |
| MASLD | metabolic dysfunction-associated steatotic liver disease |
| NGT | normal glucose tolerance |
| ODI | oral disposition index |
| OGTT | oral glucose tolerance test |
| Pre-DM | prediabetes |
| SD | standard deviation |
| SGA | small for gestational age |
| SIEDP | Italian Society for Paediatric Endocrinology and Diabetology |
| T2DM | type 2 diabetes mellitus |
| TSH | thyroid-stimulating hormone |
| WHO | World Health Organization |
| WHtR | waist-to-height ratio |
References
- World Health Organization. Obesity and Overweight; World Health Organization: Geneva, Switzerland, 2025; Available online: https://www.who.int/news-room/fact-sheets/detail/obesity-and-overweight (accessed on 25 July 2026).
- Styne, D.M.; Arslanian, S.A.; Connor, E.L.; Farooqi, I.S.; Murad, M.H.; Silverstein, J.H.; Yanovski, J.A. Pediatric Obesity—Assessment, Treatment, and Prevention: An Endocrine Society Clinical Practice Guideline. J. Clin. Endocrinol. Metab. 2017, 102, 709–757. [Google Scholar] [CrossRef] [Scilit] [PubMed]
- Kumar, S.; Kelly, A.S. Review of Childhood Obesity. Mayo Clin. Proc. 2017, 92, 251–265. [Google Scholar] [CrossRef] [Scilit] [PubMed]
- Hampl, S.E.; Hassink, S.G.; Skinner, A.C.; Armstrong, S.C.; Barlow, S.E.; Bolling, C.F.; Avila Edwards, K.C.; Eneli, I.; Hamre, R.; Joseph, M.M.; et al. Clinical Practice Guideline for the Evaluation and Treatment of Children and Adolescents With Obesity. Pediatrics 2023, 151, e2022060640. [Google Scholar] [CrossRef]
- Marcus, C.; Danielsson, P.; Hagman, E. Pediatric Obesity—Long-term Consequences and Effect of Weight Loss. J. Intern. Med. 2022, 292, 870–891. [Google Scholar] [CrossRef] [Scilit] [PubMed]
- Tchernof, A.; Després, J.-P. Pathophysiology of Human Visceral Obesity: An Update. Physiol. Rev. 2013, 93, 359–404. [Google Scholar] [CrossRef] [Scilit] [PubMed]
- Weiss, R.; Santoro, N.; Giannini, C.; Galderisi, A.; Umano, G.R.; Caprio, S. Prediabetes in Youths: Mechanisms and Biomarkers. Lancet Child Adolesc. Health 2017, 1, 240–248. [Google Scholar] [CrossRef] [Scilit] [PubMed]
- Hannon, T.S.; Arslanian, S.A. The Changing Face of Diabetes in Youth: Lessons Learned from Studies of Type 2 Diabetes. Ann. N. Y. Acad. Sci. 2015, 1353, 113–137. [Google Scholar] [CrossRef] [Scilit] [PubMed]
- TODAY Study Group. Long-Term Complications in Youth-Onset Type 2 Diabetes. N. Engl. J. Med. 2021, 385, 416–426. [Google Scholar] [CrossRef] [Scilit] [PubMed]
- Pinhas-Hamiel, O.; Zeitler, P. Acute and Chronic Complications of Type 2 Diabetes Mellitus in Children and Adolescents. Lancet 2007, 369, 1823–1831. [Google Scholar] [CrossRef] [Scilit] [PubMed]
- ElSayed, N.A.; McCoy, R.G.; Aleppo, G.; Balapattabi, K.; Beverly, E.A.; Briggs Early, K.; Bruemmer, D.; Echouffo-Tcheugui, J.B.; Ekhlaspour, L.; Garg, R.; et al. 14. Children and Adolescents: Standards of Care in Diabetes—2025. Diabetes Care 2025, 48, S283–S305. [Google Scholar] [CrossRef] [Scilit] [PubMed]
- Shah, A.S.; Barrientos-Pérez, M.; Chang, N.; Fu, J.-F.; Hannon, T.S.; Kelsey, M.; Peña, A.S.; Pinhas-Hamiel, O.; Urakami, T.; Wicklow, B.; et al. ISPAD Clinical Practice Consensus Guidelines 2024: Type 2 Diabetes in Children and Adolescents. Horm. Res. Paediatr. 2024, 97, 555–583. [Google Scholar] [CrossRef] [Scilit] [PubMed]
- Chen, M.E.; Aguirre, R.S.; Hannon, T.S. Methods for Measuring Risk for Type 2 Diabetes in Youth: The Oral Glucose Tolerance Test (OGTT). Curr. Diab. Rep. 2018, 18, 51. [Google Scholar] [CrossRef] [Scilit] [PubMed]
- Garonzi, C.; Maguolo, A.; Maffeis, C. Pros and Cons of Current Diagnostic Tools for Risk-Based Screening of Prediabetes and Type 2 Diabetes in Children and Adolescents with Overweight or Obesity. Horm. Res. Paediatr. 2023, 96, 356–365. [Google Scholar] [CrossRef] [Scilit] [PubMed]
- Nowicka, P.; Santoro, N.; Liu, H.; Lartaud, D.; Shaw, M.M.; Goldberg, R.; Guandalini, C.; Savoye, M.; Rose, P.; Caprio, S. Utility of Hemoglobin A1c for Diagnosing Prediabetes and Diabetes in Obese Children and Adolescents. Diabetes Care 2011, 34, 1306–1311. [Google Scholar] [CrossRef] [Scilit] [PubMed]
- Abdul-Ghani, M.A.; Lyssenko, V.; Tuomi, T.; DeFronzo, R.A.; Groop, L. Fasting Versus Postload Plasma Glucose Concentration and the Risk for Future Type 2 Diabetes. Diabetes Care 2009, 32, 281–286. [Google Scholar] [CrossRef] [Scilit] [PubMed]
- Bergman, M.; Manco, M.; Sesti, G.; Dankner, R.; Pareek, M.; Jagannathan, R.; Chetrit, A.; Abdul-Ghani, M.; Buysschaert, M.; Olsen, M.H.; et al. Petition to Replace Current OGTT Criteria for Diagnosing Prediabetes with the 1-Hour Post-Load Plasma Glucose ≥ 155 Mg/Dl (8.6 Mmol/L). Diabetes Res. Clin. Pract. 2018, 146, 18–33. [Google Scholar] [CrossRef] [Scilit] [PubMed]
- Jagannathan, R.; Sevick, M.A.; Fink, D.; Dankner, R.; Chetrit, A.; Roth, J.; Buysschaert, M.; Bergman, M. The 1-Hour Post-Load Glucose Level Is More Effective than HbA1c for Screening Dysglycemia. Acta Diabetol. 2016, 53, 543–550. [Google Scholar] [CrossRef] [Scilit] [PubMed]
- Bergman, M. The 1-Hour Plasma Glucose: Common Link Across the Glycemic Spectrum. Front. Endocrinol. 2021, 12, 752329. [Google Scholar] [CrossRef] [Scilit] [PubMed]
- Tfayli, H.; Jung Lee, S.; Bacha, F.; Arslanian, S. One-Hour Plasma Glucose Concentration during the OGTT: What Does It Tell about β-Cell Function Relative to Insulin Sensitivity in Overweight/Obese Children? Pediatr. Diabetes 2011, 12, 572–579. [Google Scholar] [CrossRef] [Scilit] [PubMed]
- Kim, J.Y.; Goran, M.I.; Toledo-Corral, C.M.; Weigensberg, M.J.; Choi, M.; Shaibi, G.Q. One-Hour Glucose During an Oral Glucose Challenge Prospectively Predicts β-Cell Deterioration and Prediabetes in Obese Hispanic Youth. Diabetes Care 2013, 36, 1681–1686. [Google Scholar] [CrossRef] [Scilit] [PubMed]
- Serbis, A.; Giapros, V.; Challa, A.; Chaliasos, N.; Siomou, E. Elevated 1-hour Post-load Plasma Glucose Identifies Obese Youth with Abnormal Glucose Metabolism and an Unfavourable Inflammatory Profile. Clin. Endocrinol. 2018, 89, 757–764. [Google Scholar] [CrossRef] [Scilit] [PubMed]
- Di Bonito, P.; Valerio, G.; Licenziati, M.R.; Corica, D.; Wasniewska, M.; Di Sessa, A.; Miraglia Del Giudice, E.; Morandi, A.; Maffeis, C.; Mozzillo, E.; et al. One-Hour Post-Load Plasma Glucose and Altered Glucometabolic Profile in Youths with Overweight or Obesity. Int. J. Environ. Res. Public Health 2023, 20, 5961. [Google Scholar] [CrossRef] [Scilit] [PubMed]
- Manco, M.; Miraglia Del Giudice, E.; Spreghini, M.R.; Cappa, M.; Perrone, L.; Brufani, C.; Rustico, C.; Morino, G.; Caprio, S. 1-Hour Plasma Glucose in Obese Youth. Acta Diabetol. 2012, 49, 435–443. [Google Scholar] [CrossRef] [Scilit] [PubMed]
- Tricò, D.; Galderisi, A.; Mari, A.; Santoro, N.; Caprio, S. One-hour Post-load Plasma Glucose Predicts Progression to Prediabetes in a Multi-ethnic Cohort of Obese Youths. Diabetes Obes. Metab. 2019, 21, 1191–1198. [Google Scholar] [CrossRef] [Scilit] [PubMed]
- Olivieri, F.; Zusi, C.; Morandi, A.; Corradi, M.; Boselli, M.L.; Fornari, E.; Bonadonna, R.C.; Maffeis, C. “IGT-like” Status in Normoglucose Tolerant Obese Children and Adolescents: The Additive Role of Glucose Profile Morphology and 2-Hours Glucose Concentration during the Oral Glucose Tolerance Test. Int. J. Obes. 2019, 43, 1363–1369. [Google Scholar] [CrossRef] [Scilit] [PubMed]
- Galderisi, A.; Tricò, D.; Dalla Man, C.; Santoro, N.; Pierpont, B.; Groop, L.; Cobelli, C.; Caprio, S. Metabolic and Genetic Determinants of Glucose Shape After Oral Challenge in Obese Youths: A Longitudinal Study. J. Clin. Endocrinol. Metab. 2020, 105, 534–542. [Google Scholar] [CrossRef] [Scilit] [PubMed]
- Deligozoglu, D.; Cetin, S.K.; Gokdemir, I.; Cetin, M.; Omurbek, C.E.; Işik, E.; Buyukyilmaz, G.; Tepe, D.; Kocaay, P.; Boyraz, M.; et al. One-Hour Glucose–Defined Metabolic Phenotypes in Youth with Obesity: Early β-Cell Impairment across the Spectrum of Dysglycemia. Diabetes Res. Clin. Pract. 2026, 239, 113420. [Google Scholar] [CrossRef] [Scilit] [PubMed]
- Cacciari, E.; Milani, S.; Balsamo, A.; Spada, E.; Bona, G.; Cavallo, L.; Cerutti, F.; Gargantini, L.; Greggio, N.; Tonini, G.; et al. Italian Cross-Sectional Growth Charts for Height, Weight and BMI (2 to 20 Yr). J. Endocrinol. Investig. 2006, 29, 581–593. [Google Scholar] [CrossRef] [Scilit] [PubMed]
- Marshall, W.A.; Tanner, J.M. Variations in Pattern of Pubertal Changes in Girls. Arch. Dis. Child. 1969, 44, 291–303. [Google Scholar] [CrossRef] [Scilit]
- Marshall, W.A.; Tanner, J.M. Variations in the Pattern of Pubertal Changes in Boys. Arch. Dis. Child. 1970, 45, 13–23. [Google Scholar] [CrossRef] [Scilit] [PubMed]
- Mancia, G.; Kreutz, R.; Brunström, M.; Burnier, M.; Grassi, G.; Januszewicz, A.; Muiesan, M.L.; Tsioufis, K.; Agabiti-Rosei, E.; Algharably, E.A.E.; et al. 2023 ESH Guidelines for the Management of Arterial Hypertension The Task Force for the Management of Arterial Hypertension of the European Society of Hypertension: Endorsed by the International Society of Hypertension (ISH) and the European Renal Association (ERA). J. Hypertens. 2023, 41, 1874–2071. [Google Scholar] [CrossRef] [Scilit] [PubMed]
- Matthews, D.R.; Hosker, J.P.; Rudenski, A.S.; Naylor, B.A.; Treacher, D.F.; Turner, R.C. Homeostasis Model Assessment: Insulin Resistance and β-Cell Function from Fasting Plasma Glucose and Insulin Concentrations in Man. Diabetologia 1985, 28, 412–419. [Google Scholar] [CrossRef] [Scilit] [PubMed]
- Matsuda, M.; DeFronzo, R.A. Insulin Sensitivity Indices Obtained from Oral Glucose Tolerance Testing: Comparison with the Euglycemic Insulin Clamp. Diabetes Care 1999, 22, 1462–1470. [Google Scholar] [CrossRef] [Scilit] [PubMed]
- Seltzer, H.S.; Allen, E.W.; Herron, A.L.; Brennan, M.T. Insulin Secretion in Response to Glycemic Stimulus: Relation of Delayed Initial Release to Carbohydrate Intolerance in Mild Diabetes Mellitus. J. Clin. Investig. 1967, 46, 323–335. [Google Scholar] [CrossRef] [Scilit] [PubMed]
- Utzschneider, K.M.; Prigeon, R.L.; Faulenbach, M.V.; Tong, J.; Carr, D.B.; Boyko, E.J.; Leonetti, D.L.; McNeely, M.J.; Fujimoto, W.Y.; Kahn, S.E. Oral Disposition Index Predicts the Development of Future Diabetes Above and Beyond Fasting and 2-h Glucose Levels. Diabetes Care 2009, 32, 335–341. [Google Scholar] [CrossRef] [Scilit] [PubMed]
- Moran, A.; Jacobs, D.R.; Steinberger, J.; Hong, C.P.; Prineas, R.; Luepker, R.; Sinaiko, A.R. Insulin Resistance during Puberty: Results from Clamp Studies in 357 Children. Diabetes 1999, 48, 2039–2044. [Google Scholar] [CrossRef] [Scilit] [PubMed]
- Bergman, M.; Manco, M.; Satman, I.; Chan, J.; Schmidt, M.I.; Sesti, G.; Vanessa Fiorentino, T.; Abdul-Ghani, M.; Jagannathan, R.; Kumar Thyparambil Aravindakshan, P.; et al. International Diabetes Federation Position Statement on the 1-Hour Post-Load Plasma Glucose for the Diagnosis of Intermediate Hyperglycaemia and Type 2 Diabetes. Diabetes Res. Clin. Pract. 2024, 209, 111589. [Google Scholar] [CrossRef] [Scilit] [PubMed]
- Abdul-Ghani, M.A.; Williams, K.; DeFronzo, R.A.; Stern, M. What Is the Best Predictor of Future Type 2 Diabetes? Diabetes Care 2007, 30, 1544–1548. [Google Scholar] [CrossRef] [Scilit] [PubMed]
- Marcovecchio, M.L.; Bagordo, M.; Marisi, E.; De Giorgis, T.; Chiavaroli, V.; Chiarelli, F.; Mohn, A. One-Hour Post-Load Plasma Glucose Levels Associated with Decreased Insulin Sensitivity and Secretion and Early Makers of Cardiometabolic Risk. J. Endocrinol. Investig. 2017, 40, 771–778. [Google Scholar] [CrossRef] [Scilit] [PubMed]
- Kahn, S.E.; Prigeon, R.L.; McCulloch, D.K.; Boyko, E.J.; Bergman, R.N.; Schwartz, M.W.; Neifing, J.L.; Ward, W.K.; Beard, J.C.; Palmer, J.P. Quantification of the Relationship Between Insulin Sensitivity and β-Cell Function in Human Subjects: Evidence for a Hyperbolic Function. Diabetes 1993, 42, 1663–1672. [Google Scholar] [CrossRef] [Scilit] [PubMed]
- Bergman, R.N.; Ader, M.; Huecking, K.; Van Citters, G. Accurate Assessment of β-Cell Function. Diabetes 2002, 51, S212–S220. [Google Scholar] [CrossRef] [Scilit] [PubMed]
- Franks, P.W.; McCarthy, M.I. Exposing the Exposures Responsible for Type 2 Diabetes and Obesity. Science 2016, 354, 69–73. [Google Scholar] [CrossRef] [Scilit] [PubMed]
- Smith, K.R.; Meeks, H.; Curtis, D.; Brown, B.B.; Kole, K.; Kowaleski-Jones, L. Family History of Type 2 Diabetes and the Risk of Type 2 Diabetes among Young and Middle-Aged Adults. Chronic Dis. Transl. Med. 2025, 11, 46–56. [Google Scholar] [CrossRef] [Scilit] [PubMed]
- Ali, O. Genetics of Type 2 Diabetes. WJD 2013, 4, 114. [Google Scholar] [CrossRef] [Scilit] [PubMed]
- Nightingale, C.M.; Rudnicka, A.R.; Owen, C.G.; Wells, J.C.K.; Sattar, N.; Cook, D.G.; Whincup, P.H. Influence of Adiposity on Insulin Resistance and Glycemia Markers among U.K. Children of South Asian, Black African-Caribbean, and White European Origin: Child Heart and Health Study in England. Diabetes Care 2013, 36, 1712–1719. [Google Scholar] [CrossRef] [Scilit] [PubMed]
- Alderete, T.L.; Toledo-Corral, C.M.; Goran, M.I. Metabolic Basis of Ethnic Differences in Diabetes Risk in Overweight and Obese Youth. Curr. Diab Rep. 2014, 14, 455. [Google Scholar] [CrossRef] [Scilit] [PubMed]
- Hill-Briggs, F.; Adler, N.E.; Berkowitz, S.A.; Chin, M.H.; Gary-Webb, T.L.; Navas-Acien, A.; Thornton, P.L.; Haire-Joshu, D. Social Determinants of Health and Diabetes: A Scientific Review. Diabetes Care 2020, 44, 258–279. [Google Scholar] [CrossRef] [Scilit] [PubMed]
- Després, J.-P. Body Fat Distribution and Risk of Cardiovascular Disease: An Update. Circulation 2012, 126, 1301–1313. [Google Scholar] [CrossRef] [Scilit] [PubMed]
- Kahn, S.E.; Hull, R.L.; Utzschneider, K.M. Mechanisms Linking Obesity to Insulin Resistance and Type 2 Diabetes. Nature 2006, 444, 840–846. [Google Scholar] [CrossRef] [Scilit] [PubMed]
- Reinehr, T. Clinical Presentation of Type 2 Diabetes Mellitus in Children and Adolescents. Int. J. Obes. 2005, 29, S105–S110. [Google Scholar] [CrossRef] [Scilit] [PubMed]
- Weiss, R.; Dziura, J.; Burgert, T.S.; Tamborlane, W.V.; Taksali, S.E.; Yeckel, C.W.; Allen, K.; Lopes, M.; Savoye, M.; Morrison, J.; et al. Obesity and the Metabolic Syndrome in Children and Adolescents. N. Engl. J. Med. 2004, 350, 2362–2374. [Google Scholar] [CrossRef] [Scilit] [PubMed]
- Freedman, D.S.; Kahn, H.S.; Mei, Z.; Grummer-Strawn, L.M.; Dietz, W.H.; Srinivasan, S.R.; Berenson, G.S. Relation of Body Mass Index and Waist-to-Height Ratio to Cardiovascular Disease Risk Factors in Children and Adolescents: The Bogalusa Heart Study. Am. J. Clin. Nutr. 2007, 86, 33–40. [Google Scholar] [CrossRef] [Scilit] [PubMed]
- Fox, C.S.; Massaro, J.M.; Hoffmann, U.; Pou, K.M.; Maurovich-Horvat, P.; Liu, C.-Y.; Vasan, R.S.; Murabito, J.M.; Meigs, J.B.; Cupples, L.A.; et al. Abdominal Visceral and Subcutaneous Adipose Tissue Compartments: Association With Metabolic Risk Factors in the Framingham Heart Study. Circulation 2007, 116, 39–48. [Google Scholar] [CrossRef] [Scilit] [PubMed]
- Burke, J.P.; Hale, D.E.; Hazuda, H.P.; Stern, M.P. A Quantitative Scale of Acanthosis Nigricans. Diabetes Care 1999, 22, 1655–1659. [Google Scholar] [CrossRef] [Scilit] [PubMed]
- Phiske, M.M. An Approach to Acanthosis Nigricans. Indian Dermatol. Online J. 2014, 5, 239–249. [Google Scholar] [CrossRef] [Scilit] [PubMed]
- Brickman, W.J.; Binns, H.J.; Jovanovic, B.D.; Kolesky, S.; Mancini, A.J.; Metzger, B.E. Pediatric Practice Research Group Acanthosis Nigricans: A Common Finding in Overweight Youth. Pediatr. Dermatol. 2007, 24, 601–606. [Google Scholar] [CrossRef] [Scilit] [PubMed]
- Di Bonito, P.; Licenziati, M.R.; Baroni, M.G.; Congiu, T.; Incani, M.; Iannuzzi, A.; Maffeis, C.; Perrone, L.; Valerio, G.; Del Giudice, E.M. High Normal Post-load Plasma Glucose, Cardiometabolic Risk Factors and Signs of Organ Damage in Obese Children. Obesity 2014, 22, 1860–1864. [Google Scholar] [CrossRef] [Scilit] [PubMed]
- Di Bonito, P.; Pacifico, L.; Chiesa, C.; Valerio, G.; Miraglia Del Giudice, E.; Maffeis, C.; Morandi, A.; Invitti, C.; Licenziati, M.R.; Loche, S.; et al. Impaired Fasting Glucose and Impaired Glucose Tolerance in Children and Adolescents with Overweight/Obesity. J. Endocrinol. Investig. 2017, 40, 409–416. [Google Scholar] [CrossRef] [Scilit] [PubMed]
- Taskinen, M.-R. Diabetic Dyslipidaemia: From Basic Research to Clinical Practice. Diabetologia 2003, 46, 733–749. [Google Scholar] [CrossRef] [Scilit] [PubMed]
- Pacifico, L.; Nobili, V.; Anania, C.; Verdecchia, P.; Chiesa, C. Pediatric Nonalcoholic Fatty Liver Disease, Metabolic Syndrome and Cardiovascular Risk. World J. Gastroenterol. 2011, 17, 3082–3091. [Google Scholar] [CrossRef] [Scilit] [PubMed]
- D’Adamo, E.; Cali, A.M.G.; Weiss, R.; Santoro, N.; Pierpont, B.; Northrup, V.; Caprio, S. Central Role of Fatty Liver in the Pathogenesis of Insulin Resistance in Obese Adolescents. Diabetes Care 2010, 33, 1817–1822. [Google Scholar] [CrossRef] [Scilit] [PubMed]

Disclaimer/Publisher’s Note: The statements, opinions and data contained in all publications are solely those of the individual author(s) and contributor(s) and not of MDPI and/or the editor(s). MDPI and/or the editor(s) disclaim responsibility for any injury to people or property resulting from any ideas, methods, instructions or products referred to in the content. |
© 2026 by the authors. Licensee MDPI, Basel, Switzerland. This article is an open access article distributed under the terms and conditions of the Creative Commons Attribution (CC BY) license.