


Abstract
Background/Objectives: Access to personalized nutrition counseling for cancer survivors is limited and often mirrors socioeconomic status. We hypothesized that the CANEAT application (app), a novel large language model (LLM)-based tool developed by our team, would provide usable, culturally relevant, and affordable dietary recommendations to support female breast cancer survivors treated with radiation therapy (RT) in managing long-term nutritional needs. Methods: In this single-institution pilot mixed-methods study at Thomas Jefferson University (Philadelphia, PA, USA), female breast cancer survivors with prior RT were enrolled from August 2025 to May 2026 to participate in focus groups to test the CANEAT AI app. Demographic information was collected and inputted into the LLM, which then generated personalized meal plans and grocery lists delivered through the app interface. The participants reviewed the plans and completed the validated System Usability Scale (SUS). Then a group discussion with structured questions was conducted, recorded, and transcribed. The primary endpoint was a SUS usability score > 70. Thematic analysis was applied to focus group transcripts using NVivo for qualitative themes. Results: Three focus groups were conducted consisting of 10 participants (50% were 65 years or older; 100% were female; 60% were racial/ethnic minorities; 100% with prior RT). The mean SUS score was 84.25 (SD 13.44; range 60.0–100.0), with 80% rating the app as acceptable (>70). Analysis of qualitative themes highlighted high cultural relevance, the ability to have grocery lists within budget constraints, and geographic feasibility. The main limitation participants identified was that the app did not address RT side effects. Agreement between the two qualitative coders was fair (κ = 0.34–0.35). Conclusions: In this small pilot study of female breast cancer survivors at a single institution in Philadelphia, CANEAT demonstrated high usability among a technologically experienced cohort. These preliminary, hypothesis-generating findings do not establish clinical benefit, safety, or an effect on nutritional disparities, and warrant validation in larger, multi-center domestic and international cohorts that include other cancer types, male patients, and participants with lower digital literacy, with a comparator arm, and long-term follow-up.
1. Introduction
Nutritional support plays a vital role in cancer management, with evidence linking dietary habits and weight control to cancer treatment outcomes [1]. However, access to professional nutritional counseling remains limited, particularly among low-income, minority, and underserved populations [2]. This gap is exacerbated by structural barriers including limited insurance coverage and a shortage of dietitians trained within oncology [3]. Furthermore, there are also socioeconomically correlated challenges when it comes to applying dietary advice into one’s life. Many cancer patients therefore struggle to receive or implement dietary guidance, contributing to disparities in cancer outcomes.
Recent advances in artificial intelligence (AI), particularly Large Language Models (LLMs), have introduced new opportunities for scalable dietary interventions [4]. Logan et al. demonstrated that LLMs can generate personalized grocery lists and meal plans tailored to an individual’s cultural preferences, socioeconomic constraints, and geographic accessibility. This generated nutritional guidance also aligns with existing Acceptable Macronutrient Distribution Ranges (AMDR). Their study also found that the LLM recommendations mirrored the advice of board-certified oncology dietitians, supporting the clinical validity of AI-driven nutritional guidance [5]. In settings where access to specialized care is limited, investigating the use of AI to help bridge the current gap is a promising approach for patients facing barriers to care.
The CANEAT application (app) was developed utilizing the prompt and data from Logan et al. to address this need. It offers a patient-friendly interface that delivers real-time, LLM-generated dietary recommendations for cancer patients. This pilot study aims to assess the usability and acceptability of the CANEAT app as an early step toward advancing equitable access to dietary management tools in oncology care.
Preliminary analyses of LLM-generated meal plans suggest that while they are generally nutritionally sound, there are limitations in adjusting for complex medical factors such as cancer stage and comorbidities. However, the LLMs excel in adjusting for socioeconomic needs and preferences, making them highly relevant for broader patient populations [5,6].
We hypothesize that female breast cancer patients will find the CANEAT app to be helpful in providing dietary suggestions, which will be reflected by high usability scores. This study will determine the app’s functionality, satisfaction of the user, and alignment with patients’ socioeconomic status. Data will be collected via a REDCap-based usability survey and structured focus group discussions to characterize the app’s usability in an initial pilot cohort.
2. Materials and Methods
2.1. Study Design and Population
An IRB-approved, single-institution, prospective mixed-methods pilot study was designed to evaluate the usability of the CANEAT app. The study was conducted at the Department of Radiation Oncology, Sidney Kimmel Comprehensive Cancer Center at Thomas Jefferson University, in Philadelphia, Pennsylvania, USA. From August 2025 to May 2026, we enrolled a diverse cohort of female breast cancer survivors who had previously undergone radiation therapy. Exclusion criteria included patients who were actively being treated or had a recurrence of breast cancer. For recruitment, patients were called, and an overview of the focus groups was explained. Patients who participated were offered a $50 gift card as compensation for their time. Because this was a pilot study, no formal sample size calculation was performed, and the sample is too small for inferential statistics.
2.2. The CANEAT App Intervention
The novel CANEAT app was developed collaboratively by radiation oncologists, dietitians, and physicists. A prompt was designed for input into the Gemini LLM (Google AI, Version 3). In the app, participants are able to input specific demographic, geographic, and cultural information (Supplementary Materials File S1). The LLM then processes these variables to generate personalized meal plans and grocery lists tailored specifically to the user’s cultural preferences, budget constraints, and local food access. The prompt was adapted from our earlier work, in which LLM-generated meal plans were compared with recommendations from oncology dietitians [5]. The meal plans generated during this study were not reviewed by a dietitian.
2.3. Focus Group and Data Collection Procedures
Each participant attended one focus group session. At the start of the session, each participant took a pre-app survey in REDCap and then used the CANEAT app with one-on-one guidance from a member of the study staff to generate their own meal plan and grocery list. Participants then completed the SUS survey individually in REDCap before the group discussion began.
The group discussion followed a series of structured focus group questions. The structured questions were designed to obtain qualitative feedback regarding the app’s relevance, potential limitations, and the user’s ultimate intent to use the tool in their daily lives.
Focus group discussions were facilitated by 3–5 moderators, trained research coordinators, using a semi-structured interview guide (Supplementary Materials File S2). The first and second focus groups were held in person, and the third was held virtually, and each session lasted approximately 60 min. Session format therefore did not line up with app version: the first group (in person) used Implementation A, and the second (in person) and third (virtual) groups used Implementation B. Discussions were audio-recorded and transcribed verbatim. Because this was a pilot with a fixed number of sessions, we did not formally assess thematic saturation.
2.4. Platform Implementations
Two implementations of the platform were developed: a chatbot-style research prototype and a production-oriented web app. The first implementation was written in Python using the Streamlit framework and was designed primarily as a research and rapid-iteration engine. The second implementation was written in TypeScript using the Next.js framework and was designed as an end-user-facing app. Implementation A was the initial prototype, and the app was subsequently migrated to Implementation B, the final version. The two platforms therefore reflect sequential development stages rather than separate study conditions. The patient-specific prompt-generation logic remained unchanged between them, while Implementation B added more explicit output-formatting instructions (Supplementary Materials File S1). Participants in the first focus group (n = 5) used Implementation A, and participants in the second and third focus groups (n = 5) used Implementation B. Meal plans for the first focus group were generated with Gemini 2.0 Flash, and those for the second and third focus groups with Gemini 2.5 Pro. Because the app version and the model changed together, SUS scores are reported both pooled and by implementation (Section 3.3).
Both implementations share a common scientific core. In each case, a structured prompt is programmatically assembled from patient-specific clinical inputs and contextual modifiers, transmitted to the Gemini LLM, and rendered as a one-day dietary plan with an associated grocery list. The two implementations differ principally in the technology stack used to assemble the prompt, the user interface through which information is collected and displayed, and the operational characteristics of deployment (Table 1).
Table 1.
Implementation Framework.
2.4.1. Implementation A: Streamlit Research Prototype
Implementation A is built on Streamlit, an open-source Python framework that converts standard Python scripts into interactive web apps. This implementation includes a model selector that allows investigators to toggle between Gemini 2.0 Flash, optimized for inference speed, and Gemini 2.5 Pro, optimized for more nuanced reasoning.
The prompt is assembled programmatically from user-provided information, including cancer stage, comorbidities, allergies, demographic variables, and cultural or culinary preferences. Because the app logic is largely centralized within a single Python file (app.py), changes such as adding a new cancer stage, registering an additional allergen, or modifying a clinical inclusion criterion can be implemented and tested within a single working session.
Streamlit’s execution model re-runs the entire script upon each user interaction. While this behavior is inefficient for large-scale deployment, it is well suited to methodological development: changes to clinical logic are immediately reflected in the app’s behavior, allowing rapid iteration and validation during research and prototyping.
2.4.2. Implementation B: Next.js User Application
Implementation B is built on Next.js, a widely adopted framework that combines the React user interface library with server-side rendering, in which web pages are assembled on the server before being delivered to the user. This architecture was selected to provide higher usability, performance, and robustness than is required for a research prototype.
The app presents a multi-step “wizard” interface that collects clinical information first, demographic information second, and culinary or cultural preferences last. This staged design reduces cognitive load by limiting the amount of information the user must consider at any one time. In internal testing, the wizard structure also improved the completeness and accuracy of submitted data.
Rather than treating the LLM response as a single block of unstructured text, Implementation B requests model output in a structured JSON (JavaScript Object Notation) format. The app then renders each meal as a discrete “meal card,” with separate regions for ingredients, preparation time, and the nutritional rationale generated by the model. This structured rendering improves interpretability, supports downstream validation, and enables tighter control over the user experience.
2.5. Statistical and Qualitative Analysis
The primary quantitative endpoint was a SUS usability score greater than 70, which indicates overall acceptability of the system. Data were analyzed using descriptive statistics to summarize patient demographics, SUS scores, and post-app survey responses. SUS scores were calculated using the standard scoring method [7] and classified using adjective ratings adapted from Bangor et al. [8]. Given the small sample, no inferential statistical testing was performed. The SUS scores were explored descriptively across demographic subgroups (age, education, and income) and survey responses, and these comparisons are considered hypothesis-generating only.
For the qualitative component, thematic analysis was applied to the focus group transcripts. NVivo software was utilized to extract and synthesize qualitative themes regarding user experience. To ensure inter-rater reliability, two independent coders reviewed and coded all focus group transcripts. Intercoder agreement was assessed using Cohen’s kappa, yielding an unweighted kappa of 0.34 and a weighted kappa of 0.35, which corresponds to fair agreement according to Landis and Koch [9] and minimal-to-weak agreement under more conservative criteria [10]. Intercoder agreement was assessed on the two coders’ independent coding of all transcripts, using NVivo’s coding comparison query. The kappa was calculated code by code, with coded text segments as the unit of analysis. Coding disagreements were not formally reconciled through a consensus or adjudication procedure. After coding, the two coders reviewed their codes independently and grouped them into the themes reported in Section 3.6. They did this without first reconciling the codes on which they disagreed. Because agreement was only fair and disagreements were not adjudicated, the qualitative findings are presented as exploratory.
3. Results
3.1. Participant Demographics
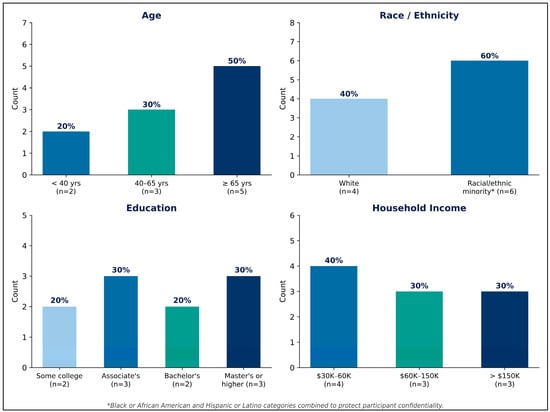
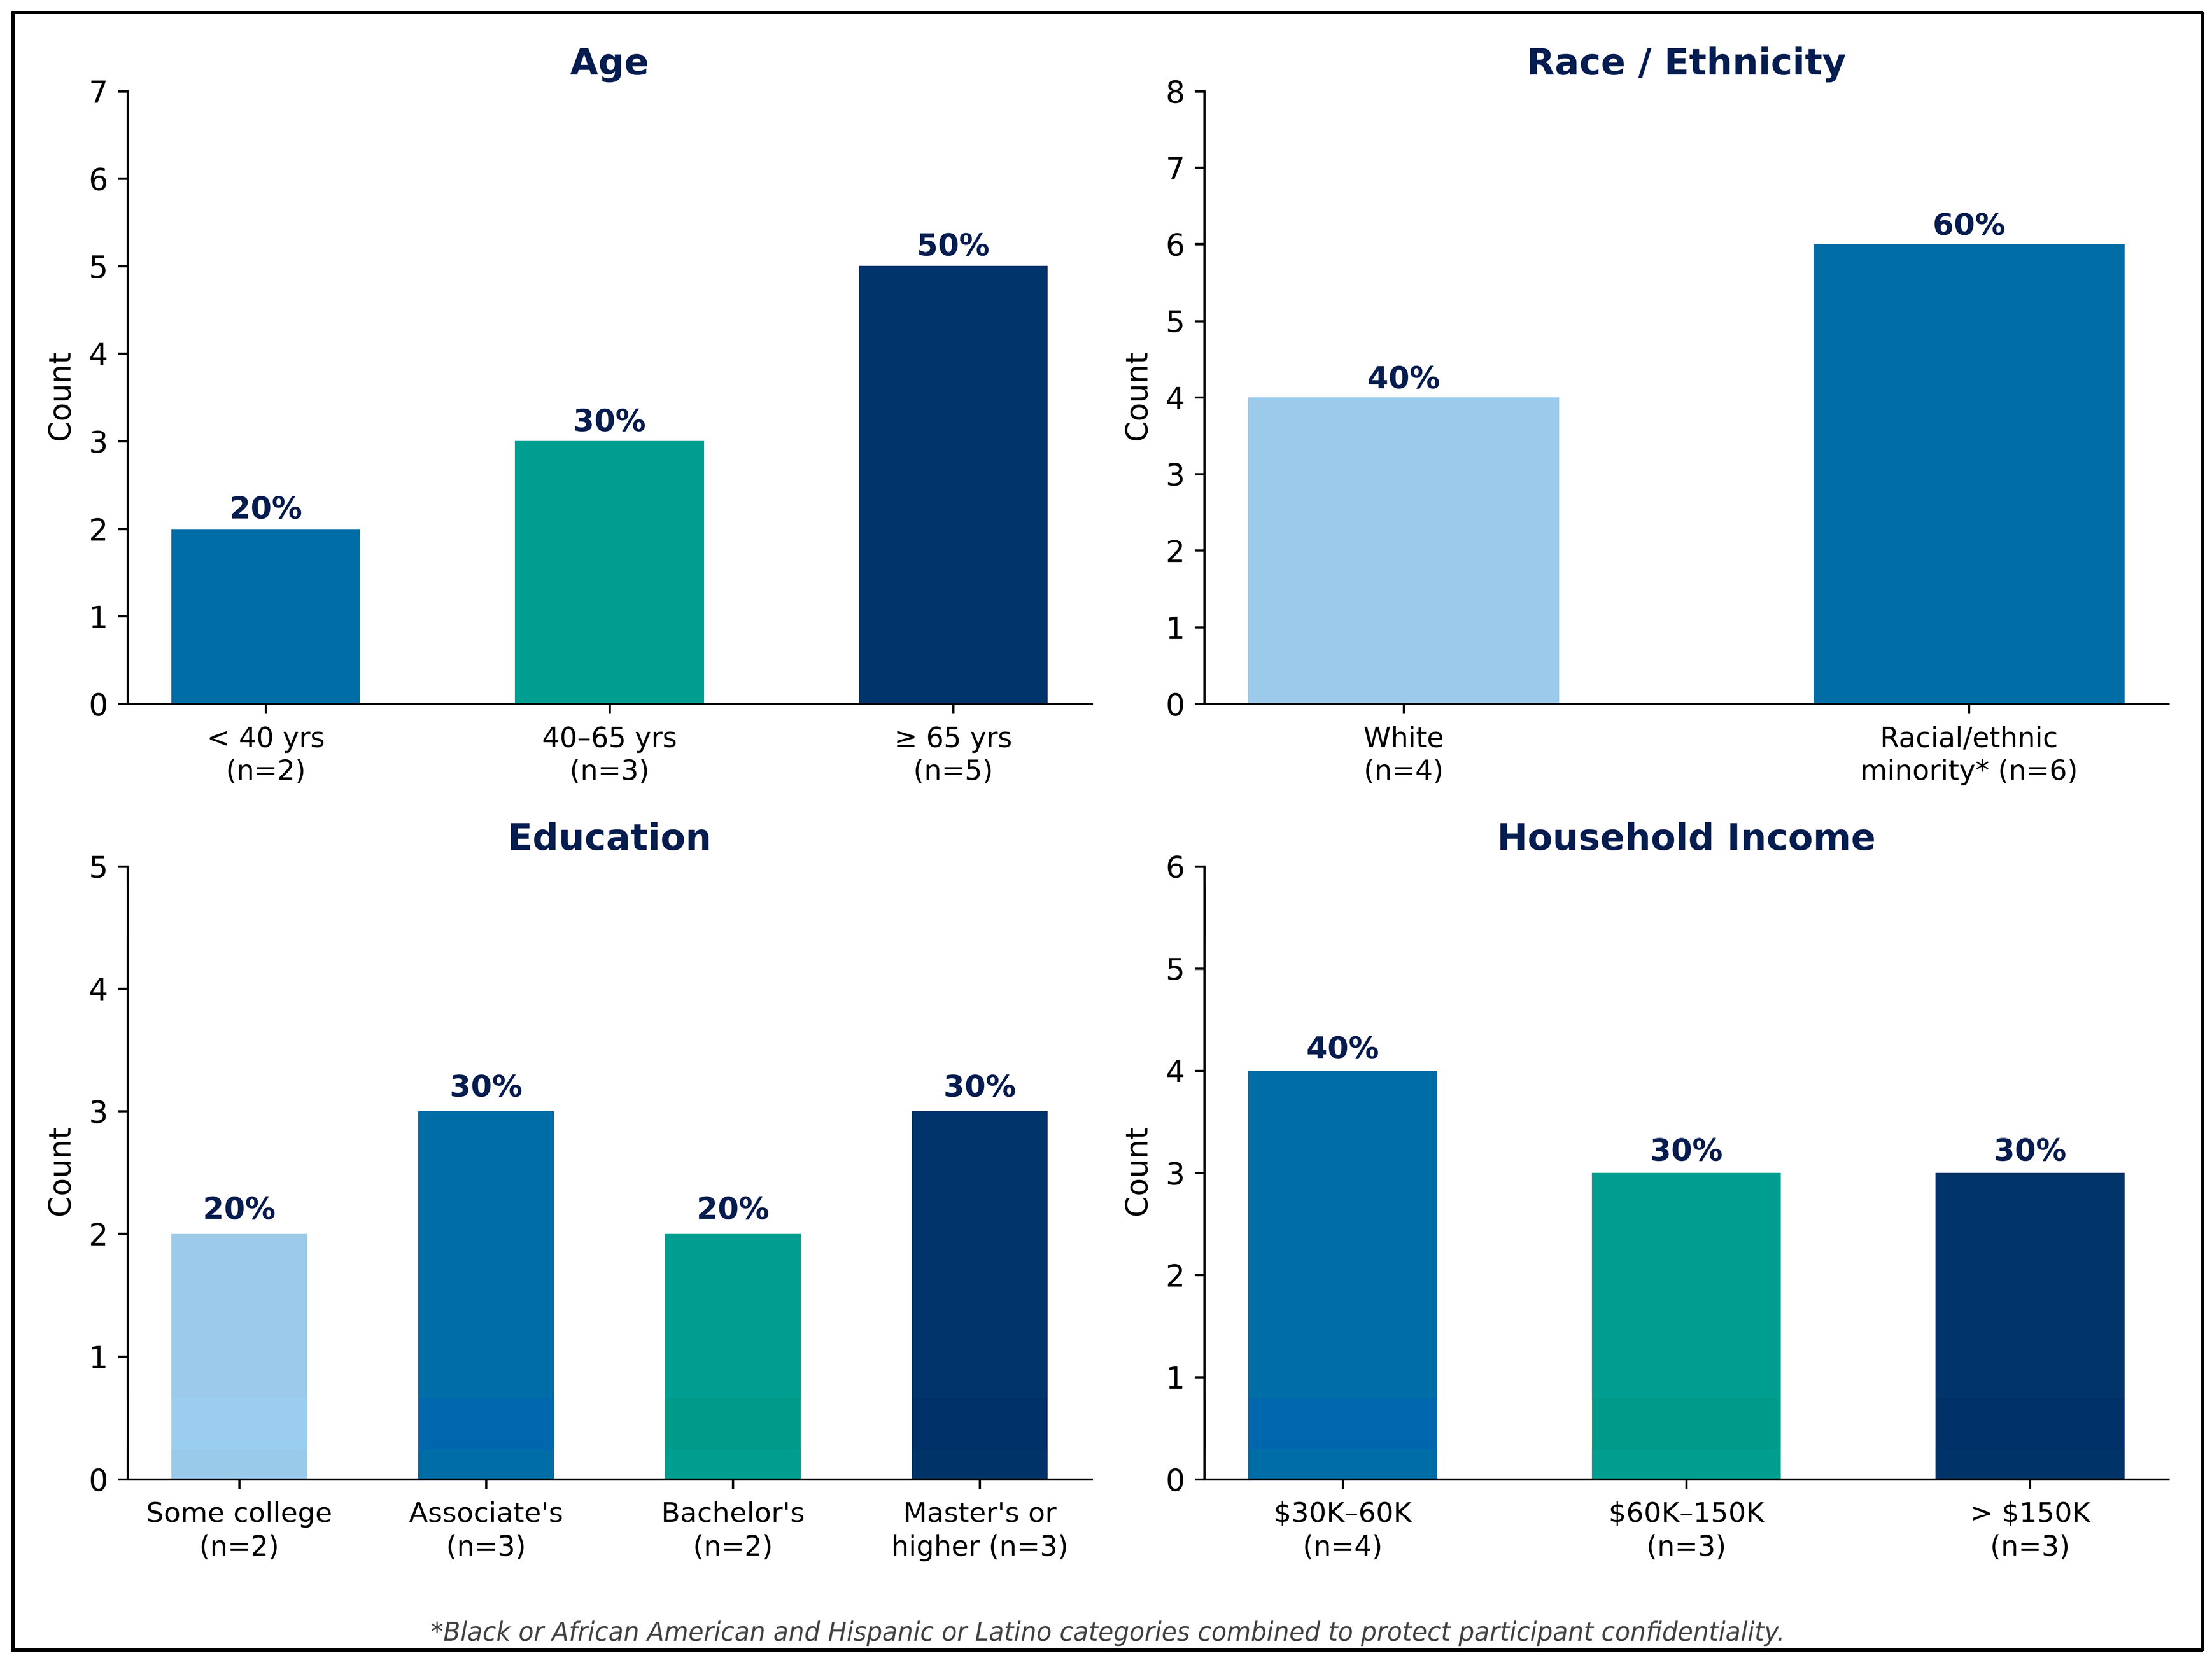
A total of three focus groups were conducted involving a total of ten breast cancer survivors. The first group consisted of five participants, the second consisted of three participants, and the final group consisted of two participants. Each participant completed both the pre-app demographic survey and the post-app System Usability Scale assessment. All participants were female (100%), and all had a prior history of radiation therapy. The cohort skewed toward increased age, with 50% of participants aged 65 years or older, 30% between 40 and 65 years, and 20% younger than 40 years. Sixty percent identified as a racial or ethnic minority and 40% as White. To protect participant confidentiality given the small sample size, minority categories are reported in combination.
Educational attainment was varied: 20% reported some college without a degree, 30% held an Associate’s degree, 20% a Bachelor’s degree, and 30% a Master’s degree or higher. Regarding household income, 40% reported earning between $30,000 and $60,000 annually, 30% between $60,000 and $150,000, and 30% more than $150,000 per year. All participants were diagnosed with localized breast cancer and were not undergoing active oncologic treatment at the time of study enrollment. Sixty percent reported at least one comorbid condition affecting dietary choices (e.g., hypertension, pre-diabetes, neurological disorders). In separate survey questions, 50% of participants reported receiving dietary recommendations from a physician and 60% from an oncology physician. Complete demographics are presented in Table 2 and Figure 1.
Table 2.
Participant Demographic and Clinical Characteristics (n = 10).
Figure 1.
Participant demographics by age group, race/ethnicity, highest education level, and household income (n = 10).
3.2. Technology Literacy and Prior App Engagement
Baseline technology access was high across the cohort. Nine of 10 participants (90%) owned a smartphone, and 80% reported knowing how to find and download mobile apps. App usage frequency varied: 5 participants used apps daily, 2 frequently, and 3 never. When asked which type of health-related app they had used, 5 selected exercise tracking, 4 weight management, and 1 on grocery list management. This item did not include a “none” option, so it cannot show that every participant had used a health app. One participant who selected a category did not own a smartphone and reported never using apps. All participants (100%) indicated they would use an easy-to-create grocery list tool, and all (100%) would use a budget-aligned grocery list if one were available, demonstrating strong a priori motivation to engage with a tool like CANEAT. Because 90% owned a smartphone and 70% used apps daily or frequently, this cohort likely had higher baseline digital engagement than is typical of the broader survivor population, which is considered in the discussion.
3.3. App Usability: System Usability Scale (SUS)
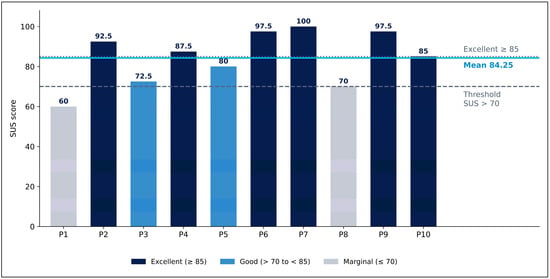
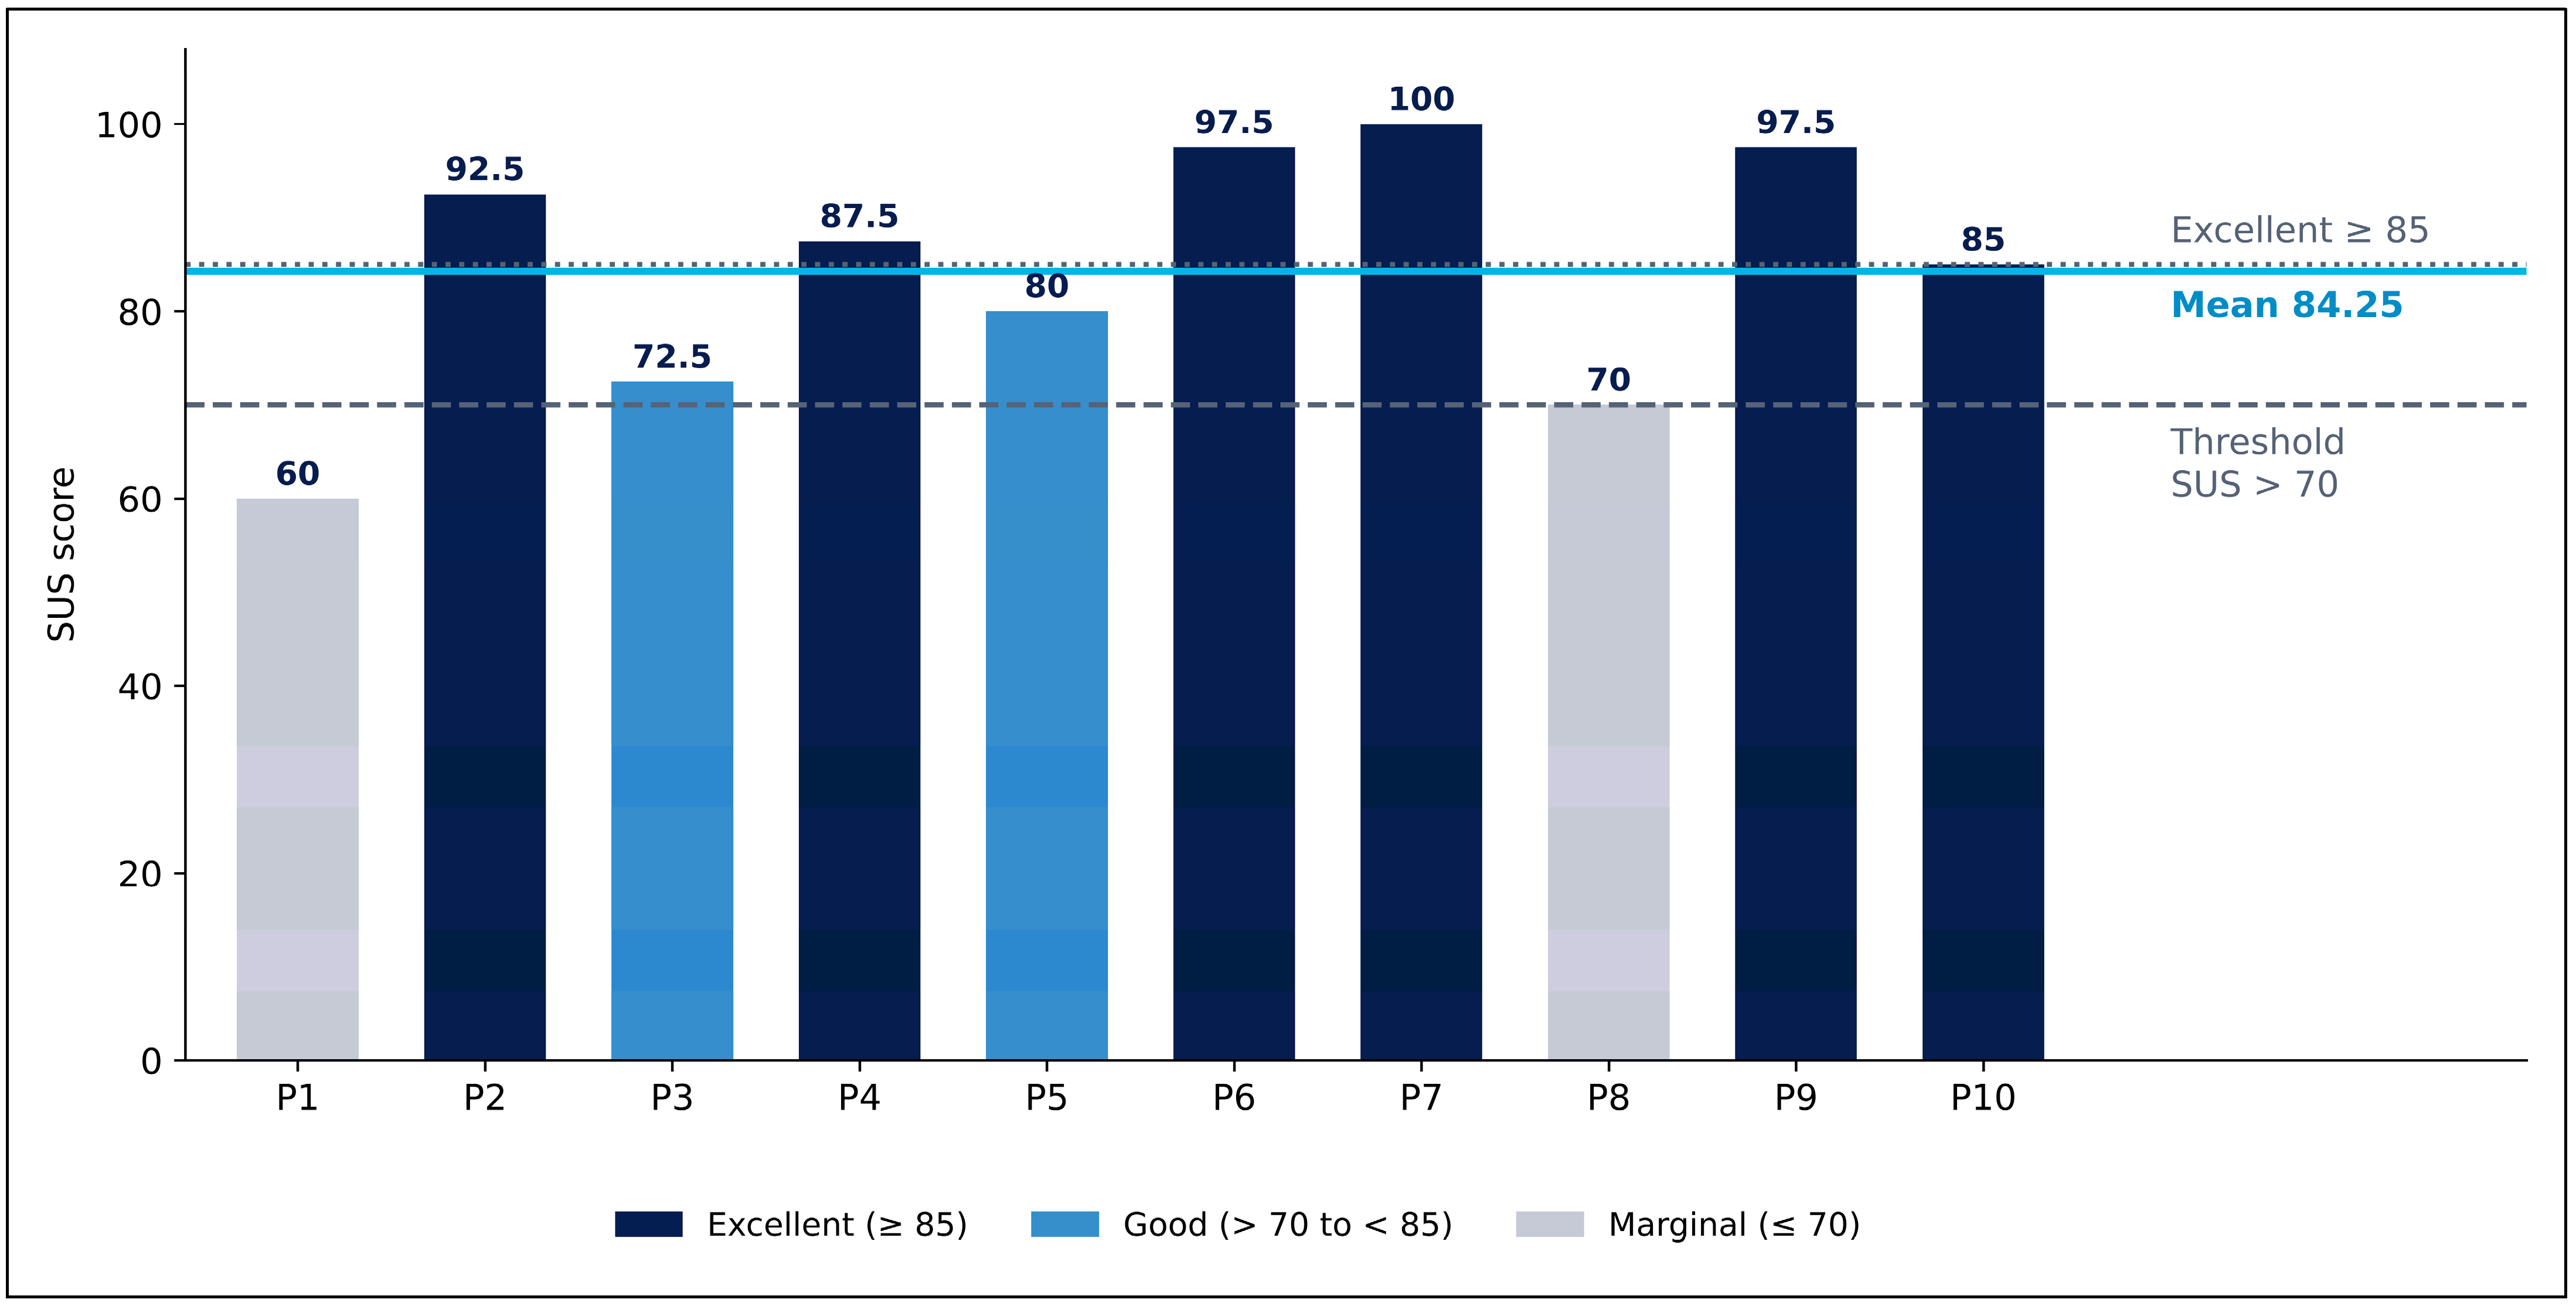
All 10 participants completed the validated System Usability Scale (SUS) following guided interaction with the CANEAT app. The mean SUS score was 84.25 (SD 13.44; range 60.0–100.0), exceeding the pre-specified primary endpoint of a mean SUS score greater than 70. Eight of 10 participants (80%) scored above the acceptability threshold of 70. Six participants (60%) scored in the “Excellent” range (≥85), and two (20%) in the “Good” range (>70 to <85). Two participants scored at or below the threshold: one received a score of 70.0 (marginal/borderline), and one received a score of 60.0 (marginal). Using the SUS adjective-based rating framework established by Bangor et al. [8], the overall sample performance is classified as “Good”, approaching “Excellent.” Individual SUS scores are detailed in Table 3 and Figure 2. The two participants who scored at or below the threshold (P1, 60.0; P8, 70.0) were both aged ≥ 65 years. They were also the only two participants who preferred to use the app together with a dietitian rather than on their own. One did not own a smartphone and reported never using apps. The other used apps daily but had several comorbidities affecting diet, found at least one food in her plan that she could not eat, and did not feel she could follow the plan during active treatment. In exploratory descriptive comparisons, mean SUS scores were 75.0 among participants aged ≥ 65 years versus 93.5 among those < 65 years, 84.0 versus 84.5 among those without versus with a bachelor’s degree or higher, and 76.9 versus 89.2 among those with household incomes < $60,000 versus ≥$60,000. The SUS scores for participants who never reported using apps versus the seven who used them daily or frequently were 74.2 versus 88.6. Given subgroup sizes of 2–5 participants, no statistical testing was performed, and these observations are hypothesis-generating only. By implementation, mean SUS was 78.5 (SD 12.8) among the five participants who used Implementation A and 90.0 (SD 12.6) among the five who used Implementation B. Both groups were above the threshold of 70. The difference may reflect the redesigned interface or the change in model (Section 2.4), but with five different participants in each group, it may also reflect who happened to be in each group.
Table 3.
System Usability Scale (SUS) Scores by Participant (n = 10).
Figure 2.
System Usability Scale (SUS) scores by participant (n = 10). The dashed grey line marks the acceptability threshold (70), the dotted line marks the cutoff for “Excellent” (85), and the solid light blue line shows the group means (84.25 ± 13.44). Bar colors follow the categories in Table 3: navy, Excellent (≥85); mid-blue, Good (>70 to <85); grey, Marginal (≤70).
3.4. Post-App User Perceptions and Feasibility
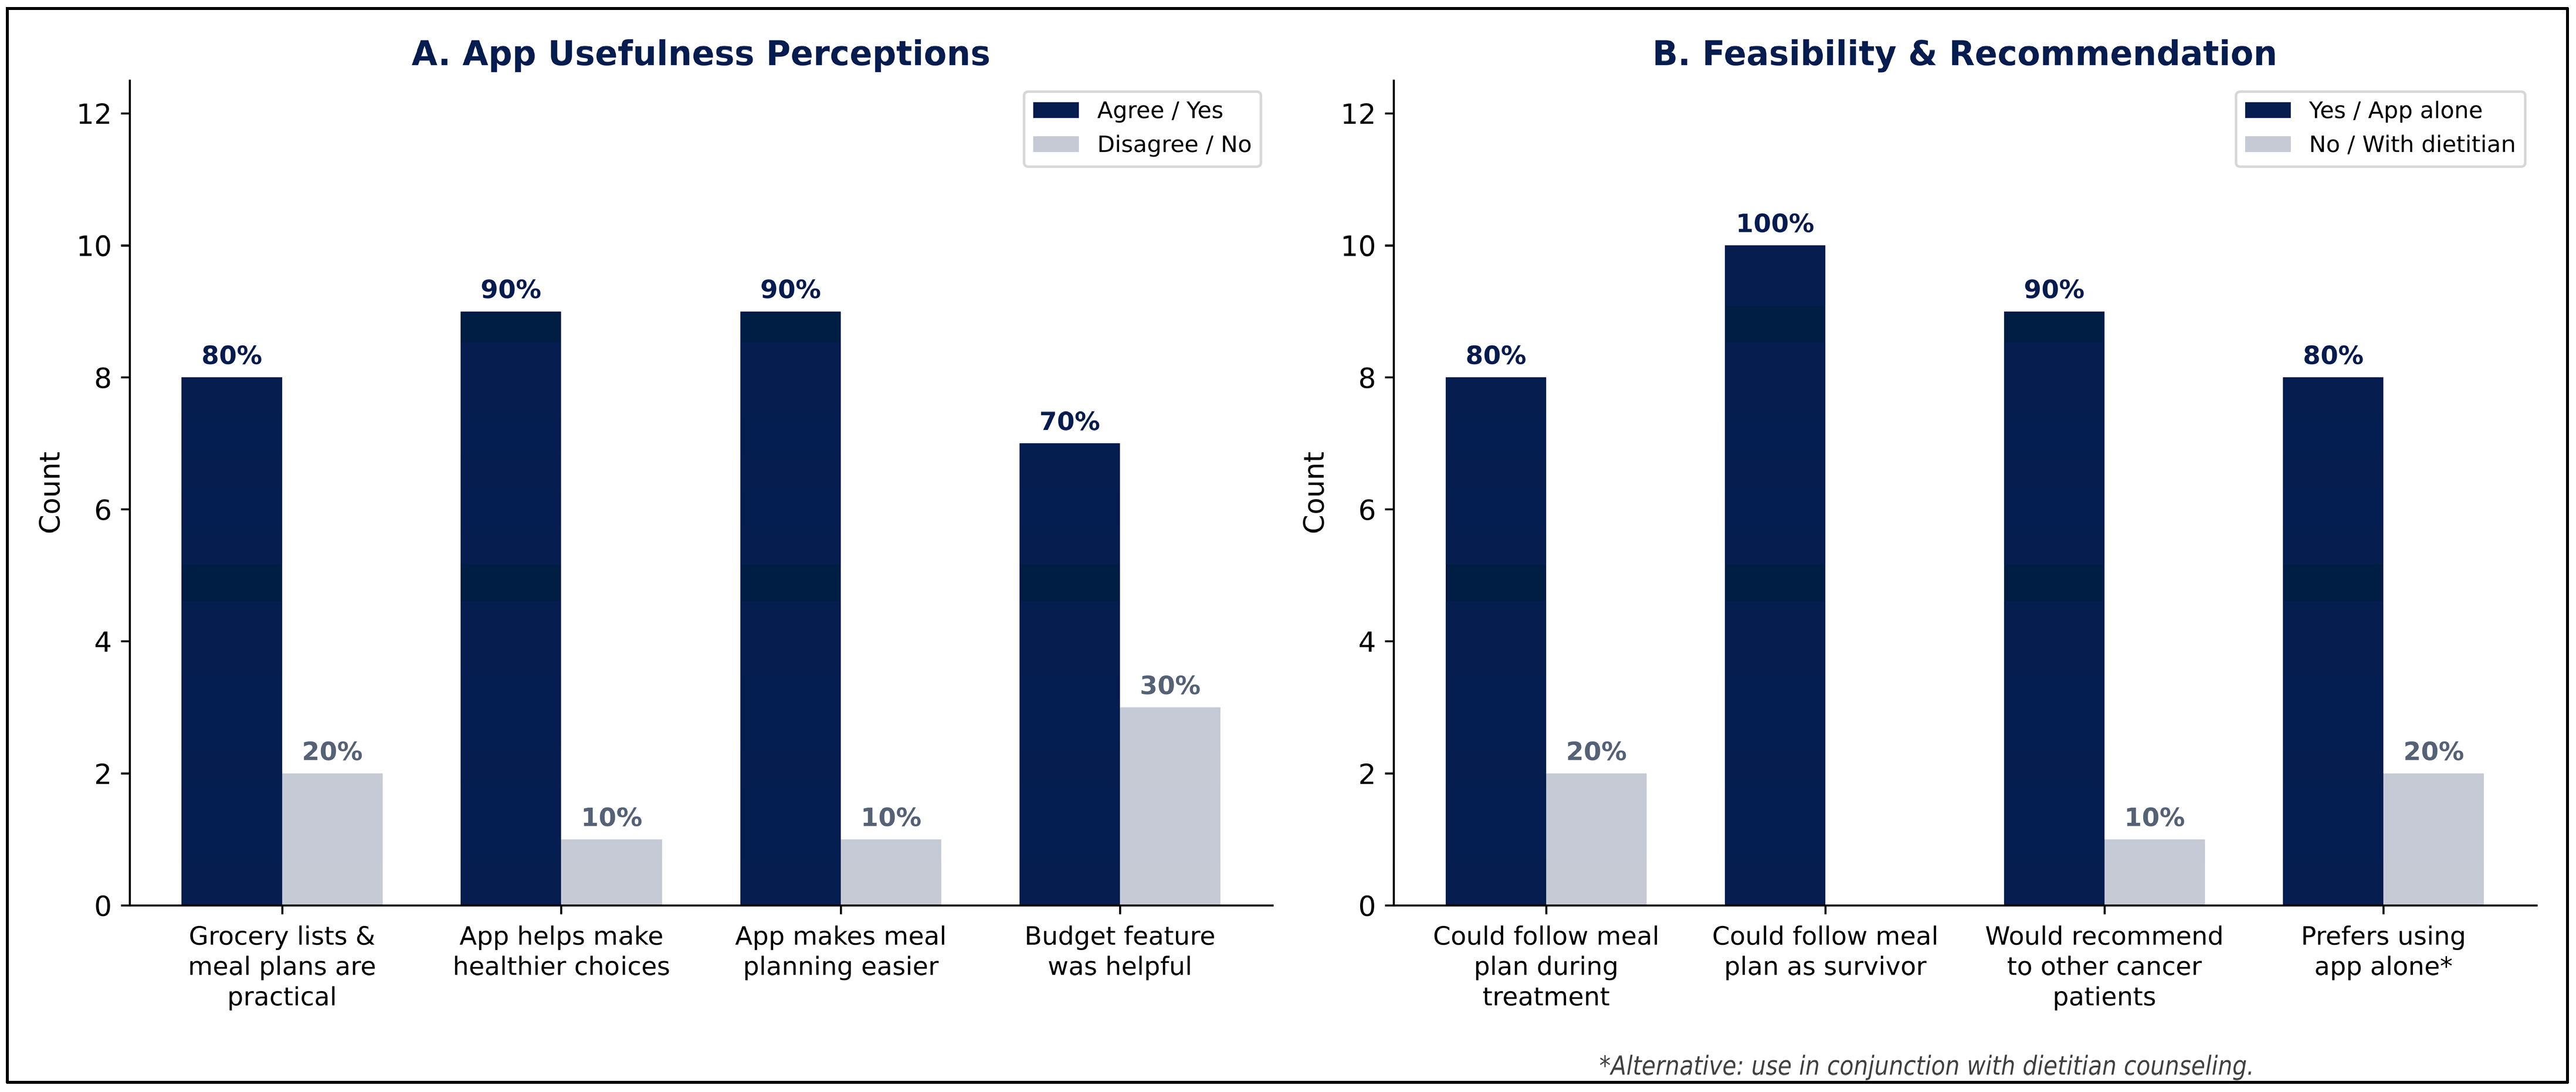
Following interaction with the CANEAT app, participants responded to structured survey items assessing practical utility, feasibility, and intent to use. Eight of 10 participants (80%) agreed that the grocery lists and meal plans were practical and realistic for daily life. Nine of 10 (90%) agreed that the app could help them make healthier food choices and that it would make meal planning easier. Seven of 10 (70%) found the budget-entry feature helpful.
Regarding real-world feasibility, 8 out of 10 (80%) believed they could follow the generated meal plans during cancer treatment, and all 10 participants (100%) felt they could follow the plans as cancer survivors. Seven of ten (70%) reported no dietary incompatibilities with the app-generated recommendations; the remaining 3 out of 10 (30%) identified at least one food they could not consume due to health conditions or personal preferences. Nine of ten (90%) indicated they would recommend the CANEAT app to other cancer patients. When asked about their preferred mode of use, 8 out of 10 (80%) preferred using the app independently, while 2 out of 10 (20%) preferred using it in conjunction with dietitian counseling. Nine of 10 (90%) also endorsed interest in the ability to swap ingredients or customize portion sizes. Results are illustrated in Figure 3.
Figure 3.
Post-app user perceptions. (A) agreement with usefulness statements and budget feature helpfulness. (B) feasibility of following meal plans and likelihood of recommendation to other cancer patients (n = 10).
3.5. Feature Preferences and Requested Improvements
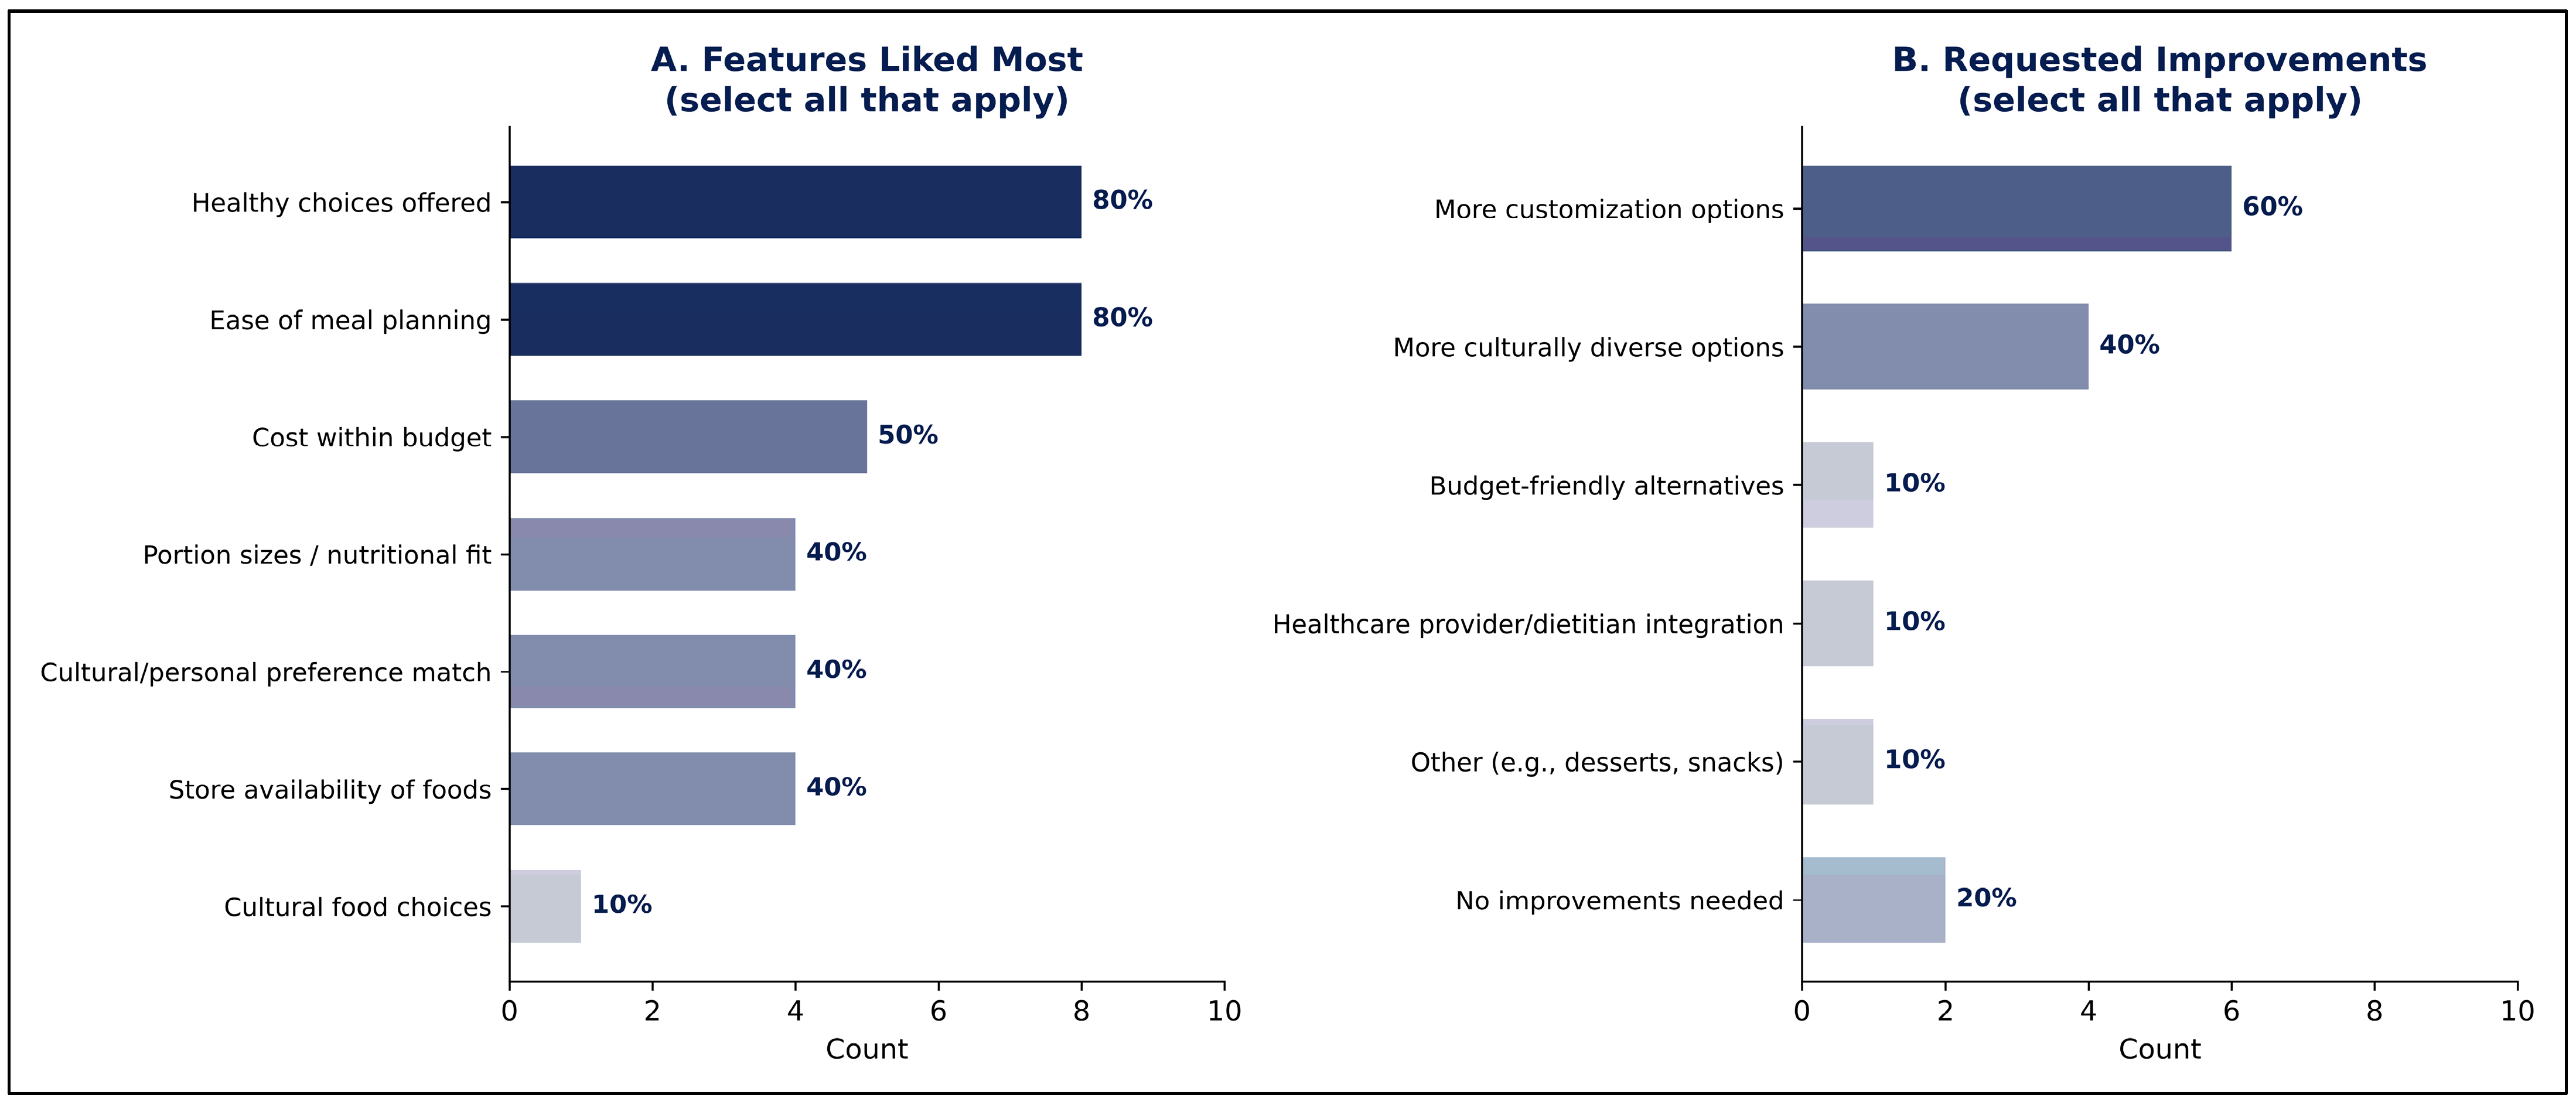
When asked to select features they liked most (with the option to select all that apply), participants most frequently endorsed the healthy dietary choices offered by the app (80%) and the ease of meal planning (80%). Additional appreciated features included the cost-within-budget alignment of ingredient suggestions (50%), cultural or personal preference matching of meal plans (40%), availability of recommended foods in local stores (40%), and appropriateness of portion sizes and nutritional content (40%).
In terms of potential improvements for the app (with the option to select all that apply), the most common response was a desire for more customization options (60%), followed by more culturally diverse meal options (40%). Smaller proportions of participants identified other potential improvements, including budget-friendly meal alternatives (10%), greater integration with healthcare providers or dietitians (10%), and other enhancements, including dessert and snack suggestions (10%) as desirable improvements. Two participants (20%) indicated that no improvements were needed. Feature preferences and requested improvements are displayed in Figure 4.
Figure 4.
App feature preferences and requested improvements. (A) features rated as most valuable (select all that apply). (B) features requested for future improvement (select all that apply) (n = 10).
3.6. Qualitative Analysis
A thematic analysis of all focus group transcripts revealed consistent and cross-cutting patterns in user perceptions of the CANEAT app. Themes were organized across five overarching domains that reflected participants’ experiences, perceived benefits, and areas for refinement. Given the fair intercoder agreement (Section 2.5), these themes should be regarded as exploratory.
3.6.1. Usability and Ease of Use
Participants across all groups consistently praised the app’s ease of use, practical utility, and visual clarity of its features. Many appreciated that the app’s interface was large, the text was readable, and the functions were intuitive, which is particularly important given the older average age among breast cancer survivors. Users favorably described the app as “basic and to the point” and “user-friendly,” emphasizing that they could easily understand calorie counts, portion sizes, and budget features without professional assistance. The app was also positively received by the participants at first interaction, and several expressed interest in integrating it into their daily lives over time, although sustained engagement could not be assessed in this single-session study.
Some inconsistencies in the visuals and some glitches (such as vegetarian filters producing meat options) were reported by the participants; however, these issues were regarded by the participants as expected small “tweaks” rather than obstacles to engagement. The overall mean SUS score (84.25) was strongly supported by participants’ narratives describing the tool as accessible for both older adults and caregivers with competing demands.
3.6.2. Cultural Relevance and Personalization
The importance of cultural alignment and flexibility was a prominent theme across the focus groups. The participants valued that CANEAT allowed customizations of cuisines, dietary restrictions, and spice preferences, but also identified opportunities for deeper cultural nuance. Users requested that the app distinguish between cultural identity and food preferences (“I like Mexican food, but I’m not Mexican”) and include more regional cuisines and familiar seasonings.
Several participants, particularly those from racially and ethnically diverse backgrounds, stressed the need for guidance on how to make traditional foods healthier rather than eliminating them outright, aligning dietary changes with real-world habits. Others suggested integrating additional modifiers (e.g., consumption of sodium, preferred proteins) and providing substitutions that maintain the cultural flavor. Additionally, some asked whether the app could recommend healthy options at specific restaurants, as many participants reported eating two or more meals per day outside the home. These findings indicate that cultural fit contributes meaningfully to user satisfaction and trust.
3.6.3. Functionality and Context of Use
Across focus groups, survivors envisioned using the app during both treatment and survivorship. Participants saw utility in using the app while grocery shopping or when eating out. Multiple participants said the app could reduce the “decision fatigue” and cognitive burden of meal planning during treatment. Others brought up that the grocery-list generation and price-point estimates were “realistic,” helping them manage budgets without compromising their nutritional needs.
Participants also appreciated the adaptability of the tool for different life stages, noting distinct needs among younger adults, parents, and older adults. Survivors envisioned the app as a bridge, supporting the transition from convenience foods back to healthier eating habits as appetite returned post-treatment. They identified increased flexibility for busy schedules, such as quick-prep filters for low-energy days and “on-the-go meals”, as an area for further refinement.
3.6.4. Trust, Credibility, and Transparency
Participants’ perspectives on trustworthiness of the app were nuanced and varied. Most indicated a baseline level of confidence in the app, one participant stating, “I trust it because I have no reason not to,” but relatively few described active trust. Their trust in the app’s recommendations was largely passive, as it was due to an absence of distrust rather than active confidence. Several expressed discomfort with the word trust itself, noting that “trust is a weird word” when applied to an AI-based tool.
Moreover, trust appeared contingent upon source transparency. Throughout the focus groups, participants requested the app cite the sources of its nutritional guidance to support informed confidence and verify credibility. Perceived transparency, such as showing nutritional rationales (“why each ingredient was chosen”), would greatly increase confidence according to users. They valued seeing how meals related specifically to cancer recovery or treatment effects, making the recommendations feel evidence-based rather than generic.
Although cost-sensitivity varied, almost everyone appreciated the built-in budget awareness of the meal plans as they noted that the app realistically accounted for grocery economics (“you buy a loaf, not a slice of bread”). Some confusion arose regarding whether the budget represented weekly or monthly totals, suggesting the need for clearer labeling. Participants linked affordability to perceived equity, acknowledging cost-effective planning as integral to making nutrition accessible across income levels.
3.6.5. Desired Improvements and Feature Requests
Participants proposed a range of enhancements centered around personalization, optional complexity, and medical safety within the app. Many highlighted the importance of integrating medication and allergy data, such as flagging potential food-drug interactions (ex: grapefruit with certain antihypertensive medications). Users also mentioned accounting for treatment-related side effects, including nausea, texture sensitivity and appetite changes, by incorporating adjustable filters. Additionally, some participants brought up the idea of a potential social media-style community tab allowing survivors to share modifications, photos, and tips, modeled after apps such as What to Expect, used for pregnancy and baby tracking. Despite the suggestions mentioned, the participants emphasized that the added features should remain optional, maintaining the simplicity found to be the app’s strongest appeal.
4. Discussion
This single-institution pilot mixed-methods study suggests that the CANEAT app attained high usability and strong perceived relevance among a small cohort of female breast cancer survivors who had undergone radiation therapy treatment. The mean System Usability Scale (SUS) score of 84.25 exceeded the pre-determined acceptability threshold. The mean score was also numerically higher than published SUS benchmarks for digital health apps [11]; however, this is an indirect cross-study comparison rather than a formal comparator. Within this cohort, participants found the app useful and intuitive. These findings were supported by qualitative data, with participants describing the app as accessible, easy to navigate, and adaptable to real-world needs. The consistency between the quantitative usability metrics and qualitative participant narratives provides preliminary support for the feasibility of using AI-derived nutritional tools in survivorship care.
Integrating the quantitative and qualitative data clarifies both the strengths and the boundaries of these findings. The high SUS scores matched what participants said in the focus groups. They described the interface as readable and “basic and to the point,” which they felt was particularly important for older users. The survey also pointed to specific problems, and the focus groups helped explain them. Twenty percent of participants did not think they could follow the meal plans during treatment, which matched requests for help with nausea, taste changes, and appetite loss. The 30% who found a food they could not eat matched comments about comorbidities and the vegetarian filter returning meat. The 90% who said they would recommend the app should also be read with some caution. In the focus groups, trust in the app was mostly passive. Participants trusted it because they had no reason not to, and they said they would trust it more if they could see where its advice came from. Overall, participants liked the core interface, but the app needs better tailoring to clinical needs and more transparency about its sources.
An important aspect of this study lies within the app’s ability to implement cultural and socioeconomic data into its generated nutrition guidance. These are aspects of health that are frequently overlooked in nutritional counseling. Participants said that having meal plans tailored to their cultural preferences, dietary habits, and budgets made the app more acceptable and useful to them. These findings are consistent with current literature, which emphasizes the importance of culturally competent care in improving patient satisfaction and adherence to treatment plans, particularly within those populations that have historically been underrepresented in medicine. Accordingly, the majority of participants in this study were racial/ethnic minorities, and their feedback suggests that LLM-based tools like CANEAT are worth studying to lower barriers to nutritional care. However, this study did not measure disparities, and whether such tools reduce them remains to be tested. The ability of the app to generate grocery lists and meal plans that are conscientious of both cost and location suggests it could help address structural barriers such as food affordability and access, a hypothesis that warrants formal evaluation.
In addition to the app’s ease of use and cultural awareness, participants felt that the CANEAT app could be useful in survivorship and in daily tasks such as grocery shopping and meal preparation. Several also thought it could help during active cancer treatment. Because patients in active treatment were excluded from this study, that remains a hypothesis to be tested in that population. Additionally, many participants said the app could help reduce “decision fatigue”, particularly during stressful periods. In a similar vein, this underscores yet another overlooked issue within supportive oncological care: the need for tools that simplify complex decisions that cancer patients face daily. We also hypothesize that the personalized, structured format of CANEAT’s recommendations may be easier to interpret than generic dietary materials such as printed handouts, and that this could support longer-term engagement. With a single session and no comparator, this study could not test either possibility.
Though there is much promising data, there are several important limitations, and its findings should be considered preliminary and hypothesis-generating. First, the small sample size (n = 10) and single-institution design limit the study’s generalizability. Despite the cohort being diverse in terms of demographics, all participants were female breast cancer survivors, which does not reflect the broader cancer patient population. Extensive validation in larger, multi-center domestic and international cohorts, including other cancer types, is required to confirm these findings. Second, the study consisted of a single-session interaction, which limited the assessment of the cohort’s long-term engagement and adherence with the app, as well as of clinical outcomes such as nutritional status or quality of life. Long-term follow-up of this study must be done to determine the benefits for the survivors of this study. Third, agreement between the two coders was only fair (κ = 0.34–0.35), and their disagreements were not reconciled. We consider this a first-order methodological limitation, and the qualitative themes should be read with that in mind. In future studies, coders will work from a more clearly defined codebook, practice on a shared transcript before coding, resolve disagreements by consensus with a third reviewer, and recheck agreement until κ reaches at least 0.60. Fourth, most of the cohort was familiar with technology. Nine of ten participants owned a smartphone, seven used apps daily or frequently, and half held a bachelor’s degree or higher, so the high usability scores may partly reflect this familiarity. Our exploratory subgroup results point the same way. Mean SUS was 75.0 among participants aged 65 years or older versus 93.5 among younger participants, 76.9 among those with household incomes below $60,000 versus 89.2 among those above it, and 74.2 among the three participants who never used apps versus 88.6 among the rest. These groups overlap, and the two lowest scorers (P1 and P8) were both older and in the lower-income group. With subgroups this small, the differences cannot be tested, but they suggest that older, lower-income, and less digitally experienced survivors may find the app harder to use. These are the survivors a tool like CANEAT is meant to reach, so future studies should specifically include them. Fifth, there was no comparator arm. We therefore cannot say whether CANEAT performs better than, or as well as, existing dietary apps or standard nutritional counseling, and a future study should compare them directly, ideally in a randomized design. Sixth, this study measured usability, not the accuracy or safety of the app’s recommendations, and a dietitian did not review the meal plans generated during the sessions. The app’s prompt was adapted from our earlier work, in which LLM-generated recommendations were broadly consistent with those of oncology dietitians [5]. LLMs can still produce advice that sounds reasonable but is wrong, so future studies will include dietitian review of the app’s output.
Additionally, the participants noted several gaps in CANEAT’s function, with the most notable being that the app did not sufficiently address side effects related to their radiation therapy, including nausea, changes in taste, and changes in appetite. Incorporating dietary recommendations that are conscientious of the patients’ symptoms is a critical next step to enhance CANEAT’s efficacy. Additionally, participants expressed a desire for clearer sourcing and nutritional rationale for the app’s generated dietary advice. This finding reveals overarching issues involving overall trust in AI-driven healthcare tools, suggesting that future models should prioritize the implementation of transparency features to bolster the confidence of the user. Future iterations will need safeguards against errors like those participants encountered. Each plan could be checked against the user’s stated restrictions before it is shown, which would have caught the vegetarian filter returning meat. Food–drug interactions should be flagged separately from the model, side-effect guidance should draw on established oncology nutrition sources, and users should be able to see where recommendations come from. Users with active symptoms or complex comorbidities should be referred to their care team, and a dietitian should periodically review the app’s output. Finally, minor issues with the interface such as issues with images not matching the stated recipe and vegetarian filters providing meat options indicate areas for improvement prior to the app’s official debut.
Overall, these findings suggest that LLM-based dietary apps like CANEAT may be able to help address gaps in nutritional care by combining personalization with cultural competence. Larger studies in more diverse populations, with a comparator arm and longer follow-up, will be needed to determine their clinical effect.
5. Conclusions
In this single-institution pilot study of female breast cancer survivors treated with radiation therapy, the CANEAT app showed high usability, and participants found it culturally relevant and practical for daily life. Because the sample was small and familiar with technology, these findings should be considered preliminary and hypothesis-generating.
Further work is needed before the app can be recommended more broadly. Larger, multi-center studies should include other cancer types, survivors with less digital experience, and a comparison with standard nutritional counseling. Dietitians should review the app’s output, and participants should be followed long enough to measure engagement and clinical outcomes. Future versions will also need to address treatment-related side effects, transparency, and trust.
Supplementary Materials
The following supporting information can be downloaded at: https://www.mdpi.com/article/10.3390/nu18223872/s1, File S1: Full Large Language Model Prompt Used in the CANEAT App; File S2: semi-structured focus group interview guide.
Author Contributions
Conceptualization, A.M.K., A.M.A., M.T., J.A.L., J.J. (Jaitri Joshi) and N.L.S.; methodology, A.M.K., A.M.A. and J.A.L.; software, D.T. and W.C.; validation, A.M.K. and A.M.A.; formal analysis, A.M.K., A.M.A. and J.M.; investigation, A.M.K., A.M.A. and N.L.S.; resources, N.L.S.; data curation, A.M.K., A.M.A., N.F., J.J. (Jenna Jacoby), J.J. (Jaitri Joshi), M.G., J.M., R.S., D.T., W.C. and N.L.S.; writing—original draft preparation, A.M.K., A.M.A., J.M. and W.C.; writing—review and editing, A.M.K., A.M.A., J.A.L. and N.L.S.; visualization, A.M.K.; supervision, N.L.S.; project administration, A.M.K. and N.L.S.; funding acquisition, N.L.S. All authors have read and agreed to the published version of the manuscript.
Funding
Funding for this work was provided by the National Cancer Institute to NLS (5P30CA056036) via clinical trial support.
Institutional Review Board Statement
The study was conducted in accordance with the Declaration of Helsinki, and approved by the Institutional Review Board of Thomas Jefferson University Hospital (IRB Protocol number: iRISID-2025-0614) on 30 June 2025.
Informed Consent Statement
Informed consent was obtained from all subjects involved in the study.
Data Availability Statement
The raw data supporting the conclusions of this article will be made available by the authors on request.
Acknowledgments
We would like to thank the patients who participated in this study for their time, expertise and passion to help others.
Conflicts of Interest
The authors declare no conflicts of interest.
Abbreviations
The following abbreviations are used in this manuscript:
| LLM | Large Language Model |
| RT | Radiation Therapy |
| AMDR | Acceptable Macronutrient Distribution Range |
| SUS | System Usability Scale |
| IRB | Institutional Review Board |
| JSON | JavaScript Object Notation |
| CSRF | Cross-site request forgery |
| CANEAT | Cancer Nutrition App for Eating Advice and Tips |
| REDCap | Research Electronic Data Capture |
| AI | Artificial Intelligence |
| API | Application Programming Interface |
| CSS | Cascading Style Sheets |
| REST | Representational State Transfer |
| UI | User Interface |
| SD | Standard Deviation |
References
- Hollinger, D.; Butscher, L.; Belinske, S.; Arthur, H.; Nagarajan, S. The Role of Nutrition and Malnutrition as Determinants of Cancer Development, Prevention, and Survivorship. Dela J. Public Health 2025, 11, 68–72. [Google Scholar] [CrossRef] [Scilit] [PubMed]
- Ravasco, P. Nutrition in Cancer Patients. J. Clin. Med. 2019, 8, 1211. [Google Scholar] [CrossRef] [Scilit] [PubMed]
- Devino, M. Medical Nutrition Therapy Act Would Benefit Medicare Recipients; Association of Community Cancer Centers: Chevy Chase, MD, USA, 2021; Available online: https://www.accc-cancer.org/acccbuzz/blog-post-template/acccbuzz/2021/08/24/medical-nutrition-therapy-act-would-benefit-medicare-recipients (accessed on 2 February 2024).
- Clusmann, J.; Kolbinger, F.R.; Muti, H.S.; Carrero, Z.I.; Eckardt, J.N.; Laleh, N.G.; Löffler, C.M.L.; Schwarzkopf, S.-C.; Unger, M.; Veldhuizen, G.P.; et al. The future landscape of large language models in medicine. Commun. Med. 2023, 3, 141. [Google Scholar] [CrossRef] [Scilit] [PubMed]
- Logan, J.A.; Sadhu, S.; Hazlewood, C.; Denton, M.; Burke, S.E.; Simone-Soule, C.A.; Black, C.; Ciaverelli, C.; Stulb, J.; Nourzadeh, H.; et al. Bridging Gaps in Cancer Care: Utilizing Large Language Models for Accessible Dietary Recommendations. Nutrients 2025, 17, 1176. [Google Scholar] [CrossRef] [Scilit] [PubMed] [PubMed Central]
- McCullough, M.L.; Chantaprasopsuk, S.; Islami, F.; Rees-Punia, E.; Um, C.Y.; Wang, Y.; Leach, C.R.; Sullivan, K.R.; Patel, A.V. Association of socioeconomic and geographic factors with diet quality in US adults. JAMA Netw. Open 2022, 5, e2216406. [Google Scholar] [CrossRef] [Scilit] [PubMed]
- Brooke, J. SUS: A retrospective. J. Usability Stud. 2013, 8, 29–40. [Google Scholar]
- Bangor, A.; Kortum, P.T.; Miller, J.T. An empirical evaluation of the System Usability Scale. Int. J. Hum. Comput Interact. 2008, 24, 574–594. [Google Scholar] [CrossRef] [Scilit]
- Landis, J.R.; Koch, G.G. The measurement of observer agreement for categorical data. Biometrics 1977, 33, 159–174. [Google Scholar] [CrossRef] [Scilit]
- McHugh, M.L. Interrater reliability: The kappa statistic. Biochem Med. 2012, 22, 276–282. [Google Scholar] [CrossRef] [Scilit]
- Hyzy, M.; Bond, R.; Mulvenna, M.; Bai, L.; Dix, A.; Leigh, S.; Hunt, S. System usability scale benchmarking for digital health apps: Meta-analysis. JMIR Mhealth Uhealth 2022, 10, e37290. [Google Scholar] [CrossRef] [Scilit] [PubMed]

Disclaimer/Publisher’s Note: The statements, opinions and data contained in all publications are solely those of the individual author(s) and contributor(s) and not of MDPI and/or the editor(s). MDPI and/or the editor(s) disclaim responsibility for any injury to people or property resulting from any ideas, methods, instructions or products referred to in the content. |
© 2026 by the authors. Licensee MDPI, Basel, Switzerland. This article is an open access article distributed under the terms and conditions of the Creative Commons Attribution (CC BY) license.