


Abstract
Introduction. Almond milk is among the most purchased plant-based alternatives to bovine milk and can be fermented with kefir grains, but the resulting beverage has been studied only in terms of its own properties and its effect on the gut microbiota has not been examined. Aims. This study characterized kefir produced from almond milk and examined whether it is associated with differences in the intestinal microbial community in mice. Materials and methods. Kefir grains were inoculated into commercial almond milk at 2%, 3% and 4% (w/v) and fermented at 25 °C for 22 h, and pH, titratable acidity and microbial counts on five culture media were followed over 14 days of refrigerated storage at 4 °C, with sensory evaluation on the first day of storage. The 3% product was then given by daily gavage to male C57BL/6 mice for 21 days alongside plain almond milk and an untreated control, with the fecal microbiota assessed by culture-based enumeration and the colonic luminal contents characterized by 16S rRNA gene sequencing. Results. Fermentation lowered the pH of the almond milk from 7.78 to between 4.74 and 5.27 at day 0 according to the grain concentration (p < 0.001), with titratable acidity rising in parallel (p = 0.009). Mean viable counts stayed at or above 8.00 log10 CFU/mL on four culture media throughout 14 days of refrigerated storage, and neither the counts nor the sensory scores differed between the three concentrations (p > 0.05), apart from texture, which was rated higher as the grain concentration rose (p = 0.005). In mice, fecal lactic acid bacteria were most abundant in the kefir group (p < 0.001); after adjustment for the counts recorded on day 0 the difference from the plain almond milk group remained significant (p = 0.002) while that from the untreated control did not (p = 0.071). In the colonic luminal contents, alpha diversity did not differ among groups (p > 0.05), whereas beta-diversity analysis suggested differences in community composition (PERMANOVA on Bray–Curtis distances, p = 0.004). Bacillota predominated over Bacteroidota only in the kefir group, while Lactobacillus represented 13.0% of the community compared with 4.8% and 5.8% in the almond milk and control groups, respectively. LEfSe further identified Lactobacillus as a discriminating taxon in the kefir group in this exploratory analysis. Conclusion. These findings indicate an association between almond milk kefir consumption and differences in the composition of the colonic luminal microbiota in mice, while alpha diversity remained unchanged.
1. Introduction
Almond milk is among the most purchased plant-based alternatives to bovine milk [1]. Its composition, however, differs substantially from that of bovine milk. Almond milk contains significantly less protein and fewer essential amino acids than animal milk [2]. Plant-based beverages in general also contain most minerals at lower concentrations than animal milk, and their lipid fraction is far less saturated, with saturated fatty acids accounting for 9.6 to 17.9% of lipid compared with about 72% in animal milk [2]. These compositional differences may alter the nutrients and other substrates available to the gut microbiota, a community that regulates host metabolism, immune responses and epithelial integrity [3]. Table 1 sets out the reported differences in composition between almond-based beverages and cow milk.
Table 1.
Reported composition of almond-based beverages and cow milk.
Adapted from Moore et al. [2]. In that source, saturated fatty acid values are given for plant-based beverages and for animal milk as groups rather than for almond and cow individually, and the amino acid scores are quoted from earlier literature.
Even without fermentation, almond milk can influence the intestinal microbial community. In a controlled study in growing rats, animals received bovine milk, soy milk or almond milk for four weeks from weaning, and the microbiota of the cecal contents was characterized by 16S rRNA gene sequencing [4]. The cecal communities differed between the groups. Bovine milk increased Actinomycetota, whereas almond milk acted mainly on Bacteroidota and Bacillota and raised the abundance of Lactobacillaceae, Clostridiaceae and Peptostreptococcaceae [4]. All three beverages were heat treated and none was fermented.
Fermentation is one way of modifying almond milk. Kefir is produced by fermenting milk with kefir grains, in which a symbiotic consortium of lactic acid bacteria, acetic acid bacteria and yeasts is held within a matrix of the bacterially produced polysaccharide kefiran [5]. Kefir fermented with grains carries a more diverse microbial community than kefir produced with starter cultures [6]. Milk kefir grains can ferment almond milk, lowering its pH from 7.68 to 4.71 [7]. Kefir prepared from bovine milk has been shown to change the composition of the fecal microbiota, increasing the lactate-producing species Bifidobacterium breve, Ruthenibacterium lactatiformans, Weissella koreensis and Leuconostoc mesenteroides after two weeks of intake in healthy adults without altering alpha or beta diversity [8], and increasing the butyrate-producing family Lachnospiraceae and the genus Lachnoclostridium together with fecal butyrate concentrations in mice [9].
Kefir produced from almond milk has so far been characterized only as a product. Almond milk has been fermented with milk and water kefir grains [7], with a plant-based kefir starter culture together with almond skin [10], and alongside chickpea and rice extracts using water kefir grains [11]. None of these studies examined the gut microbiota. The available in vivo evidence for plant-based kefir comes from other substrates, namely kefir-fermented soy milk in mice [12], and water kefir in mice [13], and in healthy adults [14]. Both animal studies used models of induced physiological stress rather than healthy animals. To the best of our knowledge, kefir produced from almond milk has not previously been evaluated in vivo. The present study therefore determined the physicochemical, microbiological and sensory properties of kefir produced from almond milk at three kefir-grain concentrations during refrigerated storage. The effect of the product was then assessed in healthy mice by culture-based enumeration in feces and by 16S rRNA gene sequencing of colonic luminal contents, relative to plain almond milk and an untreated control.
2. Materials and Methods
2.1. Preparation of Kefir Produced from Almond Milk
Commercial UHT almond milk (Mediterranean Nutty Almond; Alpro, Ghent, Belgium) was purchased from a local supermarket in Jeddah, Saudi Arabia. A widely available commercial product was used for all batches, so that the composition of the substrate was identical throughout the study. The label lists water, almond (2.3%), sugar, calcium carbonate, sea salt, stabilizers (guar gum, gellan gum), natural flavoring, emulsifier (lecithins) and vitamins B12, D2 and E, and gives, per 100 mL, 23 kcal, 1.1 g fat of which 0.1 g saturated, 2.7 g carbohydrate of which 2.4 g sugars, 0.3 g fiber, 0.5 g protein, 60 mg sodium and 120 mg calcium. Before inoculation, the kefir grains were activated by three consecutive 24 h cycles in pasteurized full-fat cow’s milk at 25 °C, the milk being renewed at each cycle, followed by rinsing in sterile distilled water [15]. The activated grains were inoculated into 200 mL of almond milk at 2%, 3% and 4% (w/v) and fermented at 25 °C for 22 h [16]. At the end of incubation, the fermented almond milk was filtered through a sterile plastic sieve to remove the grains and stored at 4 °C until further analysis.
2.2. Determination of pH and Titratable Acidity (TA)
The pH and TA were measured on the unfermented almond milk before inoculation and on the fermented samples after 0, 7 and 14 days at 4 °C. Both were determined as described by [17]. For TA, 1 g of sample was dispersed in 9 mL of distilled water in a 50 mL tube, three drops of 1% (w/v) phenolphthalein were added as indicator, and the mixture was titrated with 0.1 mol/L NaOH to a pink end-point that persisted for 30 s. TA, expressed as percent lactic acid, was obtained from
in which VNaOH is the volume of 0.1 mol/L NaOH consumed (mL), 0.009 the lactic-acid conversion factor (1 mL of 0.1 mol/L NaOH neutralizes 0.009 g of lactic acid) and W the weight of the sample (g). The whole 10 mL suspension was titrated, so no dilution factor is applied.
TA (% lactic acid) = (VNaOH × 0.009/W) × 100
2.3. Microbiological Analysis of the Kefir Produced from Almond Milk
Microbial counts were determined by the standard plate count method on the almond milk before fermentation and on the fermented product after 0, 7 and 14 days of storage. One milliliter of each sample was suspended in 9 mL of sterile buffered peptone water and serially diluted ten-fold to 10−5 [17]. A 0.1 mL aliquot of the 10−5 dilution was spread-plated onto five media: Plate Count Agar for total viable counts (PCA; 30 °C, 48 h, aerobic) [18]; de Man, Rogosa and Sharpe agar for lactic acid bacteria (MRS; 37 °C, 48 h, anaerobic) [19]; MRS-LP agar, selective for bifidobacteria (MRS supplemented with 0.2 g/100 mL lithium chloride and 0.3 g/100 mL sodium propionate; 37 °C, 72 h, anaerobic) [20]; Violet Red Bile Agar for total coliforms (VRBA; 37 °C, 24 h) [18]; and Sabouraud Dextrose Agar supplemented with 0.1 g/L chloramphenicol for yeasts and molds (SDA; 28 °C, 5 days) [21]. Colonies were enumerated on the basis of the selectivity of each medium; their identity was not confirmed, so the counts refer to the organisms recovered on each medium. Colony counts were converted to colony-forming units per milliliter (CFU/mL) as
in which N is the number of colonies counted, D the dilution factor (105) and V the volume plated (0.1 mL). As only the 10−5 dilution was plated, a single colony corresponded to 1 × 10⁶ CFU/mL, establishing a detection limit of 6.00 log10 CFU/mL. Samples yielding no colonies were reported as below the detection limit, as the absence of detectable growth at the dilution tested does not demonstrate the absence of the target organisms.
CFU/mL = (N × D)/V
2.4. Sensory Evaluation
Sensory evaluation of the kefir produced from almond milk was performed on the first day of refrigerated storage (4 °C). Fifteen untrained assessors, 5 males and 10 females aged 25 to 35 years, participated in the evaluation [17]. The assessors were postgraduate student volunteers from the Faculty of Science, King Abdulaziz University, recruited at random, and informed consent was obtained from each of them before the session. In accordance with institutional requirements, formal ethical approval was not required for a minimal-risk sensory evaluation of this kind. Each sample was rated on a standardized scoring form for six attributes, namely taste, color, flavor, aroma, texture and overall acceptability, on a 10-point hedonic scale, where 10 = excellent, 9 = highly acceptable, 8 = acceptable, 7 = moderately acceptable, 6 = slightly acceptable, 5 = slightly unacceptable, 4 = moderately unacceptable, 3 = unacceptable, 2 = highly unacceptable and 1 = rejected.
2.5. Animal Experiment
The study was approved by the Animal Care and Use Committee (ACUC) of King Fahd Medical Research Center (approval no. ACUC-25-09-17) and was conducted in accordance with institutional guidelines. Male C57BL/6 mice aged 8 weeks and weighing 20 to 30 g were supplied by King Fahd Medical Research Center (Jeddah, Saudi Arabia) and housed at 22 ± 2 °C under a 12 h light and 12 h dark cycle, with water and a standard irradiated complete vegetal rodent diet (U8002G10R, SAFE, Rosenberg, Germany; 22% crude protein, 5.3% crude fat, 4.2% crude fiber and 5.7% crude ash) available ad libitum. The animals were held in transparent polycarbonate cages with stainless steel wire lids and wood shaving bedding, and no additional environmental enrichment was provided. A total of 15 mice were used. After one week of acclimatization, they were assigned to three groups of five (n = 5 per group). Animals were assigned to the groups at random as they were taken from the transport cage; no formal randomization sequence was generated. Each group occupied a single cage for the duration of the study. The normal control group (NC) received no intervention, the PA group received plain almond milk, and the KAM group received kefir produced from almond milk. Within each group, three animals were selected at random in advance for the microbiota analysis and the remaining two were kept in reserve, the group size of five having been set on the recommendation of the animal facility so that the planned number of samples would remain available should any animal be lost over the 21-day study. The allocation of the three animals was made before the feeding period began, and no sample was excluded once sequencing had been completed. The number of animals used for the microbiota analysis, three per group, was fixed when the study was designed rather than chosen after the data had been obtained. The two reserve animals were housed, fed and gavaged in exactly the same way as the three animals selected for the analysis. No animal was lost during the 21-day feeding period, so no reserve animal was called upon as a replacement, and all five animals in each group were euthanized together at the end of the study.
The KAM group received the kefir prepared with the intermediate grain concentration, 3% (w/v), following 7 days of refrigerated storage at 4 °C, whereas the plain almond milk was administered without prior storage. This concentration was selected because the viable counts did not differ between the three concentrations on any medium, so that the intermediate formulation could be taken as representative of the range prepared. The storage age of 7 days falls within the period over which the pH, acidity and viable counts of the product were shown to be stable and was one of the time points at which those counts were determined, so the composition of each dose administered was known. A separate batch was fermented each day, so that every dose was administered at the same storage age and no batch was used on more than one day of the study. Each 0.2 mL dose therefore delivered approximately 1.0 × 10⁸ CFU of lactic acid bacteria and 2.7 × 10⁷ CFU of yeasts and molds, calculated from the viable counts of the 3% product after 7 days of storage. The same dose delivered approximately 5.6 × 10⁷ CFU of total viable organisms on Plate Count Agar and 1.0 × 10⁸ CFU on MRS-LP agar, so that the counts on the four media used to characterize the preparation are reported for the dose administered.
The PA and KAM groups were each gavaged daily with 0.2 mL of the corresponding preparation for 21 consecutive days. The plain almond milk group therefore received the same volume, by the same route and on the same schedule as the kefir group, and served as the comparator matched for the gavage procedure and for the almond milk base, while the untreated control provided a reference for animals that received no intervention. At the end of the feeding period the animals were euthanized by isoflurane overdose and cervical dislocation. The colonic luminal contents were then collected aseptically and stored at −80 °C until microbiota analysis.
2.6. Fecal Microbiological Analysis
Fresh fecal samples were collected for microbiological enumeration on days 0, 7, 14 and 21, the day 0 samples being taken 1 h after the first gavage. Three animals per group were selected at random before the feeding period began, and the same animals were sampled at each time point, every sample being processed individually (n = 3 per group). Samples were weighed and homogenized in sterile buffered peptone water (9 mL), then serially diluted ten-fold to 10−4. A 0.1 mL aliquot of the 10−4 dilution was plated on the same five media and under the same incubation conditions as in Section 2.3. Colony counts were converted to colony-forming units per gram of feces (CFU/g) as
in which N is the number of colonies counted, D the dilution factor (104), V the volume plated (0.1 mL) and W the weight of the fecal sample (g). Because the detection limit of this calculation depends on the weight of the sample, it was obtained separately for each sample. The fecal samples analyzed here weighed 0.045 to 0.290 g, so that one colony corresponded to between 5.54 and 6.35 log10 CFU/g, with a mean of 5.92 log10 CFU/g.
CFU/g = (N × D)/(V × W)
2.7. DNA Extraction and Amplicon Sequencing (16S rRNA)
Colonic luminal contents were collected from every animal, and the three samples per group selected at random in advance (Section 2.5) were extracted for total genomic DNA with the QIAamp PowerFecal Pro DNA Kit (Qiagen, Hilden, Germany), following the manufacturer’s protocol. The fermented product administered to the animals was not itself sequenced, and its microbial content was characterized by viable counts only, as described in Section 2.3.
Amplicon sequencing was performed on the colonic luminal contents. Bacterial communities were profiled by amplifying the V3–V4 hypervariable region of the 16S rRNA gene with primers 341F (5′-CCTAYGGGRBGCASCAG-3′) and 806R (5′-GGACTACNNGGGTATCTAAT-3′). Amplification was performed in a 15 µL reaction containing Phusion High-Fidelity PCR Master Mix, each primer at 0.2 µM and about 10 ng of template DNA. The program began with 1 min at 98 °C, continued through 30 cycles of 10 s at 98 °C, 30 s at 50 °C and 30 s at 72 °C, and ended with 5 min at 72 °C. Every run included a ddH2O no-template control, and amplifications were accepted only when that control gave no visible band. Products of the expected size were recovered from an agarose gel and pooled in equimolar amounts, and the pool was then subjected to end repair, A-tailing and ligation of Illumina adapters. The libraries were checked by Qubit and real-time PCR and on a bioanalyzer. Libraries were sequenced in paired-end mode (2 × 256 bp) on an Illumina NovaSeq 6000 platform by Novogene (Singapore), yielding more than 180,000 effective tags (≈0.8 million raw reads) per sample. Q20 was 97.93 to 98.12% and Q30 93.47 to 93.91% across the nine samples sequenced for this study, and the mean length of the assembled sequences was 414 to 423 nt. The raw sequencing reads generated in this study are available in the NCBI Sequence Read Archive under BioProject accession PRJNA1520965.
2.8. Bioinformatics and Sequence Data Analysis
All sequence processing was carried out in QIIME2 (v2025.04) [22]. Paired-end reads were demultiplexed, stripped of barcode and primer sequences, quality-filtered and merged, and chimeric sequences were removed. The remaining reads were denoised with DADA2 [23] into amplicon sequence variants (ASVs), which retained 157,011 to 220,091 reads per colonic sample. Taxonomy was assigned to the representative ASVs using the SILVA 138.2 database [24] for the 16S rRNA data, and a phylogenetic tree was constructed. Species-level resolution is limited for the V3–V4 region, and species assignments are therefore given as the closest matching reference sequence rather than as definitive identifications.
Alpha diversity indices (Chao1, observed features, Shannon, Simpson, Pielou’s evenness and Good’s coverage) were calculated after the data had been normalized to a uniform depth of 157,011 reads, and group differences were tested by the Kruskal–Wallis test followed by Dunn’s post hoc test. Beta diversity was derived from Bray–Curtis and UniFrac distances [25], ordinated by principal coordinates analysis (PCoA) and evaluated with PERMANOVA [26] and ANOSIM [27] over 9999 permutations. Because the groups were small (n = 3), the global three-group tests served as the primary tests of community difference. PERMDISP with 9999 permutations was applied to test the homogeneity of multivariate dispersion, so that compositional differences could be distinguished from unequal within-group variability. Relative abundances were summarized at the phylum, genus and species levels, and differentially abundant taxa were identified by LEfSe with an LDA threshold of 4.0 [28]. LEfSe was run on each pair of groups with the Kruskal–Wallis test at α = 0.05 and without correction for multiple testing. No subclass was defined, so the pairwise Wilcoxon test of the procedure was not applied, and all taxonomic ranks from kingdom to species were included in the analysis. Given the small group size, the LEfSe output was treated as exploratory and is reported as the taxa that discriminated the groups rather than as established differential abundance.
2.9. Statistical Analysis
All data are expressed as mean ± standard deviation (SD) and were analyzed with GraphPad Prism (version 11.0.2, GraphPad Software, Boston, MA, USA), differences being considered significant at p < 0.05. The physicochemical and microbiological data of the fermented almond milk were obtained from three independent fermentation batches (n = 3) and analyzed by two-way ANOVA with grain concentration and storage time as factors. Fecal counts were obtained from three animals per group at each sampling day (n = 3) and analyzed by repeated-measures two-way ANOVA with experimental group and sampling day as factors, the Geisser–Greenhouse correction being applied to the within-subjects effects. Because the day 0 counts differed between the groups, the lactic acid bacterial counts were also analyzed by analysis of covariance, with the mean of the counts at days 7, 14 and 21 as the outcome and the day 0 count as a covariate. Sensory scores were obtained from 15 assessors (n = 15), each of whom scored all three formulations, and were analyzed by repeated-measures one-way ANOVA with grain concentration as the within-subjects factor, the Geisser–Greenhouse correction being applied. Each analysis was followed by Tukey’s HSD post hoc test. Microbial counts were log10-transformed, and values below the detection limit were assigned the detection-limit value, which was 6.00 log10 CFU/mL for the fermented almond milk and the sample-specific value for each fecal sample. Coliform counts (VRBA), which lay largely below detection, were summarized descriptively rather than analyzed statistically. Because the coliform counts were summarized descriptively and the unfermented almond milk was not included in the statistical comparisons, this substitution did not influence any of the reported comparisons; every count entering a statistical analysis lay above the detection limit.
3. Results
3.1. Physicochemical Properties of the Kefir Produced from Almond Milk
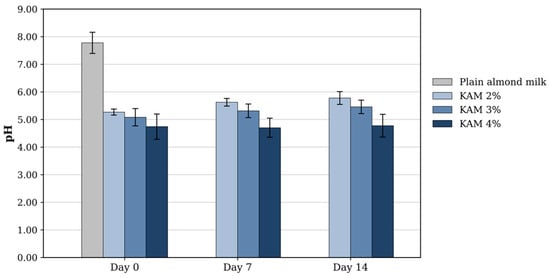
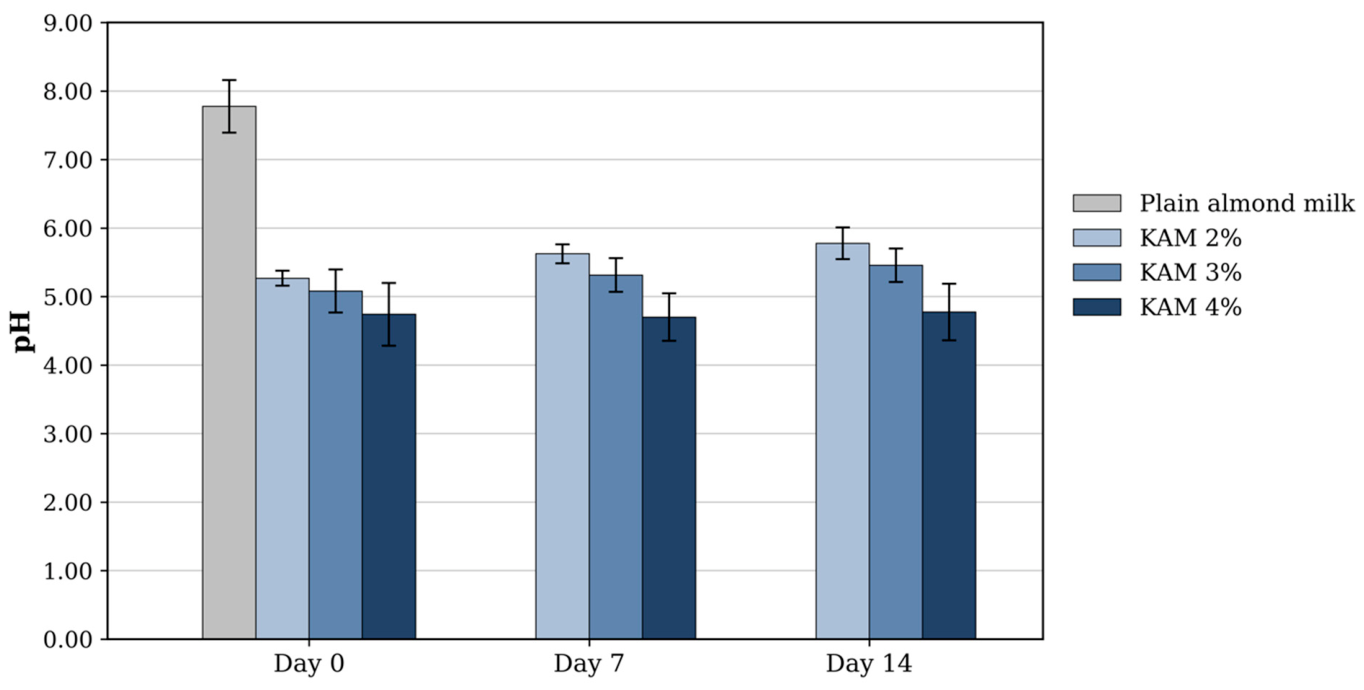
Before fermentation the almond milk was slightly alkaline, with a pH of 7.78 ± 0.38 and a titratable acidity of 0.01 ± 0.00% lactic acid. Fermentation lowered the pH of all samples to between 4.70 and 5.78 (Figure 1). The degree of acidification depended significantly on the kefir-grain concentration (p < 0.001). At day 0 the pH was 5.27 ± 0.11 at 2%, 5.08 ± 0.31 at 3% and 4.74 ± 0.46 at 4%. Pooled across storage days, the 4% samples were significantly more acidic than both the 2% samples (p < 0.001) and the 3% samples (p = 0.003), whereas the 2% and 3% samples did not differ significantly (p > 0.05). Storage at 4 °C had no significant effect on pH (p > 0.05), and the interaction between grain concentration and storage time was not significant (p > 0.05).
Figure 1.
pH of plain almond milk and of kefir produced from almond milk (KAM) at 2%, 3% and 4% (w/v) kefir-grain concentration during 14 days of refrigerated storage at 4 °C. Data are presented as the mean ± SD (n = 3). The plain almond milk was analyzed at day 0 only.
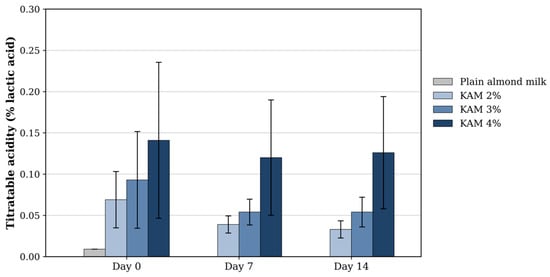
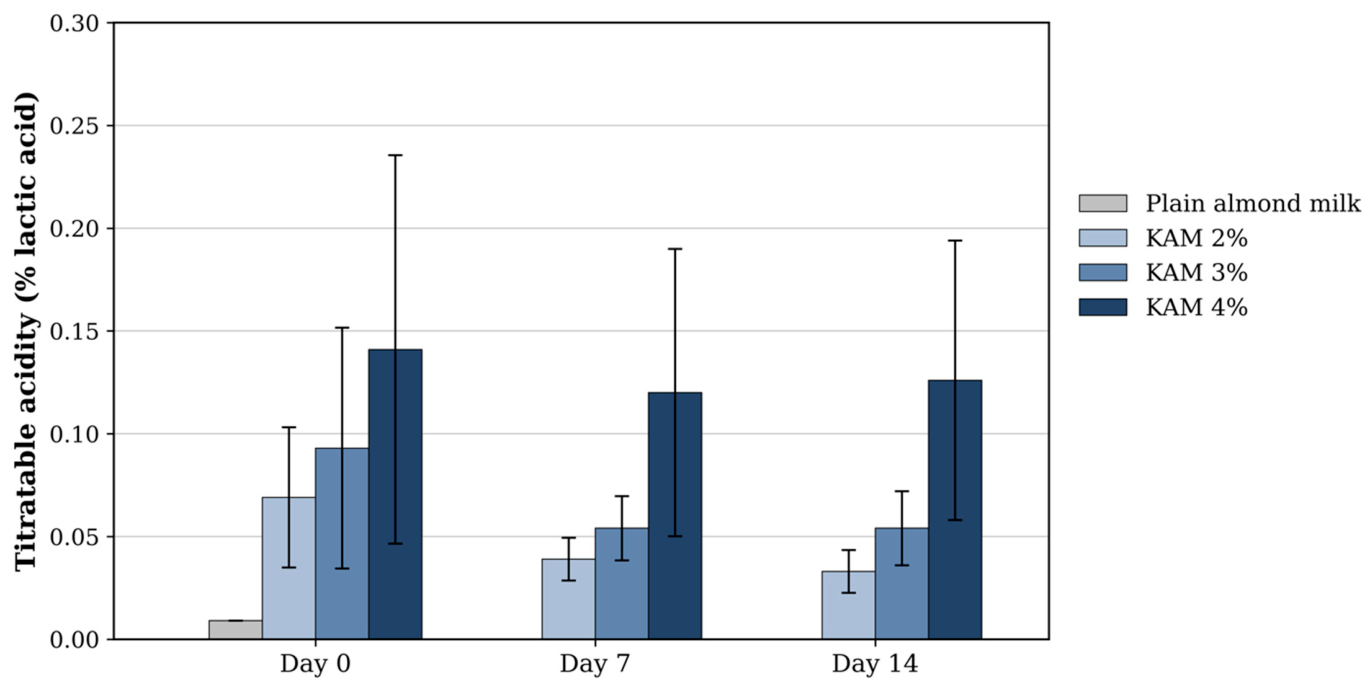
Titratable acidity showed the same dependence on grain concentration (Figure 2). Fermentation raised it from 0.01 ± 0.00% lactic acid in the plain almond milk to 0.07 ± 0.03% at 2%, 0.09 ± 0.06% at 3% and 0.14 ± 0.09% at 4% on day 0. The effect of grain concentration was significant (p = 0.009), the 4% samples reaching a higher acidity than both the 2% samples (p = 0.003) and the 3% samples (p = 0.027), while the 2% and 3% samples did not differ (p > 0.05). Neither storage time (p > 0.05) nor the interaction between the two factors (p > 0.05) was significant.
Figure 2.
Titratable acidity (% lactic acid) of plain almond milk and of kefir produced from almond milk (KAM) at 2%, 3% and 4% (w/v) kefir-grain concentration during 14 days of refrigerated storage at 4 °C. Data are presented as the mean ± SD (n = 3). The plain almond milk was analyzed at day 0 only.
3.2. Microbial Counts of the Kefir Produced from Almond Milk
The unfermented almond milk carried a very low microbial load. No colonies were recovered on plate count agar in any replicate, and the four remaining media counts were at or below 6.60 log10 CFU/mL, with most samples being below the detection limit of the method (6.00 log10 CFU/mL). After fermentation, all mean counts remained at or above 8.00 log10 CFU/mL on PCA, MRS, MRS-LP and SDA throughout the 14 days of refrigerated storage (Table 2).
Table 2.
Microbial counts (log10 CFU/mL) of kefir produced from almond milk (KAM) at 2%, 3% and 4% (w/v) kefir-grain concentration during 14 days of refrigerated storage at 4 °C.
Neither the kefir-grain concentration nor the storage time significantly affected the counts on any of the four media, and the interaction between the two factors was not significant (p > 0.05). Pooled across concentrations and storage days, the total viable count (PCA) averaged 8.54 ± 0.27 log10 CFU/mL, lactic acid bacteria (MRS) 8.66 ± 0.19, counts on MRS-LP 8.60 ± 0.26 and yeasts and molds (SDA) 8.22 ± 0.35 log10 CFU/mL. Coliforms (VRBA), in contrast, were below the detection limit in 17 of the 27 fermented samples (63%); where detectable, counts ranged from 6.30 to 7.11 log10 CFU/mL with no consistent pattern across grain concentration or storage time. These values were obtained from 2 to 13 colonies on the single dilution plated and are therefore semi-quantitative, and they were summarized descriptively rather than analyzed statistically.
3.3. Sensory Evaluation of the Kefir Produced from Almond Milk
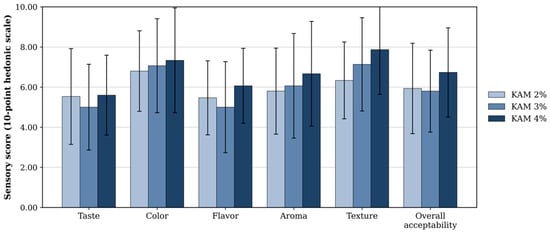
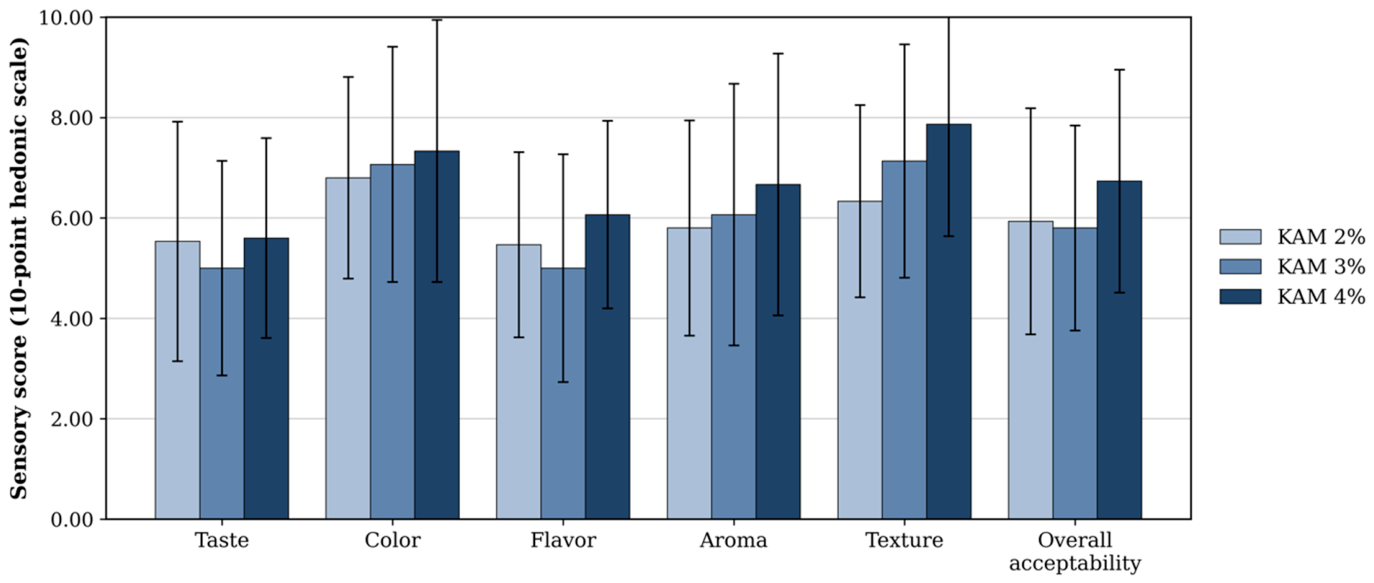
The sensory scores of the kefir produced from almond milk at the three kefir-grain concentrations are shown in Figure 3. Repeated-measures ANOVA revealed no significant differences among the 2%, 3% and 4% samples for taste (F(2,28) = 1.66, p = 0.214), color (F(2,28) = 0.79, p = 0.419), flavor (F(2,28) = 3.33, p = 0.053), aroma (F(2,28) = 2.14, p = 0.151) or overall acceptability (F(2,28) = 2.70, p = 0.099). Texture differed significantly between the concentrations (F(2,28) = 6.79, p = 0.005), the score rising from 6.33 ± 1.91 at 2% to 7.13 ± 2.33 at 3% and 7.87 ± 2.23 at 4%, although only the 2% and 4% samples differed from each other (Tukey, p = 0.003) and the 3% sample differed significantly from neither (p > 0.05). Across all samples, texture and color received the highest ratings (6.33 to 7.87 and 6.80 to 7.33, respectively), both around the “moderately acceptable” level. Aroma and overall acceptability were rated at 5.80 to 6.73, and taste and flavor received the lowest scores, at 5.00 to 6.07, around the “slightly acceptable” level.
Figure 3.
Sensory evaluation of kefir produced from almond milk (KAM) at 2%, 3% and 4% (w/v) kefir-grain concentration. Data are presented as the mean ± SD for six attributes scored on a 10-point hedonic scale (10 = excellent, 1 = rejected) by 15 assessors (n = 15). No significant differences were detected among the samples for any attribute except texture, which was rated higher at 4% than at 2% (repeated-measures ANOVA, p = 0.005; Tukey, p = 0.003).
3.4. Fecal Microbial Counts
The culturable microbial counts in the feces of the NC, PA and KAM groups over the 21-day feeding period are presented in Table 3 and were analyzed by repeated-measures two-way ANOVA with experimental group and sampling day as factors. The total viable count (PCA) did not differ significantly among the three groups (p > 0.05; group means 8.11 to 8.44 log10 CFU/g), although it varied significantly over the feeding period (p < 0.001), falling to 7.41 log10 CFU/g at day 7 and reaching 8.90 log10 CFU/g at day 21. Lactic acid bacteria (MRS), by contrast, differed significantly among the groups (p < 0.001), the KAM group carrying the highest counts (8.55 ± 0.22 log10 CFU/g), followed by NC (8.08 ± 0.44) and PA (7.89 ± 0.26). Here the KAM group differed significantly from both NC (Tukey, p = 0.003) and PA (Tukey, p < 0.001), whereas NC and PA did not differ from each other (p > 0.05), and the group × day interaction was also significant (p = 0.002). Because the three groups already differed at day 0 (p = 0.009), these counts were also analyzed by analysis of covariance with the day 0 count as a covariate. The group effect remained significant after this adjustment (F(2,5) = 34.58, p = 0.001), while the covariate itself was not significant (F(1,5) = 0.66, p = 0.454). The adjusted means were 8.61 log10 CFU/g for KAM, 8.26 for NC and 7.90 for PA, the kefir group remaining significantly higher than the plain almond milk group (p = 0.002) but no longer differing significantly from the untreated control (p = 0.071).
Table 3.
Culturable microbial counts (log10 CFU/g) in the feces of the normal control (NC), plain almond milk (PA) and kefir produced from almond milk (KAM) groups over the 21-day feeding period.
Counts on MRS-LP followed the pattern seen for the total viable count, showing no significant difference among the groups (p > 0.05; NC 7.46 ± 0.45, PA 7.16 ± 0.70 and KAM 7.15 ± 0.44 log10 CFU/g) while increasing significantly over the feeding period (p < 0.001), from 6.67 log10 CFU/g at day 0 to 7.71 log10 CFU/g at day 21. Yeast and mold counts (SDA), on the other hand, differed significantly among the groups (p = 0.027), the normal control carrying the highest counts (7.04 ± 0.36 log10 CFU/g) and differing from both KAM (6.59 ± 0.29; Tukey, p = 0.044) and PA (6.56 ± 0.60; Tukey, p = 0.028), while KAM and PA again did not differ from each other (p > 0.05); these counts likewise rose over the feeding period (p < 0.001), with no significant group × day interaction (p > 0.05). Finally, coliforms (VRBA) were below the detection limit in 11 of the 36 fecal samples (31%), including all nine samples collected at day 7, and where detectable they ranged from 5.85 to 7.35 log10 CFU/g, values obtained from 1 to 25 colonies on the single dilution plated, with no consistent pattern across groups or sampling days, and were therefore summarized descriptively rather than analyzed statistically.
3.5. Sequencing Output and Alpha Diversity of the Colonic Microbiota
Rarefaction to a uniform depth of 157,011 reads per sample left Good’s coverage at 0.999 or above in all nine samples, and the number of observed amplicon sequence variants (ASVs) ranged from 586 to 998 per sample.
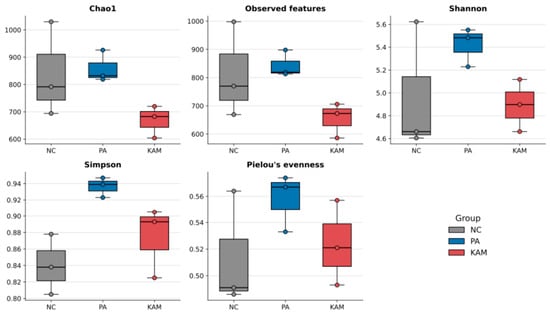
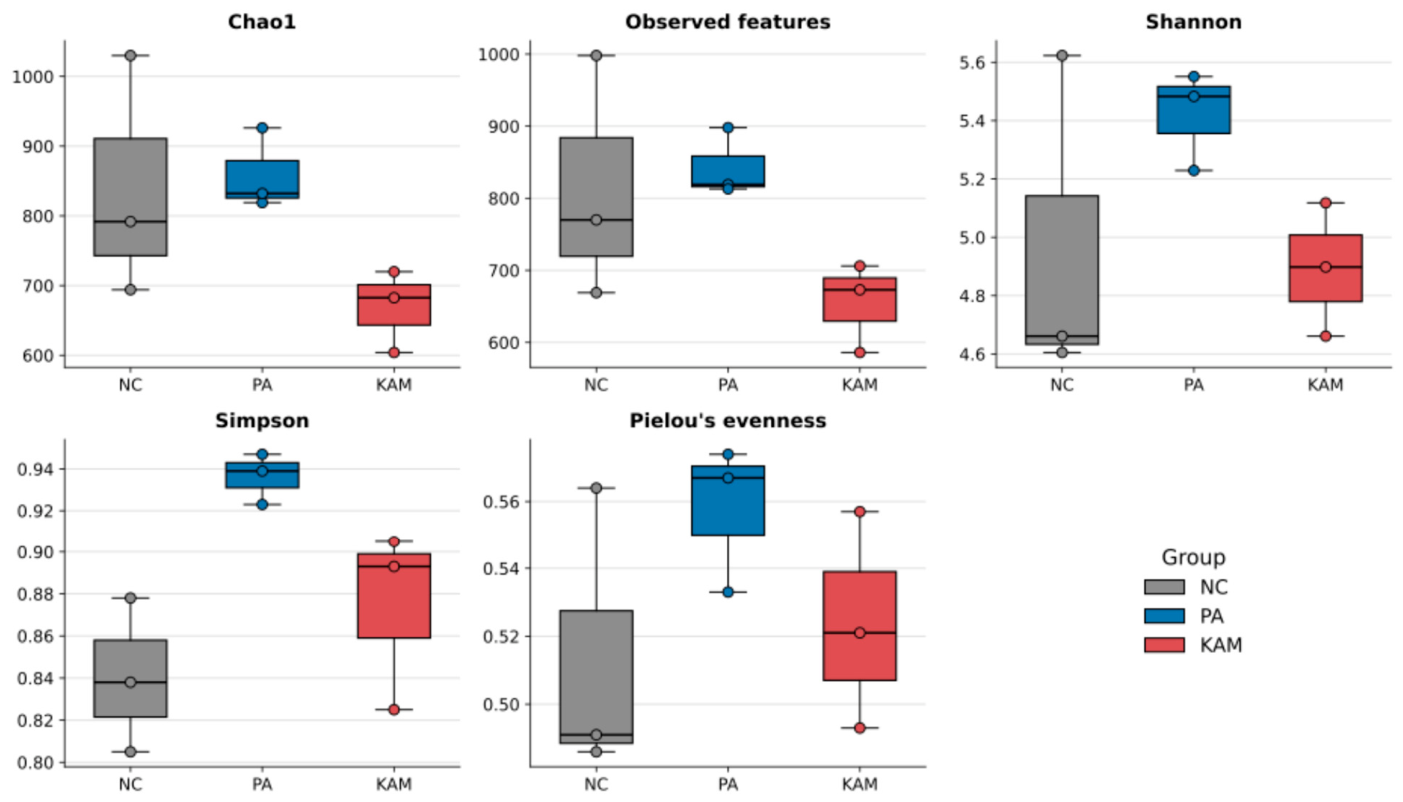
None of the six alpha-diversity indices differed significantly among the NC, PA and KAM groups (Kruskal–Wallis, p > 0.05; Figure 4). The PA group nevertheless returned the numerically highest value for each of the five diversity indices, reaching 859 ± 58 for Chao1, 843 ± 47 for observed features, 5.42 ± 0.17 for Shannon, 0.94 ± 0.01 for Simpson and 0.56 ± 0.02 for Pielou’s evenness. Richness was numerically lowest in the KAM group (Chao1 669 ± 59; observed features 655 ± 62), whereas the lowest values for Simpson (0.84 ± 0.04) and Pielou’s evenness (0.51 ± 0.04) were recorded in the NC group.
Figure 4.
Alpha diversity of the colonic luminal microbiota of the normal control (NC), plain almond milk (PA) and kefir produced from almond milk (KAM) groups (n = 3 per group). Boxes show the median and interquartile range, whiskers the full range, and points the individual animals. No index differed significantly among the groups (Kruskal–Wallis, p > 0.05).
3.6. Beta Diversity of the Colonic Microbiota
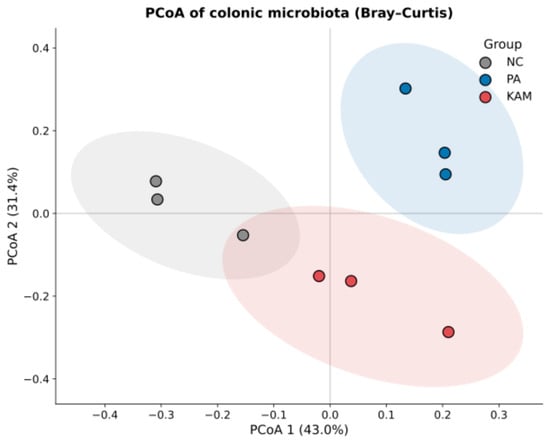
The overall community structure separated the three groups on every distance metric examined. PERMANOVA returned a pseudo-F of 5.66 (p = 0.004) for Bray–Curtis, 3.28 (p = 0.005) for weighted UniFrac and 1.35 (p = 0.004) for unweighted UniFrac, and ANOSIM agreed in each case (R = 0.89, p = 0.004; R = 0.53, p = 0.004; and R = 0.18, p = 0.011, respectively). Multivariate dispersion was homogeneous among the groups for Bray–Curtis (PERMDISP F = 0.43, p = 0.819) and for weighted UniFrac (F = 0.36, p = 0.870) but differed significantly among them for unweighted UniFrac (F = 20.24, p = 0.036).
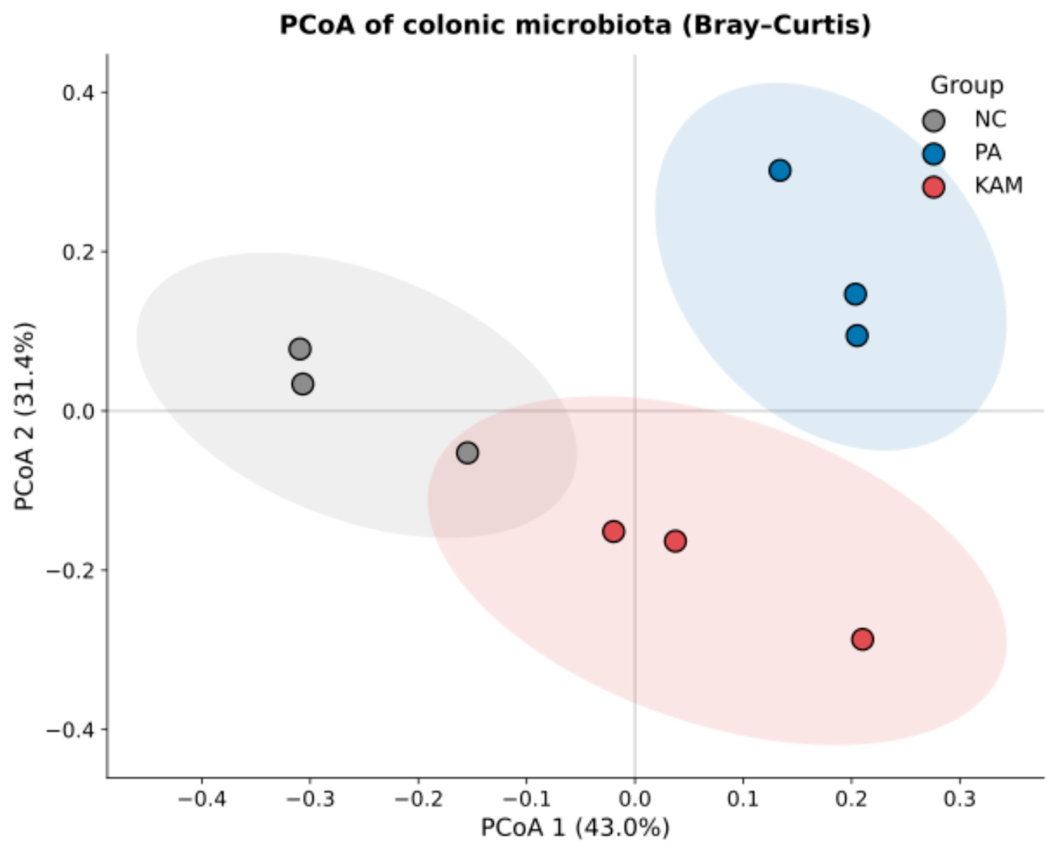
The first two axes of the principal coordinates analysis of the Bray–Curtis distances accounted for 43.0% and 31.4% of the total variation (Figure 5). Each group occupied a distinct region of the ordination: the three NC animals lay on the negative side of the first axis, the three PA animals on the positive side of both axes, and the three KAM animals below the origin on the second axis.
Figure 5.
Principal coordinates analysis (PCoA) of the Bray–Curtis distances between the colonic luminal communities of the normal control (NC), plain almond milk (PA) and kefir produced from almond milk (KAM) groups (n = 3 per group). Shaded areas are 95% confidence ellipses.
3.7. Taxonomic Composition of the Colonic Microbiota
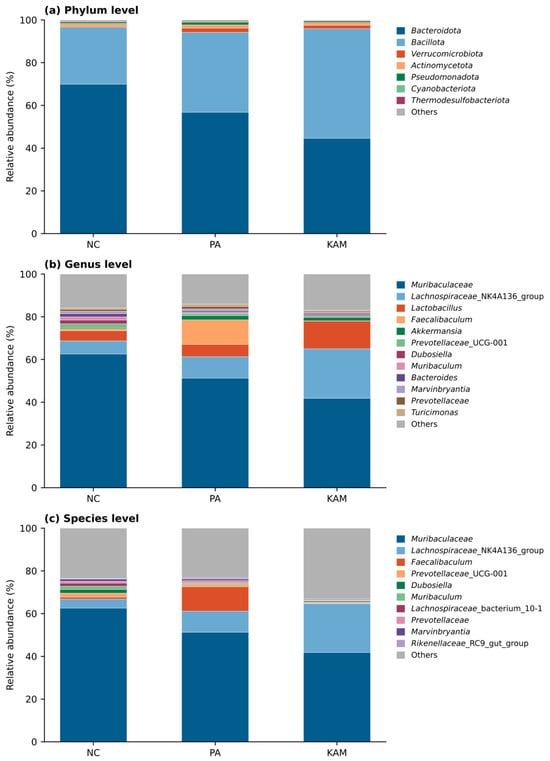
Two phyla, Bacteroidota and Bacillota, made up more than 94% of the colonic community in every group (Figure 6a). The two phyla were ordered in opposite directions across the three groups. Bacteroidota accounted for 70.0% in NC, 56.8% in PA and 44.6% in KAM, while Bacillota accounted for 26.6%, 37.4% and 51.3%, respectively, so that Bacillota outnumbered Bacteroidota only in the kefir-fed animals. Verrucomicrobiota, essentially all of it Akkermansia, remained a minor component in every group (NC 0.4%, PA 2.0%, KAM 1.6%) and varied widely between animals within each group (0.0 to 1.2% in NC, 0.3 to 4.3% in PA and 0.4 to 3.7% in KAM).
Figure 6.
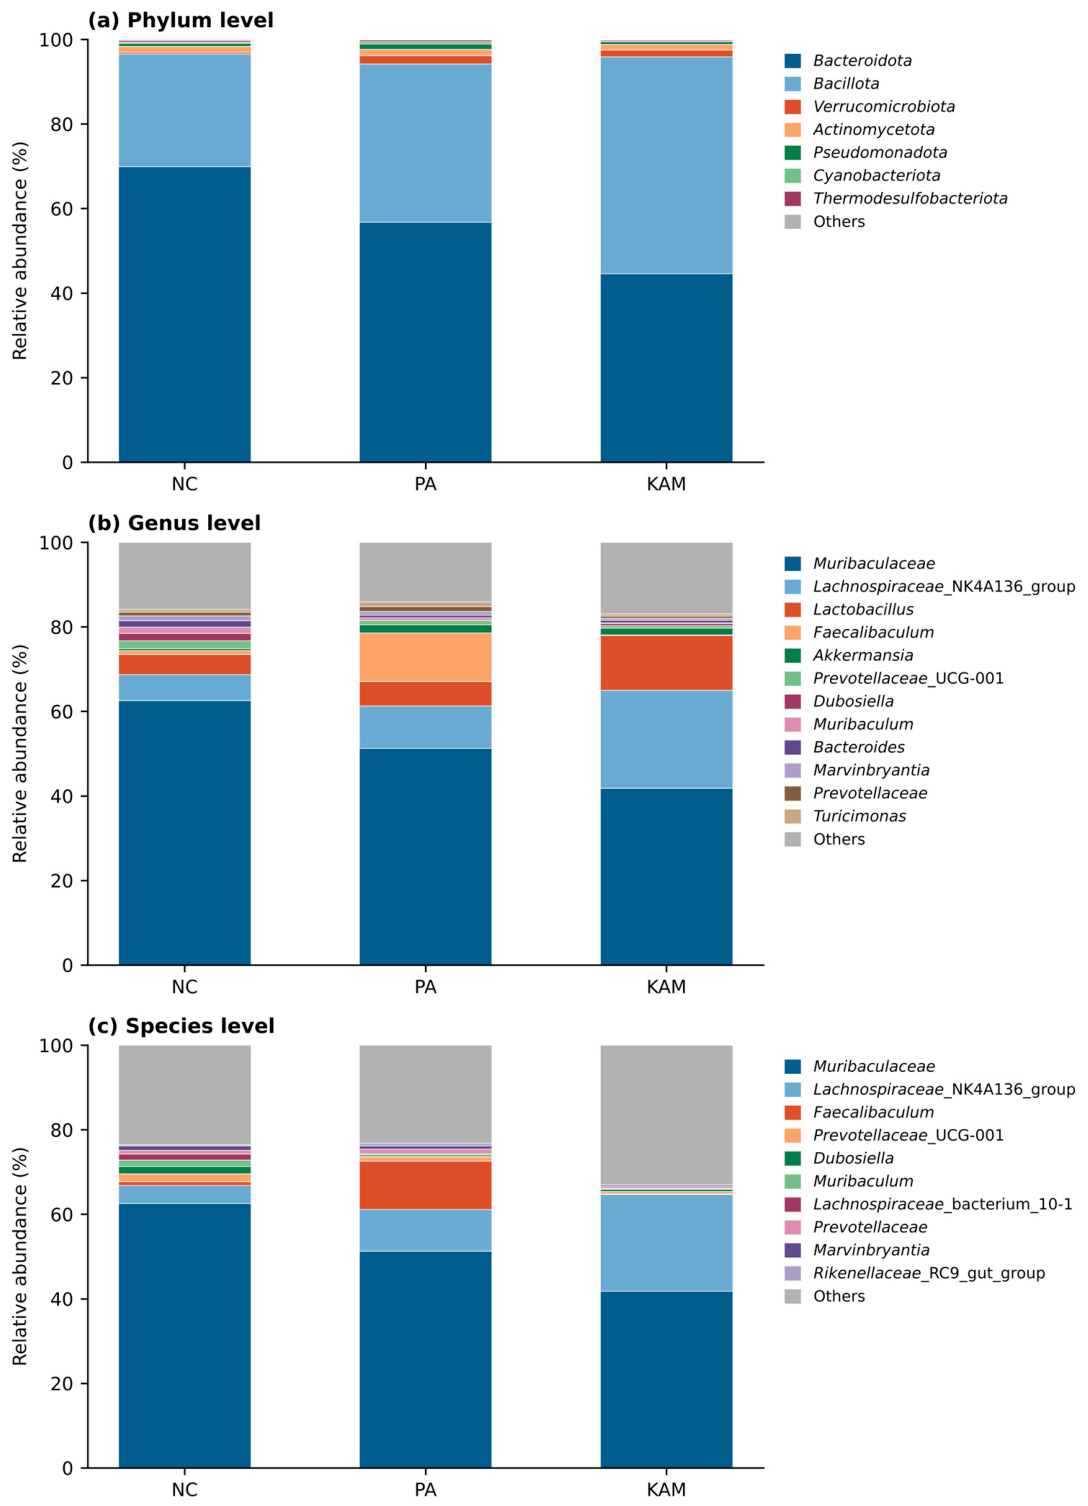
Relative abundance of the colonic luminal microbiota of the normal control (NC), plain almond milk (PA) and kefir produced from almond milk (KAM) groups at the (a) phylum, (b) genus and (c) species levels. Values are group means (n = 3 per group); taxa below the displayed ranks are pooled as Others.
At the genus level the community was dominated by unclassified Muribaculaceae in all three groups, although its share was 62.6% in NC, 51.3% in PA and 41.8% in KAM (Figure 6b). Lactobacillus showed the most consistent group difference, at 13.0% in KAM against 4.8% in NC and 5.8% in PA, and the three kefir-fed animals (10.1%, 12.6% and 16.3%) each exceeded every animal in the other two groups. Faecalibaculum showed the opposite pattern, at 11.5% in PA (7.6 to 16.5% across the three animals) against 0.9% in NC and 0.1% in KAM. The Lachnospiraceae NK4A136 group averaged 6.1%, 10.0% and 23.2% in NC, PA and KAM, respectively, but was highly variable between animals (1.2 to 10.4%, 0.8 to 14.9% and 10.2 to 40.3%). At the species level most of the abundant taxa remained unclassified (Figure 6c).
3.8. LEfSe Analysis of Differentially Abundant Taxa
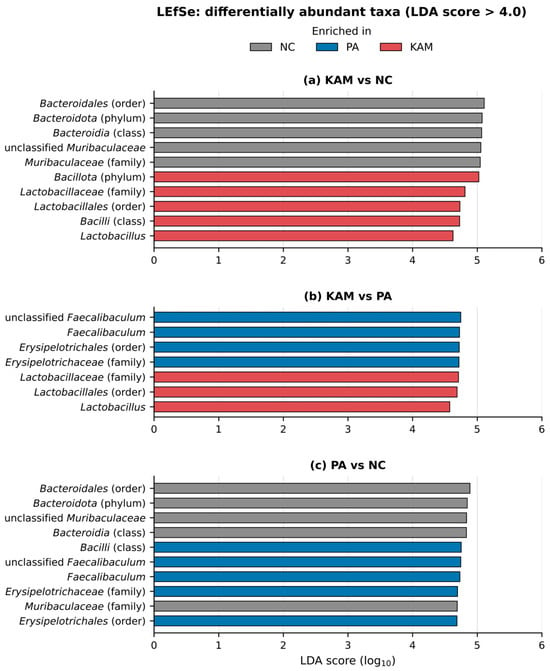
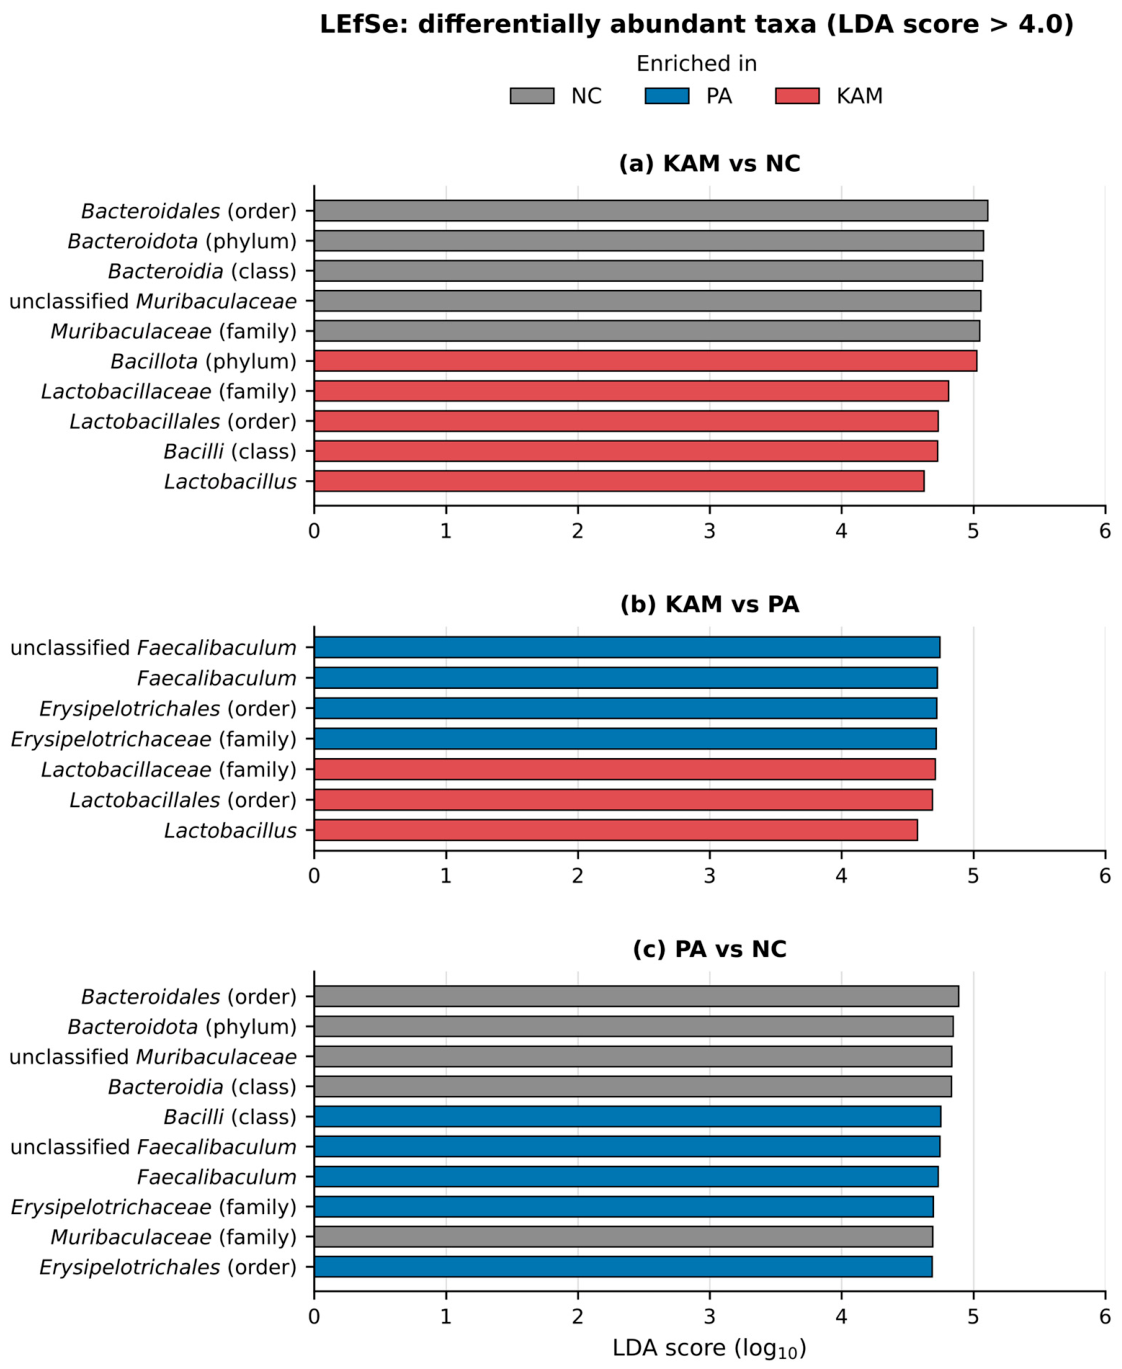
LEfSe was run on each pair of groups to identify the taxa that discriminated them at an LDA score above 4.0. Against the normal control, the kefir-fed group was enriched in the phylum Bacillota (LDA 5.03) and, nested within it, the class Bacilli, the order Lactobacillales, the family Lactobacillaceae and the genus Lactobacillus (LDA 4.62), whereas the control was enriched in the phylum Bacteroidota and the nested Bacteroidia, Bacteroidales and Muribaculaceae (LDA 5.05 to 5.11) (Figure 7a).
Figure 7.
Taxa discriminating the normal control (NC), plain almond milk (PA) and kefir produced from almond milk (KAM) groups by LEfSe (LDA score > 4.0) in the three pairwise comparisons: (a) KAM versus NC, (b) KAM versus PA and (c) PA versus NC. Bars are colored by the group in which the taxon was enriched.
The same lineage separated the kefir group from the plain almond milk group: Lactobacillaceae, Lactobacillales and Lactobacillus were enriched in KAM (LDA 4.58 to 4.71), whereas Faecalibaculum and the Erysipelotrichaceae to which it belongs were enriched in PA (LDA 4.72 to 4.74) (Figure 7b). The comparison between the plain almond milk group and the normal control returned the same Faecalibaculum and Erysipelotrichaceae signal on the PA side, together with the class Bacilli, and the Bacteroidota lineage on the NC side (Figure 7c). The Lachnospiraceae NK4A136 group did not reach the LDA threshold in any of the three comparisons.
4. Discussion
4.1. Physicochemical, Microbiological and Sensory Properties of Kefir Produced from Almond Milk
The almond milk used here was slightly alkaline before fermentation (pH 7.78) and had a negligible titratable acidity, its starting pH being close to the 7.68 reported by La Torre et al. [7] for a comparable commercial almond beverage. Kefir fermentation acidified it to between 4.70 and 5.78 and raised titratable acidity from 0.01% to as much as 0.14% lactic acid, the endpoint depending on the amount of grain added. At 4% (w/v) the product reached pH 4.74 on day 0, close to the 4.71 that La Torre et al. [7] obtained from almond milk after 24 h with 10% (w/v) milk kefir grains. Chen et al. [29] reported a fall in soy milk pH from 6.65 to 4.39 with milk kefir grains under conditions close to those used here, 24 h at 25 °C, indicating that a somewhat lower endpoint is attainable in a plant matrix, although their substrate was also markedly less alkaline at the outset. The titratable acidity of the 4% formulation was slightly below the 0.17% lactic acid reported for that product [7], whose unfermented form had also started from a higher baseline (0.11% against 0.01% here). The lower grain concentrations gave a less acidic product, the 2% and 3% formulations stopping at pH 5.27 and 5.08, above the endpoints reported in both studies cited above.
Neither pH nor acidity changed significantly over 14 days at 4 °C, and the viable populations were equally stable, the mean for every medium lying between 8.2 and 8.7 log10 CFU/mL irrespective of grain concentration or storage time. The absence of post-acidification contrasts with what has been reported for some other fermented plant beverages, since Ceylan and Öncül [30] recorded a falling pH across 7 days in kefirs made from oat, soy and coconut milk, and Al Zahrani et al. [31] found significant post-acidification in probiotic-fermented almond milk over 21 days. Almond beverages carry no lactose and a limited amount of free sugar, with 1.8 g/100 mL of sucrose measured in commercial almond alternatives against 4.6 g/100 mL of lactose in cow milk [32], which is consistent both with the low acidity reached here and with the absence of further acid production during storage. The lactic acid bacteria count of 8.66 log10 CFU/mL is close to the 8.3 log10 CFU/mL recovered on MRS agar from almond extract fermented with water kefir grains [11] and falls within the 7.88 to 9.37 log10 CFU/mL reported for lactobacilli in plant kefirs [30]. Lower counts have been reported by Al Zahrani et al. [31], who recovered 5.9 to 6.8 log10 CFU/mL with a defined two-strain starter. Together these comparisons place the counts obtained here at the upper end of the range reported for fermented plant beverages. The very low load measured in the unfermented milk is consistent with the 3 to 4 log10 CFU/mL enumerated in unfermented controls elsewhere [31], a level lying below the 6.00 log10 CFU/mL detection limit of the method applied here.
Grain concentration affected only the texture of the product, which was rated higher at 4% than at 2%, while taste, color, flavor, aroma and overall acceptability did not differ between the three concentrations. The panel rated texture and color highest, around the moderately acceptable level, while taste and flavor received the lowest scores. Overall acceptability lay between these extremes, at 5.80 to 6.73, so that the product was rated between the slightly and moderately acceptable levels. Ustaoğlu-Gençgönül et al. [11] similarly found their almond-based beverage to be the best accepted of the three plant extracts they fermented, the chickpea and rice products falling below the general level of acceptance.
4.2. Fecal Microbial Counts
Culture-based enumeration separated the kefir group from the other two on MRS agar. The KAM group carried 8.55 ± 0.22 log10 CFU/g, significantly more than both the untreated control (8.08 ± 0.44; Tukey, p = 0.003) and the plain almond milk group (7.89 ± 0.26; p < 0.001), while the two non-kefir groups did not differ from each other, so the difference is associated with the fermented product rather than with the almond milk base. A comparable pattern has been reported for another fermented plant beverage enumerated on the same medium, the highest Lactobacillus count among the treated groups, 6.68 log10 CFU/mL on MRS agar, being recorded in rats gavaged with fermented soy milk [33]. Using DNA-based quantification rather than plate counts, Kim et al. [34] likewise found significantly greater Lactobacillus and Lactococcus in mice given kefir orally for three weeks. The separation observed here was, however, already present at the first sampling, and the kefir group remained the highest at every subsequent time point, so it does not represent a shift that accumulated over the feeding period. When the day 0 counts were included as a covariate, the difference from the plain almond milk group remained significant (p = 0.002), whereas the difference from the untreated control did not (p = 0.071). Because the day 0 samples were collected 1 h after the first gavage, they do not represent a pretreatment baseline, so this adjustment controls for early post-gavage counts rather than for true baseline values. The higher lactic acid bacterial counts in the kefir group are therefore reported as an association with kefir administration rather than as an effect established over the feeding period.
Counts on MRS-LP did not differ among the groups. This departs from the fermented soy milk study cited above [33], in which 7.01 log10 CFU/mL was recorded on MRS-LP agar in rats given fermented soy milk against 5.66 to 6.05 in the comparison groups, one of which received unfermented soy milk; those animals, however, carried chemically induced colitis rather than being healthy. Both the MRS-LP counts, and the total viable counts changed significantly over the feeding period, rising between the first and the last sampling day in all three groups, including the untreated control, which points to a background temporal change rather than to a treatment effect.
Yeast and mold counts followed the opposite pattern. The untreated control carried the highest counts (7.04 ± 0.36 log10 CFU/g) and differed significantly from both the plain almond milk group (6.56 ± 0.60; p = 0.028) and the kefir group (6.59 ± 0.29; p = 0.044), which were indistinguishable from each other. The reduction was therefore common to both gavaged groups and was not specific to the fermented product. Because the control animals received no gavage, the present design cannot separate an effect of the almond milk itself from an effect of the daily gavage, but it does exclude fermentation as the cause. The direction also runs counter to Kim et al. [34], who found total yeast to be significantly higher in kefir-fed mice, a discrepancy that may reflect the viability and dose of the yeasts carried by the respective products. Coliforms lay below the detection limit in roughly one third of the samples and followed no consistent pattern across groups or sampling days and were therefore summarized descriptively.
4.3. Modulation of the Colonic Luminal Microbiota by Kefir Feeding
A previous study from our laboratory [35] characterized the same batch of kefir grains and found the bacterial community to be dominated by Lactobacillus (92.5%), almost entirely Lactobacillus kefiranofaciens, and the fungal community by Kluyveromyces marxianus.
Kefir feeding left the alpha diversity of the colonic luminal community unchanged but altered its overall structure, none of the six indices differing among the groups while the three groups separated significantly on all three-distance metrics. The same pattern has been reported for the closest available plant-based comparison in rodents. Mice gavaged with kefir-fermented soy milk for 30 days showed no change in the Ace and Chao1 richness indices (p > 0.05) while principal coordinates analysis separated the groups (p = 0.013), the fermented group being distinct from the control whereas the control and the unfermented soy milk group were not [12]. The Shannon and Simpson indices in that study did shift toward greater evenness, which was not observed here. The dispersion test qualified one of the three metrics in the present data, being homogeneous for Bray–Curtis and weighted UniFrac but significant for unweighted UniFrac, so the separation on that metric may partly reflect unequal within-group variability, whereas the Bray–Curtis and weighted UniFrac results are not subject to that reservation.
At the phylum level the community moved from a Bacteroidota-dominated toward a Bacillota-dominated profile, Bacteroidota falling from 70.0% in the control to 44.6% in the kefir group while Bacillota rose from 26.6% to 51.3%. This direction again agrees with the soy milk kefir study cited above [12], in which Bacillota increased in the mice given the fermented product. It is, however, the reverse of what Kim et al. [34] observed with dairy kefir in mice, where Bacillota fell and Bacteroidota rose. The two reports differ in substrate, dose and quantification method, and the discrepancy cannot be resolved from composition alone.
The clearest taxonomic signal was Lactobacillus, which reached 13.0% in the kefir group against 4.8% in the control and 5.8% in the plain almond milk group, every kefir-fed animal exceeding every animal in the other two groups. LEfSe selected the Lactobacillus lineage as discriminating the kefir group from both comparators, from the phylum Bacillota down to the genus against the untreated control and from the order Lactobacillales down to the genus against the plain almond milk group. The enrichment of this genus in the kefir-fed group is therefore consistent with an effect of the kefir-associated microbial community, although the present data cannot distinguish transient passage of ingested organisms from changes in the resident population. The Lachnospiraceae NK4A136 group rose numerically from 6.1% in the control to 23.2% in the kefir group, the direction reported by Albuquerque Pereira et al. [9] for butyrate-associated Lachnospiraceae after milk kefir feeding in mice, but individual animals ranged from 10.2% to 40.3% and the taxon did not reach the LEfSe threshold in any comparison, so it is reported here as a trend rather than as a discriminating feature.
The plain almond milk group was distinguished by a different organism. Faecalibaculum reached 11.5% there, against 0.9% in the control and 0.1% in the kefir group, with no overlap between the groups, and LEfSe selected it and the Erysipelotrichaceae to which it belongs as markers of that group against both others. Members of the genus Faecalibaculum, including F. rodentium, have been reported as murine gut commensals [36]. Its enrichment by the unfermented beverage and its near-absence after fermentation indicate that the almond milk base and the fermented product acted on the luminal community in different directions, and because the two products were compared within the same experiment this difference is consistent with an effect of fermentation-associated changes in the almond milk product. The kefir was, however, administered after 7 days of refrigerated storage whereas the plain almond milk was not, so this comparison cannot separate an effect of storage from an effect of fermentation.
5. Conclusions
This study characterized kefir produced from almond milk and examined its association with the gut microbiota in mice. Fermentation lowered the pH of the almond milk from 7.78 to 4.74–5.27 at day 0, depending on the kefir-grain concentration, while pH values across formulations and the storage period ranged from 4.70 to 5.78. The product maintained stable acidity and microbial counts over 14 days of refrigerated storage, with mean viable counts of 8.2 to 8.7 log10 CFU/mL across four culture media. Overall acceptability scores ranged from 5.80 to 6.73 and did not differ significantly among grain concentrations. In mice, administration of 3% (w/v) almond milk kefir was associated with higher fecal lactic acid bacterial counts than those observed in the untreated control and plain almond milk groups. After adjustment for the counts measured on day 0, the difference remained significant compared with the plain almond milk group but not the untreated control (p = 0.071). Analysis of the colonic luminal microbiota showed no differences in alpha diversity, whereas beta-diversity analysis suggested differences in community composition. Bacillota predominated over Bacteroidota only in the kefir group, which also showed a higher relative abundance of Lactobacillus. LEfSe further identified Lactobacillus as a discriminating taxon in the kefir group in an exploratory analysis. Overall, these findings provide preliminary evidence of an association between administering almond milk kefir and differences in colonic microbiota composition in mice. Given the small number of animals analyzed, these findings should be interpreted cautiously and do not establish a beneficial effect on intestinal health.
However, day-0 samples were collected 1 h after the first gavage and therefore did not represent pretreatment baseline measurements. No baseline microbiota sequencing was performed. Consequently, the comparison with the plain almond milk group, which was matched for both the gavage procedure and almond milk base, provides the more relevant basis for interpreting the observed differences. Furthermore, because each experimental group was housed in a single cage, cage and treatment effects were confounded, preventing attribution of the observed differences to kefir alone. Further studies using independent cage replicates and baseline microbiota profiling are needed to confirm these observations.
A limitation of this study is the small number of animals used for the sequencing analysis. Three mice per group were analyzed, which limits the statistical power available to detect smaller differences between the groups. Both the beta-diversity and LEfSe findings should be interpreted as exploratory. With three animals per group, the smallest attainable p-value in the test underlying LEfSe was 0.0495. All taxa that passed the LDA threshold had this same p-value. Therefore, the LEfSe findings should be interpreted cautiously, particularly in the absence of multiple-testing correction. Each group also occupied one cage, so cage and treatment group cannot be separated, and part of the similarity between animals within a group may reflect the exchange of gut microorganisms between cage mates. Because the untreated control group did not undergo gavage, comparisons with this group cannot distinguish the effects of the administered products from any potential effects of the gavage procedure. In addition, the kefir was administered after 7 days of refrigerated storage, whereas the plain almond milk was not stored before administration, so differences between the KAM and PA groups cannot be attributed to fermentation alone. No significant changes in pH, titratable acidity, or viable counts were detected over 14 days of refrigerated storage. Thus, the kefir administered after 7 days remained within the measured physicochemical and microbiological stability range, although unmeasured properties may have changed during storage. The beverage given to the animals was not sequenced, so the previously reported grain composition may not represent the community present in the product after fermentation and storage. The colonic luminal microbiota was sequenced only at the end of the feeding period, so the differences between the groups cannot be attributed with certainty to changes that occurred over the course of the intervention. Future studies involving larger groups, independent cage replicates, baseline microbiota profiling, and strain-resolved sequencing of both the administered kefir and colonic microbiota are needed to determine whether the enriched Lactobacillus originated from the kefir or from the resident microbiota.
Author Contributions
M.A.A.: Resources, Formal analysis, Data curation, Validation, Software, Writing—original draft. A.B.S.: Conceptualization, Visualization, Project administration, Supervision, Data curation, Writing—original draft, Writing—review and editing. All authors have read and agreed to the published version of the manuscript.
Funding
This work was supported by the King Abdulaziz University (grant number IPP: 49-247-2026).
Institutional Review Board Statement
The study was approved by the Animal Care and Use Committee (ACUC) of King Fahd Medical Research Center (approval no. ACUC-25-09-17, 25 September 2025). Ethical Approval: All animal experiments were conducted in accordance with the ethical guidelines for the care and use of laboratory animals and were approved by the appropriate institutional animal ethics committee (Approval No. ACUC-25-09-17). Clinical Trial Number: Not applicable.; Consent to participate: Not applicable. Consent to publish: Not applicable.
Informed Consent Statement
Not applicable.
Data Availability Statement
The original contributions presented in this study are included in the article. Further inquiries can be directed to the corresponding author.
Acknowledgments
This project was funded by the Deanship of Scientific Research (DSR), King Abdulaziz University, Jeddah, under grant No. (IPP: 49-247-2026). The authors, therefore, gratefully acknowledge the DSR technical and financial support.
Conflicts of Interest
The authors declare no conflict of interest.
References
- Drolet-Labelle, V.; Lee, J.; Provencher, V.; Vanderlee, L. Dairy and Plant-Based Beverages Purchased by Canadian Households between 2018 and 2020. Br. J. Nutr. 2026, 1–12. [Google Scholar] [CrossRef] [Scilit] [PubMed]
- Moore, S.S.; Costa, A.; Pozza, M.; Vamerali, T.; Niero, G.; Censi, S.; De Marchi, M. How Animal Milk and Plant-Based Alternatives Diverge in Terms of Fatty Acid, Amino Acid, and Mineral Composition. npj Sci. Food 2023, 7, 50. [Google Scholar] [CrossRef] [Scilit] [PubMed]
- Alali, M.A.; Shori, A.B. Understanding the Human Gut Microbiome: From Composition to Disease Association. Front. Microbiomes 2026, 5, 1717288. [Google Scholar] [CrossRef] [Scilit] [PubMed]
- Cakebread, J.; Wallace, O.A.; Henderson, H.; Jauregui, R.; Young, W.; Hodgkinson, A. The Impacts of Bovine Milk, Soy Beverage, or Almond Beverage on the Growing Rat Microbiome. PeerJ 2022, 10, e13415. [Google Scholar] [CrossRef] [Scilit] [PubMed]
- Marsh, A.J.; O’Sullivan, O.; Hill, C.; Ross, R.P.; Cotter, P.D. Sequencing-Based Analysis of the Bacterial and Fungal Composition of Kefir Grains and Milks from Multiple Sources. PLoS ONE 2013, 8, e69371. [Google Scholar] [CrossRef] [Scilit] [PubMed]
- Alali, M.A.; Shori, A.B. Recent Advances in the Modulatory Effects of Kefir on the Gut Microbiota. Explor. Foods Foodomics 2025, 3, 1010107. [Google Scholar] [CrossRef] [Scilit]
- La Torre, C.; Caputo, P. Fazio A Effect of Milk and Water Kefir Grains on the Nutritional Profile and Antioxidant Capacity of Fermented Almond Milk. Molecules 2025, 30, 698. [Google Scholar] [CrossRef] [Scilit] [PubMed]
- Choi, Y.; Keum, G.B.; Kang, J.; Doo, H.; Kwak, J.; Kim, H.; Chae, Y.; Lee, S.; Yang, H.; Kim, S.; et al. Evaluation of Kefir Consumption on Gut Microbial Diversity in a Healthy Young Population Using Full-Length 16S rRNA Sequencing. Front. Microbiol. 2025, 16, 1587831. [Google Scholar] [CrossRef] [Scilit] [PubMed]
- Albuquerque Pereira, M.F.; Morais de Ávila, L.G.; Ávila Alpino, G.C.; dos Santos Cruz, B.C.; Almeida, L.F.; Macedo Simões, J.; Bernardes, A.L.; Campos, I.X.; Ribon, A.d.O.B.; Mendes, T.A.d.O.; et al. Milk Kefir Alters Fecal Microbiota Impacting Gut and Brain Health in Mice. Appl. Microbiol. Biotechnol. 2023, 107, 5161–5178. [Google Scholar] [CrossRef] [Scilit] [PubMed]
- Şahin, A.; Buran, İ.; Akal, C. Use of Almond Milk, Almond Skin and Plant Based Probiotics on Newly Developed Kefir: Physical, Chemical, Microbiological, and Functional Properties. Food Sci. Nutr. 2025, 13, e70719. [Google Scholar] [CrossRef] [Scilit] [PubMed]
- Ustaoğlu-Gençgönül, M.; Gökırmaklı, Ç.; Üçgül, B.; Karagül-Yüceer, Y.; Guzel-Seydim, Z.B. Chemical, Microbial, and Volatile Compounds of Water Kefir Beverages Made from Chickpea, Almond, and Rice Extracts. Eur. Food Res. Technol. 2024, 250, 2233–2244. [Google Scholar] [CrossRef] [Scilit]
- Wang, X.; Zhang, J.; Ge, J.; Wu, D.; Shao, M.; Huang, X.; Chen, Z. Kefir-Fermented Soymilk Reduces Exercise-Induced Fatigue in Mice by Influencing the Gut Microbiota and Short-Chain Fatty Acid Metabolism. Front. Microbiol. 2026, 17, 1881421. [Google Scholar] [CrossRef] [Scilit] [PubMed]
- Rajah Kumar, M.; Amankwaa, A.O.; Razali, N.S.; Mohamad, N.E.; Khalid, M.; Abdullah, J.O.; Masarudin, M.J.; Osman, M.A.; Rahman, N.M.A.N.A.; Alitheen, N.B. Preliminary Evaluation of the Gut Microbiota Modulatory Potential of Malaysian Kefir Water in Ageing Mice. Foods 2025, 14, 3851. [Google Scholar] [CrossRef] [Scilit] [PubMed]
- de Mel, R.; Al Khafaji, A.H.; Muthusamy, S.; Xu, J. Håkansson Å Changes in Gut Microbiota Composition Following Water Kefir Consumption in Healthy Adults. Sci. Rep. 2026, 16, 16006. [Google Scholar] [CrossRef] [Scilit] [PubMed]
- Van De Wouw, M.; Walsh, C.J.; Vigano, G.M.; Lyte, J.M.; Boehme, M.; Gual-Grau, A.; Crispie, F.; Walsh, A.M.; Clarke, G.; Dinan, T.G.; et al. Kefir Ameliorates Specific Microbiota-Gut-Brain Axis Impairments in a Mouse Model Relevant to Autism Spectrum Disorder. Brain Behav. Immun. 2021, 97, 119–134. [Google Scholar] [CrossRef] [Scilit] [PubMed]
- Shu, G.; Ma, L.; Chen, L.; Guo, M.; Guo, Y.; Chen, H. Goat Milk Kefir with ACE Inhibitory Activity: Preparation and Storage Stability Evaluation. J. Food Process. Preserv. 2020, 44, e14417. [Google Scholar] [CrossRef] [Scilit]
- Shori, A.B.; Aljohani, G.S.; Al-Zahrani, A.J.; Al-Sulbi, O.S.; Baba, A.S. Viability of Probiotics and Antioxidant Activity of Cashew Milk-Based Yogurt Fermented with Selected Strains of Probiotic Lactobacillus Spp. LWT 2022, 153, 112482. [Google Scholar] [CrossRef] [Scilit]
- Atik, A.; Gumus, T. The Effect of Different Doses of UV-C Treatment on Microbiological Quality of Bovine Milk. LWT 2021, 136, 110322. [Google Scholar] [CrossRef] [Scilit]
- Arroum, S.; Sboui, A.; Fguiri, I.; Dbara, M.; Ayeb, N.; Hammadi, M.; Khorchani, T. Influence of Kefir Grain Concentration on the Nutritional, Microbiological, and Sensory Properties of Camel Milk Kefir and Characterization of Some Technological Properties. Fermentation 2025, 11, 170. [Google Scholar] [CrossRef] [Scilit]
- Yilmaz-Ersan, L.; Sahin, S.; Ozcan, T.; Akpinar-Bayizit, A.; Usta-Gorgun, B.; Ciniviz, M.; Keser, G. Interaction of Probiotic Activity, Antioxidative Capacity, and Gamma-Aminobutyric Acid (GABA) in Chestnut Milk-Fortified Yogurt. J. Food Process. Preserv. 2022, 46, e17266. [Google Scholar] [CrossRef] [Scilit]
- Tilahun, T.; Kumera, B.; Kibret, M. Microbial Quality and Hygienic Safety of Avocado Fruit Juice Sold in Merawi Town, Amhara, Ethiopia. J. Food Qual. 2025, 2025, 8892198. [Google Scholar] [CrossRef] [Scilit]
- Bolyen, E.; Rideout, J.R.; Dillon, M.R.; Bokulich, N.A.; Abnet, C.C.; Al-Ghalith, G.A.; Alexander, H.; Alm, E.J.; Arumugam, M.; Asnicar, F.; et al. Reproducible, Interactive, Scalable and Extensible Microbiome Data Science Using QIIME 2. Nat. Biotechnol. 2019, 37, 852–857. [Google Scholar] [CrossRef] [Scilit] [PubMed]
- Callahan, B.J.; McMurdie, P.J.; Rosen, M.J.; Han, A.W.; Johnson, A.J.; Holmes, S.P. DADA2: High-Resolution Sample Inference from Illumina Amplicon Data. Nat. Methods 2016, 13, 581–583. [Google Scholar] [CrossRef] [Scilit] [PubMed]
- Quast, C.; Pruesse, E.; Yilmaz, P.; Gerken, J.; Schweer, T.; Yarza, P.; Peplies, J.; Glöckner, F.O. The SILVA Ribosomal RNA Gene Database Project: Improved Data Processing and Web-Based Tools. Nucleic Acids Res. 2013, 41, D590–D596. [Google Scholar] [CrossRef] [Scilit] [PubMed]
- Lozupone, C.; Knight, R. UniFrac: A New Phylogenetic Method for Comparing Microbial Communities. Appl. Environ. Microbiol. 2005, 71, 8228–8235. [Google Scholar] [CrossRef] [Scilit] [PubMed]
- Anderson, M.J.A. New Method for Non-Parametric Multivariate Analysis of Variance. Austral Ecol. 2001, 26, 32–46. [Google Scholar] [CrossRef] [Scilit]
- Clarke, K.R. Non-Parametric Multivariate Analyses of Changes in Community Structure. Aust. J. Ecol. 1993, 18, 117–143. [Google Scholar] [CrossRef] [Scilit]
- Segata, N.; Izard, J.; Waldron, L.; Gevers, D.; Miropolsky, L.; Garrett, W.S.; Huttenhower, C. Metagenomic Biomarker Discovery and Explanation. Genome Biol. 2011, 12, R60. [Google Scholar] [CrossRef] [Scilit] [PubMed]
- Chen, Z.; Li, Q.; Li, F.; Yin, L.; Wang, L.; Ye, T.; Wang, Y.; Fu, S.; Wang, W.; Huang, X. Evolution in a Plant Matrix: Adaptive Reshaping of Kefir Grains Microbiota and Function during Long-Term Soymilk Culture. Front. Microbiol. 2025, 16, 1614639. [Google Scholar] [CrossRef] [Scilit] [PubMed]
- Ceylan, B. Öncül N Production of Probiotic Kefir from Different Plant-Based Milks. Cogent Food Agric. 2025, 11, 2458351. [Google Scholar] [CrossRef] [Scilit]
- Al Zahrani, A.J.; Shori, A.B.; Altammar, K.A. Synergistic Evaluation of Lactobacilli on Probiotic Viability and Antioxidant Properties in Almond and Cow Milk. Fermentation 2025, 11, 616. [Google Scholar] [CrossRef] [Scilit]
- Antunes, I.; Roseiro, C.; Bexiga, R.; Pinto, C.; Lageiro, M.; Gonçalves, H.; Quaresma, M. Carbohydrate Composition of Cow Milk and Plant-Based Milk Alternatives. J. Dairy Sci. 2025, 108, 164–172. [Google Scholar] [CrossRef] [Scilit] [PubMed]
- Al Zahrani, A.J.; Shori, A.B.; Al-Judaibi, E. Fermented Soymilk with Probiotic Lactobacilli and Bifidobacterium Strains Ameliorates Dextran-Sulfate-Sodium-Induced Colitis in Rats. Nutrients 2024, 16, 3478. [Google Scholar] [CrossRef] [Scilit] [PubMed]
- Kim, D.H.; Chon, J.W.; Kim, H.; Seo, K.H. Modulation of Intestinal Microbiota in Mice by Kefir Administration. Food Sci. Biotechnol. 2015, 24, 1397–1403. [Google Scholar] [CrossRef] [Scilit]
- Alali, M.A.; Shori, A.B. Microbiological and Sensory Characterization of Kefir Produced from Camel Milk and Its Modulation of the Gut Microbiota in Mice. Front. Nutr. 2026, 13, 1959512. [Google Scholar] [CrossRef] [Scilit]
- Zagato, E.; Pozzi, C.; Bertocchi, A.; Schioppa, T.; Saccheri, F.; Guglietta, S.; Fosso, B.; Melocchi, L.; Nizzoli, G.; Troisi, J.; et al. Endogenous Murine Microbiota Member Faecalibaculum Rodentium and Its Human Homologue Protect from Intestinal Tumour Growth. Nat. Microbiol. 2020, 5, 511–524. [Google Scholar] [CrossRef] [Scilit] [PubMed]

Disclaimer/Publisher’s Note: The statements, opinions and data contained in all publications are solely those of the individual author(s) and contributor(s) and not of MDPI and/or the editor(s). MDPI and/or the editor(s) disclaim responsibility for any injury to people or property resulting from any ideas, methods, instructions or products referred to in the content. |
© 2026 by the authors. Licensee MDPI, Basel, Switzerland. This article is an open access article distributed under the terms and conditions of the Creative Commons Attribution (CC BY) license.