


Highlights
What are the main findings?
- A practical workflow was developed by integrating SBAS-InSAR time-series deformation with UAV-derived differential DEMs to investigate rainfall-induced deformation in large tailings-deposit areas.
- Signed InSAR hotspot/cold-spot patterns are broadly consistent with UAV dDEM polarity, showing uplift–deposition and subsidence–erosion coupling at the event scale.
What are the implications of the main findings?
- The proposed framework enables regional screening of deformation-prone zones while retaining event-scale quantification of erosion and deposition in key target areas.
- This integration strategy is transferable to large, disturbed terrains where optical image comparison is insufficient and rapid post-rainfall investigation is required.
Abstract
Milltailings deposition areas in abandoned mines are inherently unstable and spatially extensive and heterogeneous, making regional-scale field investigations challenging under intense rainfall. With the advancement of space–airborne remote sensing technologies, large-scale surface deformation monitoring has become feasible. In this study, a 22.02 km2 abandoned mine in Lingqiu County, Shanxi Province, was selected as a case site; during the late-July 2023 extreme rainfall event, the site experienced large-scale surface displacements. Surface deformation was interpreted using Sentinel-1 SBAS-InSAR data, combined with differential digital elevation models (DEMs) derived from UAV surveys before and after heavy rainfall. A bivariate spatial autocorrelation analysis was conducted to evaluate the spatial relationship between differential DEMs and InSAR-derived deformation. The results indicate that: (1) SBAS-InSAR revealed significant spatial heterogeneity of ground deformation, with pronounced subsidence observed in the milltailings deposits; (2) the bivariate spatial autocorrelation analysis yielded a Moran’s I value of 0.2, suggesting a weak but positive spatial correlation between the DEM differences and InSAR results, with dispersed correlation patterns; (3) hotspot analysis highlighted notable clustering of deformation, with approximately 27.84% of the study area showing strong deformation responses, while 25.81% represented low–low clusters with limited deformation. Beyond tailings-deposit settings, this workflow is also applicable to the regional investigation of rainfall-responsive deformation and debris-flow-related terrain change on natural slopes under global change, providing technical support for surface investigations and offering insights for disaster early warning and ecological restoration in similar regions.
1. Introduction
Extreme rainfall-induced debris flows are common geomorphic hazards in mountainous and mining areas, significantly increasing the risks of geological disasters and flooding [1,2,3]. Such events are typically characterized by large spatial extent and sudden outbreaks, and rapid detection of their location and magnitude is critical for post-storm emergency response and disaster management [4]. In mining regions, the deposits of waste rock, slag and milltailings are highly susceptible to debris flows under intense rainfall [5,6]. Northern China hosts numerous iron and gold mines that underwent large-scale exploitation in the past without adequate ecological restoration, leaving vast volumes of milltailings deposited along hillslopes and valleys [7]. In recent years, the increasing frequency of extreme rainfall events has further exacerbated the susceptibility of these sites to debris flow hazards [8].
In milltailings areas, rainfall-induced debris flows commonly develop through a sequence of infiltration, local failure, downslope entrainment, channelized transport, and terminal deposition. Compared with natural hillslope debris flows, tailings-related debris flows are more strongly controlled by artificial topography, loose anthropogenic materials, and pre-existing excavation or dumping patterns. As a result, erosion and deposition may occur simultaneously within the same disturbed mining patch, producing complex and spatially heterogeneous surface responses after intense rainfall.
Debris flows are commonly identified using remote sensing interpretation by comparing pre- and post-rainfall high-resolution optical imagery to delineate the extent and scale of surface disturbances [9,10]. This method is effective in mountainous areas with dense vegetation, where debris flows leave clearly recognizable bare surfaces. However, in milltailings storage areas, where surfaces are already exposed and subject to recurrent material loss, diagnostic image features are often ambiguous, requiring intensive manual interpretation [11]. In addition to optical imagery, Interferometric Synthetic Aperture Radar (InSAR) has been widely employed for ground deformation monitoring. InSAR enables efficient acquisition of large-scale, high-precision surface displacement data, independent of daylight, weather conditions, or surface obstructions, making it particularly suitable for remote areas [12,13]. The SBAS-InSAR technique, an advanced multi-temporal interferometric processing technique, allows for accurate long-term monitoring of dynamic surface deformation and has been extensively applied to slow-moving landslides and land subsidence [14]. Nevertheless, the application of InSAR to debris flow studies requires careful interpretation. Rapid debris-flow movements often induce severe temporal decorrelation and phase-unwrapping difficulties, which limit the capability of InSAR to resolve short-lived, high-magnitude displacements associated with extreme events [15]. In practice, SBAS-InSAR predominantly reflects the spatial distribution and temporal evolution of deformation preceding and following rainfall events, capturing progressive surface instability and residual ground adjustments. Despite these constraints, SBAS-InSAR remains effective for delineating rainfall-responsive deformation patterns and identifying deformation-prone zones at the regional scale, thereby providing valuable context for debris-flow investigations and guiding subsequent high-resolution analyses.
Unmanned aerial vehicles (UAVs) are increasingly used to obtain high-resolution topographic data and to monitor rapid ground changes [16]. Flying at low altitudes, UAVs can capture high-resolution imagery and LiDAR data, providing strong support for detailed terrain surveys and fine-scale geomorphic mapping [17]. However, UAV-based monitoring of debris flows at regional scales requires substantial flight time and often produces redundant datasets [18]. This makes UAVs particularly suitable for local-scale verification and detailed mapping of selected target areas; for example, Piras et al. generated high-resolution terrain models using UAVs for detailed geological mapping in mountain environments [19].
With advances in multi-source data integration, combining UAV-derived high-resolution topography with InSAR deformation data has emerged as an effective approach [20,21]. Such integration not only compensates for the limitations of individual datasets but also allows for the fusion of data at different spatial and temporal scales, enabling more comprehensive characterization of surface deformation processes. This provides valuable insights for disaster forecasting, environmental assessment, and regional restoration.
However, the practical integration of these datasets in disturbed mining terrain remains challenging. In tailings-deposit areas, pre- and post-event optical images often show only subtle visual contrasts because the surface is already bare before rainfall and may undergo repeated remobilization afterward. InSAR, although efficient for regional deformation screening, is limited in its ability to resolve short-lived, high-magnitude movement during extreme events. By contrast, UAV surveys provide event-scale topographic detail but are constrained by flight cost, spatial coverage, and survey timing. These complementary strengths and weaknesses indicate that no single technique is sufficient to characterize large-scale post-rainfall surface response in abandoned mines.
Accordingly, a combined framework is needed in which InSAR is used to identify deformation-prone areas at the regional scale, while UAV-derived differential DEMs are used to verify and quantify local erosion–deposition patterns in selected targets. Under this logic, hotspot analysis helps translate the signed InSAR deformation field into interpretable clusters of rainfall-responsive motion, whereas bivariate spatial autocorrelation provides an additional means of evaluating the spatial consistency between InSAR-derived deformation and topographic change. This integrated strategy is particularly relevant for large, abandoned mine districts, where rapid regional screening and subsequent targeted verification must be balanced under limited time and field-access constraints.
On 30 July 2023, an extreme rainfall event associated with Typhoon Doksuri affected northern China and triggered widespread deformation and debris-flow-related terrain change in tailings deposits at an abandoned open-pit iron mine in Lingqiu County, Shanxi Province. This case provides an opportunity to examine how regional deformation screening and event-scale topographic verification can be integrated in a large, disturbed mining landscape. Accordingly, the objective of this study is to develop and test a workflow that combines SBAS-InSAR-derived hotspot mapping with UAV-based differential DEMs acquired before and after the rainfall event to identify debris-flow-related target zones and quantify rainfall-induced erosion–deposition patterns in extensive tailings-deposit areas.
2. Background
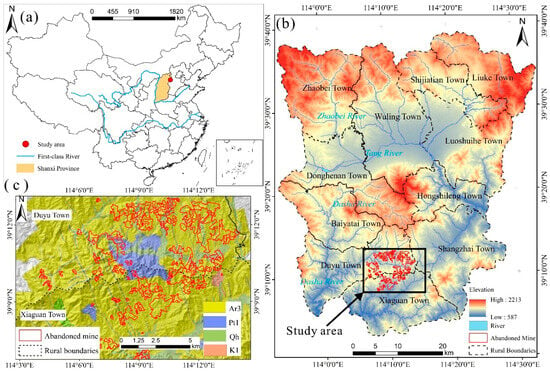
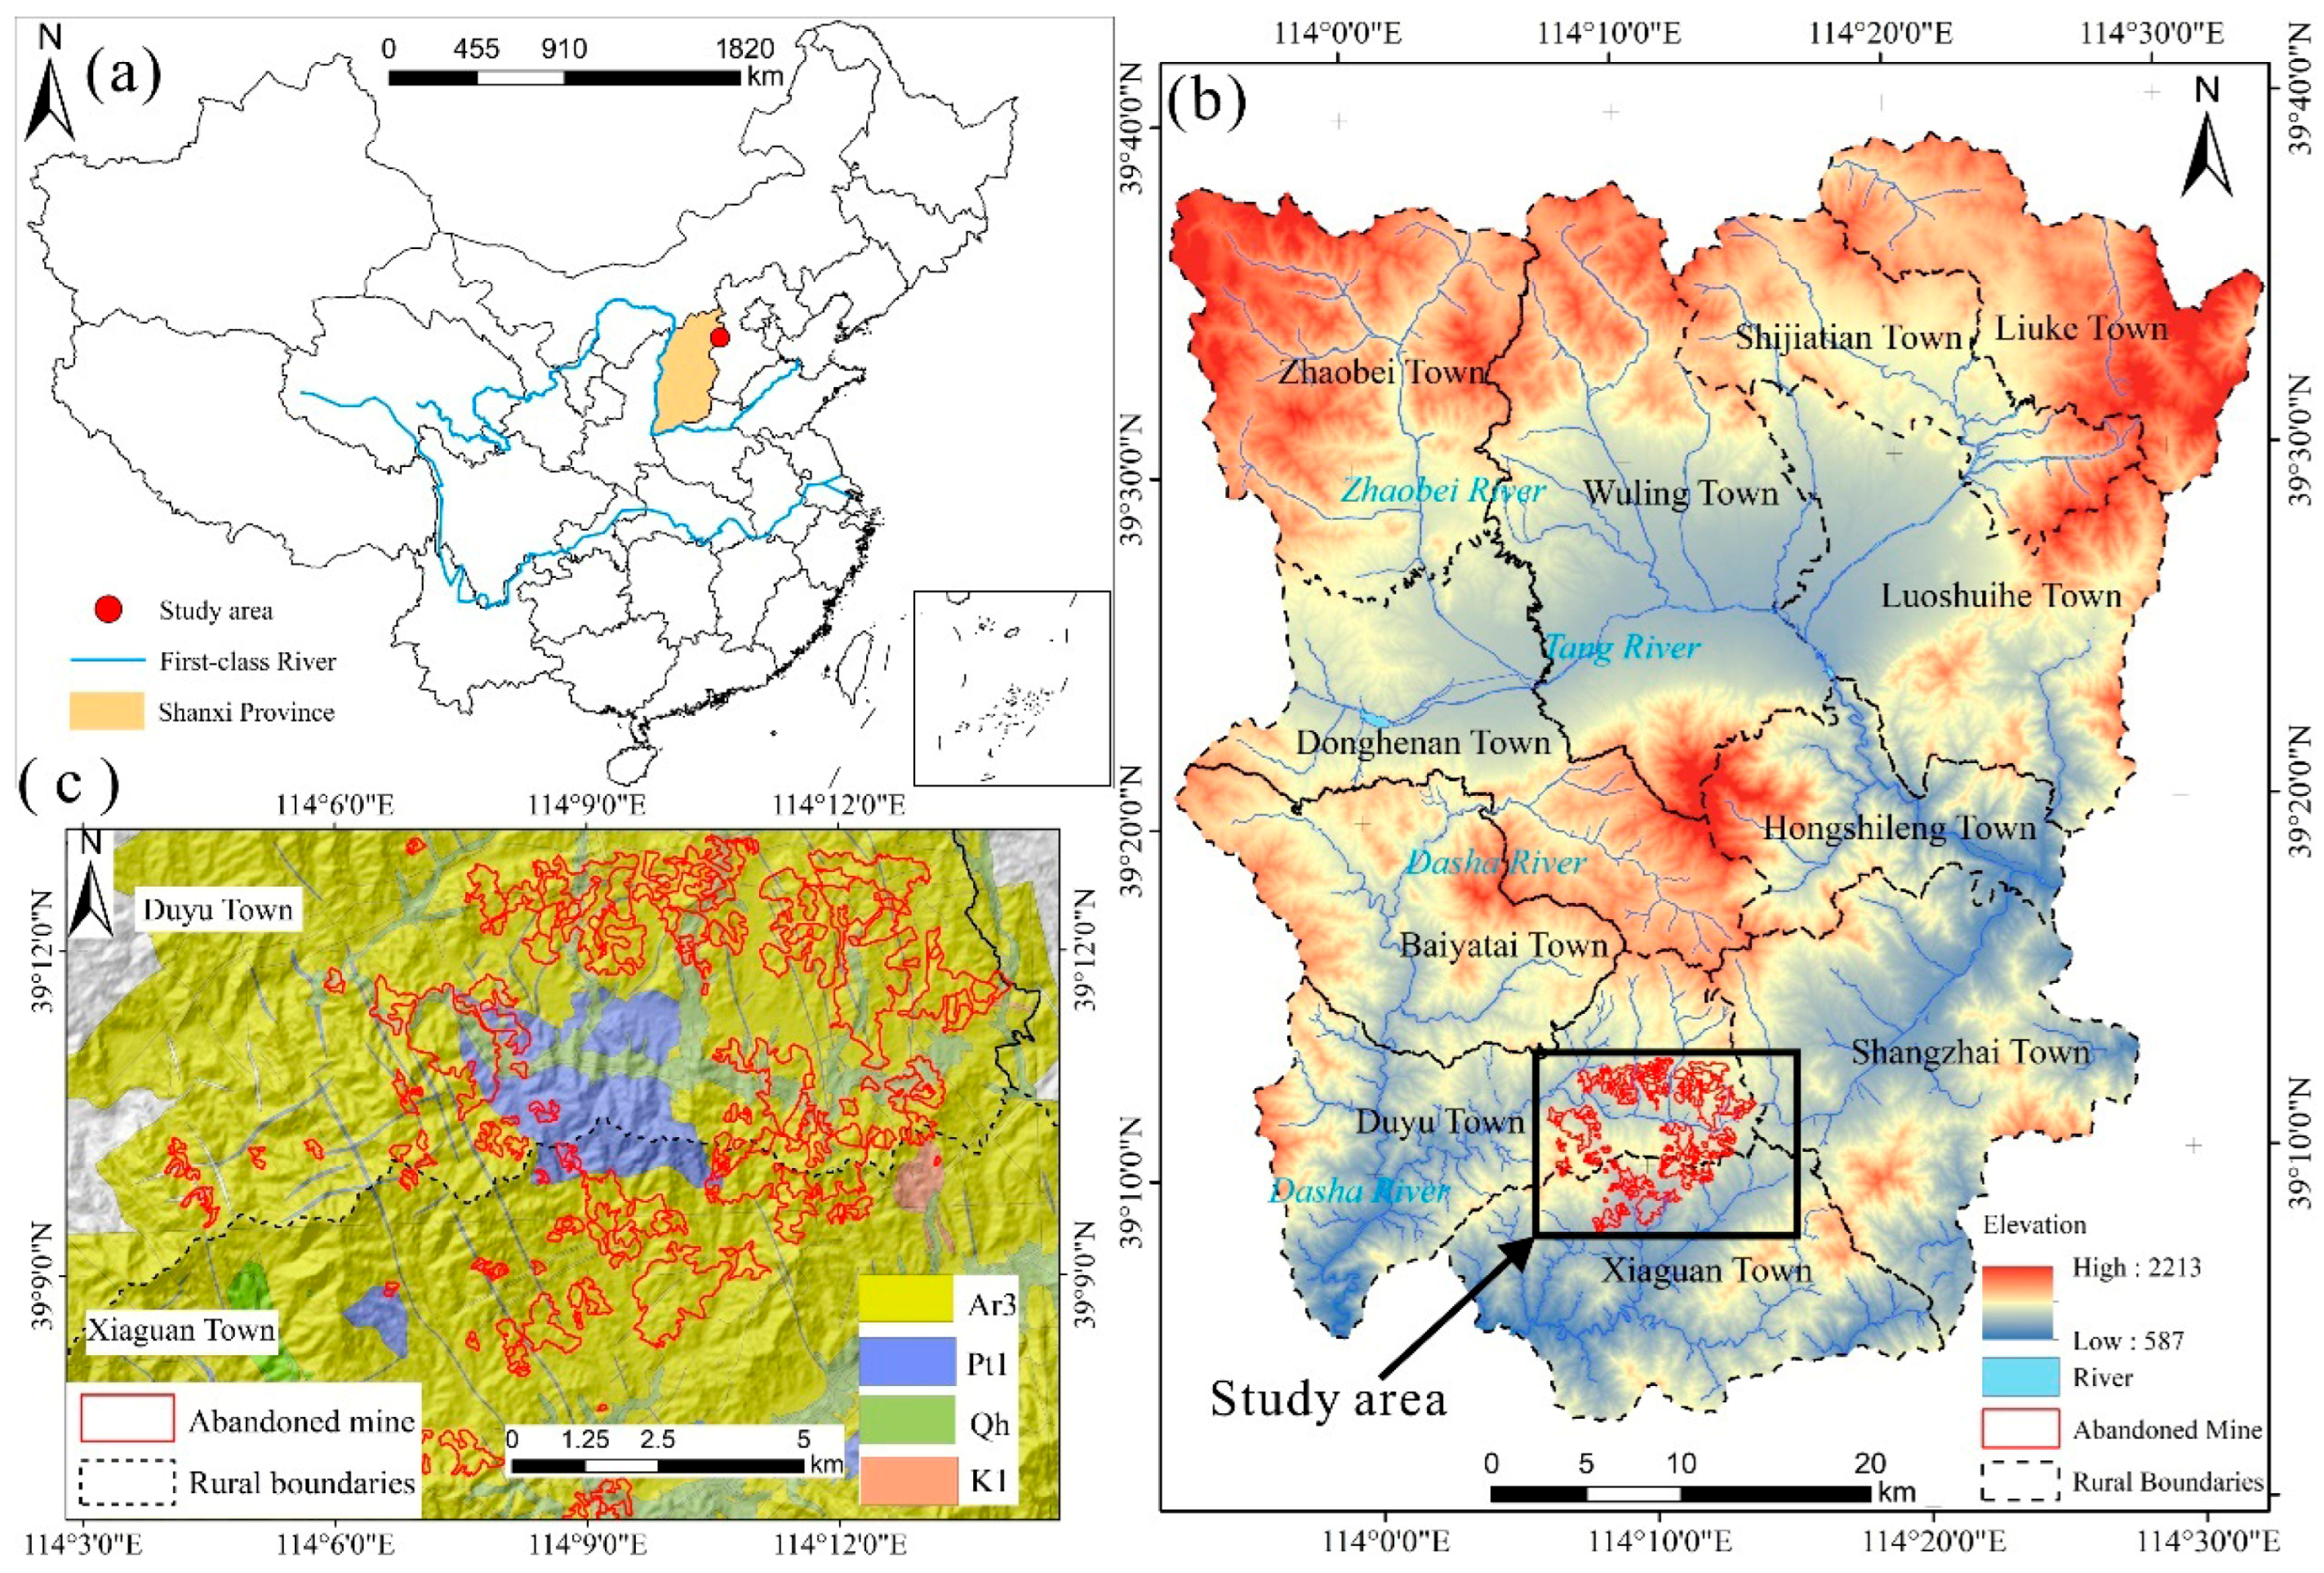
The study area is located in Lingqiu County, Datong City, Shanxi Province, China (Figure 1a). The regional landscape is characterized by tectonic mountains and basin valleys. In the southern part of the study area, large gneiss-hosted iron ore deposits are distributed, which were primarily exploited by open-pit mining until their closure in 2010. The Late Archean (Ar3) strata are mainly composed of light pink gneissic monzogranite, while the Early Proterozoic (Pt1) consists primarily of metamorphic granite, both of which served as the principal lithologies for mining.
Figure 1.
Location of the study area, (a) China administrative division; (b) Lingqiu County, Datong City; (c) Distribution of Abandoned mine in the study area.
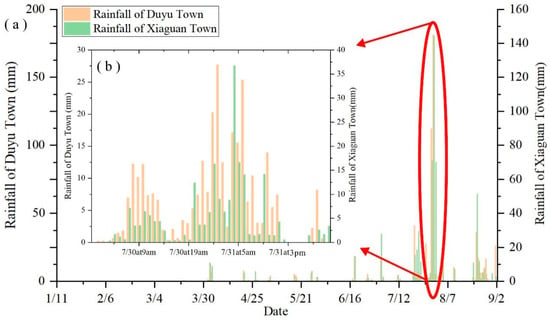
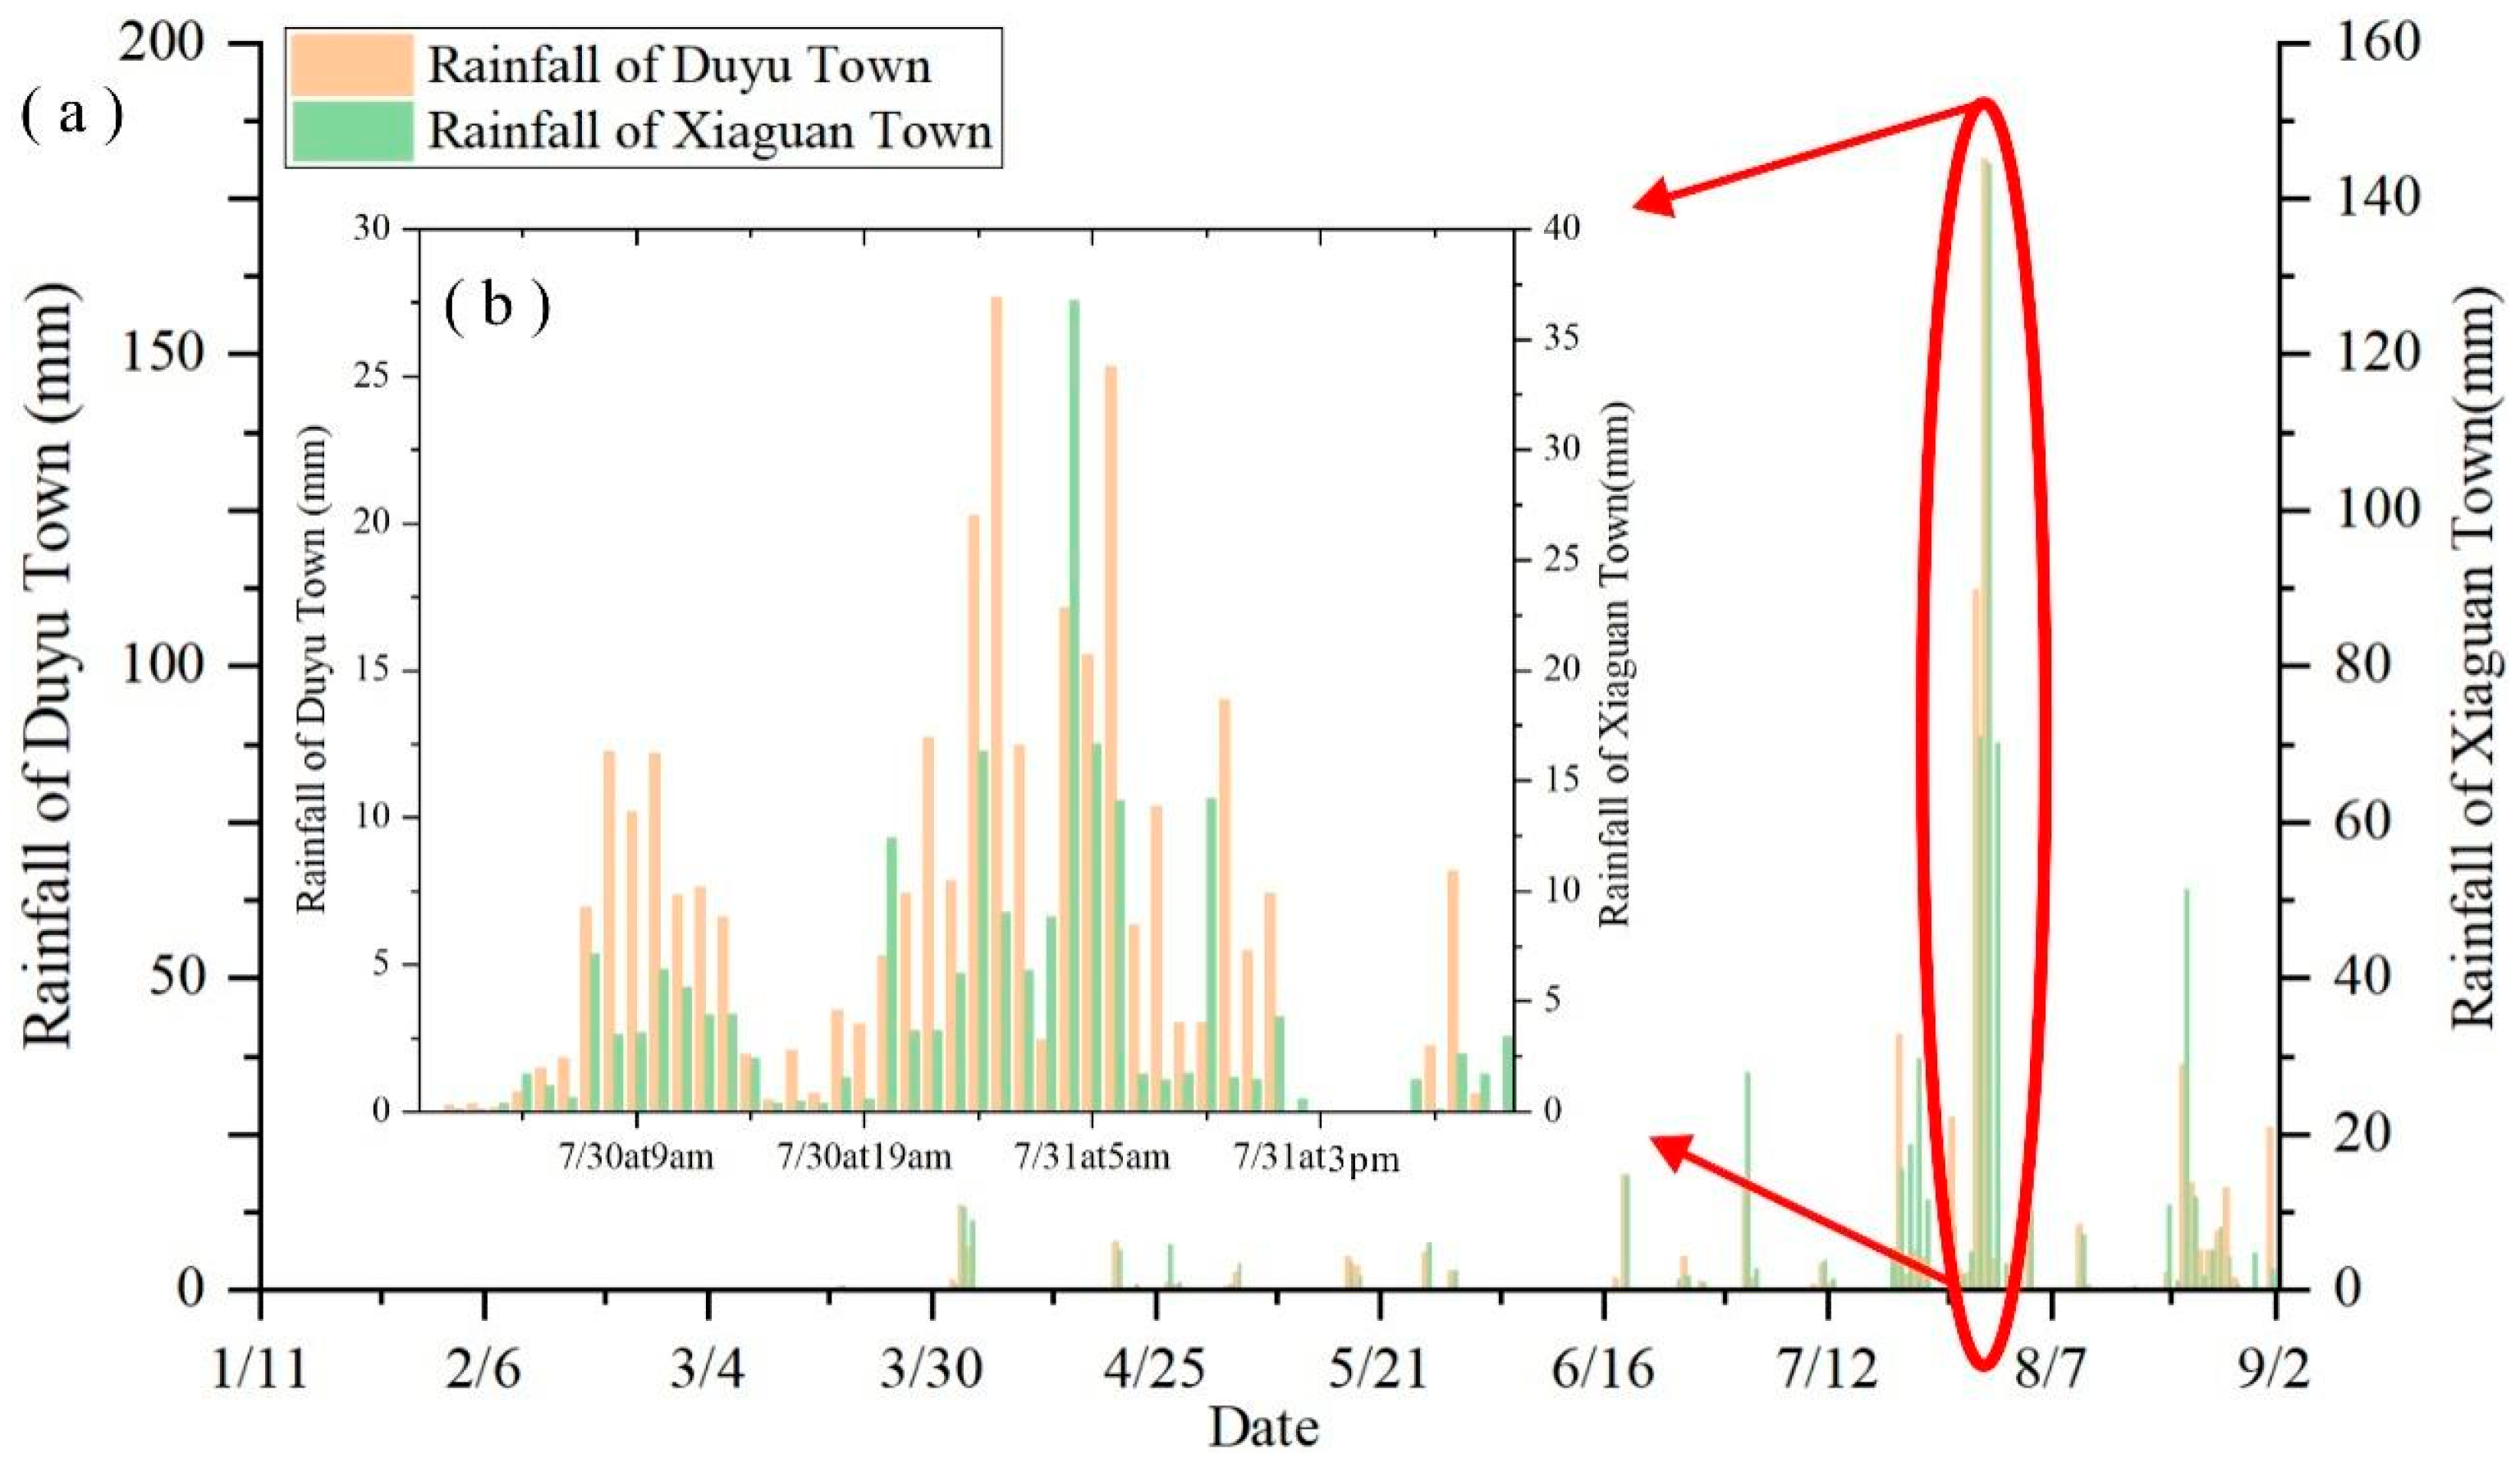
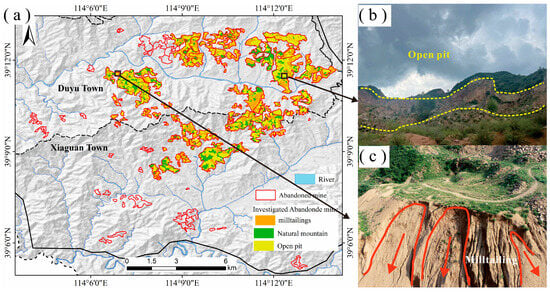
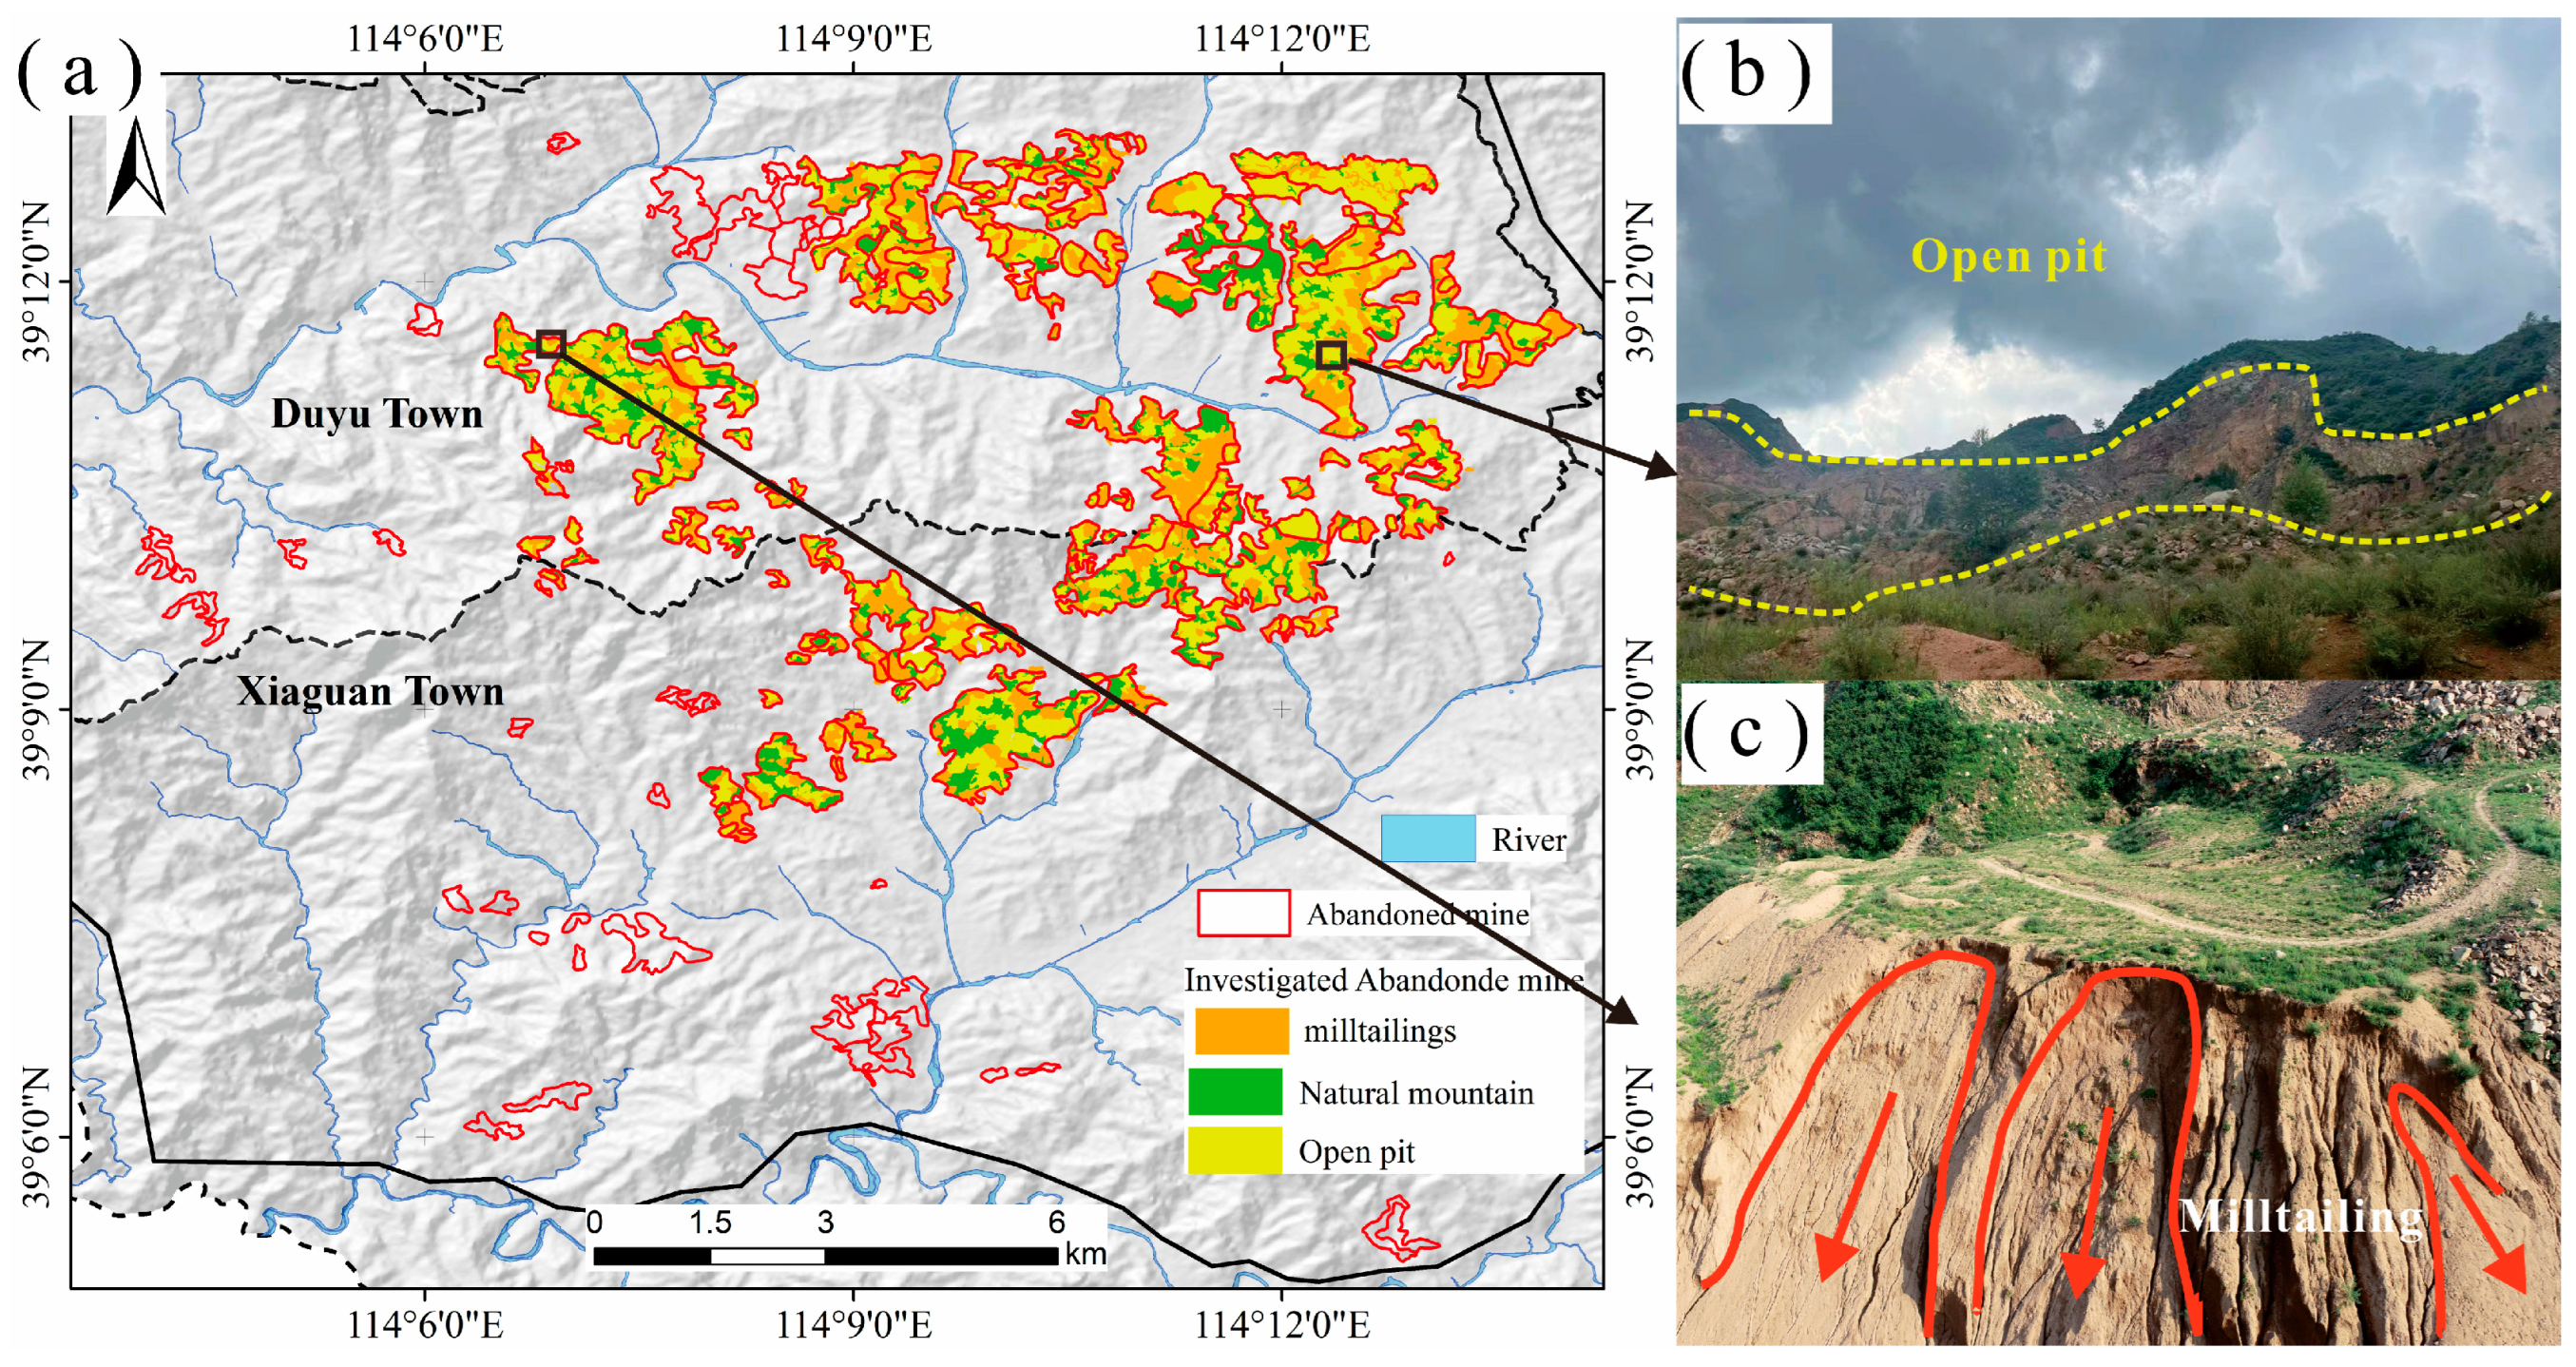
Lingqiu County has a mean annual precipitation of 463.9 mm, with frequent short-duration intense rainfall events during summer. On 28 July 2023, under the influence of Super Typhoon Doksuri, the study area experienced continuous heavy rainfall. According to local rain gauge records, peak precipitation occurred between 30 July 2023 and 1 August 2023 (Figure 2a). On 30 July 2023, the recorded rainfall was 112.27 mm at Duyu Township and 70.99 mm at Xiaguan Township; on 31 July 2023, the rainfall increased to 181.23 mm and 144.42 mm, respectively, before gradually weakening after 3:00 p.m. (Figure 2b). The hourly peak rainfall reached 27.68 mm in Duyu and 36.77 mm in Xiaguan. As shown in Figure 3c, after-the-fact field observation and image interpretation show that there is extensive erosion and deposition in tailings deposition in the study area. Arrows represent typical erosion gullies and sedimentary characteristics in the deposition of mineral processing tailings.
Figure 2.
(a) Rainfall in the study area: daily rainfall from 11 January 2023 to 2 September 2023; (b) Hourly rainfall in the study area during the transit of Typhoon Doksuri.
Figure 3.
(a) Spatial classification of abandoned mine elements after investigation; (b) Typical open-pit mining; (c) Milltailings eroded by rainfall.
In Lingqiu County, the total mining-disturbed area covers 3329.08 hectares. Within Xiaguan and Duyu Townships, 2250.59 hectares were selected for abandoned mine investigations. Based on field surveys and classification of mining features, the results indicate that open-pit excavations occupy 937.89 hectares, while tailings deposits cover 745.75 hectares (Figure 3a). The primary forms of disturbance in the abandoned mines are open-pit excavation and tailings accumulation. Historical mining activities involved large-scale excavation of mountain tops and slopes, resulting in numerous abandoned open pits (Figure 3b). During the extraction process, waste rock, rubble, and tailings were discharged along excavation slopes, natural hillsides, and valleys, subsequently forming extensive milltailings piles.
Geomorphologically, the study area is characterized by tectonically controlled mountains and incised valleys, with strong local relief and well-developed drainage pathways. Long-term open-pit excavation has reshaped the original hillslope morphology by cutting slopes, flattening ridge tops, and creating benches and artificial scarps. In addition, tailings dumping along hillslopes and valley bottoms has produced loose anthropogenic deposits, locally modified runoff pathways, and enhanced the contrast between erosional and depositional microtopography. These mining-induced geomorphic changes increase the sensitivity of the area to rainfall-triggered deformation and debris-flow-related surface processes.
3. Methods
3.1. Data Collection
This study employed data from Sentinel-1, an Earth observation satellite launched by the European Space Agency (ESA) in 2014, equipped with a C-band synthetic aperture radar and a 12-day repeat cycle. A total of 18 ascending-pass Sentinel-1 images covering the study area from 11 February to 3 September 2023 were downloaded from ASF Data Search (https://search.asf.alaska.edu, accessed on 16 September 2023). To eliminate phase errors, a Shuttle Radar Topography Mission (SRTM) digital elevation model with a spatial resolution of 30 m was used. The SRTM dataset was obtained from NASA Earthdata Search (https://search.earthdata.nasa.gov/, accessed on 20 September 2023).
To obtain a high-resolution DEM of the abandoned mines, this study applied UAV-based oblique photogrammetry. Data were collected using a DJI Phantom series rotary-wing vertical take-off and landing (VTOL) UAV. The UAV imagery was processed in DJI Terra for aerial triangulation, dense image matching, and the generation of point clouds, DSMs, and orthomosaics. Ground control was measured using RTK-GNSS under a regional network layout to ensure mapping accuracy. According to the available UAV survey and control-point accuracy documents, 148 control/check-point records were documented for the project. The resulting ground sampling distance (GSD) was 4.48 cm, and the main flight parameters are listed in Table 1.
Table 1.
Basic data of InSAR and Main parameters of UAV mapping mission.
3.2. Technology and Analysis Method
This section describes the analytical workflow adopted in this study. Sentinel-1 SBAS-InSAR time-series analysis was first used to characterize regional deformation patterns and to identify rainfall-responsive hotspot and cold-spot clusters. These clusters were then screened in relation to the local terrain context and further examined using UAV-derived differential DEMs to distinguish erosion–deposition signatures associated with debris-flow-related terrain change. Hotspot analysis and bivariate LISA were subsequently applied to evaluate the spatial clustering of deformation and the spatial consistency between the InSAR-derived deformation field and the UAV-derived topographic change.
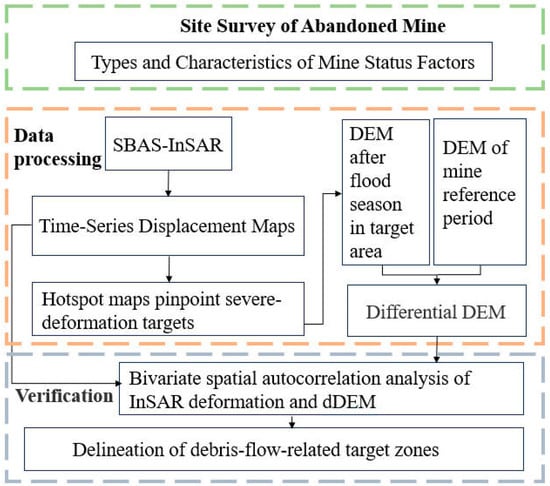
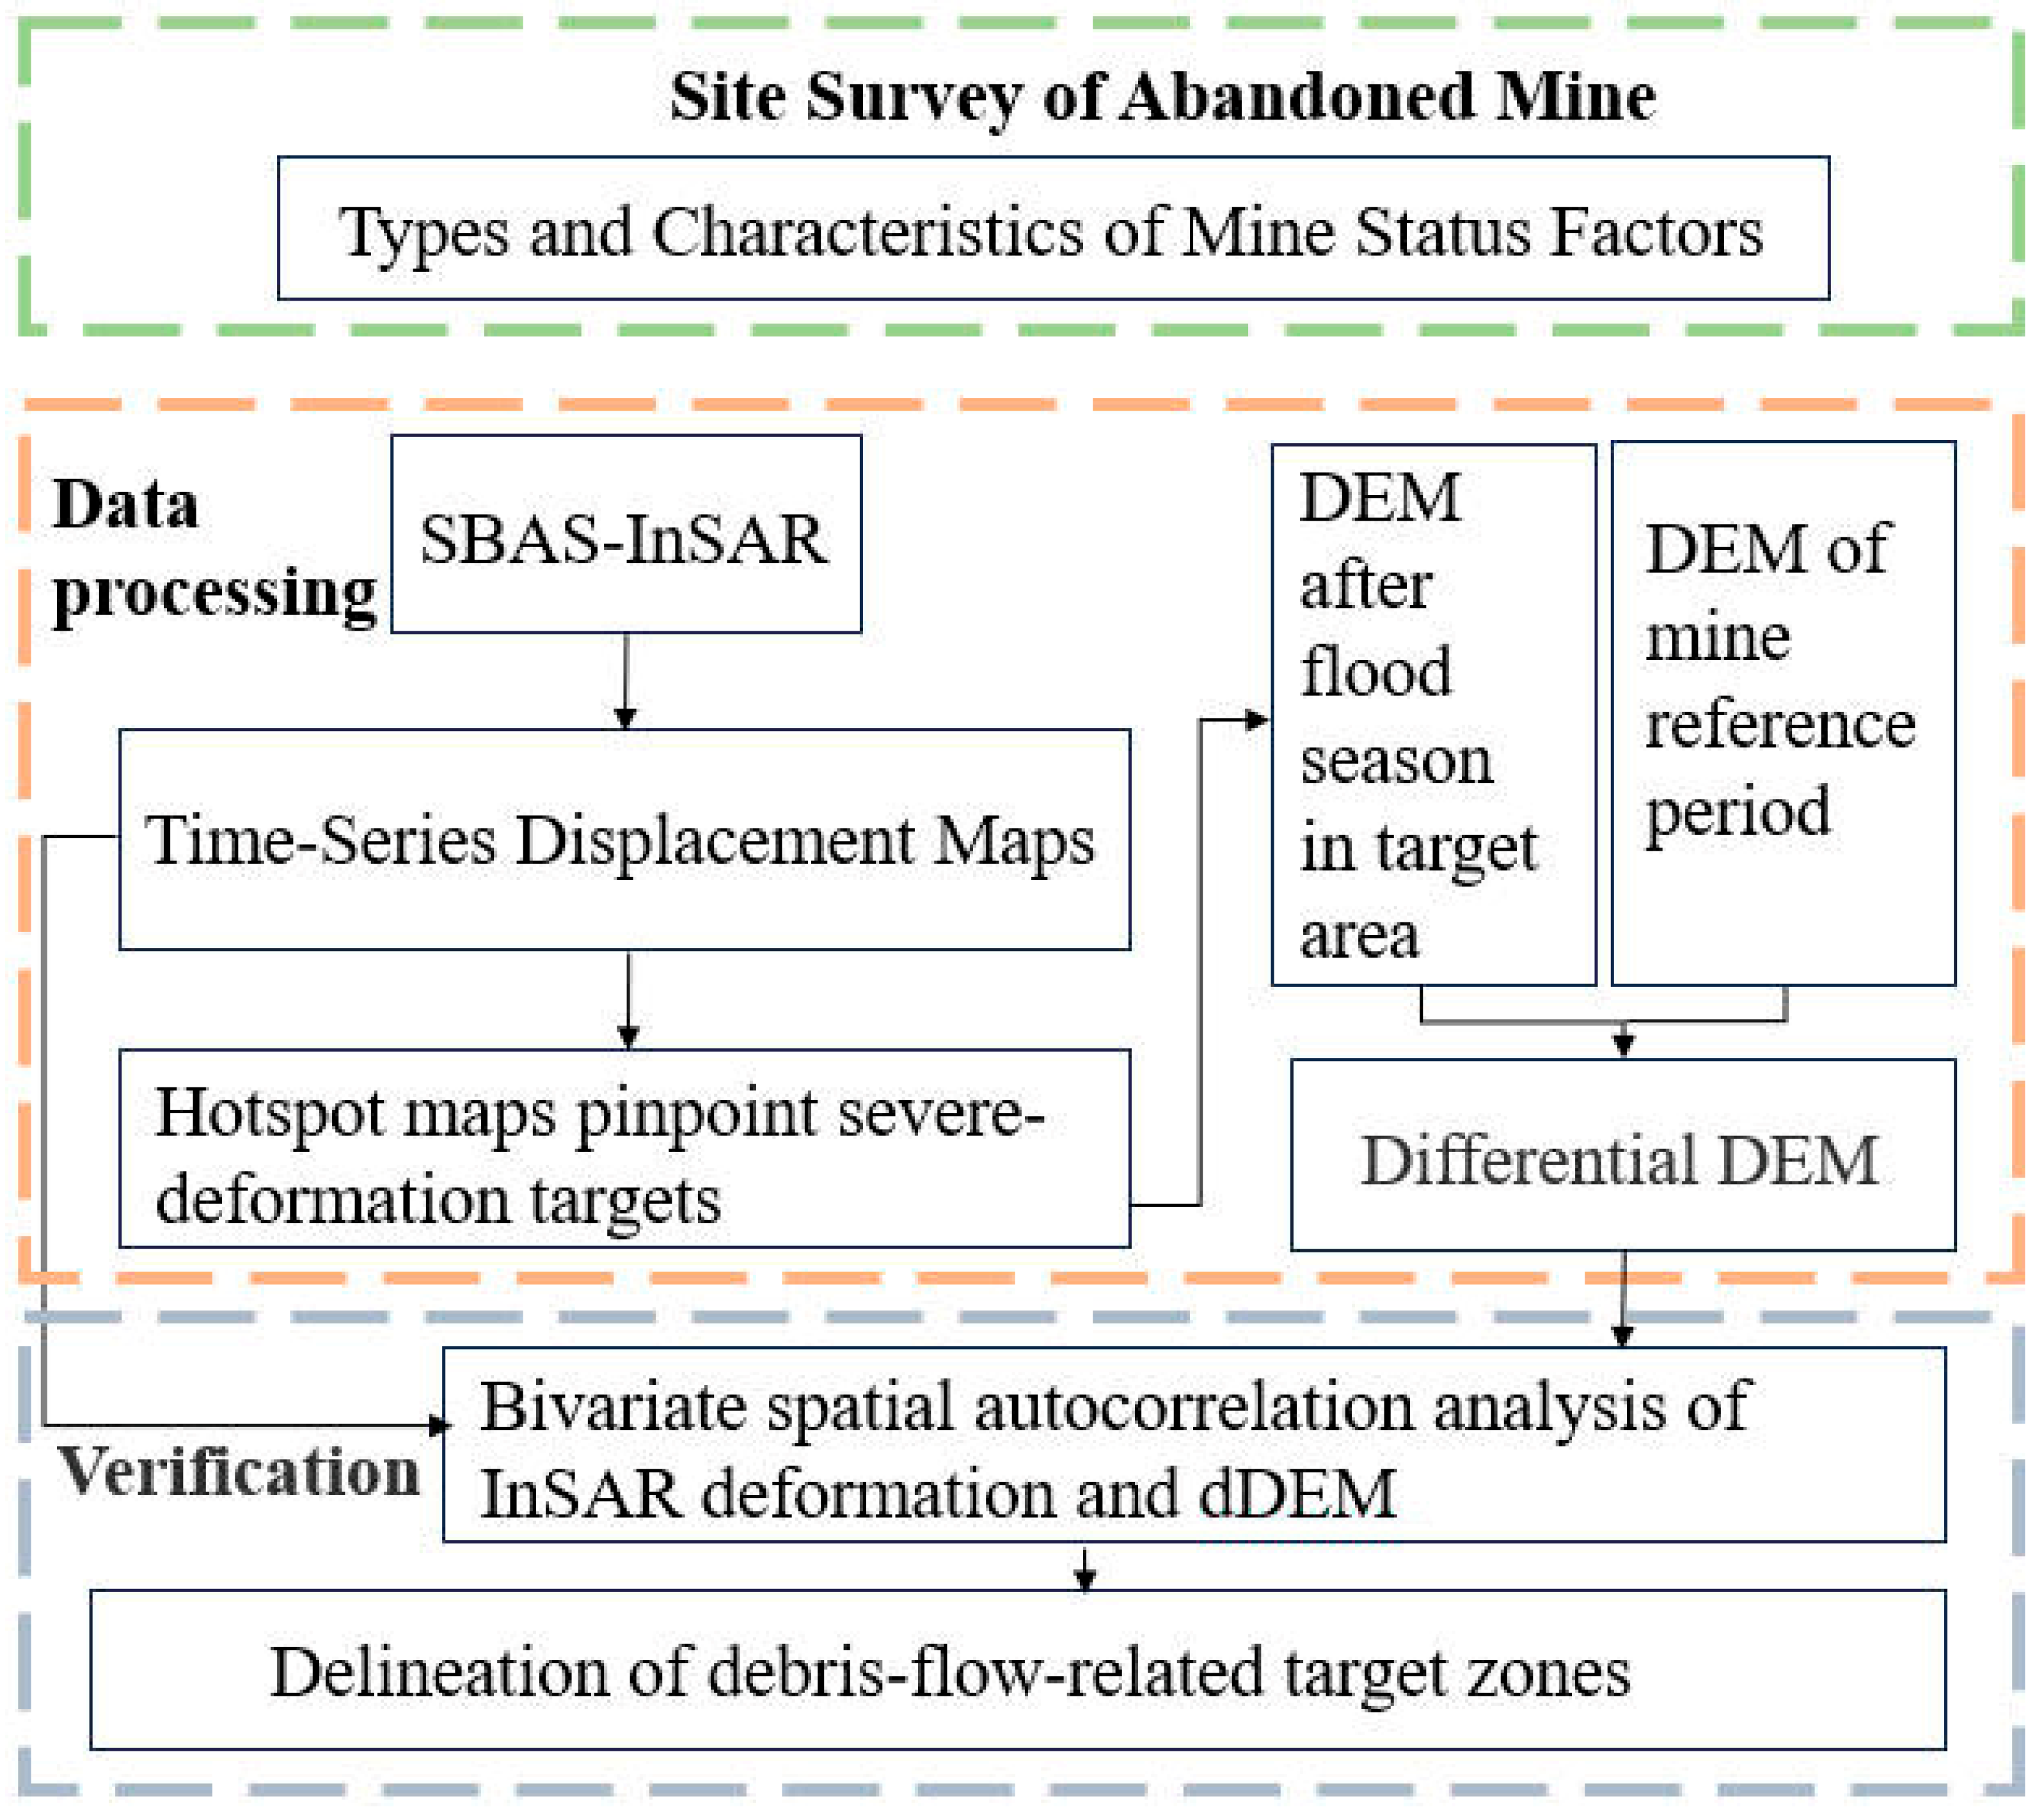
First, mining features, including open pits and tailings deposits, were preliminarily interpreted from pre-event high-resolution imagery and topographic data, and field investigation was subsequently used to verify and refine their delineation. Subsequently, a time-series SBAS-InSAR analysis was conducted to capture surface deformation of different features over time. Based on the InSAR-derived deformation, hotspot maps were generated to reveal the spatial clustering patterns of surface movement. UAV-derived DEMs acquired before and after the rainfall event were differenced to quantify local terrain change. Bivariate spatial autocorrelation analysis was used as an exploratory tool to examine the spatial consistency between the InSAR-derived deformation field and the differential DEM, rather than as a standalone indicator of process coupling. The integrated interpretation of InSAR clusters, dDEM patterns, and local spatial association was used to delineate debris-flow-related target zones for regional investigation and field verification. The overall workflow is shown in Figure 4.
Figure 4.
Research flow chart.
SBAS-InSAR data covering the period from 11 February to 3 September 2023 were analyzed, and ArcGIS 10.4 hotspot analysis was applied to assess the spatial clustering of rainfall-responsive deformation. Seven hot–cold spot classes were generated, corresponding to the 99%, 95%, and 90% confidence levels, together with non-significant areas. To further examine the dynamic response of surface deformation during rainfall, a UAV-based small-scale survey was conducted on a mining patch with high rainfall sensitivity. UAV LiDAR and oblique photogrammetry data were acquired on 21 June 2023 and 19 August 2023, and differential DEMs were used to quantify millimeter-scale vertical displacement patterns. The spatial interdependence between differential DEMs and InSAR-derived deformation was quantified using the bivariate Local Indicators of Spatial Association (LISA) framework. The integrated outputs were finally used to delineate debris-flow-related target zones for regional investigation and field verification.
3.2.1. SBAS-InSAR
The Small Baseline Subset (SBAS) technique is a widely used InSAR time-series approach that retrieves surface deformation by jointly processing multiple SAR acquisitions with short temporal and spatial baselines, thereby reducing decorrelation effects and improving deformation reliability. By inverting a network of differential interferograms, SBAS enables the estimation of mean deformation rates and cumulative displacement time series for coherent targets over extended periods [22].
In this study, a total of N+1 SAR images were acquired, and one scene was selected as the reference image. All remaining images were co-registered to the reference scene, and differential interferograms were generated by applying temporal and spatial baseline thresholds. After phase unwrapping and error mitigation, deformation time series were reconstructed following the standard SBAS workflow based on least-squares inversion and singular value decomposition (SVD). Sentinel-1 ascending images were processed using the SARscape 5.6.2 module in ENVI 5.6 following the standard SBAS workflow.
The resulting SBAS-InSAR displacement field was used in this study to derive rainfall-responsive deformation maps for subsequent hotspot analysis and comparison with UAV-derived differential DEMs.
3.2.2. InSAR Geometry Transformation
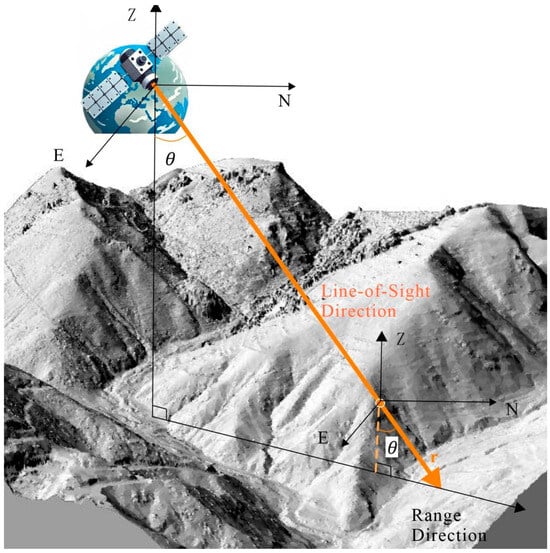
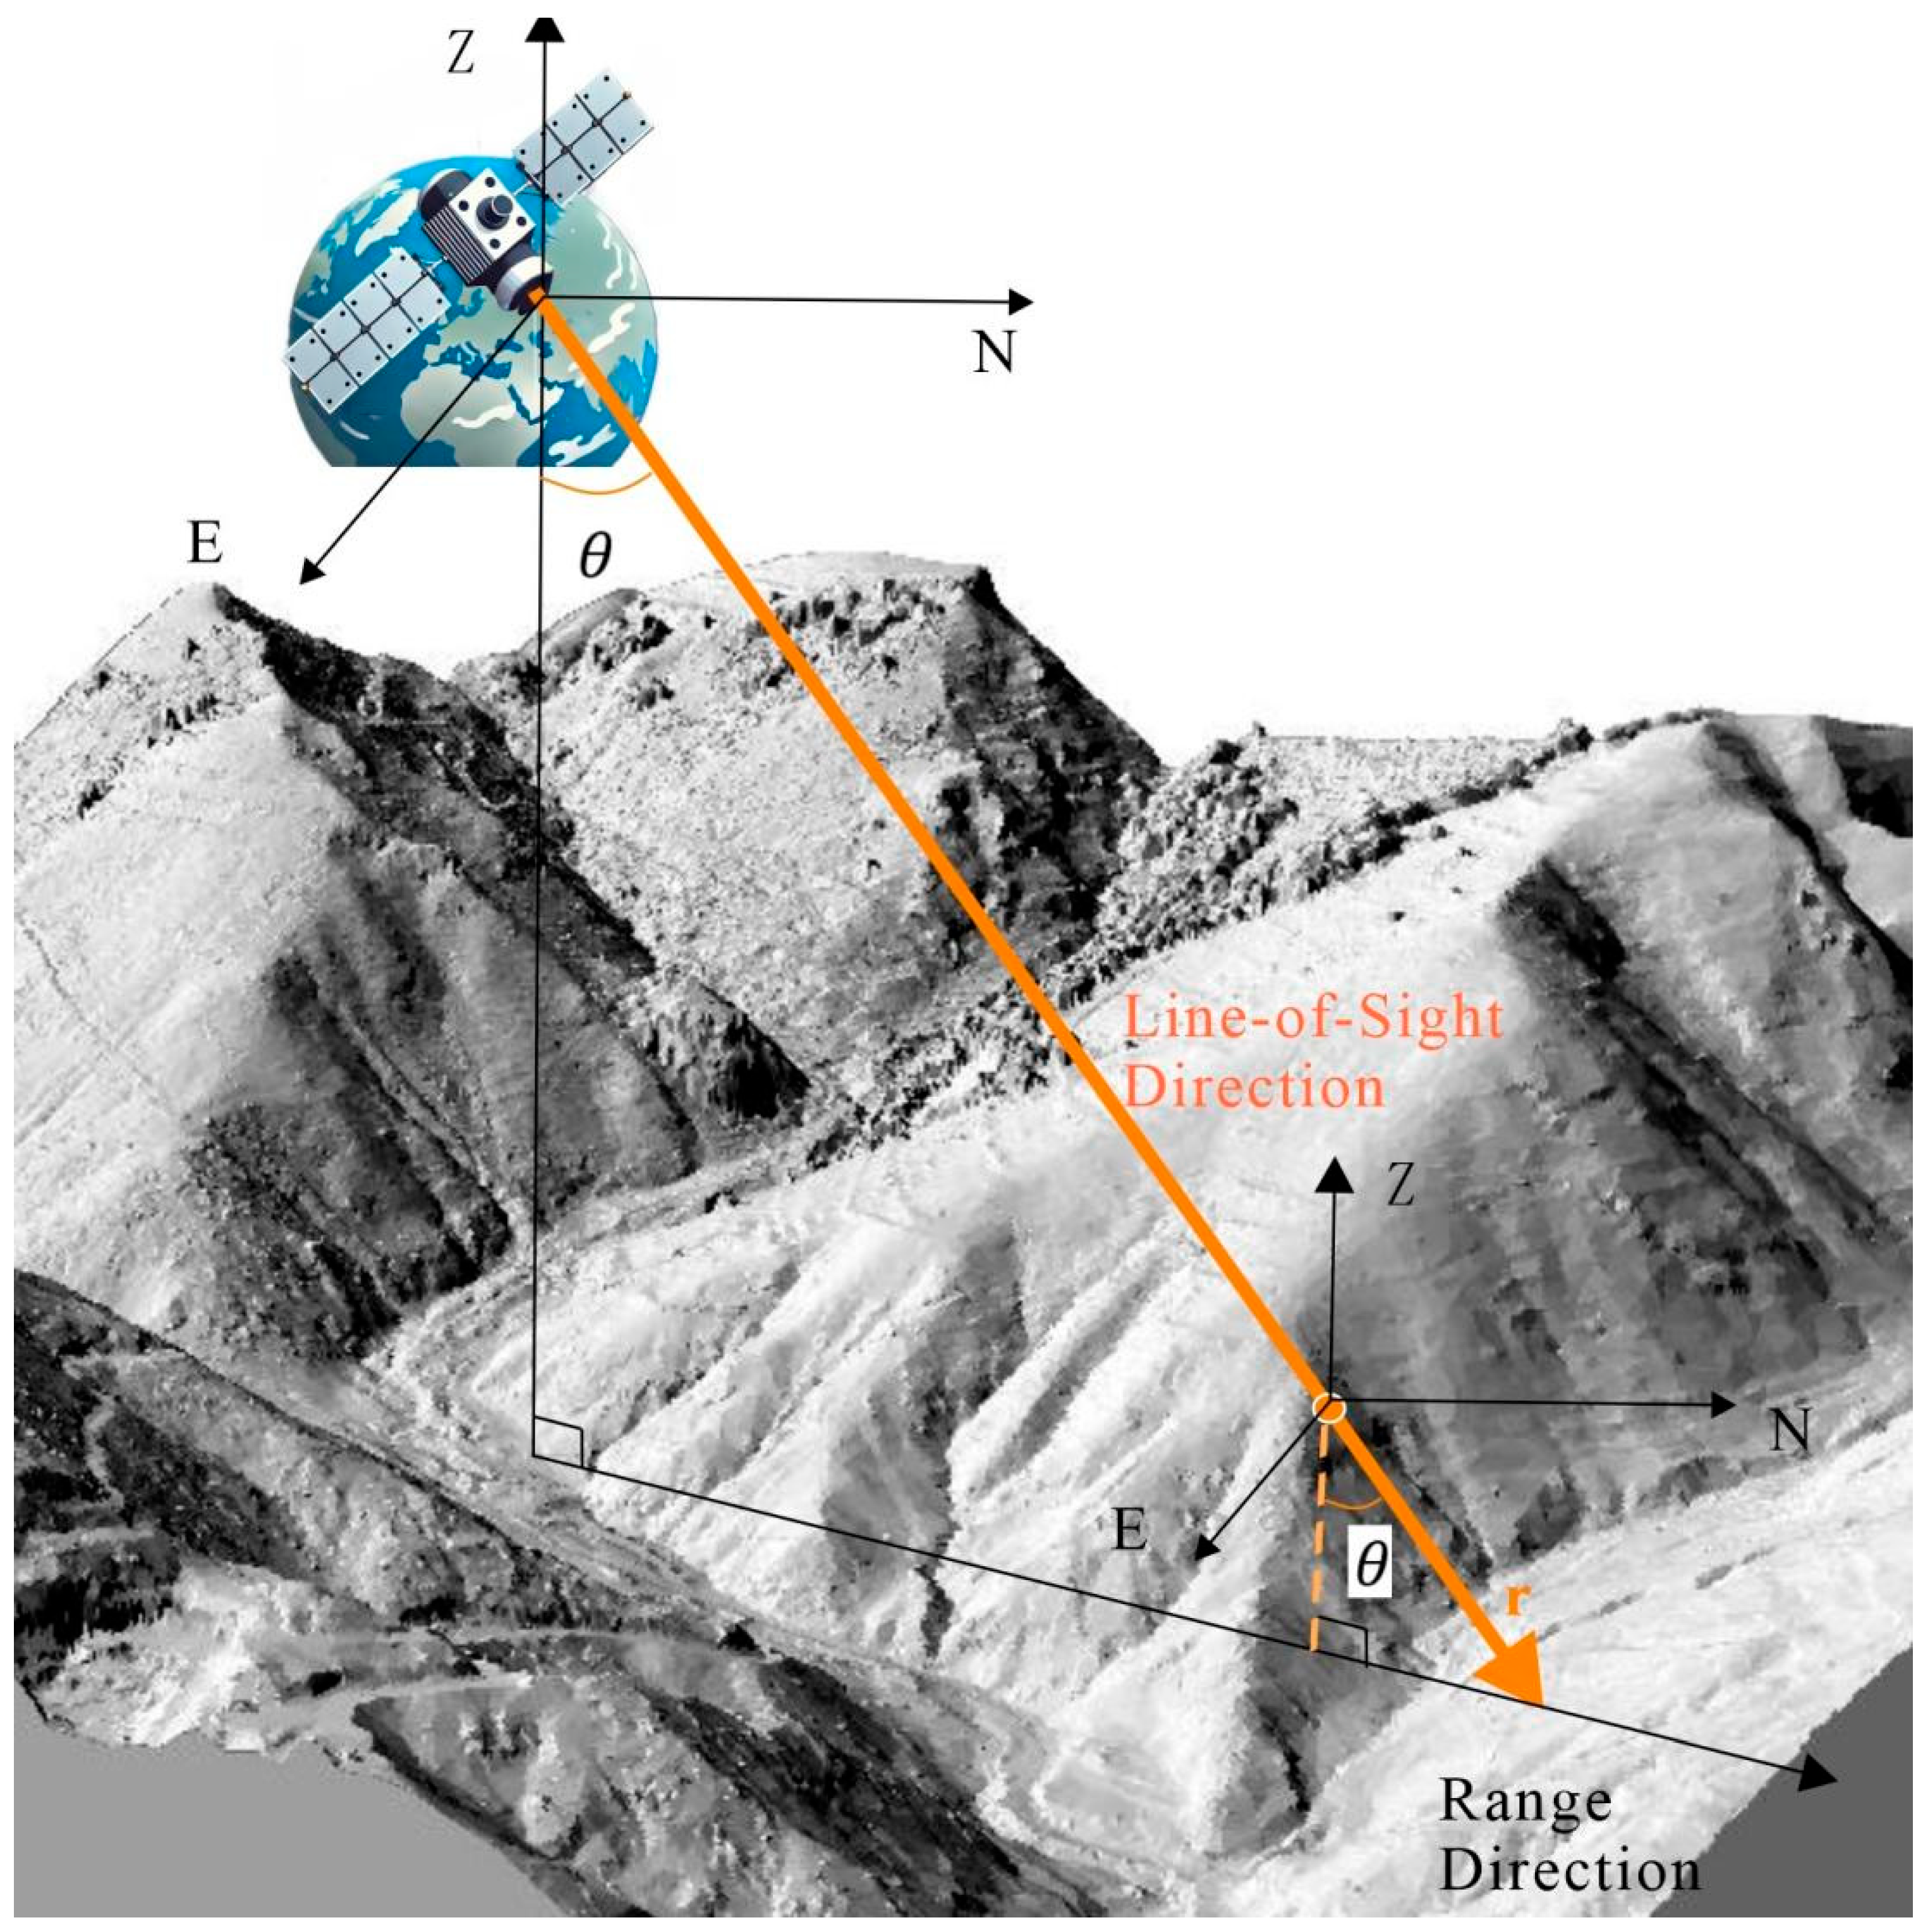
The deformation derived from the SBAS algorithm represents only the projection of surface displacement along the satellite line-of-sight (LOS), whereas actual surface deformation occurs in three dimensions [23]. Figure 5 illustrates a displacement point on a slope acquired by SAR in an ascending orbit.
Figure 5.
Three-dimensional relationship diagram between SAR line-of-sight deformation point and surface.
A three-dimensional spatial coordinate system was established with the geographic east and north directions defined as the and axes, respectively. The unit vector along the SAR line-of-sight (LOS), , can be expressed as:
In the equation:
—the angle between the satellite line-of-sight (LOS) and the vertical direction;
—the azimuth angle of the satellite relative to the geographic north;
—the unit components of the LOS velocity vector along the east, north, and vertical directions, respectively.
The LOS velocity at the point, , can be expressed as:
To obtain the vertical component of the velocity, we set and . Thus, the LOS velocity simplifies to:
When < 0, the displacement is downward, indicating subsidence; when > 0, the displacement is upward, indicating material accumulation on the slope at that point.
The SBAS-InSAR results represent LOS deformation. For comparison with UAV-derived dDEM, LOS displacement was projected to the vertical direction using the local incidence angle under the assumption that horizontal motion is negligible at the analysis scale. In this study, vertical deformation was used as an indicator of surface lowering and thickening associated with erosion and deposition, rather than as a full description of debris-flow kinematics.
3.2.3. Method of Bivariate Spatial Autocorrelation Analysis
Spatial autocorrelation analysis comprises global and local components. Global spatial autocorrelation assesses the average association, overall spatial pattern, and its significance across the entire study area, whereas local spatial autocorrelation (LISA) identifies location-specific association patterns, revealing spatial nonstationarity and local clustering/dispersion. The commonly used indices are Moran’s I and Local Moran’s I. Values typically fall within [−1, 1]: positive values indicate positive spatial autocorrelation (closer to 1 ⇒ stronger clustering); negative values indicate negative spatial autocorrelation (closer to −1 ⇒ stronger dispersion); values near 0 suggest no significant spatial autocorrelation [24]. The calculation formula of Moran’s I index is as follows:
For a single spatial unit , the Local Moran’s I is defined as follows:
where
: attribute values (observations) for spatial units and ;
: sample mean of ;
: spatial weights based on adjacency or distance;
: number of spatial units.
3.2.4. InSAR Hotspot–Guided Target Selection
To quantify event-scale erosion and deposition and to cross-validate the InSAR interpretation, the UAV imagery was processed following a standard photogrammetric workflow. The survey was conducted using a DJI UAV platform, and the imagery was processed in DJI Terra and CASS10.1. The processing workflow included POS/PPK correction, image distortion correction, aerial triangulation, bundle adjustment, image-point marking of ground control points, and 3D model reconstruction, from which orthomosaics and DEM products were generated [25]. The main flight parameters included a flight altitude of 200 m, a ground sampling distance (GSD) of 4.48 cm, and a forward/side overlap of 85%/80%.
To ensure comparability between the two survey epochs, the pre-event and post-event DEM products were referenced to a common horizontal and vertical datum before DEM differencing. According to the UAV control-point accuracy report, the final products achieved a planimetric RMSE of 0.09 m and a vertical RMSE of 0.028 m. The differential DEM (dDEM = DEM_post − DEM_baseline) was then calculated to represent terrain lowering and thickening [26]. The uncertainty of the dDEM was estimated by propagating the vertical errors of the two DEM epochs; assuming comparable vertical accuracy for both epochs, the propagated dDEM uncertainty was approximately 0.040 m.
In practical terms, the pre-event and post-event DEMs were not used only for simple surface differencing but also as a means of verifying whether the InSAR-indicated target zones corresponded to geomorphically meaningful erosion–deposition patterns. Negative dDEM values were interpreted as surface lowering related to erosion, scour, or post-failure evacuation of material, whereas positive dDEM values were interpreted as local thickening related to deposition or post-event accumulation. Because the propagated dDEM uncertainty is approximately 0.040 m, elevation changes close to this magnitude were interpreted cautiously and were mainly used in combination with their spatial continuity, geomorphic position, and correspondence with InSAR clusters, rather than as isolated indicators.
This workflow also guided the selection of UAV re-survey targets. Rather than surveying the entire mine district at high resolution, UAV campaigns were focused on areas highlighted by the InSAR hotspot/cold-spot screening and by the geomorphic setting of tailings slopes, channels, and depositional aprons. This strategy reduced the operational cost of post-rainfall survey while improving the interpretability of the local topographic changes that were subsequently compared with the regional deformation patterns.
4. Results and Analysis
4.1. Results of SBAS-InSAR
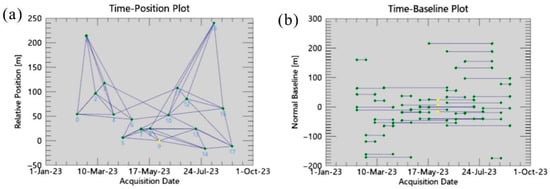
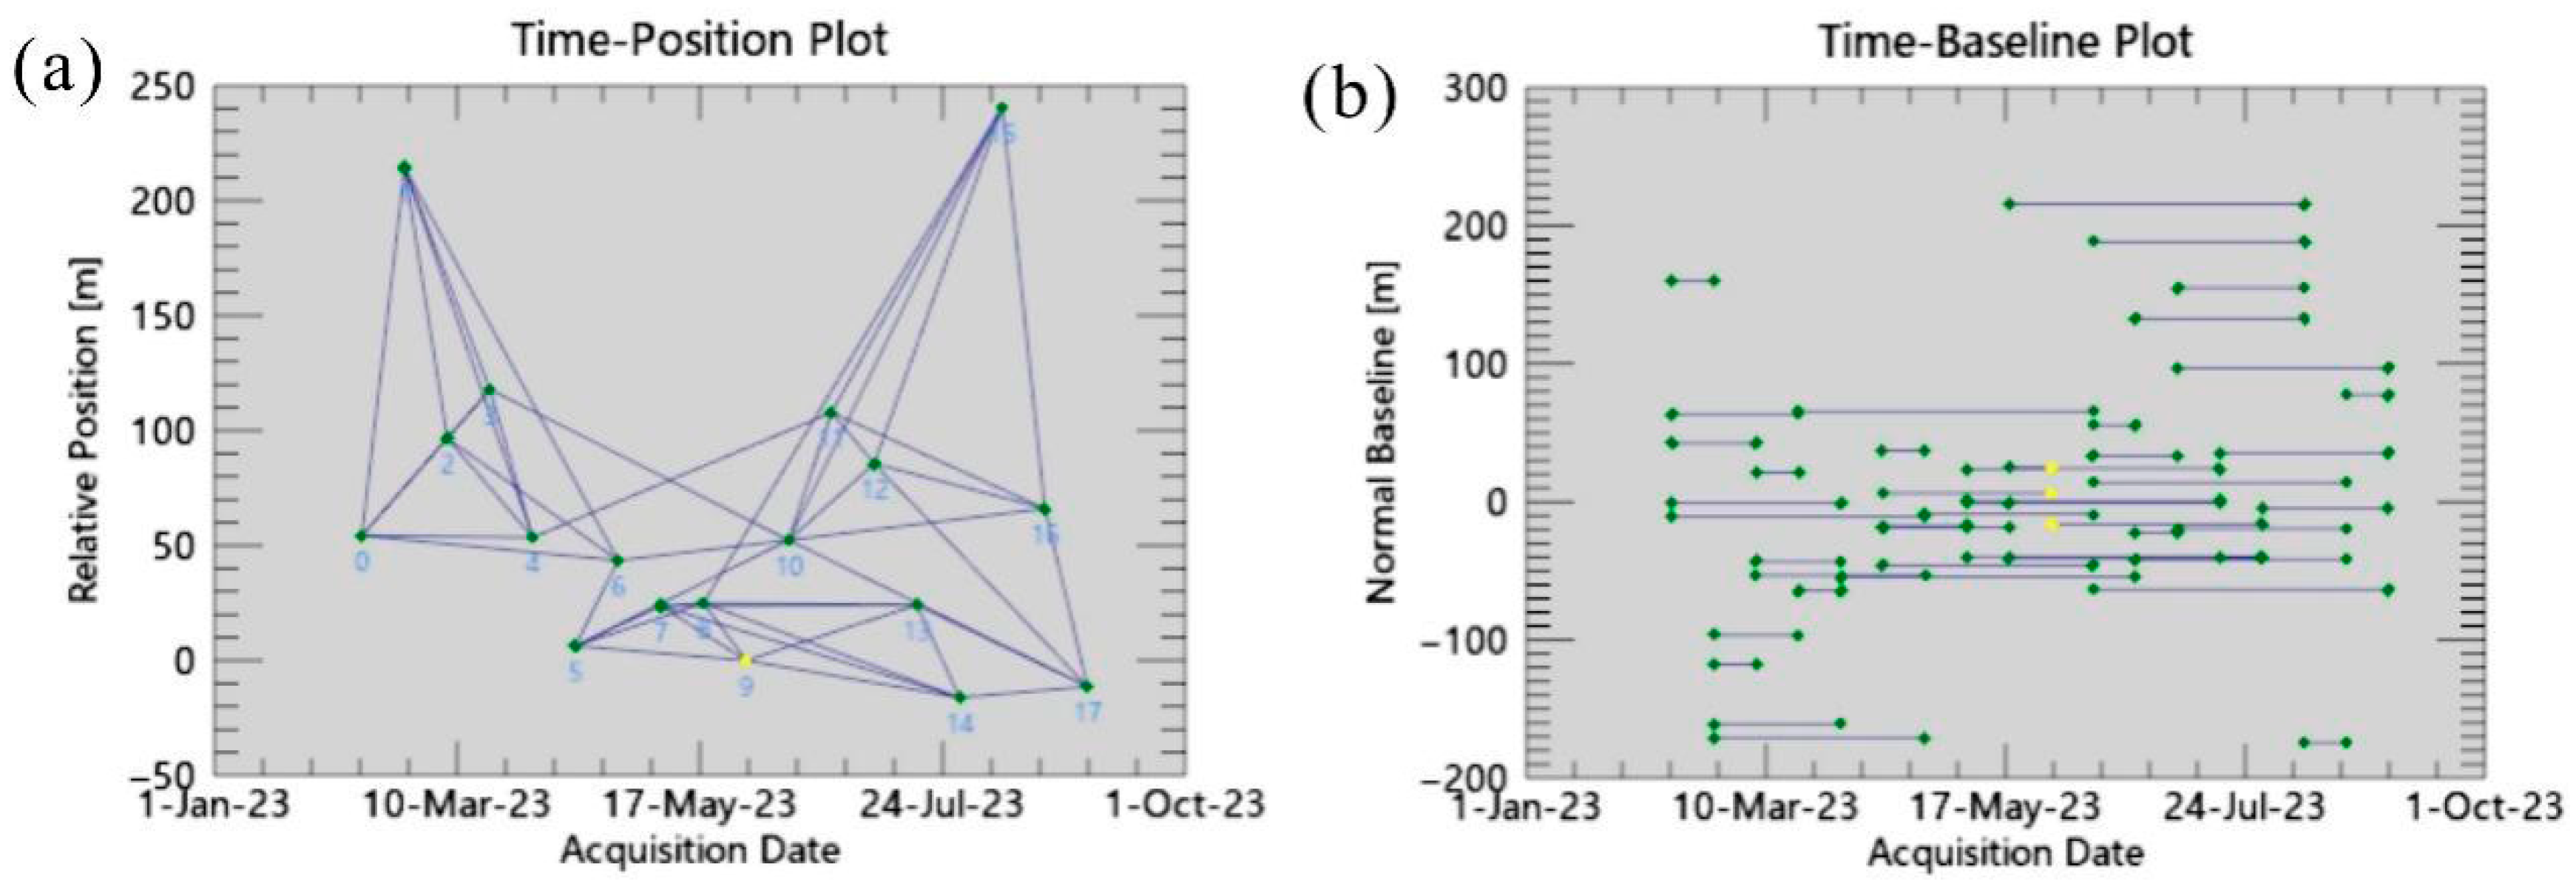
The spatial baseline threshold was set to 10% of the critical baseline and the temporal baseline threshold to 90 days. Under these constraints, an interferometric network of 47 pairs was generated (Figure 6). The acquisition on 30 May 2023 was selected as the super-master image.
Figure 6.
(a) Time-Position plot in the connection graph of SBAS-InSAR; (b) Time-Baseline plot in the connection graph of SBAS-InSAR.
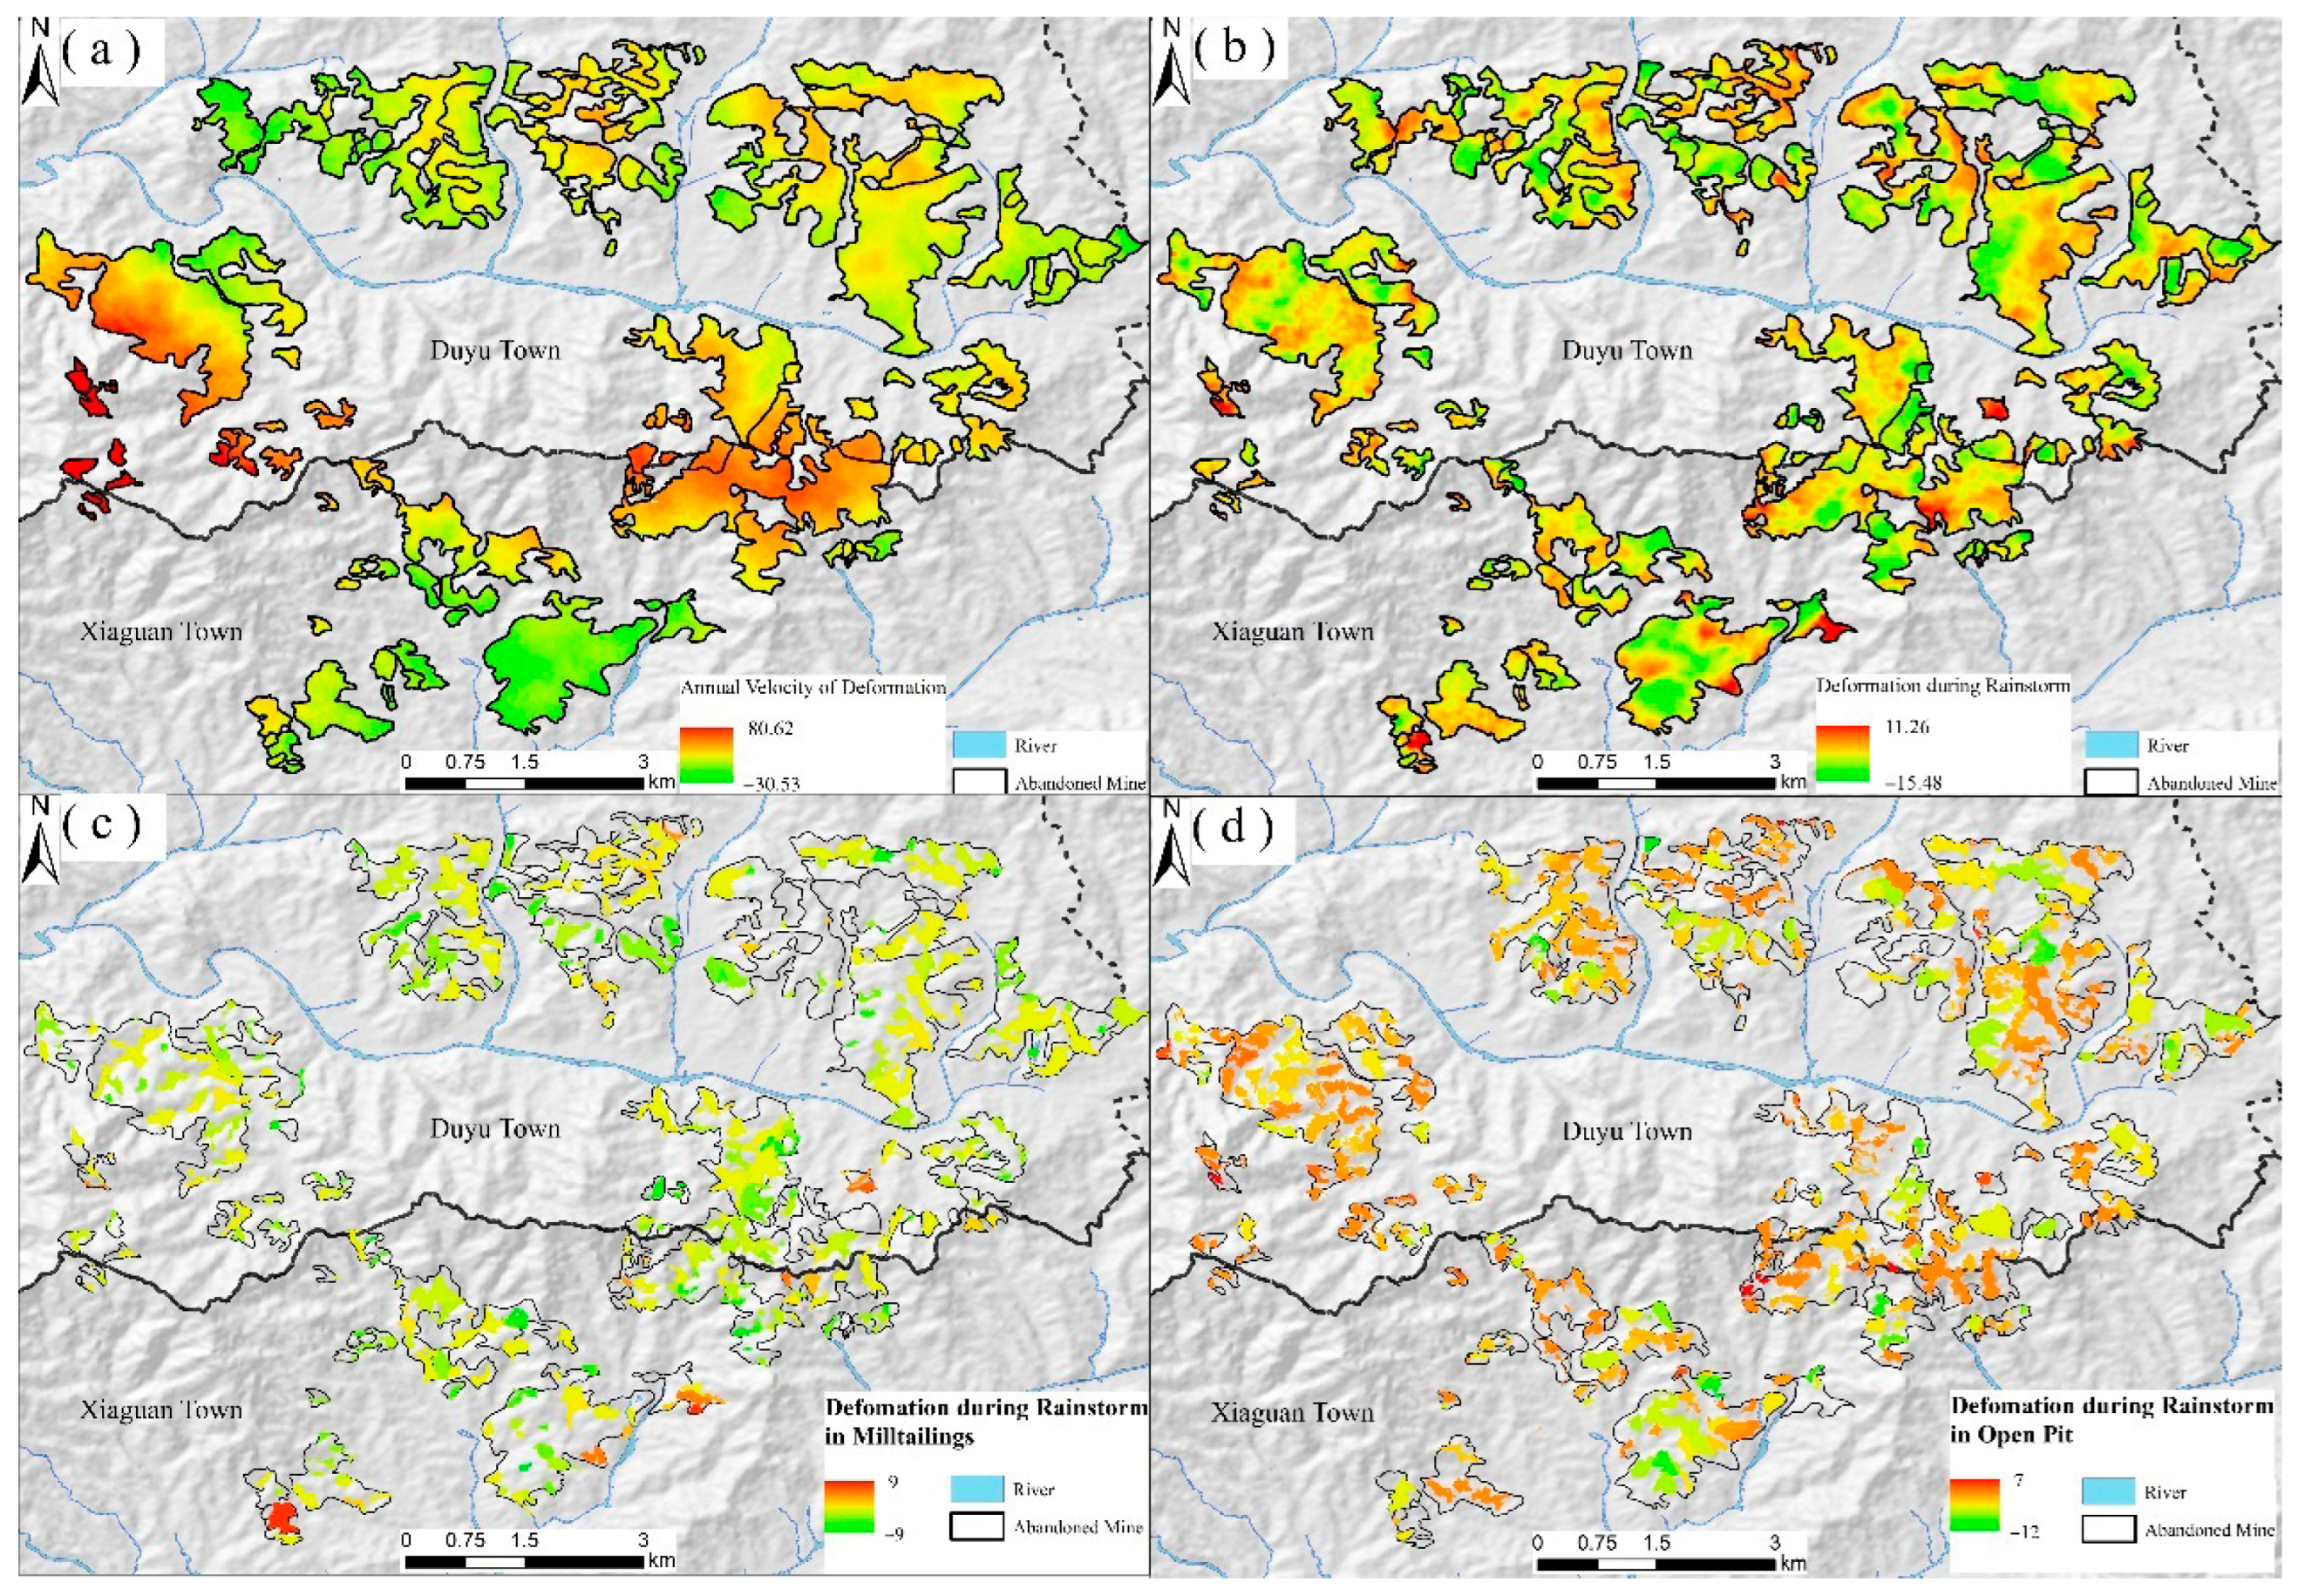
Surface deformation of the abandoned mines was retrieved using SBAS-InSAR. Based on Equation (6), LOS displacements were projected onto the vertical direction to derive the vertical deformation rate field (Figure 7a). The annual mean vertical deformation rates range from −30.53 to 80.62 mm/yr, with larger magnitudes clustered near the boundary between Duyu and Xiaguan Townships, indicating localized aggregation.
Figure 7.
Interpretation of surface displacement distribution map by SBAS-InSAR (a) Annual surface deformation rate; (b) Differential surface deformation variables between 10 August 2023 and 29 July 2023; (c) Differential displacement rate in milltailings area; (d) Surface deformation rate in open-pit area.
Rainfall-induced deformation was estimated by differencing the displacement fields on 29 July and 10 August 2023 (Figure 7b). The vertical displacement during the event ranges from −15.88 to 11.26 mm, revealing pronounced subsidence signals. Compared with the spatially clustered pattern of the annual rate field, rainfall-triggered deformation is distributed across most mining patches with varying magnitudes.
To characterize rainfall-period deformation by feature type, we aggregated pixel-wise displacements for open pits and for tailings deposits (Figure 7c,d). Open pits show a larger share of pixels classified as subsiding (69.51%) and a substantial near-zero portion (26.23%). In milltailings deposits, subsidence is also prevalent (56.03%), but uplift is more frequent (15.77%) than in open pits. This contrast reflects different process controls: pit floors and cut slopes tend to drain rapidly and undergo consolidation/settlement, yielding predominantly negative displacements; by contrast, tailings—composed of loose, hydraulically mobile material—exhibit bidirectional responses, with localized settlement where pore-pressure dissipates and positive displacements where runout and redeposition thicken the surface.
The larger subsiding fraction in open pits should not be interpreted as greater instability; rather, it arises from their geomorphic setting and from the areal basis of the aggregation. Interpreting sign-based proportions, we therefore emphasize patterns: tailings deposits show a broader mix of subsidence plus deposition, whereas open pits are dominated by settlement.
4.2. Results of Hotspot Analysis
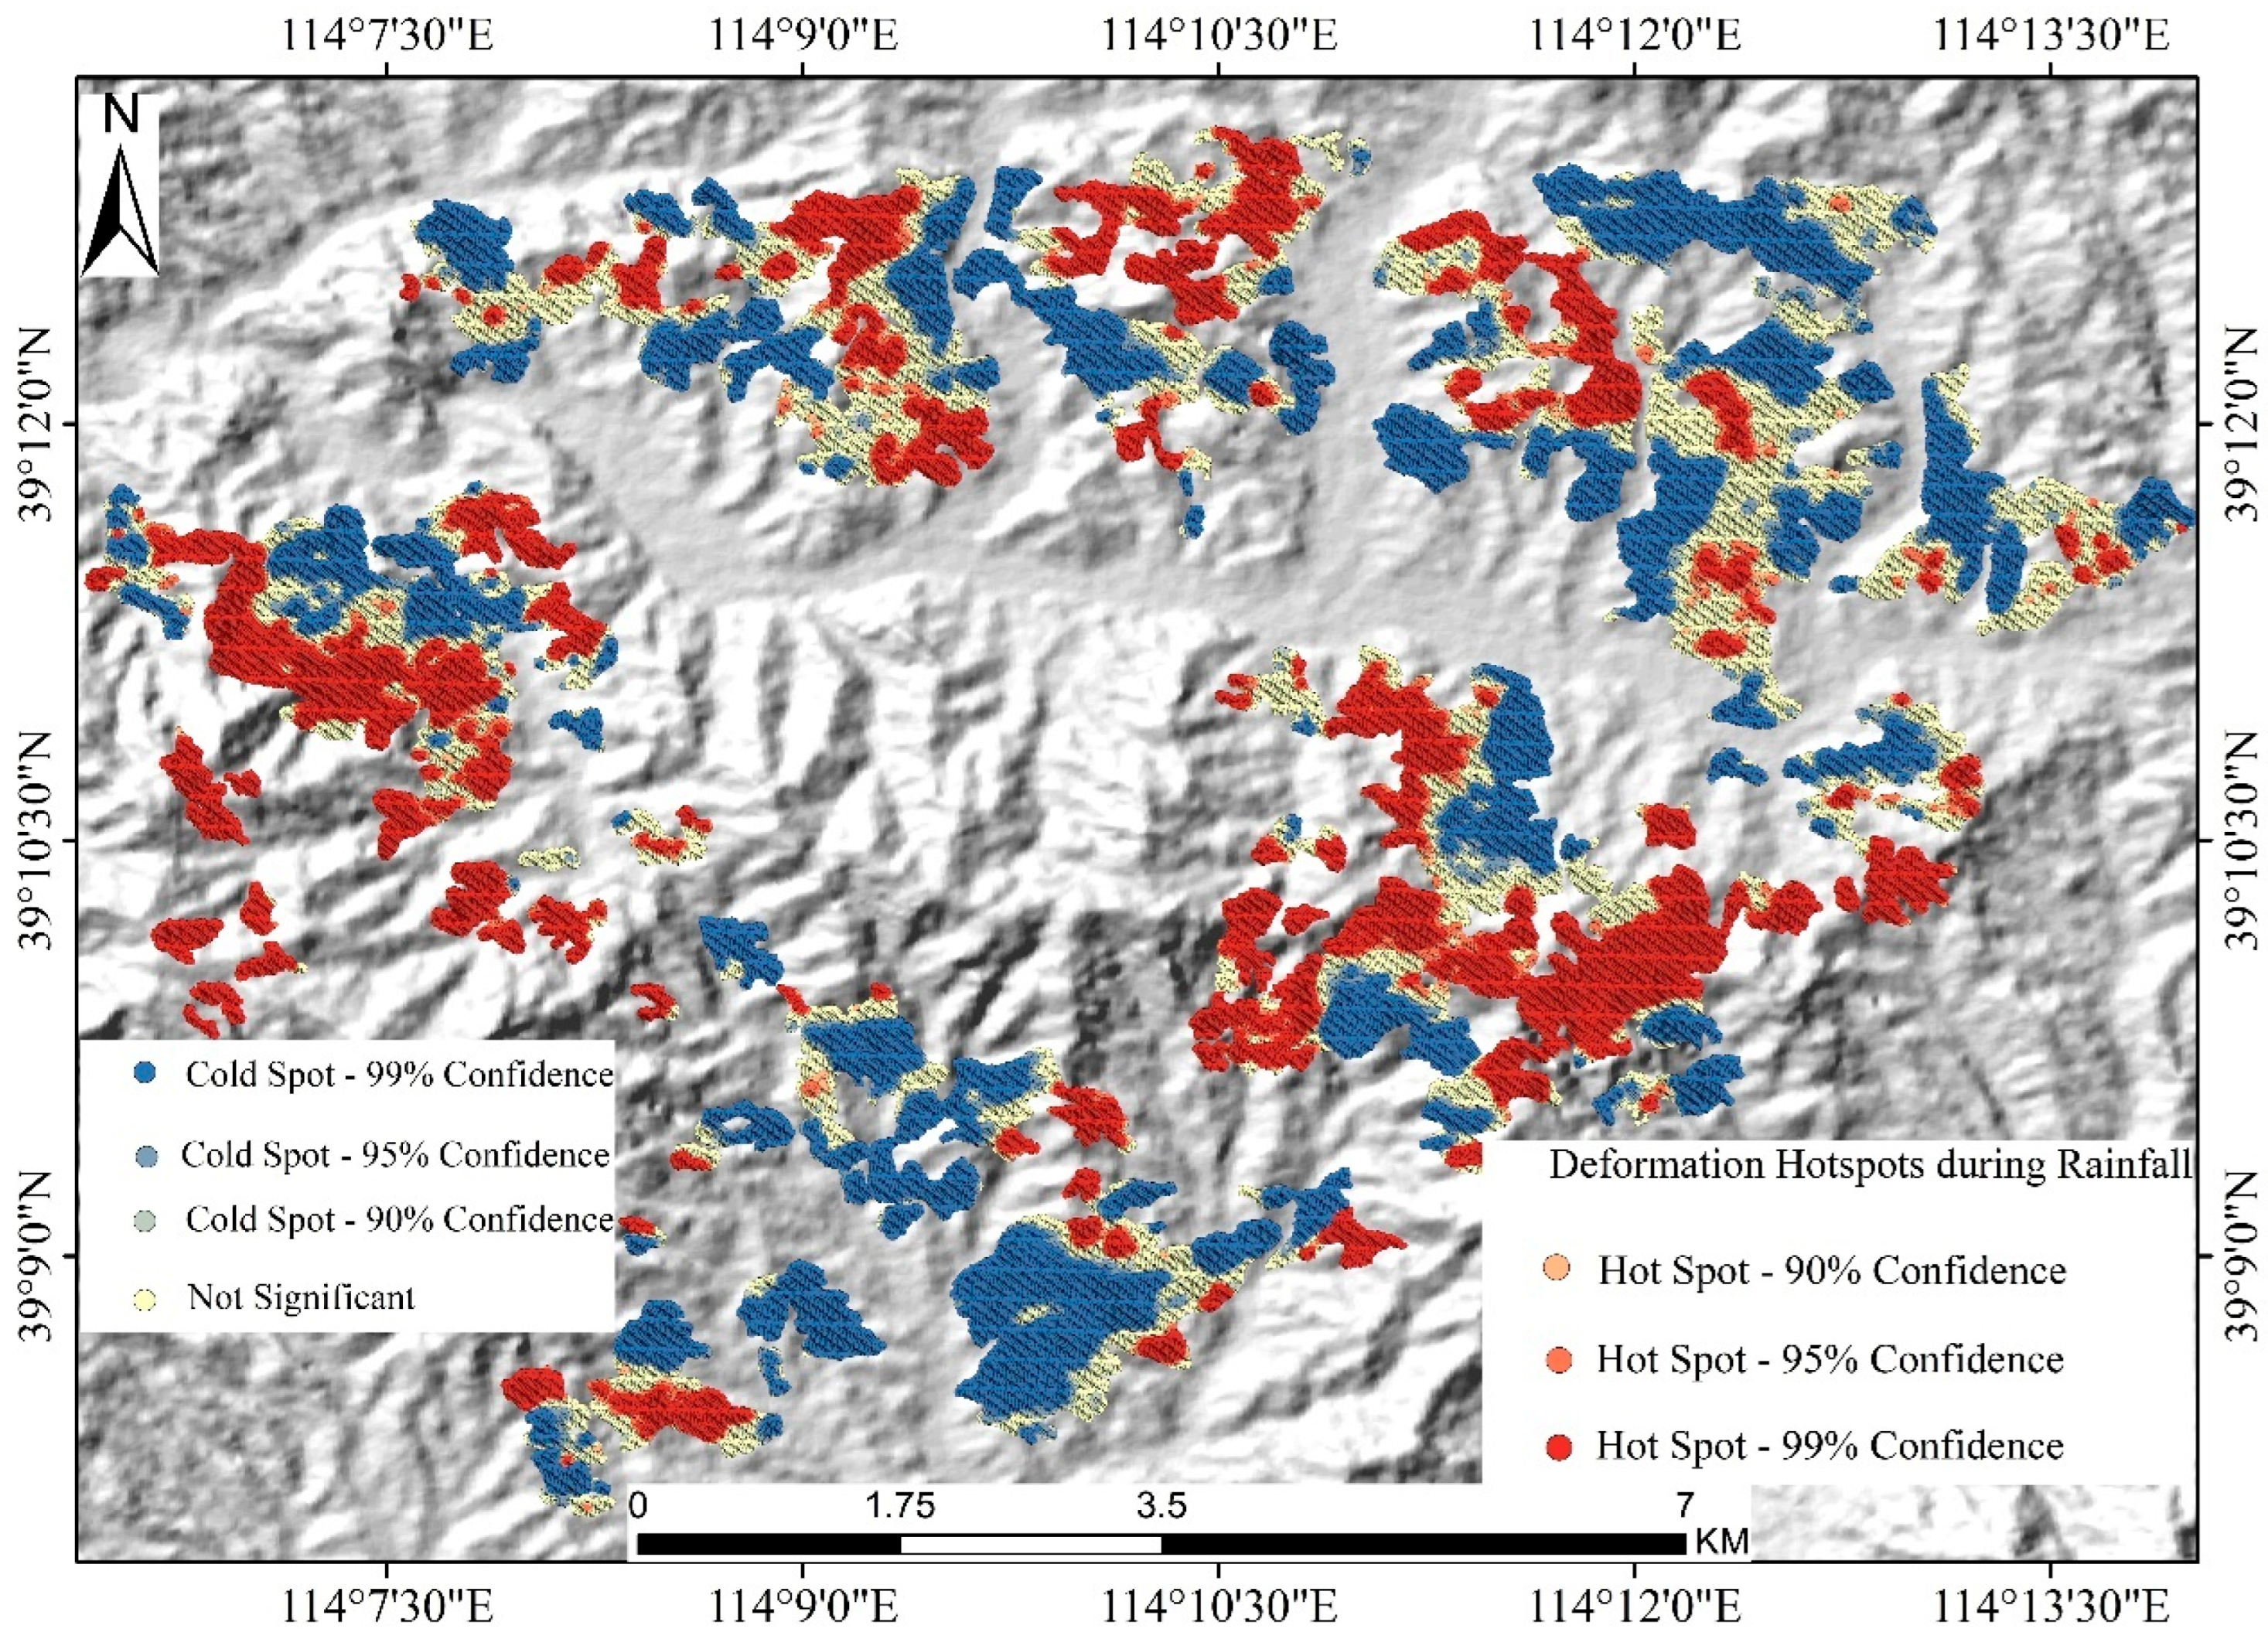
The hotspot map derived from signed SBAS-InSAR deformation (Figure 8) reveals pronounced spatial clustering of rainfall-induced motion, with clear heterogeneity among and within individual mining patches. Rather than being uniformly distributed, hot spots, cold spots, and non-significant areas occur as discrete patchy clusters, indicating that deformation responses vary substantially across the abandoned mine landscape.
Figure 8.
Hot spot map of surface deformation in the study area.
Spatially, 99% confidence hot spots are concentrated in several large, contiguous patches, particularly in the western and central-southern mining sectors, where uplift-dominated responses are most pronounced. In contrast, 99% confidence cold spots also form extensive clusters, but are more prominent in parts of the northern, northeastern, and central sectors, indicating localized subsidence-dominated deformation. In many mining patches, hot spots and cold spots coexist within the same disturbed area, with non-significant zones commonly distributed as transitional belts or mosaicked patches between them, further highlighting the complexity of rainfall-driven surface responses.
Across the study area, cold spots at the 99% confidence level account for 25.81%, representing clusters of significantly low (negative) values, i.e., subsidence-dominated areas; cold spots at 95% and 90% account for 4.56% and 2.58%, respectively. Non-significant areas cover 30.69% and are spatially scattered without clear clustering. In contrast, hot spots at the 99% confidence level comprise 27.81% of the area, corresponding to uplift-dominated zones with strong spatial aggregation; hot spots at 95% and 90% account for 3.23% and 5.33%, respectively, showing similar but less significant spatial patterns.
4.3. Results of Bivariate Spatial Autocorrelation Analysis
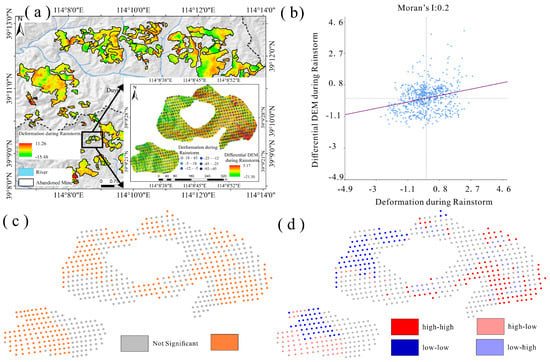
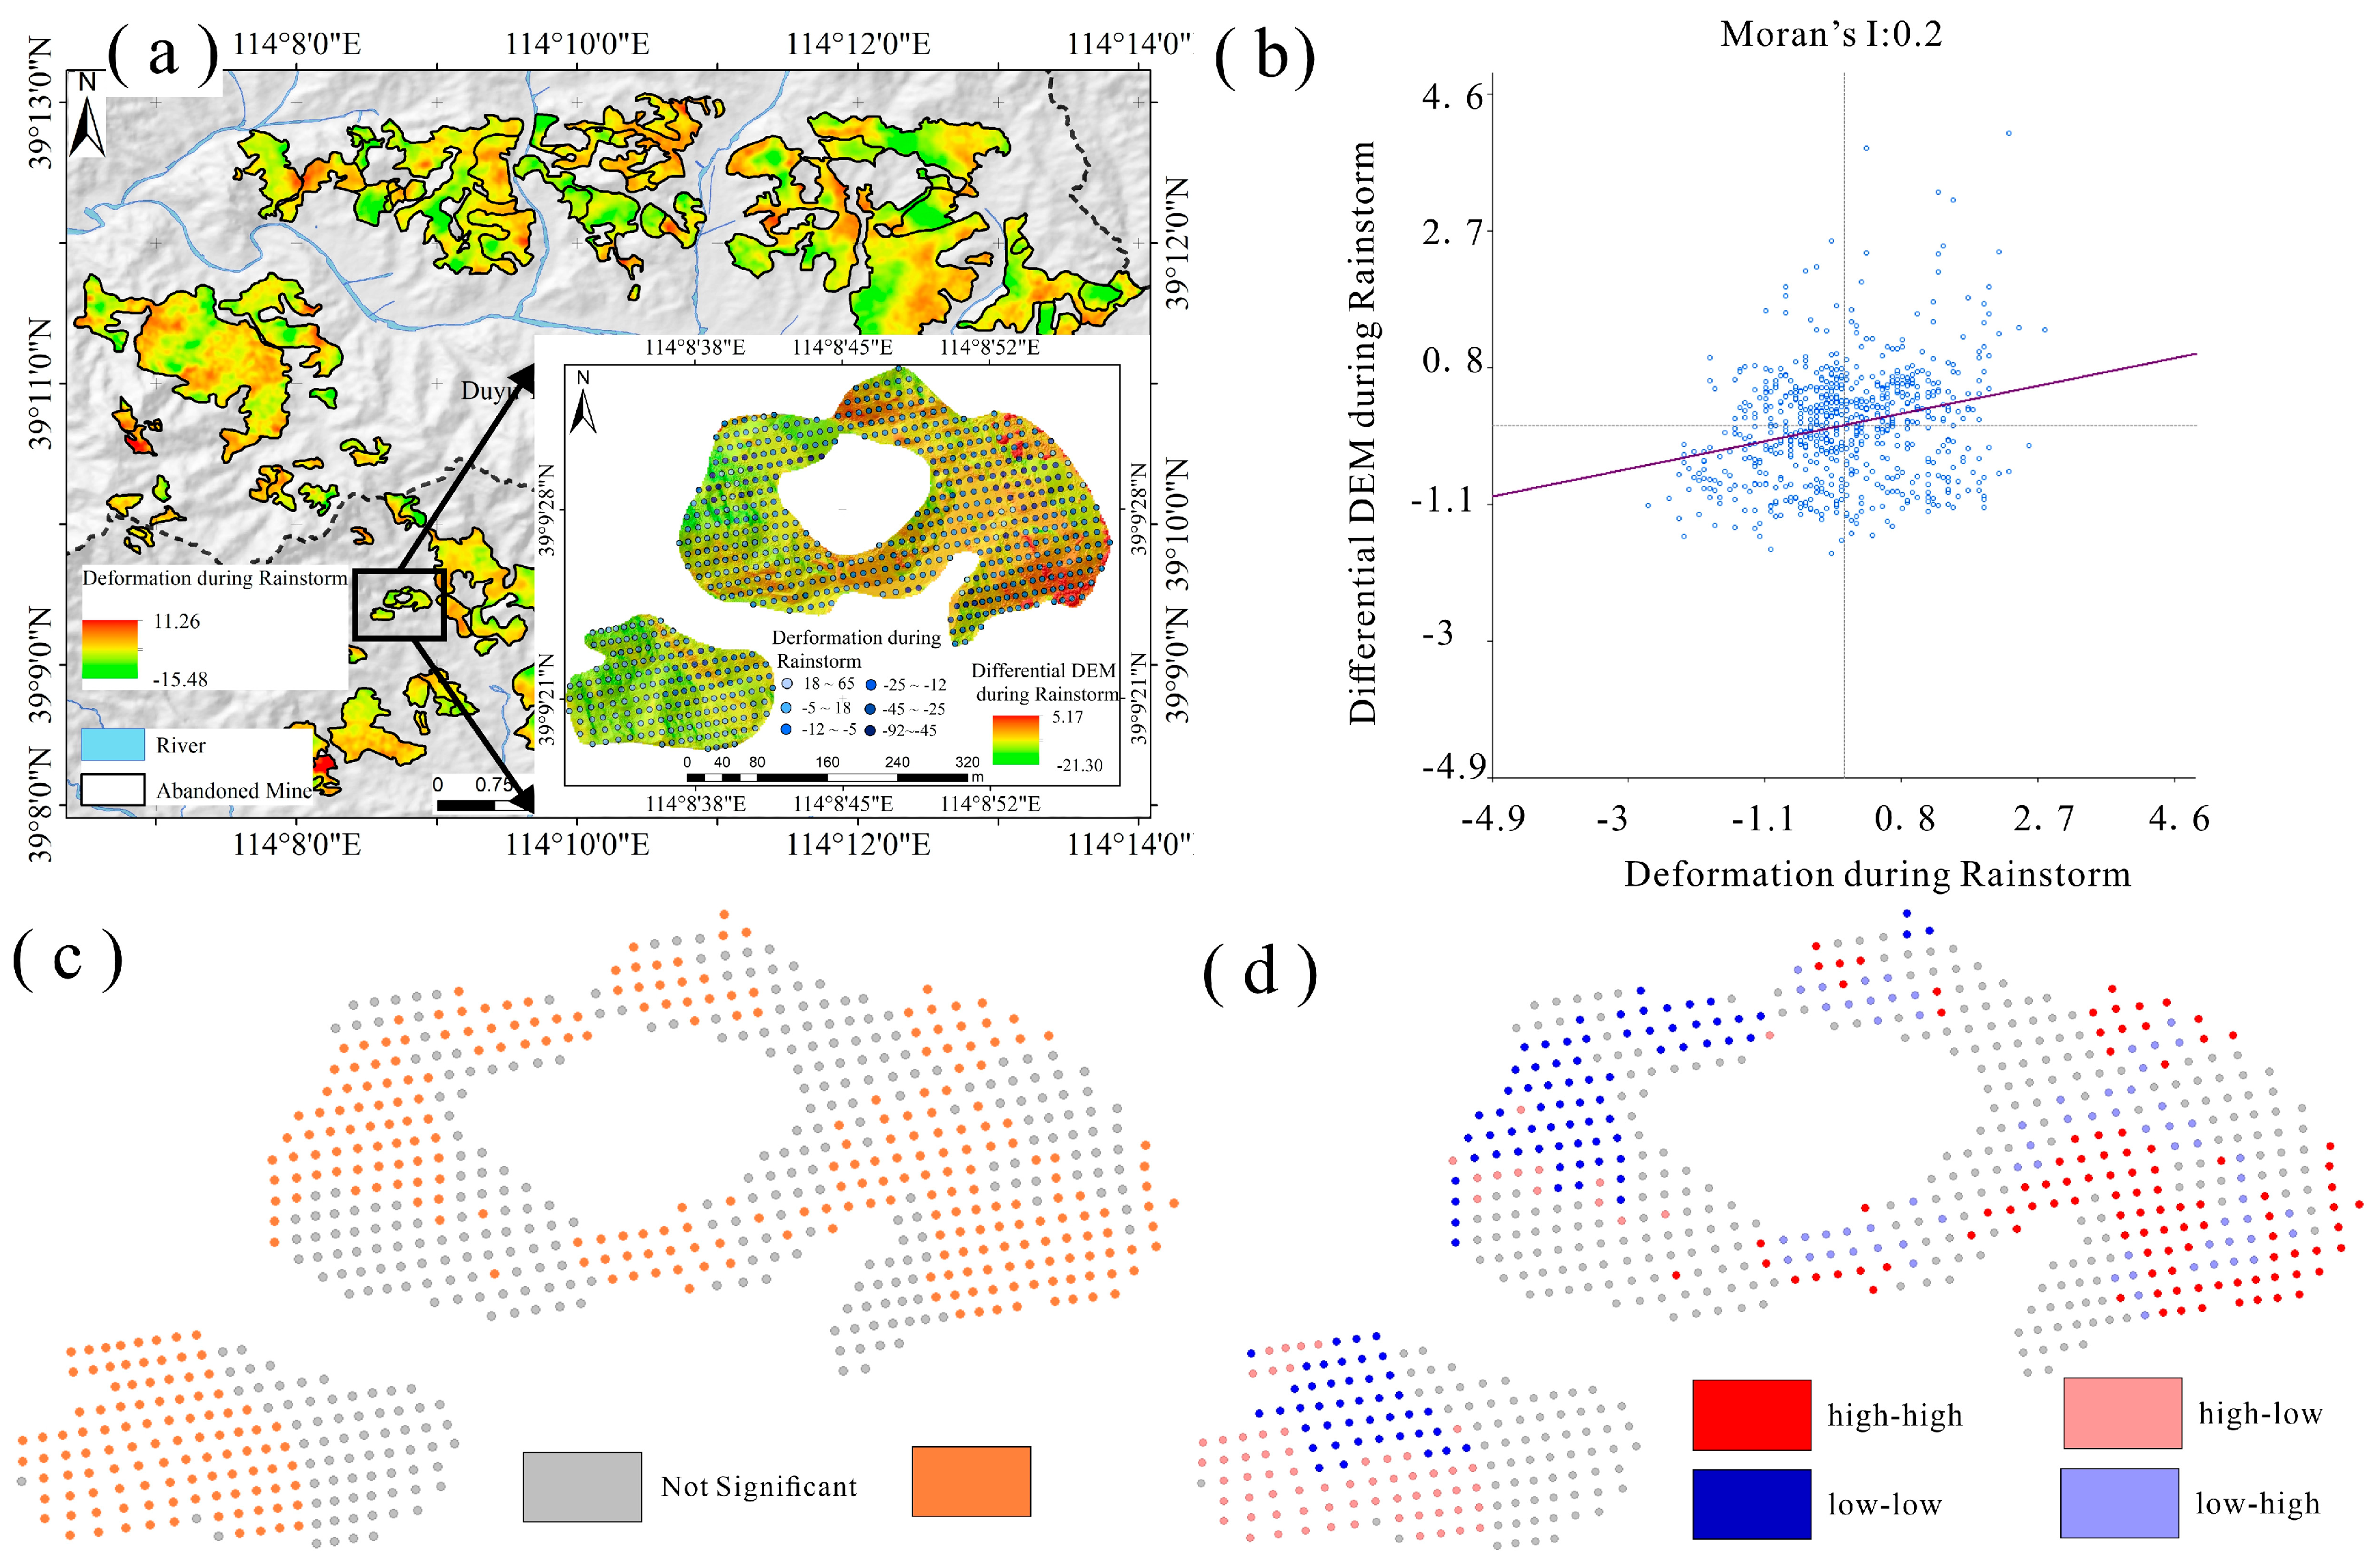
To evaluate the spatial consistency between InSAR-derived deformation and terrain change, the signed deformation field was compared with the differential DEM (dDEM), and bivariate LISA was used to quantify local co-dependence patterns (H–H/L–L/H–L/L–H). The global Moran’s is 0.20 (Figure 9b), indicating a weak but positive overall spatial association between the two variables. However, this integrated value should be interpreted cautiously, because the strength and spatial extent of the correlation differ between positive coupling and negative coupling.
Figure 9.
Comparison of differential DEM and InSAR (a) Spatial distribution map; (b) Moran scatter plot; (c) significant spatial distribution map; (d) hot spot map.
Permutation-based significance analysis (; Figure 9c) shows that 51.9% of the area exhibits significant spatial autocorrelation. The bivariate LISA cluster map (Figure 9d) reveals that high–high clusters account for 6.68% of the area and represent locations where positive InSAR deformation coincides with positive dDEM values, indicating local uplift–deposition coupling. These clusters are mainly concentrated in the eastern and central-southern sectors of the target area. In contrast, low–low clusters occupy 14.33% of the area and correspond to locations where negative InSAR deformation co-occurs with negative dDEM values, reflecting subsidence–erosion coupling. These zones are more extensive in the western and southwestern sectors. The larger proportion of low–low clusters relative to high–high clusters suggests that the spatial coupling associated with subsidence and erosion is more widespread than that associated with uplift and deposition in this case.
By comparison, high–low and low–high clusters together account for 16.42% of the area, indicating local mismatches between InSAR deformation and dDEM. These discordant patches are spatially scattered and may reflect the combined influence of microtopography, non-uniform sediment redistribution, local drainage effects, or methodological differences between the two datasets. Overall, the bivariate LISA results show that the positive and negative components of the deformation field are not spatially symmetric, and that the overall Moran’s value mainly reflects the combined contribution of a relatively limited uplift–deposition association and a more spatially extensive subsidence–erosion association.
5. Discussion
The combined InSAR and UAV-derived dDEM results indicate that rainfall-induced deformation in the studied tailings deposits is highly heterogeneous in space, with both subsidence-dominated lowering and localized uplift associated with post-event material redistribution. SBAS-InSAR reveals spatially heterogeneous responses—subsidence clusters in mechanically weakened or highly drained sectors and uplift in areas of post-event material thickening—while the dDEM supplies event-scale thickness changes at high spatial resolution. The two data streams are therefore complementary: InSAR provides continuous regional cues to where change occurs, and dDEM quantifies how much and of what sign that change is.
SBAS-InSAR retrieved time-series deformation from 11 February to 3 September 2023 and delineated the spatial patterns during the rainfall event. The results show pronounced subsidence in milltailings deposits under intense rainfall, indicating instability driven by rapid infiltration and loosening of unconsolidated materials. Consistent with prior understanding, subsidence/uplift tends to be localized and jointly governed by topography, mining history, and tailings properties. Compared with other feature classes, milltailings areas exhibit larger magnitudes and higher rainfall sensitivity; nevertheless, the overall deformation field remains highly heterogeneous, reflecting substantial intra-site variability in geological and material conditions.
Hotspot analysis highlights the spatial clustering of rainfall-induced deformation. Cold spots at the 99% confidence level account for 25.81%, typically corresponding to mechanically stable units or weak hydrologic response; hot spots at the 99% level cover 27.81%, indicating strongly clustered subsidence/uplift with rapid rainfall response; non-significant areas constitute 30.69% without clear clustering. These hotspots provide practical guidance for identifying and prioritizing debris-flow-related target zones for field surveys and monitoring deployment. In contrast, the bivariate LISA high–low/low–high classes (Figure 9d) underscore the spatial heterogeneity and complexity of rainfall-driven surface processes.
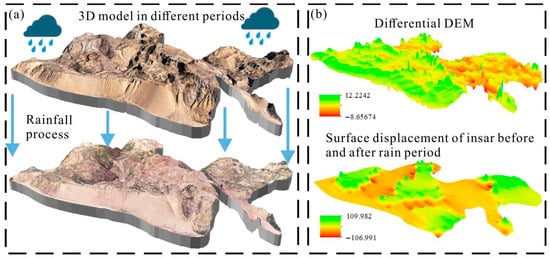
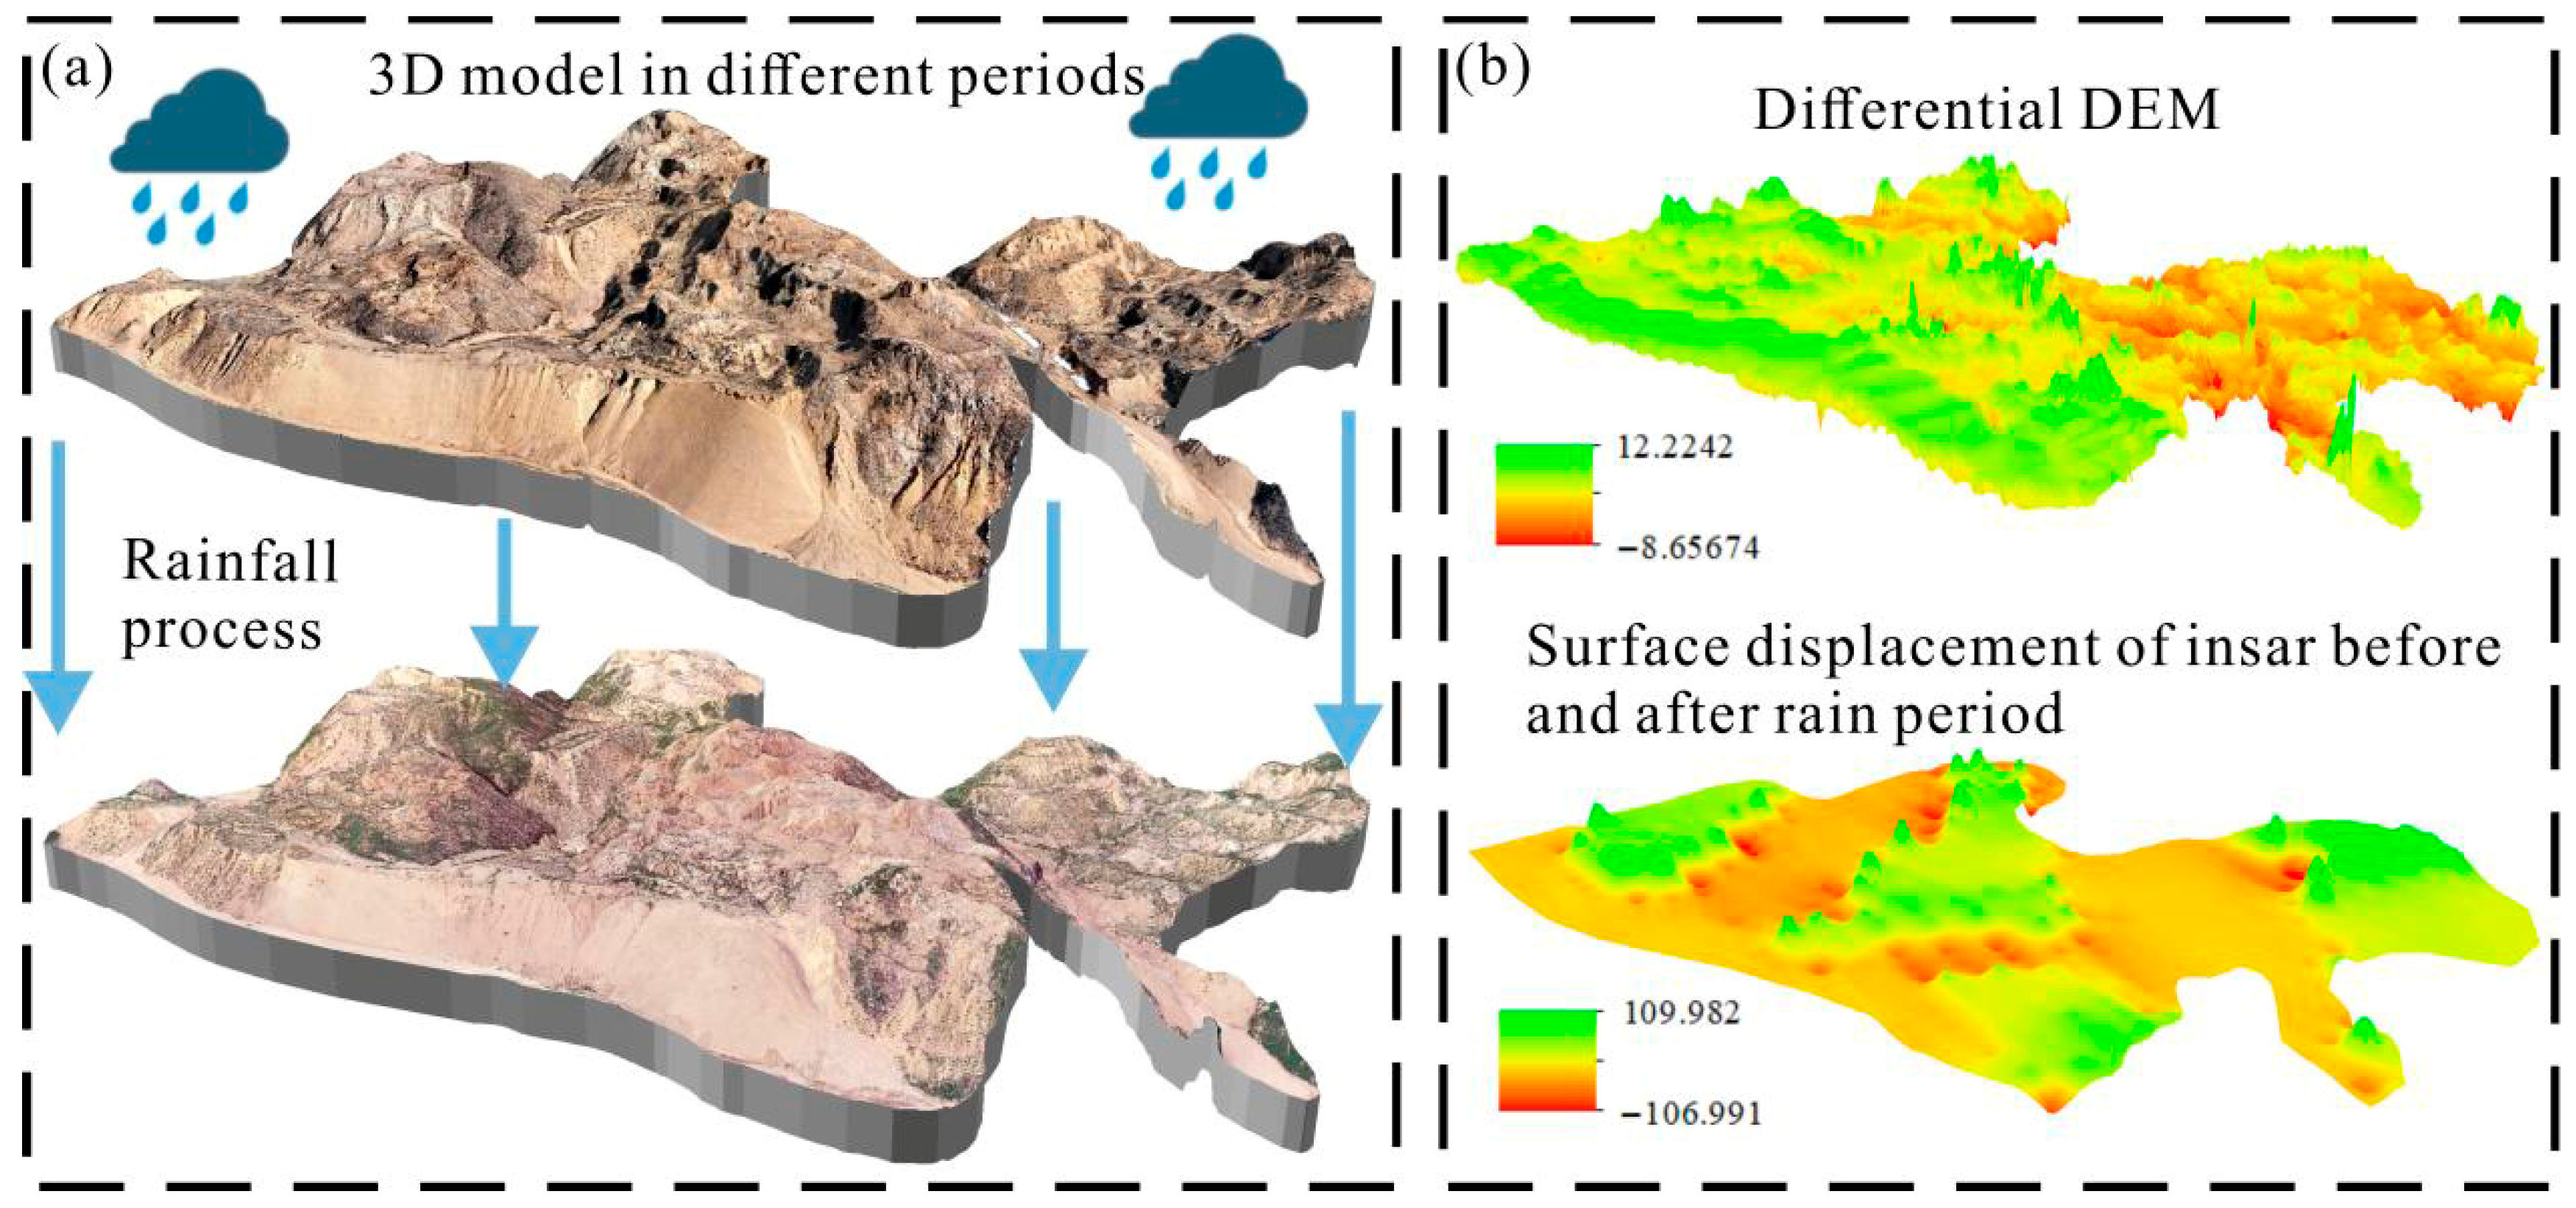
Differential DEM analysis offers a detailed depiction of pre- to post-event changes, whereas pre/post optical imagery over extensive abandoned mines shows only subtle visual contrasts (Figure 10a). When compared quantitatively, the dDEM and SBAS-InSAR results differ in magnitude more than in pattern: the two products broadly agree on the spatial extent and polarity of change, but the dDEM often reports larger local thickness changes than the SAR time series (Figure 10b). The large difference in native spatial resolution between InSAR and UAV-derived dDEM likely contributes to the discrepancy in magnitude between the two datasets. UAV dDEM captures short-wavelength erosion–deposition features that are smoothed in the coarser InSAR observations. Therefore, the comparison between the two products should emphasize spatial pattern and polarity rather than one-to-one equivalence in absolute values. Given the study area’s large extent and the rapid, high-magnitude deformation triggered by extreme rainfall—conditions that often lead to phase discontinuities and unwrapping challenges [27]—fine-scale quantification benefits from DEM support [28]. Overall, InSAR and differential DEM are mutually corroborative and complementary: SBAS-InSAR excels at regional, time-continuous monitoring, whereas differential DEM refines event-scale measurements and local mechanism interpretation.
Figure 10.
(a) Three-dimensional model of abandoned mine before and after rainfall; (b) spatial difference distribution map of surface deformation variables by differential dem and SBAS-InSAR before and after rainfall.
From an operational perspective, the combined workflow also provides a practical basis for post-rainfall prioritization. In large, abandoned mine districts, it is rarely feasible to conduct immediate high-resolution UAV surveys or intensive field checks over the entire affected area. The present results show that sign-specific InSAR hotspot screening can be used to identify candidate zones of rapid response, while the subsequent dDEM verification helps distinguish between settlement-dominated, erosion-dominated, and deposition-dominated sectors. This tiered interpretation can support more efficient deployment of UAV resurvey, field validation, and follow-up hazard assessment in time-sensitive emergency settings.
Several constraints remain. (1) Temporal mismatch and decorrelation: debris flows can initiate and terminate within hours, while Sentinel-1’s 12-day revisit and rapid, high-magnitude motion may reduce coherence, biasing InSAR signals toward the more stable tail of the event. (2) Geometry and projection: LOS-projected deformation is sensitive to incidence/azimuth; vertical projection reduces—but does not eliminate—geometric ambiguity on steep, aspect-dependent slopes. (3) UAV coverage and timing: UAV surveys are inherently site-scale and cost-intensive; coverage decisions depend on the targeting heuristic and access constraints, and post-event timing controls how much scour/deposition is captured versus reworked. (4) Co-registration and vertical datum: dDEM reliability hinges on accurate alignment to the baseline and stable-area controls; any residual bias propagates into thickness estimates. (5) The weak bivariate Moran’s reported here should not be interpreted solely as evidence of limited process coupling, because it may also be partly conditioned by the chosen grid resolution and spatial weight structure. Coarser grids may blend opposite-sign erosion/deposition signals, whereas finer grids may enhance local noise; likewise, alternative neighborhood definitions could change the balance of high–high and low–low associations. The current result is therefore scale- and weight-dependent, and future sensitivity tests are needed to evaluate its robustness. Future work could fuse ascending/descending InSAR to improve 2-D/3-D motion retrievals, incorporate intensity/backscatter change for rapid screening, and leverage multitemporal UAV or airborne lidar to constrain short-lived runout phases between SAR passes.
6. Conclusions
The results demonstrate that rainfall-induced deformation in the studied tailings deposits is highly heterogeneous in space. They further show that the combined use of SBAS-InSAR, UAV-derived differential DEMs, hotspot analysis, and bivariate spatial autocorrelation provides a practical framework for identifying deformation-prone and debris-flow-related terrain-change target zones in large, abandoned mine areas. The main conclusions are as follows:
- (1)
- Time-series SBAS-InSAR reveals pronounced spatial heterogeneity of deformation. Post-rainfall subsidence is most evident in milltailings deposits, highlighting their high sensitivity to infiltration and limited stability.
- (2)
- The bivariate global Moran’s I between the differential DEM and InSAR-derived deformation is 0.20, indicating a weak positive spatial association that is dispersed and of low intensity.
- (3)
- Hotspot analysis identifies significant clustering: ~27.8% of the area forms high–high clusters (large magnitudes, rapid response), whereas 25.81% forms low–low clusters (small deformation, stable response); the remainder is largely non-significant or heterogeneous.
- (4)
- SBAS-InSAR and differential DEM are mutually corroborative and complementary—SBAS-InSAR supports regional, time-continuous monitoring, while differential DEM refines event-scale, high-resolution quantification. The hotspot and LISA outcomes provide actionable guidance for identifying and prioritizing debris-flow-related target zones for field investigation and monitoring deployment in critical zones, supporting large-area risk assessment and early warning in abandoned mine settings.
Author Contributions
Conceptualization, H.Z., W.W. and B.C.; methodology, H.Z.; software, Z.Z.; validation, J.C.; formal analysis, H.Z. and B.C.; investigation, J.Y.; resources, W.W.; data curation, B.C.; writing—original draft preparation, H.Z.; writing—review and editing, H.Z. and B.C.; visualization, H.Z.; supervision, J.D.; project administration, B.C.; funding acquisition, B.C. All authors have read and agreed to the published version of the manuscript.
Funding
This research was funded by the National Natural Science Foundation of China, grant number 4237072116, and the National Key Historical Abandoned Mine Demonstration Project of China.
Data Availability Statement
The datasets generated or analyzed during the current study are available from the corresponding authors upon reasonable request.
Conflicts of Interest
Author Jingzhou Yang is affiliated with Shanxi Province Geological Survey Bureau 217 Geological Team Co., Ltd. The authors declare that this affiliation did not affect the study design, data analysis, interpretation of results, or the decision to publish the manuscript. The authors declare no other conflicts of interest.
References
- Rastner, P.; Strozzi, T.; Paul, F. Fusion of Multi-Source Satellite Data and DEMs to Create a New Glacier Inventory for Novaya Zemlya. Remote Sens. 2017, 9, 1122. [Google Scholar] [CrossRef] [Scilit]
- Tang, C.; Zhu, J.; Ding, J.; Cui, X.F.; Chen, L.; Zhang, J.S. Catastrophic Debris Flows Triggered by a 14 August 2010 Rainfall at the Epicenter of the Wenchuan Earthquake. Landslides 2011, 8, 485–497. [Google Scholar] [CrossRef] [Scilit]
- Allen, S.K.; Rastner, P.; Arora, M.; Huggel, C.; Stoffel, M. Lake Outburst and Debris Flow Disaster at Kedarnath, June 2013: Hydrometeorological Triggering and Topographic Predisposition. Landslides 2016, 13, 1479–1491. [Google Scholar] [CrossRef] [Scilit]
- Coussot, P.; Meunier, M. Recognition, Classification and Mechanical Description of Debris Flows. Earth Sci. Rev. 1996, 40, 209–227. [Google Scholar] [CrossRef] [Scilit]
- Cao, Y.; Zhu, X.; Liu, B.; Nan, Y. A Qualitative Study of the Critical Conditions for the Initiation of Mine Waste Debris Flows. Water 2020, 12, 1536. [Google Scholar] [CrossRef] [Scilit]
- Salvatici, T.; Morelli, S.; Pazzi, V.; Frodella, W.; Fanti, R. Debris Flow Hazard Assessment by Means of Numerical Simulations: Implications for the Rotolon Creek Valley (Northern Italy). J. Mt. Sci. 2017, 14, 636–648. [Google Scholar] [CrossRef] [Scilit]
- Duan, Z.; Chen, J.; Xie, J.; Li, Q.; Zhang, H.; Chen, C. Study on the Evolution Characteristics of Dam Failure Due to Flood Overtopping of Tailings Ponds. Water 2024, 16, 2406. [Google Scholar] [CrossRef] [Scilit]
- Cao, C.; Yang, L.; Zhang, W.; Zhang, W.; Lin, G.; Liu, K. A Land Spatial Optimization Approach for the Reutilization of Abandoned Mine Land: A Case Study of Ningbo, China. Land 2025, 14, 326. [Google Scholar] [CrossRef] [Scilit]
- Jiang, Z.; Wang, J.; Zhang, G.; Cui, P.; Yang, C.; Zhang, Y.; Zhang, B.; Li, C.; Wang, H.; Liu, J.; et al. An Innovative Approach to Evaluate Debris Flow Scale-Activity across Diverse Aridity Zones: Fusion of Image Recognition and Geomorphometric Analysis. Catena 2025, 250, 108753. [Google Scholar] [CrossRef] [Scilit]
- Miura, H. Fusion Analysis of Optical Satellite Images and Digital Elevation Model for Quantifying Volume in Debris Flow Disaster. Remote Sens. 2019, 11, 1096. [Google Scholar] [CrossRef] [Scilit]
- Lenart, J.; Šilhán, K. Chronic Rockfall in Abandoned Quarry: Chronology, Modelling and Implications. Catena 2024, 243, 108168. [Google Scholar] [CrossRef] [Scilit]
- Dai, M.; Li, H.; Long, B.; Wang, X. Quantitative Identification of Landslide Hazard in Mountainous Open-Pit Mining Areas Combined with Ascending and Descending Orbit InSAR Technology. Landslides 2024, 21, 2975–2991. [Google Scholar] [CrossRef] [Scilit]
- Zhao, R.; Du, S.; Zheng, M.; Guo, Q.; Wang, L.; Wang, T.; Guo, X.; Fernández, J. Advances and Future Directions in Monitoring and Predicting Secondary Surface Subsidence in Abandoned Mines. Remote Sens. 2025, 17, 379. [Google Scholar] [CrossRef] [Scilit]
- Wasowski, J.; Bovenga, F. Investigating Landslides and Unstable Slopes with Satellite Multi Temporal Interferometry: Current Issues and Future Perspectives. Eng. Geol. 2014, 174, 103–138. [Google Scholar] [CrossRef] [Scilit]
- Herrera, G.; Tomás, R.; Vicente, F.; Lopez-Sanchez, J.M.; Mallorquí, J.J.; Mulas, J. Mapping Ground Movements in Open Pit Mining Areas Using Differential SAR Interferometry. Int. J. Rock Mech. Min. Sci. 2010, 47, 1114–1125. [Google Scholar] [CrossRef] [Scilit]
- Jin, A.B.; Chen, S.J.; Zhao, A.Y.; Sun, H.; Zhang, Y.S. Numerical simulation of open-pit mine slope based on unmanned aerial vehicle photogrammetry. Rock Soil Mech. 2021, 42, 255–264. [Google Scholar]
- Hsieh, Y.C.; Chan, Y.C.; Hu, J.C. Digital Elevation Model Differencing and Error Estimation from Multiple Sources: A Case Study from the Meiyuan Shan Landslide in Taiwan. Remote Sens. 2016, 8, 199. [Google Scholar] [CrossRef] [Scilit]
- Walter, F.; Hodel, E.; Mannerfelt, E.S.; Cook, K.; Dietze, M.; Estermann, L.; Wenner, M.; Farinotti, D.; Fengler, M.; Hammerschmidt, L.; et al. Brief Communication: An Autonomous UAV for Catchment-Wide Monitoring of a Debris Flow Torrent. Nat. Hazards Earth Syst. Sci. 2022, 22, 4011–4018. [Google Scholar] [CrossRef] [Scilit]
- Piras, M.; Taddia, G.; Forno, M.G.; Gattiglio, M.; Aicardi, I.; Dabove, P.; Russo, S.L.; Lingua, A. Detailed Geological Mapping in Mountain Areas Using an Unmanned Aerial Vehicle: Application to the Rodoretto Valley, NW Italian Alps. Geomat. Nat. Hazards Risk 2017, 8, 137–149. [Google Scholar] [CrossRef] [Scilit]
- Xie, M.; Zhao, W.; Ju, N.; He, C.; Huang, H.; Cui, Q. Landslide Evolution Assessment Based on InSAR and Real-Time Monitoring of a Large Reactivated Landslide, Wenchuan, China. Eng. Geol. 2020, 277, 105781. [Google Scholar] [CrossRef] [Scilit]
- Ma, S.; Qiu, H.; Hu, S.; Yang, D.; Liu, Z. Characteristics and Geomorphology Change Detection Analysis of the Jiangdingya Landslide on July 12, 2018, China. Landslides 2021, 18, 383–396. [Google Scholar] [CrossRef] [Scilit]
- Berardino, P.; Fornaro, G.; Lanari, R.; Sansosti, E. A New Algorithm for Surface Deformation Monitoring Based on Small Baseline Differential SAR Interferograms. IEEE Trans. Geosci. Remote Sens. 2002, 40, 2375–2383. [Google Scholar] [CrossRef] [Scilit]
- Cascini, L.; Fornaro, G.; Peduto, D. Advanced Low- and Full-Resolution DInSAR Map Generation for Slow-Moving Landslide Analysis at Different Scales. Eng. Geol. 2010, 112, 29–42. [Google Scholar] [CrossRef] [Scilit]
- Anselin, L.; Rey, S.J. Spatial Econometrics in an Age of CyberGIScience. Int. J. Geogr. Inf. Sci. 2012, 26, 2211–2226. [Google Scholar] [CrossRef] [Scilit]
- Turner, D.; Lucieer, A.; De Jong, S. Time Series Analysis of Landslide Dynamics Using an Unmanned Aerial Vehicle (UAV). Remote Sens. 2015, 7, 1736–1757. [Google Scholar] [CrossRef] [Scilit]
- Wheaton, J.M.; Brasington, J.; Darby, S.E.; Sear, D.A. Accounting for Uncertainty in DEMs from Repeat Topographic Surveys: Improved Sediment Budgets. Earth Surf. Process. Landf. 2010, 35, 136–156. [Google Scholar] [CrossRef] [Scilit]
- Chen, Y.; Dai, K.; Chang, L.; Deng, J.; Zhuo, G.; Dong, X.; Liu, X.; Shao, Y. The Pre-Processing InSAR Feasibility Assessment Method for Wide-Area Slope Displacement Monitoring. Int. J. Appl. Earth Obs. Geoinf. 2025, 136, 104336. [Google Scholar] [CrossRef] [Scilit]
- Ouyang, C.J.; An, H.; Zhou, S.; Wang, Z.; Su, P.; Wang, D.; Cheng, D.; She, J. Insights from the Failure and Dynamic Characteristics of Two Sequential Landslides at Baige Village along the Jinsha River, China. Landslides 2019, 16, 1397–1414. [Google Scholar] [CrossRef] [Scilit]

Disclaimer/Publisher’s Note: The statements, opinions and data contained in all publications are solely those of the individual author(s) and contributor(s) and not of MDPI and/or the editor(s). MDPI and/or the editor(s) disclaim responsibility for any injury to people or property resulting from any ideas, methods, instructions or products referred to in the content. |
© 2026 by the authors. Licensee MDPI, Basel, Switzerland. This article is an open access article distributed under the terms and conditions of the Creative Commons Attribution (CC BY) license.