Article

The DLOD&MCCA Framework for Accurate Mapping of Reservoir Dams in Arid Regions from Remote Sensing Imagery: A Multimodal Fusion and Constraint Approach


1
School of Geography, Geomatics and Planning, Jiangsu Normal University, Xuzhou 221116, China
2
Research Center for Ecology and Environment of Central Asia, Dushanbe 734063, Tajikistan
3
State Key Laboratory of Ecological Safety and Sustainable Development in Arid Lands, Xinjiang Institute of Ecology and Geography, University of Chinese Academy of Sciences, Urumqi 830011, China
4
Institute of Forest Resource Information Techniques, Chinese Academy of Forestry, Beijing 100091, China
*
Author to whom correspondence should be addressed.
Remote Sens. 2026, 18(9), 1297; https://doi.org/10.3390/rs18091297
Submission received: 28 February 2026 / Revised: 17 April 2026 / Accepted: 20 April 2026 / Published: 24 April 2026

Highlights

What are the main findings?
  • The DLOD&MCCA framework has led to improved accuracy and efficiency in dam detection, particularly in arid regions.
  • The dual-mode input of VIS and NIR significantly enhances the recognition of dam targets within complex spectral environments.
What are the implications of the main findings?
  • Addressed the issue of visual confusion and reduced the false alarm rate associated with dam detection in arid areas.
  • Enhanced computational initiative and improved the robustness and efficiency of large-scale mapping of dams.

Abstract

Accurate reservoir dam detection in arid regions is challenging because of spectral similarity between dams and surrounding backgrounds, indistinct boundaries, and substantial target-scale variation. To address these issues, this study proposes a deep learning object detection with multi-conditional constraint assistance (DLOD&MCCA) framework that combines a dual deep enhancement YOLO network (DDE-YOLO) with a multi-conditional constraint assistance (MCCA) strategy. In DDE-YOLO, visible (VIS) and near-infrared (NIR) imagery are fused to enhance cross-spectral discrimination, while task-oriented architectural refinements improve the representation of dam targets with diverse scales and structural characteristics. Meanwhile, the MCCA strategy constrains the search space to geographically plausible candidate regions, thereby reducing background interference and improving detection efficiency. Experiments conducted on the self-constructed S2-Dam dataset and the public DIOR dataset show that DDE-YOLO achieves mAP50 values of 92.8% and 76.2%, respectively, outperforming existing state-of-the-art (SOTA) methods. Furthermore, regional-scale dam mapping in Xinjiang achieved an accuracy of over 95%, demonstrating the effectiveness and practical applicability of the proposed framework for large-scale reservoir dam detection in arid environments.

1. Introduction

Reservoir dams are crucial components of water conservancy infrastructure, playing essential roles in water storage and discharge, hydropower generation, maintaining the dynamic balance of water resources, and safeguarding ecosystem stability [1,2,3,4]. Timely understanding of the spatial distribution and dynamic changes of reservoirs and dams within a watershed is therefore essential for optimizing water resources and monitoring watershed safety, which is of considerable strategic significance [5,6,7,8,9]. Consequently, remote sensing technology has been widely applied to dam mapping [10,11,12]. Representative studies include dam site mapping based on the sediment yield index, GIS-assisted machine learning methods, and deep learning-based large-scale dam localization [13,14,15]. The aforementioned methods can generally be classified into three categories: (1) index-based methods, (2) machine learning-based methods, and (3) deep learning-based methods. Index-based methods are relatively simple in implementation; however, their performance is frequently constrained by spectral variability and sensitivity to threshold selection. Although machine learning-based methods improve adaptability to some extent, they remain highly dependent on manually engineered features. In contrast, deep learning-based methods exhibit a stronger capability for learning discriminative feature representations directly from data, thereby offering greater potential for dam detection in remote sensing imagery characterized by complex backgrounds and indistinct boundaries. Despite these advances, automatic extraction of reservoir dams from remote sensing imagery in arid regions remains highly challenging due to severe spectral similarity between dams and backgrounds, blurred boundaries, and low target separability. The arid environment’s sparse vegetation and prevalent earth-rock dam structures exacerbate spectral homogeneity [16]. Additionally, significant elevation gradients and year-round snow cover complicate identification, as snow and water share similar spectral features [17]. Furthermore, dams exhibit considerable spatial scale variations, with boundaries frequently obscured by seasonal hydrological fluctuations [18]. Lastly, limited dam samples and coarse annotations further constrain model training and detection accuracy [19].
In recent years, target detection models have undergone rapid development, evolving from traditional approaches based on handcrafted features to deep learning-based frameworks [20]. Existing deep learning detectors are commonly categorized into two-stage and one-stage architectures [21]. Two-stage detectors generally exhibit strong localization capability; however, their relatively high computational cost limits their applicability in large-scale remote sensing scenarios. One-stage detectors, represented by the YOLO series, provide a more desirable balance between detection accuracy and inference efficiency, rendering them more suitable for large-scale object detection tasks in remote sensing imagery. In addition, transformer-based detectors have further strengthened global feature modeling capability, although their computational complexity remains a constraint for practical deployment [22]. Overall, current research on target detection models has become increasingly oriented toward improving the balance among accuracy, robustness, and efficiency in complex scenes.
In remote sensing applications, the rapid development of deep learning has established it as a dominant paradigm for object detection. Supported by improved RSI datasets, detection accuracy has advanced significantly [23]. Nevertheless, most existing frameworks rely solely on visible-light inputs [24]. The lack of multimodal data restricts accurate dam recognition. With the rise of multimodal RSI techniques, integrating diverse data sources and spectral bands shows great potential for addressing spectral homogeneity and improving detection robustness in arid environments [25].
To address these challenges, we propose a two-stage framework integrating deep learning-based object detection with multi-conditional constraint assistance, termed deep learning object detection and multi-conditional constraint assistance (DLOD&MCCA). In the first stage, multi-conditional constraints are introduced based on the spatial characteristics of dams in arid regions. These include watershed systems, normalized difference water index (NDWI) [26], local water body ratios, and DEM-derived elevation and slope, which collectively help exclude irrelevant areas and delineate regions of interest. The second stage employs constraint-assisted screening to refine optimal detection ranges. To further enhance detection, the complementary properties of visible (VIS) and near-infrared (NIR) imagery are exploited through a dual deep enhancement YOLO network, termed dual deep enhancement YOLO (DDE-YOLO), which fuses VIS and NIR features to mitigate large spatial scale variations, spectral homogeneity, and boundary blurring.
In this study, we aim to enable fully automatic and accurate reservoir dam identification in arid regions at large spatial extents. The main contributions of this work are summarized as follows.
(1)
Network Architecture Innovation: We propose a task-oriented multimodal DDE-YOLO network for remote sensing dam detection. To address the multi-scale variability and ambiguous boundary characteristics of dam targets, the Backbone–Neck architecture is refined through the incorporation of the MSC3k module for enhanced multi-scale feature interaction and the TCUB module for improved restoration of fine-grained structural details during upsampling. These dedicated architectural refinements render the proposed network more suitable for dam detection in complex remote sensing scenes.
(2)
Multimodal Feature Enhancement: We propose a dedicated multimodal fusion (MF) module for co-registered VIS and NIR imagery. By incorporating attention-guided fusion to better exploit the complementary spectral responses of the two modalities, the MF module enhances salient dam-related features while suppressing background interference, thereby improving target discrimination in spectrally homogeneous arid environments.
(3)
Constraint-Driven Region Selection: We propose a multi-conditional constraint assistance (MCCA) strategy to improve the efficiency and practicality of large-scale dam detection. By integrating watershed systems, digital elevation models (DEMs), NDWI, and local water body area ratios into a hierarchical screening process, the proposed strategy identifies reliable candidate regions for dam detection, reduces unnecessary search space, and enhances detection efficiency over large spatial extents.

2. Related Work

2.1. Multimodal Fusion of Remote Sensing Images

Multimodal fusion integrates heterogeneous information from different sensors, leveraging feature complementarity to overcome the limitations of single-modality representations. Existing multimodal fusion strategies are typically categorized as early, mid-level, or late fusion [27]. Early fusion, or pixel-level fusion, concatenates data at the input stage to construct multi-channel inputs, which are subsequently processed by a unified feature extraction network [28]. Li et al. [29] conducted a comparative study on pixel-level integration of SAR and optical imagery, evaluating different fusion strategies for classification tasks. Mid-level fusion, or feature-level fusion, processes different modalities in independent networks and subsequently integrates them at intermediate layers before feeding fused features into the detection head. Representative studies include MCFNet proposed by Song et al. [30], which enhances joint classification of hyperspectral images (HSI) and LiDAR data by combining spatial and frequency domain features, and ACMFNet developed by Chen et al. [31], which employs hierarchical refinement of global and local features to reduce spatial discrepancies and achieve effective complementarity between multispectral and normalized digital surface model (nDSM) data. In late fusion, predictions from different modalities are integrated after independent inference, typically using weighting schemes. Zhang et al. [32] employed a dynamic weight allocation mechanism to adaptively balance contributions from three output branches, enhancing the synergistic performance of HSI and LiDAR data. In practice, due to the substantial heterogeneity of multimodal inputs, feature-level fusion has emerged as the most widely adopted approach in remote sensing. However, this method often entails considerable redundant computation, resulting in high computational costs and suboptimal performance in meeting task-specific requirements.
Recent multimodal detection methods, such as ACMFNet, further demonstrate the effectiveness of cross-modal feature integration; however, these frameworks are mainly designed for general remote sensing tasks and are not specifically tailored to the combined challenges of spectral homogeneity, ambiguous boundaries, and substantial scale variation in reservoir dam detection.
Given that this study utilizes VIS and NIR bands from Sentinel-2 imagery and that reservoir dams exhibit significant spatial-scale variation, the proposed framework adopts a multimodal feature fusion strategy to enhance dam–background separability. Specifically, the proposed MF module performs front-end fusion on co-registered VIS-NIR imagery to enhance cross-spectral target discrimination and suppress background interference, while the MSC3k module strengthens multi-scale feature interaction in the Backbone and Neck, thereby improving the representation of dam targets with varying spatial extents and irregular structures.

2.2. Reservoir Dam Automatic Identification

Recent dam detection studies primarily employ deep learning for object recognition [33]. Balaniuk et al. [34] were among the pioneers in applying fully convolutional networks (FCNs) for detecting mines and tailings dams. Building upon this foundation, Fang et al. [35] proposed the HRLibra-RCNN model, which facilitates global-scale dam detection and incorporates auxiliary strategies such as sliding windows and a non-maximum suppression (NMS) algorithm to enhance localization accuracy. This model demonstrated superior performance in dam identification across seven regions worldwide. Despite their effectiveness in processing complex image data, deep learning-based approaches still face challenges in distinguishing targets with substantial spectral similarity from homogeneous backgrounds.
Although deep learning algorithms effectively recognize land features, they often lack precision in localizing target areas. To address this limitation, many studies have incorporated multi-source data to determine the spatial positions of dam targets. Jing et al. [36] employed a thresholding approach based on JRC-GSW combined with terrain roughness index constraints and spatial intersection analysis to filter out high-similarity interference targets, narrowing the detection range. Wang et al. [37] proposed a dam detection ratio method that evaluates topographic features by comparing water body areas across potential dam sites, while Gu et al. [38] designed a four-stage hydrological constraint approach to reduce background interference. Despite their effectiveness in integrating spatial and multi-source data to screen potential dam locations, most methods still rely on manual post-processing for error reduction, considerably limiting the efficiency of automated information extraction.
In arid regions, dam identification remains challenged by (1) semantic ambiguity due to heterogeneous backgrounds, spectral similarity, and scale diversity, and (2) abundant false positives generated during large-scale searches. The proposed framework is developed to address these limitations through multimodal fusion and multi-constraint optimization.

3. Materials and Methods

3.1. Study Area

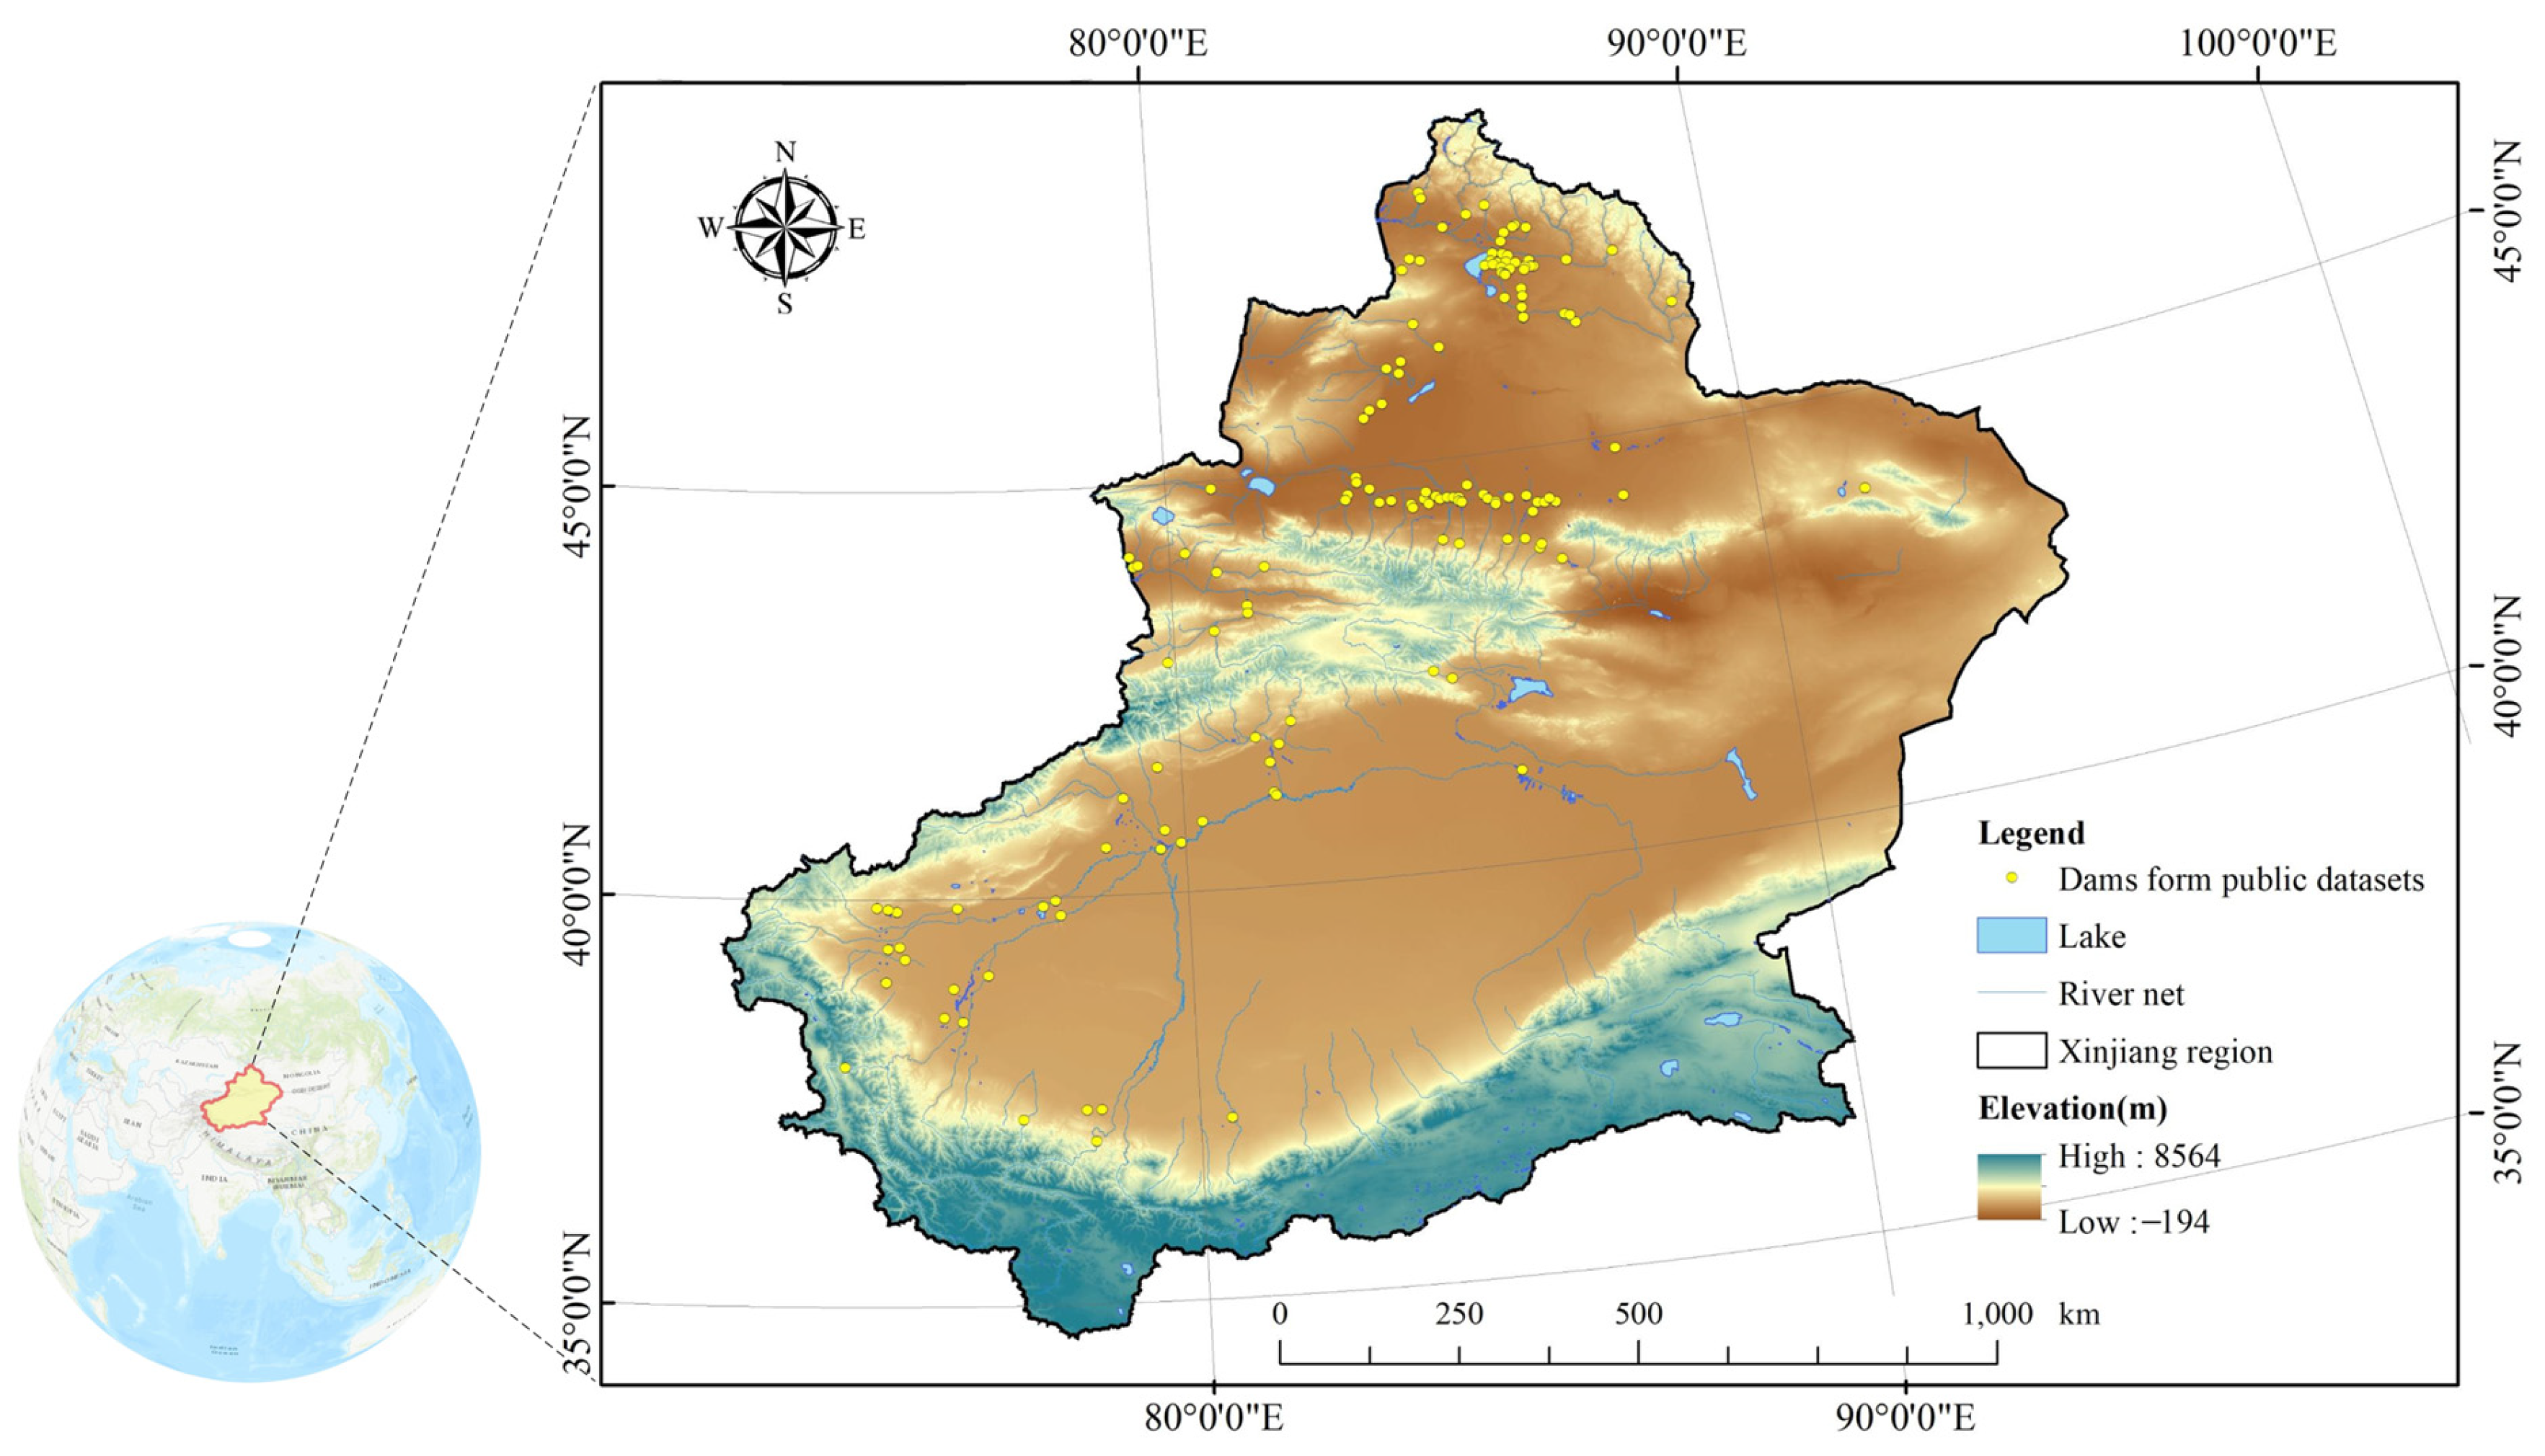
This study focuses on the arid region of the Xinjiang Uygur Autonomous Region, spanning 73°40′E–96°23′E and 34°22′N–49°10′N (Figure 1). Located in northwestern inland China, the region covers approximately 1.66 million km2 and is characterized by an arid climate with sparse vegetation dominated by deserts, Gobi, and sandy areas. Water systems show distinct regional patterns, with rivers and reservoirs mainly distributed in the central-eastern, southern, and central zones along basin–mountain interfaces. Owing to the unique topographical and hydrological conditions, reservoir dams are mostly located along river and lake systems, particularly at basin–river junctions. These dams, primarily earth-rock structures, have low spectral contrast with surrounding terrain in remote sensing imagery, making accurate identification and detection more challenging.

3.2. Data Sources

The Sentinel-2 imagery used in this study was acquired from the ESA data portal. Images covering dam regions from March 2023 to September 2024 underwent atmospheric correction, cloud masking, and mosaicking, with monthly median composites generated and cloud-free images selected. ALOS DEM data (12.5 m) were resampled to 10 m to match Sentinel-2 resolution. The datasets include the self-constructed S2-Dam dataset and the public DIOR dataset [39].
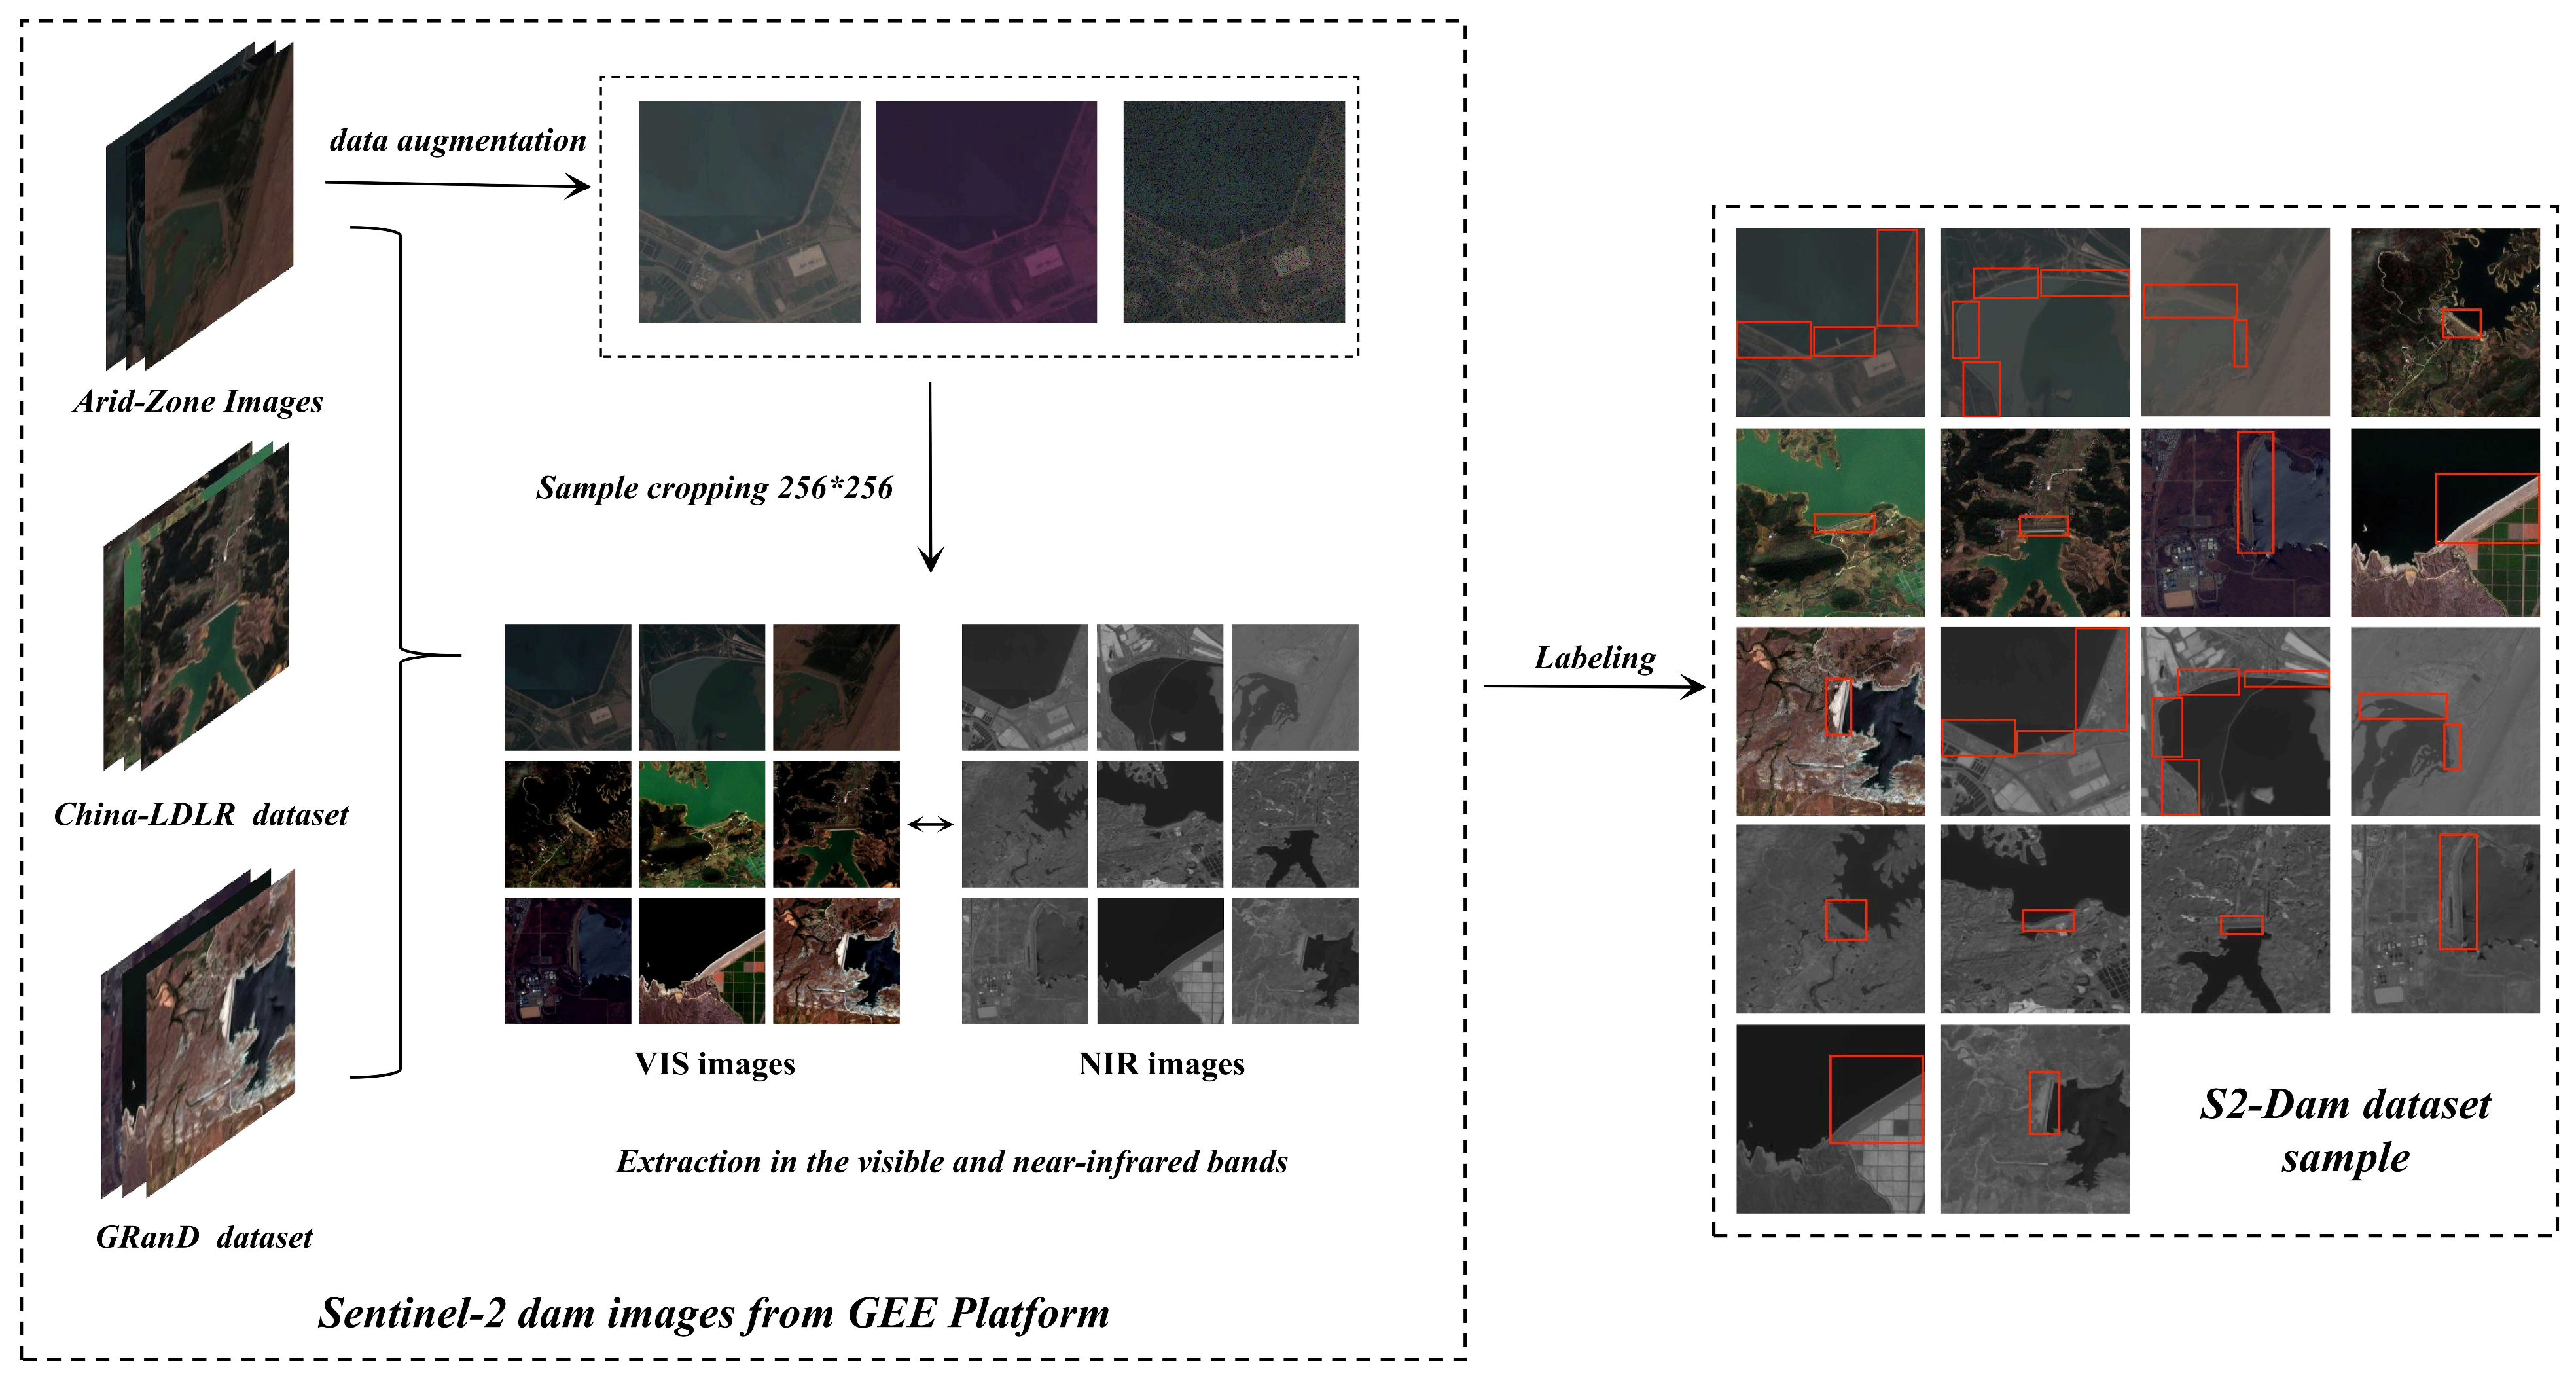
The S2-Dam dataset consists of two components with corresponding VIS-NIR image pairs. As illustrated in Figure 2, the first combines a public Xinjiang dam location dataset with a Sentinel-2 base map to extract supplementary samples. The second derives from dam locations in China-LDLR [40] and GranD [41] datasets, visually verified, refined using Google Earth Pro, corrected for spatial bias, and uploaded to GEE. All images were cropped to 256 × 256 pixels, yielding 824 images (624 training, 80 validation, 80 test).
To mitigate the limited number of samples, data augmentation techniques such as rotation, cropping, and salt-and-pepper noise were applied to the training subset, generating 450 images to alleviate class imbalance. After initial pre-training, 115 low-confidence images were selected as negative samples to enrich background classes. The final S2-Dam dataset comprised 1389 images (1229 training, 80 validation, 80 testing). Augmentation was performed only after partitioning to prevent data leakage. The paired VIS and NIR images in the S2-Dam dataset are co-registered at 10 m spatial resolution. Therefore, the multimodal inputs are spatially aligned on a pixel-to-pixel basis, which provides the necessary foundation for the proposed front-end fusion in the MF module.
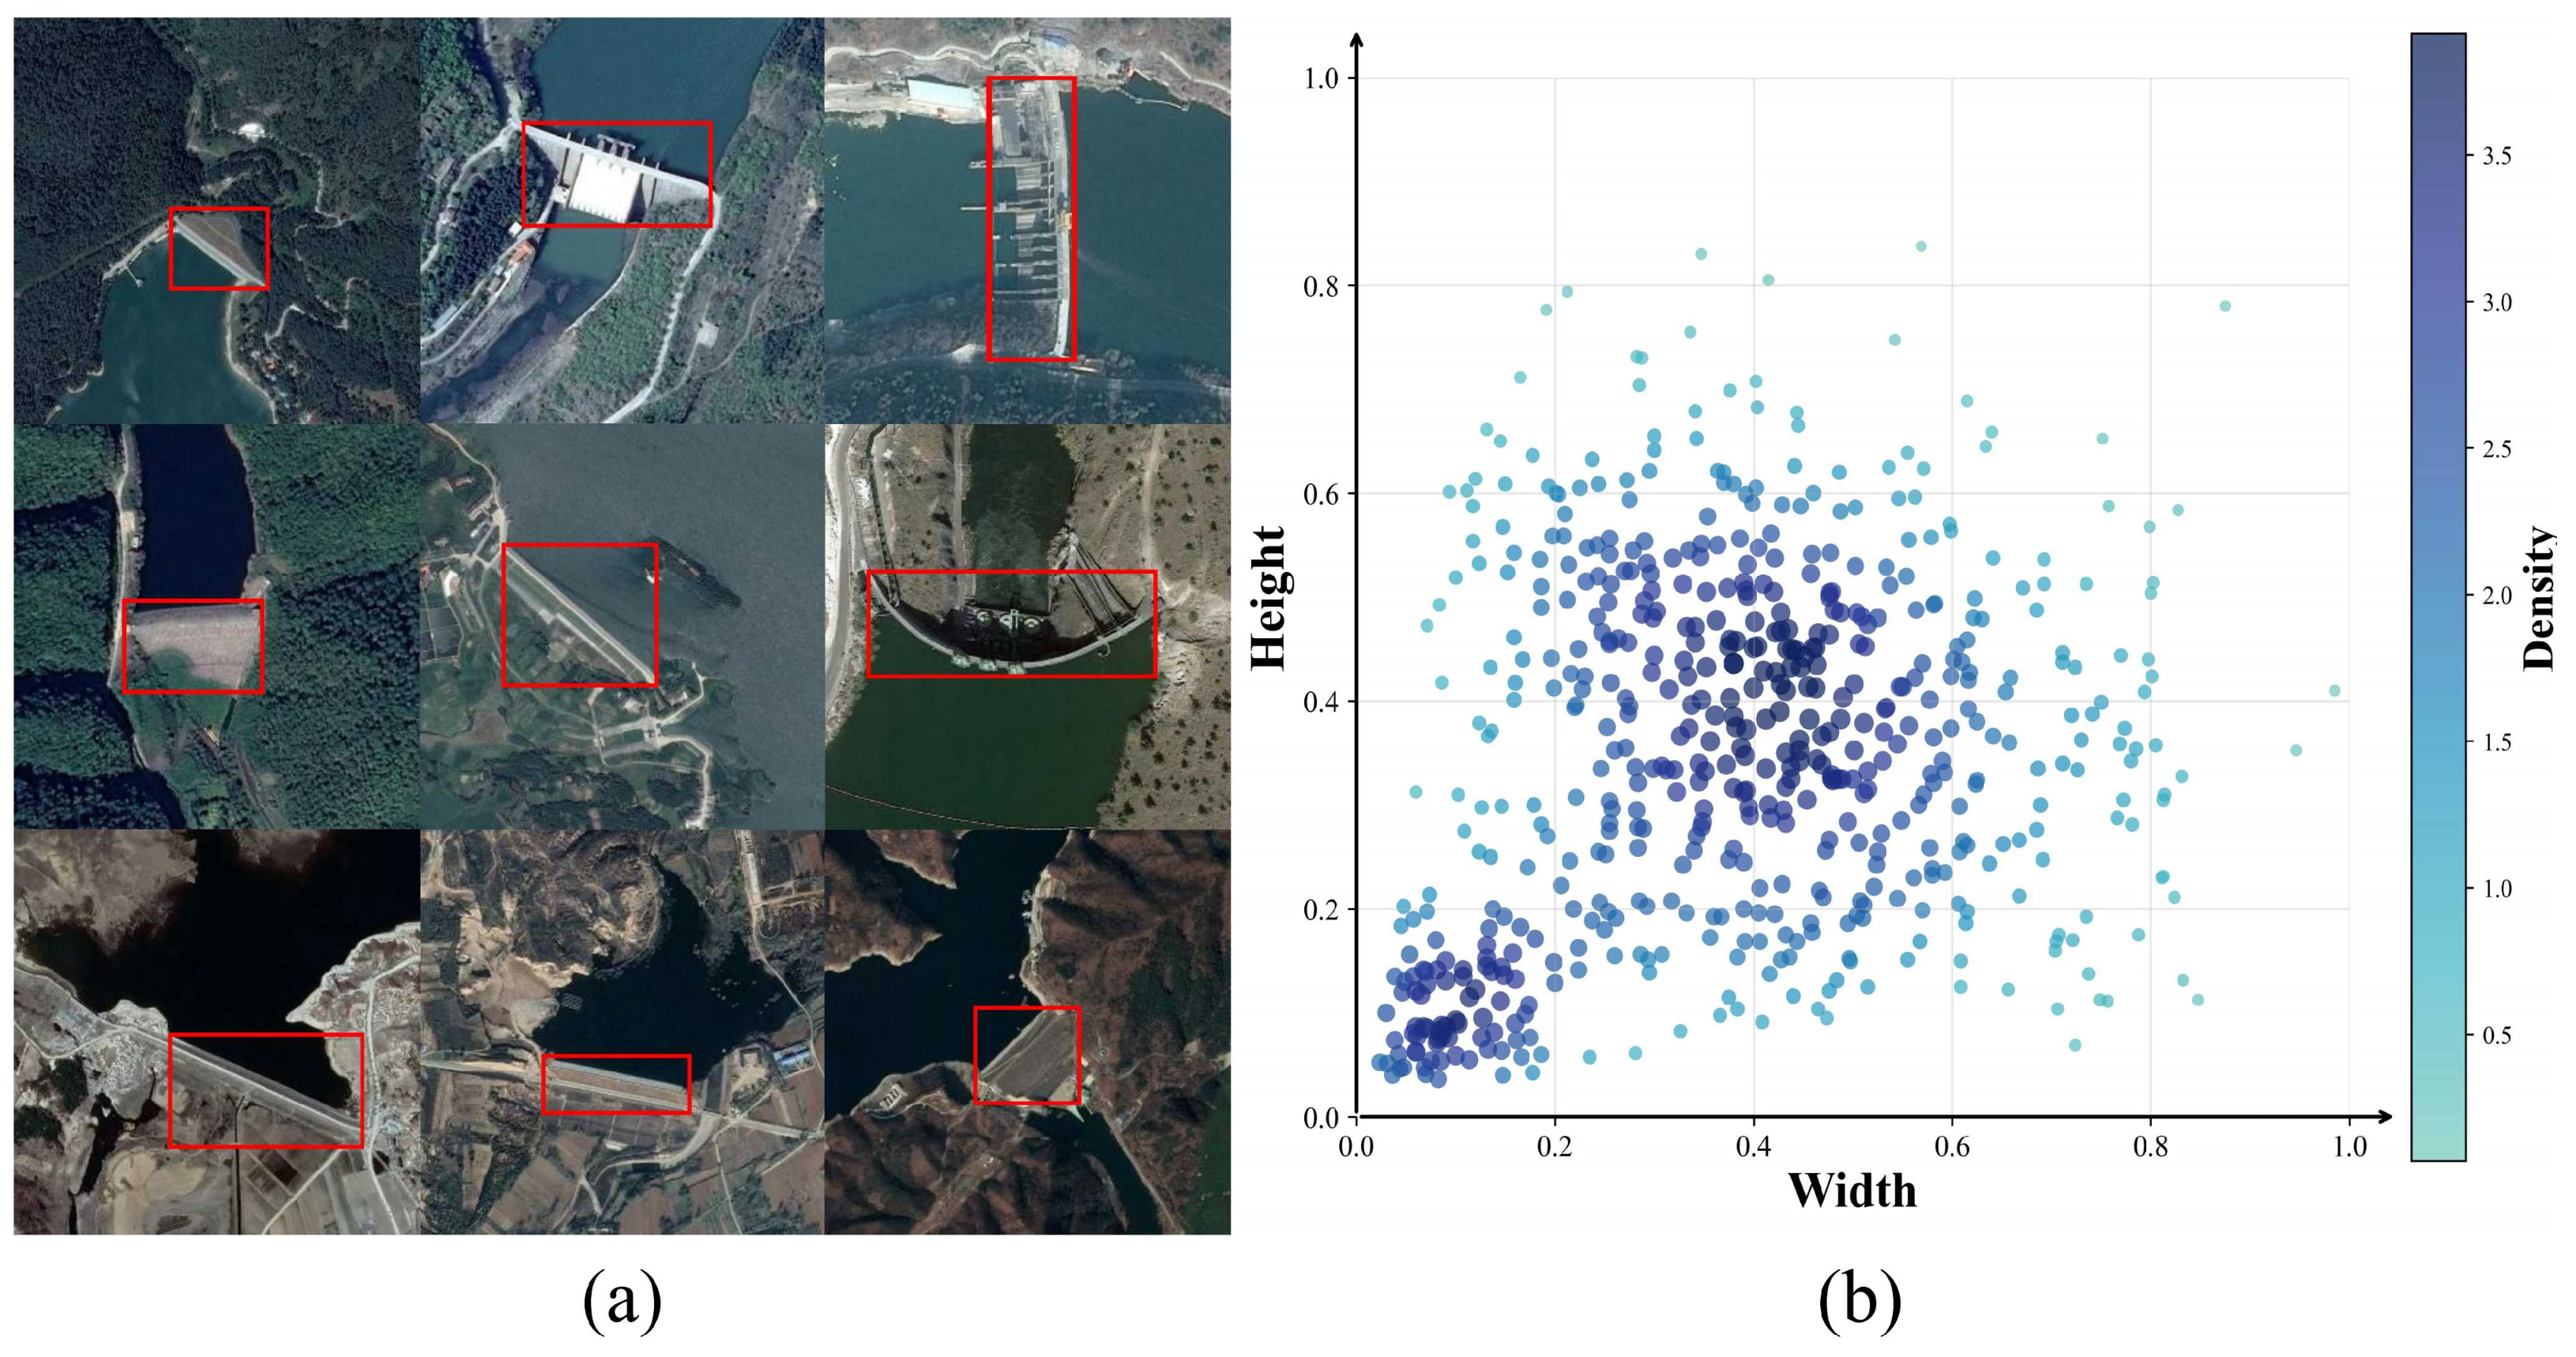
To evaluate model generalization, tests used the DIOR dataset, containing 20 categories, 23,463 aerial images, and 192,472 annotated instances (0.5–30 m resolution). Within the dam class, 905 images containing 951 labeled objects were selected and divided into training and testing subsets at an approximate ratio of 8:2 (724 for training and 181 for testing). Figure 3 shows representative dam examples and their scale distribution, which is relatively uniform, reflecting the wide variation in dam sizes across the dataset.

3.3. DLOD&MCCA Framework

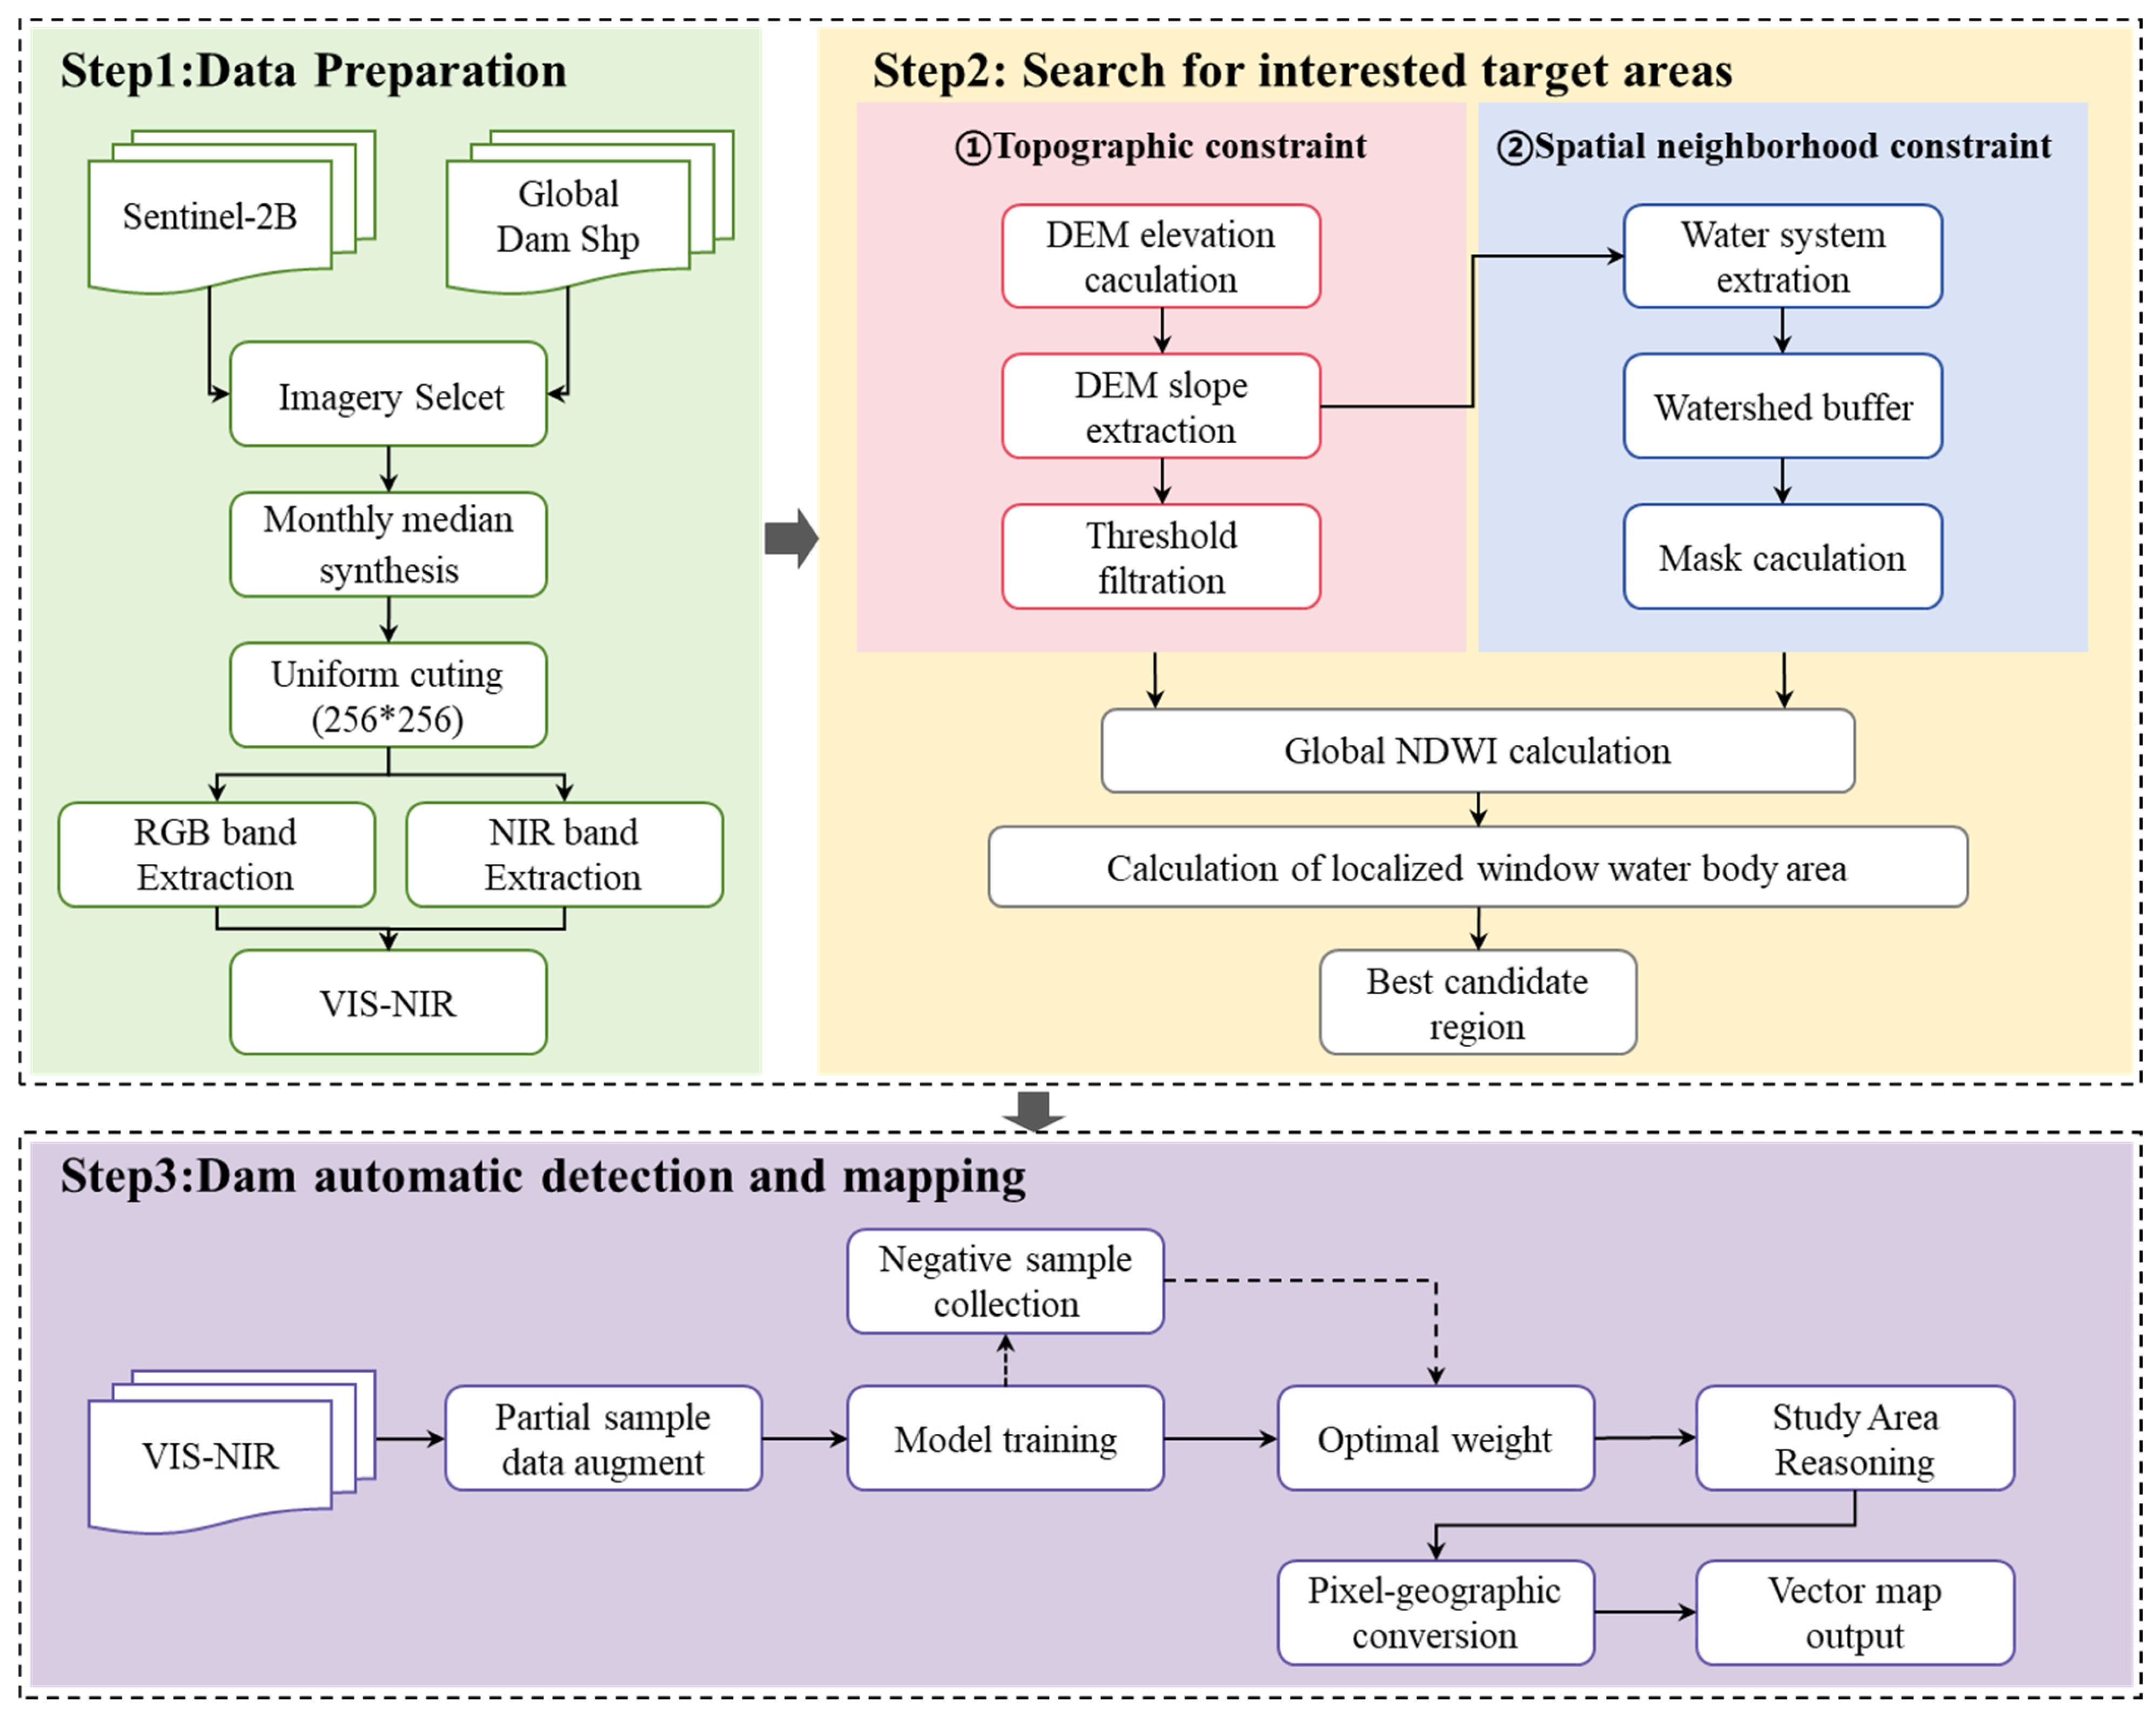
The DLOD&MCCA framework (Figure 4) comprises three primary components: (1) data preparation; (2) the search for interested target areas; and (3) dam automatic detection and mapping. All data are standardized to 10 m resolution to construct the S2-Dam dataset, which is input into DDE-YOLO for training and fine-tuning. Multi-conditional constraints are then applied to select relevant regions of interest. Finally, the trained model performs global inference within the designated areas, using an NMS algorithm and block-based detection for precise localization. Detection box coordinates are exported as vector data, stitched, and overlaid onto the full map for automated reservoir and dam mapping in arid regions.

3.3.1. DDE-YOLO Network

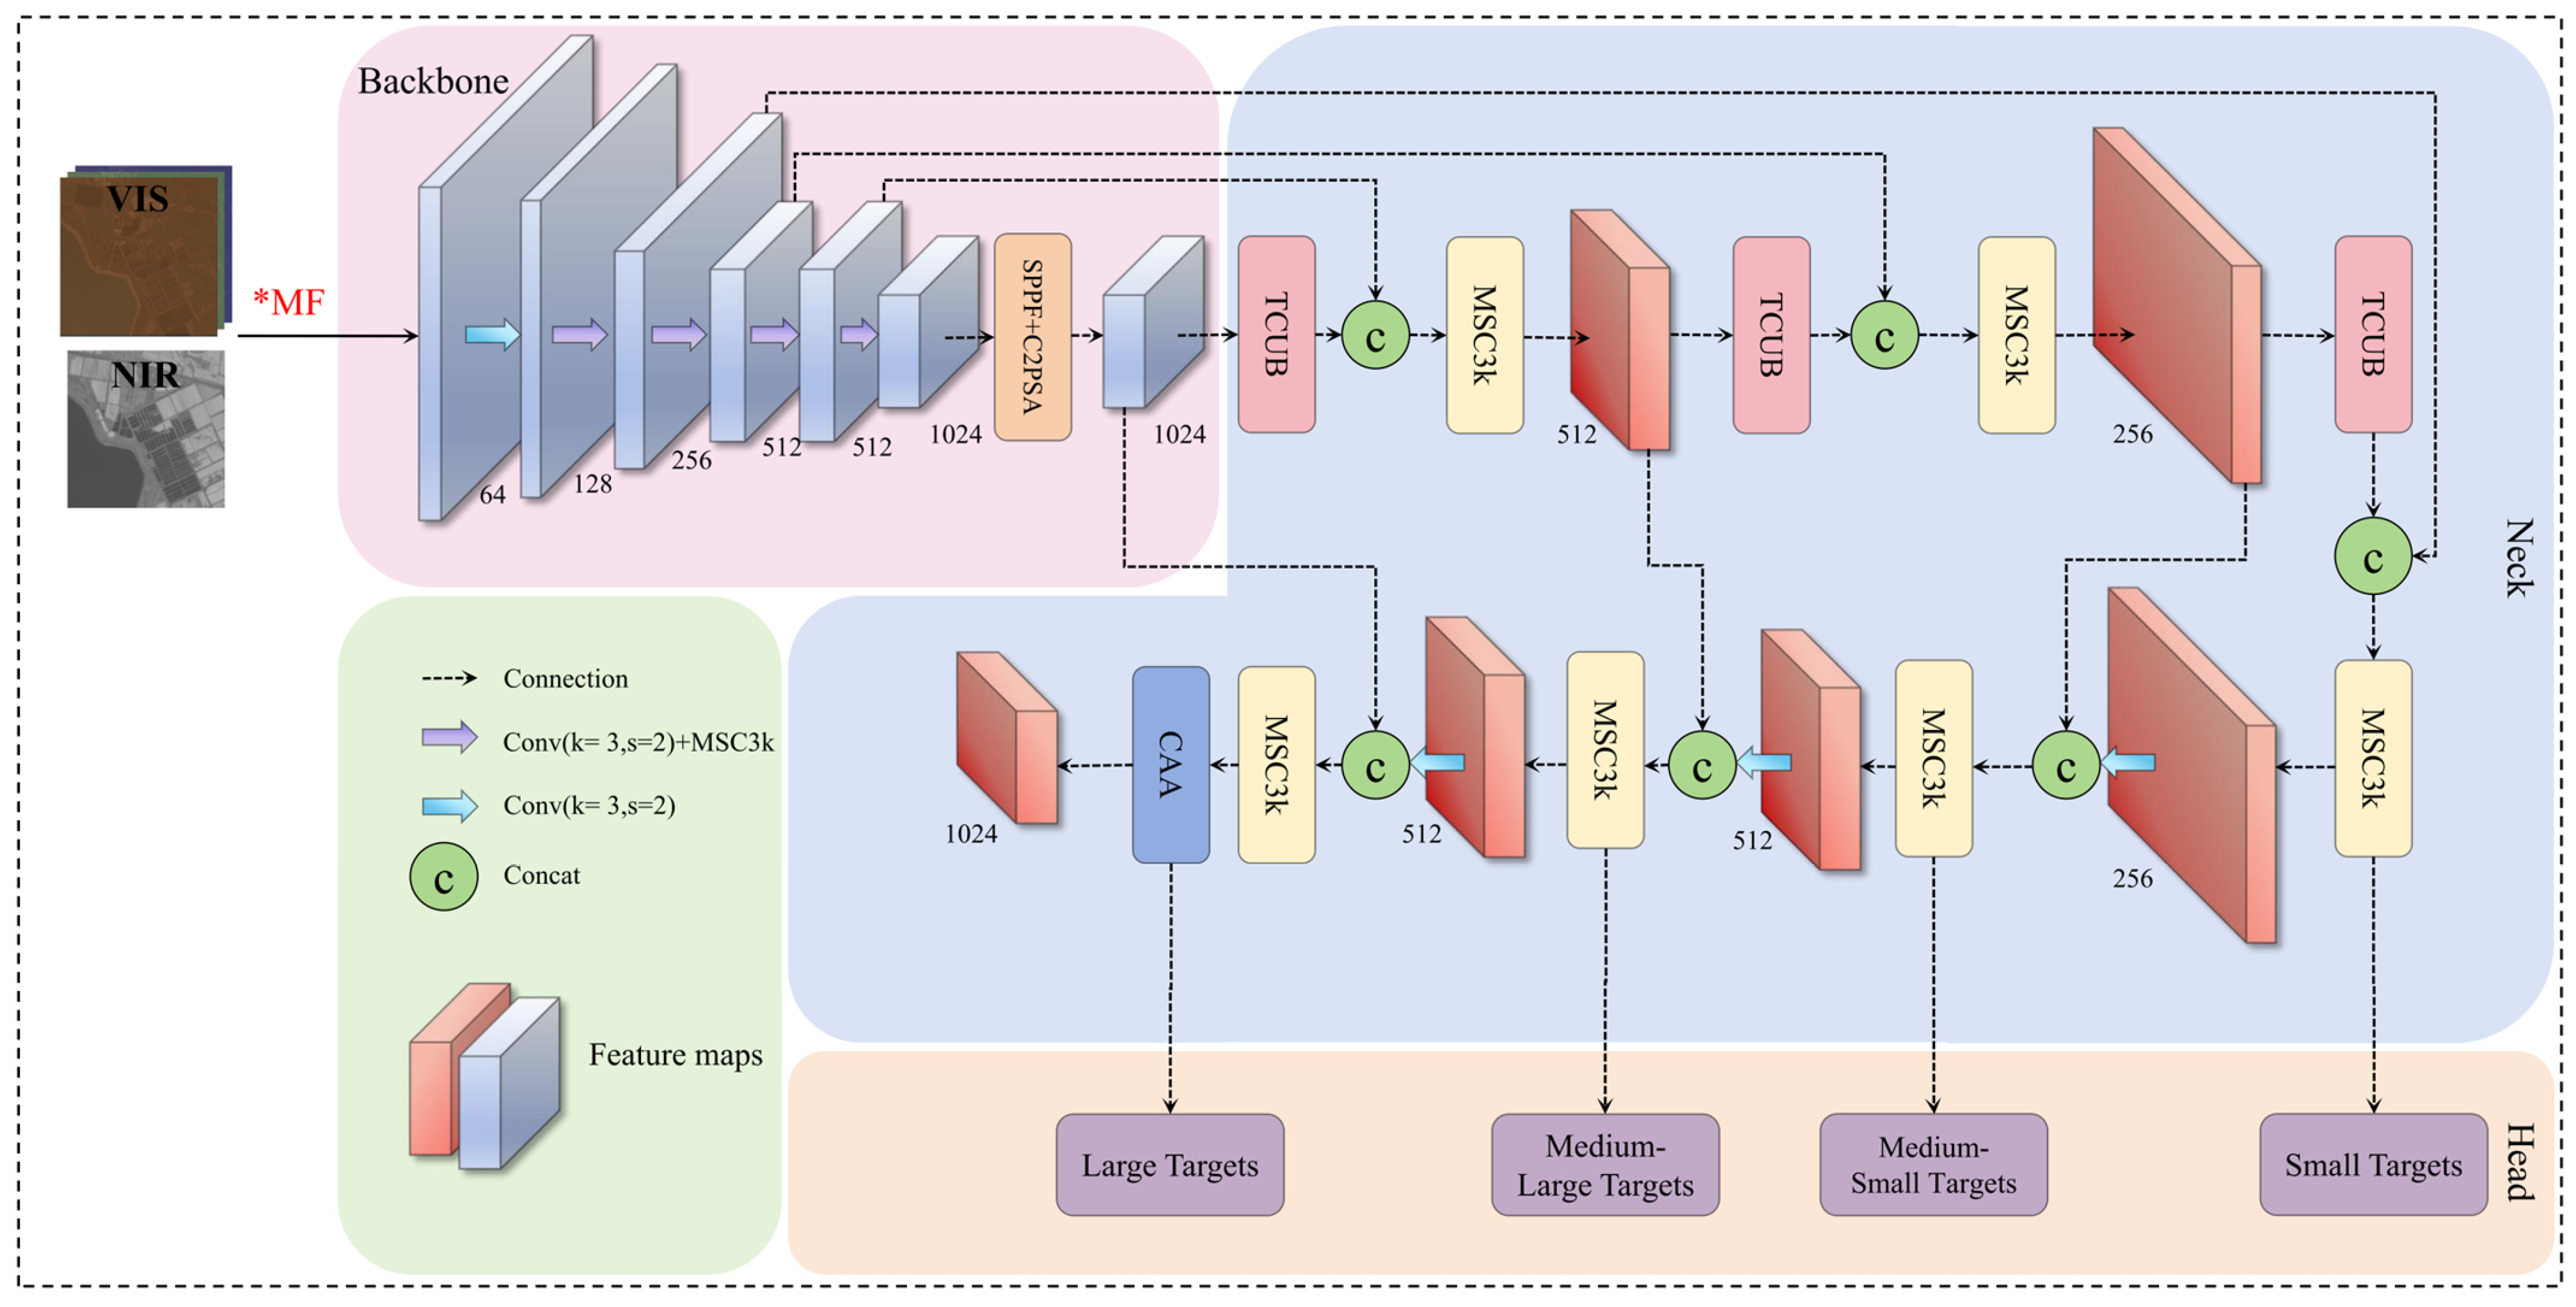
DDE-YOLO consists of three core components (Figure 5): Backbone, Neck, and Head. The Backbone extracts features from the input image, the Neck fuses and enhances these features, and the Head maps them to output space for category and location predictions. MF [42] is employed at the input stage, integrating characteristics from two image sources. Within the network, MSC3k is integrated into the Backbone and Neck as the feature extraction module to enhance sensitivity to objects of varying scales. Standard upsampling blocks are substituted with TCUB, utilizing the adaptive learning capability of transposed convolutions to reduce information loss. Additionally, a contextual anchor attention (CAA) [43] module is added after the last MSC3k to improve large-object detection. Collectively, these enhancements form the DDE-YOLO framework, facilitating effective adaptation to the multi-scale feature distribution of dams. In the training stage, the proposed DDE-YOLO is optimized using a composite loss consisting of classification loss, bounding box regression loss, and distribution focal loss. Specifically, BCEWithLogits loss is used for object classification, Complete Intersection over Union (CIoU) loss is employed for bounding box regression, and Distribution Focal Loss (DFL) is adopted to further improve localization accuracy.
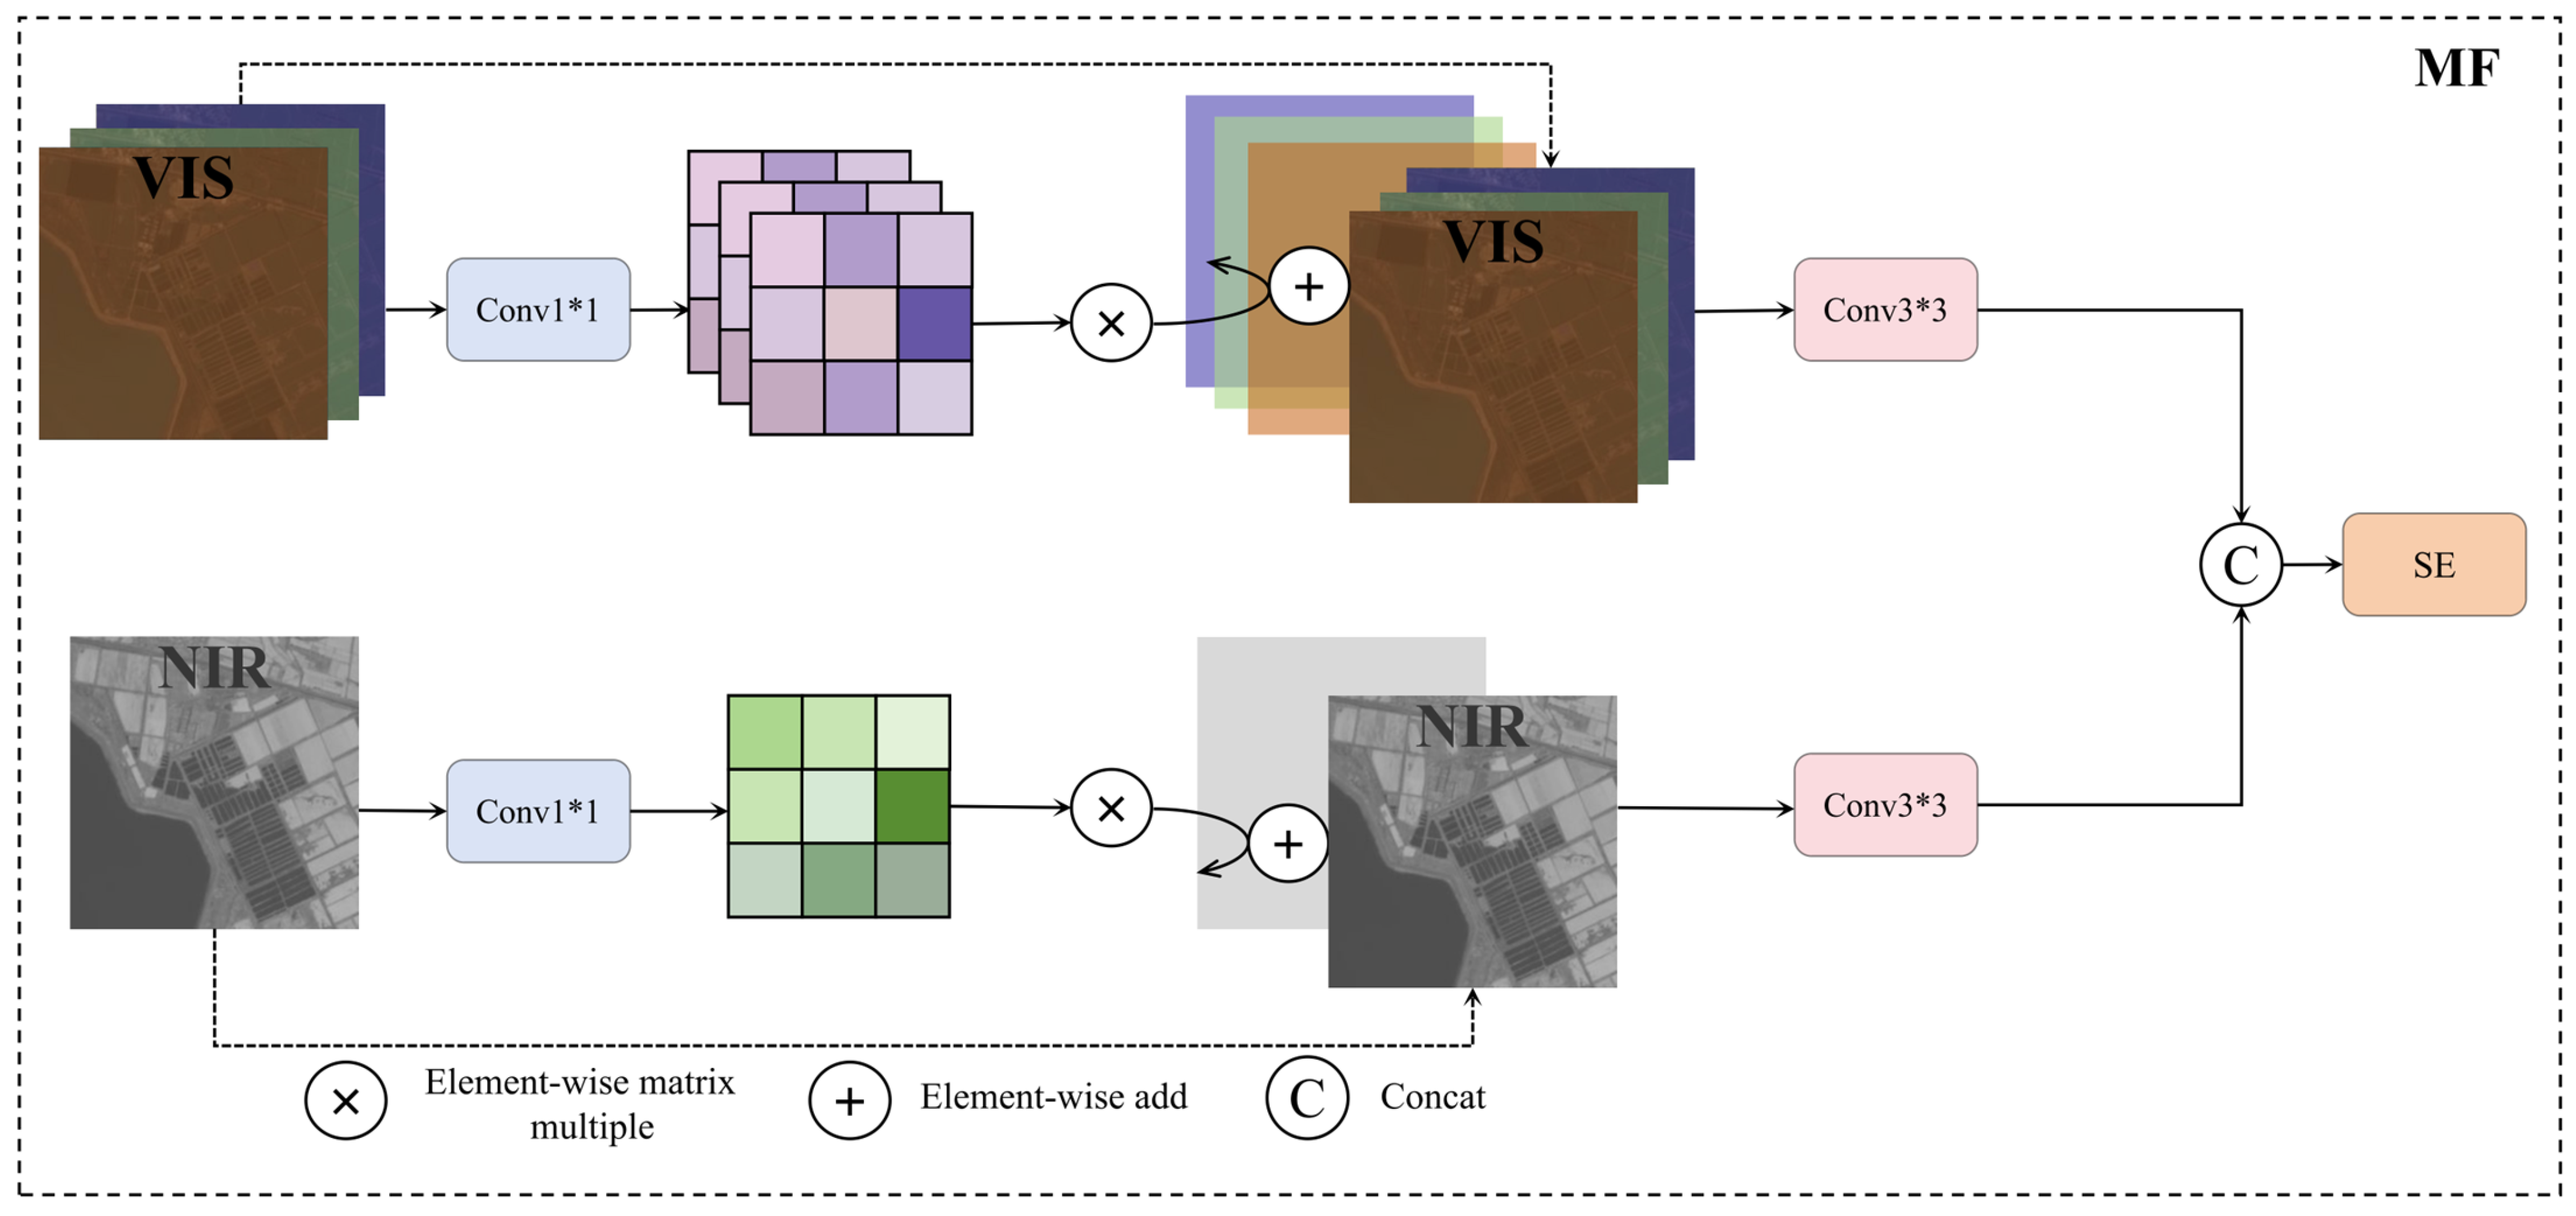
MF Module
Given the complementary characteristics of the VIS and NIR branches and their respective wavelength bands, the MF module is introduced as a streamlined front-end fusion unit to integrate multimodal information at the input stage (Figure 6). Unlike direct feature concatenation, MF performs attention-guided reweighting after the initial aggregation of VIS and NIR features, thereby enhancing dam-relevant cross-spectral responses while suppressing redundant background interference. This design is intended to preserve shallow cross-modal interactions and improve the discriminative representation of dam targets in arid environments, where spectral homogeneity, weak structural boundaries, and limited target size often hinder single-modality detection.
Specifically, the self-attention (SE) mechanism, which was previously applied independently to each branch, is reformulated to operate on the concatenated VIS-NIR feature representation, enabling unified cross-modal response modeling after the initial aggregation stage. Such a modification allows the MF module to jointly exploit complementary information from the two modalities, thereby highlighting dam-relevant structures while reducing the influence of inconsistent or redundant background responses. In the implementation, the input band features are first compressed to half of their original size in order to control feature scale, reduce redundant information, and improve training stability by avoiding potential gradient instability caused by excessively large feature values. Subsequently, pixel-wise convolutions are applied to generate modality-specific attention masks for the two branches. These masks are then used to adaptively reweight the corresponding feature responses, such that informative regions in the input feature maps are enhanced whereas irrelevant or distracting regions are suppressed. As a consequence, the MF module produces a more discriminative multimodal representation for subsequent dam detection. The computation process of MF is defined in Equation (1).
Y = W R G B W m L X L 2 · X L 2 + X L , W N I R W m R X R 2 · X R 2 + X R · σ W 2 m a x 0 , W 1 · 1 H W h , w Z h , w
where Y represents the final output, W R G B and W N I R denote the weight matrices for VIS and NIR feature maps, respectively, W m L and W m R are the modulation weight matrices for left and right views, X L and X R represent the input features from left and right perspectives, σ is the activation function, W 2 represents the weight matrix of the second layer, ma denotes the max pooling operation, HW indicates the height and width of the feature map, Z h , w represents the feature value at spatial position (h,w), and * denotes the convolution or matrix multiplication operation.
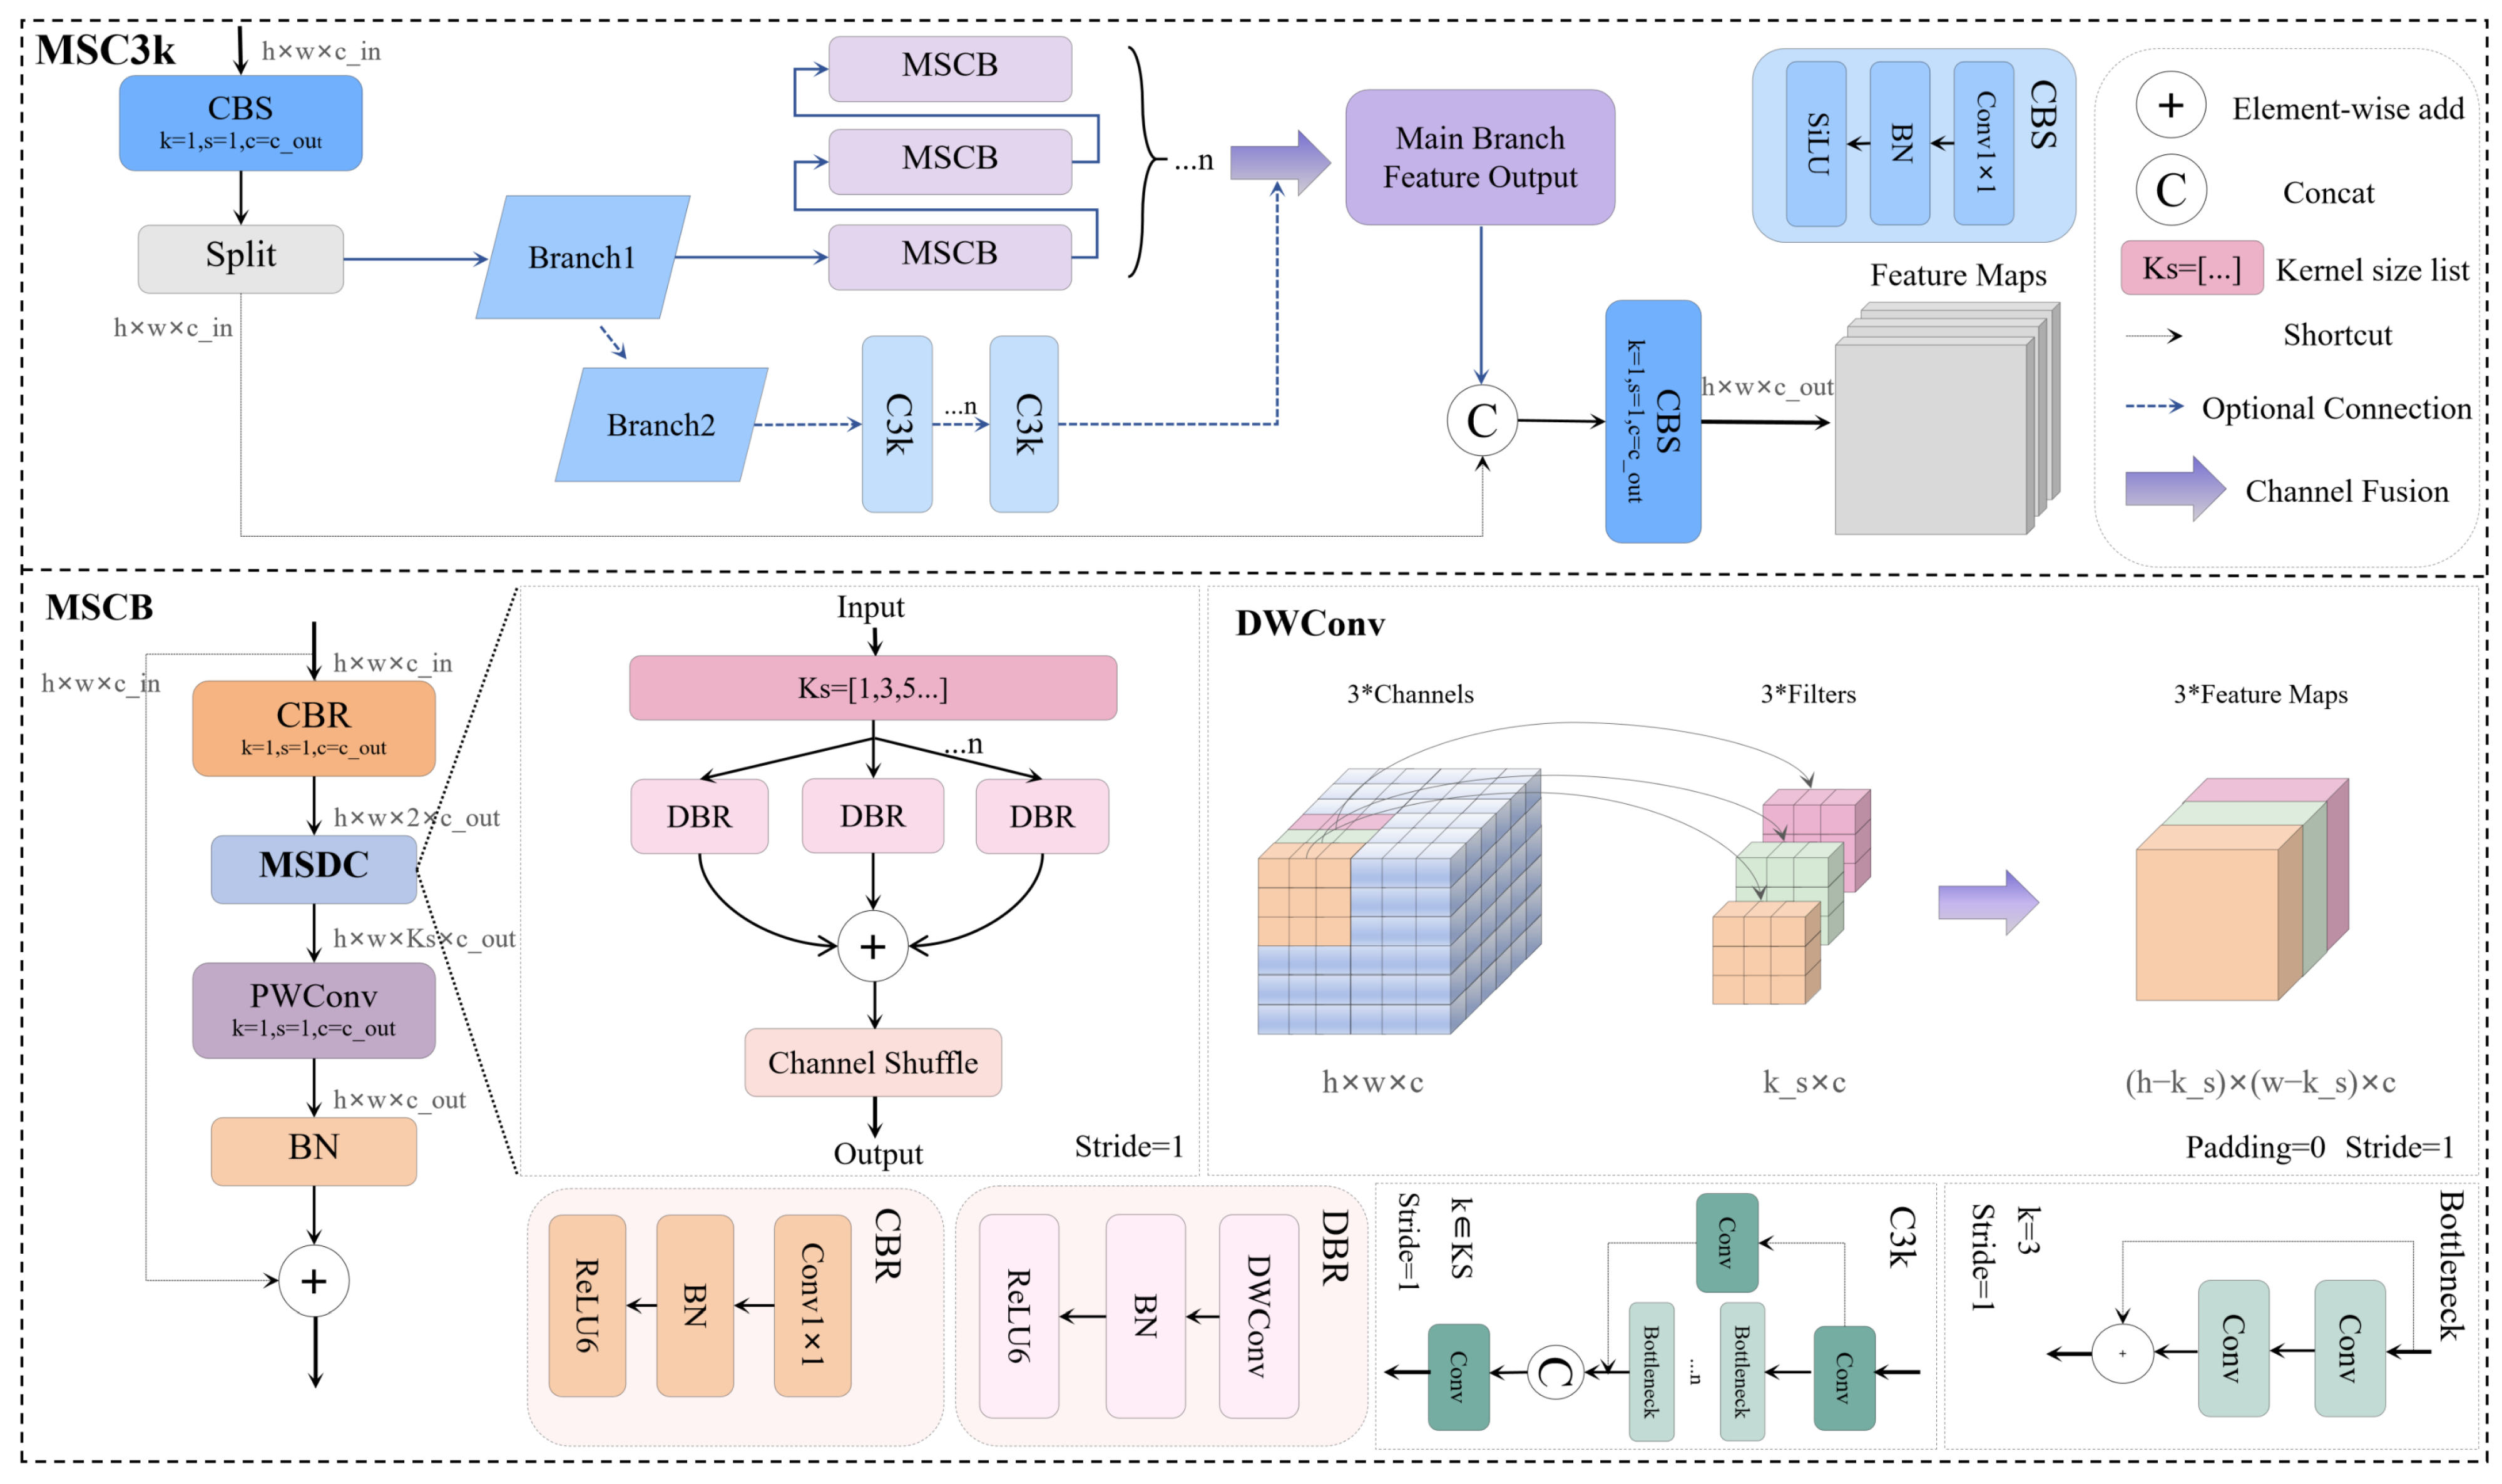
MSC3k Module
The MSC3k module extracts features through the multi-scale convolution block (MSCB) and C3k branches (Figure 7). The MSCB branch emphasizes multi-level channel feature extraction, while the C3k branch deepens the network. In MSCB, input feature maps pass through a Convolution-BN-SiLU (CBS) structure, doubling channel numbers. Multi-scale depth-wise convolution (MSDC) [44] then extracts depth-wise features per channel, followed by a 1 × 1 pointwise convolution to restore channel dimensions and batch normalization. Quadratic feature weighting and channel shuffle from ShuffleNet [45] enable inter-channel communication, improving multimodal feature complementarity. Compared to conventional convolution, this design refines modeling of target scales, enhancing multi-scale dam detection. The formula of MSCB is shown in Equation (2).
MSCB X = X + W 2 · Shuffle F a g g σ γ 2 · W d w , i k 1 σ γ 1 · W 1 · x μ 1 σ 1 2 + ϵ + β 1 μ 2 σ 2 2 + ϵ + β 2 i = 1 K
where W1, W2 denote the learnable projection weight parameters, and W d w , i represents the depth-wise convolution kernel for the i-th scale branch. K represents the total number of multi-scale branches. Given the depth-wise convolution operation k 1 with kernel size ki, the Batch Normalization operation computes the mean μ 1 , μ 2 and variance σ across the batch dimension for each channel, where γ and β are learnable affine parameters, whilst ϵ is introduced as a small constant to ensure numerical stability.
By incorporating multi-scale depth-wise separable convolution, MSC3k captures spatial features at different granularities. The depth-wise convolution operates on individual channels with varying kernel sizes {Ki}, enabling simultaneous extraction of fine- and coarse-grained spatial patterns. The aggregation function F a g g consolidates information across scales, and the Shuffle operation facilitates inter-channel communication and feature mixing. This architecture promotes stable gradient propagation and enriched feature expressiveness, benefiting robust multi-scale representation learning in complex visual recognition tasks. The computational definition of aggregate functions is as follows.
F a g g F i i = 1 K = 1 α · Concat i = 1 K F i + α · i = 1 K F i
where F i i = 1 K represents the set of feature maps from K different scale branches, F i denotes the feature output from the i-th scale branch, and α ∈ {0, 1} is a binary switch parameter that controls the aggregation strategy. When α = 0, the function performs channel-wise concatenation C o n c a t i = 1 K F i to preserve scale-specific information, resulting in an output dimension of. Conversely, when α = 1, the function executes element-wise summation i = 1 K F i to fuse multi-scale features, maintaining the original channel dimension.
M S D C ( X ) = σ γ k · X W k μ k / σ k 2 + ϵ + β k k K
where X represents the input node feature matrix, and W k denotes the learnable weight parameters for the k-th feature channel.
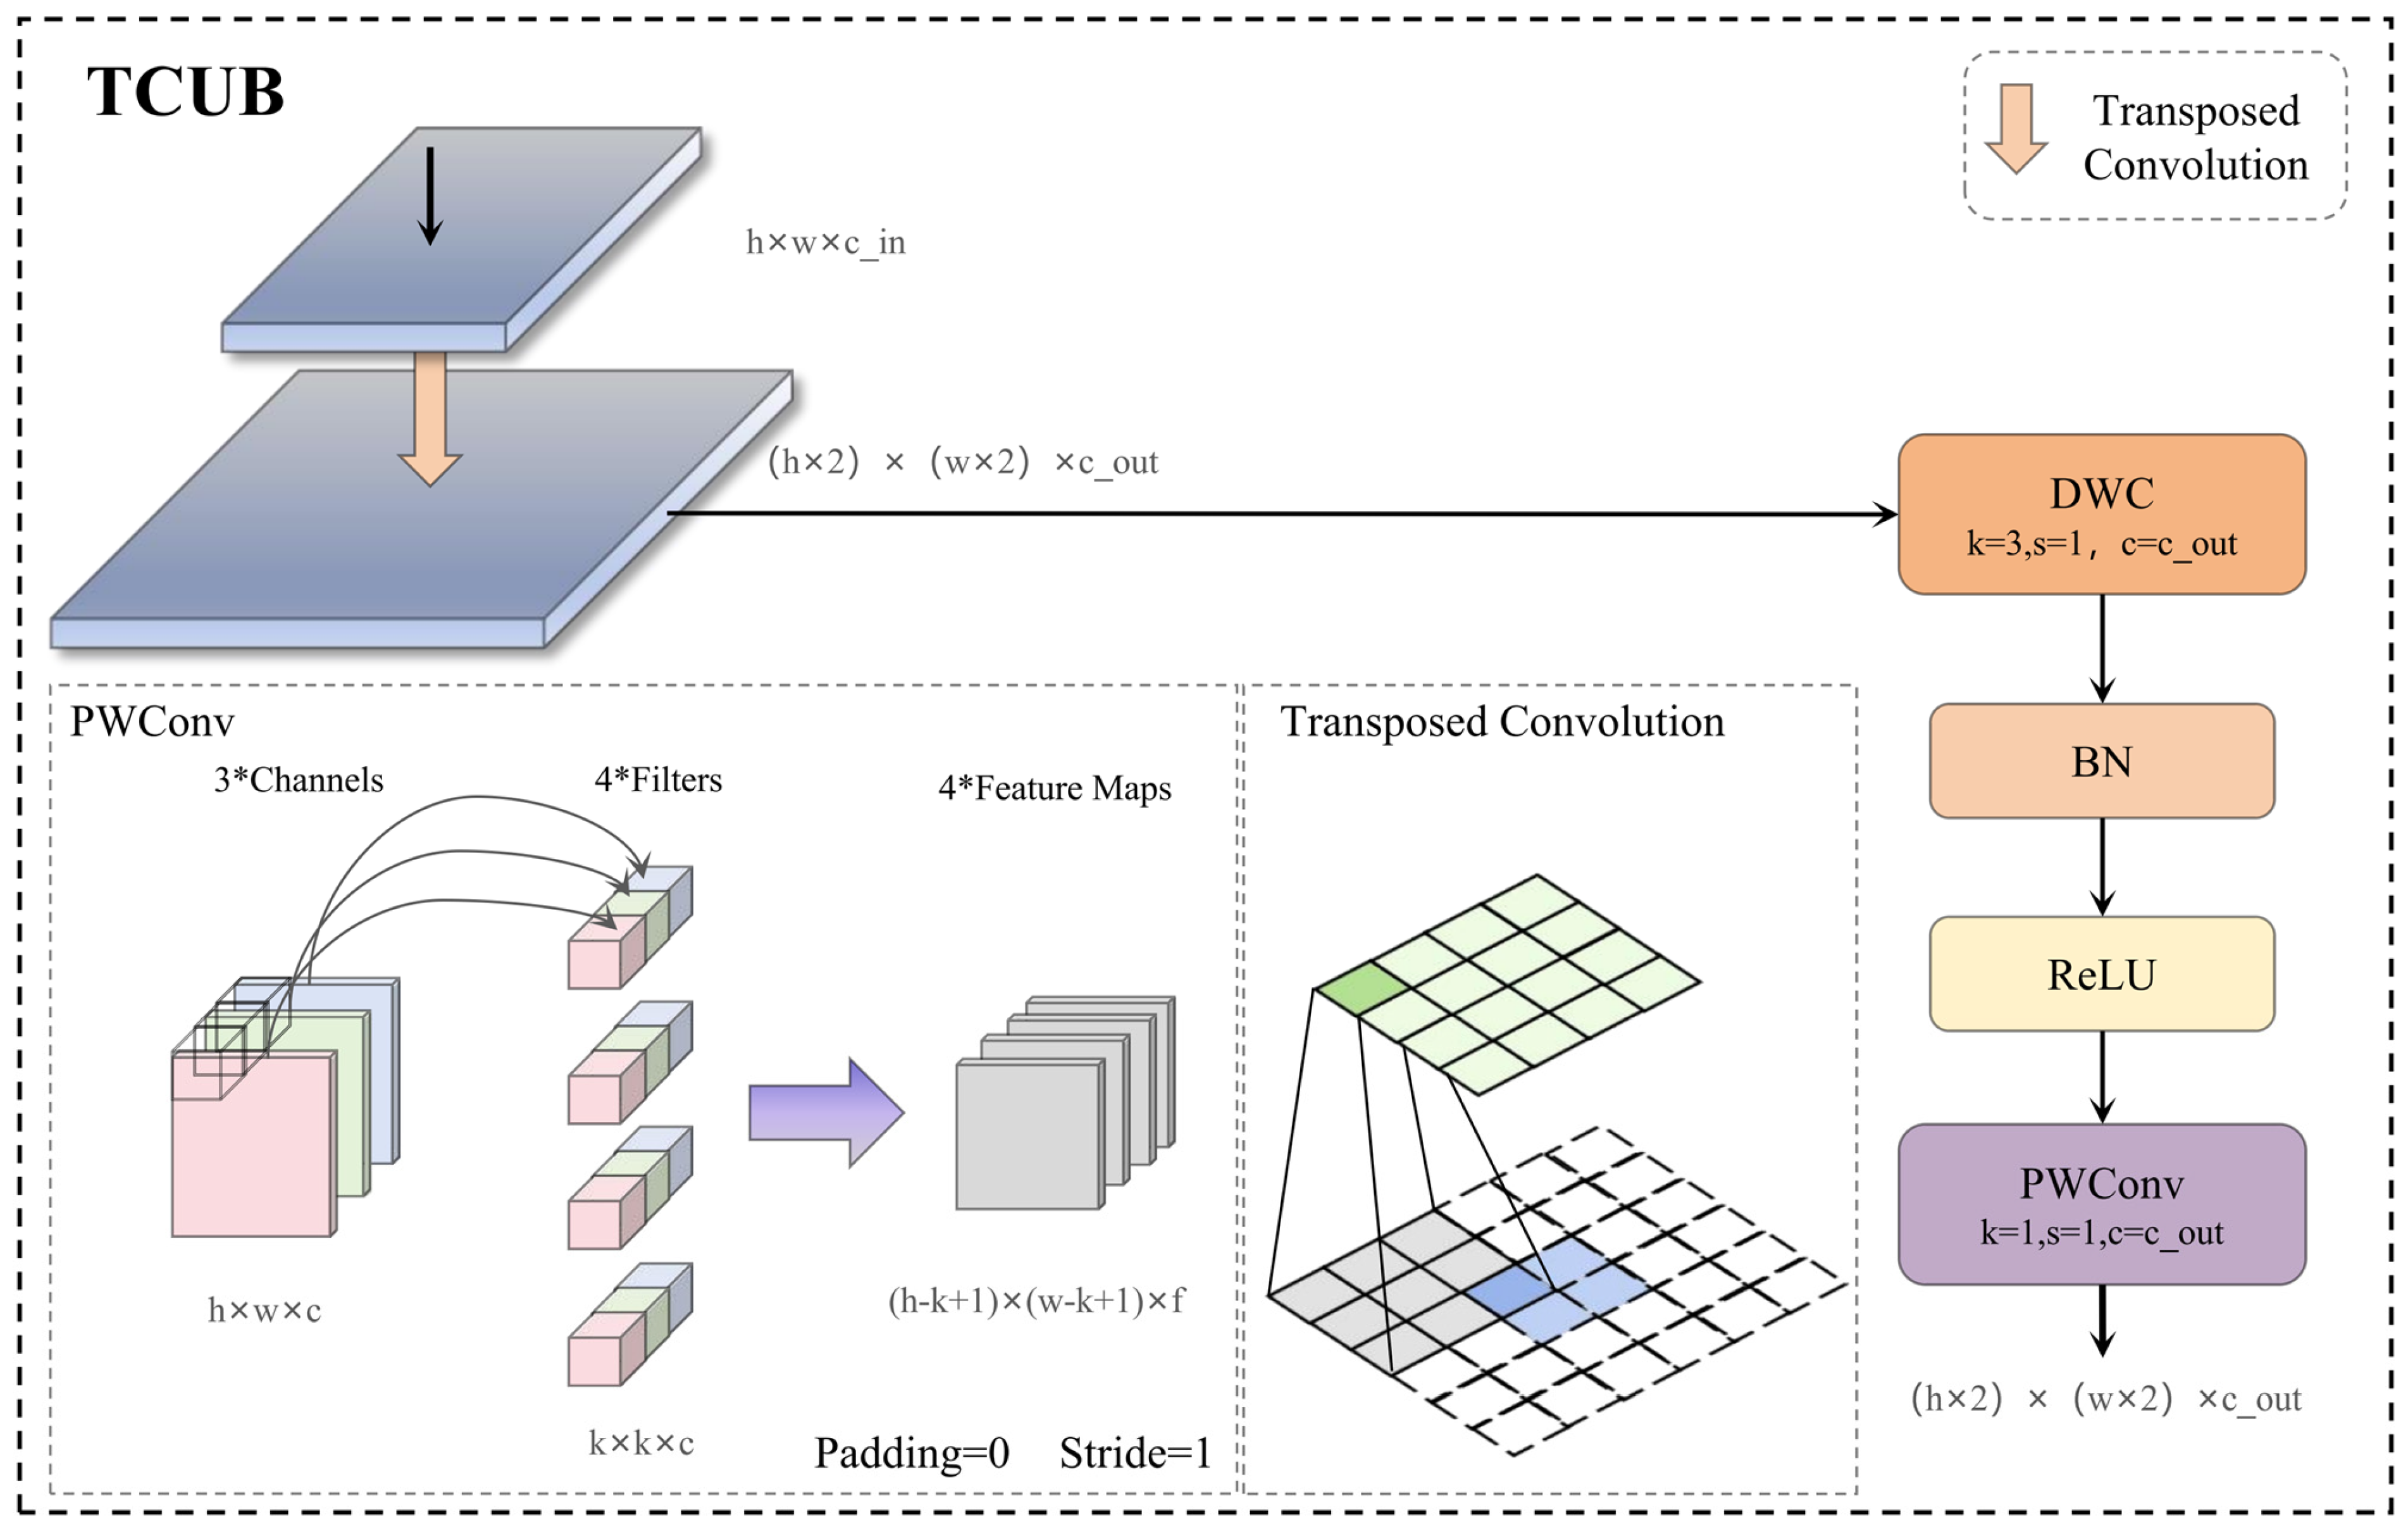
TCUB Module
TCUB cascades a 3 × 3 DWC block following a transposed convolution and adjusts the feature size and channel alignment (Figure 8). Given the element-wise convolution operation X k W k , the mean μ k and variance σ k 2 are computed across the spatial domain for each channel k, whilst ϵ is introduced as a small constant to ensure numerical stability.
This method, combined with multi-scale depth-wise separable convolution, effectively mitigates internal covariate shift during training. Depth-wise convolution processes each channel independently with different kernel sizes, efficiently extracting multi-scale features, stabilizing gradients, and accelerating convergence, which benefits learning multi-scale representations for dam detection. A subsequent 1 × 1 pointwise convolution doubles the feature dimension. Unlike nearest-neighbor interpolation, which loses detail due to pixel clustering, TCUB enables continuous parameter optimization during backpropagation, improving upsampling, preserving image details, maintaining semantic integrity, and ensuring precise boundary localization. Note that transposed convolution may introduce checkerboard artifacts due to uneven overlap. In TCUB, this risk is alleviated by the subsequent 3 × 3 depth-wise refinement, which reaggregates local responses and suppresses aliasing artifacts in the upsampled feature maps. Since TCUB is used for feature alignment rather than image reconstruction and is followed by learnable refinement and channel mixing, this design effectively suppresses checkerboard artifacts and maintains stable detection performance. The calculation process for TCUB is as follows.
TCUB X c , i , j = c = 1 C i n W c , c 3 · ϕ 2 p , q W π c , p , q 2 · ϕ 1 m , n W c , m , n 1 · X c , j m , j n + b c
where TCUB(X)(c,i,j) represents the output feature at channel c and spatial position (i,j); C i n denotes the number of input channels; W c , c 3 are the weights of the third convolution layer connecting channel c to intermediate feature e; ϕ2(.) is the activation function of the second layer; W π c , p , q 2 are the spatial convolution kernels of the second layer, where a(c) maps output channel c to its corresponding intermediate channel, and (p,q) indexes the kernel positions; ϕ1(.) is the activation function of the first layer; W c , m , n 1 are the spatial convolution kernels of the first layer with kernel positions indexed by (m,n); X c , j m , j n represents the input feature at channel e and spatial position ([j]−m,[j]−n); and b c is the bias term for channel c.
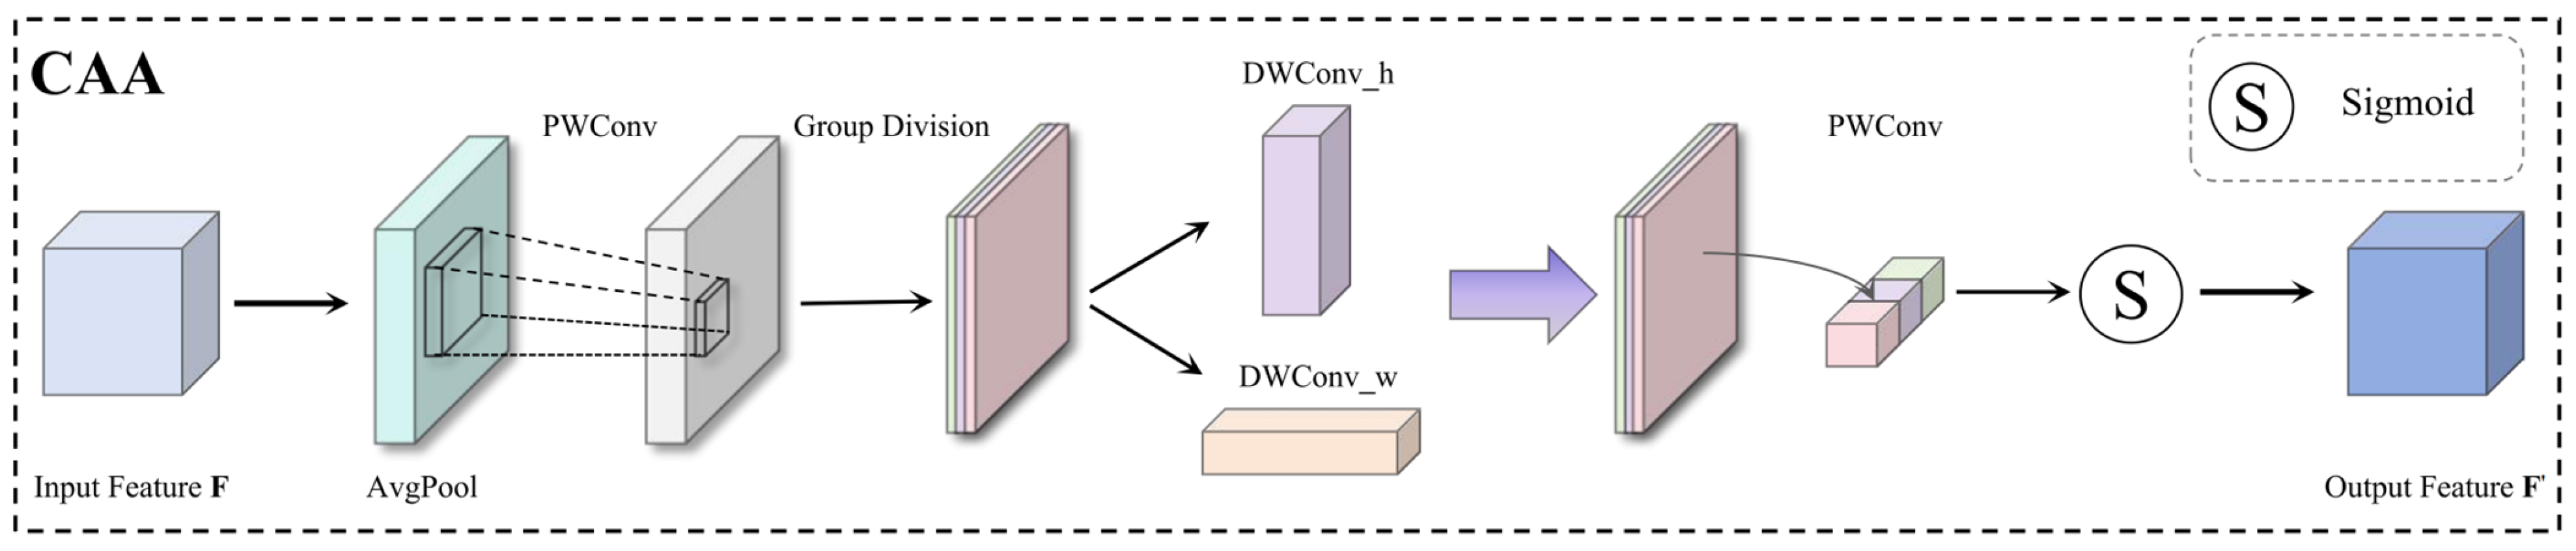
CAA Module
The introduction of CAA facilitates large-scale target detection, as illustrated in Figure 9. The input feature map first undergoes global average pooling, followed by channel compression and feature reconstruction via pointwise convolution, forming a compact local representation. Subsequently, one-dimensional strip convolutions are applied along height and width to capture spatial structures in both directions. Another pointwise convolution refines the feature map and adjusts channel dimensions, while a sigmoid activation generates a spatially adaptive attention weight map. The strip convolution kernel size increases with layer depth, progressively expanding the receptive field to capture broader contextual information and overcoming the limitations of fixed-size convolutions for medium to long-range dependencies. The calculation process for CAA is defined as follows.
CAA X = σ W 4 W 3 W 2 W 1 A v g P o o l X · γ 1 + β 1 · x · σ x · γ 2 + β 2 σ 2 2 + ϵ · y · σ y
where W1, W4 are 1 × 1 convolution weights, W2, W3 are depth-wise convolution kernels for horizontal and vertical directions, γ, β are batch normalization parameters, σ ( . ) is the Sigmoid function, and * denotes convolution operation.

3.3.2. MCCA Strategy

MCCA employs a three-stage cascaded filtering strategy to optimize ROI selection for aquatic object detection, as shown in Algorithm 1, integrating optical imagery with DEM and spectral indices to progressively refine candidate regions before applying deep learning detection. In this study, the thresholds in the MCCA strategy were set as follows: θ s l o p e = 15 , θ e l e v a t i o n = 3500   m , θ N D W I = 0.0 , θ W p = 0.03 , θ b l a c k = 0.10 , and r b u f f e r = 2560   m . These values are determined by combining geographical prior knowledge, the geomorphological and hydrological characteristics of the Xinjiang arid region, relevant previous studies, and repeated pilot experiments, with the aim of suppressing obvious non-target areas while retaining geographically plausible candidate regions for dam detection.
Algorithm 1. MCCA hierarchical screening strategy
Inputs: image dataset I = {I1, I2, …, In}, DEM elevation map E, DEM slope map S,
terrain constraints θ s l o p e , θ e l e v a t i o n ,
water detection parameters θ N D W I , θ W p , spatial buffer r b u f f e r ,
quality threshold θ b l a c k .
Outputs: filtered ROI set R o p t i m a l , total detection count D t o t a l .
Step 1: Spatial and terrain filtering
Initialize: R t e r r a i n , n s k i p p e d ← 0
for k = 1 to n do
Extract water system Wk and construct buffer zone:
Bk = {(i,j) | d e u c l i d e a n ((xij, yij), Wk) ≤ r b u f f e r }
where d e u c l i d e a n = ( x 1 x 2 ) 2 + ( y 1 y 2 ) 2
Apply spatial mask: R c a n d i d a t e = Ik ∩ Bk
Compute terrain metrics: e ¯ k , s ¯ k over R c a n d i d a t e
if ( e ¯ k > θ e l e v a t i o n ) or ( s ¯ k > θ s l o p e ) then
n s k i p p e d + 1 ; continue
Filter pixels: R c a n d i d a t e ← {(i,j) ∈ R c a n d i d a t e | s i j θ s l o p e e i j θ e l e v a t i o n }
R t e r r a i n R t e r r a i n ∪ {(Ik, R c a n d i d a t e )}
end for
Step 2: Water body validation
Initialize: R o p t i m a l
for each R t e r r a i n = { ( I k , R k c a n d i d a t e ) }  do
Compute black pixel ratio ρ b l a c k
if  ρ b l a c k > θ b l a c k  then  n s k i p p e d + 1 ; continue
Calculate NDWI: nij = (Greenij − NIRij)/(Greenij + NIRij + ε)
Extract water region: R w a t e r = {(i,j) ∈ R k c a n d i d a t e | nij > θ N D W I }
if | R w a t e r | = 0 then  n s k i p p e d + 1 ; continue
Compute water proportion: Wp = | R w a t e r |/| R k c a n d i d a t e |
if Wp > θ W p  then  R o p t i m a l R o p t i m a l ∪ {(Ik, R w a t e r )}
else  n s k i p p e d + 1
end for
Step 3: Object detection and aggregation
Initialize: D t o t a l ← 0
for each (Ik, Rk) ∈ R o p t i m a l  do
R e s u l t s k = DDE-YOLO(Rk)
Extract detections: B k = {(bboxi, confi)}
D t o t a l D t o t a l +| B k |
end for
return  R o p t i m a l , D t o t a l
Spatial and Terrain Filtering
Given an input image dataset I = {I1, I2, …, In} with corresponding DEM elevation (E) and slope (S) maps, a buffer zone Bk is constructed around each water system Wk using d((xij, yij), Wk) ≤ r b u f f e r . Candidate regions R c a n d i d a t e within this buffer are filtered by terrain thresholds: regions with mean elevation e ¯ k > θ e l e v a t i o n or mean slope s ¯ k > θ s l o p e are discarded. Remaining regions undergo pixel-level filtering to remove locations exceeding local slope or elevation thresholds, eliminating mountainous terrain while preserving low-lying aquatic habitats.
Water Body Validation
Terrain-filtered candidates undergo two-stage validation. First, we compute black pixel ratio ρ b l a c k to reject poor-quality images where ρ b l a c k > θ b l a c k . Second, we calculate NDWI = (Green − NIR)/(Green + NIR + ε) to identify water pixels, extracting water regions R w a t e r = {(i,j)|NDWI(i,j) > θ N D W I }. Only regions with water proportion Wp = | R w a t e r |/| R c a n d i d a t e | exceeding θ W p are retained in the optimal set R o p t i m a l , ensuring sufficient water coverage for meaningful detection.
Object Detection and Aggregation
Validated ROIs are processed through the DDE-YOLO detector, yielding bounding boxes B k with confidence scores for each region. Total detection count D t o t a l = Σk | B k | is computed across all regions, providing comprehensive detection results with substantially reduced computational cost compared to full-image processing.

4. Experiment and Result Analysis

4.1. Experimental Environment and Parameter Settings

4.1.1. Experimental Setup

The experimental procedures were carried out in the PyTorch framework version 2.0.0, based on Python 3.9.21 and CUDA 11.8, and executed on an NVIDIA RTX 4000 GPU. All models discussed in this paper were trained, validated, and tested using the same hyperparameters. The hyperparameter configurations are detailed in Table 1.

4.1.2. Accuracy Indicators

In this study, five metrics are employed to evaluate model performance: precision (P), recall (R), mean average precision (mAP), F1 score, and F2 score. Precision and recall are calculated as follows.
Precision = T P T P + F P .
Recall = T P T P + F N .
where TP denotes the number of true positive samples, FN signifies the number of false negatives, and FP indicates false positives. In the evaluation process, a confidence threshold of 0.25 was used to determine valid detections for calculating precision and recall, while an IoU threshold of 0.5 was used to determine whether a prediction was counted as a true positive.
Precision quantifies the accuracy of positive predictions, with higher values indicating fewer false detections. Recall measures the proportion of actual positive samples correctly identified, with higher values corresponding to fewer missed detections. Average precision (AP) and mAP are calculated as follows.
AP = 0 1 p r dr .
m A P 50 = i = 1 N A P i N , I o U 0.5 .
AP ranges from 0 to 1, with higher values indicating better detection. For single-class detection, mAP equals AP. mAP50 represents performance at an IoU threshold of 0.5. Higher mAP50 indicates stronger detection capability. F1 score and F2 score are calculated as follows.
F 1 = 2 × P r e c i s i o n × R e c a l l P r e c i s i o n + R e c a l l .
F 2 = 5 × P r e c i s i o n × R e c a l l 2 × P r e c i s i o n + R e c a l l .
The F1 score, the harmonic mean of precision and recall, provides a balanced performance measure. The F2 score weights recall 2.5 times more than precision, making it sensitive to false negatives. Higher F2 scores indicate fewer missed detections. In large-area detection, minimizing false negatives is crucial; therefore, this study prioritizes recall and F2 as key metrics.

4.2. Comparative Experimental Results and Analysis

4.2.1. Test on S2-Dam VIS

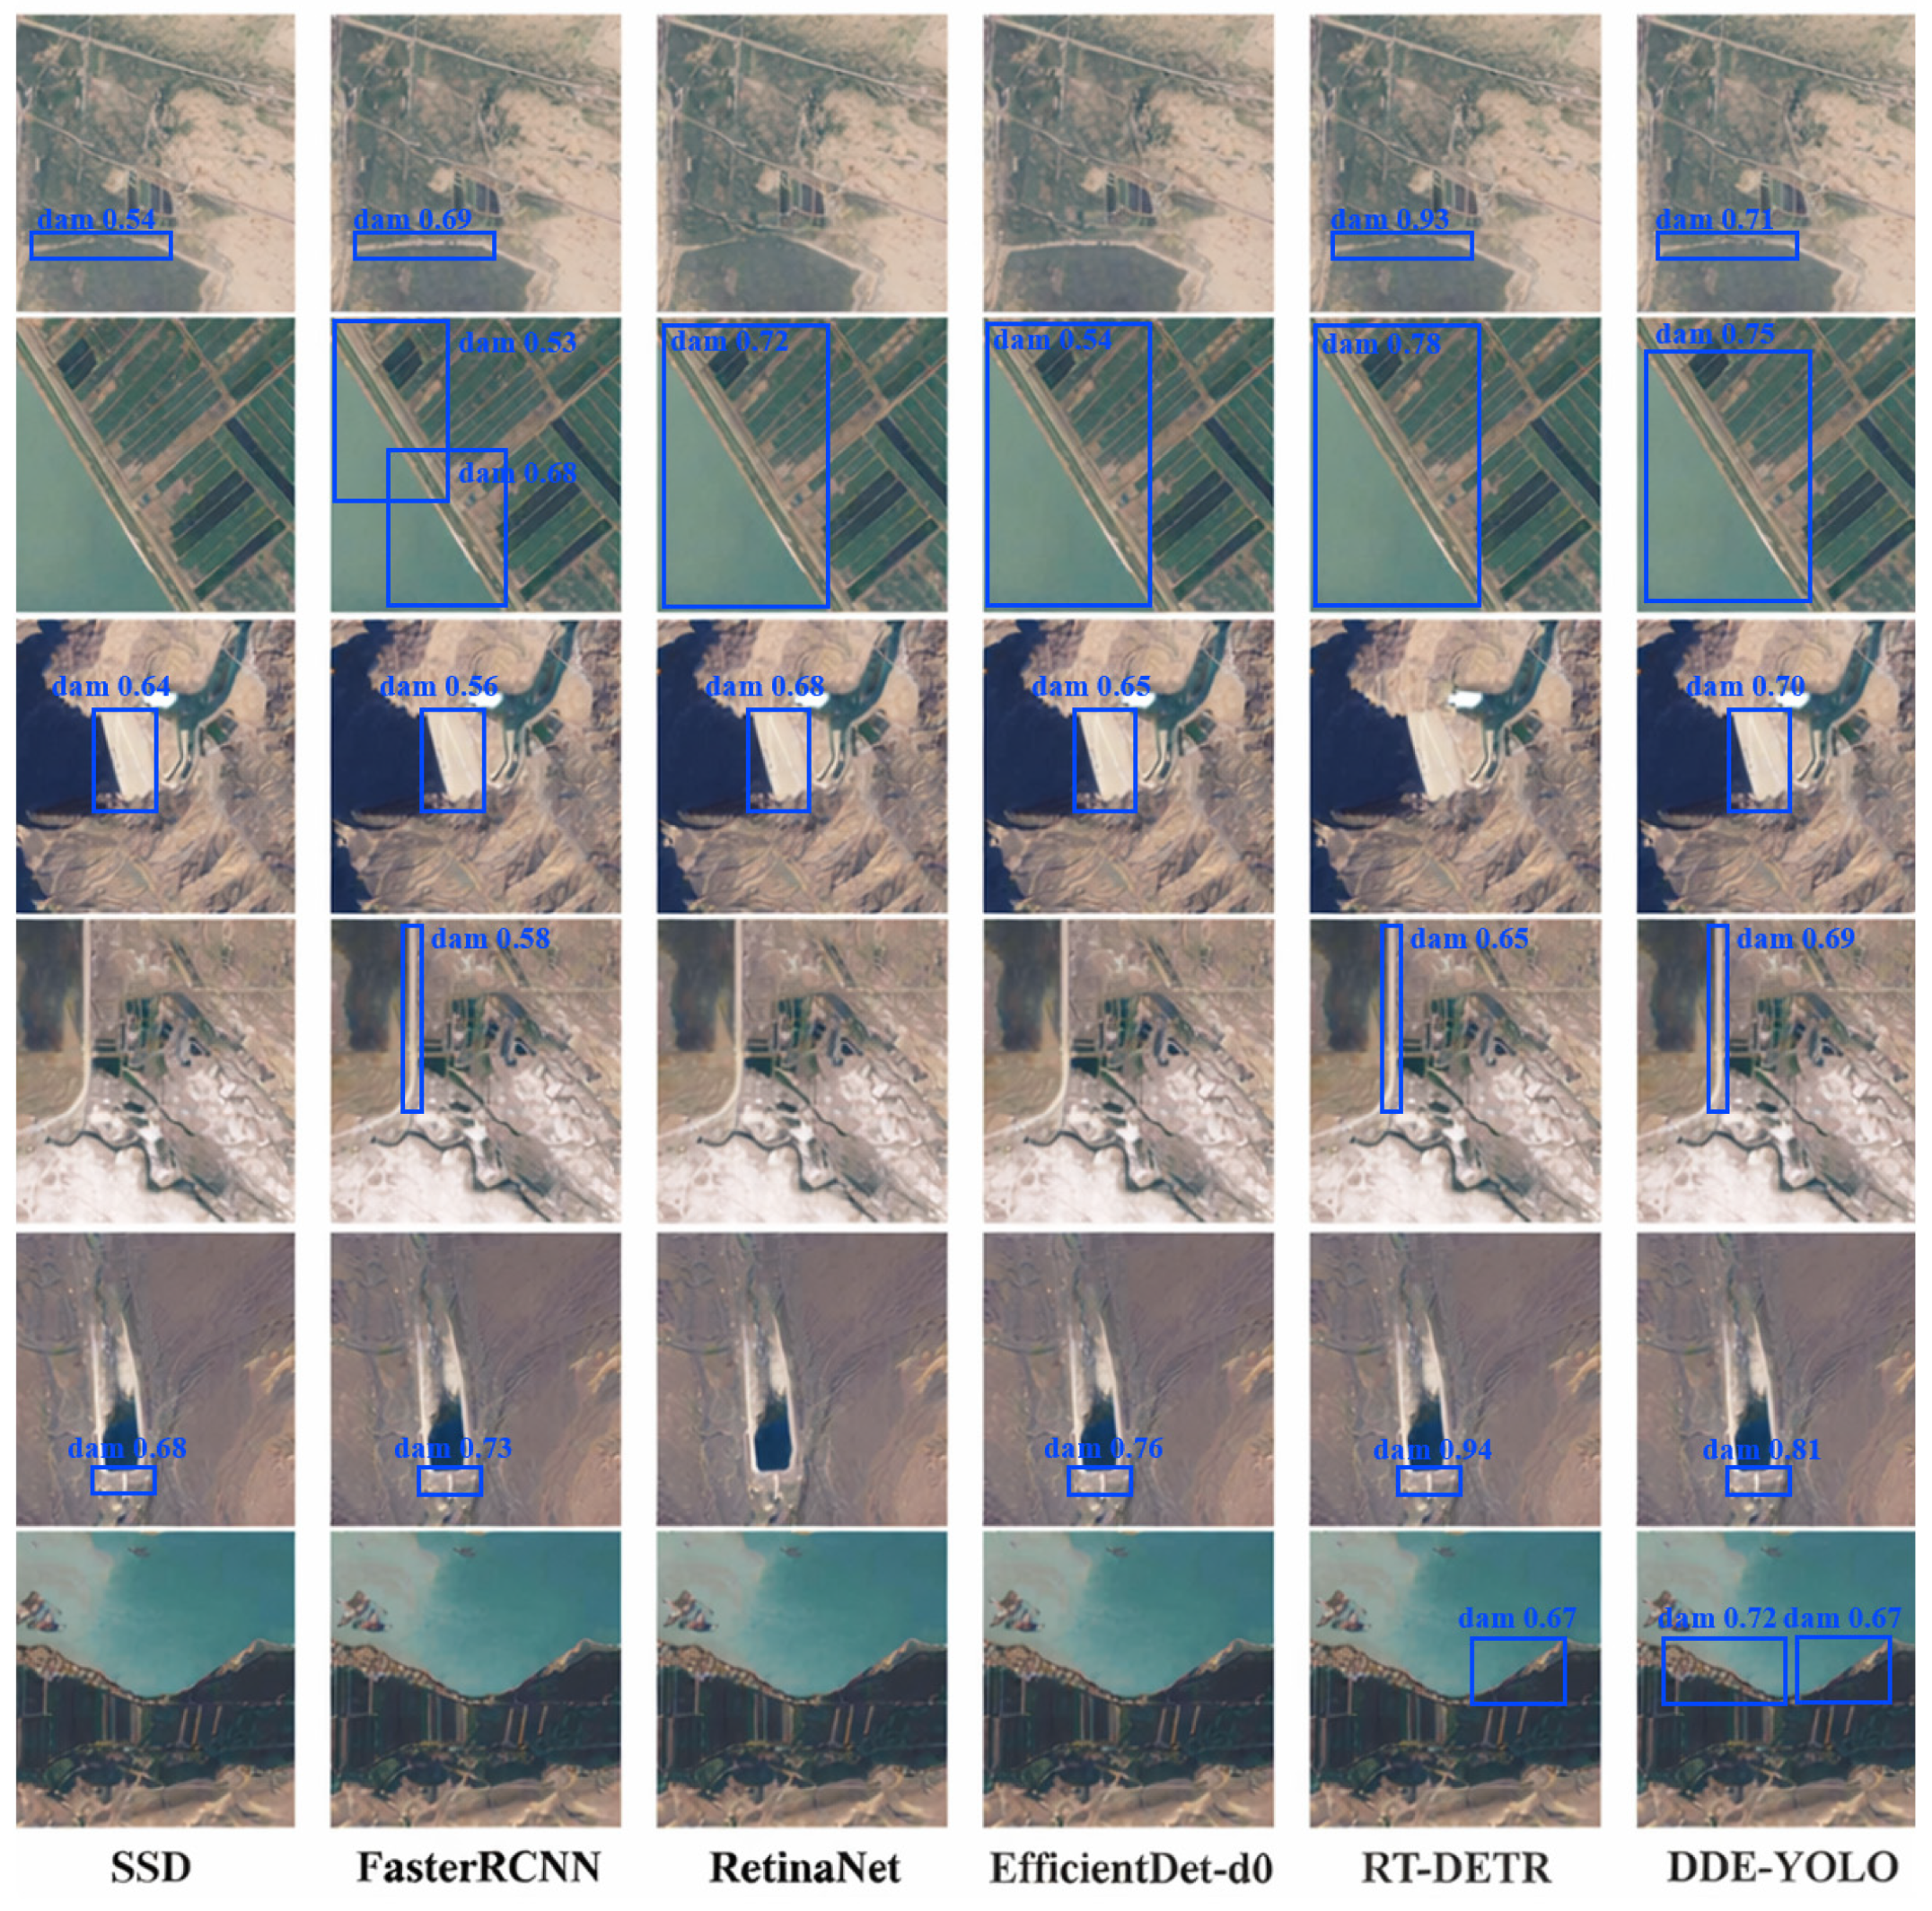
Three classical object detection models—SSD [46], FasterRCNN [47], and RetinaNet [48]—along with EfficientDet-d0 [49] and RT-DETR [50], were selected for comparative analysis, as illustrated in Figure 10. The results show that DDE-YOLO achieves more complete and accurate dam detection. Compared with the other models, DDE-YOLO exhibits stronger capability in identifying dams with varying spatial extents and structural forms. In contrast, the competing models show evident limitations in several scenarios. SSD, RetinaNet, and EfficientDet-d0 are more prone to incomplete detections or missed detections when dam boundaries are indistinct or when background interference is pronounced, indicating insufficient preservation of local structural information. FasterRCNN provides relatively accurate localization for some salient targets; however, it tends to fragment large dams, which reduces the integrity of the detection results. Only RT-DETR and DDE-YOLO are capable of identifying irregularly shaped dams, although RT-DETR still produces false negatives in some cases. In comparison, DDE-YOLO generates bounding boxes that are more consistent with the actual extent of the targets, indicating greater reliability in dam detection.
Table 2 presents the key quantitative evaluation metrics, showing that DDE-YOLO significantly outperforms the other models across the core indicators. These quantitative results are in agreement with the visual comparison in Figure 10, further demonstrating the effectiveness of the proposed method. Although RT-DETR achieves competitive performance in certain cases, its effectiveness in objects with substantial scale variation remains constrained. DDE-YOLO incorporates MSC3k and TCUB to strengthen local feature extraction and reduce information loss during feature reconstruction, while CAA enhances long-range contextual modeling. This design improves the representation of both detailed local features and broader semantic context, thereby contributing to more complete and stable detection results. As a result, DDE-YOLO achieves improvements of 1.0%, 9.5%, 4.1%, 5.6%, and 11.6% in precision, recall, mAP50, F1, and F2, respectively, compared with the other models. Overall, these findings demonstrate the superiority of DDE-YOLO for dam detection in remote sensing imagery.

4.2.2. Test on S2-Dam VIS-NIR

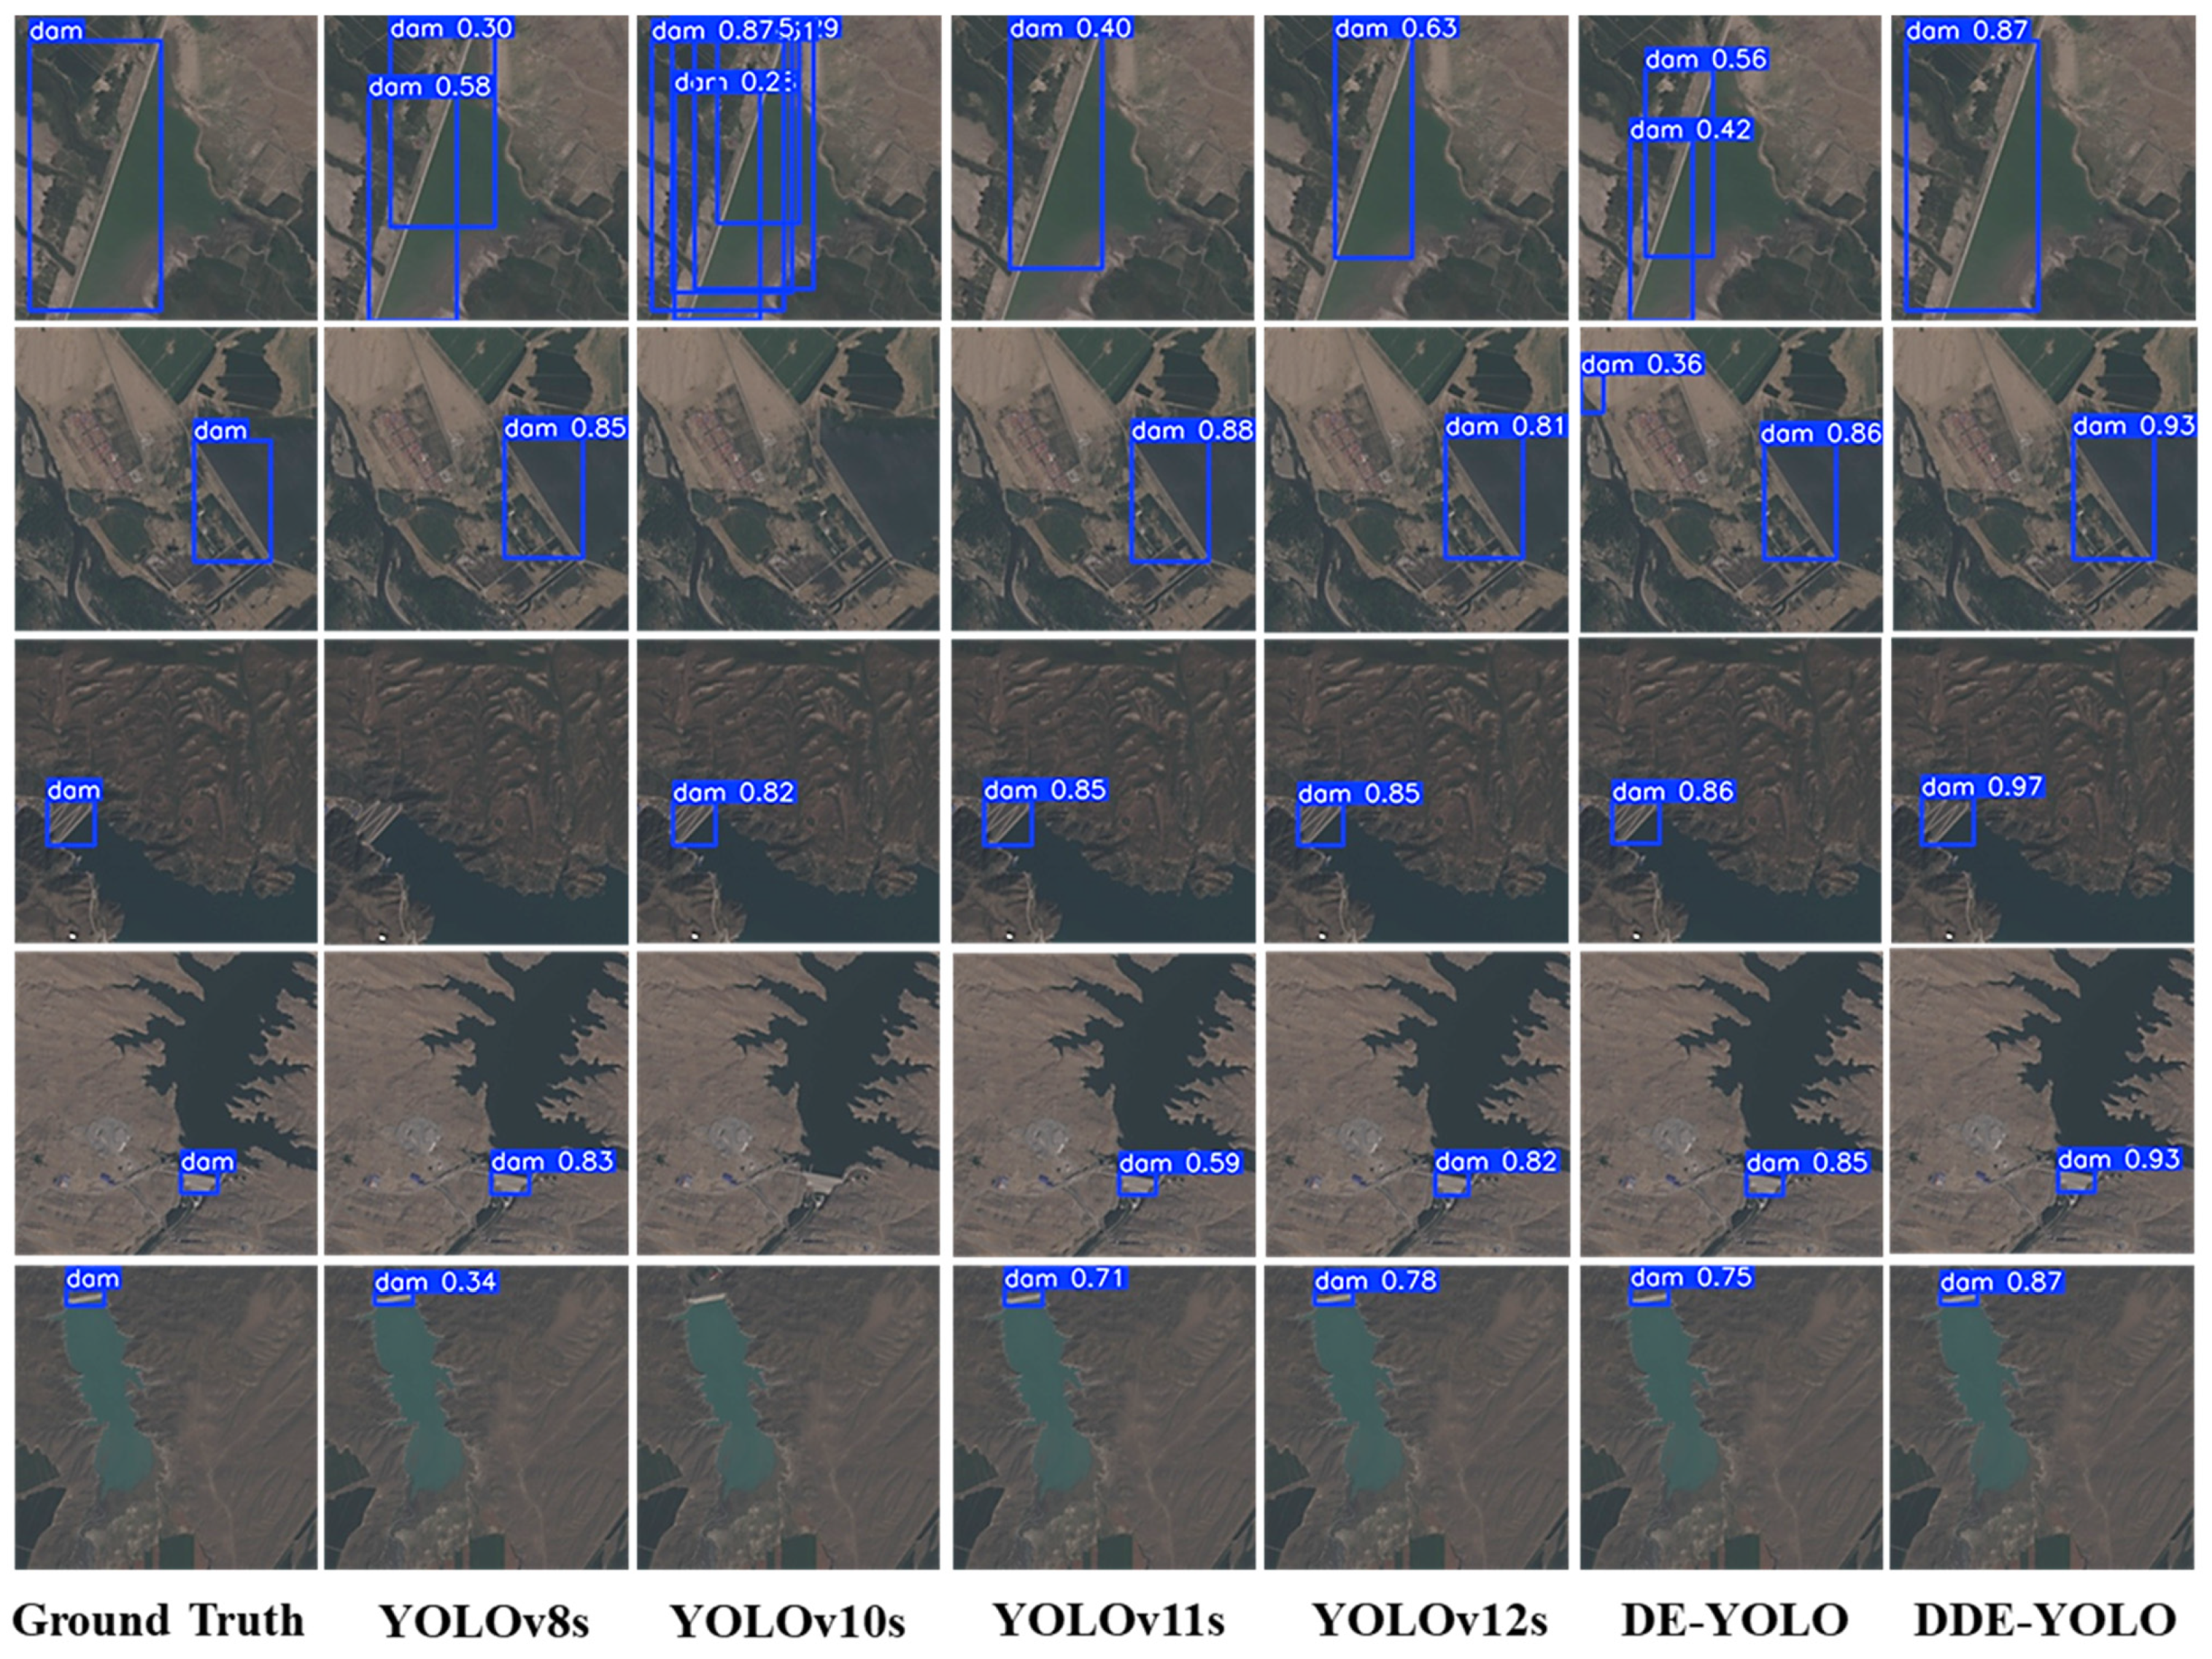
Based on VIS-NIR remote sensing imagery, comparative experiments were conducted across multiple multimodal detection models. As shown in Figure 11, most baseline models (YOLOv8s, YOLOv10s [51], YOLOv11s, YOLOv12s [52], and DE-YOLO [53]) exhibit noticeable instability, including repeated overlapping detections on the same target, occasional missed detections, and fluctuating confidence scores, particularly in scenes with complex shorelines or heterogeneous mountainous backgrounds. In contrast, DDE-YOLO achieves consistent and precise localization across all test samples, producing single, well-aligned bounding boxes without omissions, while maintaining higher and more stable confidence scores. These results indicate stronger feature discrimination capability and enhanced robustness under VIS-NIR multimodal fusion. For a fair and consistent comparison, all models in Table 3 were evaluated under identical settings, with a confidence threshold of 0.25 and an IoU threshold of 0.5.
In this study, YOLOv11s was adopted as the baseline model owing to its lightweight architecture and balanced performance in detection accuracy and computational efficiency. As DDE-YOLO was developed based on YOLOv11s, comparison with this baseline provides a more direct and interpretable quantitative assessment of the effectiveness of the proposed improvements. Quantitatively, although DE-YOLO attains slightly higher precision (97.3%), DDE-YOLO surpasses it by 2.3% in mAP50 and significantly improves recall, F1, and F2 by 4.5%, 5.6%, and 5.7%, respectively (Table 3). These gains demonstrate that DDE-YOLO achieves a better balance between detection accuracy and completeness, effectively reducing both false negatives and unstable predictions. Notably, DDE-YOLO attains these performance gains without introducing a substantial increase in parameter count or computational cost, while preserving the highest precision level among the evaluated models. In addition, SuperYOLO is included in Table 3 as a representative multimodal detector for comparison on the VIS-NIR dataset. SuperYOLO enhances multimodal object detection through a reconstruction strategy assisted by super-resolution, which improves fine-grained feature representation. However, as shown in Table 3, its overall performance on the present reservoir dam detection task remains inferior to that of DDE-YOLO, with consistently lower precision, recall, mAP50, and F1 score. This result indicates that, although super-resolution-based multimodal enhancement contributes to improved feature quality, it remains insufficient for adequately addressing the combined challenges of spectral homogeneity, ambiguous boundaries, and substantial target-scale variation in arid region dam detection. By contrast, DDE-YOLO yields more robust and better-balanced detection performance, further demonstrating the effectiveness of the proposed framework on the VIS-NIR dataset. Overall, the results confirm that DDE-YOLO delivers superior detection robustness and generalization capability on VIS-NIR imagery.

4.2.3. Test on DIOR Dataset

To assess the generalization capability of the proposed model across various spatial scales, rather than limiting the evaluation to its performance on Sentinel-2 at 10 m resolution, we conducted extensive experiments on the DIOR dataset. As shown in Table 4, DDE-YOLO surpasses other models, achieving mAP50 of 76.2%, with an F1 score and F2 score of 75.7% and 122.9%, respectively, consistently exceeding YOLOv5s, YOLOv8s, RT-DETR, and RetinaNet. Although YOLOv5s attained 84.2% precision, its recall was constrained to 65.8%. FasterRCNN achieved a recall of 85.8%, with a precision of only 46.3%. In contrast, DDE-YOLO provides a more balanced performance. This further substantiates that, even under cross-scale conditions and in more complex backgrounds, the DDE-YOLO model retains strong generalization capabilities and detection robustness, achieving overall superior performance.

4.3. Ablation Experiment

4.3.1. VIS Single Mode

This section presents ablation experiments isolating each module to evaluate its individual contribution and examining synergistic effects to enhance the overall effectiveness of DDE-YOLO. All experiments were performed on the S2-Dam dataset using the same hyperparameter configuration. In the tables, (√) denotes the inclusion of a module, while (×) indicates its exclusion.
The impact of the MSC3k, TCUB, and CAA modules on VIS evaluation metrics was analyzed. To ensure fair conclusions, experiments were conducted using only the VIS single input, avoiding MF influence. The experimental results, recorded in Table 5, indicate that the introduction of the MSC3k, TCUB, and CAA modules led to significant performance gains. Specifically, MSC3k improved recall by 3.5%, mAP50 by 4.0%, F1 score by 1.8%, and F2 score by 4.0%. TCUB further increased recall by 5.9%, mAP50 by 4.0%, and F2 score by 7.2%. The standalone CAA module achieved a 4.7% improvement in mAP50. Overall, consistent upward trends were observed in recall, mAP50, and F2 score, confirming the positive contributions of each module. When combined, the three modules achieved a peak mAP50 of 91.1%, demonstrating that substantial improvements in detection accuracy can be achieved using only the MSC3k, TCUB, and CAA modules with a single VIS input.

4.3.2. VIS-NIR Fusion Mode

To comprehensively evaluate module generalization and effectiveness under VIS-NIR inputs, ablation experiments were conducted by adding or removing MSC3k, TCUB, and CAA modules. As summarized in Table 6, compared to a single VIS input, the combined application of MSC3k, TCUB, and CAA modules yields significant improvements: 3.4% in precision, 4.7% in recall, 1.3% in mAP50, 4.2% in F1 score, and 7.2% in F2 score. These improvements are not merely additive, implying that the three modules reinforce one another when learning shared VIS-NIR representations. In particular, the performance uplift under fused inputs is stronger than that observed under VIS-only inputs, indicating that the proposed design is better able to capitalize on cross-spectral complementarity to further maintain high precision.

5. Discussion

5.1. Effectiveness of DLOD&MCCA Framework

The DLOD&MCCA framework introduces a novel methodology for the high-precision detection of reservoir dams in arid regions. It addresses three primary challenges: variability in target spatial scales, spectral homogeneity with blurred visible boundaries, and high background noise coupled with low mapping efficiency in extensive dam detection across arid environments. This framework utilizes the distinct characteristics of VIS and NIR imagery to develop a dual-mode feature integration network, referred to as DDE-YOLO, which significantly enhances accuracy in complex settings while facilitating intelligent recognition and automated mapping. Simultaneously, the MCCA strategy defines optimal detection ranges by considering key environmental factors, thereby enhancing the identification of regions of interest, reducing background interference, and improving both mapping accuracy and computational efficiency.
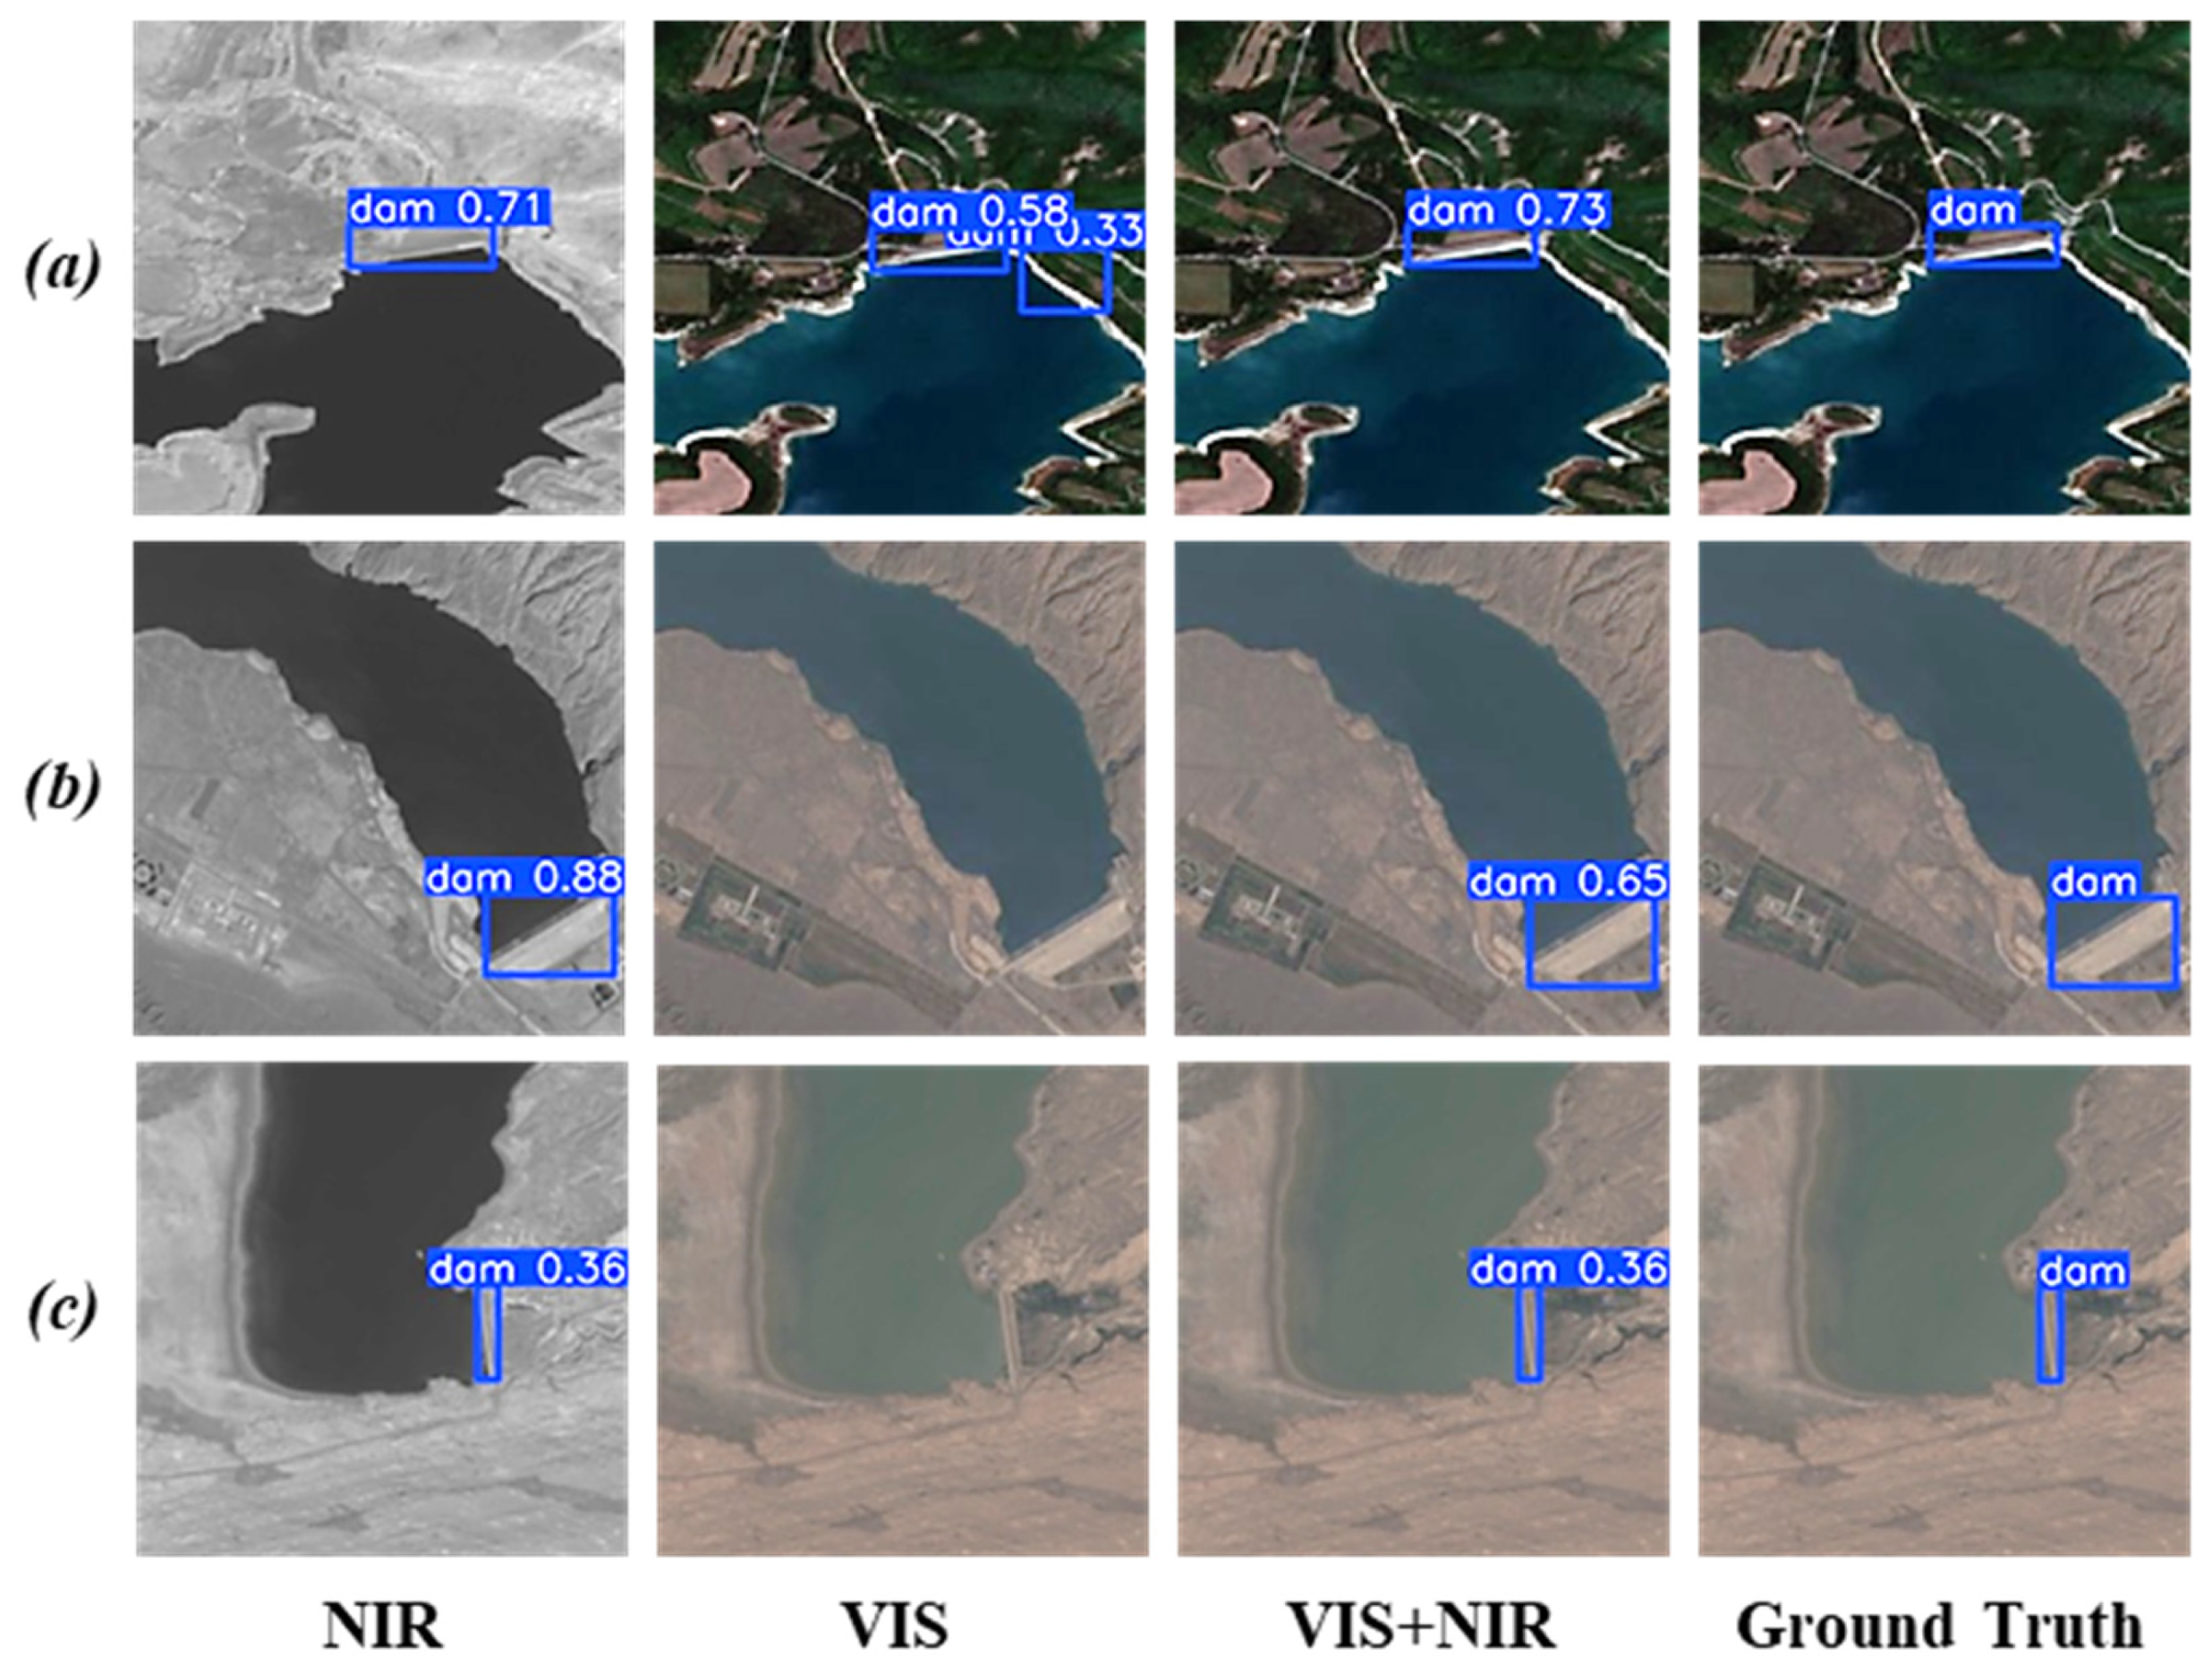
The early fusion of NIR data provides crucial complementary information for addressing the spectral homogeneity issue inherent in visible light detection. This approach compensates for the limitations of visible light, effectively mitigating pixel ambiguity and minimizing missed detections. The multimodal fusion module at the front end of the DDE-YOLO framework significantly enhances the accuracy of dam recognition in arid regions. This remarkable performance improvement is attributed to the strong water absorption and dark hue characteristics of NIR, which effectively enhance the contrast with surrounding materials, as illustrated in Figure 12. Figure 12a presents the S2-Dam test set, while Figure 12b,c are derived from the study area. In Figure 12a, VIS misjudged the target due to visual interference caused by the white concrete structure of the dam; in contrast, NIR effectively reduced such errors. Consequently, the joint detection results of VIS and NIR data effectively eliminated false alarms and improved overall recognition accuracy. As shown in Figure 12b, the spectral homogeneity between the dam and the surrounding arid terrain led to the failure of the VIS modality to detect the target; however, the NIR modality successfully achieved target recognition, ensuring accurate detection through VIS-NIR fusion technology, thereby preventing missed detections. In Figure 12c, the spectral homogeneity of smaller dams is even more pronounced. Limited pixel information caused the visible light to fail in recognizing the target, whereas the VIS-NIR spectral features compensated for the limitations of pixel size, enabling successful detection.
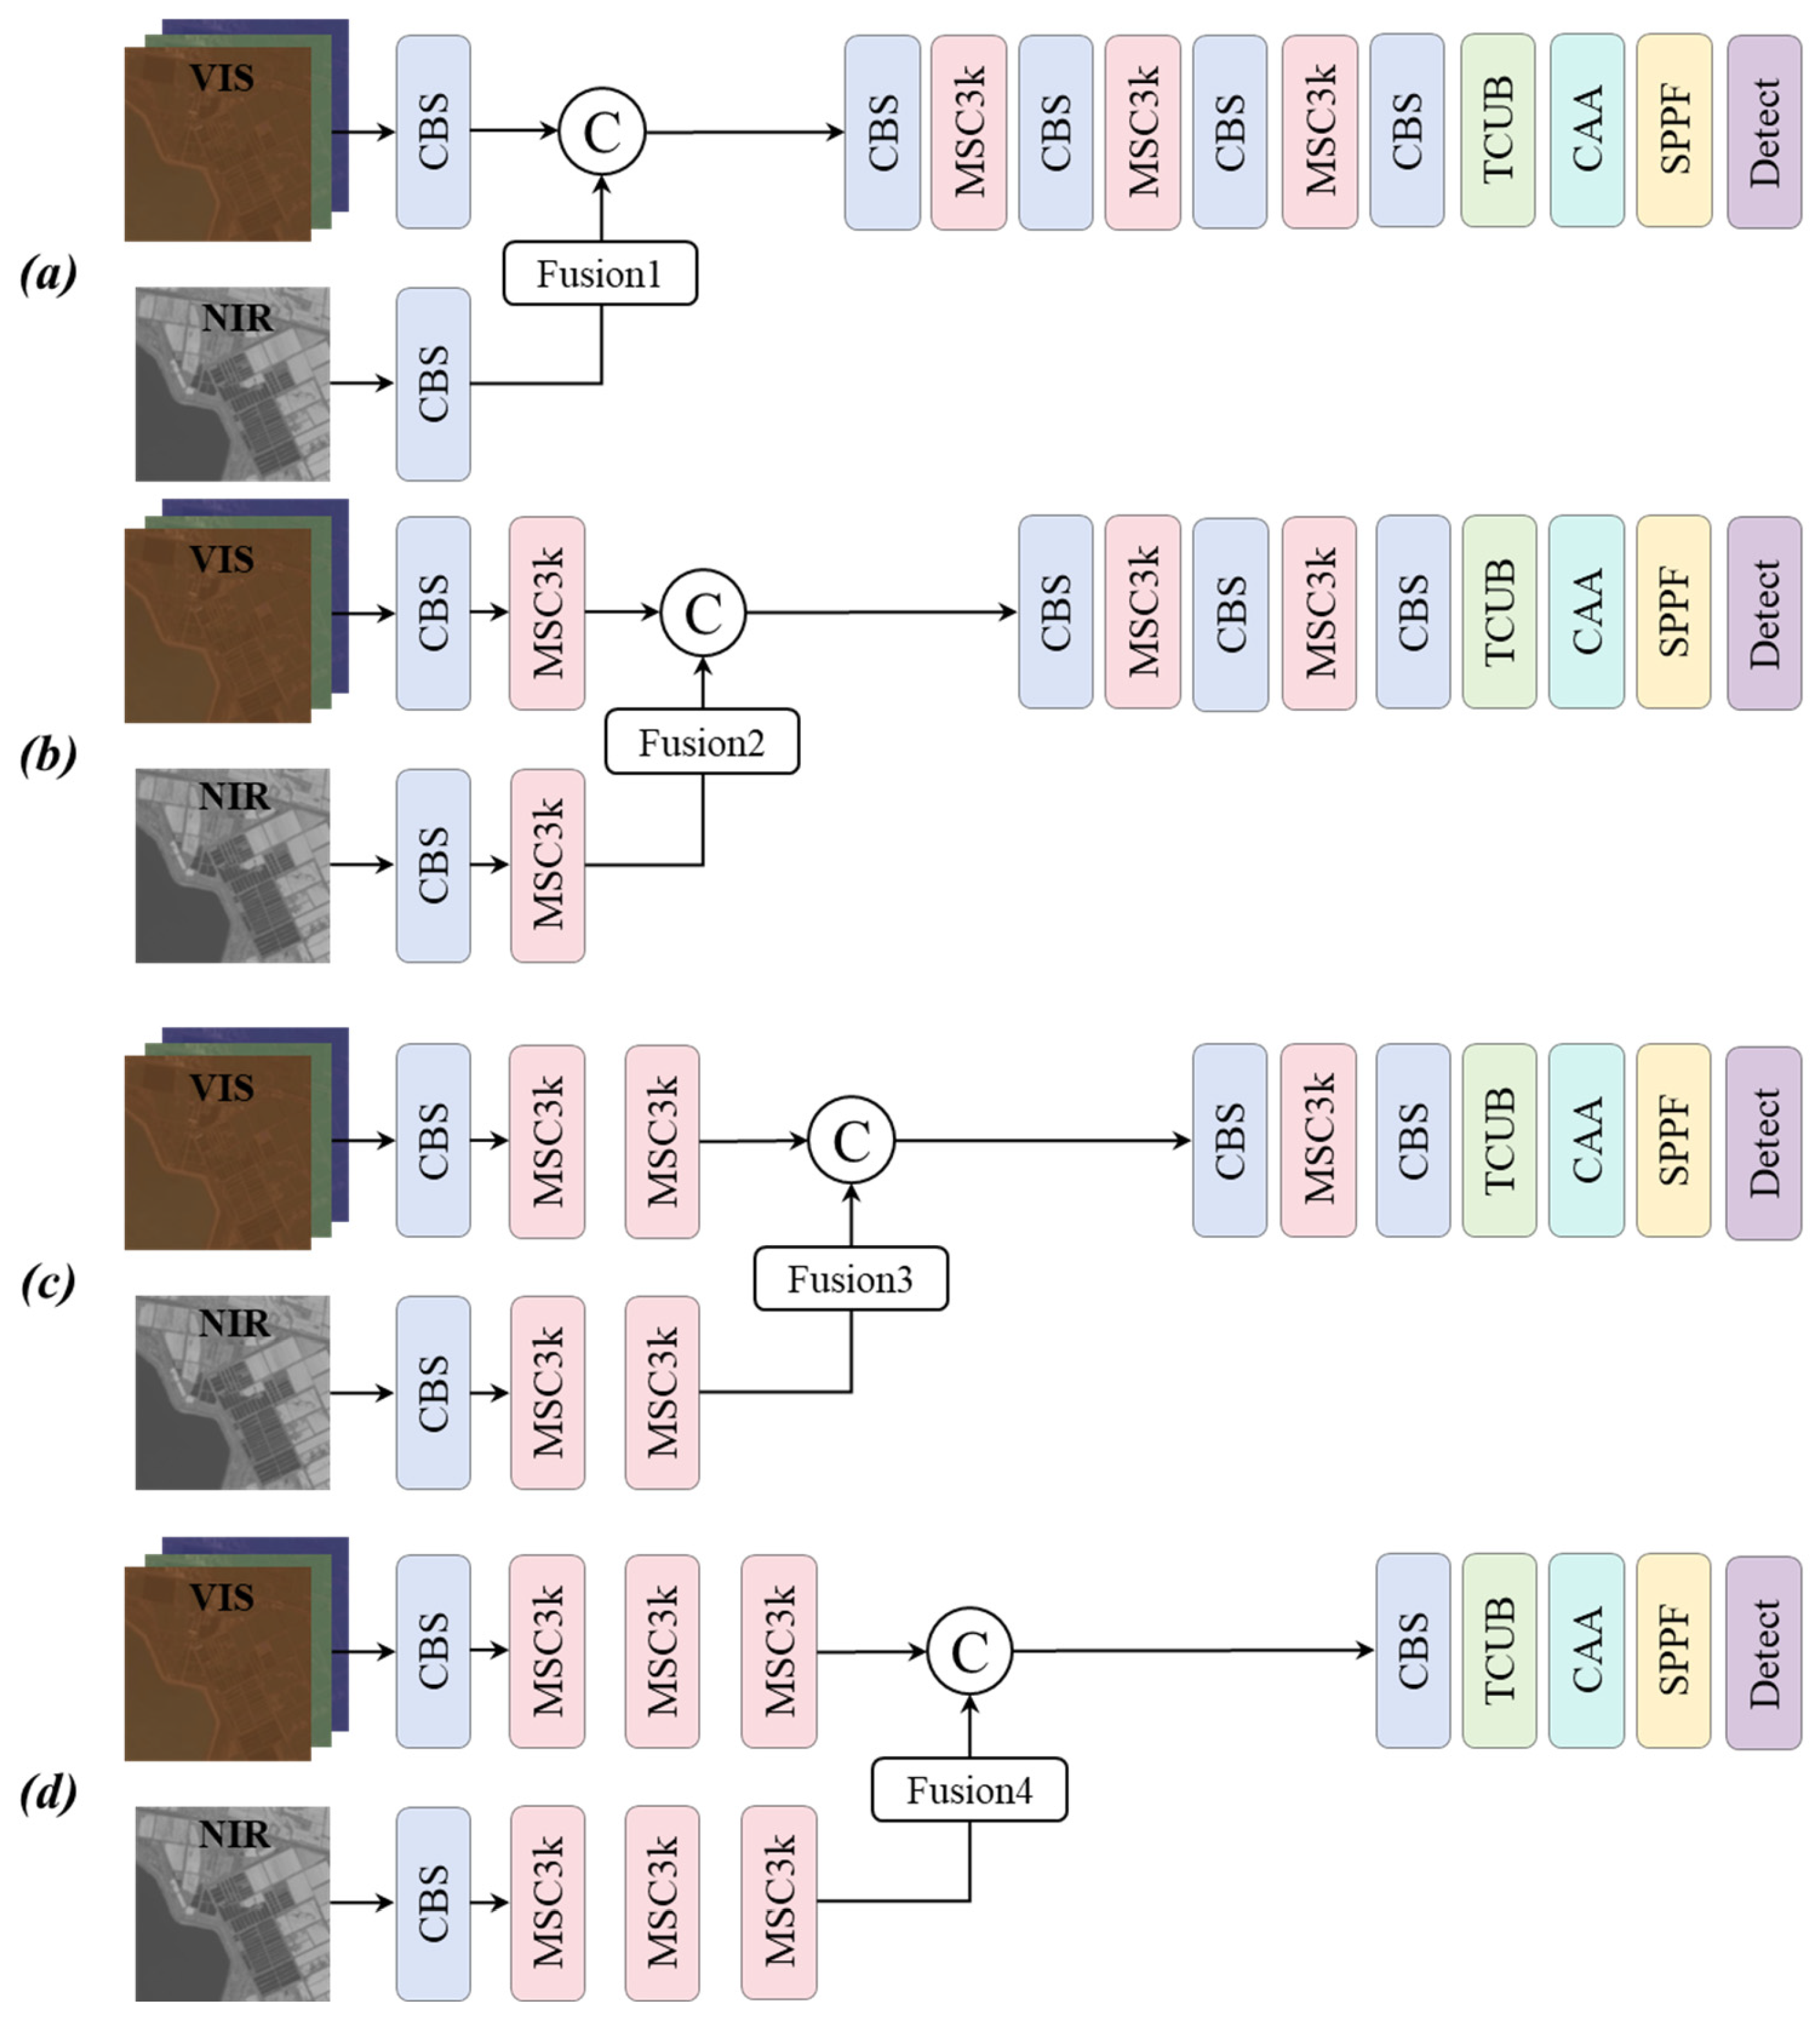
Different fusion strategies significantly influence the accuracy of the DDE-YOLO model. Through a comprehensive exploration and analysis of four distinct fusion strategies, namely early fusion, mid fusion, mid-to-late fusion, and late fusion, we observed that the mid fusion method integrates features at a specific point within the Backbone network before they are transmitted to the Head module, thereby effectively reducing computational cost. The mid-to-late fusion strategy builds upon this by performing integration in both the Backbone and Head, whereas late fusion solely combines independently extracted features at the final stage. To facilitate a clearer structural comparison, schematic diagrams of the four fusion strategies are presented in Figure 13. As illustrated in Figure 13, the main difference among these methods lies in the stage at which VIS and NIR information is integrated. Specifically, early fusion performs cross-modal interaction at the input stage through the proposed MF module, mid fusion introduces feature integration after preliminary feature extraction in the Backbone, mid-to-late fusion conducts hierarchical interaction at multiple deeper stages, and late fusion delays modality interaction until the final prediction stage. However, detection accuracy progressively declines as the fusion stage is postponed, with early fusion demonstrating the highest performance (as illustrated in Table 7). This result suggests that earlier feature interaction is more effective in preserving complementary spectral information and enhancing target discriminability. This trend can be attributed to stage-specific optimization within the Backbone and Head, as excessive downsampling or delayed concatenation can impair feature representation capability and lead to the loss of semantic information, thereby diminishing detection performance. Therefore, the superior performance of early fusion further confirms the effectiveness of the proposed MF module in exploiting VIS-NIR complementarity for reservoir dam detection in arid environments.
It should be emphasized that the observed performance improvement cannot be attributed exclusively to the inclusion of the NIR modality. On the one hand, the visual evidence presented in Figure 12, together with the comparison of different input configurations, demonstrates that NIR provides complementary spectral information that mitigates spectral homogeneity and improves the separability between dam targets and surrounding background regions in arid environments. On the other hand, the comparison of different fusion strategies in Table 7 indicates that early fusion consistently achieves the best performance under the same VIS-NIR setting, implying that the fusion manner itself also constitutes an important factor affecting detection performance. Therefore, the effectiveness of the proposed MF module should be understood as arising from the combined contributions of VIS-NIR complementarity and the front-end fusion strategy adopted for this task.
To further quantify the contribution of different input configurations under the early fusion setting, the effects of introducing features beyond the near-infrared band, including NDWI, were evaluated, as summarized in Table 8. In this study, we evaluated four configuration schemes: single-input NIR, single-input VIS, VIS + NIR, and VIS + NIR + NDWI. This analysis quantitatively assesses the impact of different input configurations on detection performance, as detailed in Table 8. All experiments utilized an early fusion strategy, which integrates multiple features through a unified module. Experimental evidence indicates that incorporating NIR information markedly improves the performance of the VIS-based model, achieving an accuracy of 95.4%, mAP50 of 92.8%, and an F1 score of 91.7%.
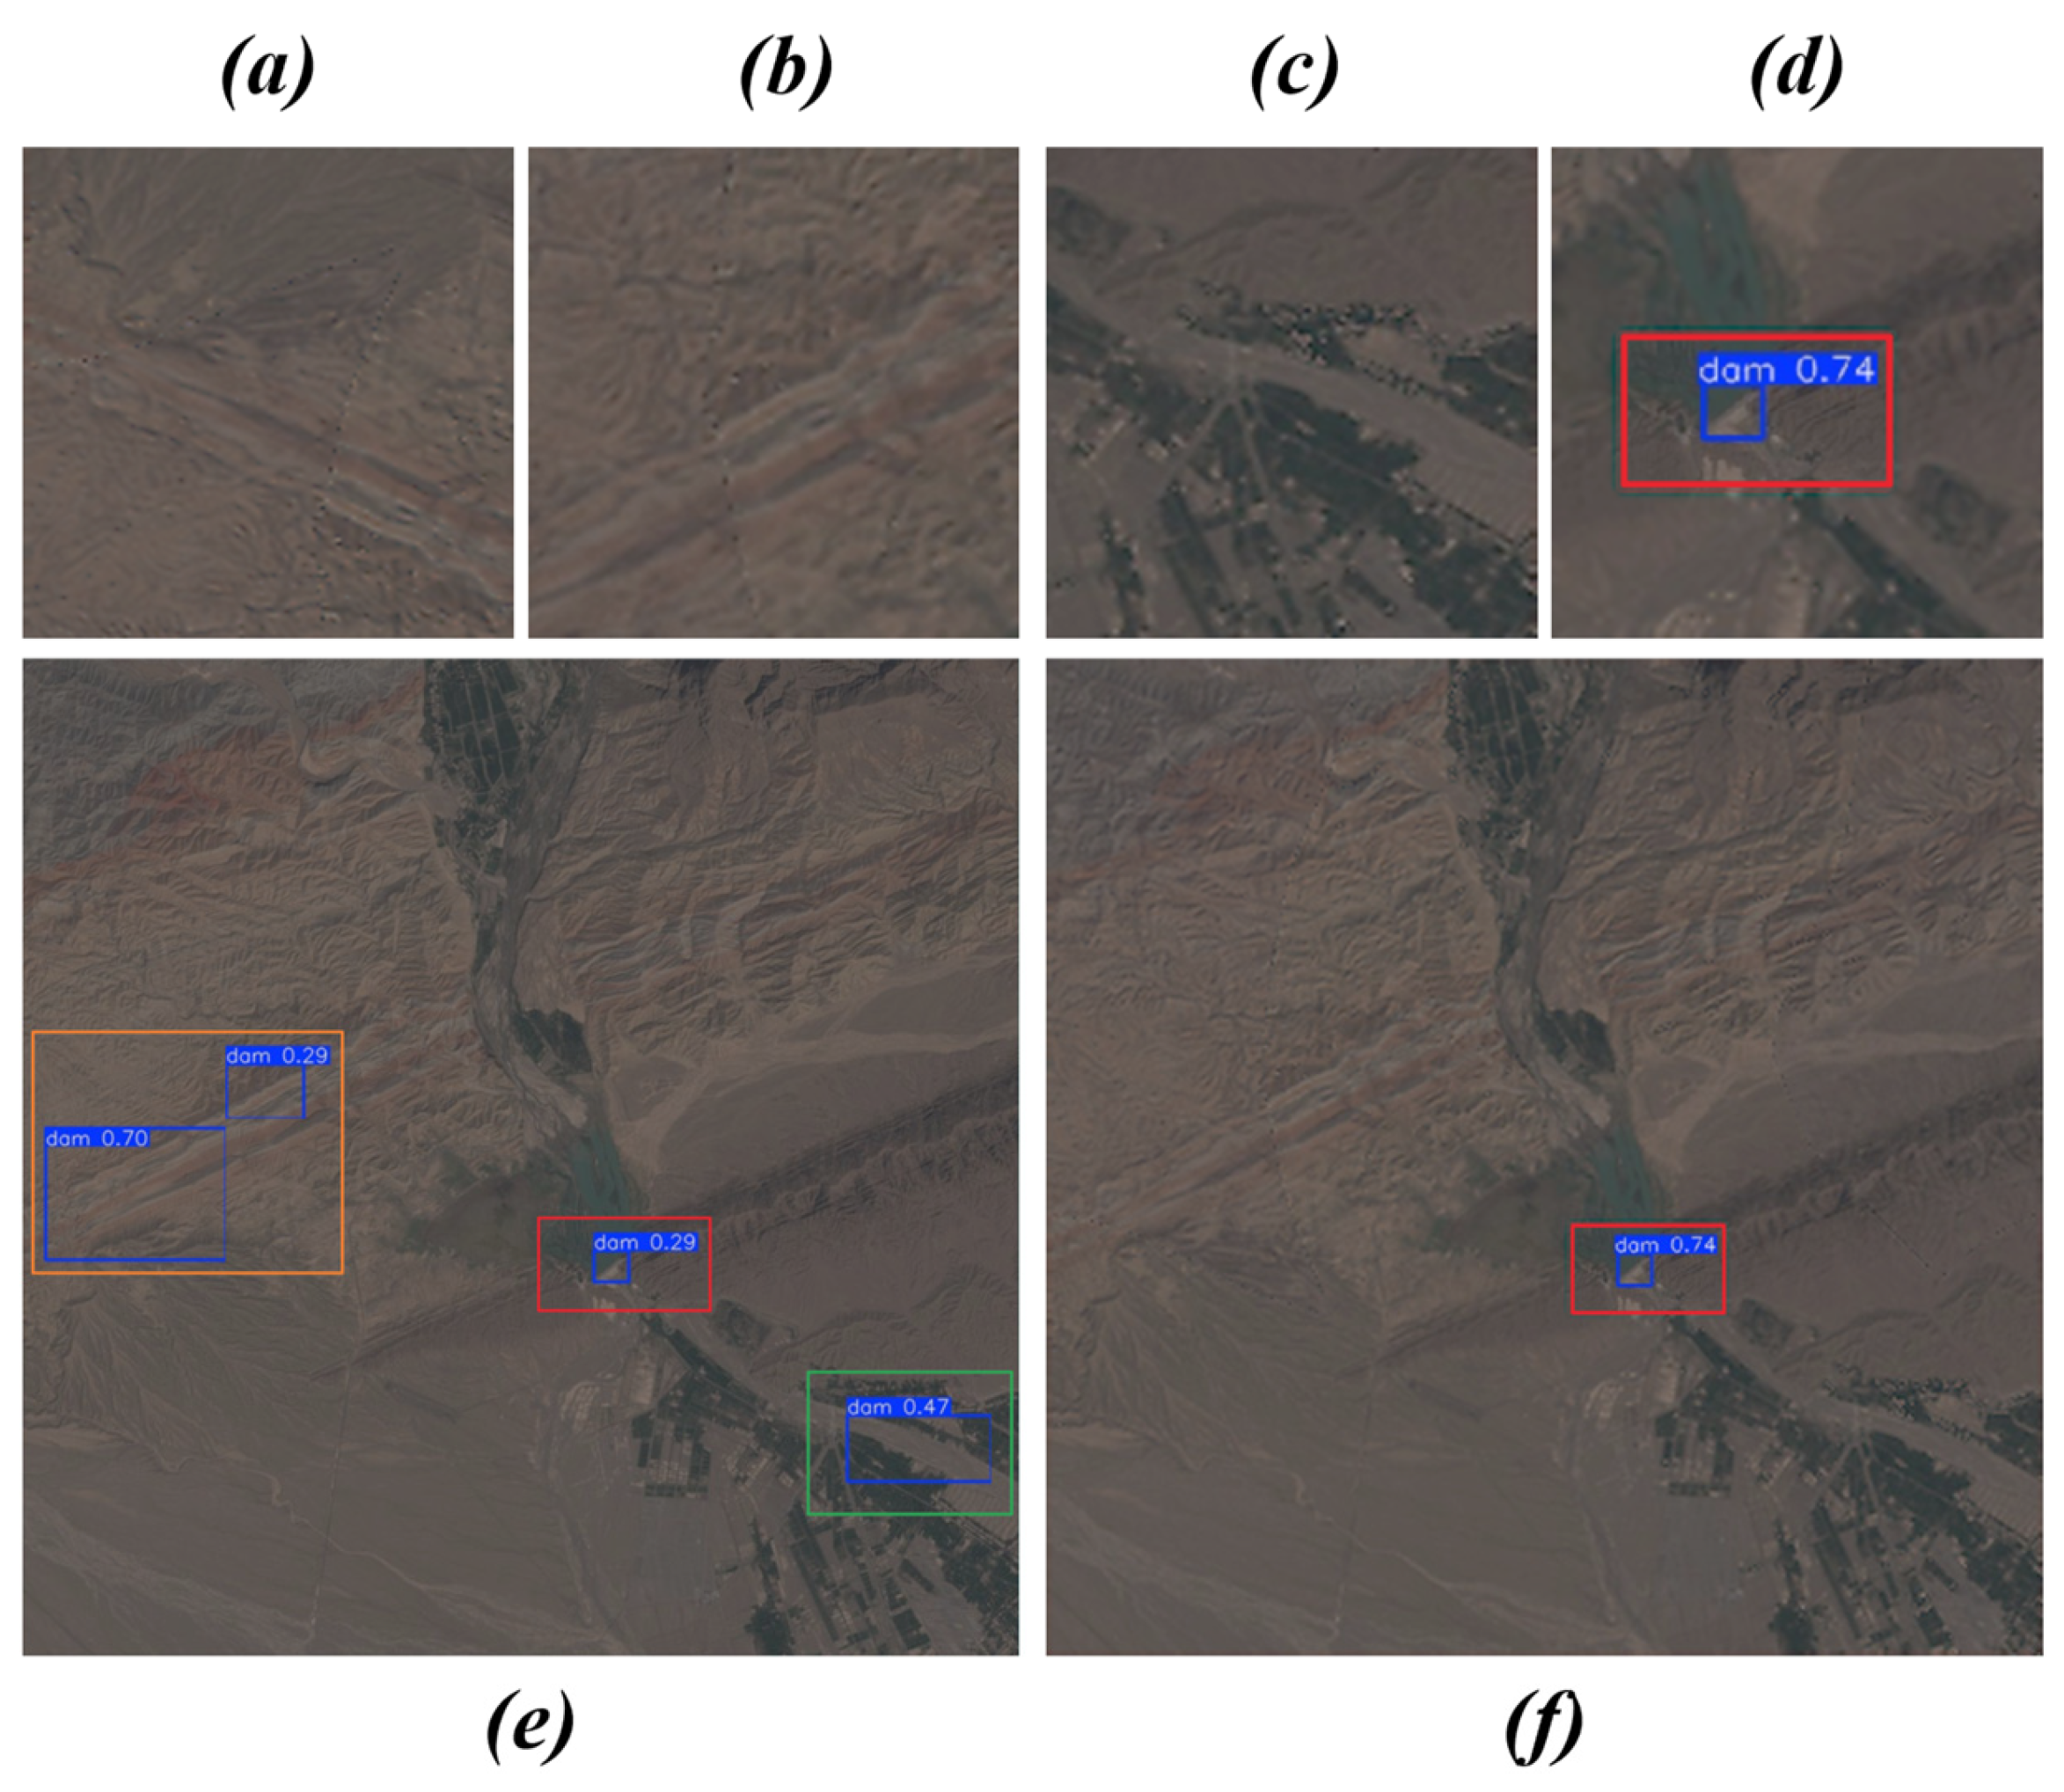
Furthermore, the MCCA strategy delineates optimal detection ranges by considering critical environmental factors. This approach not only enhances the identification of regions of interest but also minimizes background interference, thereby improving both mapping accuracy and computational efficiency. In the remote sensing identification of dams in arid mountainous areas, background noise can easily be confused with dams in visible light images, significantly affecting the accuracy and efficiency of mapping. Consequently, the MCCA strategy introduces conditional limiting factors including elevation, slope, water distribution, and water proportion from the perspective of geographic spatial analysis, effectively reducing false detection rates. Figure 14 illustrates the comparison of recognition results with and without the MCCA strategy. Figure 14e presents the blind detection results, while Figure 14f showcases the detection results under the MCCA strategy. The blue box indicates the model’s detection results, the red box denotes the actual target, and the green and orange boxes represent false detections. The water-related constraints in MCCA strategy (NDWI and water–area proportion) suppress typical false alarms in Figure 14a–c, including non-water background patches that resemble dam signatures while remaining spatially inconsistent with water bodies, as well as narrow linear watercourses or valley features prone to morphological confusion. These constraints jointly suppress background-induced responses and reduce the false alarm rate of the DDE-YOLO model. At the same time, by constraining inference to geographically relevant candidate regions, the MCCA strategy enables the detector to focus more effectively on plausible dam-related structures, thereby helping to alleviate missed detections caused by complex backgrounds and irrelevant interference. Nevertheless, in challenging cases, some targets may still be difficult to identify when water-related cues are weak or structural boundaries are indistinct. Overall, the MCCA strategy improves detection reliability by reducing both false detections and missed detections in large-scale dam mapping.

5.2. Model Efficiency and Stability

Computational efficiency is critical for the large-scale deployment and application of remote sensing detection, where model parameters and complexity serve as key factors in assessing the practicality of automatic recognition algorithms in remote sensing. This consideration pertains to the feasibility, operational costs, and potential for deployment in extensive remote sensing applications. Consequently, the design of the DLOD&MCCA framework prioritized achieving a balance among these aspects, striving to significantly reduce deployment costs while preserving the previously reported accuracy advantages. Table 9 provides a comparison between the DLOD&MCCA and representative state-of-the-art (SOTA) detectors across three dimensions: parameter count, GFLOPs and FPS. The results reveal that FasterRCNN incurs the highest computational burden, with 370.2 GFLOPs and 137.1 million parameters. The RetinaNet and RT-DETR also demonstrate substantial computational demands, requiring 170.1 GFLOPs and 103.4 GFLOPs, respectively. In contrast, the DDE-YOLO necessitates only 22.7 GFLOPs of computation and 10.12 million parameters. When compared to the RT-DETR, the DDE-YOLO achieves a reduction in computation of approximately 78.0% and a decrease in parameter size of about 49.1%. Additionally, relative to the SSD, its computational load is diminished by approximately 63.8%. Although EfficientDet-d0 presents the smallest model size with 3.87 million parameters and 5.3 GFLOPs of computation, its detection accuracy remains significantly inferior to that of the DDE-YOLO model.
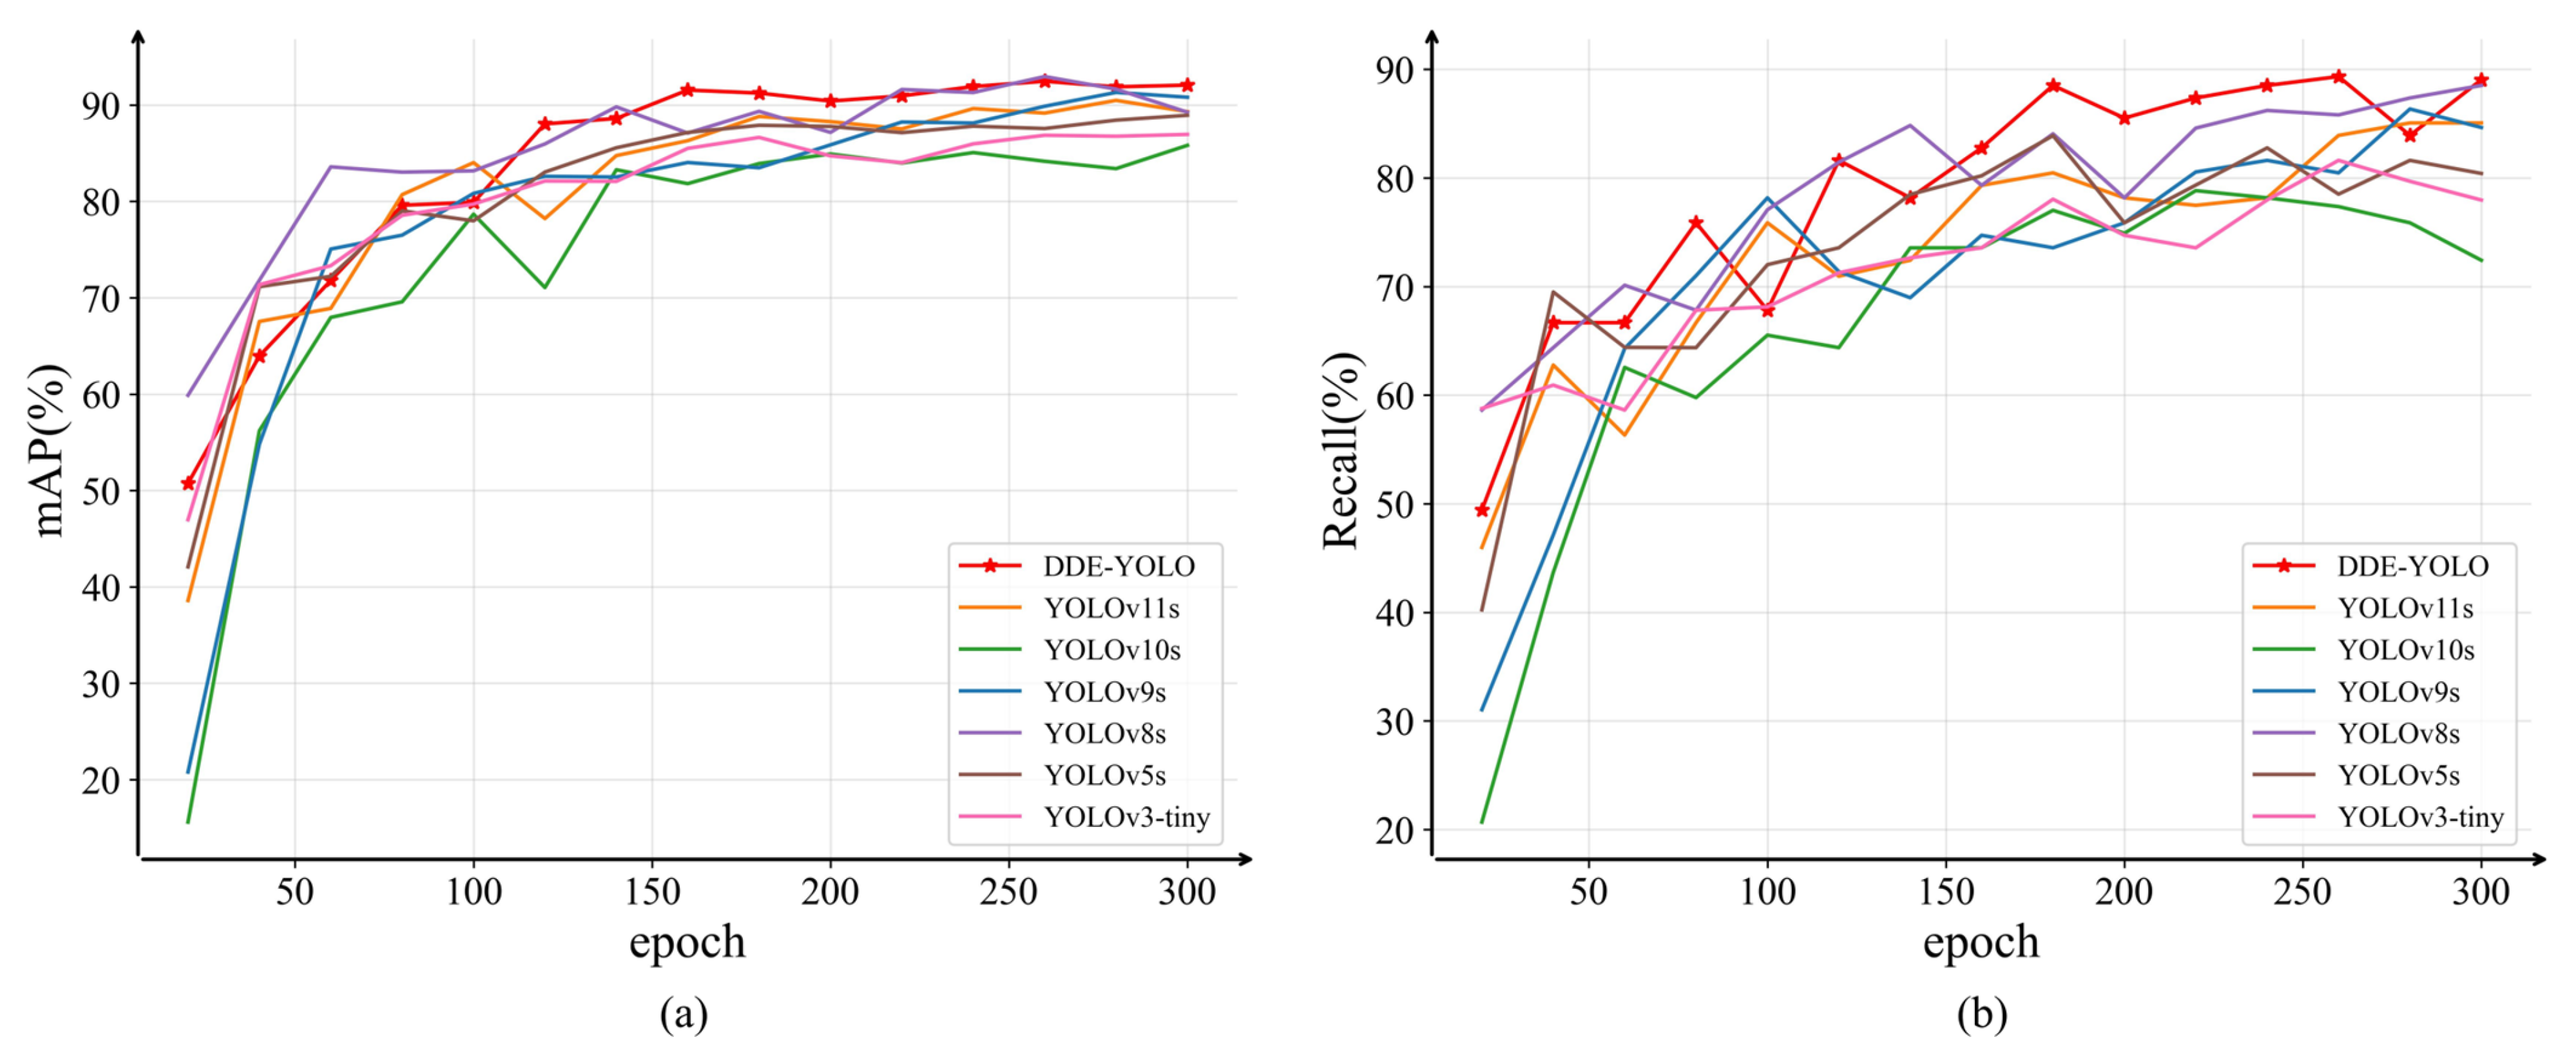
The stability of a model reflects its capability to generalize effectively while maintaining reliable prediction accuracy. Figure 15 illustrates the evolution of recall and mAP during the training process on the S2-Dam dataset. Specifically, Figure 15a presents the mAP curves, whereas Figure 15b depicts the recall curves. The graph indicates that DDE-YOLO reached its peak mAP around the 160th epoch and achieved its highest recall rate around the 180th epoch, maintaining a consistent advantage over other models between the 150th and 200th epochs. In the final training stage, DDE-YOLO exhibits stable convergence, while the competing models demonstrate performance degradation on the test set. These performance characteristics collectively suggest that DDE-YOLO achieves high detection accuracy and robust performance. Additionally, we quantitatively compared and analyzed the performance limits and applicability of DDE-YOLO against multiple YOLO versions (Table 10). Quantitative results demonstrate that DDE-YOLO achieves superior performance compared with existing mainstream YOLO variants. Notably, the mAP50 of YOLOv3-tiny [54] is only 84.0%, while the Precision of YOLOv9s [55] is 87.3%, both indicating limited effectiveness. Although YOLOv5 and YOLOv8 demonstrate competitiveness, they clearly lag behind in terms of accuracy, recall, and F2 score.

5.3. Regional-Scale Mapping Application

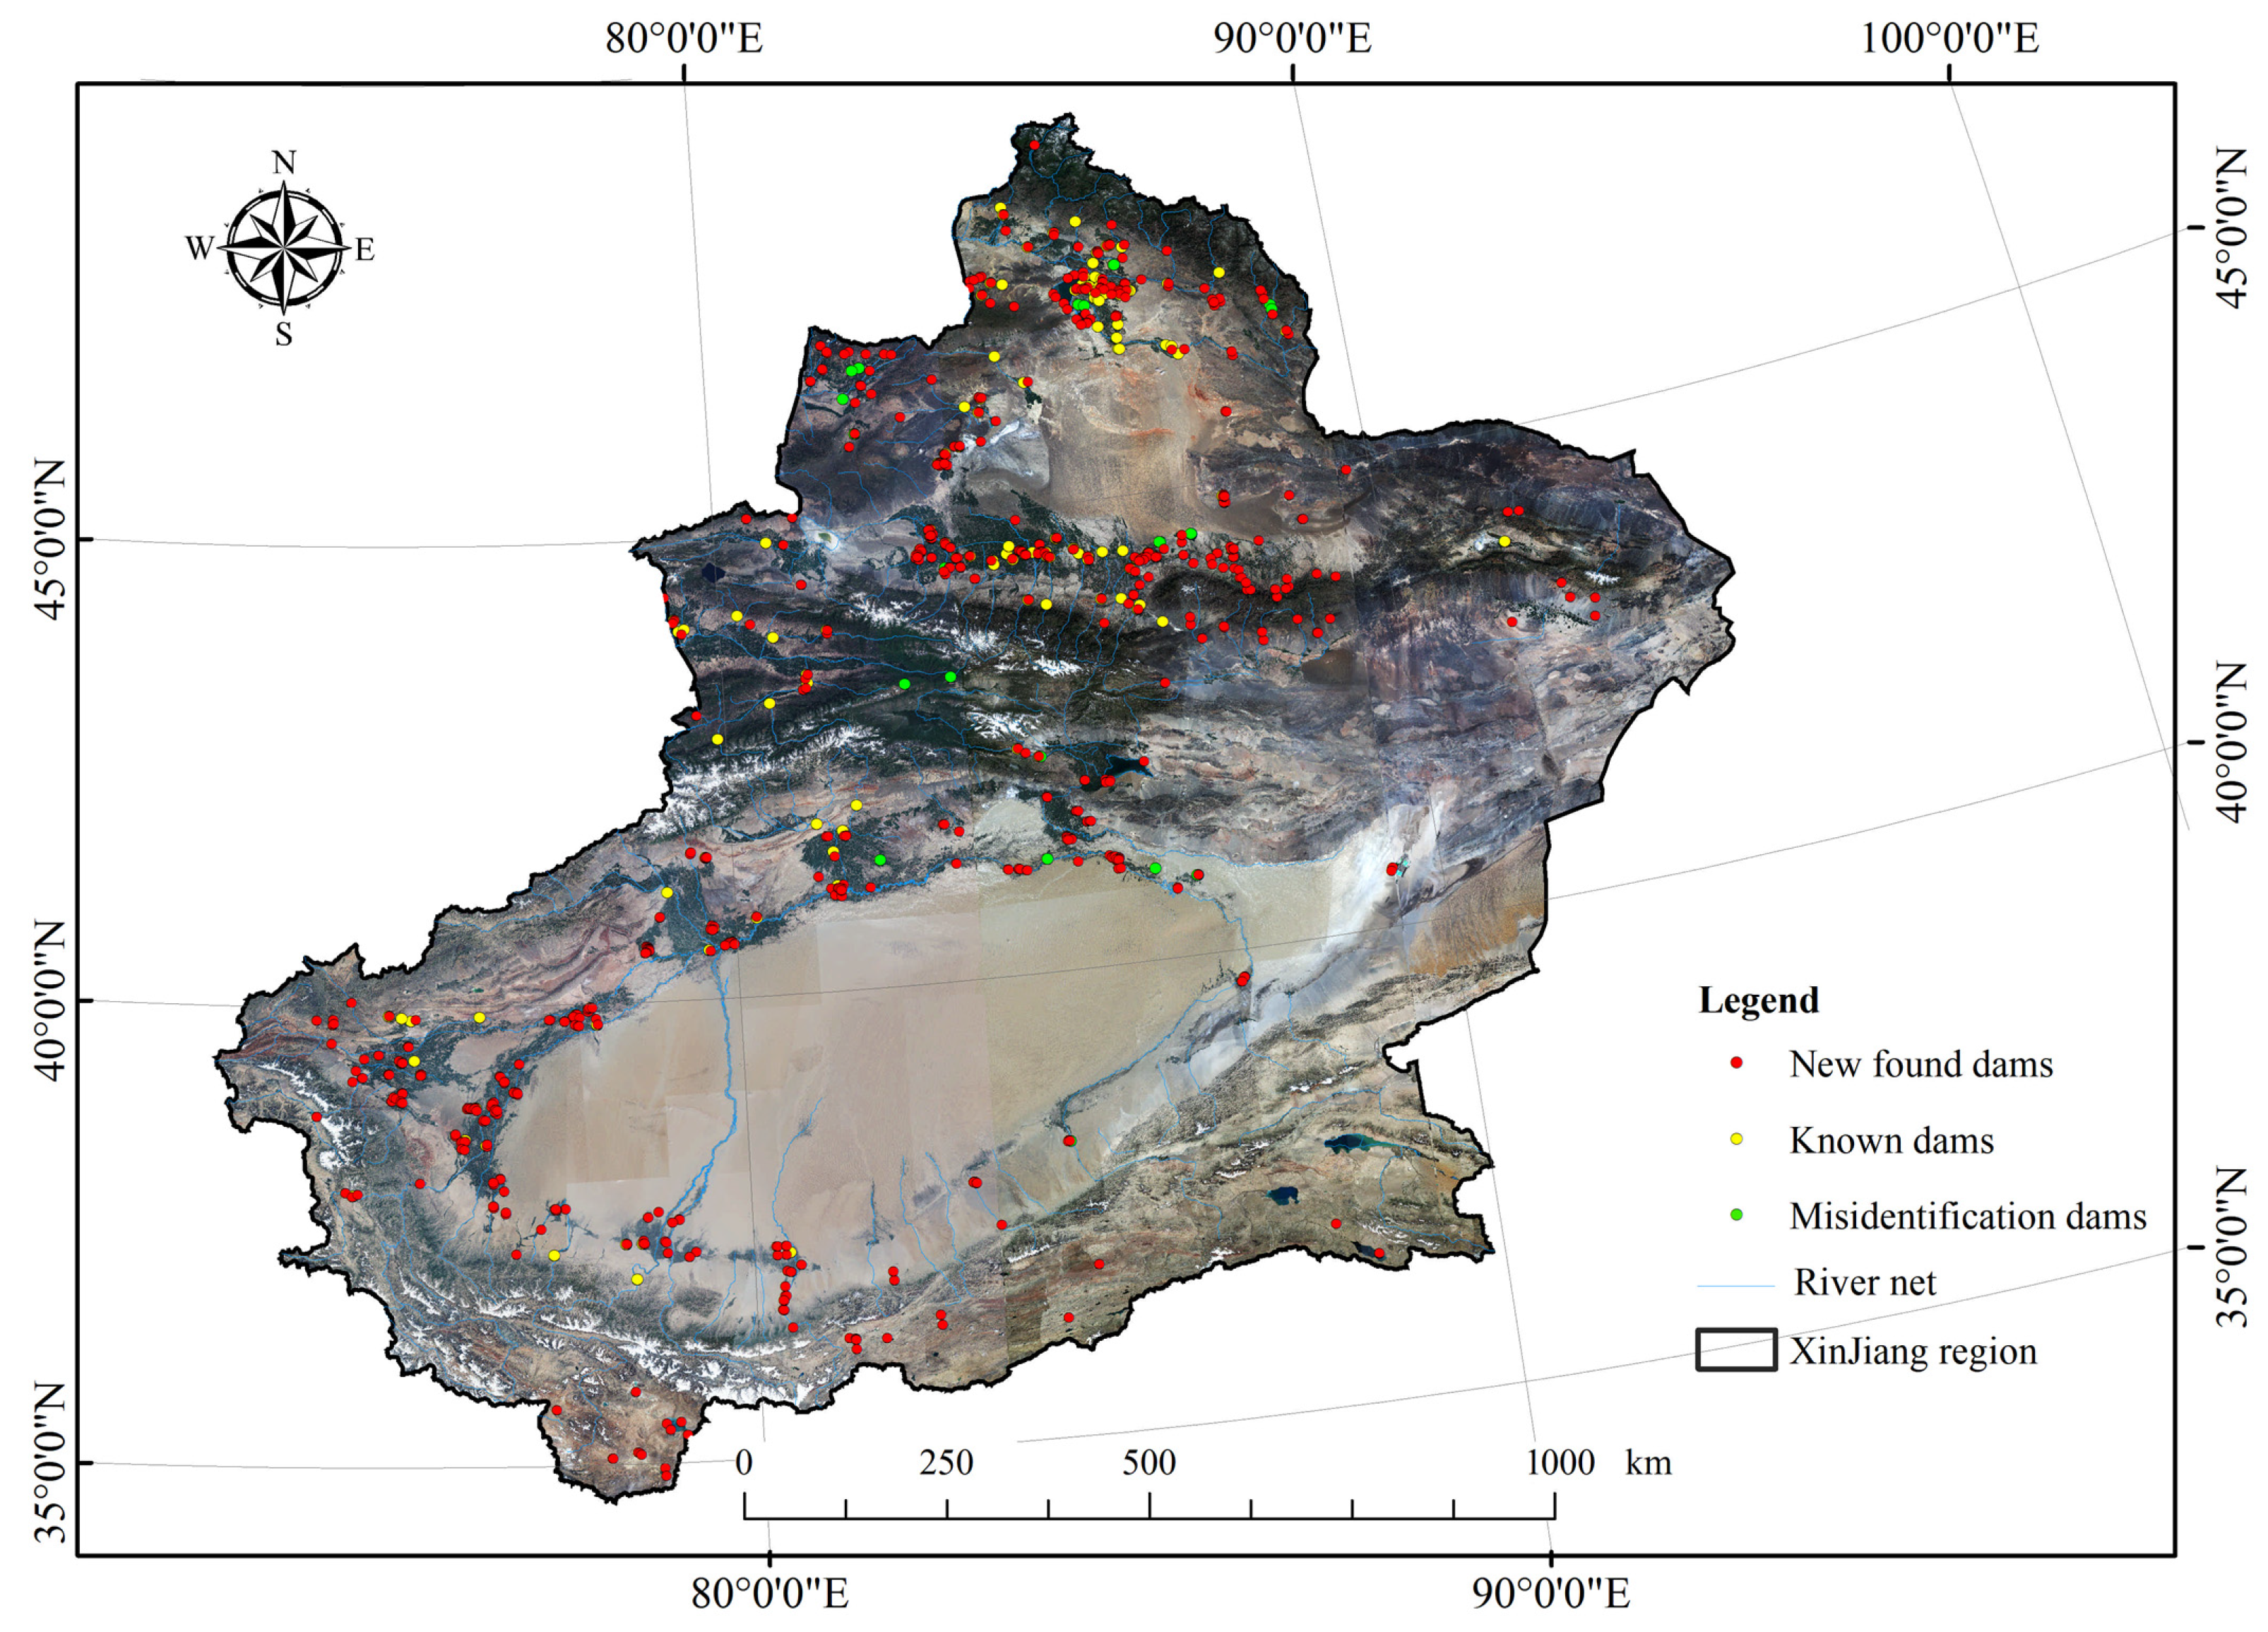
The DLOD&MCCA model was initially employed for the identification and mapping of reservoirs in Xinjiang. We conducted automated detection and mapping throughout Xinjiang utilizing Sentinel-2 imagery acquired in August 2023 (Figure 16). The study area encompasses approximately 1.66 million km2 and includes 187 Sentinel-2 scenes. As illustrated in Figure 16, red points represent detected dam candidates (741), yellow points indicate known dams (141), and green points denote initially misidentified targets (26). To enhance the credibility of the results beyond mere visual interpretation, we performed cross-validation using records from scientific field investigations in Xinjiang and conducted targeted verification with high-resolution imagery available in Google Earth Pro, focusing on river network junctions and dam-like linear structures. Through this verification process, 26 false detections were confirmed and subsequently removed. These false alarms were primarily located along wide, well-structured river roads, where pixel-level confusion resulted in misclassification. Overall, the automated mapping achieved an accuracy of 96.61% with a false alarm rate of 3.39%. This further underscores the generalizability and reliability of the DLOD&MCCA framework for reservoir dam identification in arid regions.

5.4. Analysis of False Detections Under Different Confidence Thresholds

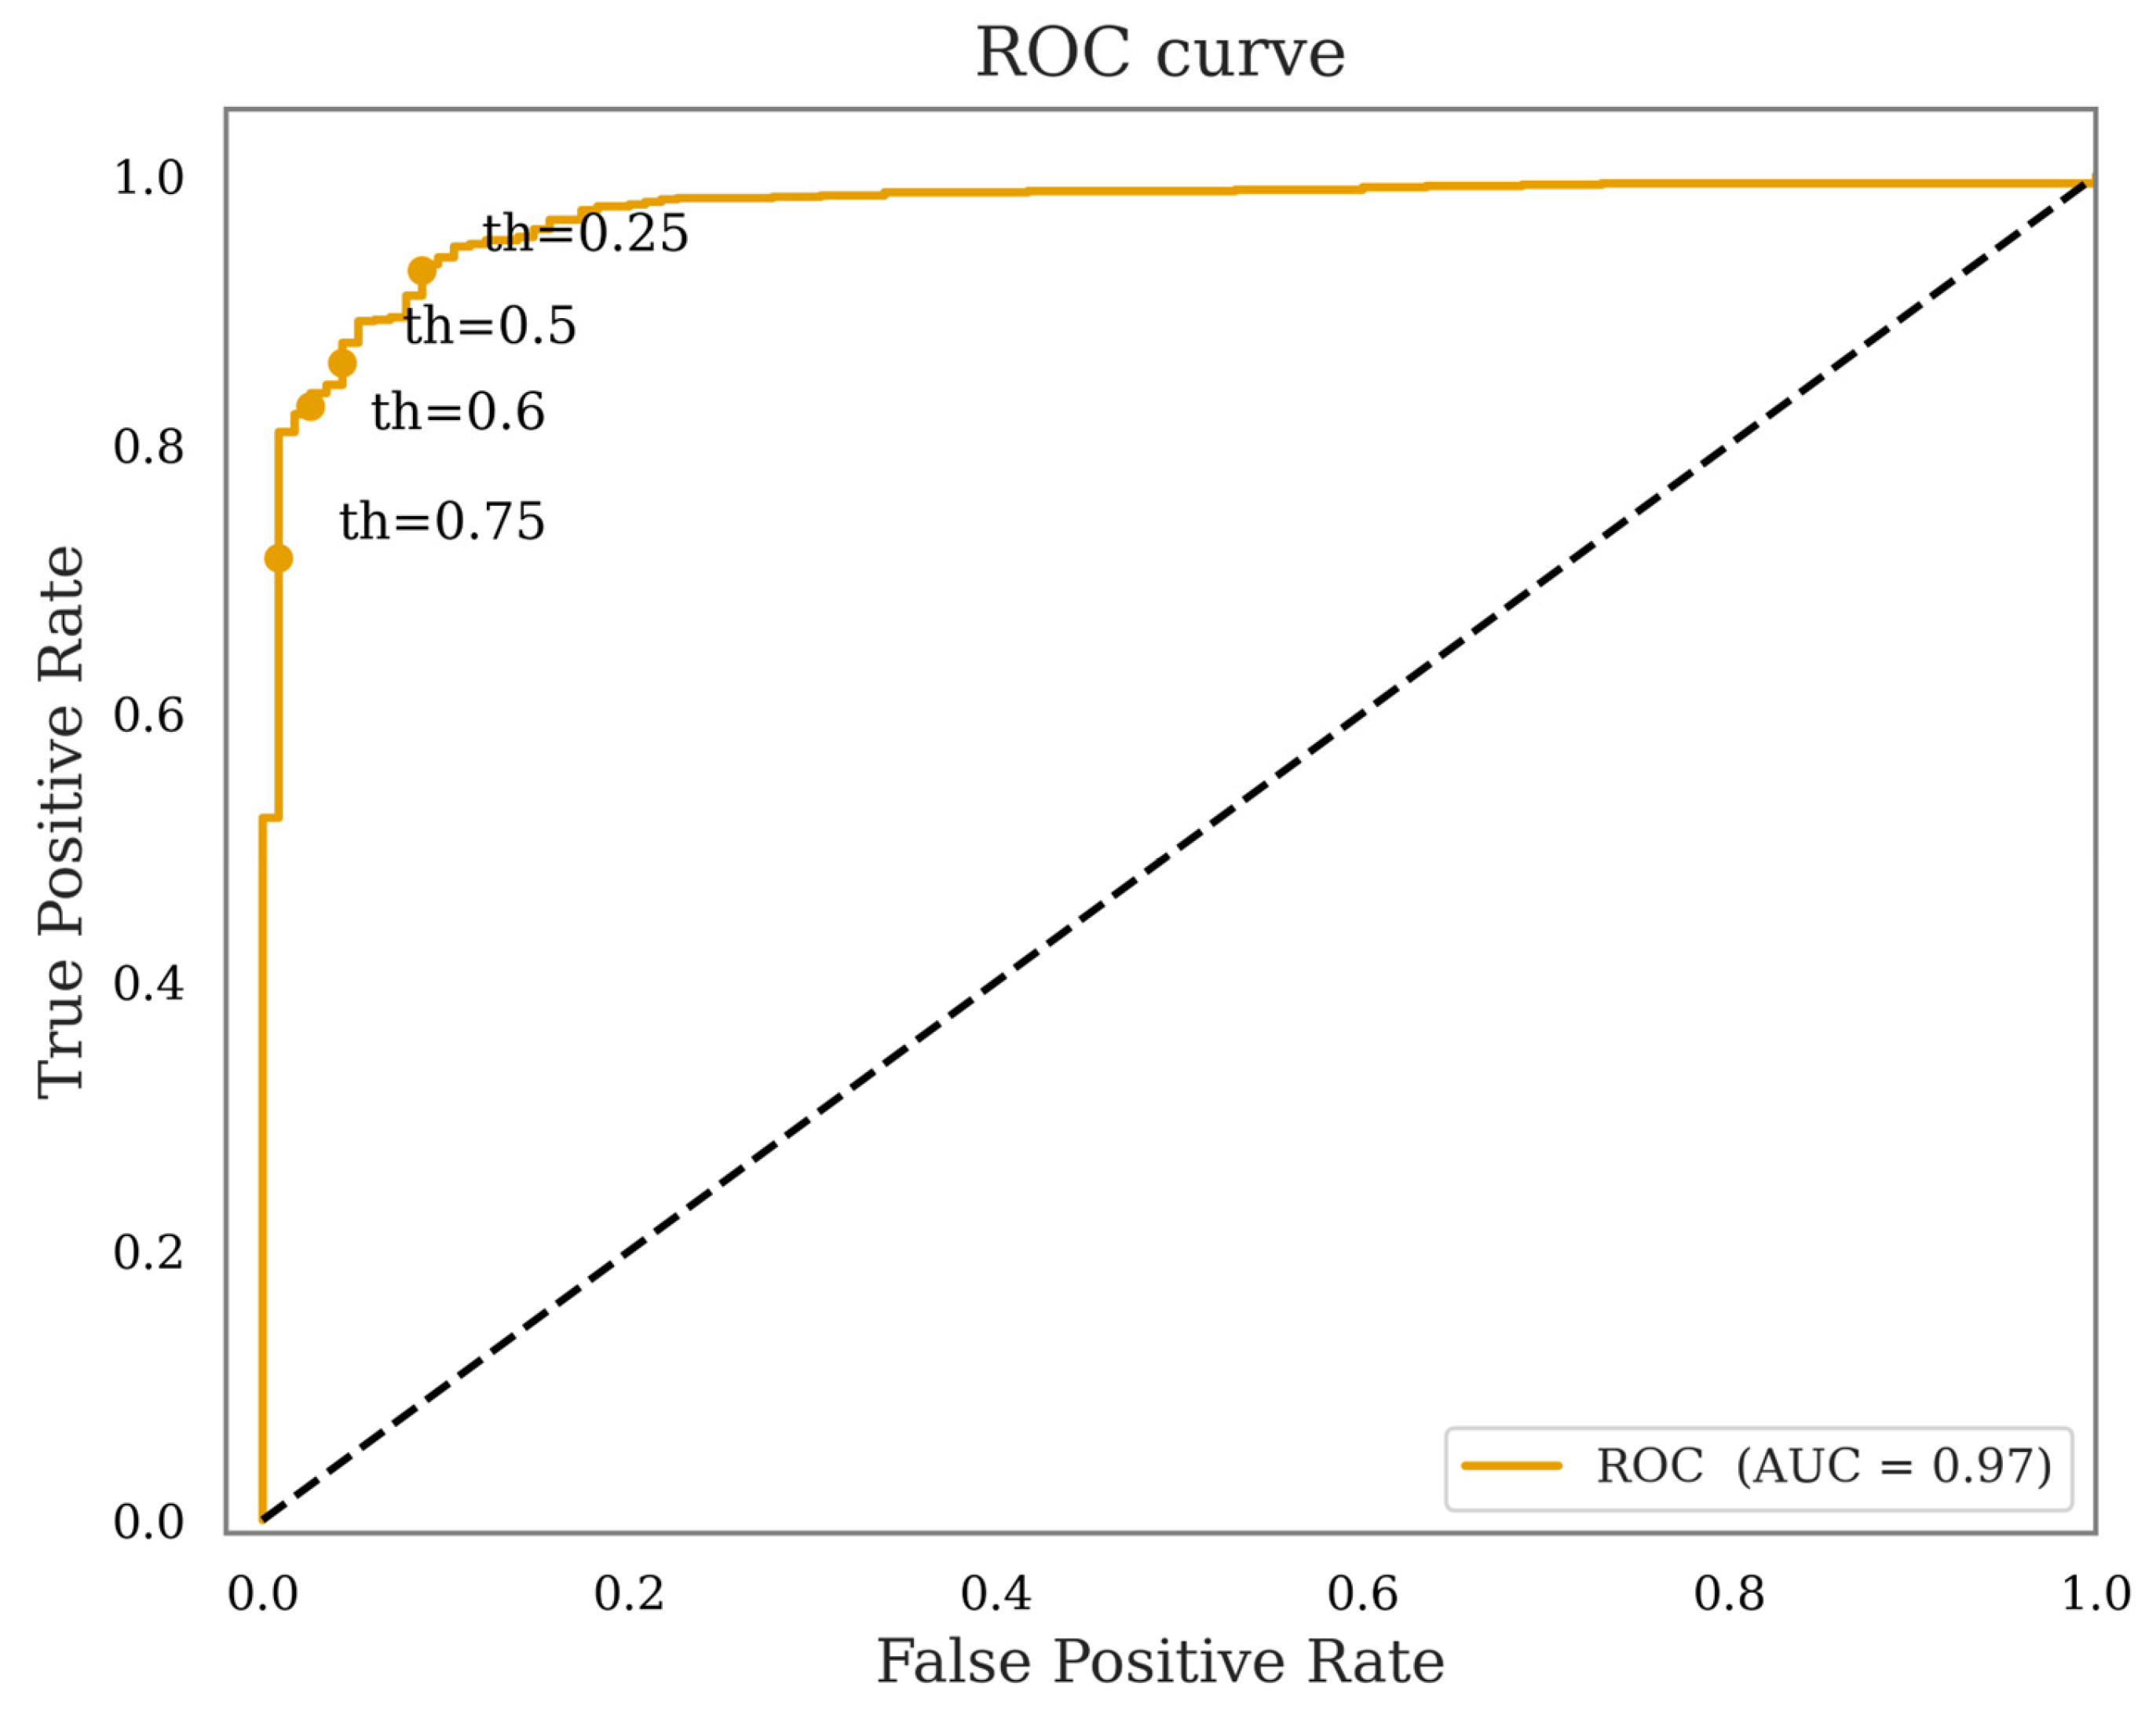
To further characterize the false detection behavior of the proposed framework, a comparative analysis was conducted under four representative confidence thresholds (0.25, 0.50, 0.60, and 0.75), together with ROC evaluation. Figure 17 shows that the proposed model achieves an AUC of 0.97, indicating strong overall discriminative capability across different decision thresholds. Table 11 further shows that, as the confidence threshold increases from 0.25 to 0.75, precision rises from 95.4% to 97.9%, whereas recall decreases from 88.2% to 75.6%; correspondingly, the F1 score declines from 91.7% to 85.3%, and the number of false positives is reduced from 26 to 11. This trend indicates that increasing the confidence threshold can effectively suppress a portion of the road-related false positives.
A closer examination of these false detections indicates that they are predominantly associated with wide, regular anthropogenic linear features located adjacent to water bodies, particularly riverside roads. Such objects are especially susceptible to misclassification because their linear morphology, spatial continuity, and proximity to water closely resemble the structural characteristics of reservoir dams in medium-resolution Sentinel-2 imagery. The threshold-dependent results further indicate that a substantial proportion of these road-related false positives are concentrated among predictions with relatively low confidence and can thus be partially mitigated by increasing the confidence threshold. Nevertheless, the threshold points in Figure 17 suggest that the resulting reduction in false positive rate is accompanied by a decline in true positive rate, indicating that valid dam targets associated with relatively low-confidence predictions may be suppressed simultaneously.
Therefore, the remaining uncertainty in this study is mainly attributable to the visual and geometric similarity between reservoir dams and riverside anthropogenic roads in complex arid region scenes. Considering that large-area dam mapping in this study prioritizes recall and F2 to minimize missed detections, the confidence threshold of 0.25 adopted in the main experiments provides a more appropriate balance between suppressing road-related false alarms and preserving true dam targets.

5.5. Uncertainty and Prospects

While acknowledging inherent uncertainties in the DLOD&MCCA framework, these do not compromise our main findings. The framework meets accuracy requirements for automatic remote sensing mapping of reservoir dams in arid regions. However, certain regular riverside roads may still be misidentified as dams. Incorporating typical false positives as background samples alleviated this issue, although it did not fully resolve it. A further limitation is that, although the threshold parameters in the MCCA strategy were determined by combining geographical prior knowledge, regional geomorphological characteristics, relevant literature, and repeated pilot experiments, a systematic sensitivity analysis of these parameters was not conducted in the present study. This issue will be further investigated in future work to improve the interpretability and transferability of the MCCA strategy. Future work will focus on more robust discrimination mechanisms and advanced multimodal fusion, including synthetic aperture radar integration, to enhance feature extraction and achieve higher precision detection in complex terrains.
Overall, this study presents a novel technical pathway and research direction for high-precision target recognition in remote sensing scenarios. It demonstrates strong generalization ability and has successfully facilitated the automatic identification and mapping of reservoirs in the arid regions of Xinjiang. The findings have significant practical value and can provide essential technical support for the automatic detection of reservoir dams in these arid areas. This will assist in intelligent detection, comprehensive management, and collaborative scheduling of reservoirs.

6. Conclusions

This paper proposes a DLOD&MCCA framework specifically designed for dam detection in complex arid regions. This framework integrates deep learning object detection techniques with multiple conditional constraint strategies, effectively addressing the issues of target–background confusion in intricate scenes and overcoming the challenges posed by significant similarity in target spatial morphology. Consequently, the accuracy of remote sensing automatic identification of dams in arid areas has been markedly improved. The main conclusions of this study are as follows:
(1)
The DLOD&MCCA framework harnesses the strengths of VIS-NIR dual-mode data input through an early fusion strategy, effectively addressing the spectral homogeneity in VIS imagery and the low visual discrimination of target information.
(2)
The DDE-YOLO network integrates the MSC3k and TCUB modules together with the CAA attention mechanism, thereby enhancing detection accuracy and improving generalization capability for reservoir dams.
(3)
The MCCA strategy effectively mitigates the issue of misidentification related to snow-capped mountains and ridge lines, reduces false alarm rates, and substantially enhances the practical efficiency of mapping reservoirs and dams in arid regions.

Author Contributions

Conceptualization, C.Z.; supervision, C.Z.; methodology, M.G.; data collection, S.Q.; formal analysis, S.Q. and J.L.; data preprocessing, Q.S. and B.C.; visualization, Q.S. and B.C.; writing—original draft preparation, S.Q.; writing—review and editing, C.Z. and Y.S.; result interpretation, M.G.; project administration, C.Z. All authors have read and agreed to the published version of the manuscript.

Funding

This study was supported in part by the National Key Research and Development Program of China under Grant [No. 2023YFE0103800], in part by the National Natural Science Foundation of China under Grant [No. 42571346, 42374020], in part by the Jiangsu Qinglan Project, and in part by the Research and Practice Innovation Plan for Postgraduates of Jiangsu Normal University under Grant [No. 2025XKT1060].

Data Availability Statement

The S2-Dam dataset used in this study is freely accessible at https://doi.org/10.57760/sciencedb.32154, accessed on 18 April 2026.

Conflicts of Interest

The authors declare no conflicts of interest.

References

  1. Dai, F.C.; Lee, C.F.; Deng, J.H.; Tham, L.G. The 1786 earthquake-triggered landslide dam and subsequent dam-break flood on the Dadu River, southwestern China. Geomorphology 2005, 65, 205–221. [Google Scholar] [CrossRef]
  2. Zhao, Y.; Liu, S.; Shi, H. Impacts of dams and reservoirs on local climate change: A global perspective. Environ. Res. Lett. 2021, 16, 104043. [Google Scholar] [CrossRef]
  3. Mantel, S.K.; Rivers-Moore, N.; Ramulifho, P. Small dams need consideration in riverscape conservation assessments. Aquat. Conserv. Mar. Freshw. Ecosyst. 2017, 27, 748–754. [Google Scholar] [CrossRef]
  4. Elgendy, M.; Hassini, S.; Coulibaly, P. Review of climate change adaptation strategies in water management. J. Hydrol. Eng. 2024, 29, 03123001. [Google Scholar] [CrossRef]
  5. Anderson, E.P.; Jenkins, C.N.; Heilpern, S.; Maldonado-Ocampo, J.A.; Carvajal-Vallejos, F.M.; Encalada, A.C.; Rivadeneira, J.F.; Hidalgo, M.; Cañas, C.M.; Ortega, H.; et al. Fragmentation of Andes-to-Amazon connectivity by hydropower dams. Sci. Adv. 2018, 4, eaao1642. [Google Scholar] [CrossRef] [PubMed]
  6. Al-Afeshat, A.; Zoubi, M.M.; Abu Afifeh, Q.Y.; Al-Jawaldeh, H.; Qutishat, T.A.; Masoud, A.M.N.; Rahbeh, M. Interrelation of dams sustainability with the local communities and water quality. Glob. J. Environ. Sci. Manag. 2025, 11, 1–20. [Google Scholar]
  7. Lehner, B.; Beames, P.; Mulligan, M.; Zarfl, C.; De Felice, L.; Van Soesbergen, A.; Thieme, M.; Garcia De Leaniz, C.; Anand, M.; Belletti, B.; et al. The Global Dam Watch database of river barrier and reservoir information for large-scale applications. Sci. Data 2024, 11, 1069. [Google Scholar] [CrossRef]
  8. Belletti, B.; Garcia De Leaniz, C.; Jones, J.; Bizzi, S.; Börger, L.; Segura, G.; Castelletti, A.; Van De Bund, W.; Aarestrup, K.; Barry, J.; et al. More than one million barriers fragment Europe’s rivers. Nature 2020, 588, 436–441. [Google Scholar] [CrossRef]
  9. Grill, G.; Lehner, B.; Thieme, M.; Geenen, B.; Tickner, D.; Antonelli, F.; Babu, S.; Borrelli, P.; Cheng, L.; Crochetiere, H.; et al. Mapping the world’s free-flowing rivers. Nature 2019, 569, 215–221. [Google Scholar] [CrossRef]
  10. Wang, Y.; Tian, Y.; Cao, Y. Dam siting: A review. Water 2021, 13, 2080. [Google Scholar] [CrossRef]
  11. Adamo, N.; Al-Ansari, N.; Hussain Ali, S.; Laue, J.; Knutsson, S. Dam safety: Review of satellite remote sensing applications to dams and reservoirs. J. Earth Sci. Geotech. Eng. 2020, 10, 347–438. [Google Scholar] [CrossRef]
  12. Forzieri, G.; Gardenti, M.; Caparrini, F.; Castelli, F. A methodology for the pre-selection of suitable sites for surface and underground small dams in arid areas: A case study in the region of Kidal, Mali. Phys. Chem. Earth 2008, 33, 74–85. [Google Scholar] [CrossRef]
  13. Nooka Ratnam, K.; Srivastava, Y.K.; Venkateswara Rao, V.; Amminedu, E.; Murthy, K.S.R. Check dam positioning by prioritization of micro-watersheds using SYI model and morphometric analysis—Remote sensing and GIS perspective. J. Indian Soc. Remote Sens. 2005, 33, 25–38. [Google Scholar] [CrossRef]
  14. Al-Ruzouq, R.; Shanableh, A.; Yilmaz, A.G.; Idris, A.; Mukherjee, S.; Khalil, M.A.; Gibril, M.B.A. Dam site suitability mapping and analysis using an integrated GIS and machine learning approach. Water 2019, 11, 1880. [Google Scholar] [CrossRef]
  15. Jing, M.; Cheng, L.; Ji, C.; Mao, J.; Li, N.; Duan, Z.; Li, Z.; Li, M. Detecting unknown dams from high-resolution remote sensing images: A deep learning and spatial analysis approach. Int. J. Appl. Earth Obs. Geoinf. 2021, 104, 102576. [Google Scholar] [CrossRef]
  16. Yang, Y.; Liu, Y.; Zhou, M.; Zhang, S.; Zhan, W.; Sun, C.; Duan, Y. Landsat 8 OLI image based terrestrial water extraction from heterogeneous backgrounds using a reflectance homogenization approach. Remote Sens. Environ. 2015, 171, 14–32. [Google Scholar] [CrossRef]
  17. Yan, D.; Huang, C.; Ma, N.; Zhang, Y. Improved Landsat-based water and snow indices for extracting lake and snow cover/glacier in the Tibetan Plateau. Water 2020, 12, 1339. [Google Scholar] [CrossRef]
  18. Lajoie, F.; Assani, A.A.; Roy, A.G.; Mesfioui, M. Impacts of dams on monthly flow characteristics: The influence of watershed size and seasons. J. Hydrol. 2007, 334, 423–439. [Google Scholar] [CrossRef]
  19. Salazar, F.; Morán, R.; Toledo, M.Á.; Oñate, E. Data-based models for the prediction of dam behaviour: A review and some methodological considerations. Arch. Comput. Methods Eng. 2017, 24, 1–21. [Google Scholar] [CrossRef]
  20. Pagire, V.; Chavali, M.; Kale, A. A comprehensive review of object detection with traditional and deep learning methods. Signal Process. 2025, 237, 110075. [Google Scholar] [CrossRef]
  21. Li, Z.; Dong, Y.; Shen, L.; Liu, Y.; Pei, Y.; Yang, H.; Zheng, L.; Ma, J. Development and Challenges of Object Detection: A Survey. Neurocomputing 2024, 598, 128102. [Google Scholar] [CrossRef]
  22. Li, Y.; Miao, N.; Ma, L.; Shuang, F.; Huang, X. Transformer for Object Detection: Review and Benchmark. Eng. Appl. Artif. Intell. 2023, 126, 107021. [Google Scholar] [CrossRef]
  23. Chan, S.; Zhou, W.; Lei, Y.; Li, C.; Hu, J.; Hong, F. Sparse point annotations for remote sensing image segmentation. Sci. Rep. 2025, 15, 27347. [Google Scholar] [CrossRef] [PubMed]
  24. Zhang, X.; Liu, Q.; Gui, D.; Zhao, J.; Chen, Y.; Liu, Y.; Martínez-Valderrama, J. Enhanced river connectivity assessment across larger areas through deep learning with dam detection. Hydrol. Process. 2025, 39, e70063. [Google Scholar] [CrossRef]
  25. Kieu, N.; Nguyen, K.; Nazib, A.; Fernando, T.; Fookes, C.; Sridharan, S. Multimodal colearning meets remote sensing: Taxonomy, state of the art, and future works. IEEE J. Sel. Top. Appl. Earth Obs. Remote Sens. 2024, 17, 7386–7409. [Google Scholar] [CrossRef]
  26. McFeeters, S.K. The use of the normalized difference water index (NDWI) in the delineation of open water features. Int. J. Remote Sens. 1996, 17, 1425–1432. [Google Scholar] [CrossRef]
  27. Atrey, P.K.; Hossain, M.A.; El Saddik, A.; Kankanhalli, M.S. Multimodal fusion for multimedia analysis: A survey. Multimed. Syst. 2010, 16, 345–379. [Google Scholar] [CrossRef]
  28. Liu, Y.; Chen, X.; Wang, Z.; Wang, Z.J.; Ward, R.K.; Wang, X. Deep learning for pixel-level image fusion: Recent advances and future prospects. Inf. Fusion 2018, 42, 158–173. [Google Scholar] [CrossRef]
  29. Li, J.; Zhang, J.; Yang, C.; Liu, H.; Zhao, Y.; Ye, Y. Comparative analysis of pixel-level fusion algorithms and a new high-resolution dataset for SAR and optical image fusion. Remote Sens. 2023, 15, 5514. [Google Scholar] [CrossRef]
  30. Song, Q.; Mo, F.; Ding, K.; Xiao, L.; Dian, R.; Kang, X.; Li, S. MCFNet: Multiscale cross-domain fusion network for HSI and LiDAR data joint classification. IEEE Trans. Geosci. Remote Sens. 2025, 63, 4703912. [Google Scholar] [CrossRef]
  31. Chen, B.; Pan, Z.; Yang, J.; Long, H. ACMFNet: Attention-based cross-modal fusion network for building extraction of remote sensing images. IEEE Trans. Geosci. Remote Sens. 2024, 62, 5405614. [Google Scholar] [CrossRef]
  32. Zhang, S.; Meng, X.; Liu, Q.; Yang, G.; Sun, W. Feature-decision level collaborative fusion network for hyperspectral and LiDAR classification. Remote Sens. 2023, 15, 4148. [Google Scholar] [CrossRef]
  33. Zhang, X.; Zhang, T.; Wang, G.; Zhu, P.; Tang, X.; Jia, X.; Jiao, L. Remote sensing object detection meets deep learning: A metareview of challenges and advances. IEEE Geosci. Remote Sens. Mag. 2023, 11, 8–44. [Google Scholar] [CrossRef]
  34. Balaniuk, R.; Isupova, O.; Reece, S. Mining and tailings dam detection in satellite imagery using deep learning. Sensors 2020, 20, 6936. [Google Scholar] [CrossRef] [PubMed]
  35. Fang, W.; Sun, Y.; Ji, R.; Wan, W.; Ma, L. Recognizing global dams from high-resolution remotely sensed images using convolutional neural networks. IEEE J. Sel. Top. Appl. Earth Obs. Remote Sens. 2021, 14, 6363–6371. [Google Scholar] [CrossRef]
  36. Jing, Y.; Ren, Y.; Liu, Y.; Wang, D.; Yu, L. Dam extraction from high-resolution satellite images combined with location based on deep transfer learning and post-segmentation with an improved MBI. Remote Sens. 2022, 14, 4049. [Google Scholar] [CrossRef]
  37. Wang, L.; Xu, Y.; Chen, Q.; Wu, J.; Luo, J.; Li, X.; Peng, R.; Li, J. Research on remote-sensing identification method of typical disaster-bearing body based on deep learning and spatial constraint strategy. Remote Sens. 2024, 16, 1161. [Google Scholar] [CrossRef]
  38. Gu, H.; Gao, Y.; Fei, Y.; Sun, Y.; Tian, Y. Deep learning and hydrological feature constraint strategies for dam detection: Global application to Sentinel-2 remote sensing imagery. Remote Sens. 2025, 17, 1194. [Google Scholar] [CrossRef]
  39. Li, K.; Wan, G.; Cheng, G.; Meng, L.; Han, J. Object detection in optical remote sensing images: A survey and a new benchmark. ISPRS J. Photogramm. Remote Sens. 2020, 159, 296–307. [Google Scholar] [CrossRef]
  40. Wang, X.; Xiao, X.; Qin, Y.; Dong, J.; Wu, J.; Li, B. Improved maps of surface water bodies, large dams, reservoirs, and lakes in China. Earth Syst. Sci. Data 2022, 14, 3757–3771. [Google Scholar] [CrossRef]
  41. Lehner, B.; Liermann, C.R.; Revenga, C.; Vörösmarty, C.; Fekete, B.; Crouzet, P.; Döll, P.; Endejan, M.; Frenken, K.; Magome, J.; et al. High-resolution mapping of the world’s reservoirs and dams for sustainable river-flow management. Front. Ecol. Environ. 2011, 9, 494–502. [Google Scholar] [CrossRef]
  42. Zhang, J.; Lei, J.; Xie, W.; Fang, Z.; Li, Y.; Du, Q. SuperYOLO: Super resolution assisted object detection in multimodal remote sensing imagery. IEEE Trans. Geosci. Remote Sens. 2023, 61, 5605415. [Google Scholar] [CrossRef]
  43. Cai, X.; Lai, Q.; Wang, Y.; Wang, W.; Sun, Z.; Yao, Y. Poly kernel inception network for remote sensing detection. In Proceedings of the IEEE/CVF Conference on Computer Vision and Pattern Recognition (CVPR), Seattle, WA, USA, 17–21 June 2024. [Google Scholar]
  44. Rahman, M.M.; Munir, M.; Marculescu, R. EMCAD: Efficient multi-scale convolutional attention decoding for medical image segmentation. In Proceedings of the IEEE/CVF Conference on Computer Vision and Pattern Recognition (CVPR), Seattle, WA, USA, 17–21 June 2024. [Google Scholar]
  45. Zhang, X.; Zhou, X.; Lin, M.; Sun, J. ShuffleNet: An extremely efficient convolutional neural network for mobile devices. In Proceedings of the IEEE/CVF Conference on Computer Vision and Pattern Recognition (CVPR), Salt Lake City, UT, USA, 18–22 June 2018. [Google Scholar]
  46. Liu, W.; Anguelov, D.; Erhan, D.; Szegedy, C.; Reed, S.; Fu, C.-Y.; Berg, A.C. SSD: Single shot multibox detector. In Proceedings of the European Conference on Computer Vision (ECCV), Amsterdam, The Netherlands, 11–14 October 2016. [Google Scholar]
  47. Ren, S.; He, K.; Girshick, R.; Sun, J. Faster R-CNN: Towards real-time object detection with region proposal networks. arXiv 2015, arXiv:1506.01497. [Google Scholar] [CrossRef]
  48. Lin, T.-Y.; Goyal, P.; Girshick, R.; He, K.; Dollar, P. Focal loss for dense object detection. In Proceedings of the IEEE Conference on Computer Vision and Pattern Recognition (CVPR), Honolulu, HI, USA, 21–26 July 2017. [Google Scholar]
  49. Tan, M.; Le, Q.V. EfficientNet: Rethinking model scaling for convolutional neural networks. In Proceedings of the International Conference on Machine Learning (ICML), Long Beach, CA, USA, 9–15 June 2019. [Google Scholar]
  50. Zhao, Y.; Lv, W.; Xu, S.; Wei, J.; Wang, G.; Dang, Q.; Liu, Y.; Chen, J. DETRs beat YOLOs on real-time object detection. In Proceedings of the IEEE/CVF Conference on Computer Vision and Pattern Recognition (CVPR), Seattle, WA, USA, 17–21 June 2024. [Google Scholar]
  51. Wang, A.; Chen, H.; Liu, L.; Chen, K.; Lin, Z.; Han, J.; Ding, G. YOLOv10: Real-time end-to-end object detection. In Proceedings of the Advances in Neural Information Processing Systems (NeurIPS), Vancouver, BC, Canada, 10–15 December 2024. [Google Scholar]
  52. Tian, Y.; Ye, Q.; Doermann, D. YOLOv12: Attention-centric real-time object detectors. arXiv 2025, arXiv:2502.12524. [Google Scholar]
  53. Chen, Y.; Wang, B.; Guo, X.; Zhu, W.; He, J.; Liu, X.; Yuan, J. DEYOLO: Dual-feature-enhancement YOLO for cross-modality object detection. In Proceedings of the International Conference on Pattern Recognition (ICPR), Kolkata, India, 1–5 December 2024. [Google Scholar]
  54. Adarsh, P.; Rathi, P.; Kumar, M. YOLO v3-tiny: Object detection and recognition using one stage improved model. In Proceedings of the 6th International Conference on Advanced Computing and Communication Systems (ICACCS), Coimbatore, India, 6–7 March 2020. [Google Scholar]
  55. Wang, C.-Y.; Yeh, I.-H.; Liao, H.-Y.M. YOLOv9: Learning what you want to learn using programmable gradient information. arXiv 2024, arXiv:2402.13616. [Google Scholar] [CrossRef]
Figure 1. The study area and distribution of dams recorded in public datasets in the Xinjiang region, China.
Remotesensing 18 01297 g001
Figure 2. An overview of S2-Dam dataset preparation from multi-source Sentinel-2 imagery. (Left) Data collection from three sources (arid-zone images, China-LDLR, and GRanD datasets) via the GEE platform, followed by data augmentation, 256 × 256 cropping, and VIS-NIR band extraction. (Right) Representative annotated samples showing various dam scenarios with bounding box labels, where the red rectangles indicate dam targets.
Remotesensing 18 01297 g002
Figure 3. Representative examples of dams and their scale distributions in the DIOR dataset: (a) representative examples, with dams marked by red rectangles; (b) scale distributions.
Remotesensing 18 01297 g003
Figure 4. Overall technical framework of DLOD&MCCA method for remote sensing identification of reservoir dams in arid regions.
Remotesensing 18 01297 g004
Figure 5. A structural overview of the DDE-YOLO framework consisting of three principal components: Backbone with MF-based feature extraction, neck with MSC3k modules for feature fusion, and a multi-scale detection head for targets of varying sizes. The symbol “*” indicates the proposed MF module in this study.
Remotesensing 18 01297 g005
Figure 6. The architecture of the MF module and its input fusion mechanism for texture attention enhancement based on the spectral characteristics of VIS and NIR imagery.
Remotesensing 18 01297 g006
Figure 7. Network structure of MSC3k with a two-branch design, where the MSCB branch enhances feature extraction width via multi-scale dilated convolutions and the C3k branch increases extraction depth through sequential convolutions.
Remotesensing 18 01297 g007
Figure 8. Network structure of TCUB, which utilizes transposed convolution for optimized upsampling with depth-wise separable convolutions for enhanced feature recovery.
Remotesensing 18 01297 g008
Figure 9. Network structure of CAA, which encodes spatial information along horizontal and vertical directions via depth-wise convolutions and aggregates coordinate attention for enhanced feature representation.
Remotesensing 18 01297 g009
Figure 10. Visual comparison of dam detection results on VIS imagery across different models. (From left to right: SSD, FasterRCNN, RetinaNet, EfficientDet-d0, RT-DETR, and DDE-YOLO). The blue rectangles indicate the detection results of different models.
Remotesensing 18 01297 g010
Figure 11. Visual comparison of dam detection results on VIS-NIR imagery. Compared with models that exhibit duplicate or missed detections, DDE-YOLO delivers consistent localization with higher confidence and cleaner predictions across all samples.
Remotesensing 18 01297 g011
Figure 12. Comparison of dam detection results among NIR images, VIS images, VIS-NIR fusion, and ground truth. (ac) Three representative scenarios.
Remotesensing 18 01297 g012
Figure 13. A schematic comparison of different multimodal fusion strategies in DDE-YOLO. (a) Early fusion, (b) mid fusion, (c) mid-to-late fusion, and (d) late fusion. The proposed MF module in this study follows the early fusion paradigm The symbol “C” denotes the concatenation operation used for feature fusion.
Remotesensing 18 01297 g013
Figure 14. Comparison of dam detection results with and without the MCCA module. (ad) Local enlarged views of representative regions, where the red rectangles indicate the ground-truth targets, the orange and green rectangles indicate false positives, and the blue rectangles indicate the detection results. (e) Global blind detection without MCCA produces scattered responses with confidence scores ranging from 0.29 to 0.74, including false positives in non-target areas. (f) Detection results with the MCCA constraint applied. The responses are restricted to plausible regions, irrelevant areas are effectively suppressed, detection confidence is improved, and the false alarm rate is significantly reduced.
Remotesensing 18 01297 g014
Figure 15. The convergence performance comparison among the DDE-YOLO and other YOLO models: (a) mAP comparison over training epochs; (b) Recall comparison over training epochs.
Remotesensing 18 01297 g015
Figure 16. Regional-scale reservoir dam detection and mapping in Xinjiang arid region.
Remotesensing 18 01297 g016
Figure 17. ROC curve analysis of DDE-YOLO under different confidence thresholds.
Remotesensing 18 01297 g017
Table 1. Experimental hyperparameter configuration.
Training
Parameters
Epochs300
Batch Size16
OptimizerSGD
Image Size256
Initial Learning Rate0.01
Momentum0.937
IoU0.5
Table 2. Accuracy comparison among DDE-YOLO and other models on VIS. Bold values indicate the highest scores for each metric.
ModelPrecision (%)Recall (%)mAP50 (%)F1 (%)F2 (%)
SSD84.563.758.072.0115.7
FasterRCNN36.383.369.051.097.0
RetinaNet83.072.770.378.0126.4
EfficientDet-d086.757.154.969.0107.4
RT-DETR89.277.487.082.9135.0
DDE-YOLO90.286.991.188.5146.6
Table 3. Accuracy comparison among DDE-YOLO and other models on VIS-NIR. Bold values indicate the highest scores for each metric.
ModelPrecision (%)Recall (%)mAP50 (%)F1 (%)F2 (%)ParametersGFLOPs
YOLOv8s86.885.388.286.1143.011,166,56028.8
YOLOv10s88.178.585.583.0135.88,128,27225.1
YOLOv11s92.083.591.587.5143.69,428,17921.5
YOLOv12s88.086.590.587.2145.09,127,42421.4
DE-YOLO97.382.790.586.1145.111,853,27231.1
SuperYOLO91.978.288.784.5137.27,991,42056.0
DDE-YOLO95.488.292.891.7150.810,121,74722.7
Table 4. Accuracy comparison of dam detection on DIOR dataset. Bold values indicate the highest scores for each metric.
ModelBackbonePrecision (%)Recall (%)mAP50 (%)F1 (%)F2 (%)
SSDVGG1687.559.055.970.0110.3
FasterRCNNResNet5046.385.874.760.0111.3
RetinaNetResNet5077.771.668.575.0122.5
EfficientDetEfficientNet-d083.952.148.364.099.4
RT-DETRHGNet78.565.270.471.2115.2
RT-DETRResNet5081.566.869.573.4118.4
YOLOv5sCSPDarknet84.265.873.873.8118.3
YOLOv8sC2f + Conv + SPPF75.564.772.369.7113.2
YOLOv11sC3k2 + Conv + SPPF80.967.173.173.4118.6
DDE-YOLOMSC3k + Conv + SPPF82.170.276.275.7122.9
Table 5. Accuracy comparison across various MSC3k, TCUB, and CAA modules on VIS. Bold values indicate the highest scores for each metric.
MSC3kTCUBCAAPrecision (%)Recall (%)mAP50 (%)F1 (%)F2 (%)
×××90.581.285.085.6140.1
××90.384.789.087.4144.1
××91.087.189.089.0147.3
××89.781.289.785.2140.0
×93.483.290.288.0143.9
×90.382.485.186.2141.5
×84.784.688.984.7141.1
90.286.991.188.5146.7
Table 6. Accuracy comparison across various MSC3k, TCUB, and CAA modules on VIS-NIR. Bold values indicate the highest scores for each metric.
MSC3kTCUBCAAPrecision (%)Recall (%)mAP50 (%)F1 (%)F2 (%)
×××92.083.591.587.5143.6
××89.680.087.584.6138.2
××90.679.787.884.8138.3
××88.287.689.989.7146.3
×90.188.290.489.1148.0
×89.287.390.388.2146.5
×85.281.285.883.2134.8
95.488.292.891.7150.8
Table 7. Accuracy comparison among different fusion strategies on VIS-NIR. Bold values indicate the highest scores for each metric.
ModelFusion StrategyPrecision (%)Recall (%)mAP50 (%)F1 (%)F2 (%)
DDE-YOLOearly fusion95.488.292.891.7150.8
mid fusion93.587.190.890.1148.6
mid-to-late fusion87.884.689.286.2142.7
late fusion86.785.989.586.3143.6
Table 8. Accuracy comparison among different input configurations. Bold values indicate the highest scores for each metric.
ModelInput SourcePrecision (%)Recall (%)mAP50 (%)F1 (%)F2 (%)
DDE-YOLONIR87.876.480.981.7133.1
VIS92.383.591.087.7143.7
VIS + NIR95.488.292.891.7150.8
VIS + NIR + NDWI91.690.192.390.9151.0
Table 9. Comparison of model parameters, computational complexity, and inference speed across different methods.
ModelSSDFasterRCNNRetinaNetEfficientDet-d0RT-DETRYOLOv11sDDE-YOLO
Parameters26,285,486137,098,72437,968,6923,874,21719,882,0329,428,17910,121,747
GFLOPs62.7370.2170.15.3103.421.522.7
FPS40.235.836.652.138.346.445.2
Table 10. Accuracy comparison among the DDE-YOLO and YOLO series models on VIS. Bold values indicate the highest scores for each metric.
ModelPrecision (%)Recall (%)mAP50 (%)F1 (%)F2 (%)
YOLOv3-tiny85.281.284.083.2137.8
YOLOv5s95.482.488.388.4143.9
YOLOv8s93.483.189.988.0143.8
YOLOv9s87.381.287.084.2138.6
YOLOv10s87.976.984.482.1133.8
YOLOv11s90.581.285.085.6140.1
DDE-YOLO90.286.991.188.5146.6
Table 11. Quantitative analysis of detection results under different confidence thresholds.
Confidence ThresholdPrecision (%)Recall (%)F1 (%)False Positives
0.2595.488.291.726
0.5096.586.491.220
0.6097.184.390.316
0.7597.975.685.311
Disclaimer/Publisher’s Note: The statements, opinions and data contained in all publications are solely those of the individual author(s) and contributor(s) and not of MDPI and/or the editor(s). MDPI and/or the editor(s) disclaim responsibility for any injury to people or property resulting from any ideas, methods, instructions or products referred to in the content.