


Highlights
What are the main findings?
- This study proposed and validated the approach of using Sentinel-2 and handheld LiDAR data for the retrieval of phenological and structural feature parameters of urban park trees and exploratory assessments of their cross-species phenological–structural relationships, e.g., a weak but significant negative correlation existing between start of growing season (SOS) and tree height in the study area.
What are the implications of the main findings?
- The developed approach can be applied to urban park trees across more extensive areas for deriving more general rules of their cross-species phenological–structural relationships, with the implications of coping with complex species compositions for refining from urban tree ecological knowledge to terrestrial process models.
Abstract
Understanding the interplay between tree structure and seasonal dynamics, particularly cross-species, is crucial for managing urban forest ecosystems. However, balancing fine-scale inventory of trees with large-area mapping of forest ecosystems is a challenge. This endeavor integrates multi-temporal Sentinel-2 satellite remote sensing (RS) imagery with high-density handheld light detection and ranging (LiDAR) point clouds to launch exploratory analyses of cross-species phenological–structural relationships (CSPSRs) in urban park trees. We derived plot-level phenological metrics (e.g., start of growing season, SOS) and quantified fine-scale three-dimensional (3D) tree structural attributes (e.g., tree height and trunk curvature), respectively. Then, we investigated how the 3D structural attributes of urban park trees covary with their phenological traits. The results revealed the underlying CSPSRs, e.g., a weak but significant negative correlation between SOS and tree height in the study area. The derived CSPSRs demonstrate that tree structure is a key predictor of its phenology, even across species. Overall, the integrated RS approach can provide a robust framework for associating the structure and phenology of trees, offering valuable insights for the ecological management of urban forests.
1. Introduction
Urban forest trees are critical components of ecosystems, providing a multitude of ecological, social, and economic services, including carbon sequestration, microclimate regulation, air pollution mitigation, and enhancement of human well-being [1,2]. Their health and functionality are intrinsically linked to both their phenology—the timing of cyclical biological events such as budburst, leaf expansion, and leaf senescence—and their three-dimensional (3D) structural attributes, such as crown volume, leaf area, and tree height [3,4]. Understanding the relationships between the phenology and structure of urban forest trees is crucial for effective urban environment management, particularly under the pressures of climate change and urban densification [5].
Phenology serves as a key indicator of tree responses to environmental conditions. In urban environments, trees face unique stressors, including the urban heat island effect, soil compaction, pollution, and limited rooting space, which can significantly alter their phenological cycles compared to their rural counterparts [6,7]. Urban warming often leads to earlier spring leaf-out and later autumn senescence [8]. These shifts can affect ecosystem processes like carbon uptake and water cycling. Simultaneously, the structural complexity of a tree determines its capacity to deliver ecosystem services. Denser, larger canopies typically intercept more rainfall, provide more shade, and sequester more carbon [9,10]. However, accurately quantifying the structural parameters in heterogeneous urban parks has traditionally been labor-intensive and limited in spatial extent.
Remote sensing (RS) offers powerful tools to overcome these limitations at various scales. Satellite-based multispectral sensors, e.g., the European Space Agency’s Sentinel-2, provide frequent, synoptic observations of the land surfaces [11,12]. Sentinel-2’s spectral bands, including the red-edge regions, are particularly sensitive to vegetation chlorophyll content and leaf area, making it suitable for monitoring vegetation phenology through spectral indices like the Normalized Difference Vegetation Index (NDVI) and Enhanced Vegetation Index (EVI) [11,12]. Time-series analysis of these indices allows the derivation of phenological metrics (phenometrics), such as the start and end of the growing season (SOS, EOS) [13,14]. However, the medium spatial resolution (10–20 m) of Sentinel-2 often leads to mixed pixels in urban parks, where tree signals are often blended with grass, soil, and impervious surfaces, complicating the interpretation of tree-specific phenology [15].
Handheld light detection and ranging (LiDAR) provides a complementary, high-resolution solution for capturing the intricate 3D structure of individual trees. By emitting laser pulses and measuring their return, handheld LiDAR generates precise point clouds from which detailed structural metrics can be derived, including trunk diameter, crown diameter, plant area index (PAI), and above-ground biomass [16,17,18,19,20,21]. Actually, handheld LiDAR is a portable, flexible form of terrestrial laser scanning (TLS), which is inherently an important means for precisely measuring various structural properties of trees [22,23]. These metrics offer a ground-truth, mechanistic representation of tree form and function. While handheld LiDAR excels at tree structural characterization, its operational scope is typically plot-based and temporally sparse due to logistical constraints, making it quite unsuitable for continuous, landscape-scale phenological monitoring.
Integration of Sentinel-2 time-series images with handheld LiDAR-derived structural metrics presents a novel and robust framework to bridge the scale gap between landscape-level phenology and individual tree structure. This synergy allows researchers to learn how the observed spatial and temporal patterns in satellite-derived phenology are related to the 3D architecture of trees [24,25]. For example, do trees with larger canopy volumes demonstrate a different seasonal green-up trajectory than smaller ones? How does canopy structural complexity influence the spectral signature captured by satellites throughout growing seasons? Answering such questions simultaneously regarding multiple species is essential for refining the RS models of urban forest ecology.
The particular objective of this study is to assess cross-species phenological–structural relationships (CSPSRs) in heterogeneous urban park environments, based on Sentinel-2 RS image series and handheld LiDAR-collected point clouds. To finish this task, we first hypothesize: (1) Sentinel-2 phenometrics can distinguish significant variation across urban park plots; (2) handheld LiDAR-derived tree structural metrics (e.g., canopy volume, PAI) will be key explanatory variables for this variation; and (3) the CSPSRs exist across the varying local urban forests. By exploring the linkages, this study attempts to promote the development of integrated RS approaches for more accurate and sustainable urban forest monitoring.
2. Materials and Methods
2.1. Study Area and Data Collection
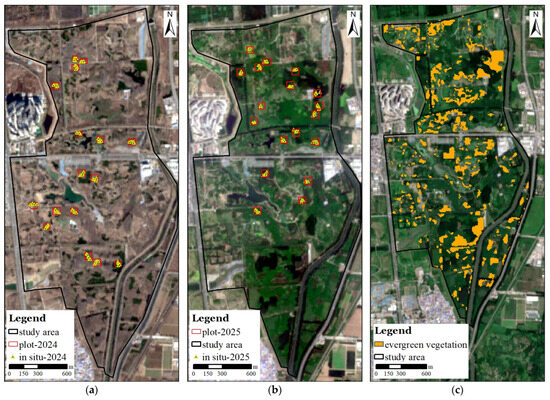
This study was deployed at the urban forest park named North China Arboretum, as shown in Figure 1, within the metropolitan area of Beijing, China. The park was selected due to its diversity of tree species (including native and exotic species). Specifically, this urban forest park displays over 260 species of woody plants, which are divided into five major landscape functional zones based on plant characteristics. Its North Garden owns the native tree area and the resource tree area, while its South Garden includes the areas of introduced trees, protected trees, wetland, and desert trees.
Figure 1.
Demonstration of the study area, in terms of (a) December 2024 and (b) May 2025 Sentinel-2 images used as the background, respectively, with the handheld LiDAR scanned plots and the in situ surveyed sites indicated. With the 30 July 2025 Sentinel-2 image used as the background, (c) evergreen vegetation is marked out.
A time series of Sentinel-2 Level-2A (Bottom-Of-Atmosphere reflectance) images was acquired from the Copernicus Open Access Hub for the period covering at least one full growing season (e.g., December 2024–November 2025). All available images with less than 20% cloud cover over the study area were downloaded. Bands at 10 m (B2, B3, B4, B8) spatial resolution were utilized.
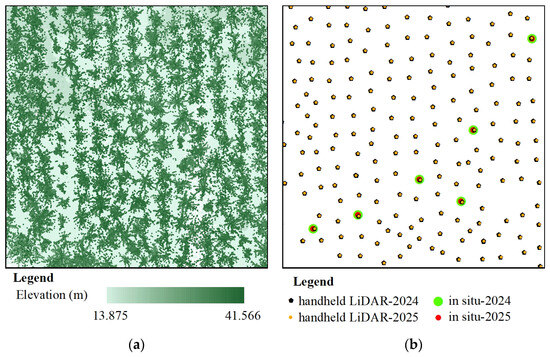
The handheld LiDAR datasets were collected using a SLAM100 laser scanner (http://www.slam100.com/slam100-lidar-scanner/) in December 2024 and May 2025. The interval of six months corresponded to negligible changes in tree structural traits. Scans were performed in high-resolution mode to capture fine branch details. The point clouds are illustrated in Figure 2a. The locations of the plots mapped by the handheld LiDAR and in situ surveyed in 2024 and 2025 are illustrated in Figure 2b. A large portion of LiDAR scan locations are overlapped.
Figure 2.
Illustration of (a) handheld LiDAR-collected point clouds and (b) the locations of handheld LiDAR scanning and in situ survey in 2024 and 2025.
Then, the spatial distribution of the handheld LiDAR data and the in situ survey data in the Sentinel-2 images was tested. The sites of the field measurements in December 2024 are displayed in Figure 1a, with the concurrent Sentinel-2 image shown as the background. The scenario corresponding to the field measurement in May 2025 is shown in Figure 1b. To better characterize the phenological feature parameters, the evergreen and deciduous vegetation were classified. in accordance with the spectral characteristics (NDVImin ≥ 0.25), the distribution of evergreen vegetation was extracted, as shown in Figure 1c.
Field surveys were conducted concurrently with the handheld LiDAR scanning to record tree species (Table 1 and Table 2) and diameter at breast height (DBH) for validation. The quality of all the data used for the following analyses was also checked by interactively referring to the ancillary data; e.g., ultra-high-resolution smartphone-collected photos that were used for the artificial interpretation of plot scenarios.
Table 1.
The species for each of the field survey plots in 2024.
Table 2.
The species for each of the field survey plots in 2025, with the overlapped ones in 2024 listed.
It is worth mentioning, necessarily at this initial stage of delineating data collection, that the scenarios involving mixtures of crowns, grass, bare soil, impervious surfaces, and shadow for same-location pixels in the Sentinel-2 image series, substantially vary every day, and it is almost impossible to collect all their daily ground-truth data. Thus, after the common practice of selecting pixels dominated by tree crowns was repeated, the mixture-caused inherent errors in deriving phenological dates were neglected, as was done in the previous studies [13,14,15].
2.2. Data Processing
2.2.1. Sentinel-2 Phenological Metric Extraction
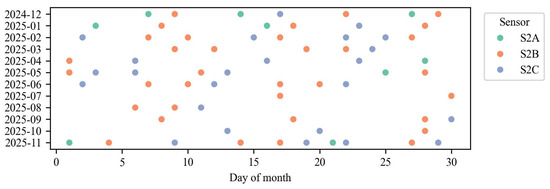
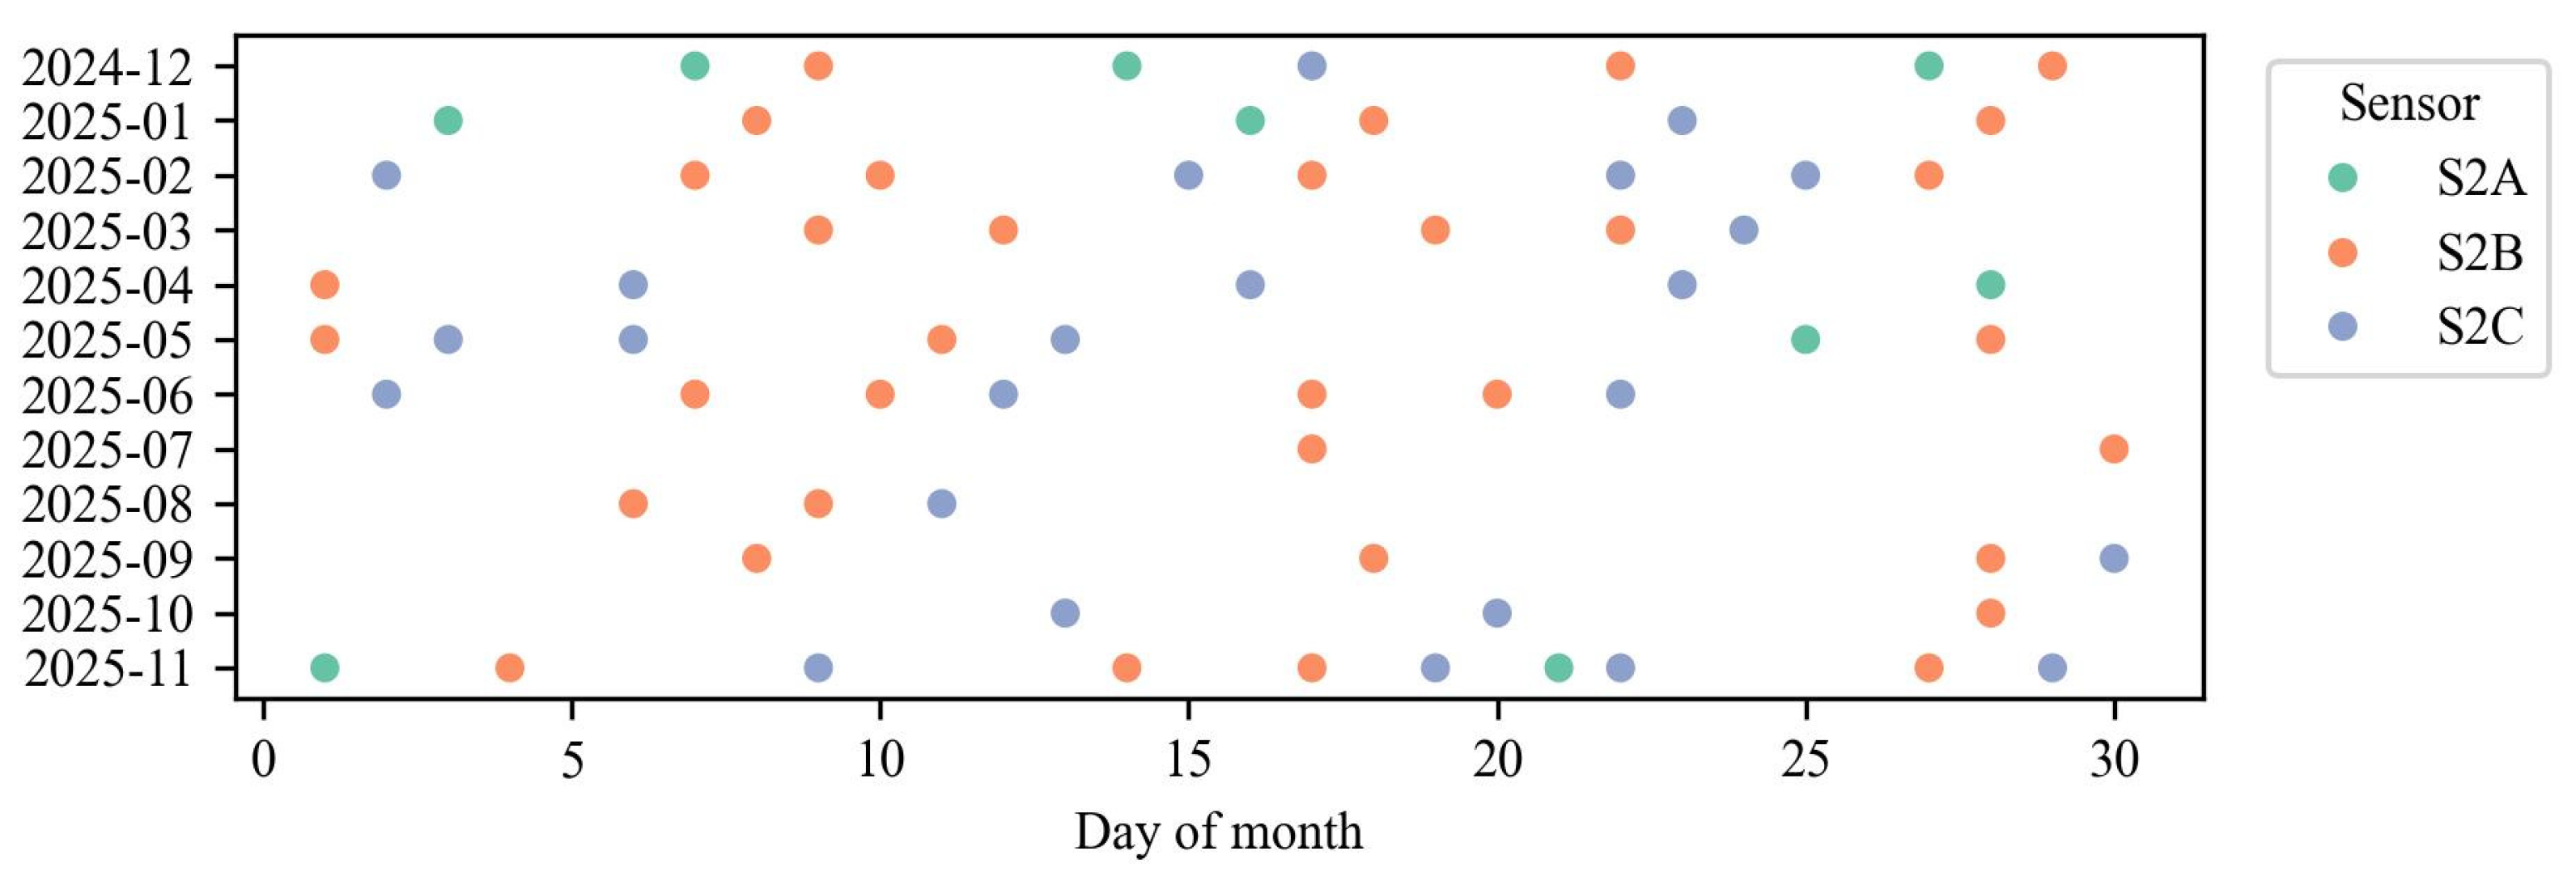
The pre-processing of Sentinel-2 images includes cloud and shadow masking, which was applied using the Scene Classification Layer (SCL) and advanced algorithms (e.g., s2cloudless) [26,27]. Then, the Sentinel-2 images covering the study area were retrieved, and the overpassing dates were determined, as listed in Figure 3.
Figure 3.
Listing of the dates (in terms of day of month for each month) when Sentinel-2 overpassed the study area during the study period.
The following step is the calculation of vegetation indices. For each cloud-free image, spectral indices were computed at the native pixel resolution. The primary spectral indices include NDVI optimized for Sentinel-2 [28]. The next step is time-series smoothing and gap-filling. The multi-temporal index data for each pixel were smoothed using adaptive filtering algorithms (e.g., double logistic (D-L) function fitting, Savitzky–Golay, Whittaker smoother) to reduce noise and interpolate gaps caused by clouds [29,30].
The last step is phenometric retrieval. For each park plot (aggregated from pixels), a double logistic model was fitted to the smoothed annual index time series [31]. The key phenological metrics were extracted, including SOS, EOS, duration of growing season (DOS), and the seasonal amplitude (NDVImax, NDVImin). The method for defining these thresholds (e.g., 30% of seasonal amplitude) was consistently applied.
2.2.2. Handheld LiDAR Data Processing and Structural Metric Extraction
The first step of handheld LiDAR data processing is point cloud registration and plot segmentation. Individual scans were co-registered using the simultaneous location and mapping (SLAM) method to create a single, plot-level point cloud [32]. The plot area was then isolated from the ground and non-vegetation points. The second step of handheld LiDAR data processing is individual tree segmentation. Within each plot, individual trees were segmented from the plot cloud using a combination of algorithms, e.g., normalized cut segmentation or comparative shortest-path methods [33,34].
The key step is structural metric calculation. For each segmented tree, the following metrics were computed from the point cloud: (1) biometric: DBH (from cylinder fitting to trunk points), tree height (TH), height to first branch (HFB); (2) canopy metrics: crown diameter (CD), North–South crown diameter (NSCD), East–west crown diameter (EWCD), crown area (CA), crown volume (CV) derived using the convex hull or voxel-based methods [35,36]; (3) trunk metrics: trunk volume (TV), trunk curvature (TC) calculated by using the TC-regarded DBH retrieval method [37].
2.3. Exploratory Analyses of CSPSRs
The first step of exploratory analysis is spatial co-registration. Plot boundaries from the handheld LiDAR scanning campaign were precisely georeferenced and overlaid onto the Sentinel-2 pixels. The phenological metrics from all the pixels whose centers fell within a plot boundary were averaged to generate a single, plot-level phenometric value.
The next step is the retrieval of tree structural metrics from handheld LiDAR data. For each tree, the handheld LiDAR metrics were derived by using the software LiDAR360 (https://www.greenvalleyintl.com/LiDAR360, accessed on 21 July 2025), including TH, DBH, CD, NSCD, EWCD, CA, CV, HFB, TV, and TC, representing its structural attributes.
At last, exploratory analyses (correlation matrices, scatterplots) were conducted. The core analysis involved constructing a linear univariate regression analysis model to assess the predictive power of each of the handheld LiDAR-derived structural metrics (independent variables) on each of the Sentinel-2-derived phenometrics (dependent variables), with all the species taken into account to derive the aimed CSPSRs. The results can also demonstrate the situation of autocorrelation possibly existing between the phenological and structural feature parameters.
3. Results
3.1. Sentinel-2-Derived Phenological Metrics
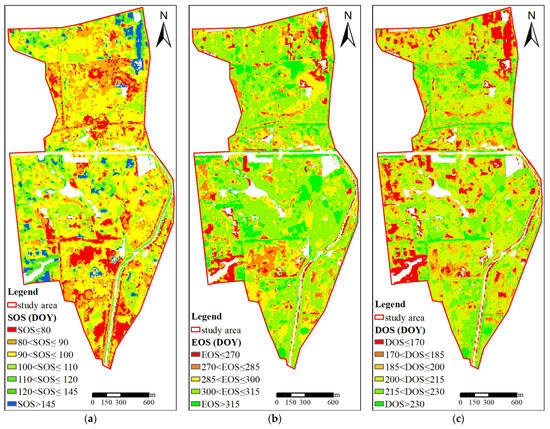
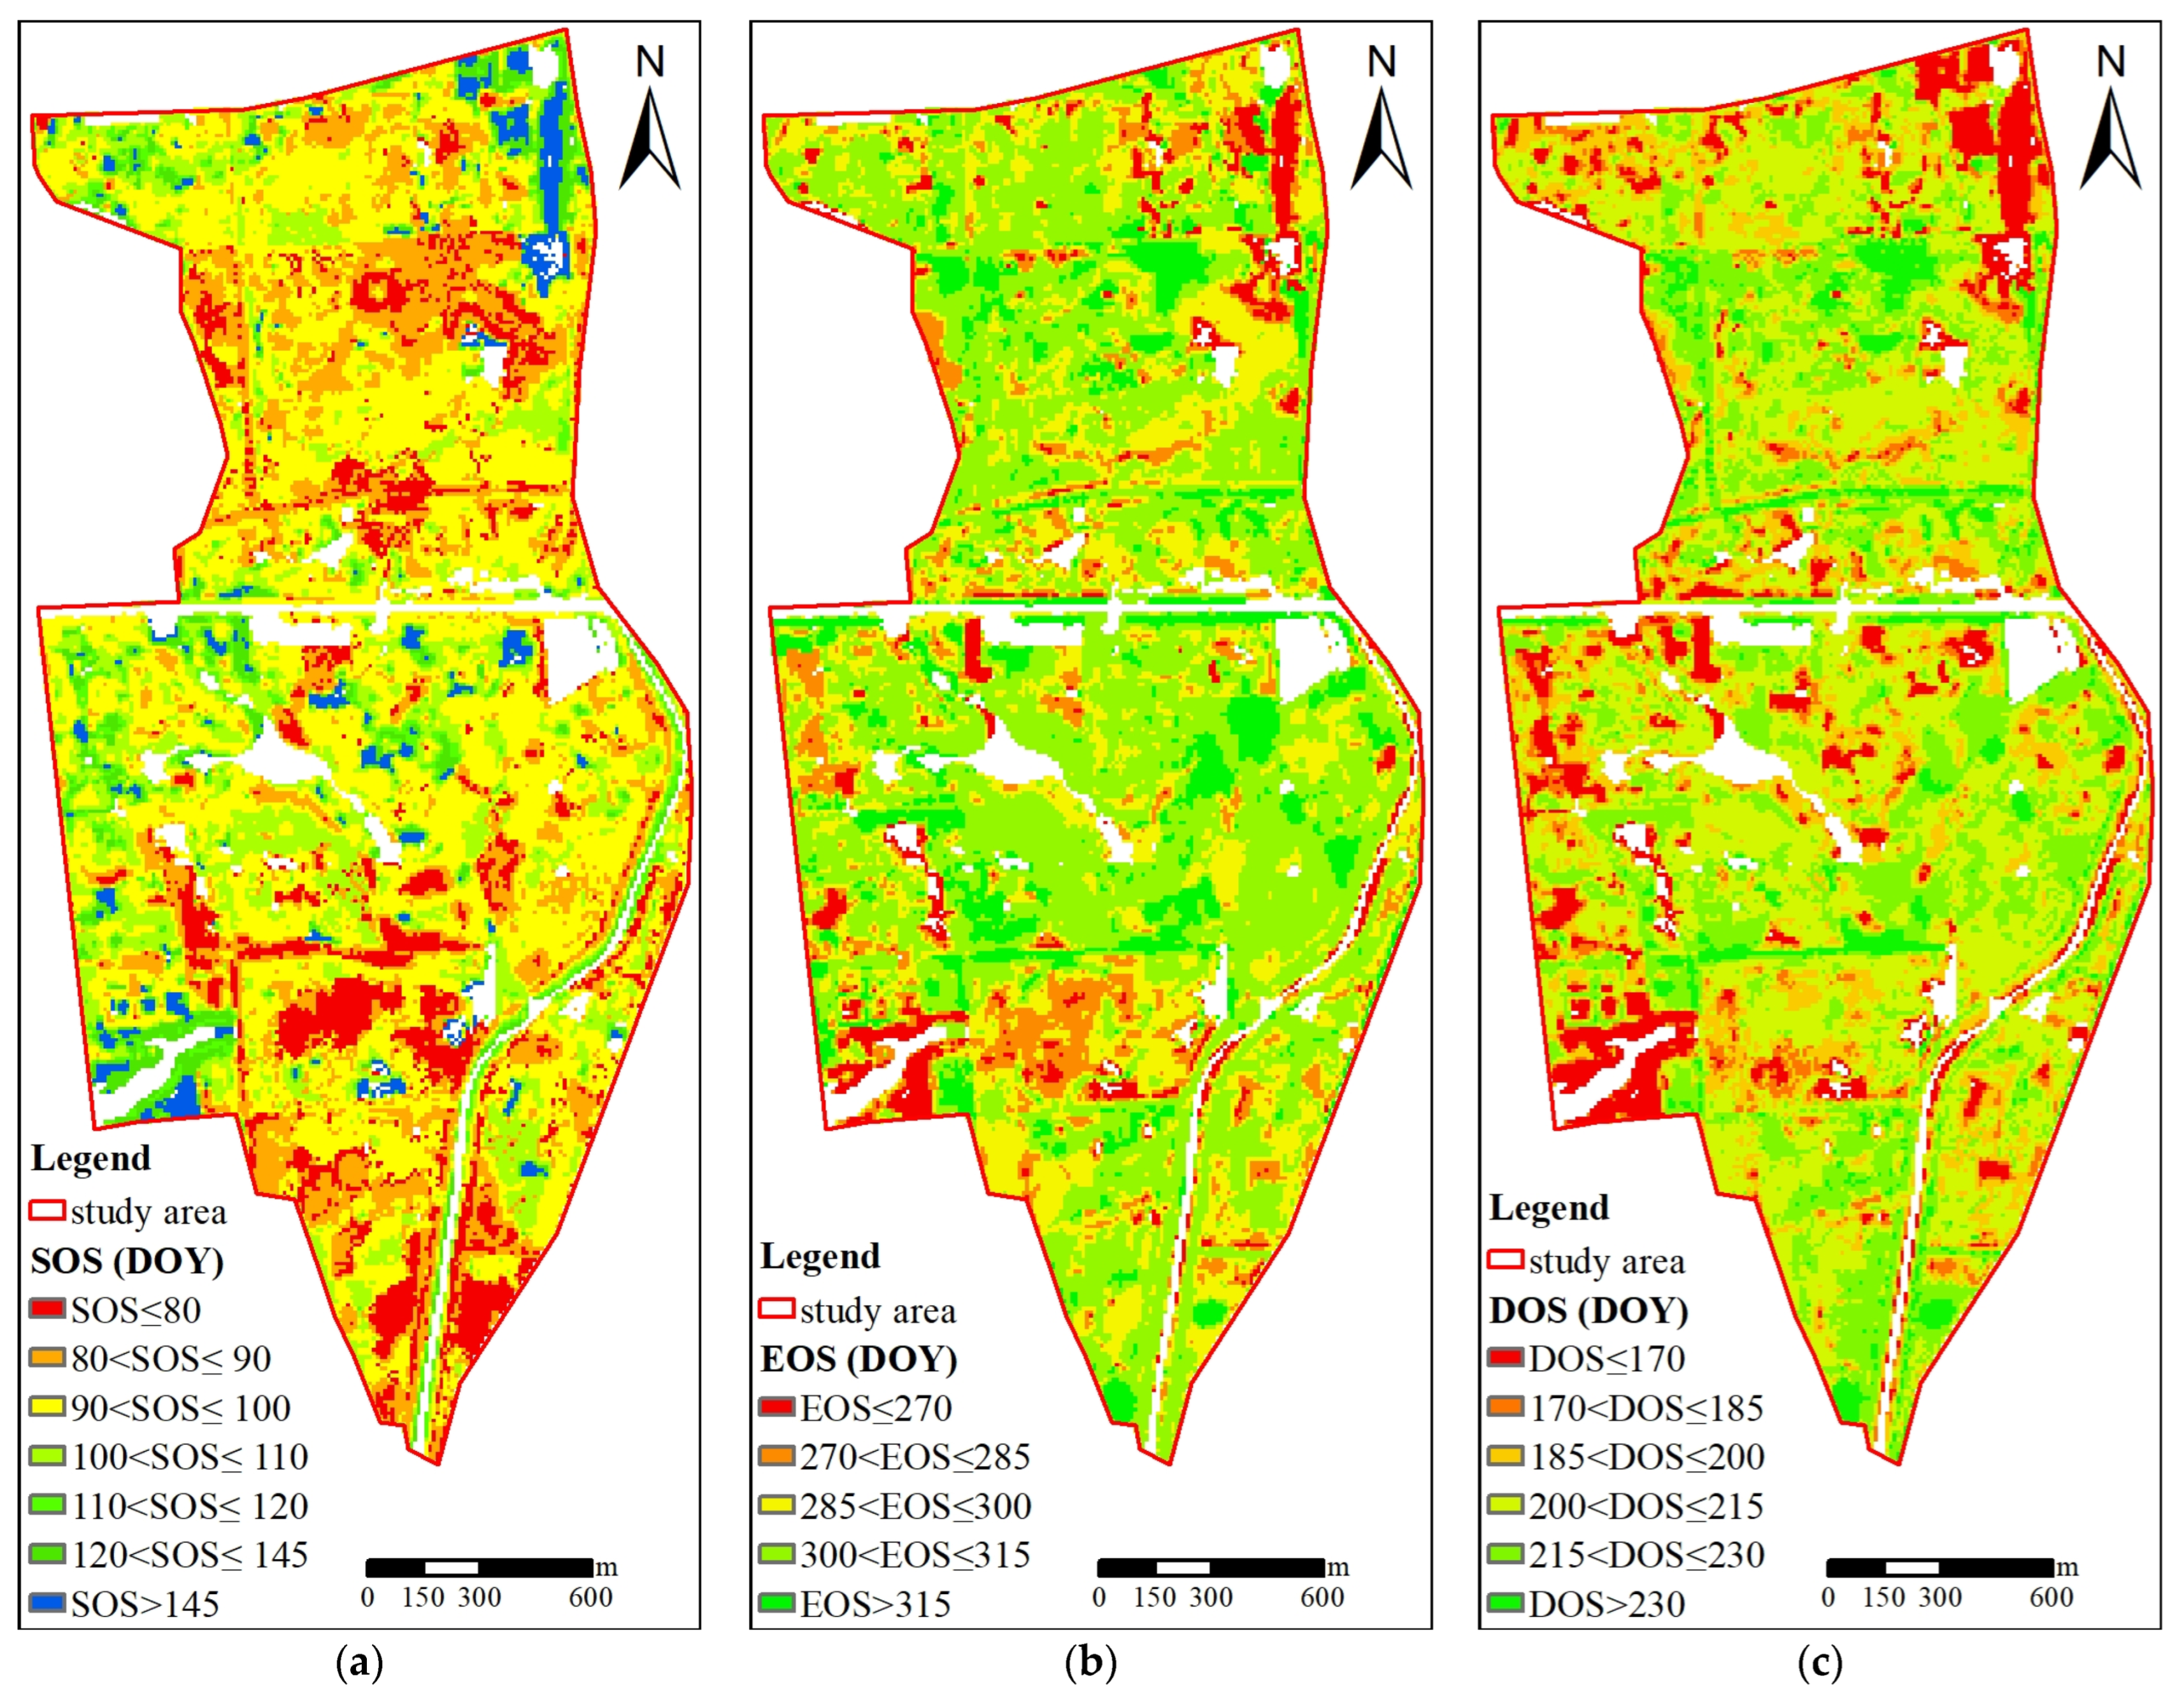
The spatial patterns of the phenological metrics derived from the Sentinel-2 images are shown in Figure 4a, Figure 4b and Figure 4c, in terms of SOS, EOS, and DOS, respectively. For the three kinds of phenological attributes, the trees of different species in the selected study area presents spatial heterogeneity, which guarantees the premise for operating this study of exploring CSPSRs.
Figure 4.
Spatial patterns of (a) SOS, (b) EOS, and (c) DOS derived from the Sentinel-2 images over the study area.
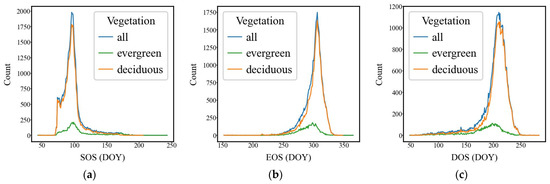
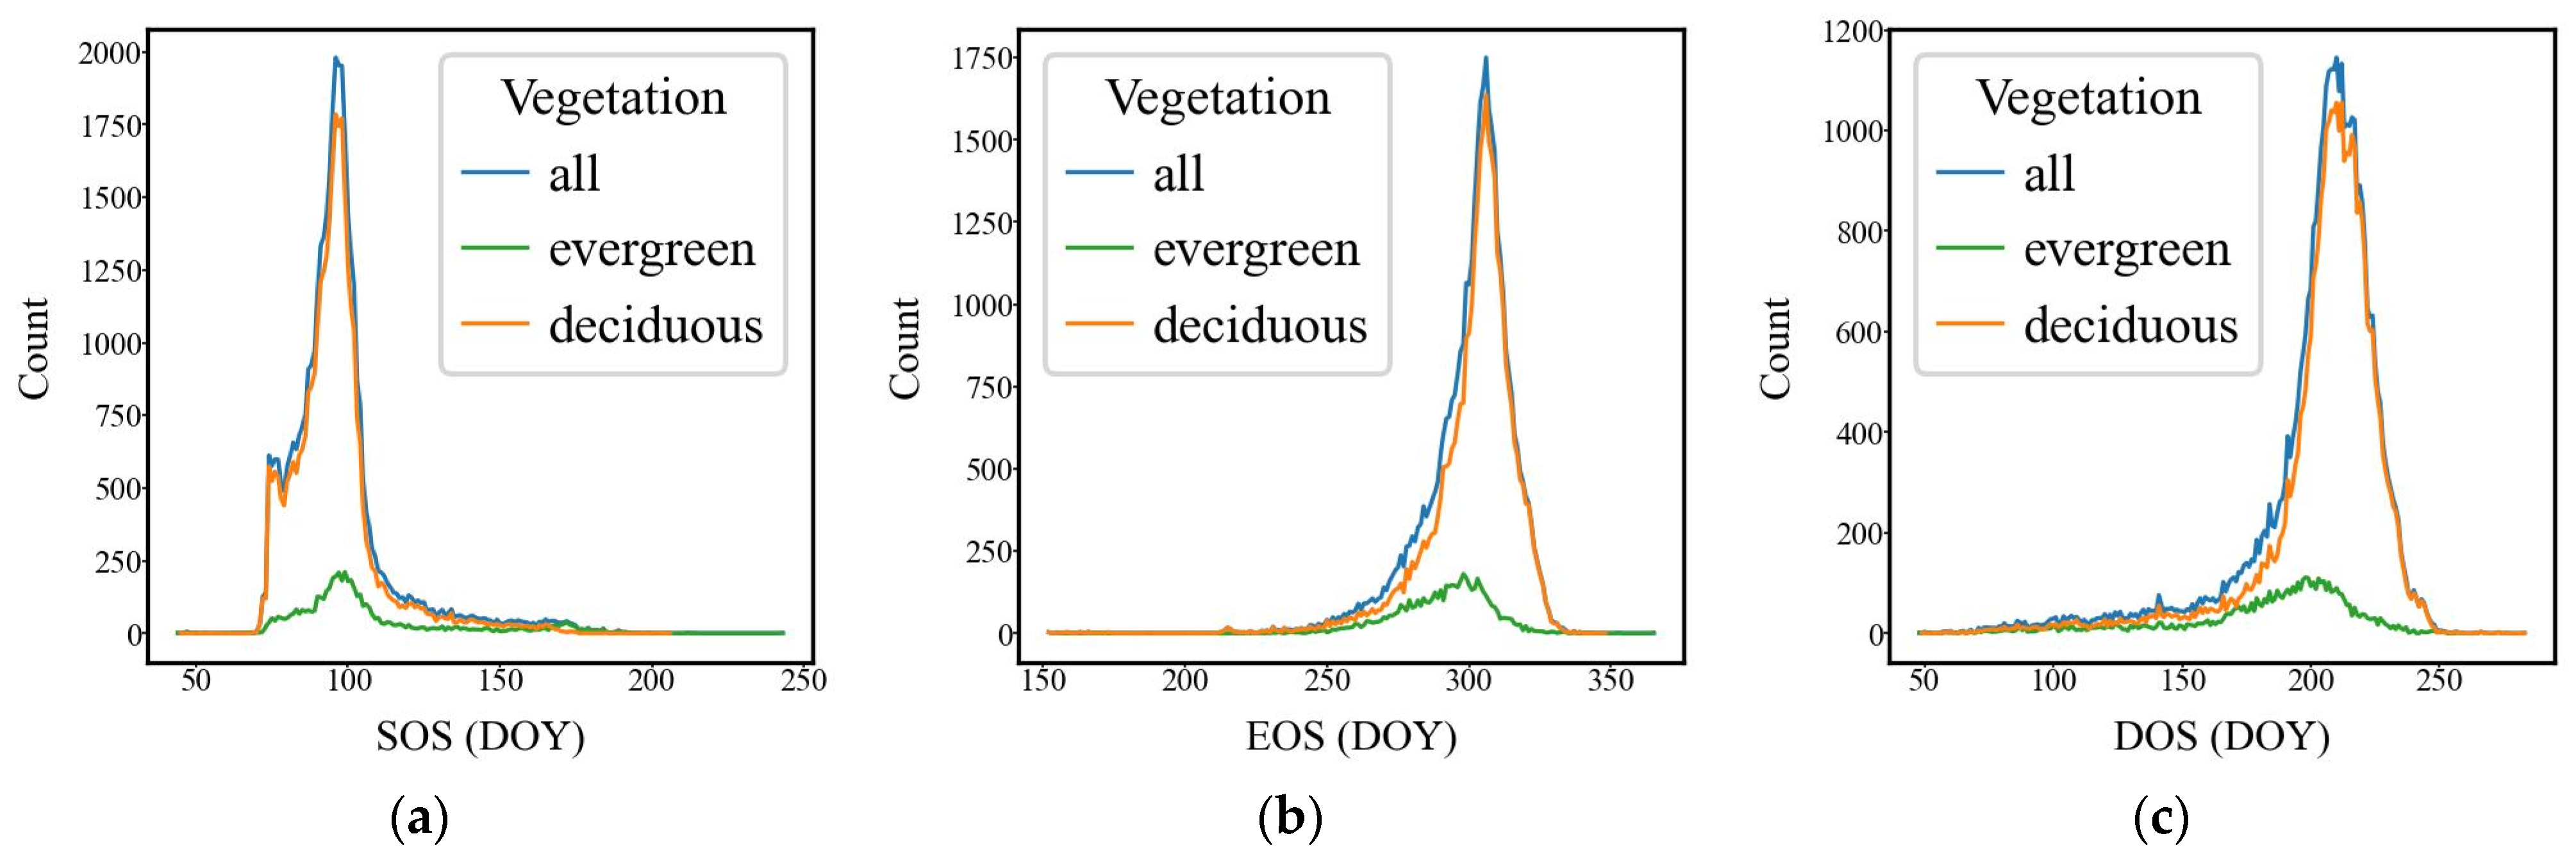
The holistic situations of phenological metrics, in terms of SOS, EOS, and DOS, are shown in Figure 5a, Figure 5b and Figure 5c, respectively. In addition, the difference between evergreen and deciduous vegetation can also be presented. In general, for SOS, deciduous trees are a little earlier than evergreen trees, while for EOS, deciduous trees are a little later than evergreen trees.
Figure 5.
Histograms of (a) SOS, (b) EOS, and (c) DOS for the scenarios of evergreen, deciduous, and all vegetation.
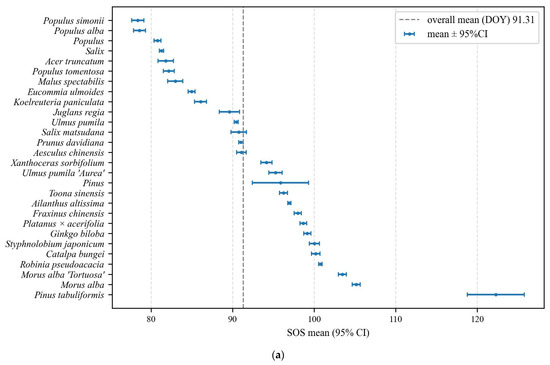
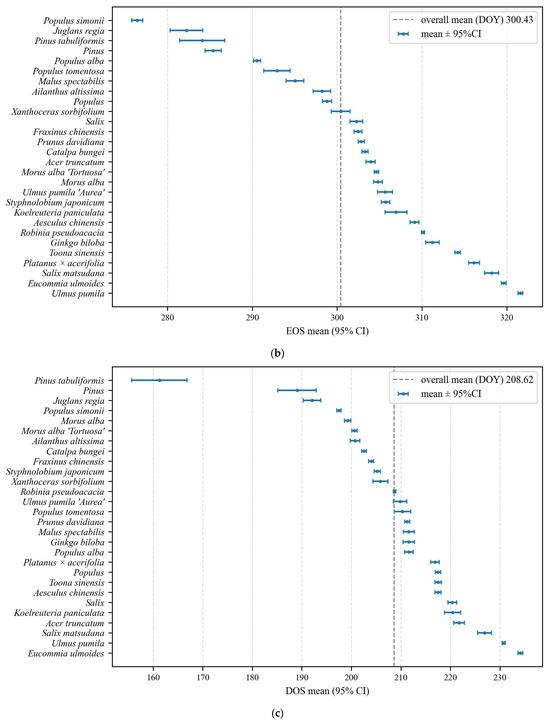
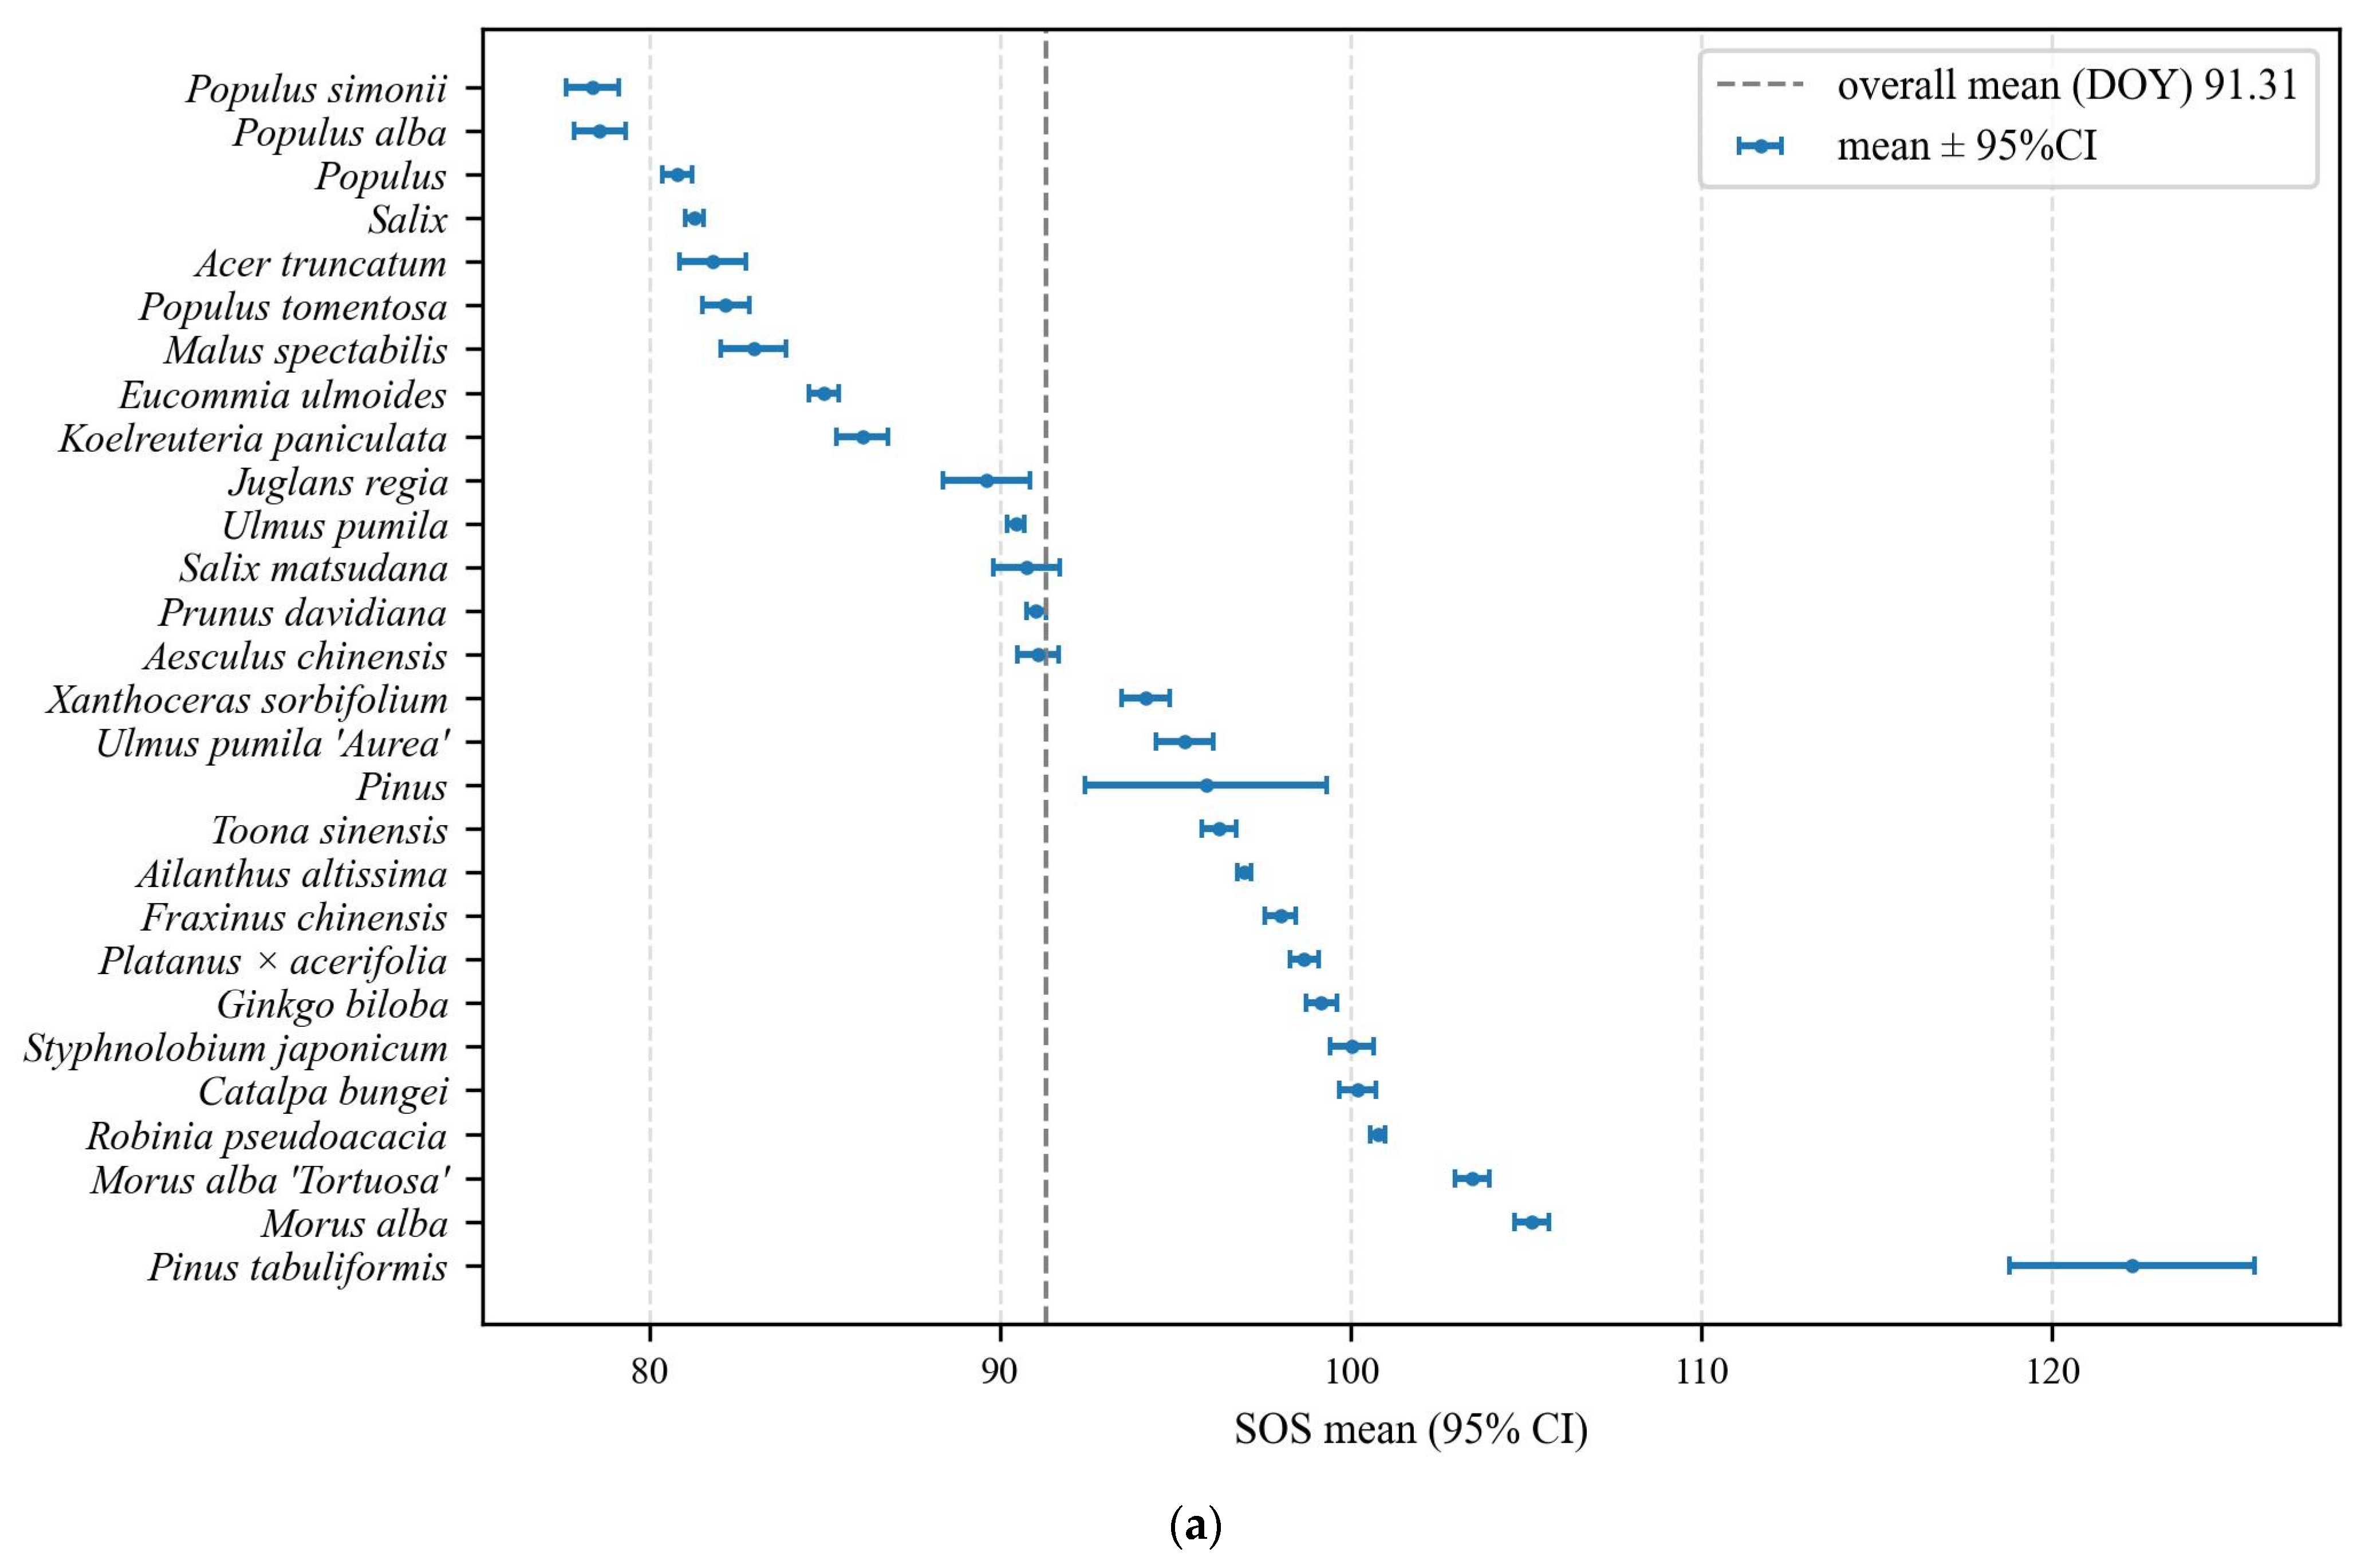
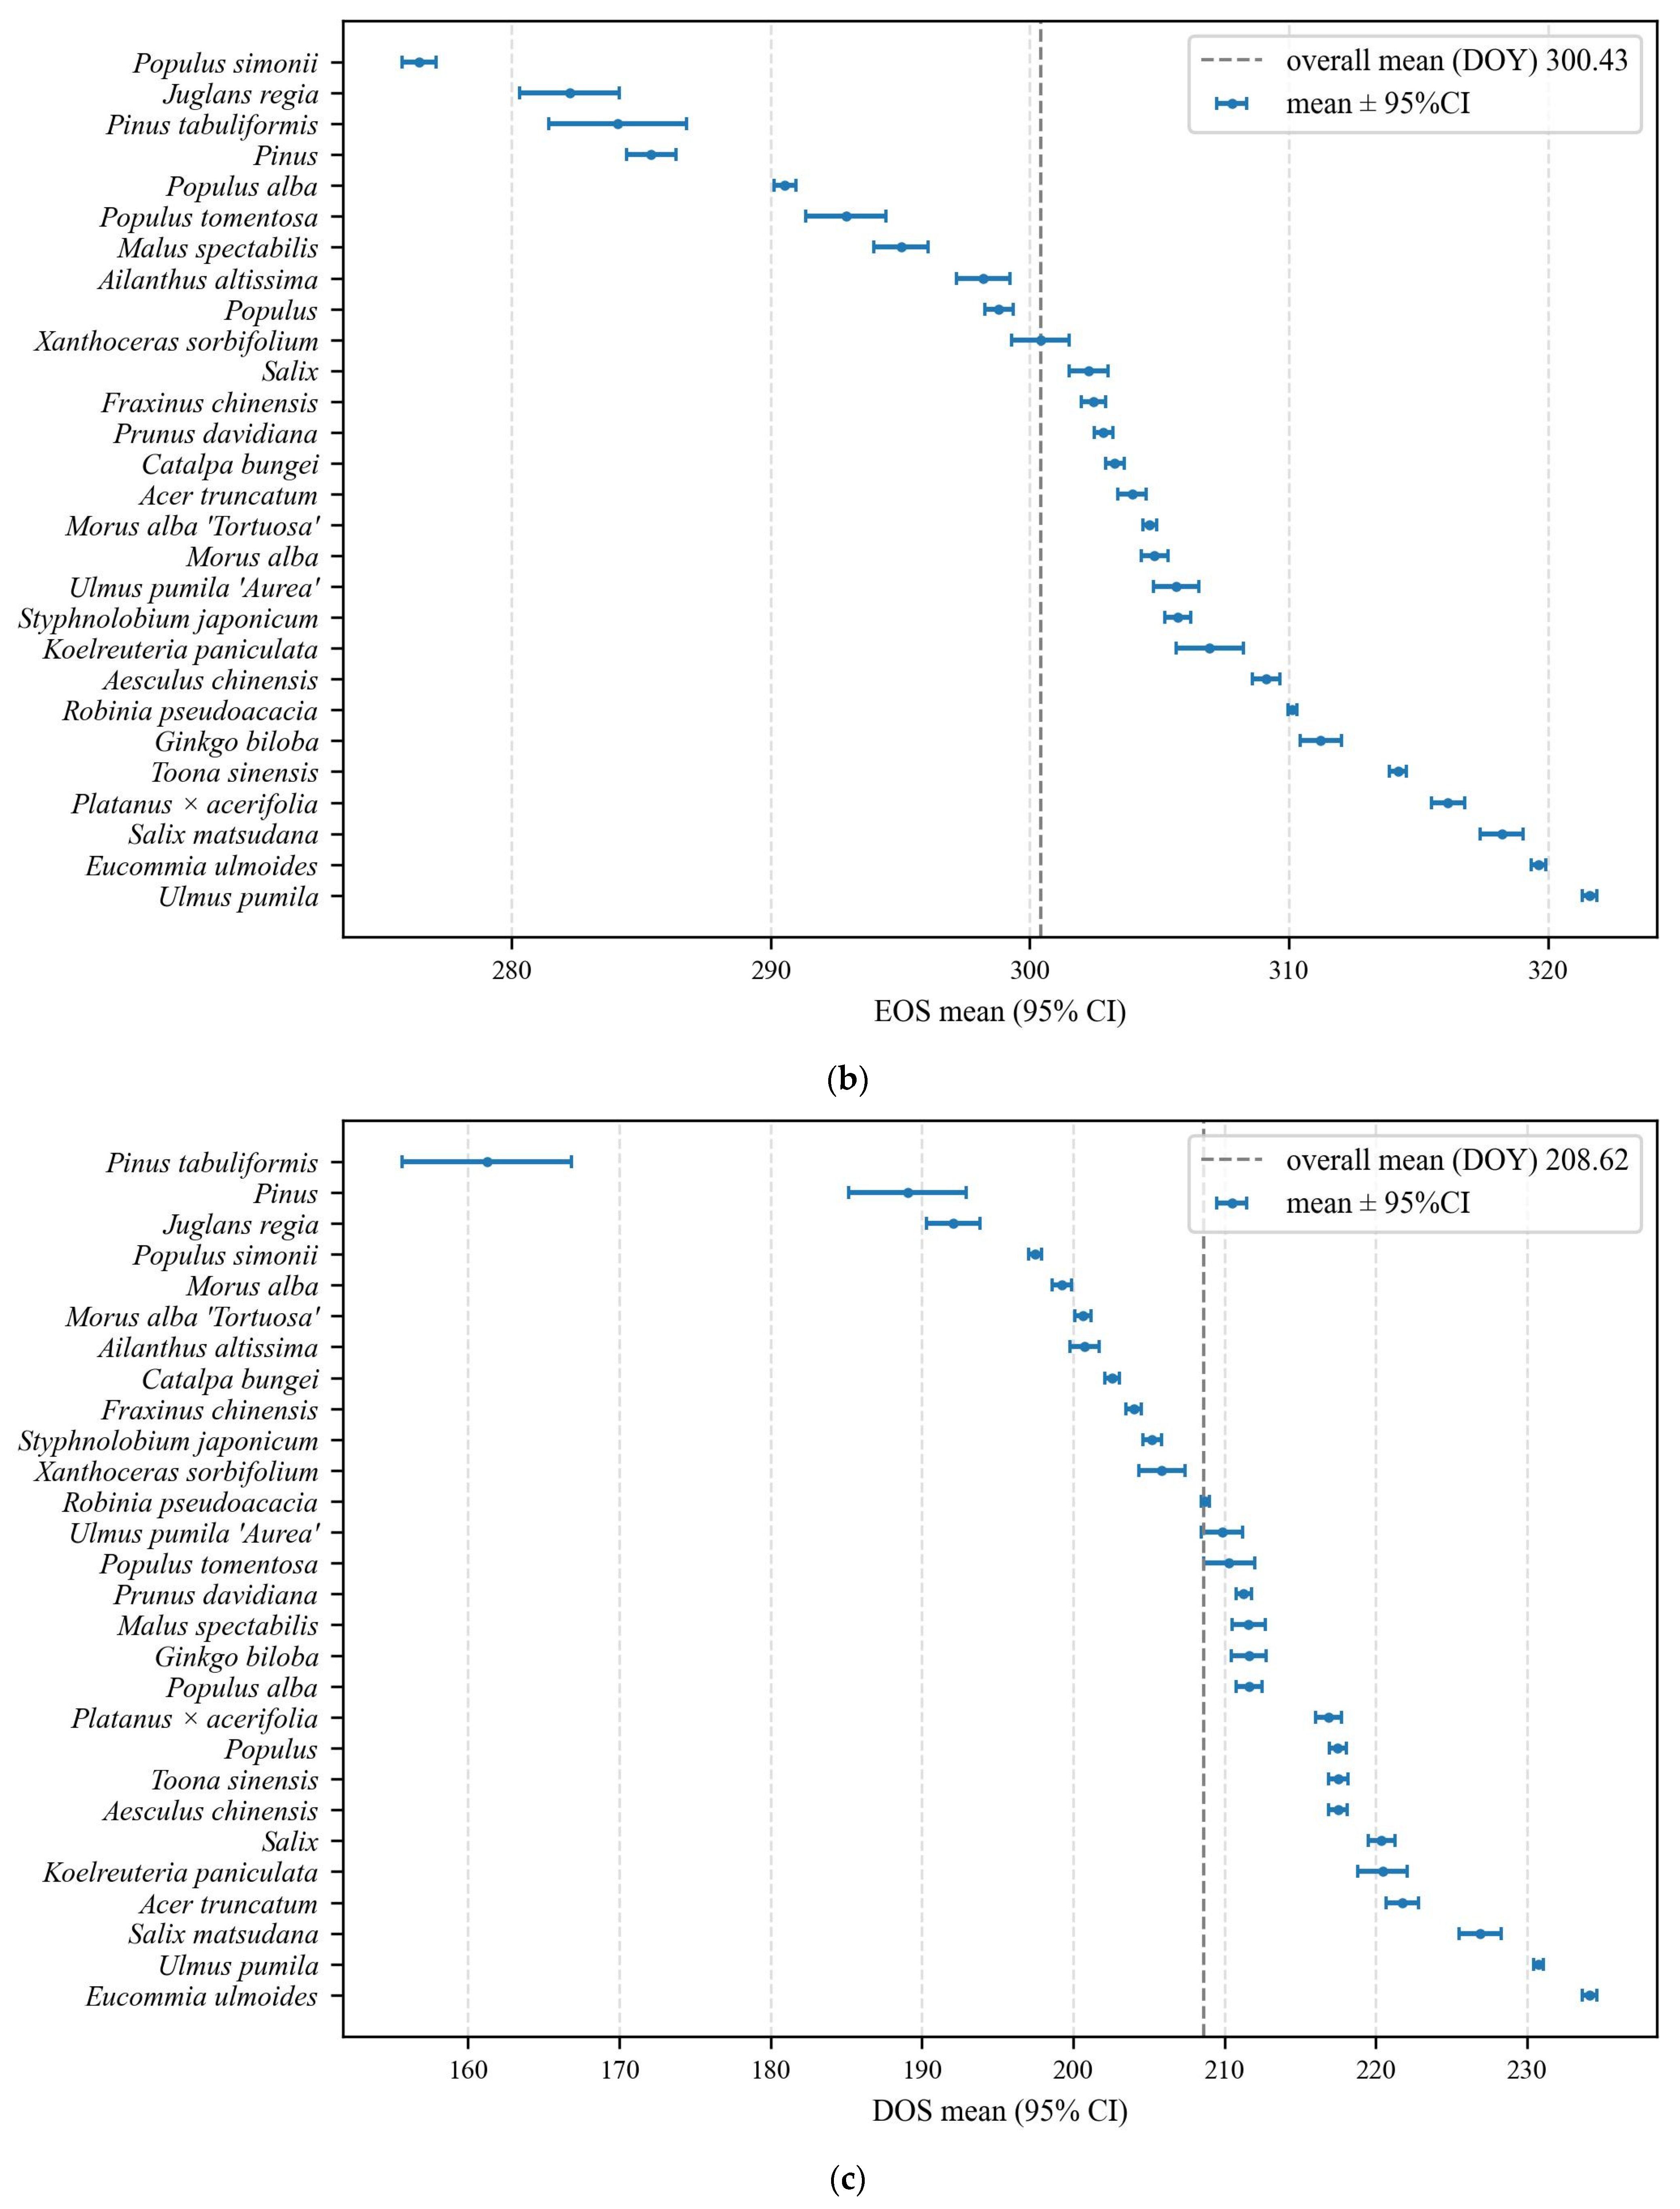
The phenological metrics for all tree species are characterized in Figure 6. For SOS, the mean is 91.31, and the species from the earliest to the latest range from Simon polar to Chinese pine, as shown in Figure 6a. For EOS, the mean is 300.43, and the species from the earliest to the latest range from Simon polar to Elm, as presented in Figure 6b. For DOS, the mean is 208.62, and the species from the earliest to the latest range from Chinese pine to Hardy Rubber Tree, as displayed in Figure 6c. For these three kinds of phenological traits, the sequences of species ranking are inconsistent.
Figure 6.
Boxplots of (a) SOS, (b) EOS, and (c) DOS for all the considered tree species under the setting of a 95% confidence interval (CI), with their overall mean values marked out and their listing sorted in the overall mean ascending order.
3.2. Handheld LiDAR-Derived Structural Metrics
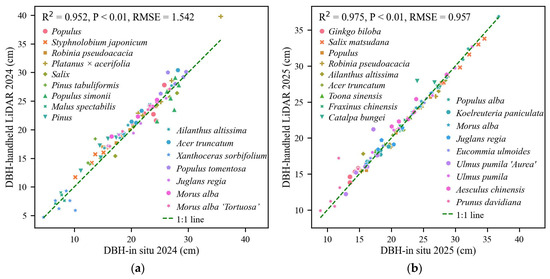
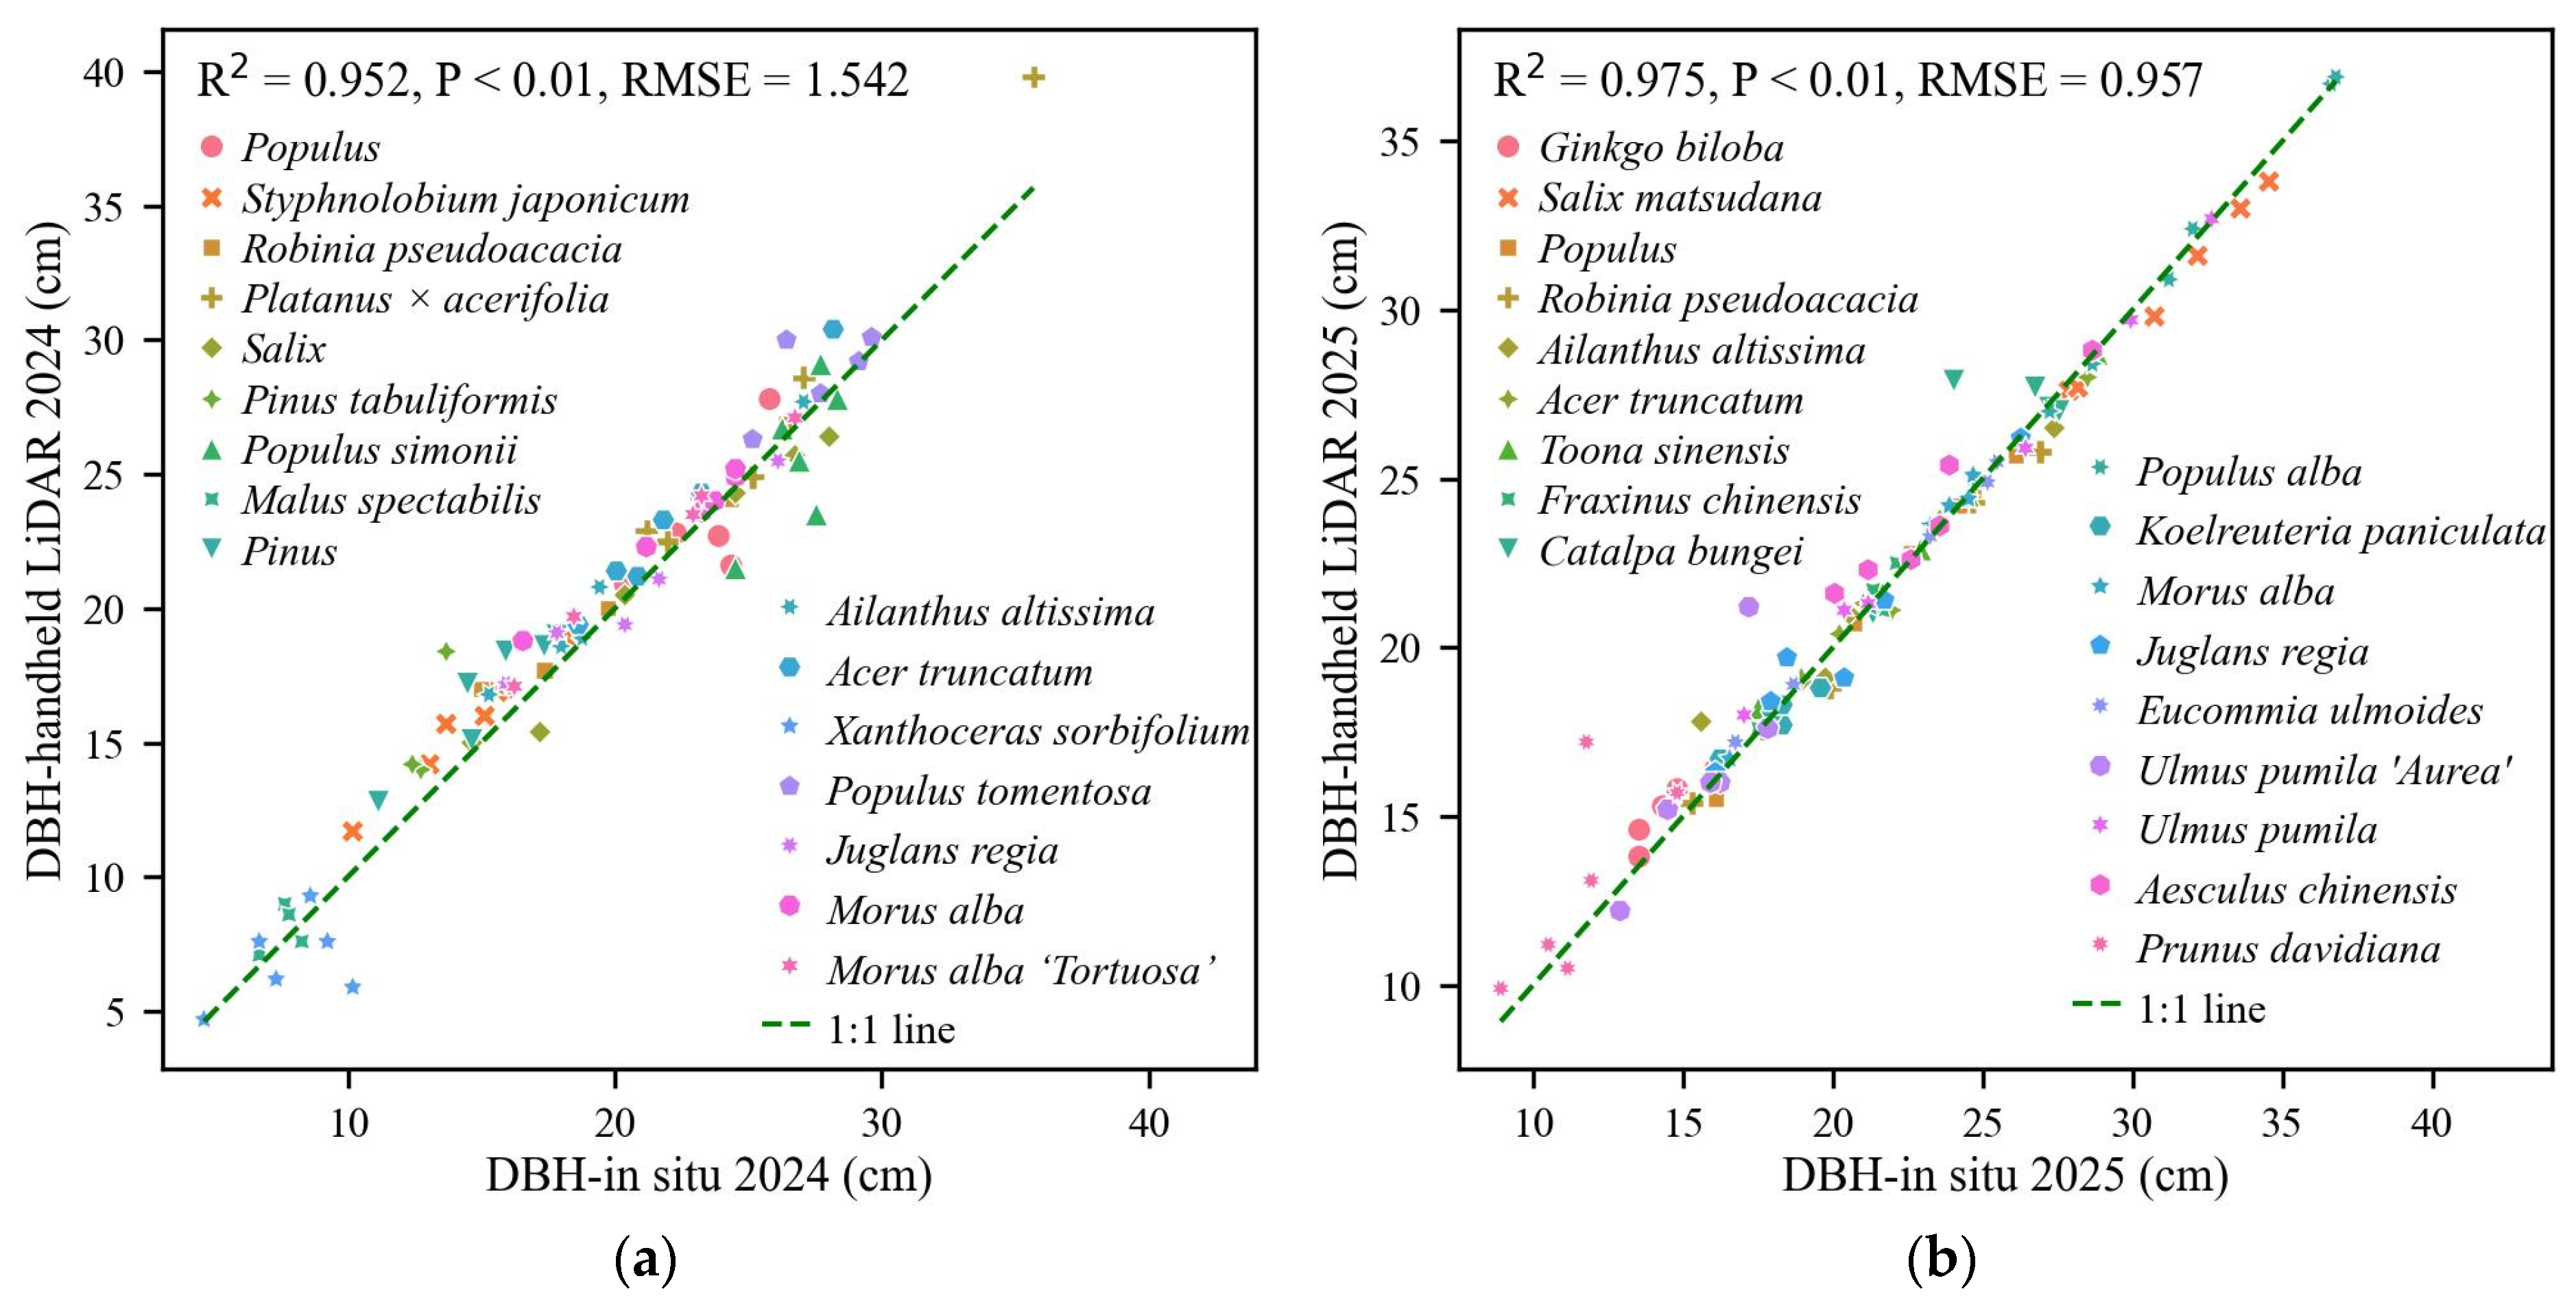
The precision of handheld LiDAR-derived tree structural metrics was examined by comparing with in situ surveyed ones in terms of DBH, which is commonly used in forestry practice. The results in Figure 7 demonstrate good R2 and p-value. This performance has briefly validated the applicability of handheld LiDAR data-derived tree structural feature parameters for the following exploratory analyses of CSPSRs.
Figure 7.
Scatterplots of handheld LiDAR-collected DBH and in situ surveyed DBH in (a) 2024 and (b) 2025, with the performance of regression analysis listed.
3.3. CSPSRs
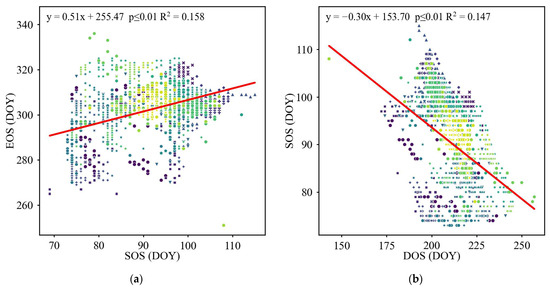
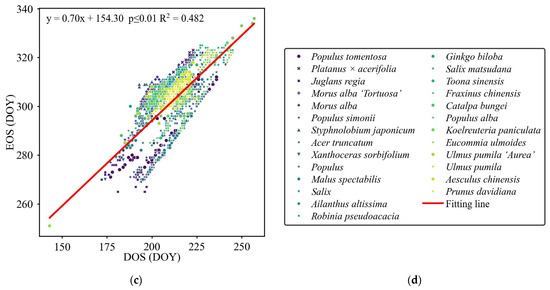
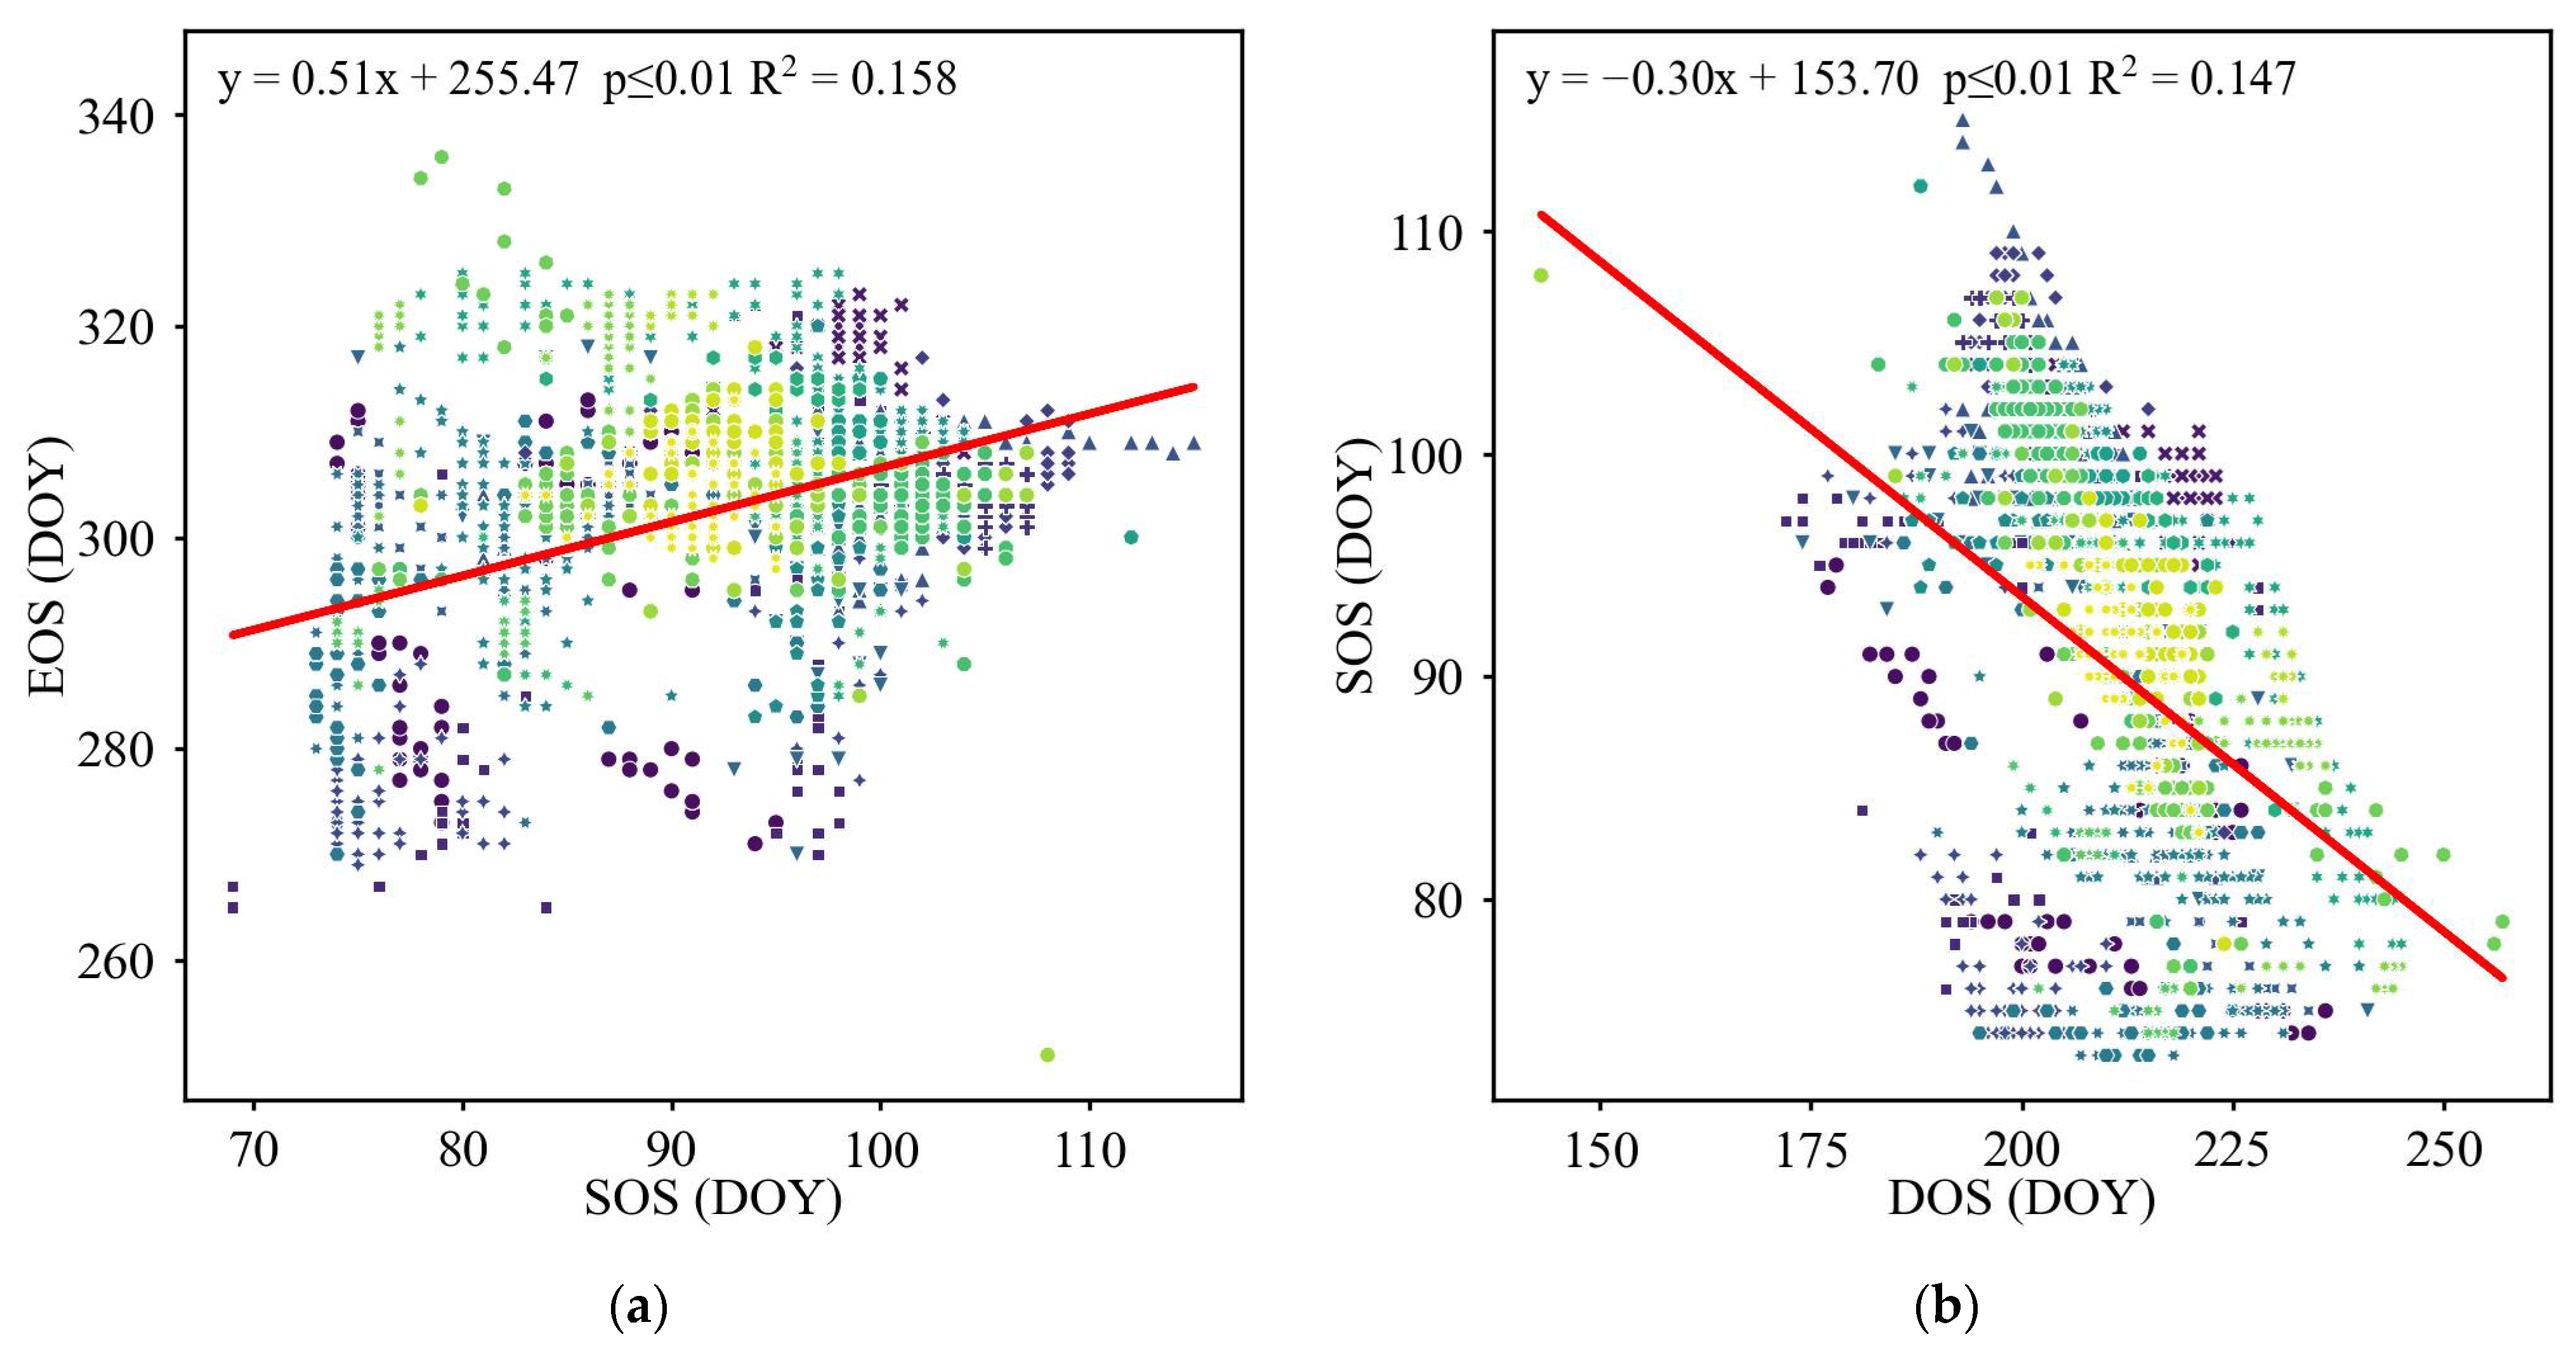
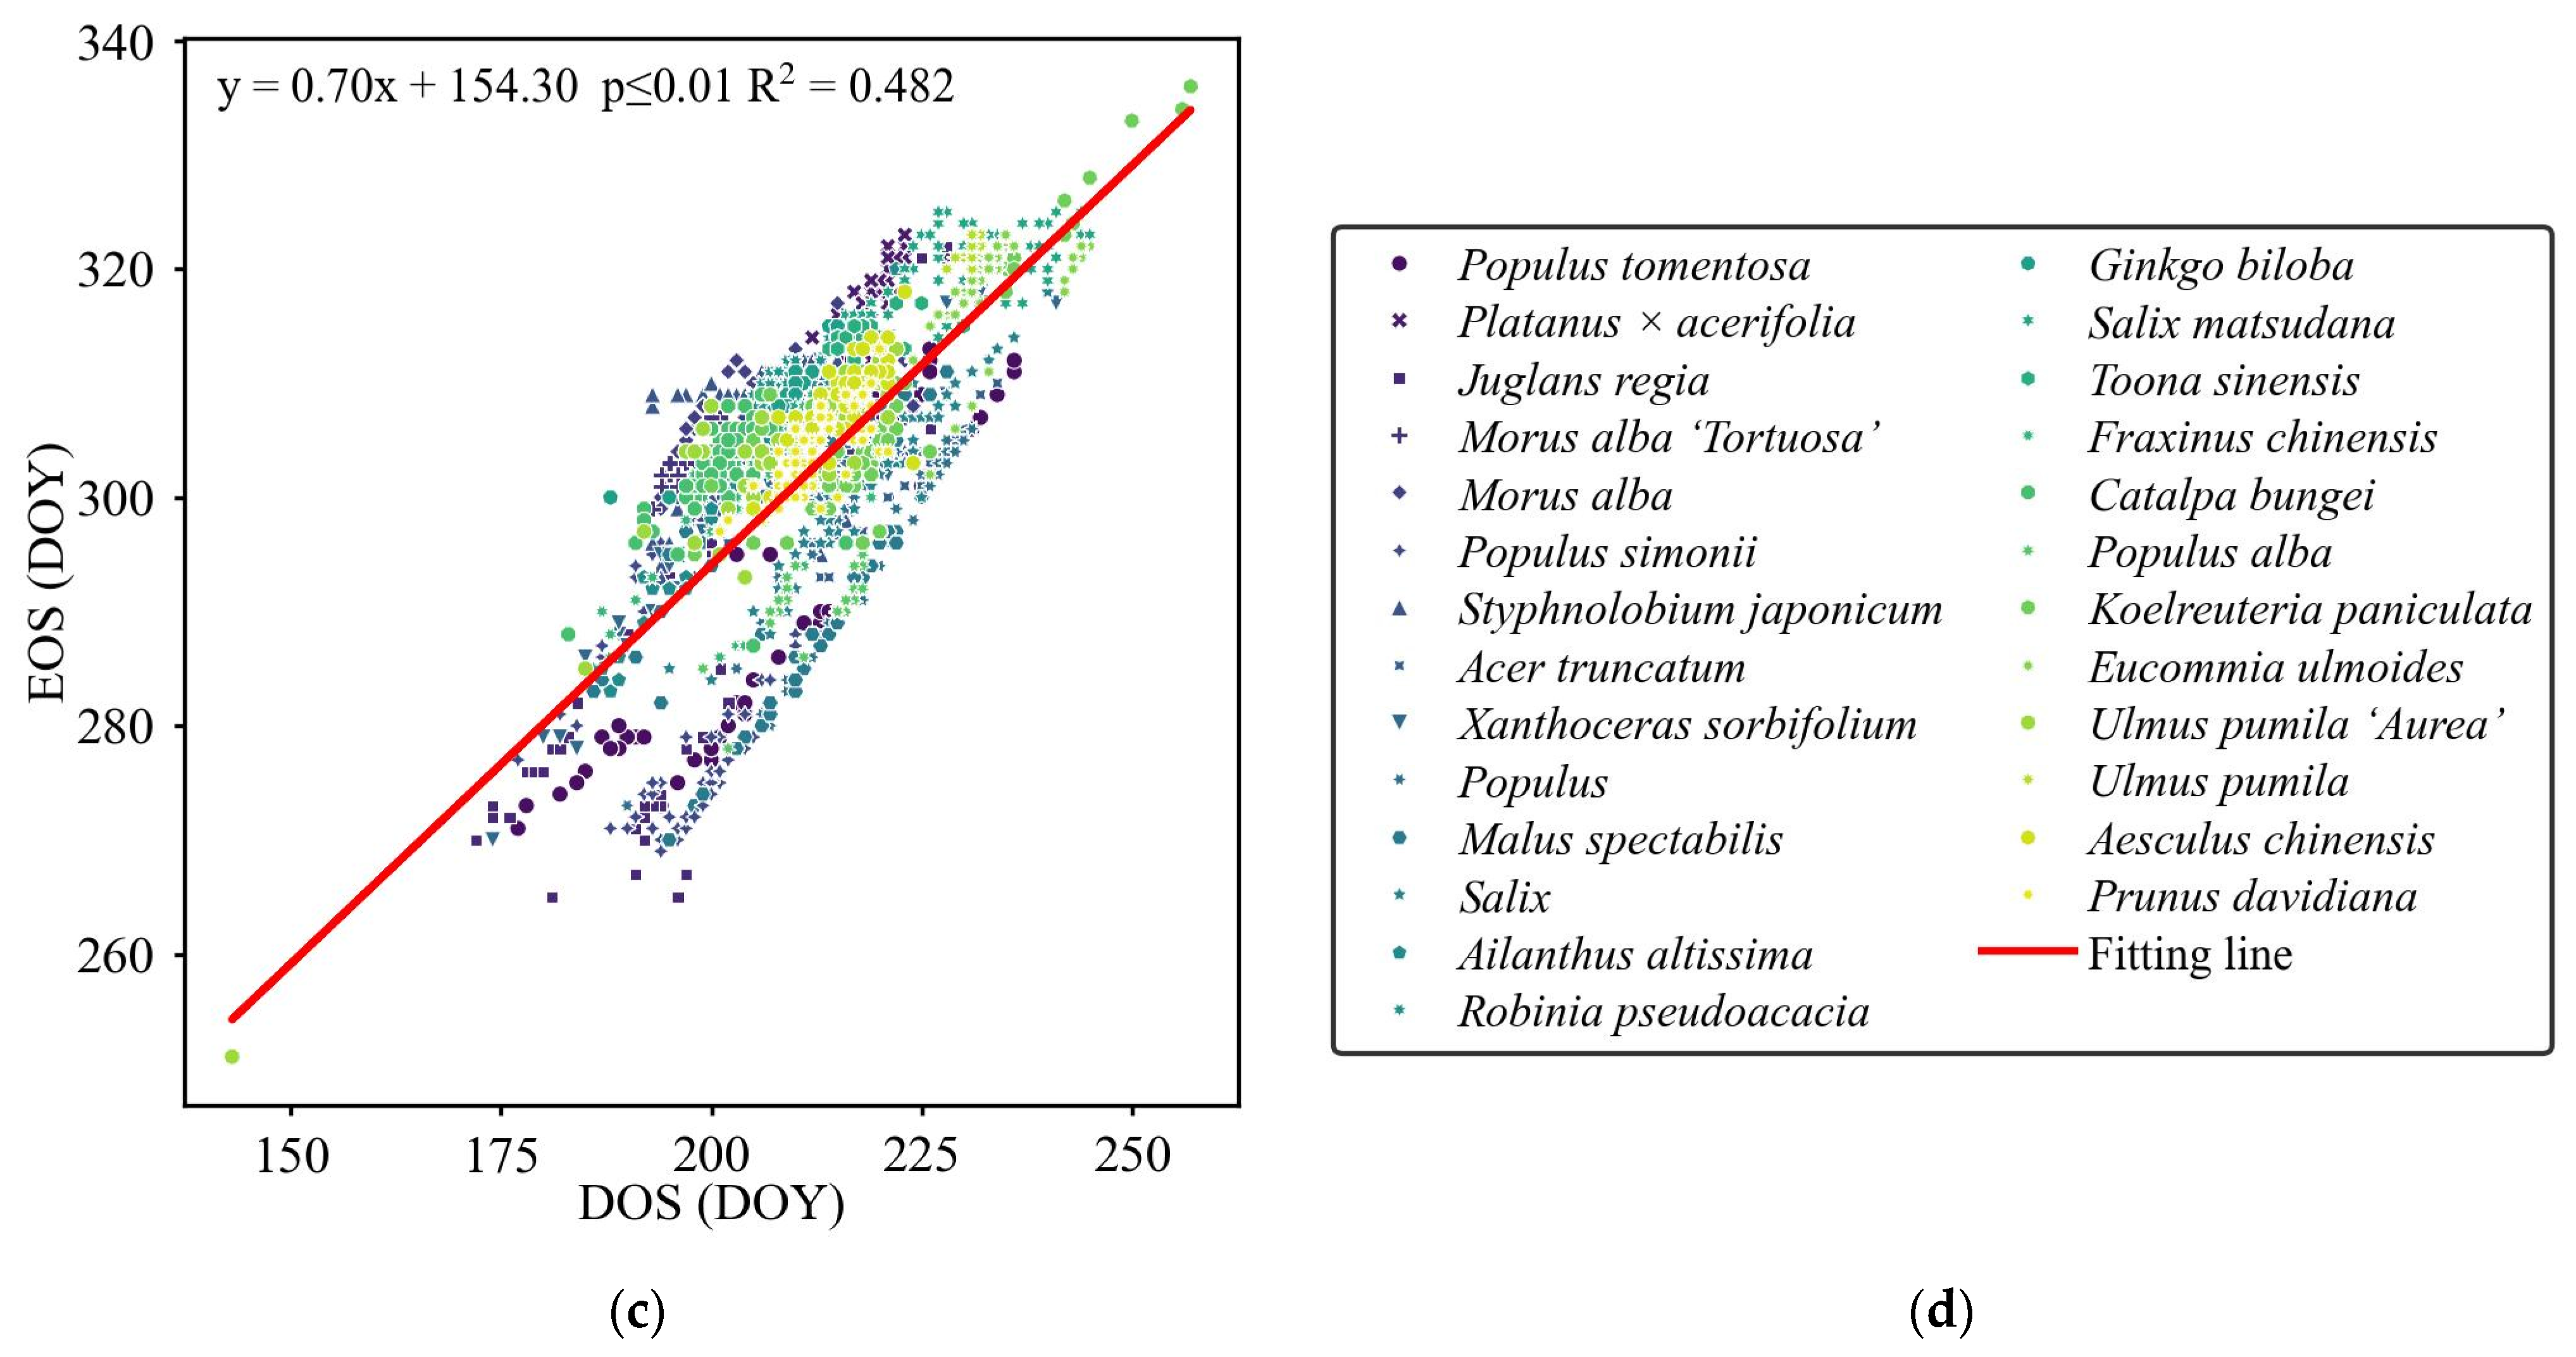
Before analyzing the anticipated CSPSRs, we need to first examine the relationships between the phenological traits and between the structural parameters to learn their self-correlations. The relatively weak correlations between the phenological traits are shown in Figure 8, also with the fitting lines marked out.
Figure 8.
Scatterplots of (a) EOS and SOS, (b) SOS and DOS, and (c) EOS and DOS, with the performance of regression analyses and the fitted lines listed. Note that the legend listed in (d) is available for (a–c).
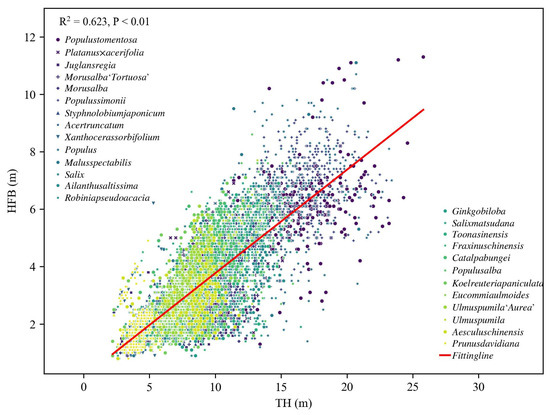
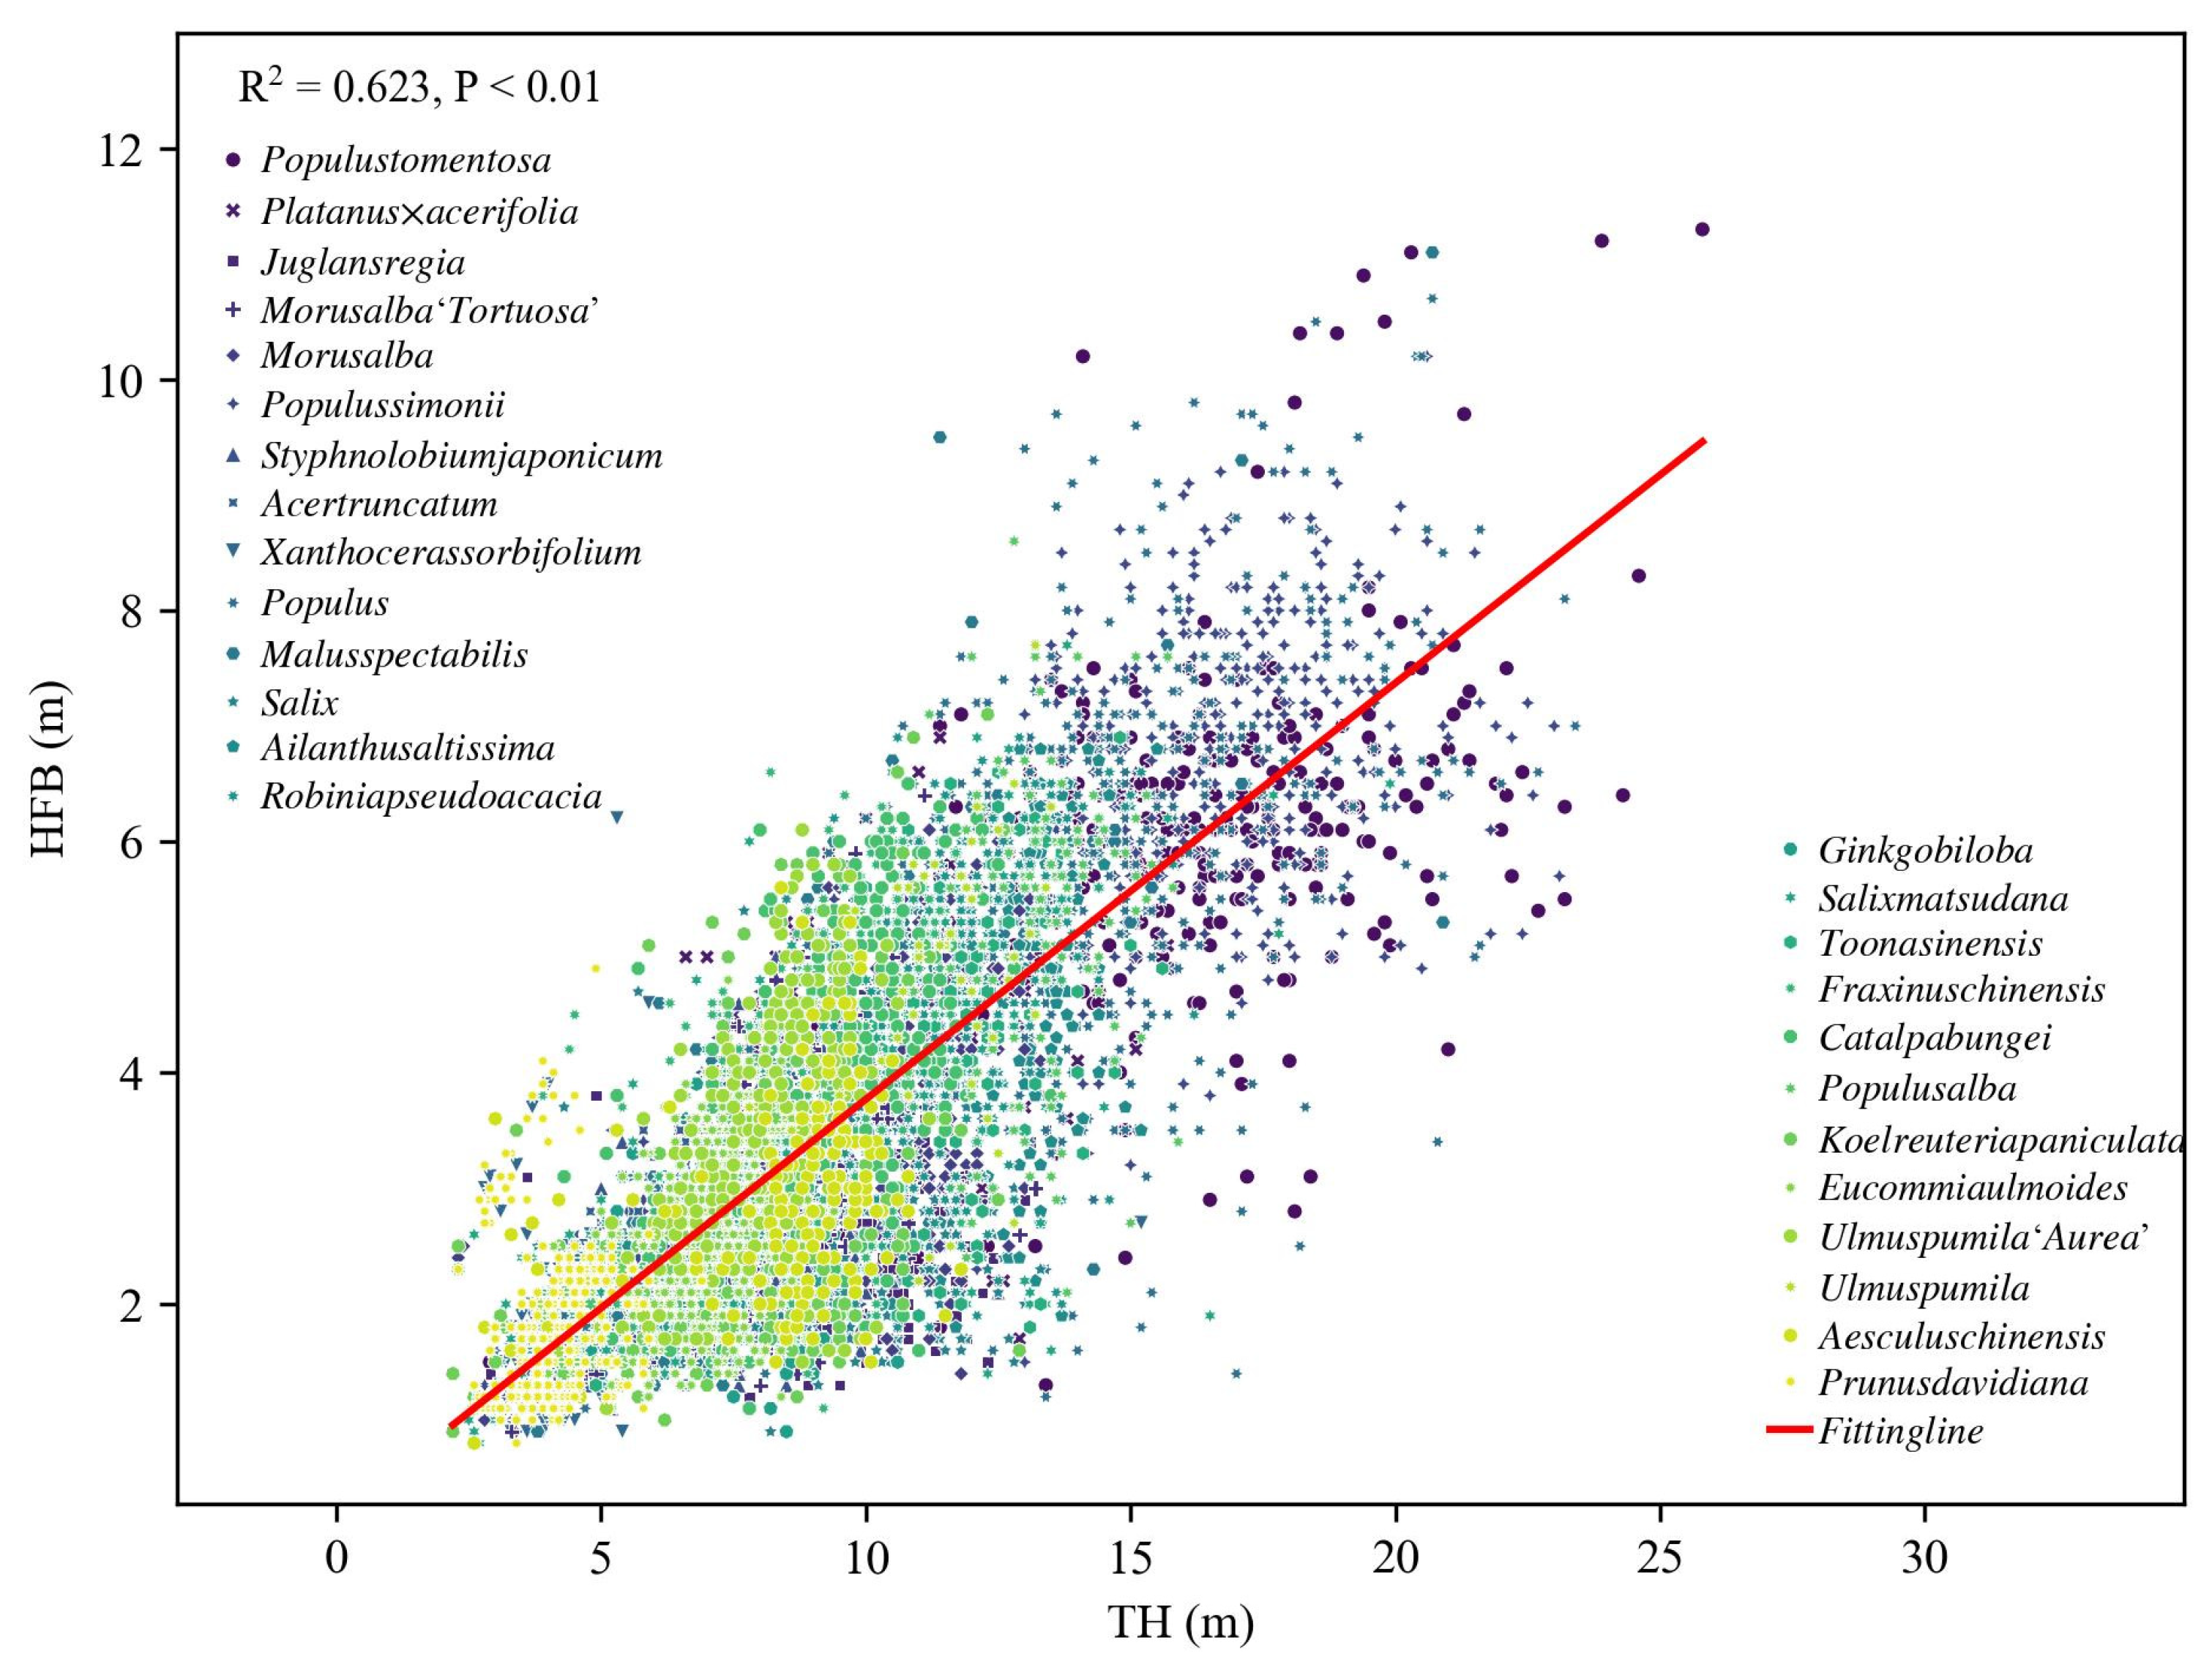
As regards the self-correlations between structural parameters, the situations are illustrated in Figure 9, in terms of HFB vs. TH. The results present self-correlations to some extent. With the self-correlations between those phenological traits (Figure 8) taken into account, we selected the approach of partial regression analysis to analyze the relationship between each of the phenological traits and each of the structural parameters.
Figure 9.
Scatterplots of HFB and TH for all of the considered tree species, with the performance of regression analysis listed.
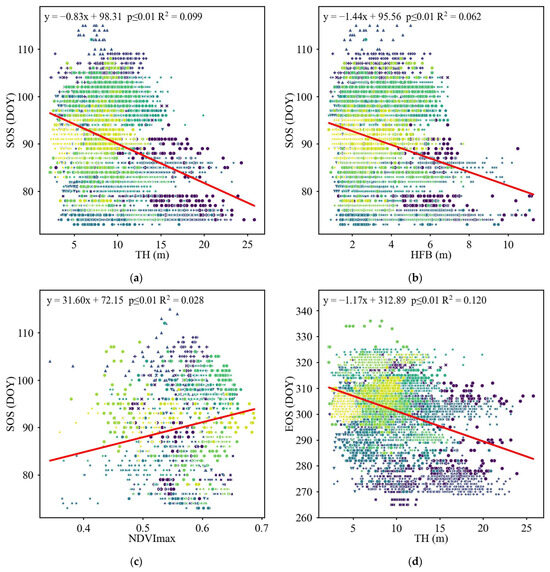
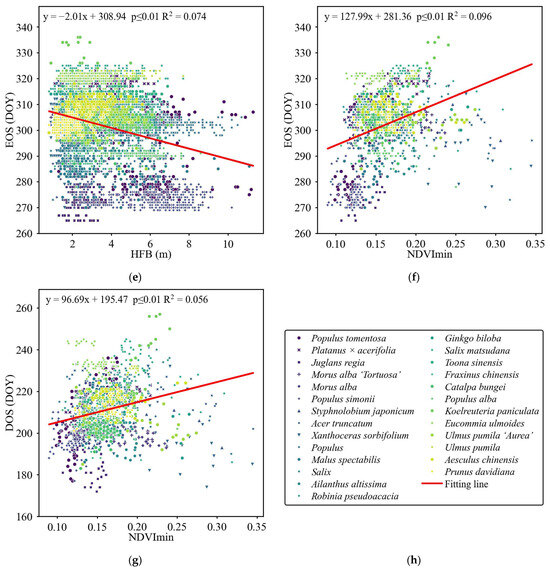
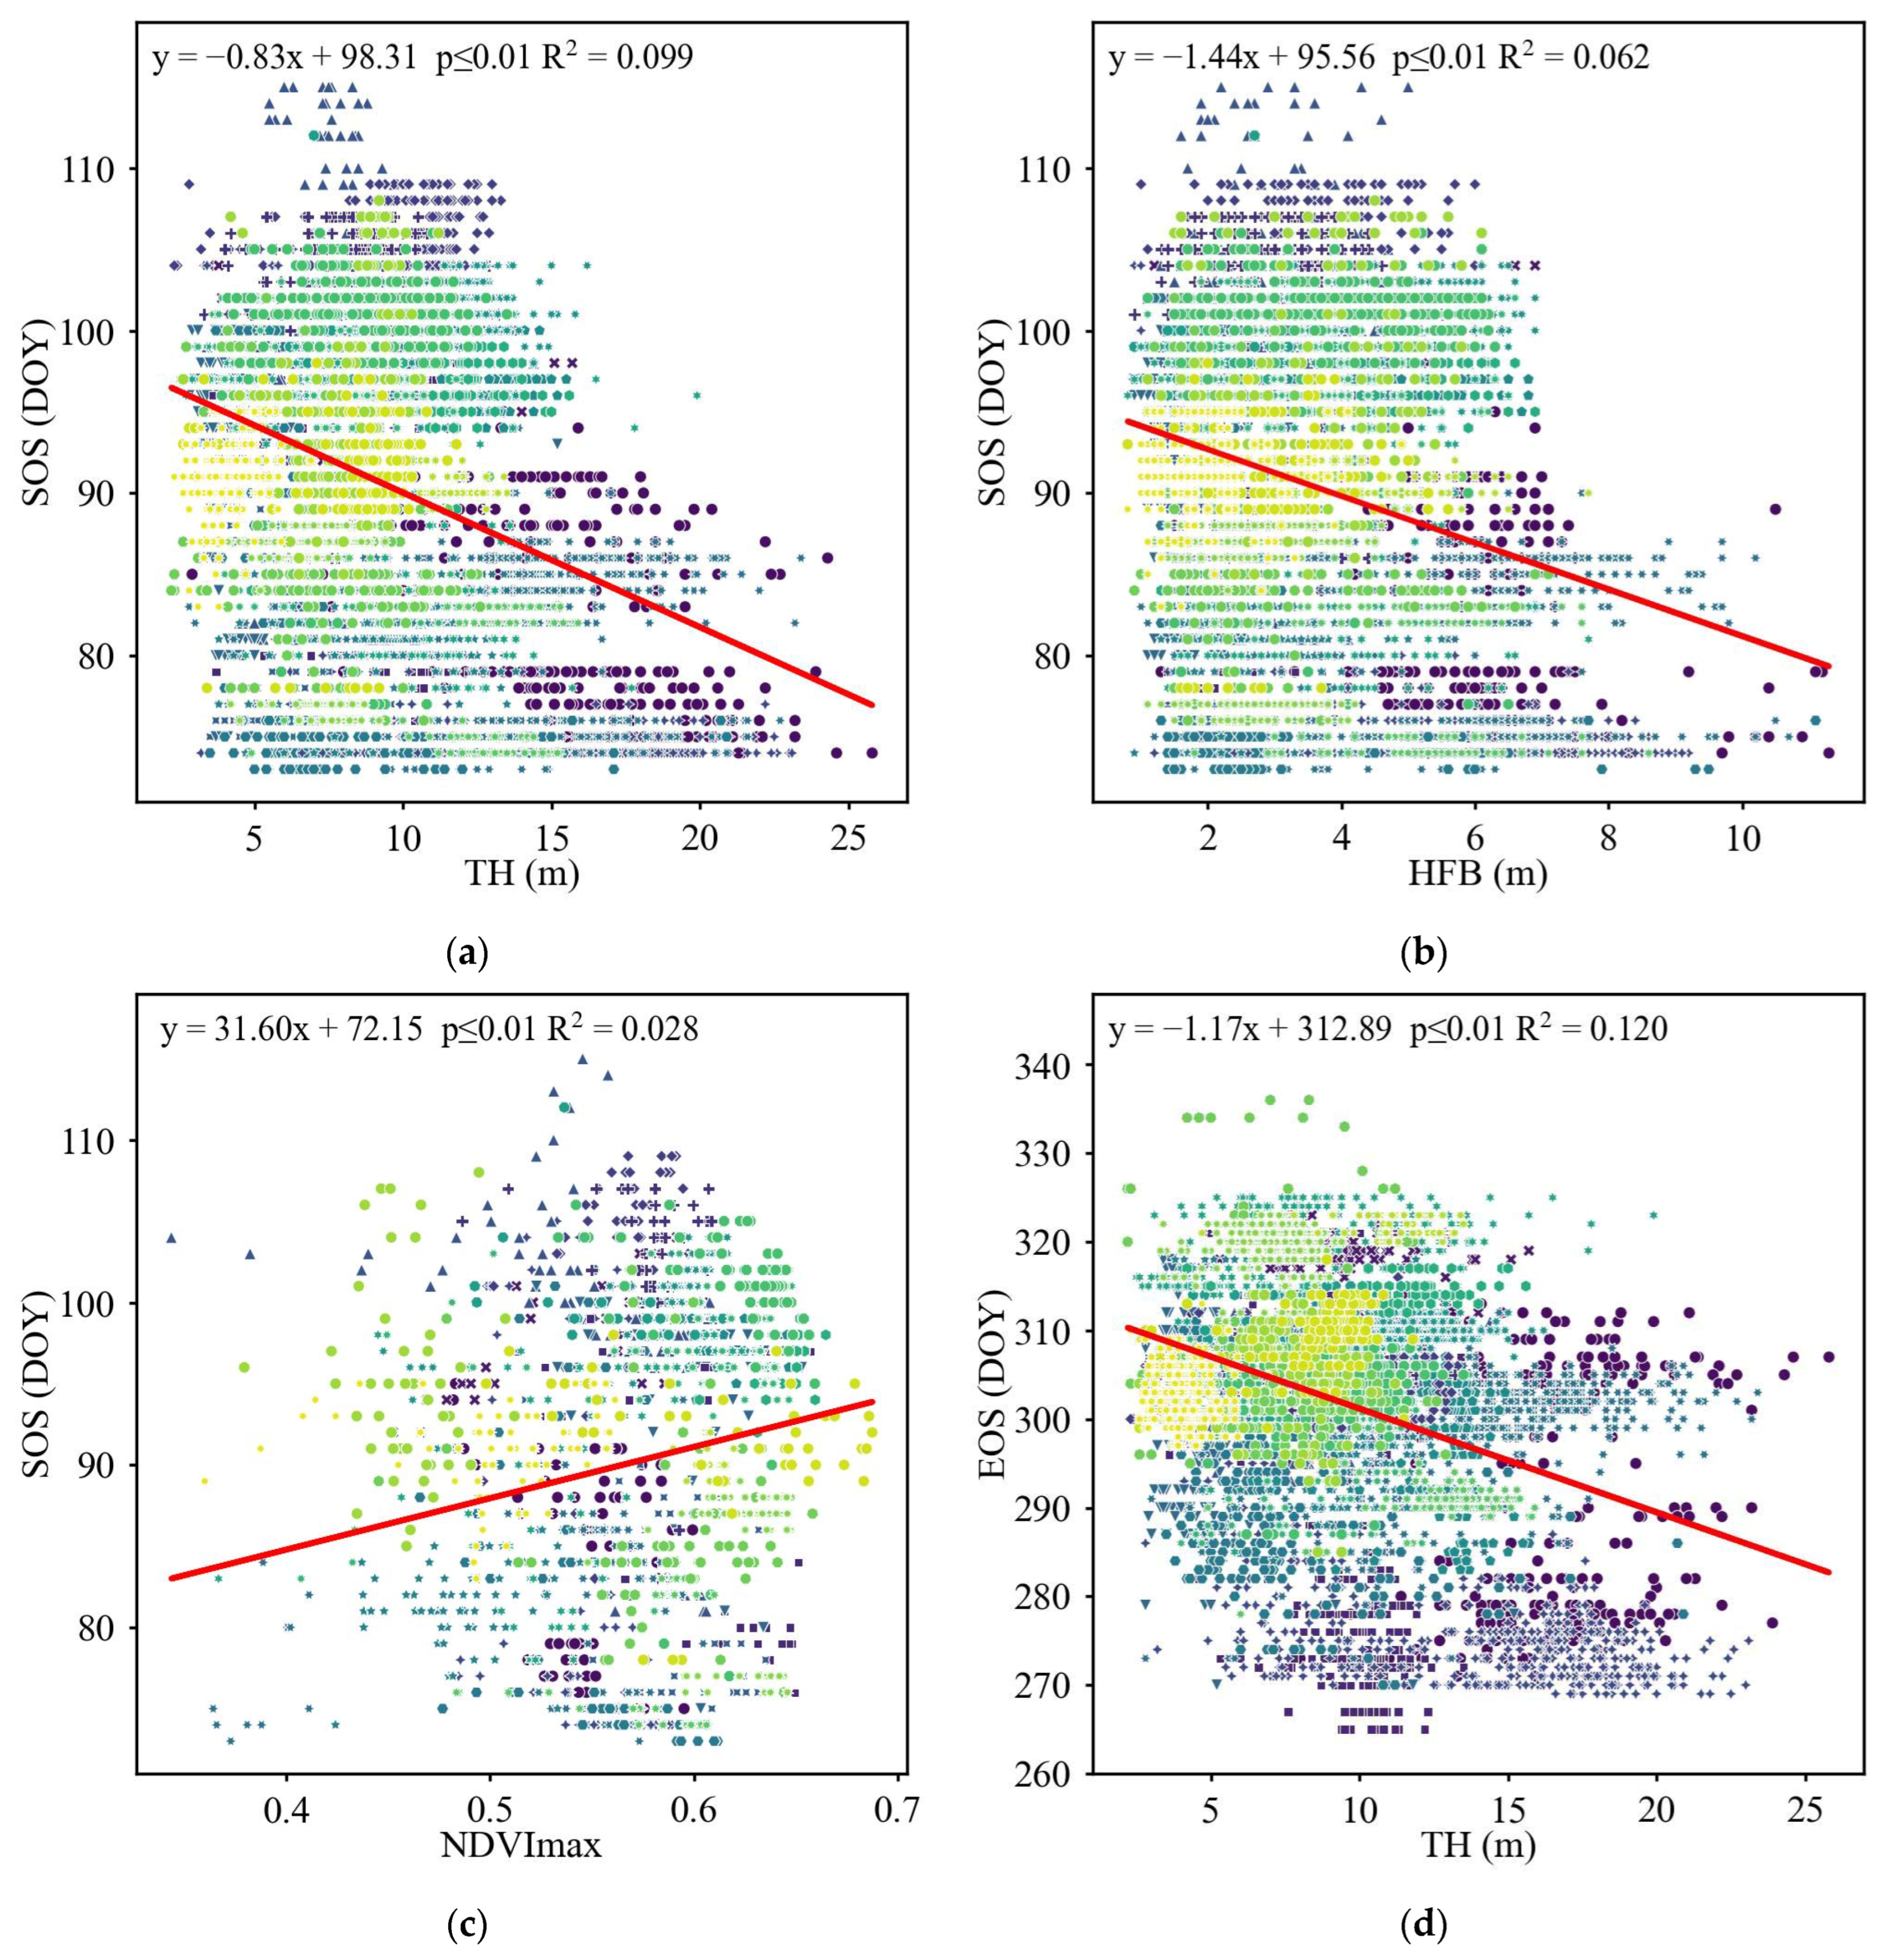
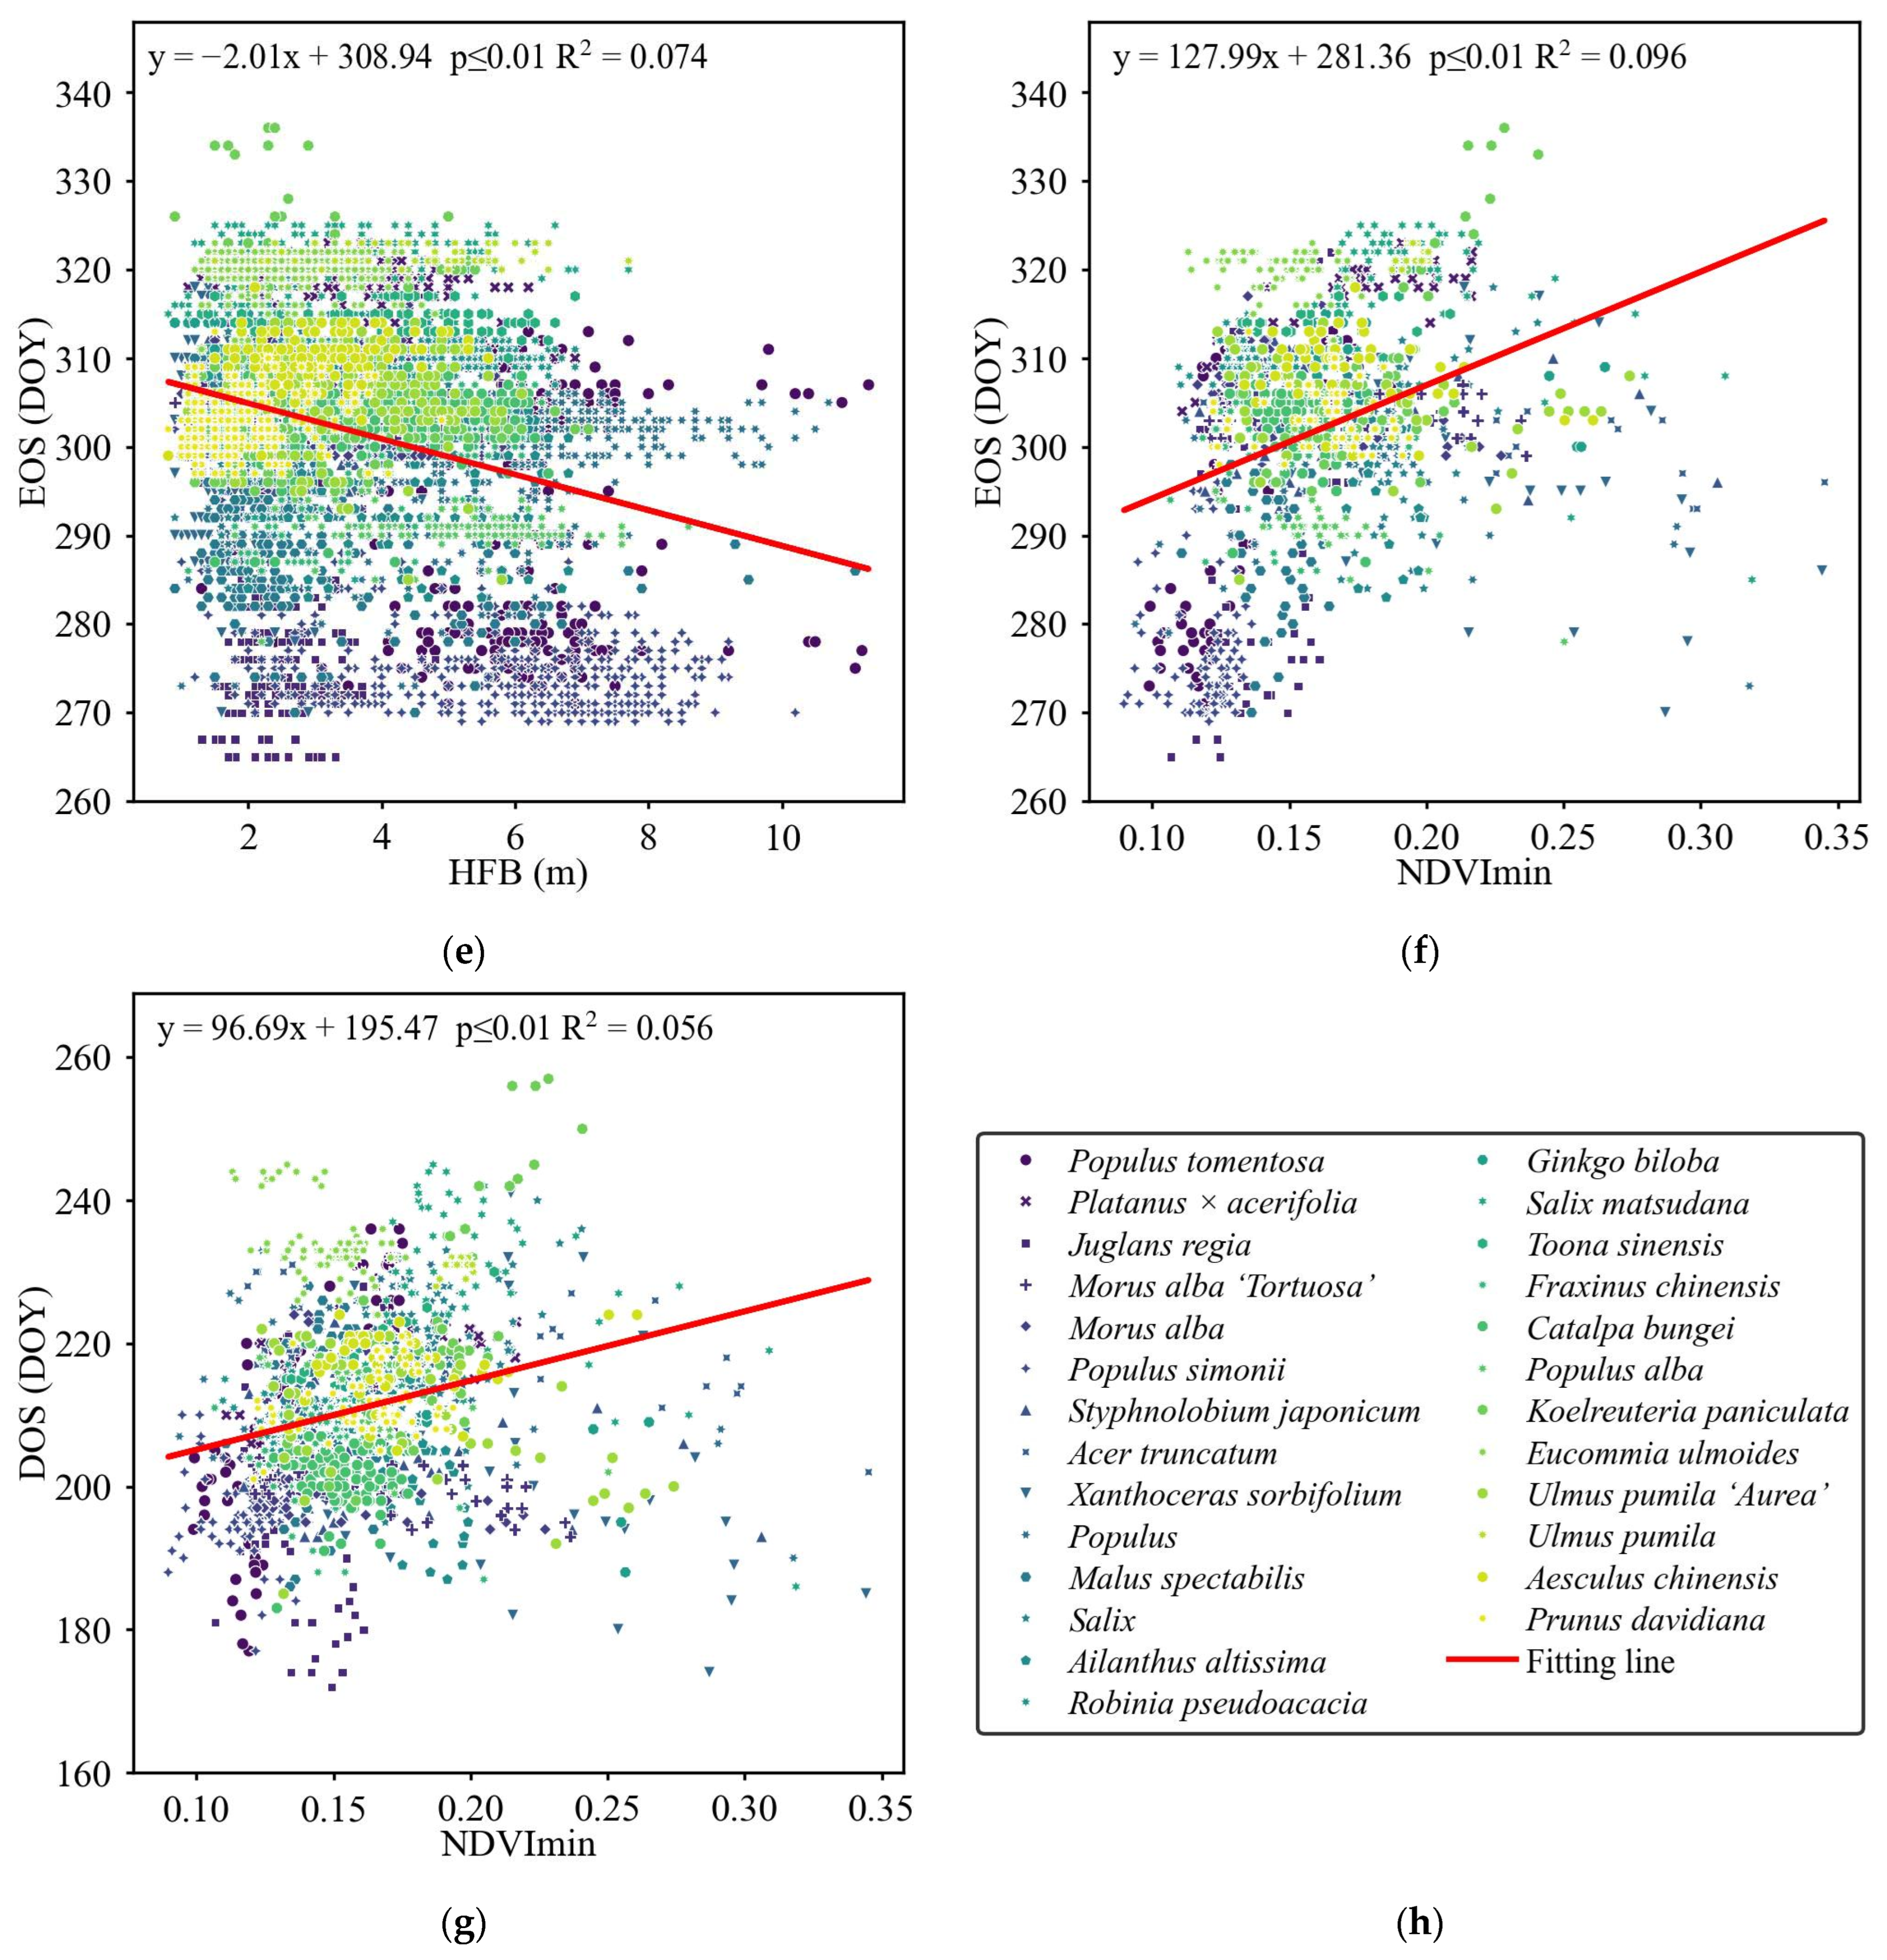
The correlations between the phenological traits and the structural parameters are illustrated in Figure 10. Most of the phenological–structural correlations are statistically weak, but some show weakly significant correlations, as illustrated in Figure 10d. Totally, based on the analysis of the correlation between individual tree structural parameters and SOS, SOS shows a significant weak negative correlation with tree height. For every 1 m increase in tree height, SOS advances by approximately 0.8 days. Based on the analysis of the correlation between individual tree structural parameters and EOS, EOS shows a significant weak negative correlation with tree height. For every 1 m increase in tree height, EOS advances by approximately 1 day.
Figure 10.
Scatterplots of (a) SOS and TH, (b) SOS and HFB, (c) SOS and NDVImax, (d) EOS and TH, (e) EOS and HFB, (f) EOS and NDVImin, and (g) DOS and NDVImin, with the performance of regression analyses and the fitted lines listed. Note that the legend listed in (h) is available for (a–g).
The timing of leaf falling exhibits significant phenological differentiation, spanning a period of 45 days (from 4 October to 18 November, from the day of year (DOY) 276 to DOY 322). Based on the timing of the end of leaf falling, three strategies can be learnt: resource conservation (such as Elm, Eucommia ulmoides, and Hankow Willow, whose leaves fall after November 13) maximizes carbon accumulation by extending the growing season; risk avoidance (such as Populus simonii, Juglans regia, and Populus tomentosa, whose leaves fall before October 20) enters dormancy early to avoid frost; and the balanced strategy (such as Ginkgo biloba, Acer truncatum, and Sophora japonica, whose leaves fall from the end of October to the beginning of November) is the mainstream (53.6%), achieving a balance between growth and stress resistance.
There are significant differences in phenological strategies among genera, with the greatest variation within the Salicaceae family (range of 41.8 days). The Salix genus (Salix matsudana, 318 days) grows leaves later than the Populus genus (Populus simonii, 276 days), reflecting the adaptive merit of “early germination and late defoliation”. The cultivated variety of Ulmus pumila, known as the Golden elm, leaves 16 days earlier than common Elm, indicating the changes in phenological rhythm caused by artificial selection. This result reveals the diverse deciduous phenological spectrum of tree species in urban parks, providing a reference for understanding the differentiated strategies of temperate woody plants in response to environmental stress.
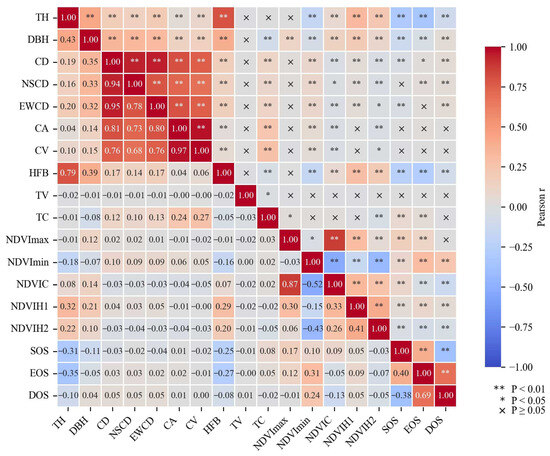
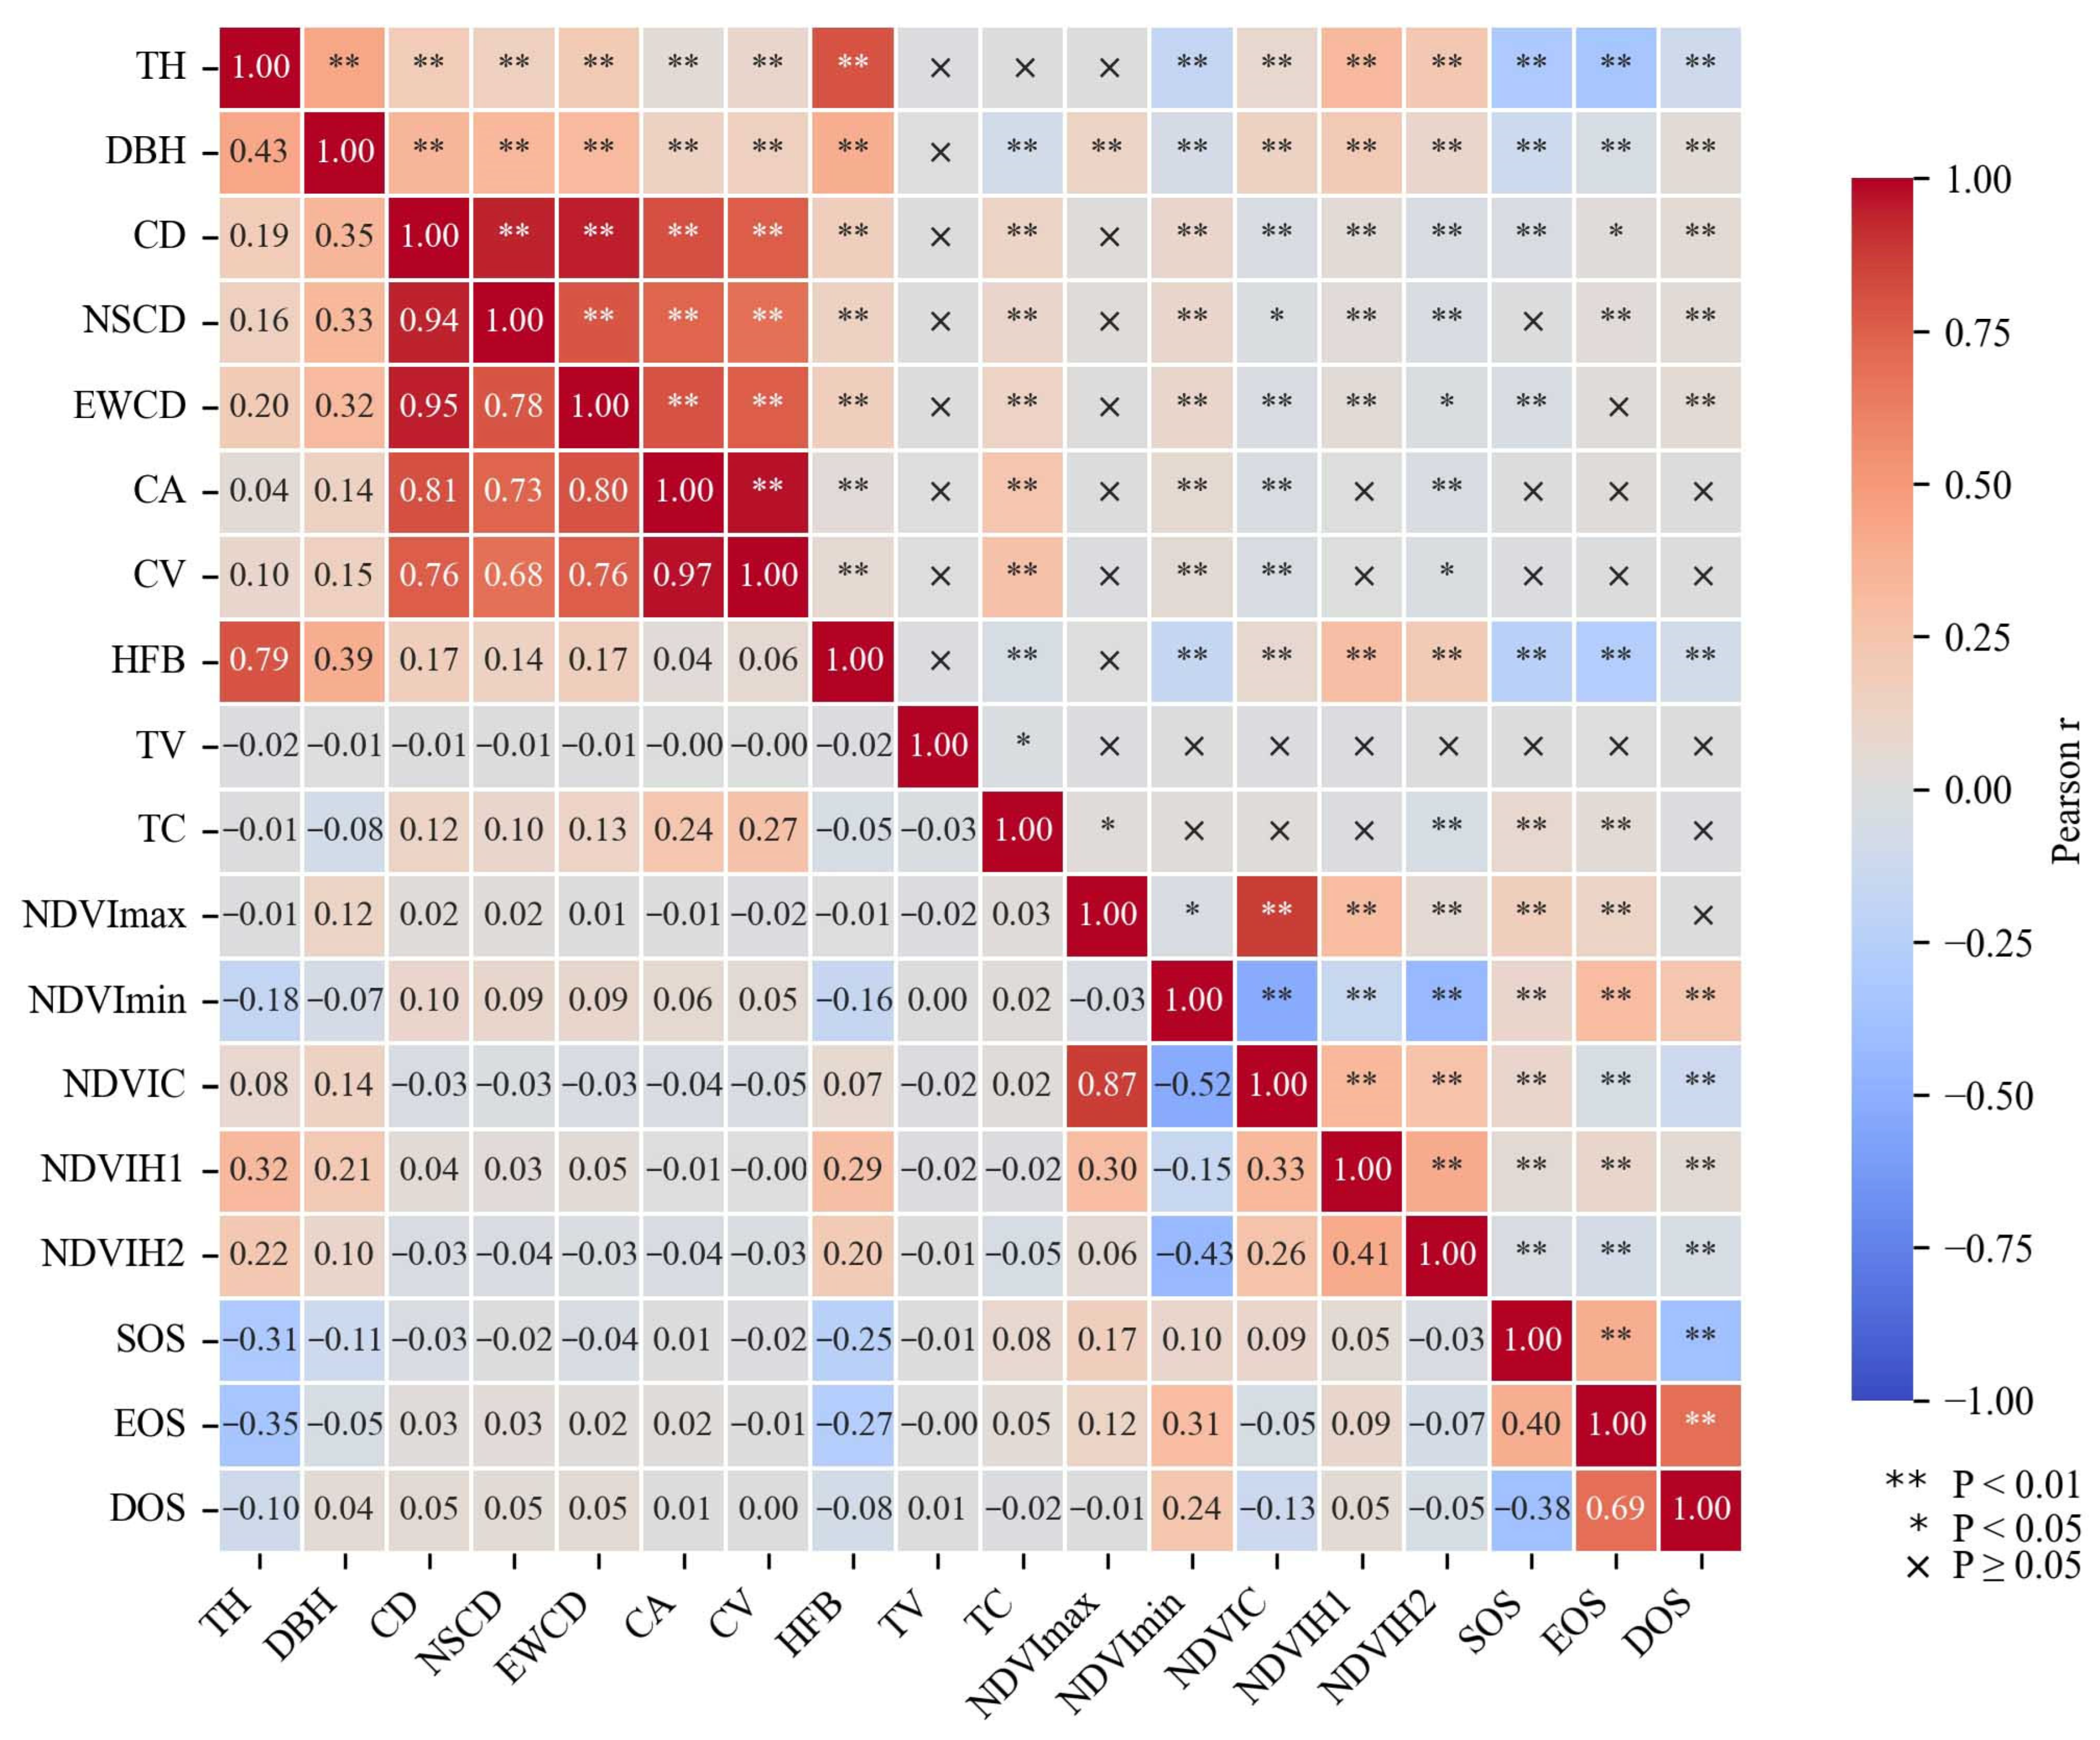
Further with the NDVI-related feature parameters considered, the correlation matrix is shown in Figure 11. The results suggest that the NDVI-related feature parameters show relatively stronger correlations with the phenological traits than the structural parameters. The reason is that the phenological metrics were derived from the NDVI amplitudes, as evidenced by their relatively higher correlations with the phenological traits. Thus, the structural feature parameters, albeit presenting weaker correlations with the phenological traits, may contribute to composing the model for the retrieval of phenological characteristics for urban park forests.
Figure 11.
Correlation matrix plot with significance levels between the phenological, structural, and NDVI-related feature parameters.
4. Discussion
This study outlines an efficient means for assessing the underlying linkages between the 3D structural characteristics of urban trees and their local-scale phenological dynamics, utilizing the synergistic potential of Sentinel-2 imagery and handheld LiDAR scanning data. By bridging the gap between highly detailed, individual structural measurements and synoptic, temporal plot-scale spectral observations, this research has preliminarily addressed a fundamental question in urban eco-physiology: how does tree architecture relate to its functions across scales in human-dominated environments?
The methodological integration proposed in this study is designed to disentangle the contributions of tree structure, species identity, and urban milieu to the observed seasonal trajectories of urban vegetation. Whether the results reveal strong predictive relationships or highlight the pervasive noise of urban forest heterogeneity, the findings will advance our understanding. Successful models would demonstrate the capacity to infer functional (phenological) behavior from structural inventories, a powerful tool for urban managers. Alternatively, findings that emphasize the disruptive impact of mixed pixels and micro-environmental variation will provide a key reality check for the application of moderate- and high-resolution satellites in fine-scale urban greenspace assessment and steer future technological and analytical developments.
The challenges inherent in the integration means, particularly the temporal mismatch between single-scan LiDAR and continuous phenological time series, point to clear future research avenues. These include the deployment of multi-temporal TLS or the emerging usages of drone-borne LiDAR and hyperspectral sensors for frequent, high-resolution monitoring of both structure and physiology [38]. Furthermore, expanding such studies across a broader range of cities and climate zones is essential to develop more generalized models of urban tree CSPSRs.
The integration of Sentinel-2 and handheld LiDAR data provides a multi-scale lens through which to examine the functional ecology of urban trees. Our proposed approach, irrespective of specific numerical outcomes, is designed to elucidate several important conceptual and practical discussions in urban RS and urban forestry.
Firstly, the observed relationships (or lack thereof) between plot-level structure and phenology will stimulate discussion on the scale and signal-mixing challenges inherent in urban RS [39]. If strong CSPSRs are found, it would suggest that the aggregated structural properties of a tree collective may be a dominant predictor of the spectral–phenological signal captured by a 10 m Sentinel-2 pixel. This would validate the use of a plot-scale structure as a proxy for predicting pixel-scale phenological behavior [40]. Conversely, weak CSPSRs would highlight the significant confounding effects of sub-pixel heterogeneity—such as the influence of grass phenology, shadows, and bare soil—on the satellite signal [41]. This would underscore the critical need for advanced unmixing techniques or the use of higher-resolution satellite data (e.g., from Planet Labs) to better isolate the tree-specific phenological signal in complex urban matrices [42].
Secondly, the role of tree species identity and diversity shall be a central point of discussion. Urban parks are often palettes of diverse species with differing phenological strategies and structural forms [43]. A model that significantly improves when species are included as a factor would reinforce the understanding that species-specific traits (e.g., deciduous vs. evergreen, diffuse- vs. ring-porous wood) are paramount [44]. It would also align with ecological studies emphasizing functional diversity over mere structural metrics in determining ecosystem function [45]. This presents some direct implications for urban planning. For example, selecting a mix of species with complementary structural and phenological properties could be a strategy to ensure continuous ecosystem service provision throughout the year [46].
Thirdly, the discussion will inevitably extend to the influence of the urban environment. Beyond intrinsic factors such as structure and species, extrinsic urban stressors modulate phenology. The urban heat island effect is a prime candidate factor to explain systematic deviations in phenometrics (e.g., prolonged DOS) across plots located in different parts of the city or parks with varying levels of impervious surface cover [47]. Our study design, which links plot-level RS data to the local environment, allows for hypothesizing how gradients in soil sealing, irrigation, or proximity to roads may weaken or even alter the peculiar CSPSRs. This interplay between the intrinsic biological attributes and extrinsic anthropogenic forcing is a hallmark of urban ecology [48].
From a methodological standpoint, the strengths and limitations of handheld LiDAR as a comprehensive structural descriptor need to be examined. While TLS can provide unparalleled 3D detail, it captures a static structural snapshot. Tree phenology, however, is dynamic; canopy structure in terms of leaf area and density tends to change throughout the season [49]. Our single seasonal handheld LiDAR scan may not represent the canopy condition at the times of SOS or EOS. This temporal disconnect is a recognized challenge in LiDAR phenology explorations [24]. Future research directions cued by this limitation include multi-temporal TLS campaigns or the use of dense time-series from drone-borne LiDAR to capture structural phenology (i.e., changes in 3D green biomass) and directly link it with spectral phenology [50].
Finally, the practical implications for urban forest management must be considered. If robust predictive models emerge, they suggest that a one-time TLS survey, combined with continuous free Sentinel-2 monitoring, could be used to map the functional status of urban forests. Managers could identify parks or zones where the canopy structure is typically associated with sub-optimal phenology (e.g., extremely short DOS), prompting targeted investigations into soil health, water availability, or pest pressures [51]. This integrated approach can support a shift from reactive to predictive, evidence-based urban forestry, enhancing resilience in the face of climate change [52].
5. Conclusions
In summary, urban forests are complex, dynamic systems requiring more innovative monitoring approaches. The combined use of Sentinel-2 imagery and handheld LiDAR data, as conceptualized in this study, represents a significant step toward a more holistic, mechanistic, and scalable understanding of urban tree health and service provision. By solidifying the cross-species link between tree structure and seasonal performance, this research ultimately contributes to the science-informed stewardship of urban ecosystems, further advancing the development of greener, more resilient, and more livable urban environments for the future.
Author Contributions
Conceptualization, M.J. and Y.L.; methodology, M.J.; software, Y.L.; validation, M.J.; formal analysis, Y.L.; investigation, M.J. and M.C.; writing—original draft preparation, Y.L.; writing—review and editing, M.J.; funding acquisition, Y.L. All authors have read and agreed to the published version of the manuscript.
Funding
This research was funded by the National Key Research and Development Program of China (grant number 2022YFE0112700) and the National Natural Science Foundation of China (grant number 32171782).
Data Availability Statement
The data that support the findings of this study are available from the corresponding author upon reasonable request.
Acknowledgments
Thank the anonymous reviewers for making the constructive comments.
Conflicts of Interest
The authors declare no conflicts of interest. The funders had no role in the design of the study; in the collection, analyses, or interpretation of data; in the writing of the manuscript; or in the decision to publish the results.
Abbreviations
The following abbreviations are used in this manuscript:
| CSPSR | Cross-Species Phenological–Structural Relationship |
| NDVI | Normalized Difference Vegetation Index |
| TH | Tree Height |
| DBH | Diameter at Breast Height |
| CD | Crown Diameter |
| NSCD | North–South Crown Diameter |
| EWCD | East–West Crown Diameter |
| CA | Crown Area |
| CV | Crown Volume |
| HFB | Height to First Branch |
| TV | Trunk Volume |
| TC | Trunk Curvature |
| NDVImax | The maximum value of NDVI throughout the year |
| NDVImin | The minimum value of NDVI throughout the year |
| NDVIC | The NDVI change value from NDVImin to NDVImax |
| NDVIH1 | Homogeneity of NDVImax |
| NDVIH2 | Homogeneity of NDVImin |
| SOS | Start of Season |
| EOS | End of Season |
| DOS | Duration of Season |
References
- Pataki, D.E.; Alberti, M.; Cadenasso, M.L.; Felson, A.J.; McDonnell, M.J.; Pincetl, S.; Pouyat, R.V.; Setälä, H.; Whitlow, T.H. The benefits and limits of urban tree planting for environmental and human health. Front. Ecol. Evol. 2021, 9, 603757. [Google Scholar] [CrossRef] [Scilit]
- Roy, S.; Byrne, J.; Pickering, C. A systematic quantitative review of urban tree benefits, costs, and assessment methods across cities in different climatic zones. Urban For. Urban Green. 2012, 11, 351–363. [Google Scholar] [CrossRef] [Scilit]
- Richardson, A.D.; Keenan, T.F.; Migliavacca, M.; Ryu, Y.; Sonnentag, O.; Toomey, M. Climate change, phenology, and phenological control of vegetation feedbacks to the climate system. Agric. For. Meteorol. 2013, 169, 156–173. [Google Scholar] [CrossRef] [Scilit]
- Gough, C.M.; Atkins, J.W.; Fahey, R.T.; Hardiman, B.S.; LaRue, E.A. Community and structural constraints on the complexity of eastern North American forests. Glob. Ecol. Biogeogr. 2020, 29, 2107–2118. [Google Scholar] [CrossRef] [Scilit]
- Esperon-Rodriguez, M.; Tjoelker, M.G.; Lenoir, J.; Baumgartner, J.B.; Beaumont, L.J.; Nipperess, D.A.; Power, S.A.; Richard, B.; Rymer, P.D.; Gallagher, R.V. Climate change increases global risk to urban forests. Nat. Clim. Change 2022, 12, 950–955. [Google Scholar] [CrossRef] [Scilit]
- Zhou, W.; Qian, Y.; Li, X.; Li, W.; Han, L. Relationships between land cover and the surface urban heat island: Seasonal variability and effects of spatial and thematic resolution of land cover data on predicting land surface temperatures. Landsc. Ecol. 2014, 29, 153–167. [Google Scholar] [CrossRef] [Scilit]
- Meng, L.; Mao, J.; Zhou, Y.; Richardson, A.D.; Lee, X.; Thornton, P.E.; Ricciuto, D.M.; Li, X.; Dai, Y.; Shi, X.; et al. Urban warming advances spring phenology but reduces the response of phenology to temperature in the conterminous United States. Proc. Natl. Acad. Sci. USA 2020, 117, 4228–4233. [Google Scholar] [CrossRef] [Scilit] [PubMed]
- Li, X.; Zhou, Y.; Asrar, G.R.; Zhu, Z. Developing a 1 km resolution daily air temperature dataset for urban and surrounding areas in the conterminous United States. Remote Sens. Environ. 2018, 215, 74–84. [Google Scholar] [CrossRef] [Scilit]
- Moskal, L.M.; Zheng, G. Retrieving forest inventory variables with terrestrial laser scanning (TLS) in urban heterogeneous forest. Remote Sens. 2012, 4, 1–20. [Google Scholar] [CrossRef] [Scilit]
- Alonzo, M.; Bookhagen, B.; Roberts, D.A. Urban tree species mapping using hyperspectral and lidar data fusion. Remote Sens. Environ. 2014, 148, 70–83. [Google Scholar] [CrossRef] [Scilit]
- Drusch, M.; Del Bello, U.; Carlier, S.; Colin, O.; Fernandez, V.; Gascon, F.; Hoersch, B.; Isola, C.; Laberinti, P.; Martimort, P.; et al. Sentinel-2: ESA’s optical high-resolution mission for GMES operational services. Remote Sens. Environ. 2012, 120, 25–36. [Google Scholar] [CrossRef] [Scilit]
- Frampton, W.J.; Dash, J.; Watmough, G.; Milton, E.J. Evaluating the capabilities of Sentinel-2 for quantitative estimation of biophysical variables in vegetation. ISPRS J. Photogramm. Remote Sens. 2013, 82, 83–92. [Google Scholar] [CrossRef] [Scilit]
- White, K.; Pontius, J.; Schaberg, P. Remote sensing of spring phenology in northeastern forests: A comparison of methods, field metrics and sources of uncertainty. Remote Sens. Environ. 2014, 148, 97–107. [Google Scholar] [CrossRef] [Scilit]
- Bolton, D.K.; Gray, J.M.; Melaas, E.K.; Moon, M.; Eklundh, L.; Friedl, M.A. Continental-scale land surface phenology from harmonized Landsat 8 and Sentinel-2 imagery. Remote Sens. Environ. 2020, 240, 111685. [Google Scholar] [CrossRef] [Scilit]
- Myint, S.W.; Gober, P.; Brazel, A.; Grossman-Clarke, S.; Weng, Q. Per-pixel vs. object-based classification of urban land cover extraction using high spatial resolution imagery. Remote Sens. Environ. 2011, 115, 1145–1161. [Google Scholar] [CrossRef] [Scilit]
- Kükenbrink, D.; Marty, M.; Rehush, N.; Abegg, M.; Ginzler, C. Evaluating the potential of handheld mobile laser scanning for an operational inclusion in a national forest inventory—A Swiss case study. Remote Sens. Environ. 2025, 321, 114685. [Google Scholar] [CrossRef] [Scilit]
- Winberg, O.; Pyörälä, J.; Yu, X.; Kaartinen, H.; Kukko, A.; Holopainen, M.; Holmgren, J.; Lehtomäki, M.; Hyyppä, J. Branch information extraction from Norway spruce using handheld laser scanning point clouds in Nordic forests. ISPRS Open J. Photogramm. Remote Sens. 2023, 9, 100040. [Google Scholar] [CrossRef] [Scilit]
- Yang, J.; Yuan, W.; Lu, H.; Liu, Y.; Wang, Y.; Sun, L.; Li, S.; Li, H. Assessing the performance of handheld laser scanning for individual tree mapping in an urban area. Forests 2024, 15, 575. [Google Scholar] [CrossRef] [Scilit]
- Sofia, S.; Maetzke, F.G.; Crescimanno, M.; Coticchio, A.; La Mela Veca, D.S.; Galati, A. The efficiency of LiDAR HMLS scanning in monitoring forest structure parameters: Implications for sustainable forest management. EuroMed J. Bus. 2022, 17, 350–373. [Google Scholar] [CrossRef] [Scilit]
- Mak, N.P.L.; Siu, T.Y.; Law, Y.K.; Zhang, H.; Sui, S.; Yip, F.T.; Ng, Y.S.; Ye, Y.; Cheung, T.C.; Wa, K.C. Mapping individual tree- and plot-level biomass using handheld mobile laser scanning in complex subtropical secondary and old-growth forests. Remote Sens. 2025, 17, 1354. [Google Scholar] [CrossRef] [Scilit]
- Wang, M.; Wong, M.S.; Abbas, S. Tropical species classification with structural traits using handheld laser scanning data. Remote Sens. 2022, 14, 1948. [Google Scholar] [CrossRef] [Scilit]
- Dassot, M.; Constant, T.; Fournier, M. The use of terrestrial LiDAR technology in forest science: Application fields, benefits and challenges. Ann. For. Sci. 2011, 68, 959–974. [Google Scholar] [CrossRef] [Scilit]
- Calders, K.; Newnham, G.; Burt, A.; Murphy, S.; Raumonen, P.; Herold, M.; Culvenor, D.; Avitabile, V.; Disney, M.; Armston, J.; et al. Nondestructive estimates of above-ground biomass using terrestrial laser scanning. Methods Ecol. Evol. 2015, 6, 198–208. [Google Scholar] [CrossRef] [Scilit]
- Salas, E.A.L. Waveform LiDAR concepts and applications for potential vegetation phenology monitoring and modeling: A comprehensive review. Geo-Spat. Inf. Sci. 2021, 24, 179–200. [Google Scholar] [CrossRef] [Scilit]
- Disney, M. Terrestrial LiDAR: A three-dimensional revolution in how we look at trees. New Phytol. 2019, 222, 1736–1741. [Google Scholar] [CrossRef] [Scilit]
- Main-Knorn, M.; Pflug, B.; Louis, J.; Debaecker, V.; Müller-Wilm, U.; Gascon, F. Sen2Cor for sentinel-2. In Proceedings of the SPIE Remote Sensing, Warsaw, Poland, 11–14 September 2017; Volume 10427, pp. 37–48. [Google Scholar]
- Louis, J.; Pflug, B.; Main-Knorn, M.; Debaecker, V.; Mueller-Wilm, U.; Iannone, R.Q.; Cadau, E.G.; Boccia, V.; Gascon, F. Sentinel-2 global surface reflectance Level-2A product generated with Sen2Cor. In Proceedings of the IGARSS 2019—2019 IEEE International Symposium on Geoscience and Remote Sensing, Yokohama, Japan, 28 July–2 August 2019; pp. 8522–8525. [Google Scholar]
- Wu, C.; Peng, D.; Soudani, K.; Siebicke, L.; Gough, C.M.; Arain, M.A.; Bohrer, G.; Lafleur, P.M.; Peichl, M.; Gonsamo, A.; et al. Land surface phenology derived from normalized difference vegetation index (NDVI) at global FLUXNET sites. Agric. For. Meteorol. 2017, 233, 171–182. [Google Scholar] [CrossRef] [Scilit]
- Chen, J.; Jönsson, P.; Tamura, M.; Gu, Z.; Matsushita, B.; Eklundh, L. A simple method for reconstructing a high-quality NDVI time-series data set based on the Savitzky–Golay filter. Remote Sens. Environ. 2004, 91, 332–344. [Google Scholar] [CrossRef] [Scilit]
- Eilers, P.H. A perfect smoother. Anal. Chem. 2003, 75, 3631–3636. [Google Scholar] [CrossRef] [Scilit] [PubMed]
- Zhang, X.; Friedl, M.A.; Schaaf, C.B.; Strahler, A.H.; Hodges, J.C.; Gao, F.; Reed, B.C.; Huete, A. Monitoring vegetation phenology using MODIS. Remote Sens. Environ. 2003, 84, 471–475. [Google Scholar] [CrossRef] [Scilit]
- Guan, H.; Su, Y.; Sun, X.; Xu, G.; Li, W.; Ma, Q.; Wu, X.; Wu, J.; Liu, L.; Guo, Q. A marker-free method for registering multi-scan terrestrial laser scanning data in forest environments. ISPRS J. Photogramm. Remote Sens. 2020, 166, 82–94. [Google Scholar] [CrossRef] [Scilit]
- Li, W.; Guo, Q.; Jakubowski, M.K.; Kelly, M. A new method for segmenting individual trees from the lidar point cloud. Photogramm. Eng. Remote Sens. 2012, 78, 75–84. [Google Scholar] [CrossRef] [Scilit]
- Tao, S.; Wu, F.; Guo, Q.; Wang, Y.; Li, W.; Xue, B.; Hu, X.; Li, P.; Tian, D.; Li, C.; et al. Segmenting tree crowns from terrestrial and mobile LiDAR data by exploring ecological theories. ISPRS J. Photogramm. Remote Sens. 2015, 110, 66–76. [Google Scholar] [CrossRef] [Scilit]
- Burt, A.; Disney, M.; Calders, K. Extracting individual trees from lidar point clouds using treeseg. Methods Ecol. Evol. 2019, 10, 438–445. [Google Scholar] [CrossRef] [Scilit]
- Béland, M.; Widlowski, J.L.; Fournier, R.A. A model for deriving voxel-level tree leaf area density estimates from ground-based LiDAR. Environ. Model. Softw. 2014, 51, 184–189. [Google Scholar] [CrossRef] [Scilit]
- Lin, Y.; Jiang, M. A new algorithm for MLS-based DBH mensuration and its preliminary validation in an urban boreal forest: Aiming at one cornerstone of allometry-based forest biometrics. Remote Sens. 2018, 10, 749. [Google Scholar] [CrossRef] [Scilit]
- de Almeida, D.R.A.; Broadbent, E.N.; Ferreira, M.P.; Meli, P.; Zambrano, A.M.A.; Gorgens, E.B.; Resende, A.F.; de Almeida, C.T.; do Amaral, C.H.; Corte, A.P.D.; et al. Monitoring restored tropical forest diversity and structure through UAV-borne hyperspectral and lidar fusion. Remote Sens. Environ. 2021, 264, 112582. [Google Scholar] [CrossRef] [Scilit]
- Peng, Z.; Jiang, D.; Li, W.; Mu, Q.; Li, X.; Cao, W.; Shi, Z.; Chen, T.; Huang, J. Impacts of the scale effect on quantifying the response of spring vegetation phenology to urban intensity. Remote Sens. Environ. 2024, 315, 114485. [Google Scholar] [CrossRef] [Scilit]
- Huang, Z.; Zhong, L.; Zhao, F.; Wu, J.; Tang, H.; Lv, Z.; Xu, B.; Zhou, L.; Sun, R.; Meng, R. A spectral-temporal constrained deep learning method for tree species mapping of plantation forests using time series Sentinel-2 imagery. ISPRS J. Photogramm. Remote Sens. 2023, 204, 397–420. [Google Scholar] [CrossRef] [Scilit]
- Burchard-Levine, V.; Nieto, H.; Riaño, D.; Migliavacca, M.; El-Madany, T.S.; Guzinski, R.; Carrara, A.; Martín, M.P. The effect of pixel heterogeneity for remote sensing based retrievals of evapotranspiration in a semi-arid tree-grass ecosystem. Remote Sens. Environ. 2021, 260, 112440. [Google Scholar] [CrossRef] [Scilit]
- Hu, M.; Li, X.; Xu, Y.; Huang, Z.; Chen, C.; Chen, J.; Du, H. Remote sensing monitoring of the spatiotemporal dynamics of urban forest phenology and its response to climate and urbanization. Urban Clim. 2024, 53, 101810. [Google Scholar] [CrossRef] [Scilit]
- Nielsen, A.B.; van den Bosch, M.; Maruthaveeran, S.; van den Bosch, C.K. Species richness in urban parks and its drivers: A review of empirical evidence. Urban Ecosyst. 2013, 17, 305–327. [Google Scholar] [CrossRef] [Scilit]
- Richardson, A.D.; O’Keefe, J. Phenological differences between understory and overstory: A case study using the long-term Harvard Forest records. In Phenology of Ecosystem Processes; Noormets, A., Ed.; Springer: New York, NY, USA, 2009; pp. 87–117. [Google Scholar]
- Lefcheck, J.S.; Byrnes, J.E.; Isbell, F.; Gamfeldt, L.; Griffin, J.N.; Eisenhauer, N.; Hensel, M.J.; Hector, A.; Cardinale, B.J.; Duffy, J.E. Biodiversity enhances ecosystem multifunctionality across trophic levels and habitats. Nat. Commun. 2015, 6, 6936. [Google Scholar] [CrossRef] [Scilit]
- Dobbs, C.; Kendal, D.; Nitschke, C.R. Multiple ecosystem services and disservices of the urban forest establishing their connections with landscape structure and sociodemographics. Ecol. Indic. 2014, 43, 44–55. [Google Scholar] [CrossRef] [Scilit]
- Melaas, E.K.; Wang, J.A.; Miller, D.L.; Friedl, M.A. Interactions between urban vegetation and surface urban heat islands: A case study in the Boston metropolitan region. Environ. Res. Lett. 2016, 11, 054020. [Google Scholar] [CrossRef] [Scilit]
- Grimm, N.B.; Faeth, S.H.; Golubiewski, N.E.; Redman, C.L.; Wu, J.; Bai, X.; Briggs, J.M. Global change and the ecology of cities. Science 2008, 319, 756–760. [Google Scholar] [CrossRef] [Scilit] [PubMed]
- Nunes, M.H.; Camargo, J.L.C.; Vincent, G.; Calders, K.; Oliveira, R.S.; Huete, A.; de Moura, Y.M.; Nelson, B.; Smith, M.N.; Stark, S.C.; et al. Forest fragmentation impacts the seasonality of Amazonian evergreen canopies. Nat. Commun. 2022, 13, 917. [Google Scholar] [CrossRef] [Scilit]
- Hoeppner, J.M.; Skidmore, A.K.; Darvishzadeh, R.; Heurich, M.; Chang, H.C.; Gara, T.W. Mapping canopy chlorophyll content in a temperate forest using airborne hyperspectral data. Remote Sens. 2020, 12, 3573. [Google Scholar] [CrossRef] [Scilit]
- Alonzo, M.; McFadden, J.P.; Nowak, D.J.; Roberts, D.A. Mapping urban forest structure and function using hyperspectral imagery and lidar data. Urban For. Urban Green. 2016, 17, 135–147. [Google Scholar] [CrossRef] [Scilit]
- Ordóñez, C.; Duinker, P.N. An analysis of urban forest management plans in Canada: Implications for urban forest management. Landsc. Urban Plan. 2013, 116, 36–47. [Google Scholar] [CrossRef] [Scilit]

Disclaimer/Publisher’s Note: The statements, opinions and data contained in all publications are solely those of the individual author(s) and contributor(s) and not of MDPI and/or the editor(s). MDPI and/or the editor(s) disclaim responsibility for any injury to people or property resulting from any ideas, methods, instructions or products referred to in the content. |
© 2026 by the authors. Licensee MDPI, Basel, Switzerland. This article is an open access article distributed under the terms and conditions of the Creative Commons Attribution (CC BY) license.