


Highlights
What are the main findings?
- We propose TreeSpecViT for fine-grained campus tree species classification from UAV RGB imagery under complex urban backgrounds, with a Background SuppressionModule that attenuates non-crown responses to reduce background-induced misclassification.
- Fine-Grained Feature Guidance and a Global–Local Fusion head improve separability among visually similar species.
What are the implications of the main findings?
- TreeSpecViT achieves consistent gains on SZUTreeDataset and NJFUDataset with MobileViT-level budgets (+6.06% accuracy and +7.20% macro-F1).
- Predicted species labels and crown geometry enable campus-scale human–vegetation coupling analysis, supporting operational green-space management.
Abstract
On university campuses, trees and green spaces shape how students and staff move and use outdoor spaces. To support planning, tree species information is needed at the level of individual trees. Tree species classification from UAV RGB imagery remains difficult in complex campus scenes because roads, buildings, shadows and subtle inter species differences degrade recognition. To address background interference, the loss of subtle fine-grained cues before tokenization, and insufficient local structure modeling in lightweight transformer-based classification, we propose TreeSpecViT for tree species classification. It uses a MobileViT backbone and a Background Suppression Module (BSM) to reduce clutter from non-canopy regions. A Fine-Grained Feature Guidance (FGF) module is inserted before the unfold operation to enhance canopy details and guide tokenization toward key regions. convolutional neck layers align channels, and a Global and Local Fusion (GLF) module jointly models overall crown semantics and local textures for species recognition. From the predicted masks and species labels, we build an individual tree digital archive. The archive stores per tree geometric attributes and can be linked with grids of campus activity intensity to analyze how activity patterns relate to vegetation structure. TreeSpecViT achieves an Accuracy of 87.88% (+6.06%) and an F1 score of 76.48% (+5.08%) on the SZUTreeDataset. On our self constructed NJFUDataset, it reaches 76.30% (+5.10%) in Accuracy and 70.10% (+7.20%) in F1. These results surpass mainstream models. Ablation experiments show that the modules jointly reduce background clutter and enhance canopy features. Overall, TreeSpecViT supports campus scale analyses that link human activity intensity to vegetation patterns and provides a practical basis for planning and adjusting campus green spaces.
1. Introduction
Trees on university campuses are important components of everyday outdoor environments and campus green-space management. Practical tasks such as maintenance, risk inspection, and landscape planning increasingly require tree-level information, including species identity, spatial distribution, and structural attributes [1,2,3].
UAVs equipped with RGB cameras provide an efficient way to acquire tree-level imagery over large campus areas [4,5,6]. However, accurate tree-species classification from campus UAV imagery remains challenging because tree crowns often exhibit high inter-class similarity, large intra-class variation, and strong background interference from roads, buildings, pavements, shadows, and surrounding vegetation. In campus UAV scenes, adjacent crowns may overlap in top-view imagery, making individual crown boundaries ambiguous, while small or partially occluded crowns are more easily affected by background clutter. Moreover, seasonal changes, illumination differences, and shadow variations can further alter crown colour, texture, and local appearance, thereby increasing intra-class variation and confusion among visually similar species. These characteristics make campus UAV imagery a representative and practical scenario for fine-grained tree-species classification [4,5,7,8,9,10,11].
Tree species classification is a key step in campus tree-information pipelines based on remote sensing imagery. Ground surveys provide accurate species labels and structural measurements but are costly and slow to update. Aerial and satellite imagery can be updated more frequently and cover larger extents, but most products only support patch-level or plot-level indicators. They struggle to provide reliable individual tree or tree species information for campuses [3]. Recent work suggests that combining multi-source sensing platforms and learning-based models can improve individual-tree mapping and species detection at broader scales, but robust fine-grained discrimination remains difficult in cluttered urban scenes [12,13].
Existing image-based tree species classification methods can be broadly grouped into three families. The first relies on handcrafted spectral or textural descriptors with traditional classifiers. The second adopts high-resolution imagery and convolutional neural networks (CNNs). The third leverages vision Transformers and other large deep models [5,14]. While these approaches have advanced tree species classification, they still face limitations in campus UAV scenes. Many methods are not designed to explicitly suppress background clutter, and visually similar species remain difficult to separate [4,15]. In practice, effective discrimination often requires combining global crown cues, such as overall crown shape, size, and canopy-level color distribution, with local fine-grained cues, such as texture details and boundary morphology [8,15]. Moreover, some models rely on large backbones or heavy modules that exceed what campus-scale datasets and deployment constraints can comfortably support [14]. Meanwhile, multi-source fusion (e.g., UAV RGB with LiDAR) has been shown to improve tree species discrimination [10]. Such multimodal approaches can complement RGB appearance cues with canopy height, crown geometry, and three-dimensional structural information, which is particularly helpful when visually similar species cannot be reliably separated by color and texture alone. However, RGB-only methods remain practically attractive for campus-scale applications because RGB imagery is easier and cheaper to acquire. At the same time, they are more sensitive to illumination changes, seasonal variation, and the lack of explicit structural cues.
We propose a fine-grained tree species classification model named TreeSpecViT for campus UAV RGB imagery. TreeSpecViT uses a MobileViT backbone and adds three task specific modules. The Background Suppression Module (BSM) reduces responses in non crown regions, including roads, buildings, ground surfaces and shadows. The Fine-Grained Feature Guided module (FGF), placed before the tokenization, guides tokenization toward discriminative canopy regions. In the neck and head, convolutional layers perform channel alignment and a Global Local Fusion (GLF) module combines global crown semantics with local texture structures. These components improve the signal to noise ratio of canopy features and increase the separability of both inter class and intra-class variation without a large increase in model size.
Beyond per-tree classification accuracy, the proposed framework also supports the construction of an individual-tree digital archive by combining predicted species labels with crown geometry obtained from the crown-extraction stage. This makes tree-species recognition useful not only as a computer-vision task, but also as a technical basis for tree-level inventorying and campus-scale analysis of the spatial relationship between human activity intensity and vegetation density [1,16].
In this work we make three main contributions. First, we build a campus oriented workflow that links single tree species classification and crown geometry extraction into a consistent pipeline from UAV imagery to per tree indicators. Secondly, we design the TreeSpecViT architecture with the BSM, FGF and GLF module to address background clutter, fine-grained discrimination and global local feature fusion while keeping model complexity in the same order as the MobileViT backbone. Thirdly, we conduct comparative experiments against mainstream models on the SZUTreeDataset and on our self constructed NJFUDataset. On SZUTreeDataset, TreeSpecViT achieves an Accuracy of 87.88% (+6.06%) and an F1 score of 76.48% (+5.08%). On NJFUDataset, it achieves an Accuracy of 76.30% (+5.10%) and an F1 score of 70.10% (+7.20%). These results show clear improvements over all baselines under the same experimental settings.
2. Related Work
Tree-species classification in image-based remote sensing has evolved from traditional handcrafted-feature approaches to deep convolutional networks and vision Transformers. Earlier studies in generic image classification and remote sensing often relied on manually designed features [17], such as color histograms, texture descriptors, and shape contours, which were then combined with shallow classifiers including support vector machines, Random Forests, and K-nearest neighbors. These methods are relatively transparent and can perform reliably in controlled scenarios with clean backgrounds and limited disturbance. However, handcrafted features have limited representational capacity and often struggle to simultaneously capture high-level semantics and subtle fine-grained differences. Their performance tends to saturate in tasks involving complex backgrounds, large-scale variation, and high inter-class similarity, and they are also sensitive to feature-engineering choices and parameter tuning.
The emergence of deep convolutional neural networks fundamentally advanced visual classification. Early CNNs such as AlexNet and VGG demonstrated the effectiveness of end-to-end feature learning on large-scale benchmarks, while later architectures such as ResNet [18] and DenseNet [19] further improved representational power through residual and dense connections. CNNs can learn hierarchical and multi-scale features directly from raw pixels [20] and are generally more robust to changes in illumination, viewpoint, and local occlusion. In tree-species classification, CNN-based methods have been applied to several types of imagery. Some studies use leaf or ground images collected under relatively controlled conditions, where the background is simple and the viewpoint is stable. CNNs and fine-grained recognition networks in these settings can model leaf texture, shape, and venation, and often use local attention or part localization to distinguish closely related species. Other studies focus on high-resolution aerial or UAV imagery and operate at the crown level [21,22]. A common workflow first delineates tree crowns using models such as U-Net or Mask R-CNN, and then classifies cropped crown patches using ResNet-, DenseNet-, or related CNN-based backbones [23]. To improve robustness to occlusion, shadows, and clutter, some methods introduce spatial attention, multi-scale fusion, or geometric descriptors to strengthen species discrimination. Although these approaches improve tree-species classification performance, many of them still rely on relatively large backbones and sufficient labeled data, which may be difficult to satisfy in campus-scale UAV applications.
More recently, vision Transformers and lightweight hybrid architectures have become important tools in visual classification [24]. Pure Transformer models such as ViT divide images into patches and model long-range dependencies through global self-attention. When pretrained on large-scale datasets, they can achieve performance comparable to or better than CNNs [25]. Hierarchical Transformers such as Swin Transformer [26] and PVT improve the trade-off between contextual modeling and computational cost through shifted windows and progressive downsampling. At the same time, some CNN architectures such as ConvNeXt [27] incorporate Transformer-inspired design choices, including larger kernels and normalization layers, back into convolutional networks. In addition, compact backbones such as MobileNetV2 and MobileNetV3 [28], ShuffleNet [29], and RegNet [30] reduce parameter counts and floating-point operations through depthwise separable convolutions, bottleneck structures, and grouped convolutions. Hybrid lightweight models such as MobileViT [31] and EfficientFormer [32] further combine convolutional blocks with Transformer-style attention to capture both local texture and long-range context with moderate complexity. These models are attractive for UAV applications because they provide a better balance between recognition performance and deployment efficiency. Nevertheless, many of them are still designed for generic image classification and do not explicitly model the particular appearance of tree crowns or the complex backgrounds commonly found in campus UAV scenes.
Beyond generic visual architectures, an increasing number of studies have specifically investigated tree-species classification from UAV and remote-sensing imagery. These studies show that crown-level species recognition benefits from high-resolution aerial observations, but they also reveal persistent domain-specific challenges, including crown overlap, within-species appearance variation under changing illumination or seasonal conditions, and strong interference from roads, buildings, shadows, and surrounding vegetation [22,23]. Some remote-sensing studies combine crown delineation and species recognition in individual-tree workflows, while others perform species mapping directly at the crown or patch level using RGB imagery, hyperspectral data, or LiDAR [23,33]. In particular, multimodal approaches that combine UAV imagery with LiDAR or hyperspectral information can improve discrimination between visually similar species by introducing height, structural, or spectral cues that are difficult to infer from RGB imagery alone [33,34]. However, such multimodal systems usually require more expensive acquisition, data alignment, and processing pipelines, which may limit their practicality in campus-scale and frequently updated monitoring tasks. Therefore, RGB-only approaches remain attractive in applications that require lower cost, easier deployment, and broader accessibility, although they must cope with weaker species-discriminative cues and stronger sensitivity to background and illumination changes [35].
Across these technical lines, current tree-species classification methods still face important limitations when applied to campus UAV imagery. Leaf- and ground-based methods often assume relatively clean backgrounds and simple viewing geometry [36], while crown-level CNN and Transformer methods may require large backbones or multi-source data, increasing the demand for computation and labeled samples. In campus UAV scenes, three challenges are especially prominent. First, different species may appear highly similar in canopy shape, color, and texture, resulting in strong inter-class similarity. Second, the same species may exhibit diverse crown appearances under different backgrounds, illumination conditions, and growth states, leading to large intra-class variation. Third, complex campus backgrounds and crowns of different sizes often mix foreground and background information. Roads, buildings, pavements, shadows, and partial occlusions can dilute important canopy details, especially for small or partially occluded crowns. These limitations indicate the need for a lightweight and task-oriented model that can suppress non-canopy interference, preserve subtle fine-grained canopy cues, and jointly model global and local crown features. Based on these considerations, we propose TreeSpecViT for fine-grained tree-species classification from campus UAV RGB imagery.
3. Methodology
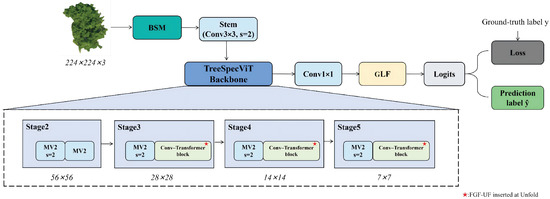
The proposed framework for fine-grained tree species classification consists of four components: a Background Suppression Module (BSM), a TreeSpecViT backbone integrated with FGF, a Global–Local Fusion Convolutional Neck () for channel alignment, and a Global–Local Fusion Module (GLF Module) for classification. Given an input UAV RGB image , the overall mapping can be formulated as
where denotes the predicted probability vector over C tree species. As shown in Figure 1, BSM first suppresses large-area background regions (e.g., roads, buildings, and shadows). The enhanced image is then fed into the backbone with FGF to extract fine-grained canopy features and prune redundant background tokens. Next, the neck module performs lightweight channel alignment and smooths the feature distribution. Finally, the GLF Module fuses global canopy shape semantics with local texture structures to output the tree species classification result.
Figure 1.
Overview of the proposed TreeSpecViT framework. Given an RGB canopy patch, BSM suppresses background responses and the TreeSpecViT backbone extracts hierarchical features, where FGF is inserted before tokenization in Stages 3–5. A conv aligns channels and the GLF head fuses global and local cues to produce class logits. During training, the loss is computed with the ground-truth label y, while inference outputs the predicted label .
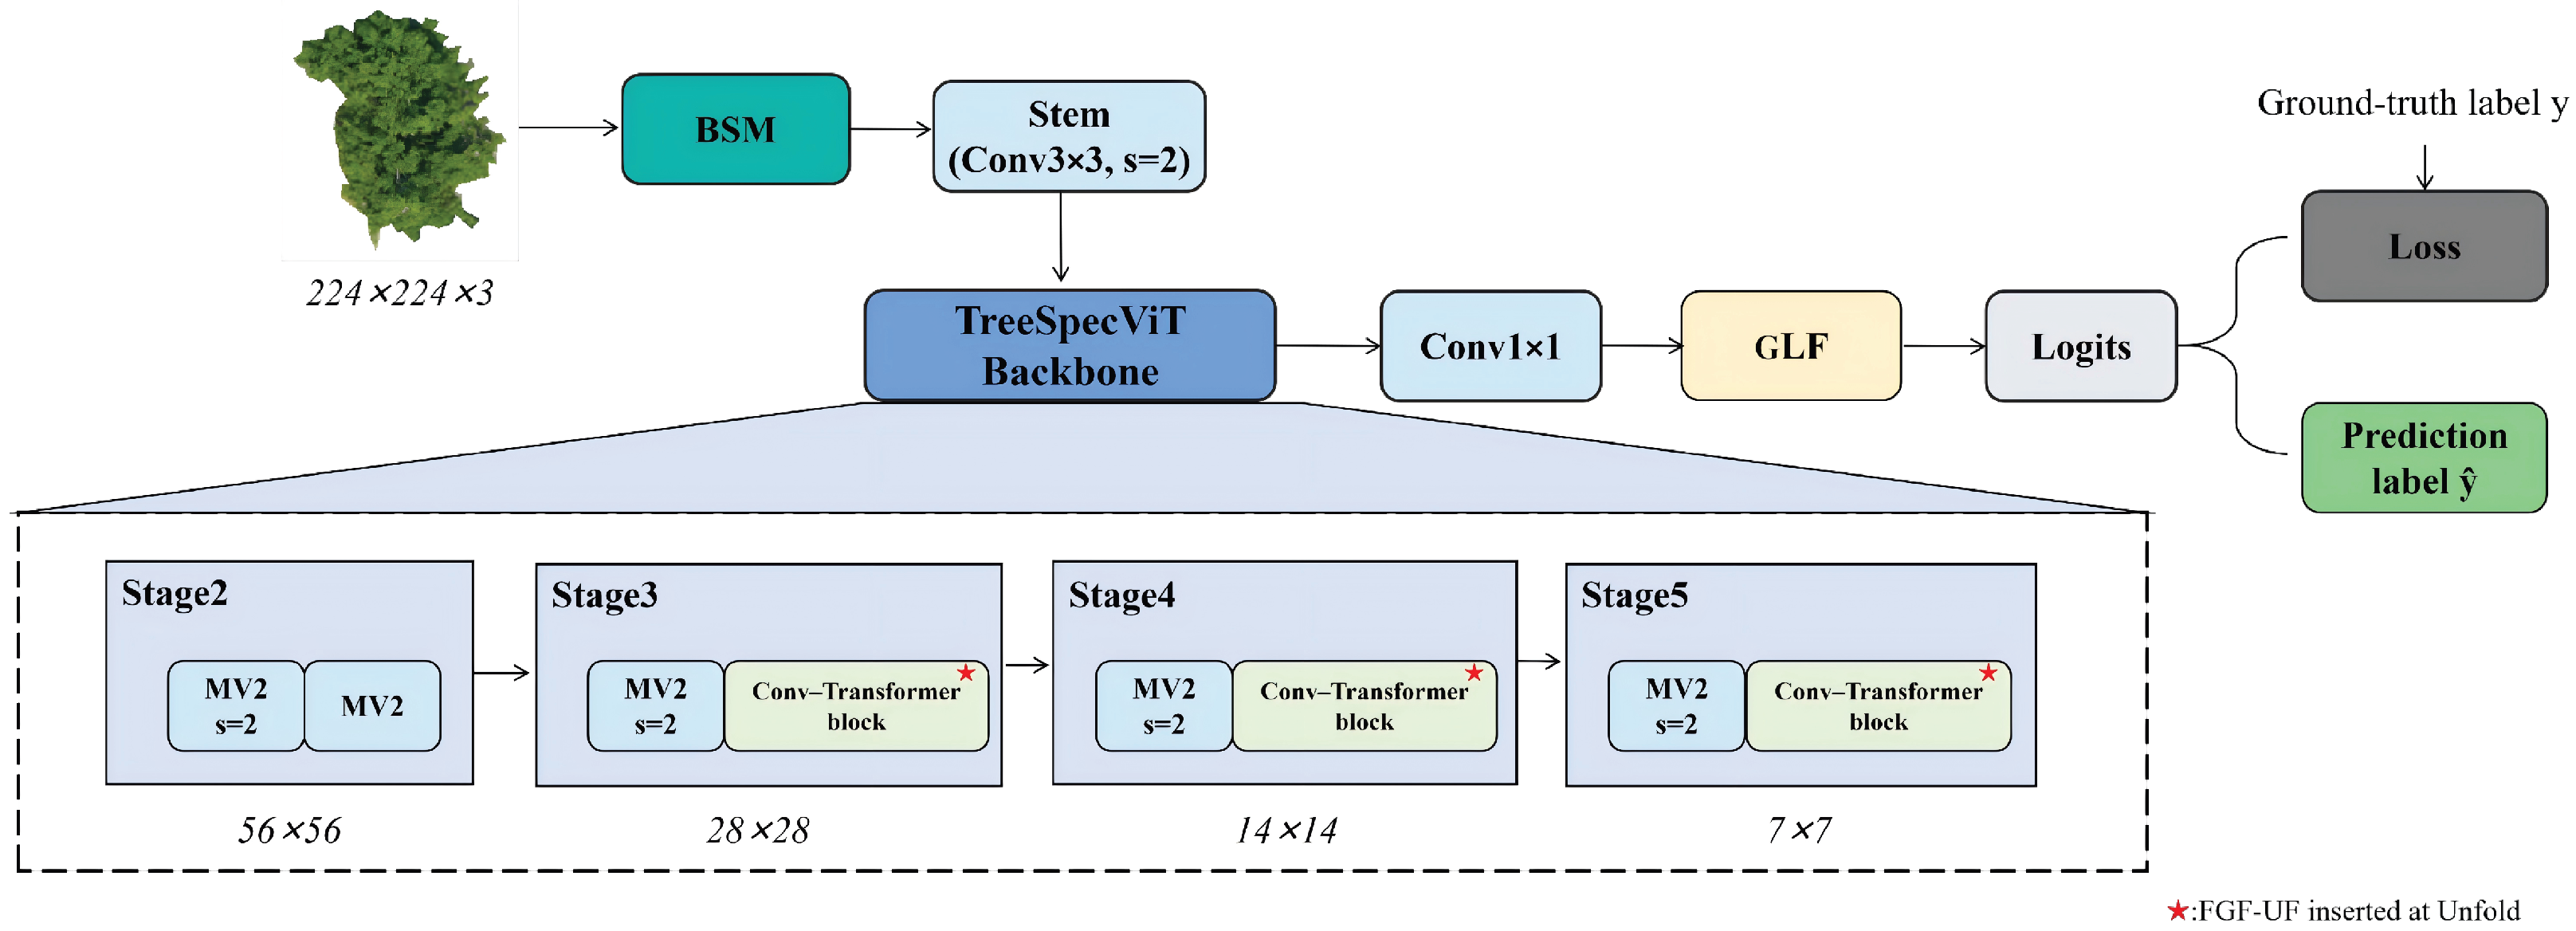
To enhance the signal-to-noise ratio of foreground features prior to extraction, as shown in Figure 2, BSM employs a shallow depthwise–pointwise convolution structure to generate a single-channel soft mask and reweight the input image:
where DWConv denotes depthwise-separable convolution, BN represents batch normalization, and denotes the Sigmoid activation function. The term inside produces a soft mask in , which is broadcast to all RGB channels during the element-wise multiplication ⊙. By suppressing low-response background pixels while preserving high-response canopy regions, BSM reduces the computational burden on subsequent layers at the input stage. This approach yields more compact and discriminative canopy features, particularly in scenes with strong human activity interference, by generating a lightweight spatial suppression mask to reduce responses from non-canopy regions before feature extraction. Although BSM shares some similarity with standard spatial attention or spatial gating mechanisms, its role in this work is different. Rather than serving as a generic feature-enhancement block, BSM is introduced as a task-oriented background suppression module for UAV tree-crown imagery, where roads, buildings, pavements, and shadows often introduce strong spatial interference. Therefore, BSM is applied at an early stage to suppress irrelevant spatial responses before deeper representation learning, so that subsequent layers can focus more effectively on canopy-related regions.
Figure 2.
Structure of the Background Suppression Module (BSM). A single-channel spatial mask is generated and broadcast across channels to suppress non-canopy responses in the input feature map.
3.1. Model Backbone
The backbone of TreeSpecViT combines convolutional feature extraction with Transformer-based global modeling. The design follows the TreeSpecViT block, which couples local inductive bias from convolutions with long-range dependency modeling from Transformers. Campus scenes often contain cluttered backgrounds and similar canopy appearances across species. This makes fine-grained discrimination difficult.
TreeSpecViT adds a Fine-Grained Feature-Guided module (FGF) before the tokenization in several blocks of stages 3 to 5. FGF predicts an importance mask by modeling spatial saliency and channel importance. It reweights features before tokenization. This helps self-attention focus on informative canopy cues such as leaves, fruits, and crown margins. It also suppresses background responses. The workflow is shown in Figure 3. The FGF module is related in spirit to existing spatial–channel attention mechanisms such as CBAM, since both aim to recalibrate feature responses along spatial and channel dimensions. However, the role of FGF in this work is more task-specific. Instead of being used as a generic plug-in attention block, FGF is inserted before the unfold/tokenization operation in the lightweight transformer pipeline to preserve and enhance subtle fine-grained canopy cues at the feature-map stage. This design is motivated by the observation that discriminative tree-species details may be weakened during tokenization if they are not sufficiently emphasized beforehand.
Figure 3.
Structure of the Fine-Grained Feature Guidance (FGF) module. Spatial and channel cues are fused before tokenization to enhance discriminative canopy information.
Consider an input feature map from a TreeSpecViT block. FGF computes a spatial attention map and a channel attention map :
where is a depthwise convolution with kernel size , GAP denotes global average pooling, and are two fully connected layers, and is a nonlinear activation function. The two maps are fused into a fine-grained mask:
where is a normalization operator used to stabilize the mask scale. The reweighted features are
The placement of FGF before tokenization is intentional. In fine-grained tree-species classification, discriminative cues are often subtle, localized, and easily overwhelmed by background responses or dominant coarse structures. During the unfold/tokenization process, feature maps are partitioned and rearranged into token sequences, which may weaken these subtle canopy cues if they are not sufficiently emphasized in advance. By applying FGF before tokenization, the network first recalibrates spatial and channel responses at the feature-map level, so that the generated tokens carry more discriminative fine-grained information for the subsequent transformer encoder. Next, enters the tokenization, Transformer, and detokenization pipeline of TreeSpecViT. Let denote the tokenization with window size and stride s. It divides feature maps into local patches and converts them into token sequences. Let denote a Transformer with L layers. Let denote the detokenization that reconstructs spatial feature maps. The block output is
The final output of the block is obtained by a convolution and a residual connection:
In summary, TreeSpecViT applies pre-tokenization spatial–channel reweighting in stages 3 to 5 to enhance canopy cues and suppress background responses, yielding cleaner tokens for subsequent global modeling.
3.2. Model Neck
The neck module in TreeSpecViT provides a unified feature representation for the subsequent GLF Module. It aligns the channel dimension of backbone features and calibrates their activation distribution. It keeps the spatial resolution unchanged.
Let the backbone output be . The neck adopts a lightweight projection followed by BN and SiLU:
where maps channels from to , and denotes the SiLU activation function.
This operation is applied independently at each spatial location. Let , and let denote the feature vector at the i-th location of . The neck can be written as
where defines a shared channel projection that is applied to all spatial locations, and provides a channel-wise offset after projection. This shared projection reshapes the backbone output into the channel space expected by the GLF Module. It also compresses redundant responses across channels while preserving the spatial layout.
Compared with building an additional multi-scale feature pyramid, the proposed neck is simpler and cheaper. It preserves spatial structure and local texture details. It outputs the aligned feature map for the GLF Module.
3.3. Model Head
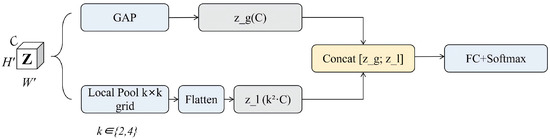
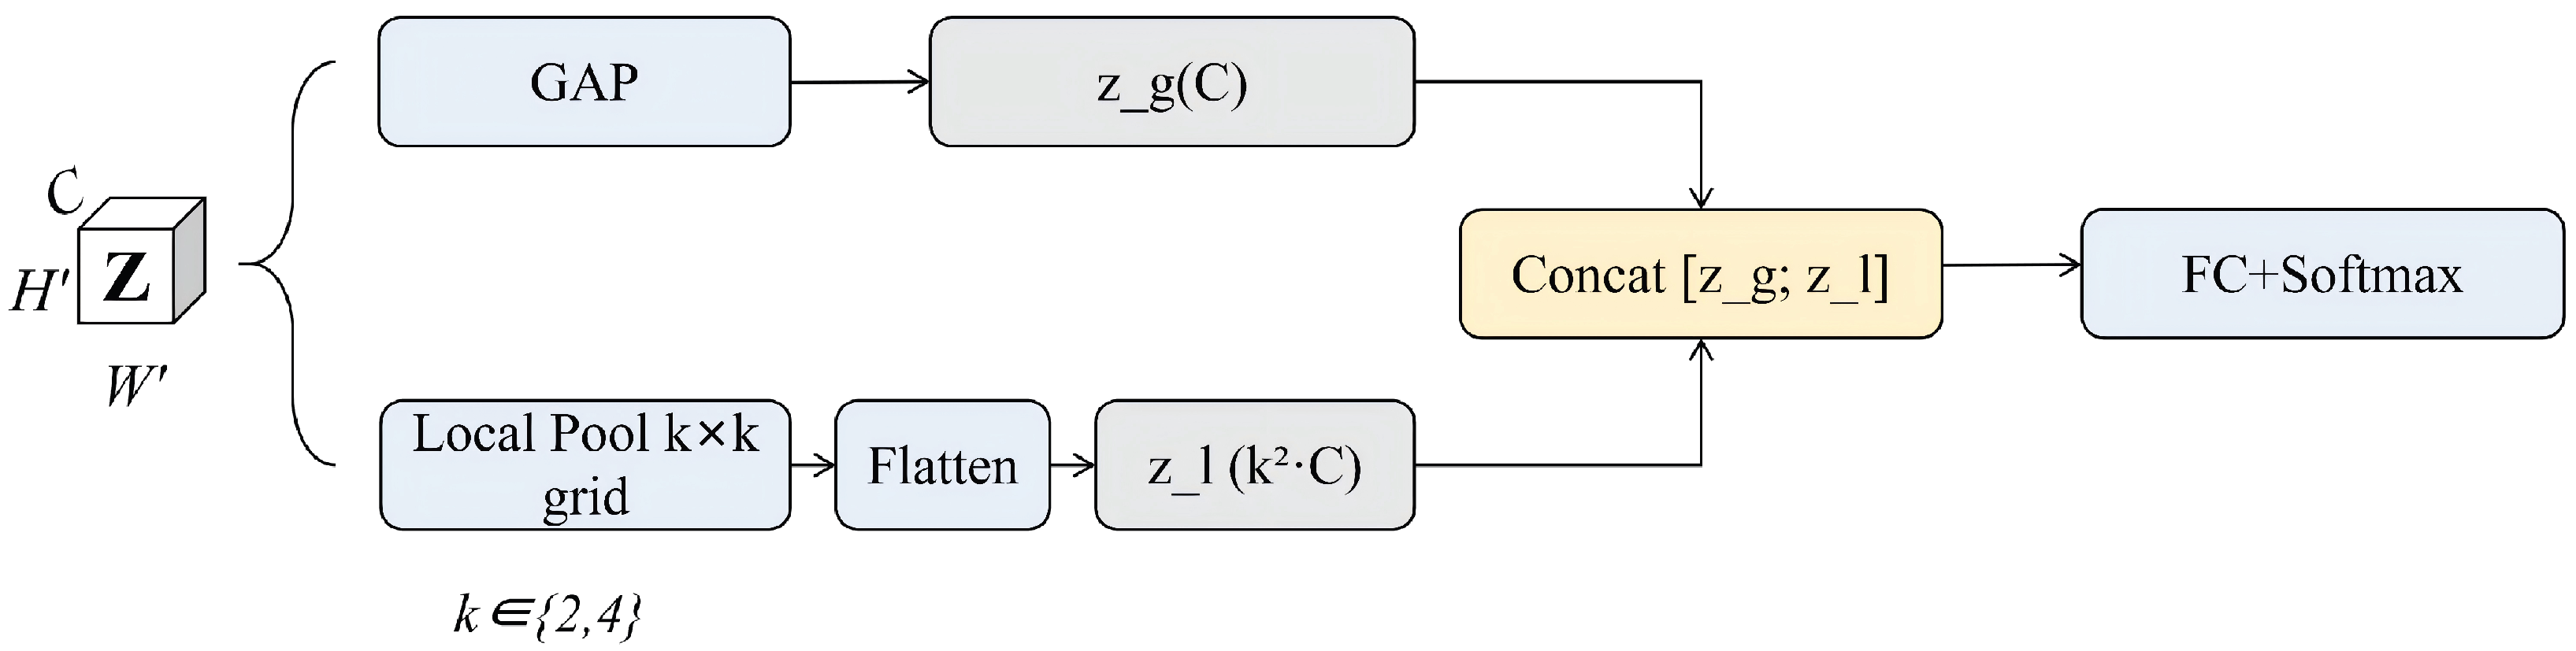
The GLF Module takes the neck output as input. It fuses global crown-level semantics with local texture and spatial layout cues. As shown in Figure 4, the head has three parts. It includes a global branch using global average pooling, a local branch using grid pooling, and a linear classifier.
Figure 4.
Structure of the Global–Local Fusion (GLF) module. Global average pooling and grid-based local pooling are combined to capture complementary crown semantics and local structural cues for classification.
In the global branch, global average pooling is applied to obtain a global descriptor:
which summarizes coarse crown properties such as overall canopy size and density.
In the local branch, is divided into non-overlapping grid regions , where . Here, the grid-size parameter K controls the granularity of local spatial pooling. A smaller K produces coarser local descriptors and may miss subtle crown-pattern differences, whereas a larger K preserves finer local detail but may introduce more fragmented representations and reduce robustness. In this work, was selected as a practical trade-off between local detail and classification stability. We average features within each region to obtain local descriptors:
We then concatenate all region descriptors into a single vector:
where denotes vector concatenation along the feature dimension. A linear projection is used to obtain the local representation:
where and are the parameters of the projection. The local representation captures fine-grained cues such as leaf texture and crown boundary patterns.
Finally, the global and local representations are concatenated and normalized before classification:
where and are classifier parameters, LN denotes LayerNorm, and is the temperature coefficient.
This design combines complementary information from two branches. The global descriptor provides stable crown-level semantics. The local descriptor preserves discriminative texture and spatial layout cues. Their fusion yields a more informative representation for tree species classification. In this sense, the contribution of GLF lies less in proposing a new pooling paradigm than in adapting a lightweight global–local fusion strategy to the specific representation needs of campus UAV tree-species classification. Unlike pure global pooling, which may overlook subtle local crown-pattern differences, the proposed design preserves structured local cues while remaining computationally efficient for UAV-based applications.
3.4. Individual-Tree Digital Archive Construction
After individual-tree species recognition and crown delineation, we further build a digital tree archive for individual-level management. Each tree corresponds to one record. The predicted species label is stored as an attribute. The record also includes geometric traits extracted from the crown mask. These traits support maintenance planning, resource assessment, and risk screening. In this work, we focus on four parameters. They are crown area, equivalent crown diameter, major and minor crown diameters, and crown perimeter.
Crown area describes the horizontal extent of the crown. We count the number of crown pixels in the mask. The number is denoted as . We convert it to physical area using the ground sampling distance (m/pixel):
This value reflects horizontal crown expansion. It is useful for growth monitoring and biomass-related estimation.
Equivalent crown diameter assumes a circular crown projection. We compute an equivalent diameter from area. This follows the standard equivalent-diameter definition used in region-based shape measurement [37]:
This diameter is intuitive. It is also convenient for comparisons across species and scales.
Major and minor crown diameters quantify elongation and symmetry. We apply principal component analysis (PCA) to the coordinates of crown pixels. PCA provides two principal directions. They correspond to the largest and the second-largest variance. We measure the crown extent along these two directions. The results are denoted as and . Their ratio indicates elongation. It can also reveal asymmetric or tilted crowns.
Crown perimeter describes boundary complexity. We extract crown contours using a chain-code method. We count contour pixels and denote the number as . We convert it to physical perimeter using :
This measure reflects edge tortuosity. It is related to branching patterns and pruning intensity.
These archived attributes provide a structured basis for subsequent tree-level inventory analysis and for the spatial aggregation used in the campus-scale coupling model.
3.5. Campus Human Activity–Vegetation Coupling Model
Building on individual-tree species recognition and crown delineation, this section defines a campus-scale coupling framework between pedestrian activity intensity and vegetation density. The analysis is conducted on a unified grid to quantify the spatial co-occurrence between activity demand/pressure represented by pedestrian flows and vegetation supply represented by canopy coverage.
We partition the campus into regular grid cells of 25 m × 25 m. This grid size is selected as a practical trade-off between spatial detail and analytical stability. As shown in Table 1, the overall coupling trend remains broadly consistent across different grid sizes. A finer grid preserves more local spatial variation but is also more sensitive to fragmented crowns and local fluctuations, whereas a coarser grid tends to smooth local variation in canopy distribution and pedestrian activity. Therefore, the adopted 25 m × 25 m grid provides a balanced basis for comparing activity intensity and vegetation density at the campus scale. We aggregate vegetation metrics at the grid-cell level. Using UAV-derived crown masks, we sum all crown areas within a grid cell x. We then compute the canopy coverage ratio:
where is the area of the grid cell. The index reflects local canopy coverage. Crown delineation provides the geometric basis for vegetation aggregation, while species labels support species-aware archive construction and subsequent ecological interpretation.
Table 1.
Sensitivity analysis of the coupling results under different grid sizes.
We also define a tree density index to describe local clustering:
where is the number of trees within a circular neighborhood centered at cell x with radius . We set to three to five times a typical crown diameter. This choice balances local representativeness and spatial smoothing.
We define a potential human activity intensity index by integrating three normalized components: traffic accessibility , functional aggregation , and environmental attraction :
where . The weights are determined using questionnaire surveys and expert judgment. After calibration, serves as a grid-level proxy for the relative concentration of pedestrian activity.
The reliability of the coupling analysis depends on the quality of the preceding crown delineation and, for species-related interpretation, also on the accuracy of species classification.
On the unified grid, we examine the activity vegetation relationship using several statistical models. We first specify a log-linear model. We use canopy coverage as the response. We summarize terrain, functional zoning, and other controls by :
where is a small positive constant added to avoid numerical instability when is close to zero, and is a random error term.
We then fit an exponential decay model. This model captures potential threshold effects in highly used areas:
where controls the decay rate. The term represents residual green coverage under very high activity.
Finally, we fit a quantile regression model for vegetation coverage:
We estimate the model at .
4. Experiments and Analysis
4.1. Dataset
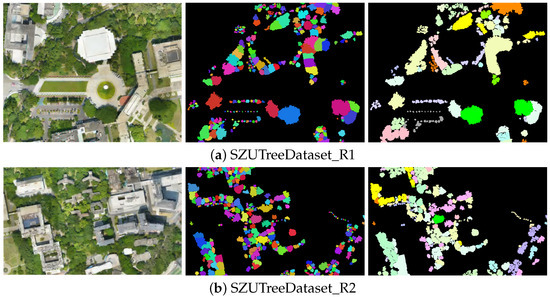
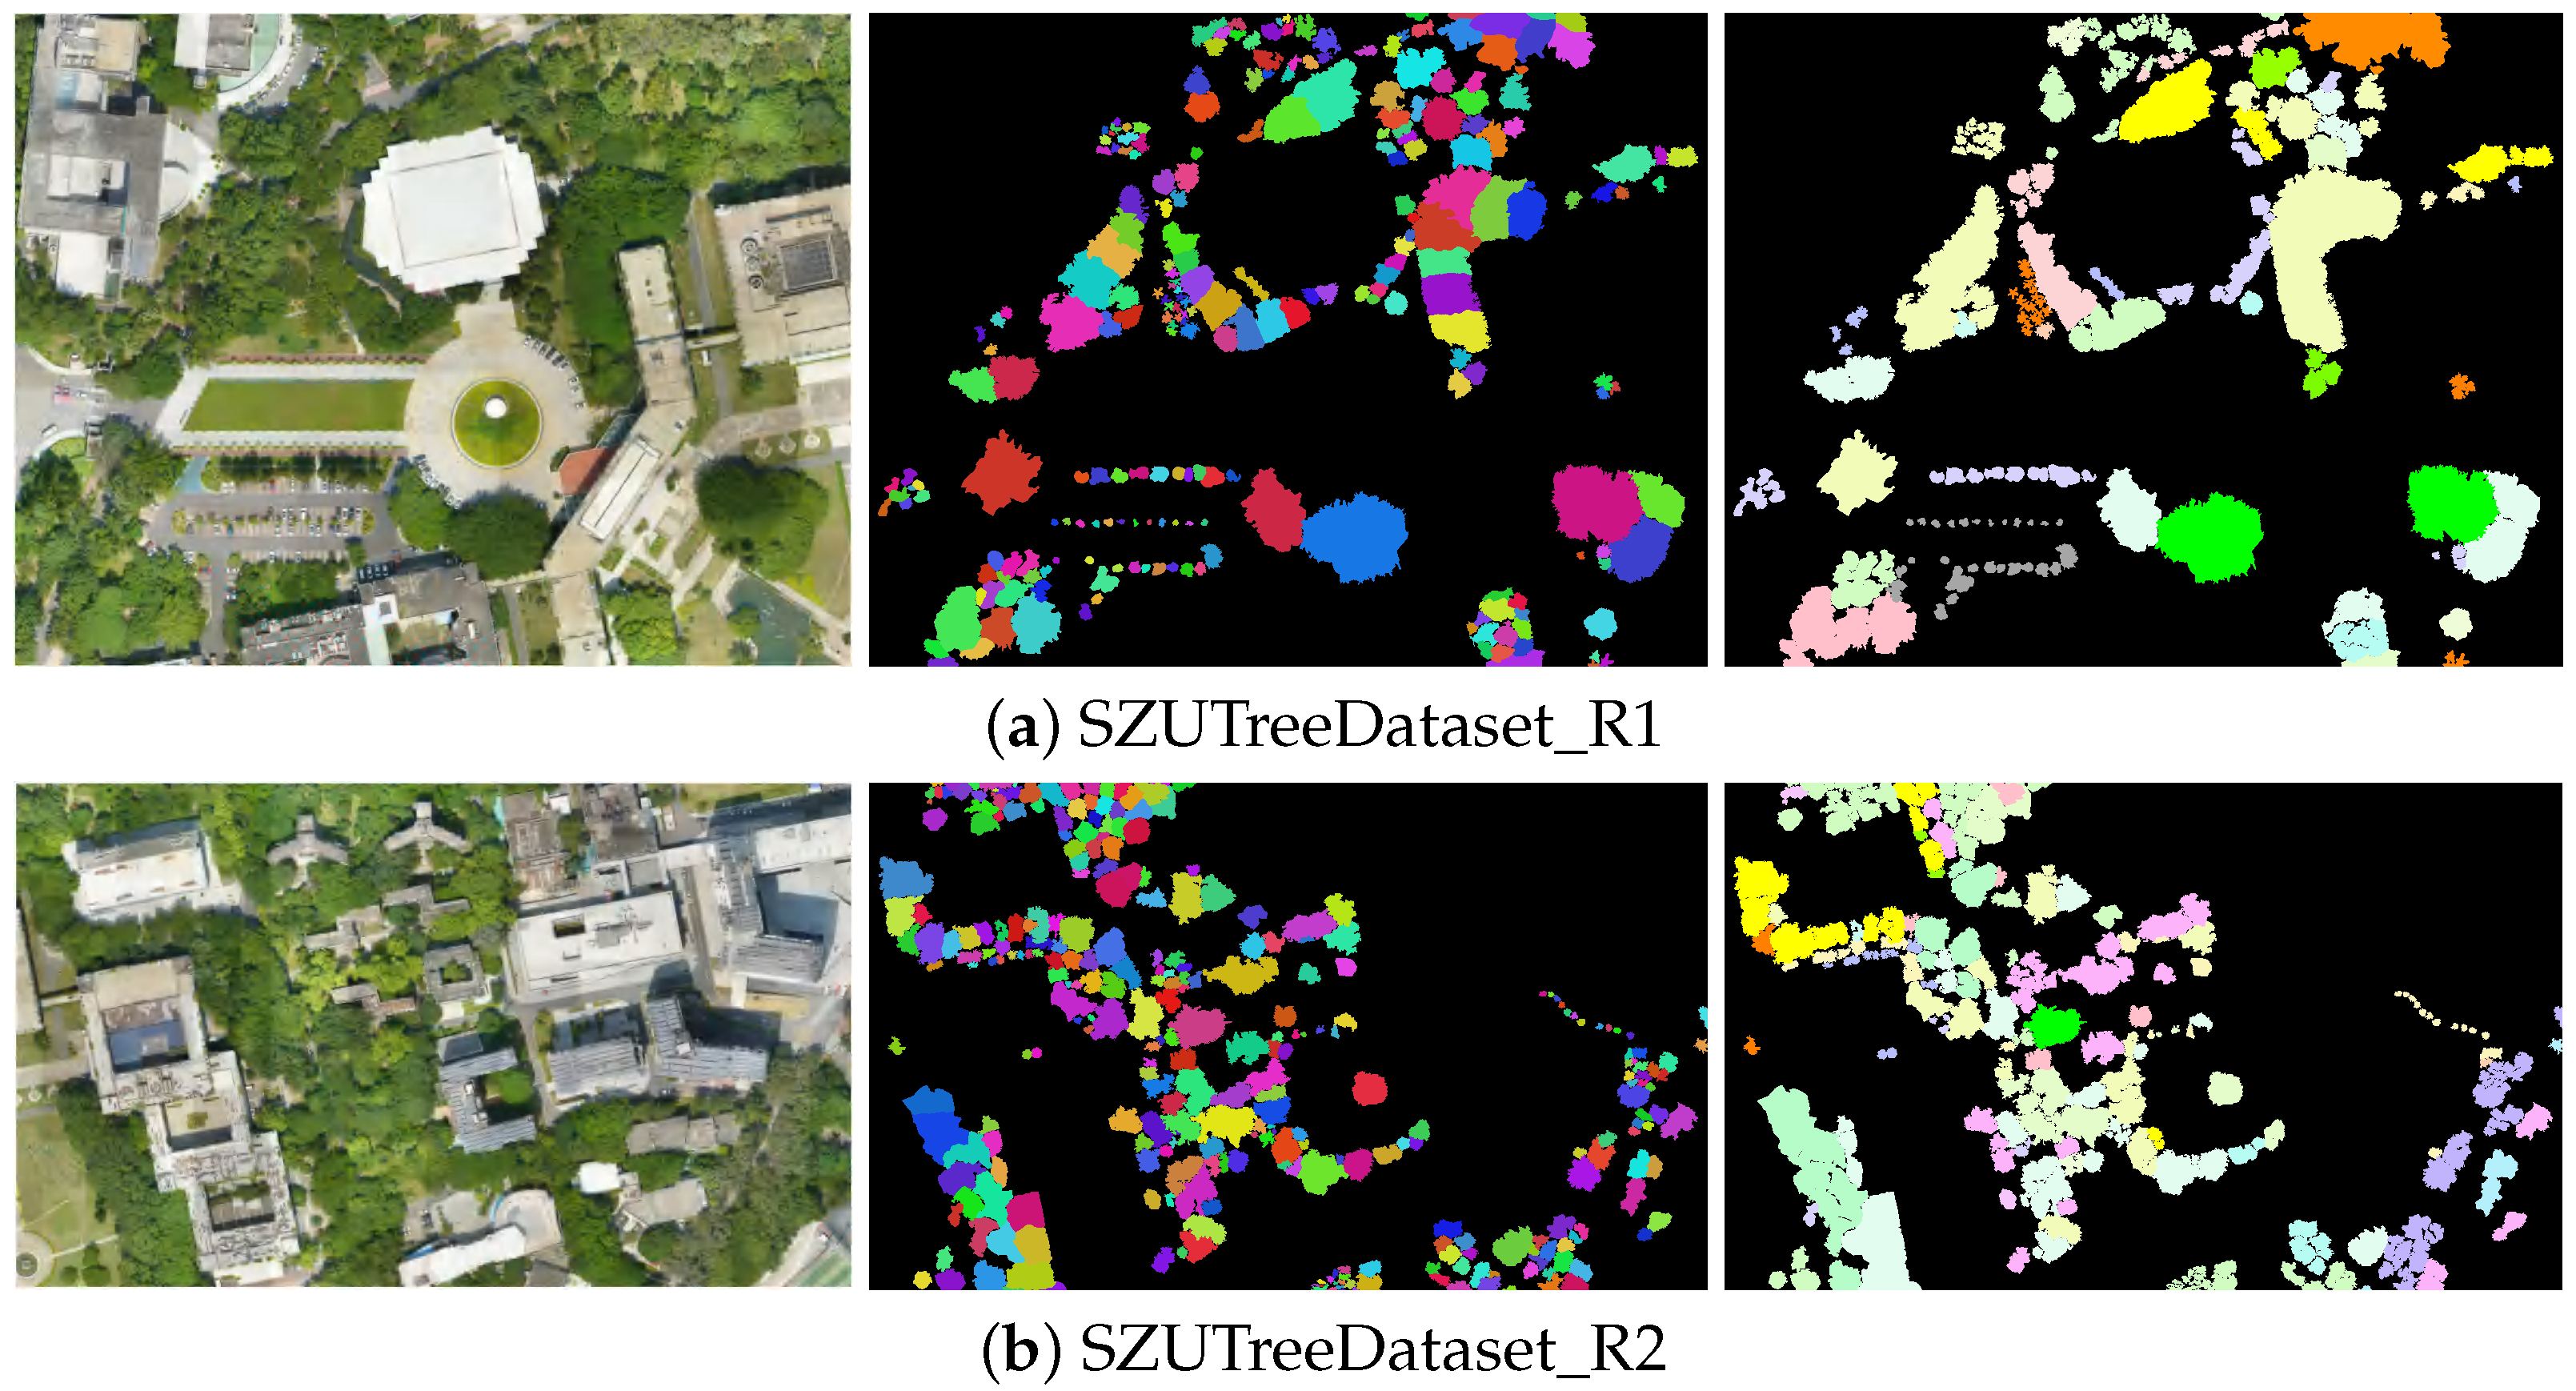
The SZUTreeDataset (http://szu-hsilab.com/szu-tree-dataset/(accessed on 2 June 2025)) was constructed and publicly released by the Hyperspectral Imaging Laboratory (HSI Lab) at Shenzhen University. It is a high-resolution hyperspectral image dataset focused on urban tree classification. As shown in Figure 5, it includes samples of 25 common tree species from cities in southern China.
Figure 5.
Each subfigure contains three side-by-side images, which (from left to right) are: the original image of the study area, the visualization map of individual tree annotation information (distinguishing the independent boundary of each tree), and the visualization map of tree species category information (with different tree species differentiated by colors).
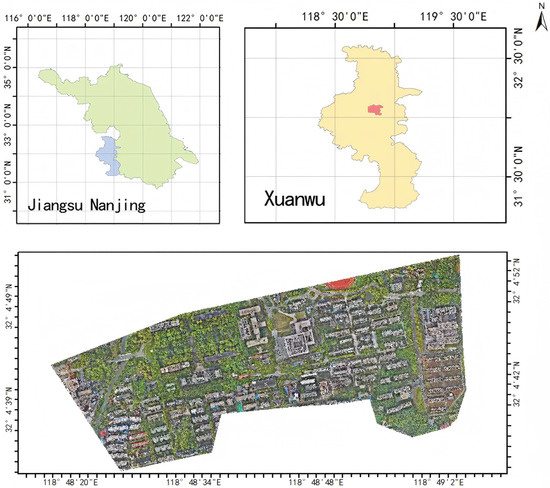
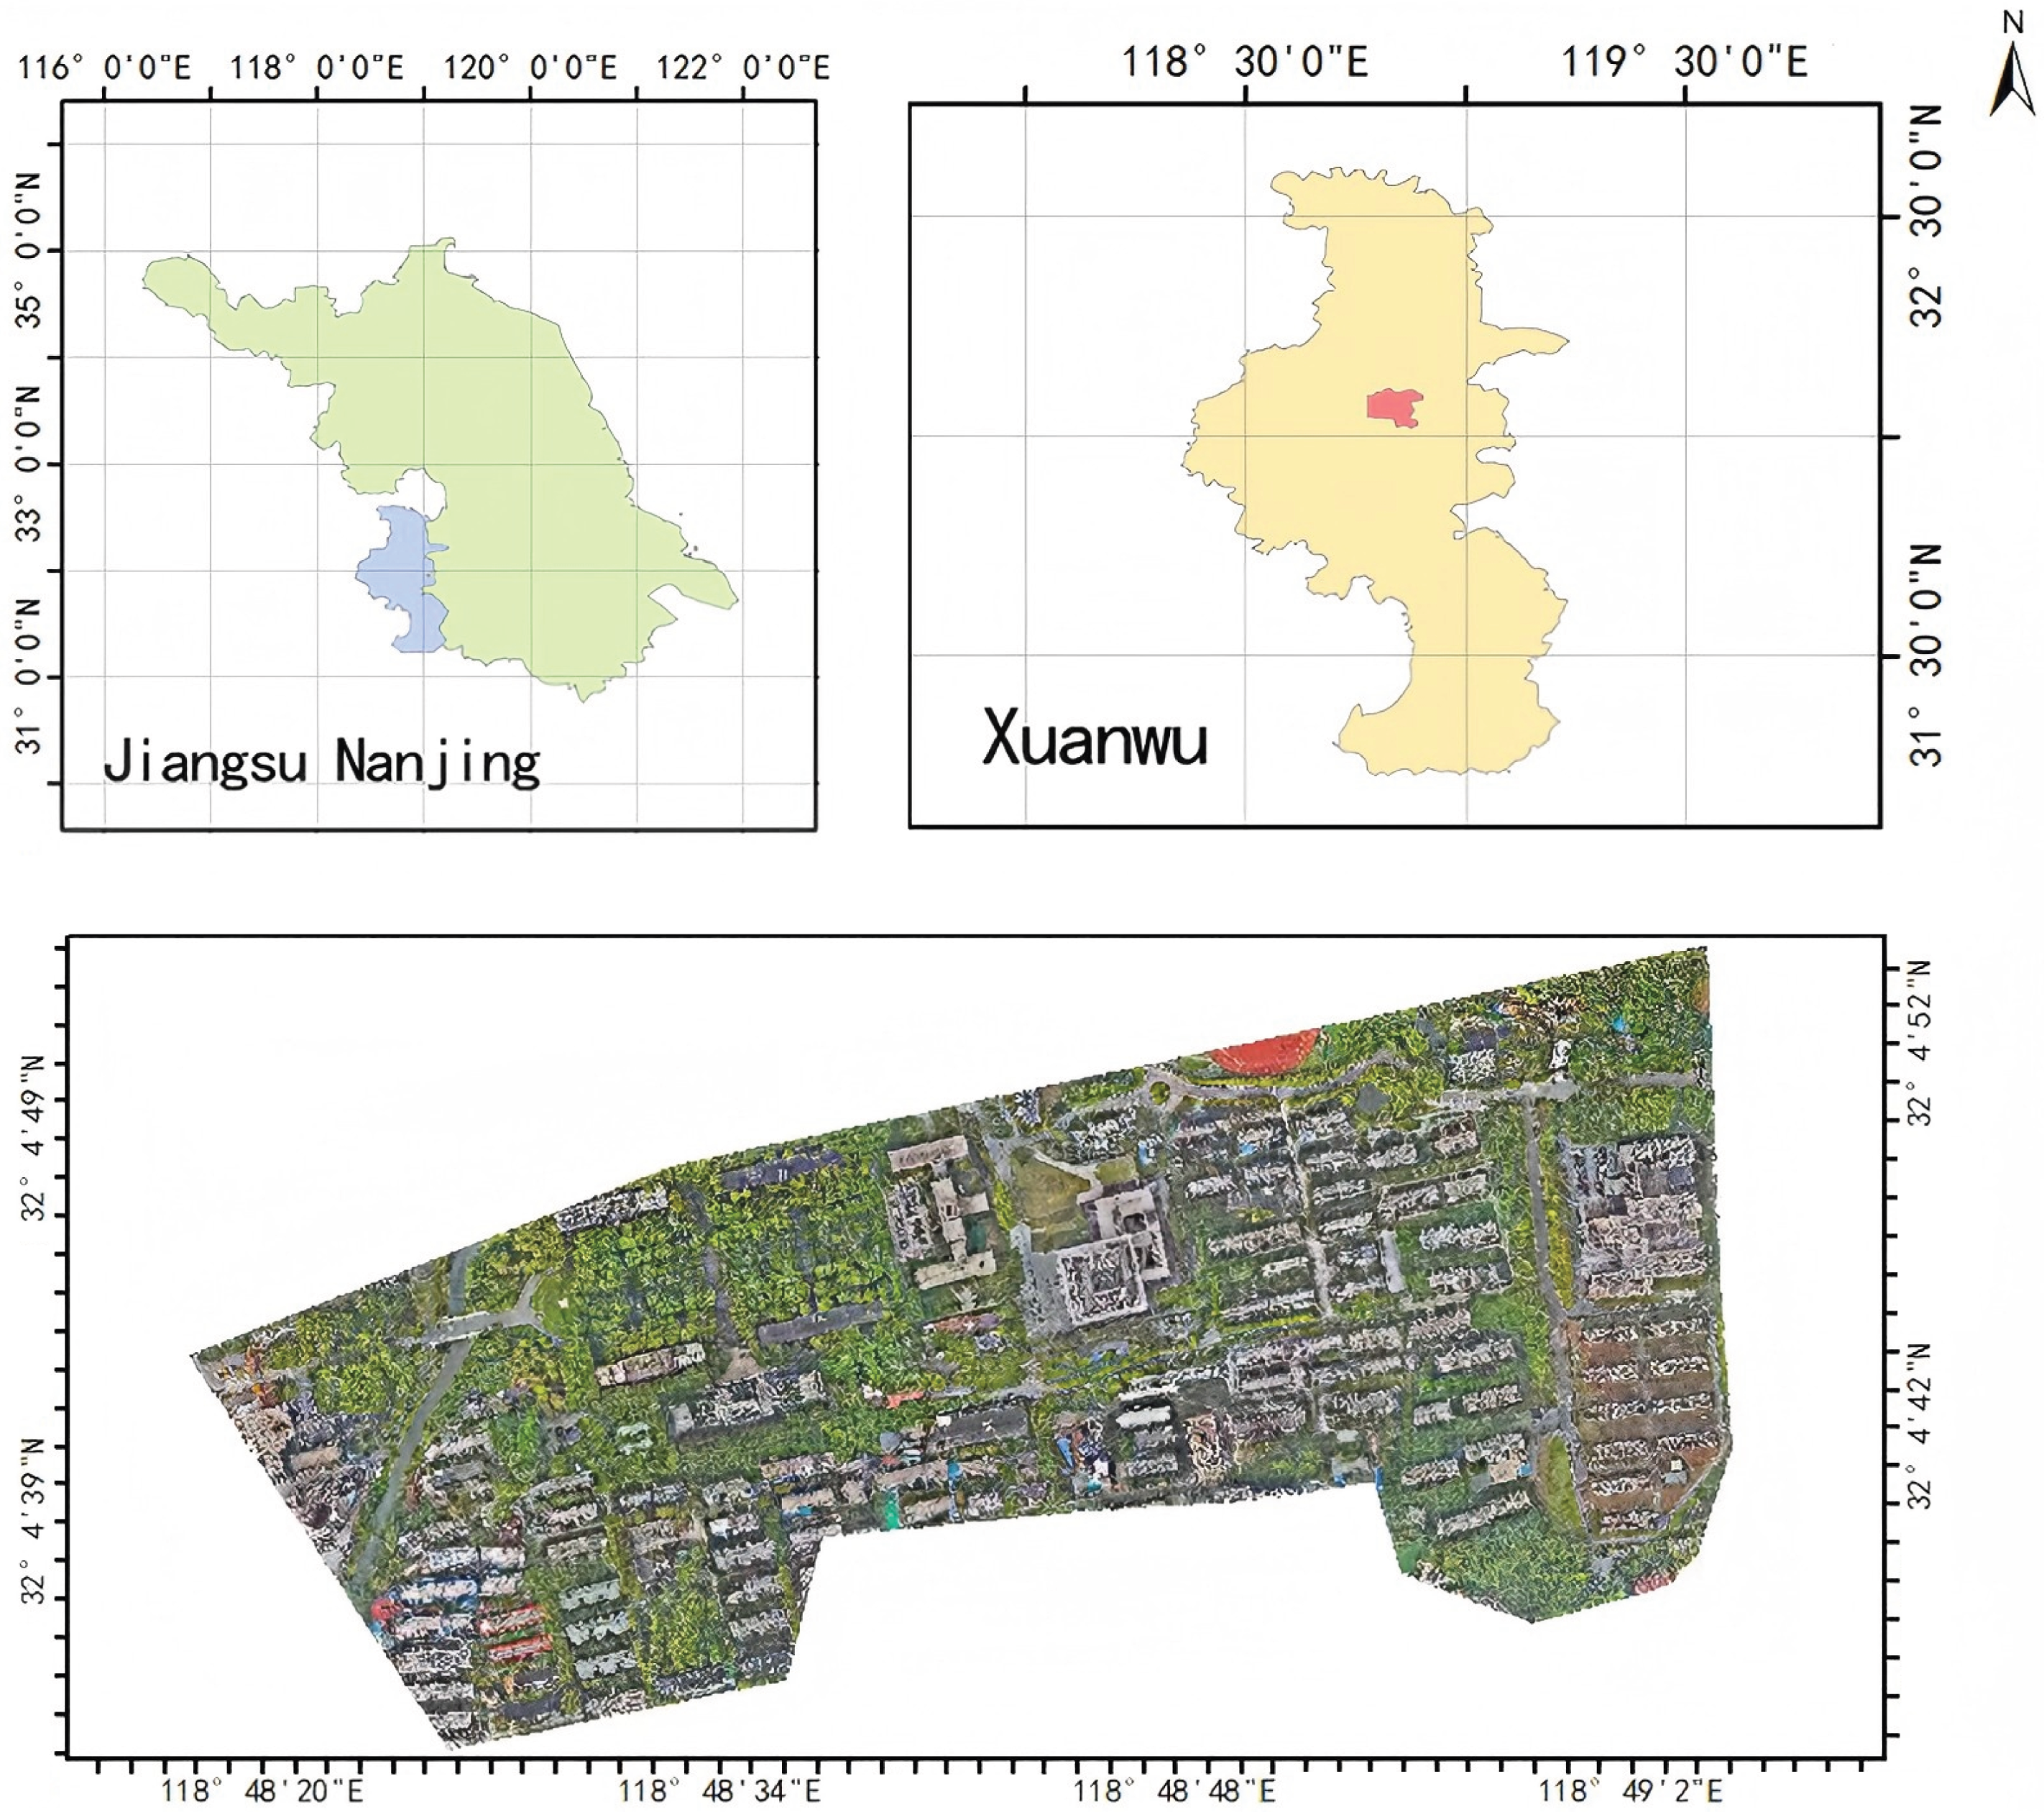
NJFUDataset is a comprehensive plant dataset for plant classification and resource surveys, built upon the website of NJFU Campus Plants (http://plants.njfu.edu.cn). The website is established through an on-site botanical inventory covering the entire NJFU campus, and thus can be regarded as an authoritative reference with near-complete coverage and high identification reliability. The multi-scale location map of NJFUDataset is shown in Figure 6. As a forestry university in East and Central China, this dataset covers 94 families and 222 genera, including 400 common and distinctive plant samples, which supports multi-dimensional plant feature analysis. The spatial resolution is 0.0347 m per pixel (ground sampling distance), and the data are provided as standard .tif files. The dataset integrates remote sensing imagery, field surveys, and ecological parameters, aiming to alleviate the shortage of training data for regional tree species identification, biomass estimation, and growth monitoring, and also supporting campus-scale urban green research such as carbon sink benefit assessment and planting optimization [38,39]. For each dataset, the samples were randomly divided into training, validation, and testing subsets at a ratio of 8:1:1. The same split was used for all compared models to ensure a fair evaluation.
Figure 6.
Hierarchical Spatial Localization of the NJFU Dataset: From Nanjing (Jiangsu Province) to the Study Area in Xuanwu District.
4.2. Evaluation Methods
For fine-grained tree species classification, we adopt a multi-metric evaluation system to quantify overall classification correctness and per-class recognition performance at different hierarchical levels (major, sub-, and minor categories). The metrics are defined as follows:
- Accuracy (Acc).
- Accuracy measures the proportion of correctly classified samples:where N is the number of samples, and denote the ground-truth and predicted labels of sample i, respectively, and is the indicator function.
- Precision (P).
- Precision for class c is the proportion of samples predicted as class c that truly belong to class c:where is the number of true positives of class c, and is the number of samples from other classes incorrectly predicted as class c.
- Recall (R).
- Recall for class c is the proportion of samples of class c that are correctly identified:where is the number of samples of class c incorrectly predicted as other classes.
- F1 score (F1).
- The F1 score is the harmonic mean of precision and recall for class c:For overall evaluation across C classes, macro-averaged F1 can be computed as:
4.3. Qualitative Analysis
We provide the tree-species legends for SZUTreeDataset and NJFUDataset, as shown in Table 2 and Table 3, to support interpretation of the spatial distribution of species in later qualitative results.
Table 2.
Tree species legends for SZUTreeDataset R1/R2 (with a total of 25 species).
Table 3.
Tree species legends for NJFUDataset (with 32 species).
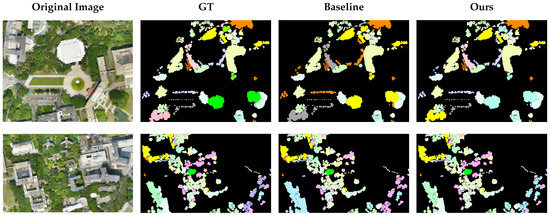
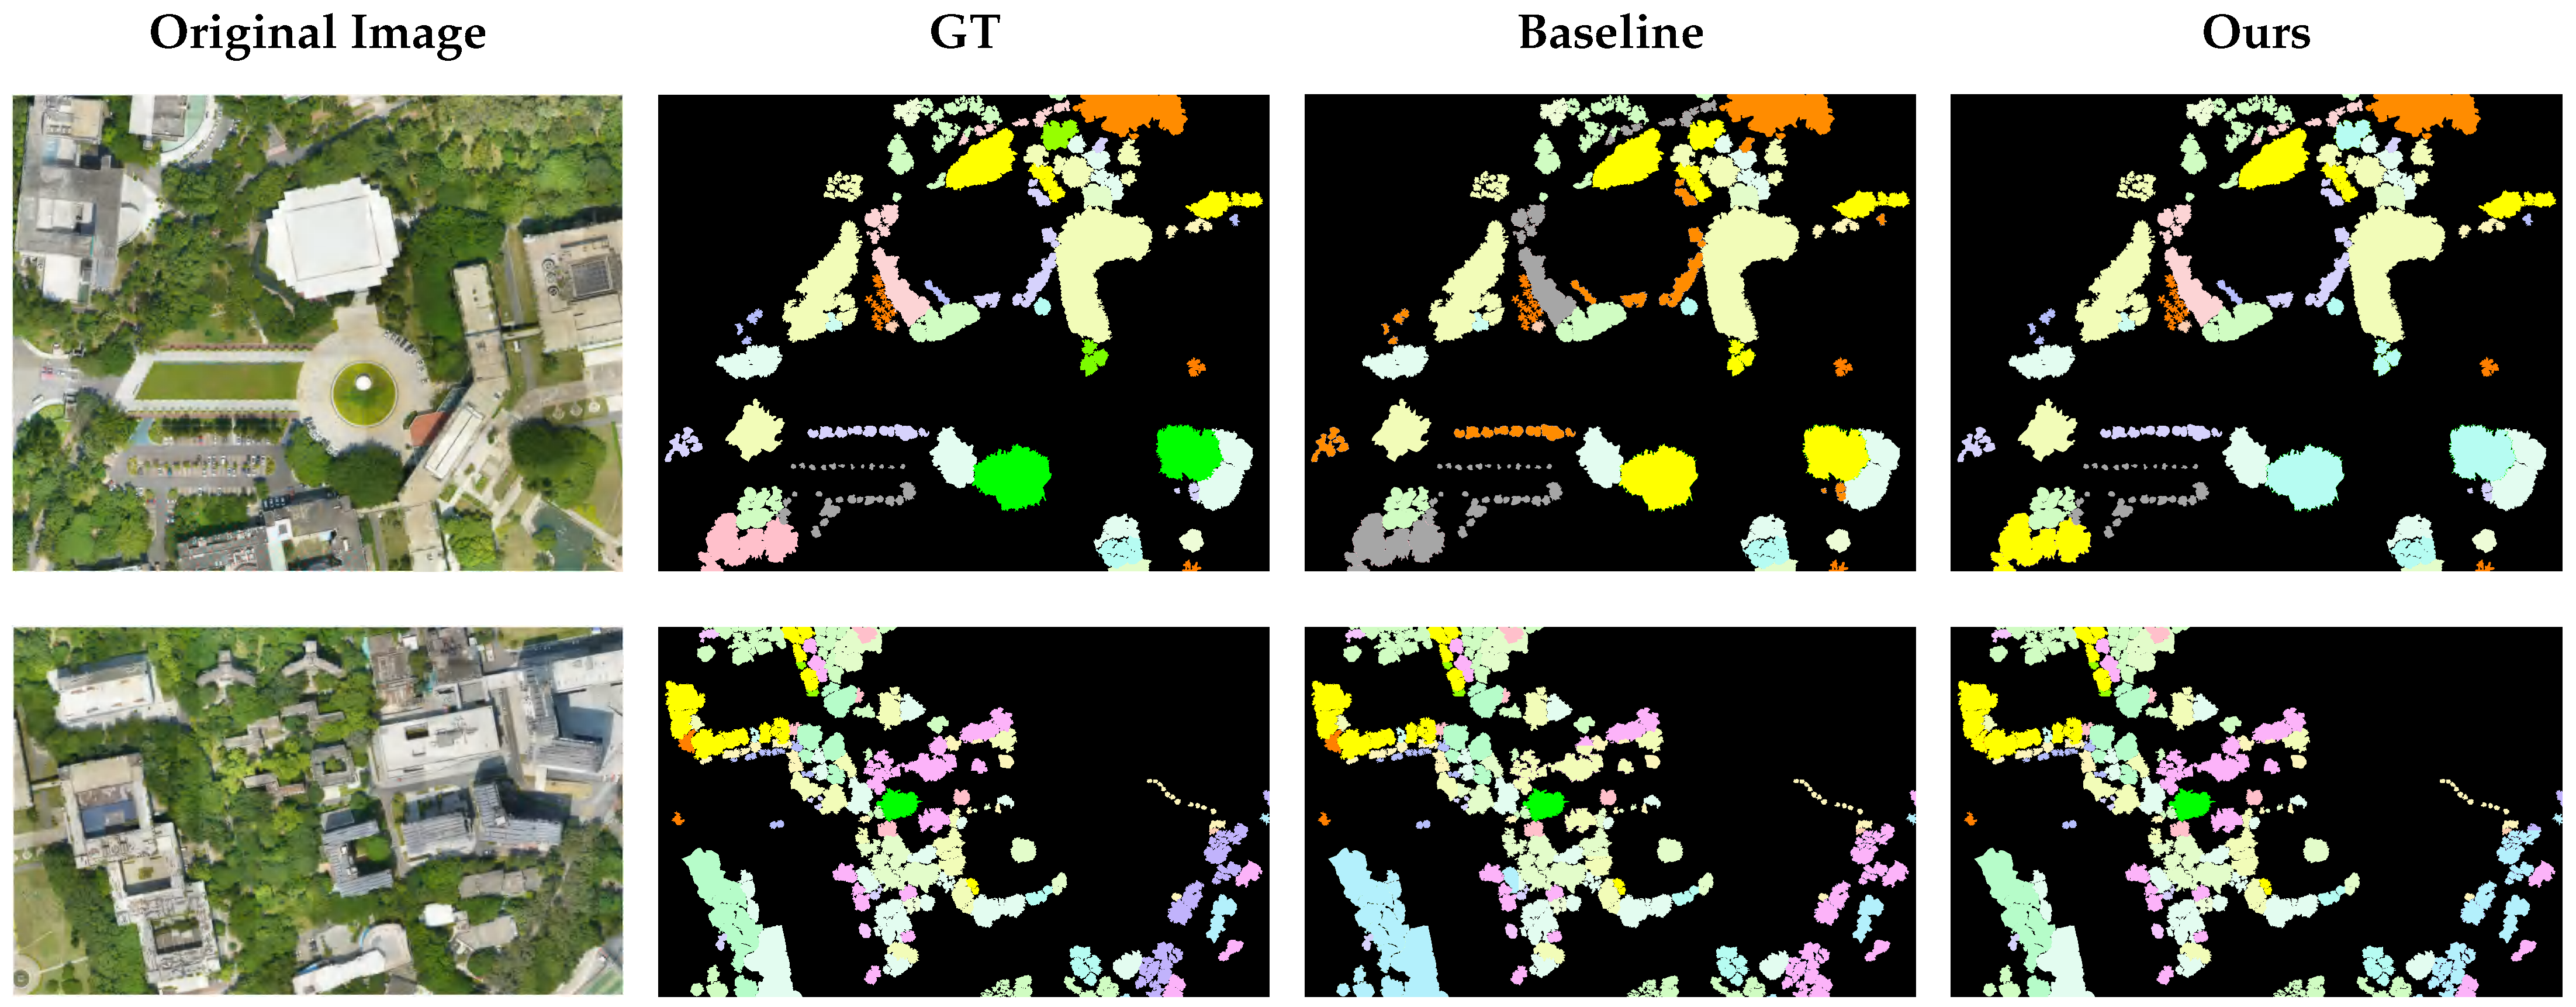
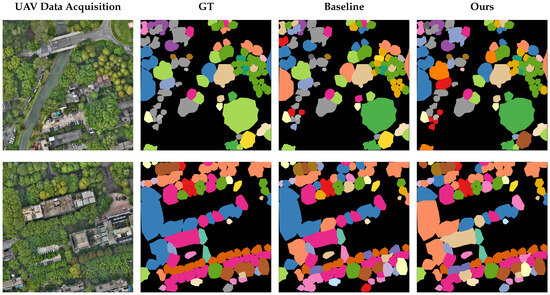
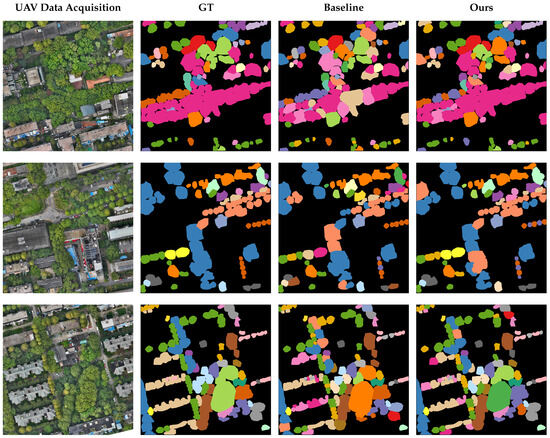
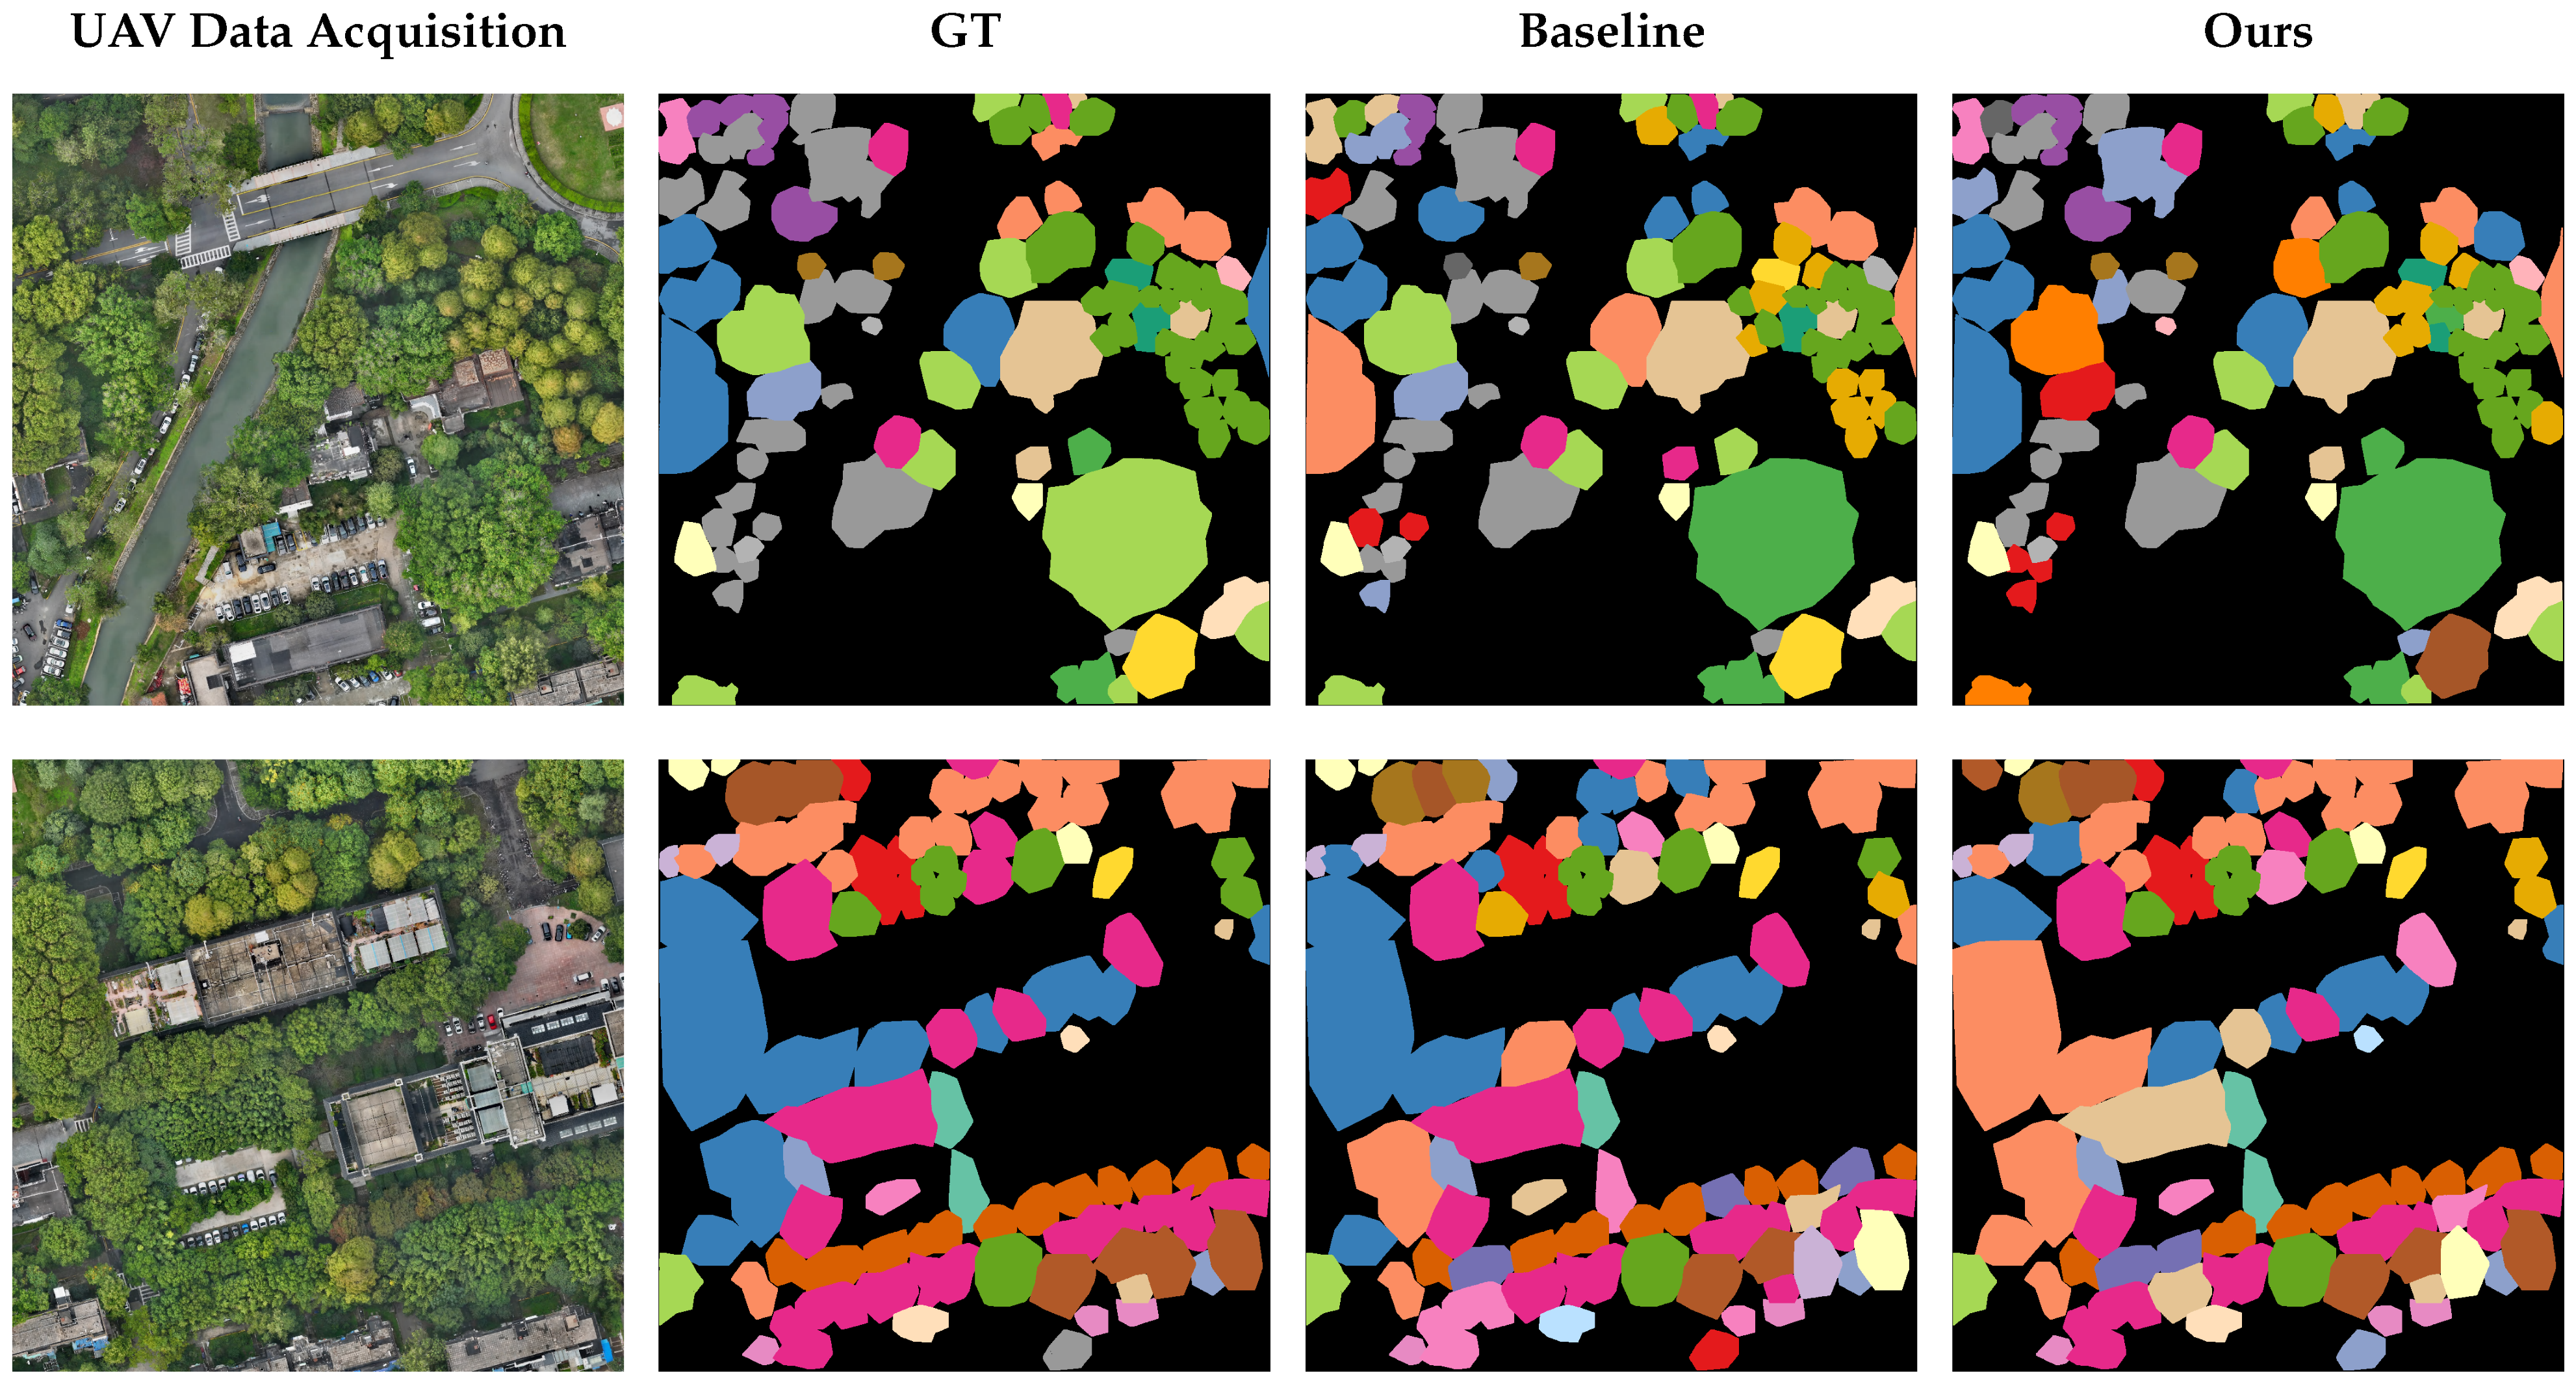
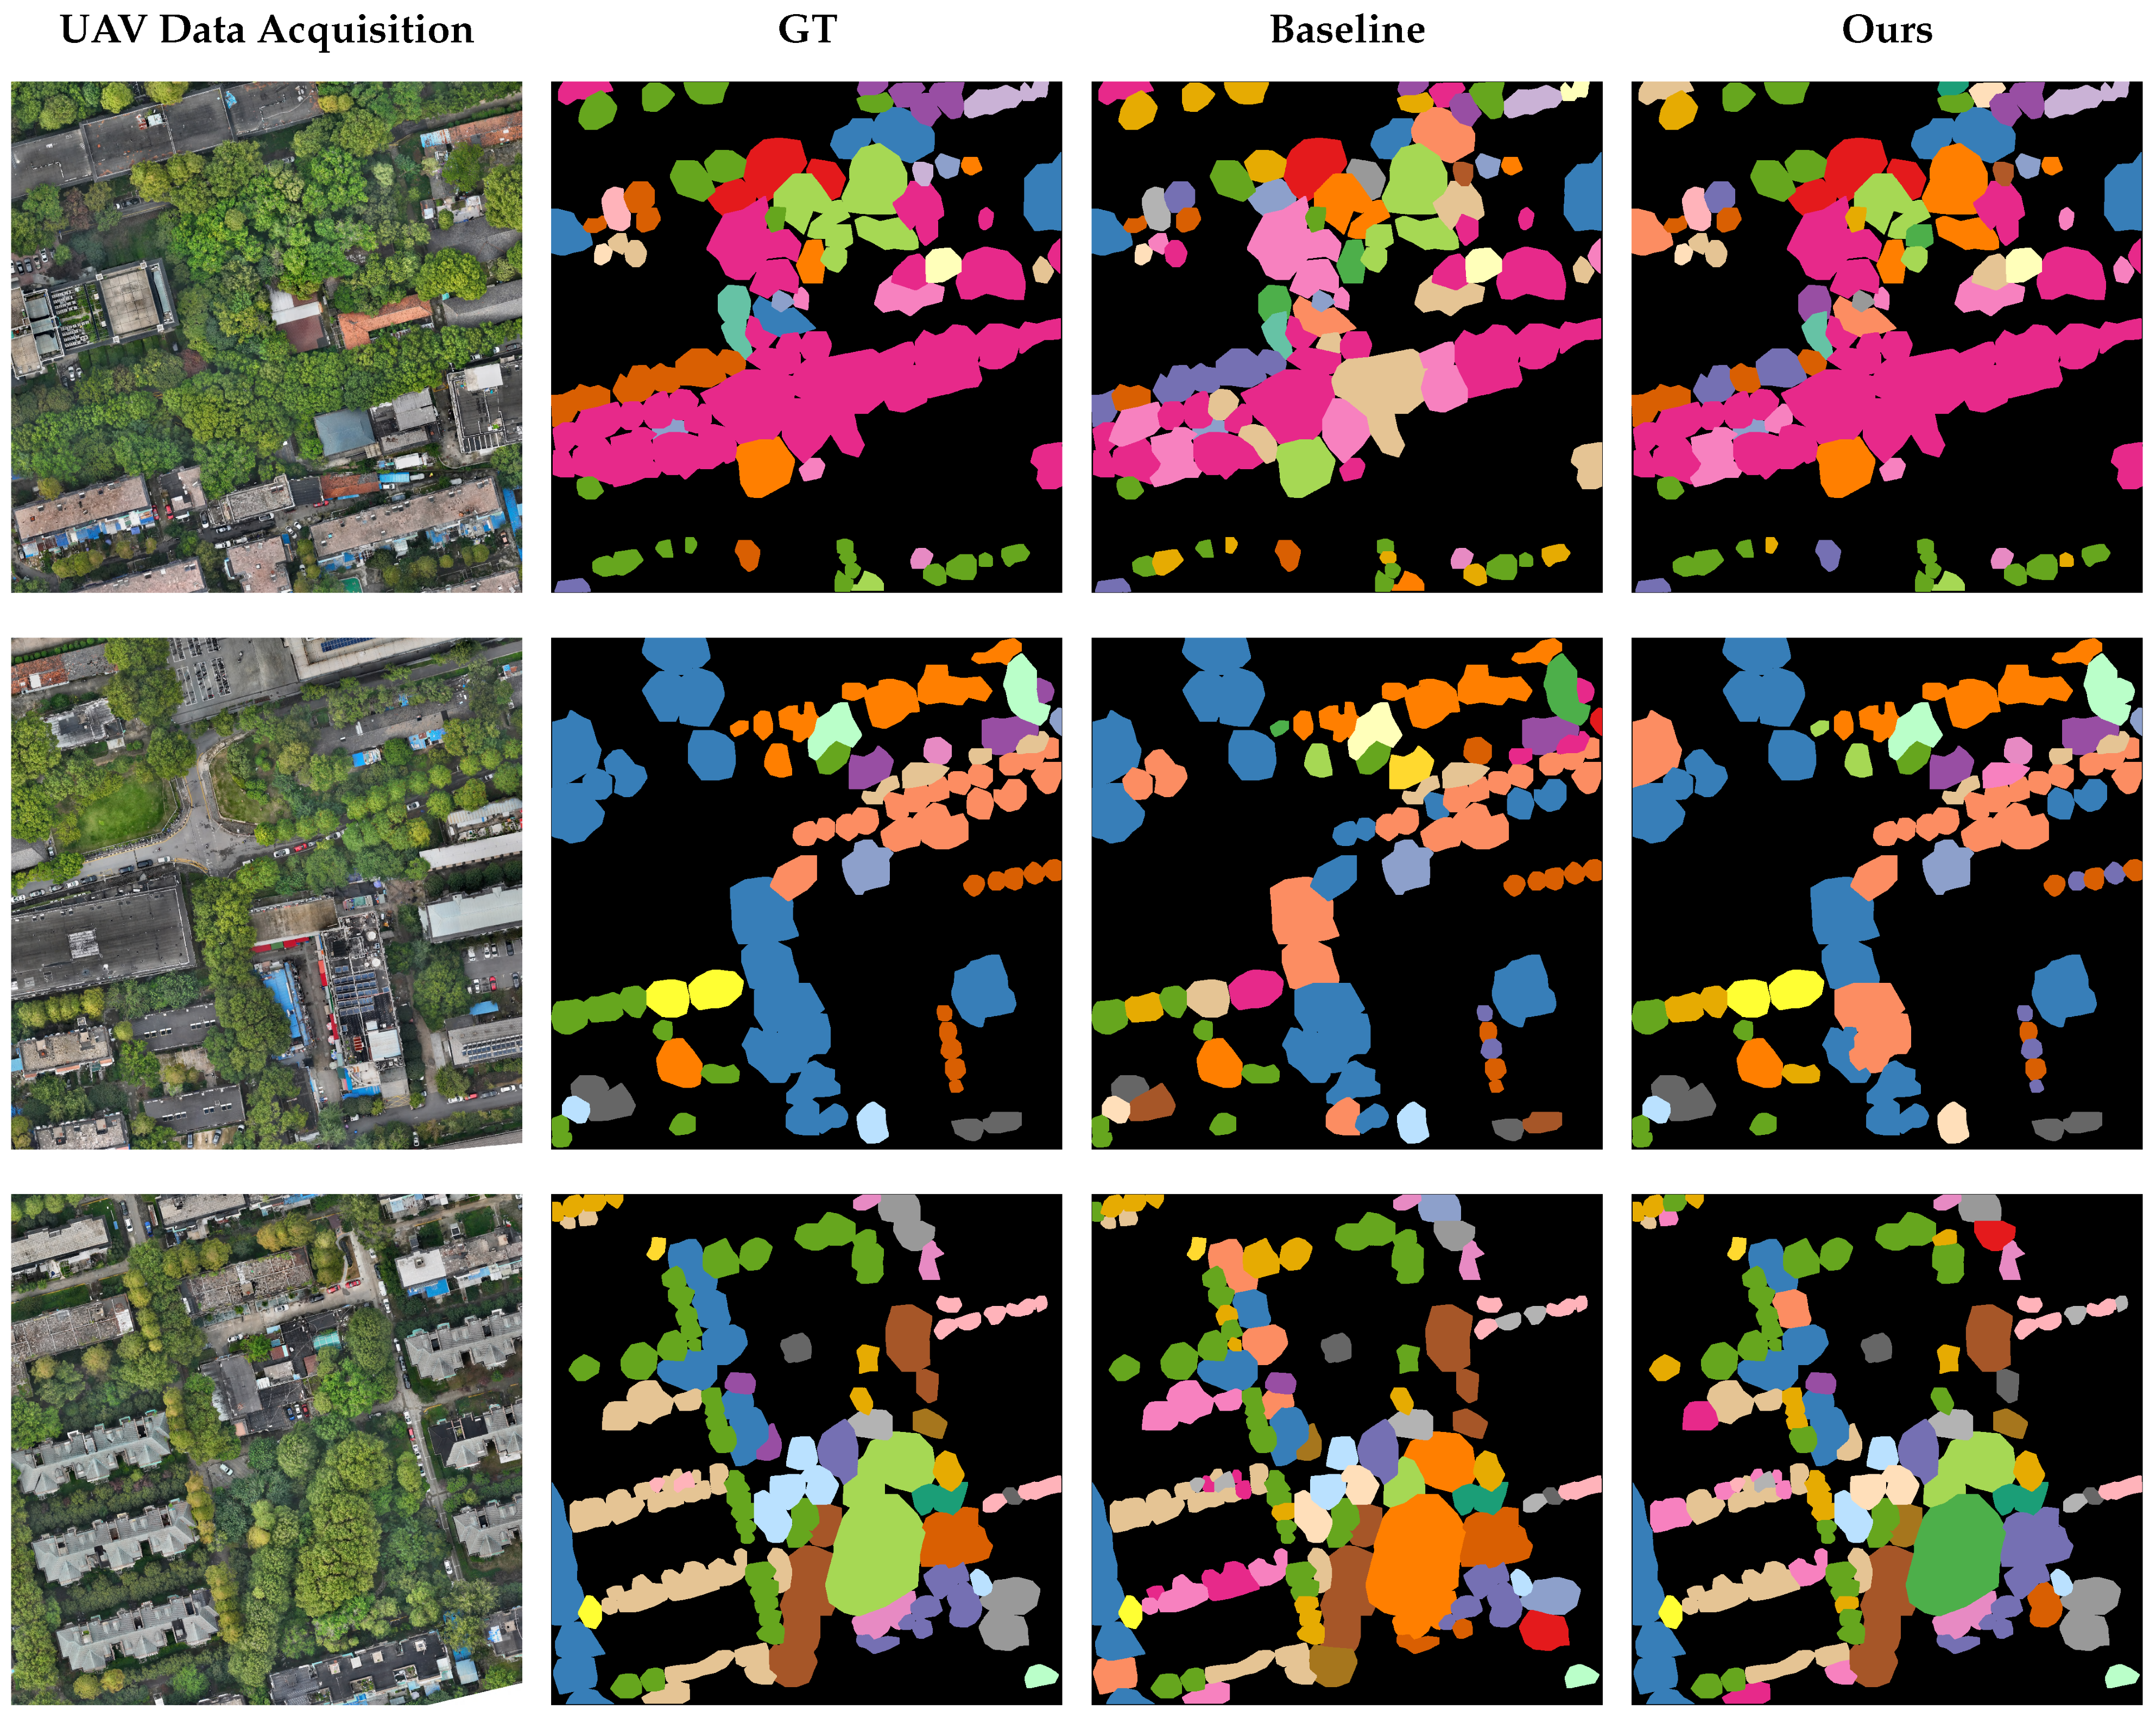
Representative regions from the two datasets are presented to qualitatively compare the original UAV images, ground truth, the MobileViT baseline, and the results of our method (Figure 7 and Figure 8).
Figure 7.
Qualitative classification results on the SZUTreeDataset. Each row shows a representative region. From left to right, the columns show the original UAV image, the ground-truth annotation (GT), the MobileViT baseline prediction, and the proposed TreeSpecViT prediction. The colors representing different tree species follow Table 2 and Table 3. The figure shows that TreeSpecViT produces crown-level predictions closer to the ground truth, especially in regions with complex backgrounds and adjacent tree crowns.
Figure 8.
Qualitative classification results on the NJFUDataset. Each row shows a representative UAV subregion. From left to right, the columns show the original UAV image, the ground-truth annotation (GT), the MobileViT baseline prediction, and the proposed TreeSpecViT prediction. The colors representing different tree species follow Table 2 and Table 3. The figure shows that TreeSpecViT better preserves crown boundaries and species consistency in cluttered regions with dense tree distribution.
On both datasets, the baseline model can roughly locate the main tree crowns. However, it performs poorly in complex backgrounds and in fine-grained category differentiation. In regions R1 and R2 of the SZUTreeDataset, misclassifications are often blocky. Color mixing frequently appears near roadsides, dense forest belts, and buildings. Boundaries between visually similar species are also blurry. On the NJFUDataset, the baseline makes larger errors. The dataset contains more species. The shooting conditions vary more. The model often misclassifies shadowed areas and crowns with similar height. Some species with small crowns or few samples are even missed entirely.
Our method produces predictions that better match the ground truth on both datasets. The overall crown shapes are more accurate. Local texture details are also better preserved. Crown edges are more continuous. Gaps between canopies and grass regions are reduced. False positives on non-vegetation areas such as buildings and roads are also reduced. For adjacent species, the color-block boundaries are clearer. The results better reflect gradual spatial transitions between species. In the more challenging parts of R2 in the SZUTreeDataset and in the NJFUDataset, the baseline often ignores scattered trees. These trees are located along roads or in narrow gaps between buildings. Our method still detects them as separate crowns. This suggests stronger robustness under complex campus scenes.
These observations suggest that BSM suppresses background interference from roads, buildings, and shadows. It makes feature extraction more focused on crown regions. FGF and the GLF head further strengthen sensitivity to local textures and crown-edge morphology. They help maintain clearer decision boundaries when species differences are subtle. Some errors remain on both datasets. They mainly occur for species with very similar morphology. They also occur for small crowns or heavy occlusion. This reflects the intrinsic difficulty of fine-grained tree species recognition.
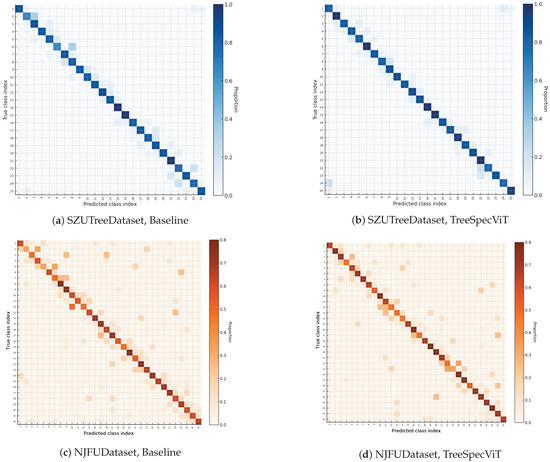
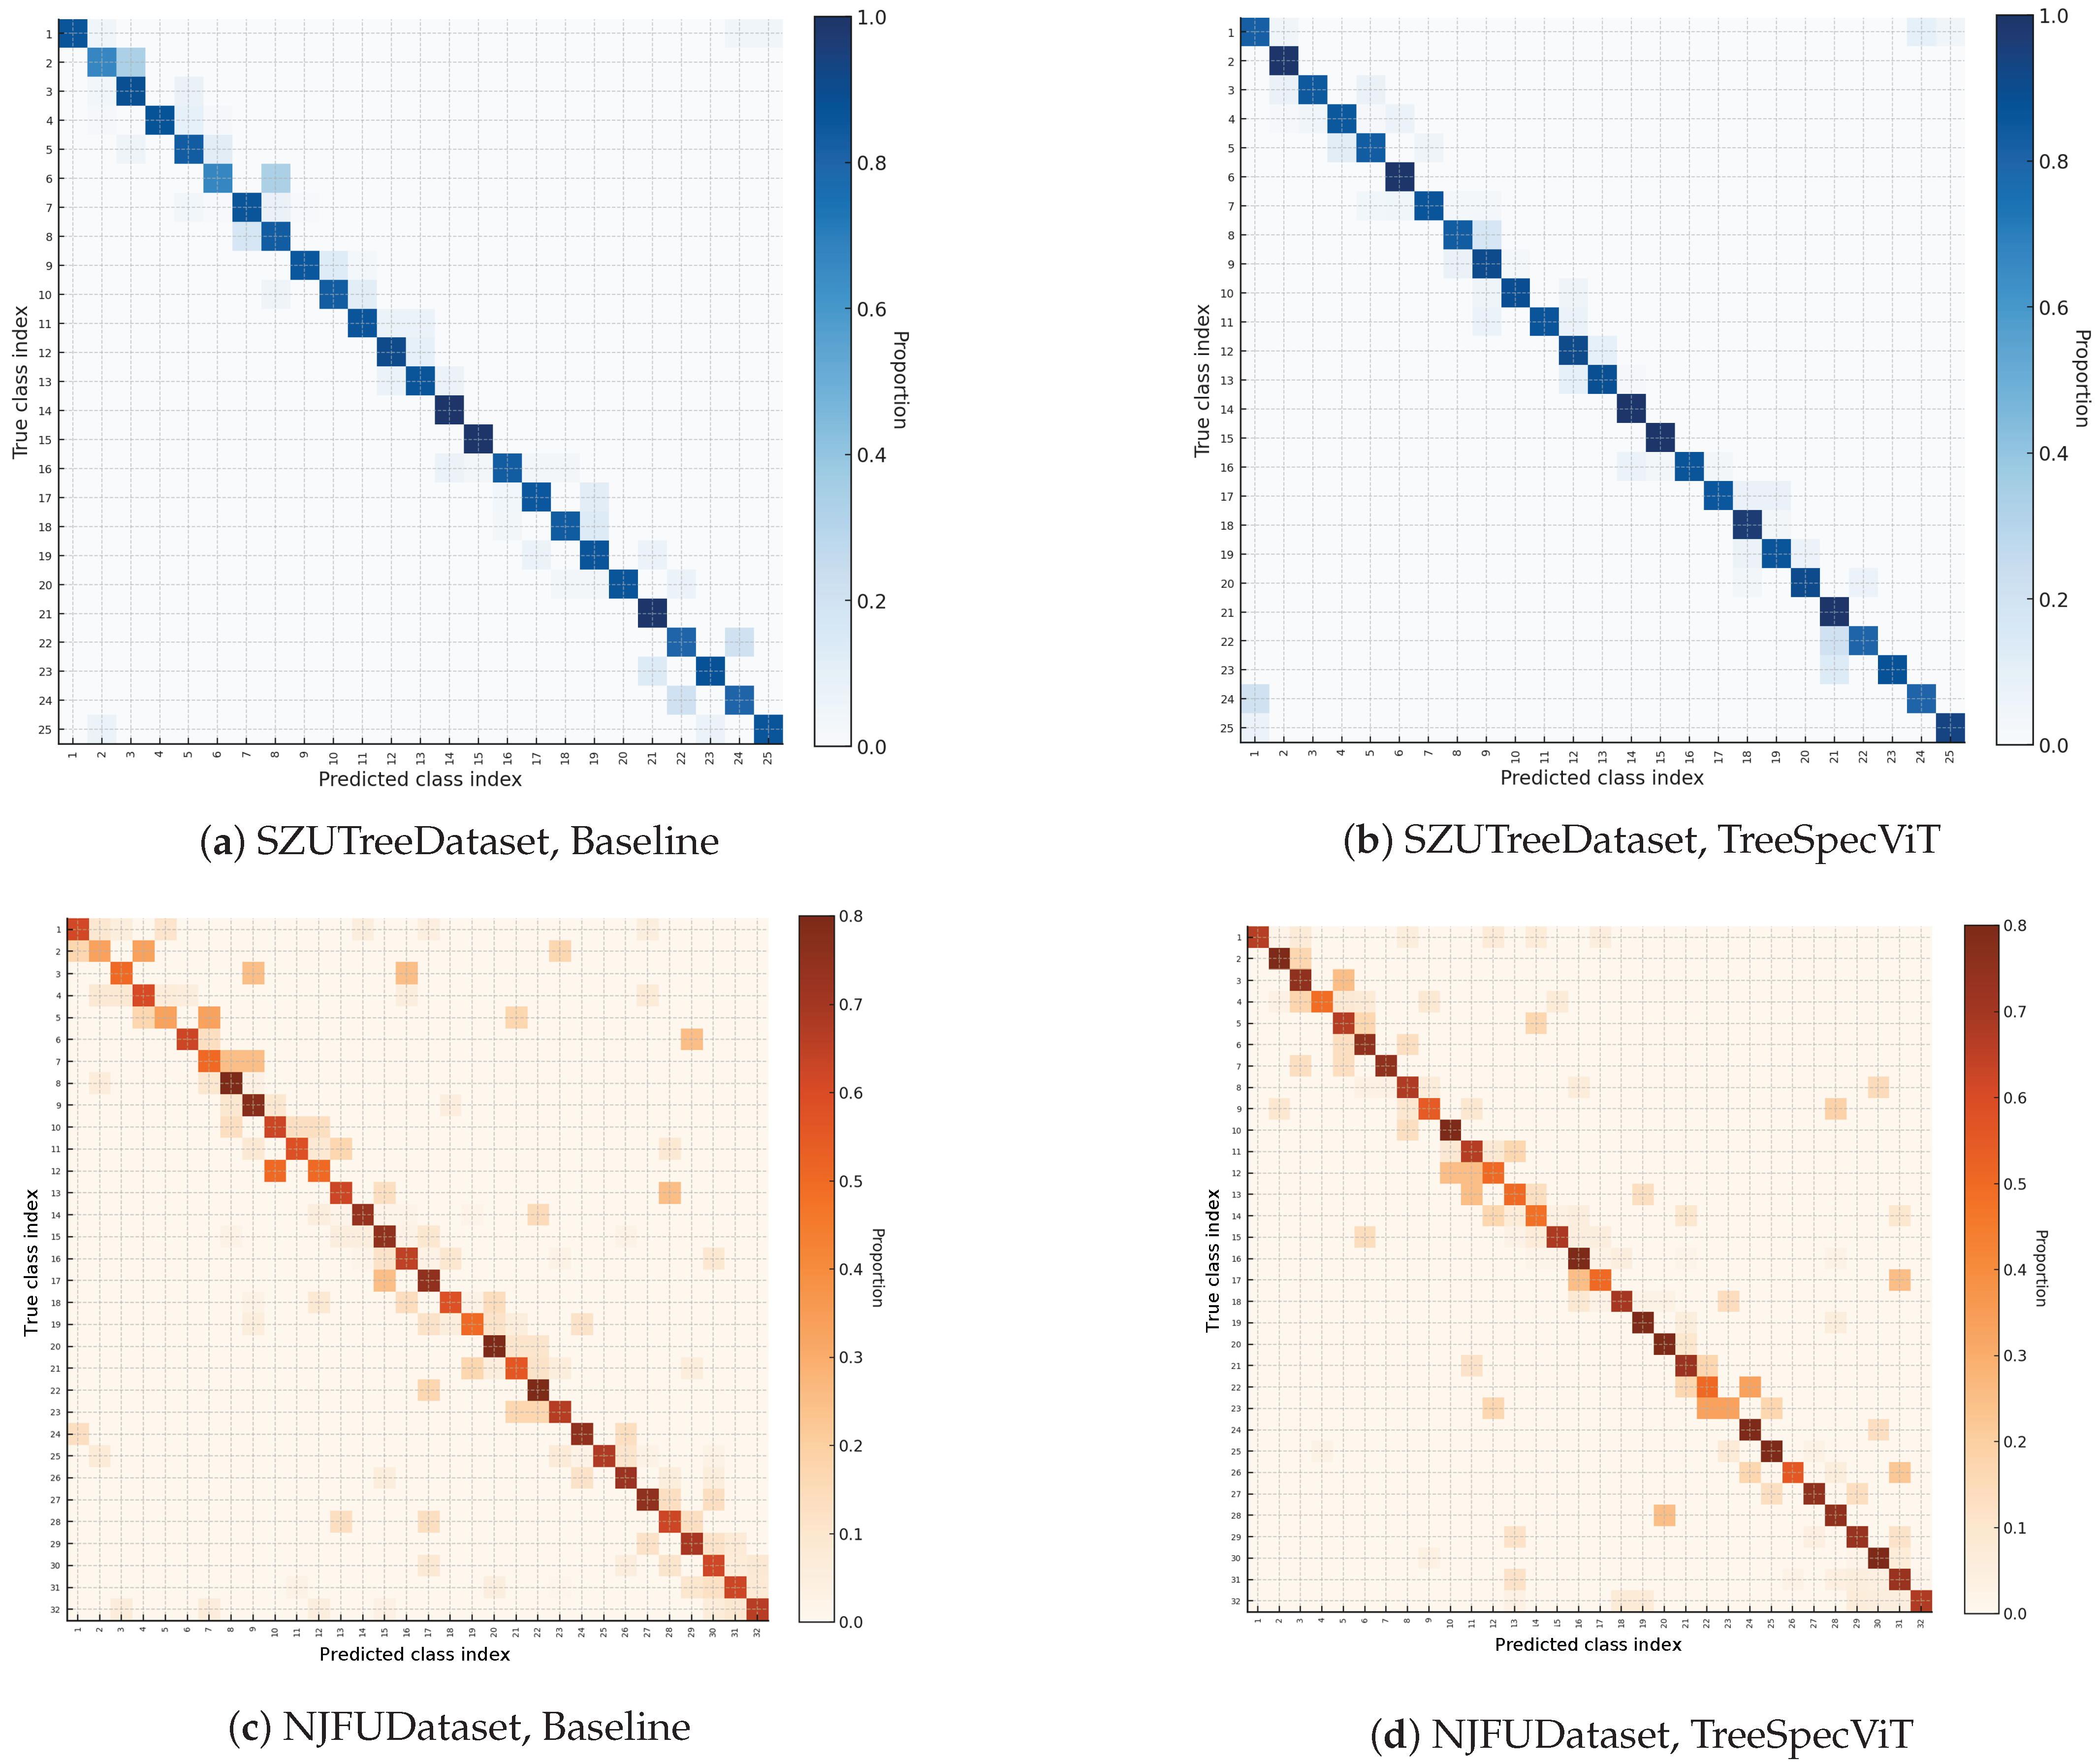
Figure 9 compares the confusion matrices of the MobileViT baseline and the proposed TreeSpecViT on the SZUTreeDataset and NJFUDataset in a 2 × 2 layout. For confusion-matrix analysis, each sample is defined as an individual tree-crown patch used for classification. Accordingly, the confusion matrices are computed at the sample level rather than at the pixel level, and the class indices correspond to the species class numbers listed in Table 2 and Table 3. For each dataset, the baseline and TreeSpecViT results are shown side by side to facilitate direct comparison. Overall, most categories are concentrated along the diagonal, indicating stable discrimination for the majority of classes. The remaining errors mainly follow three systematic patterns: confusion between visually similar species, misclassification of long-tail classes into dominant classes with more training samples, and reduced separability in regions affected by dense crown adjacency, shadows, or other background interference.
Figure 9.
Confusion matrices of the MobileViT baseline and the proposed TreeSpecViT on the SZUTreeDataset and NJFUDataset. Rows denote true class indices and columns denote predicted class indices.
On the SZUTreeDataset, the main confusion is concentrated among several broadleaf species with similar crown appearance. In the baseline model, these classes produce visible cross-stripe and off-diagonal responses, indicating mutual confusion between visually similar categories. In addition, some long-tail classes are more likely to be predicted as dominant classes with larger sample sizes, suggesting a bias caused by class imbalance. In contrast, TreeSpecViT produces a more concentrated diagonal distribution and weaker off-diagonal responses, indicating that the proposed modules improve class separability by suppressing non-canopy interference and preserving more discriminative fine-grained crown features. This improvement is particularly evident for long-tail classes, whose predictions become less biased toward major classes after introducing BSM, FGF, and GLF.
On the NJFUDataset, the confusion pattern is more dispersed than that on the SZUTreeDataset, reflecting the higher task difficulty caused by a larger number of species, stronger seasonal and illumination variation, and more complex canopy appearance differences. In this dataset, misclassification still occurs mainly between species with similar crown shape and leaf color, while minority classes are more likely to be absorbed into nearby dominant classes. Complex UAV scene factors, including dense crown adjacency and shadows, further reduce separability for some classes. Compared with the baseline, TreeSpecViT yields a clearer diagonal structure and reduced off-diagonal confusion for many classes, indicating improved intra-class compactness and inter-class separability under class imbalance and complex background conditions.
Some errors remain on both datasets. They mainly occur in classes with very limited samples and in regions affected by shadows, occlusion, or limited spatial resolution. Although common data-augmentation strategies were used during training to partially alleviate the impact of limited samples in long-tail classes, more dedicated methods, such as class-balanced loss or other imbalance-aware learning strategies, may further improve the recognition of minority classes in future work.
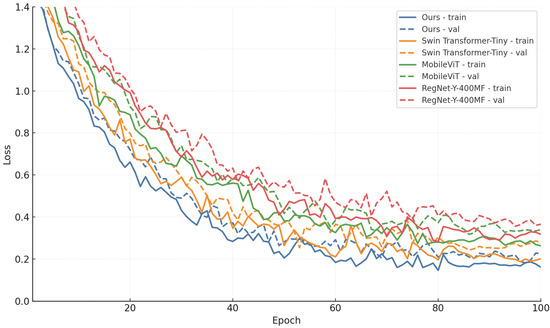
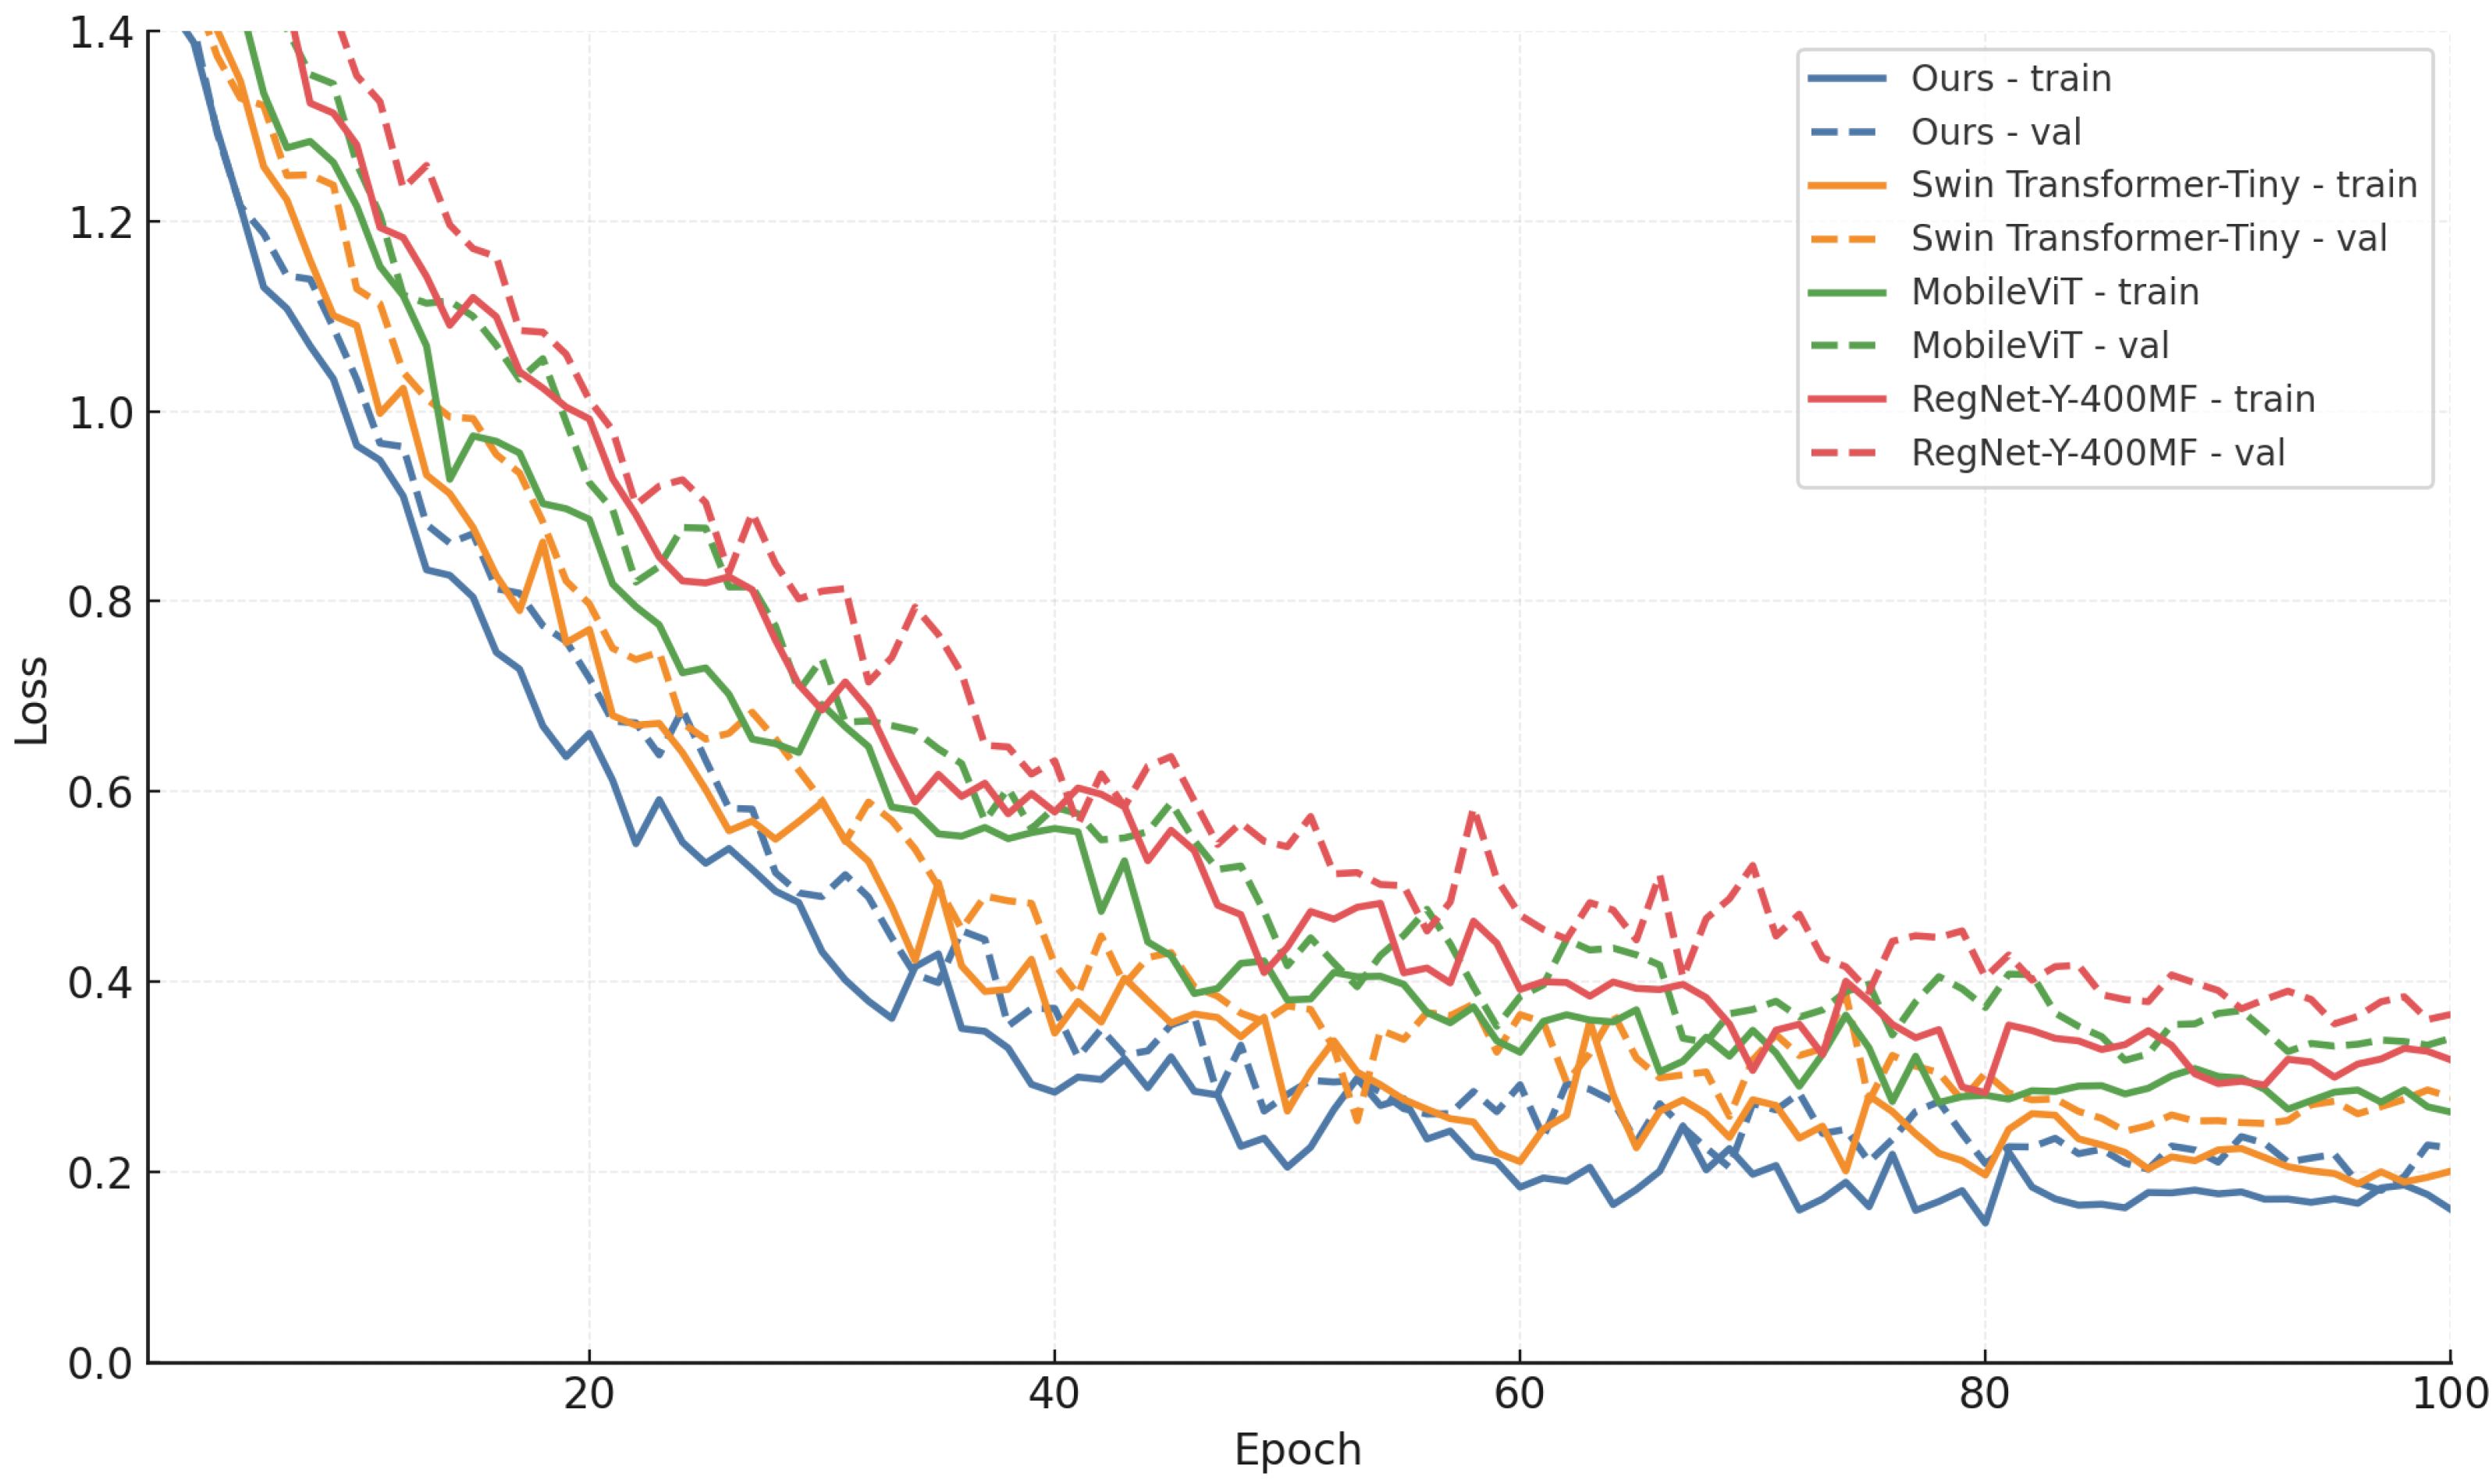
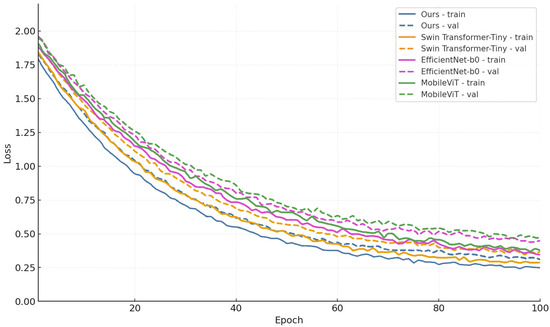
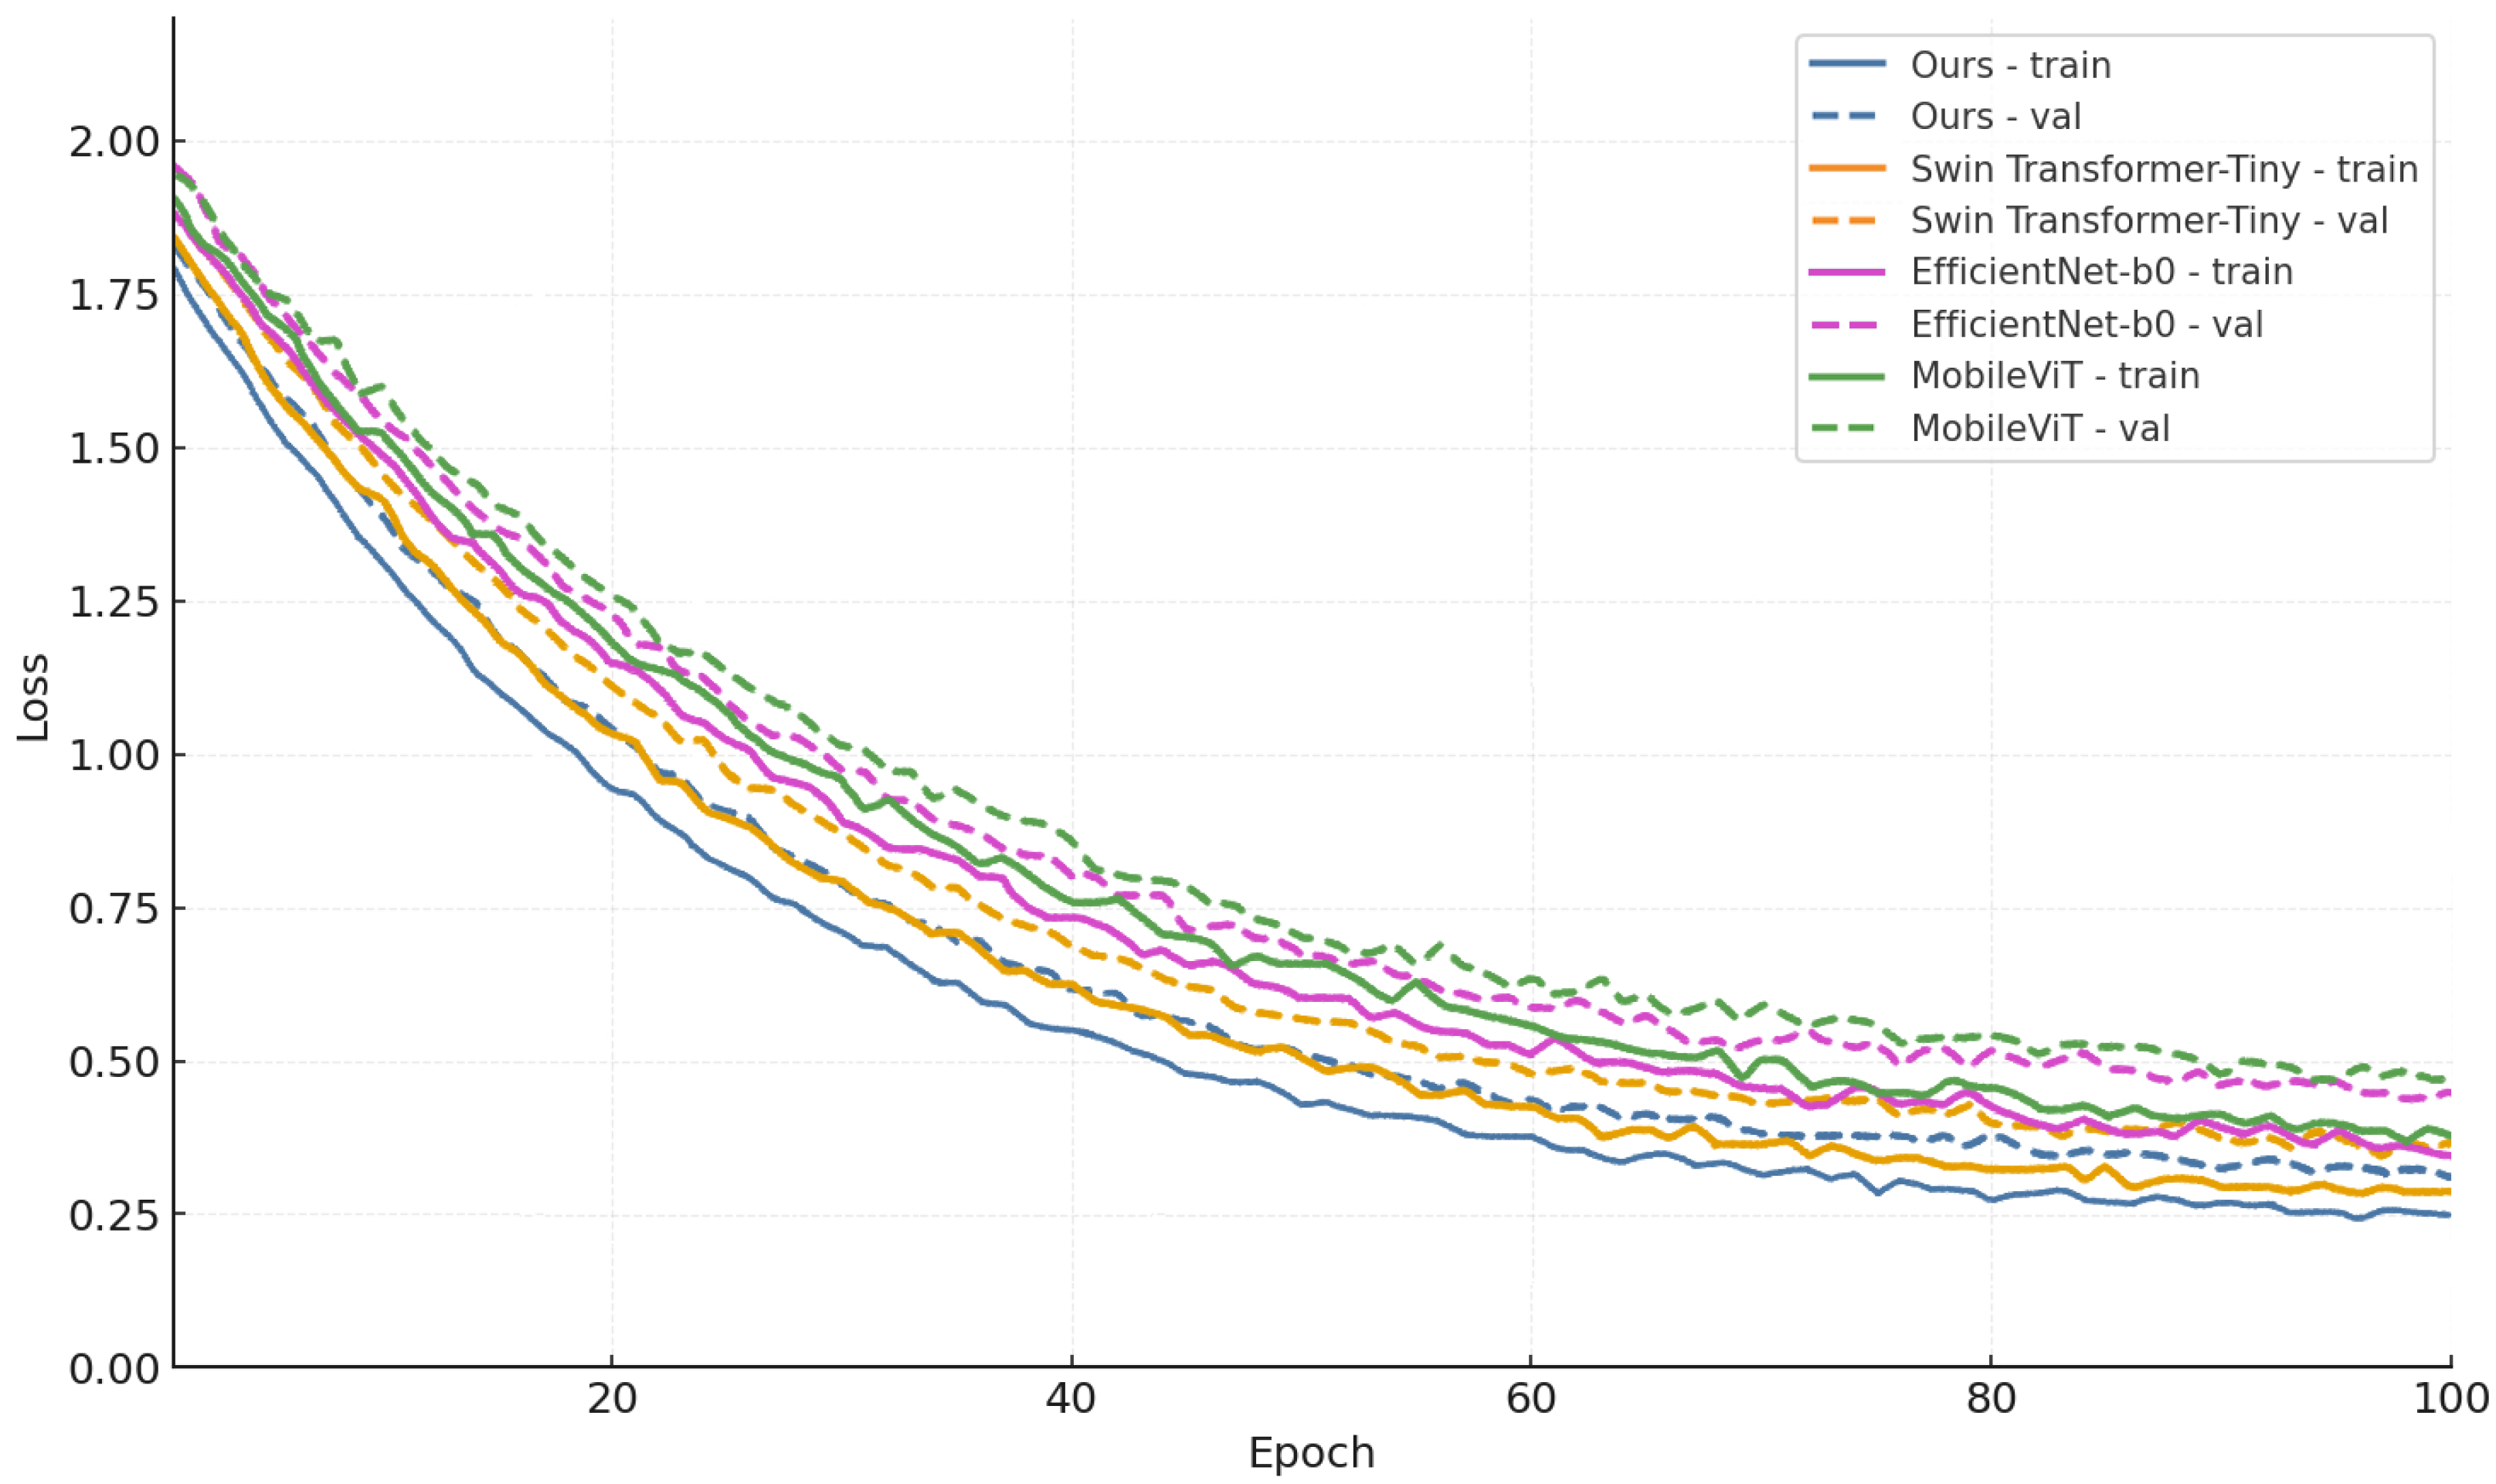
Training and validation loss curves of representative models are provided to compare the convergence behaviors of the proposed method and competing methods on SZUTreeDataset and NJFUDataset (Figure 10 and Figure 11).
Figure 10.
Training and validation loss curves of different models on the SZUTreeDataset.
Figure 11.
Training and validation loss curves of different models on the NJFUDataset.
It can be seen that on both datasets, the method proposed in this paper can quickly reduce the loss to a low level in the previous stages of training, and then steadily converge within a relatively smooth range. The gap between the training curve and the validation curve remains small, with no prolonged oscillations or obvious overfitting. In contrast, some of the comparison models experience slow loss reduction or even slight increases in the later stages, especially on more complex datasets like NJFUDataset, where inter-class differences are more subtle, showing more noticeable fluctuations. This indicates that in more challenging scenarios, the method proposed in this paper can still maintain good optimization stability and generalization ability, which corroborates the previously demonstrated advantages in accuracy, F1 score, and confusion matrix.
4.4. Quantitative Analysis
To systematically evaluate the overall performance of the proposed framework in fine-grained tree species classification, this study uses the SZUTreeDataset and NJFUDataset, selecting various mainstream lightweight CNNs and vision Transformers, including MobileViT, MobileNetV3, RegNet, DenseNet, EfficientNet, Swin Transformer, EfficientFormer, ViT, and ConvNeXt, as well as two fine-grained recognition baselines, BCNN and TransFG, as comparison models. A quantitative comparison is conducted based on four metrics: Accuracy, Precision, Recall, and F1, with results shown in Table 4, while the model complexity comparison is reported in Table 5. Overall, Transformer and CNN–Transformer hybrid structures generally outperform pure CNN models, and under similar lightweight constraints, the proposed method achieves the best or jointly best overall performance on both datasets.
Table 4.
Quantitative results on SZUTreeDataset and NJFUDataset.
Table 5.
Model complexity comparison of representative models.
Compared with lightweight CNN models, the baseline MobileViT has already shown significant advantages on both datasets, but it is still affected by complex backgrounds and confusion between similar tree species. After introducing BSM, FGF, and GLF Head, our method achieves stable improvements on both datasets: on the SZUTreeDataset, Accuracy increases from 81.82% to 87.88% and F1 from 71.40% to 76.48%, improving by 6.06 and 5.08 percentage points respectively; on the NJFUDataset, Accuracy rises from 71.20% to 76.30% and F1 from 62.90% to 70.10%, improving by 5.10 and 7.20 percentage points respectively. As shown in Table 5, it can be seen that, while maintaining a parameter scale and computational cost similar to MobileViT, the proposed combination of modules brings consistent and substantial gains on both datasets. Comparing our method with other Transformers or hybrid architectures as well as fine-grained recognition baselines further shows that the F1 score is the highest among all methods on both datasets: on the SZUTreeDataset, our F1 is 76.48%, about 1.28 percentage points higher than the second-best model, TransFG, which has 75.20%; on the NJFUDataset, our F1 is 70.10%, still about 1.70 percentage points higher than the second-best model, TransFG (68.40%). Additionally, there is a good balance between Precision and Recall, without a situation where one metric is high while the other drops significantly, indicating that the model does not achieve high scores by favoring majority classes, but rather has strong recognition ability across the overall class distribution. It should be noted that, compared to SZUTreeDataset, Accuracy and F1 are generally lower for all methods on NJFUDataset, reflecting the higher difficulty of this dataset due to tree species diversity, variations in shooting conditions, and background interference. Even in this more challenging setting, our method maintains a lead over all comparison methods in both key metrics, indicating that the proposed BSM, FGF, and GLF combination is not only effective within a single campus scenario but also demonstrates strong cross-region generalization ability and robustness to complex backgrounds.
In summary, under the premise that the number of parameters and computational cost are on the same level as MobileViT, the method proposed in this paper can consistently and significantly improve Accuracy and F1 on both SZUTreeDataset and NJFUDataset. It also achieves the best overall performance among various lightweight models, fine-grained recognition baselines, balancing accuracy, efficiency, and deployability, thus providing reliable support for the practical application of fine-grained tree species classification for drones in campus and urban greening management scenarios.
4.5. Ablation Experiment
Table 6 presents the results of module ablation experiments conducted on the NJFU dataset. As shown in the table, when using MobileViT as the baseline, the accuracy is 71.20%, precision is 62.85%, recall is 63.40%, and F1 score is 62.90%. When individually adding each module to this baseline, all three yielded stable yet varying performance gains. Adding only BSM boosted accuracy to 72.60% and F1 to 64.00% (+1.10 percentage points), demonstrating that image-level background suppression effectively mitigates interference from roads, buildings, and shadows. Adding only FGF increased accuracy to 73.05% and F1 to 65.10% (+2.20 percentage points), representing the largest improvement among the three standalone configurations. This demonstrates that explicitly guiding fine-grained features before tokenization is particularly crucial for distinguishing similar tree species. When only the GLF head was added, accuracy reached 72.30% and F1 reached 64.00%, primarily improving precision. This demonstrates that global–local feature fusion can reduce misclassifications of partially boundary-blurred and long-tail categories. The ablation results suggest that BSM, FGF, and GLF are complementary because they act on different stages of the feature-extraction and decision pipeline. BSM is introduced in the early feature-learning stage to suppress non-canopy interference and improve the foreground signal-to-noise ratio. FGF is applied before tokenization to enhance subtle fine-grained canopy cues, so that the generated tokens preserve more discriminative information. GLF is used at the prediction stage to combine holistic crown semantics with local structural cues that may be weakened by purely global summarization. From this perspective, the three modules address different but connected aspects of the task: background suppression, fine-grained feature enhancement, and global–local representation fusion. Their joint use, therefore, leads to more stable gains than any single module alone.
Table 6.
Ablation experiment results for NJFUDataset. ✓ indicates that the corresponding module is enabled, while a blank entry indicates that it is not used.
Performance gains become more pronounced when combining multiple modules. The joint use of BSM and FGF increases accuracy to 74.80% and F1 to 67.00% (a +4.10 percentage point improvement over the baseline). Combining BSM with GLF raises F1 to 65.90%. When FGF and GLF are combined, accuracy is 74.30% and F1 is 66.40%. The F1 scores of these three combinations significantly outperform any single module, indicating functional complementarity among background suppression, fine-grained guidance, and global-local fusion. Specifically, the front-end BSM provides cleaner foreground input, the intermediate FGF enhances detail discrimination, and the back-end GLF further integrates global semantics with local textures during category decision-making.
When all three modules (BSM + FGF + GLF) are enabled, the model achieves peak performance: Accuracy rises to 76.30% and F1 reaches 70.10%, representing improvements of 5.10 and 7.20 percentage points over the baseline, respectively. Concurrently, precision and recall also increase to 70.95% and 69.90%. Combined with the parameter and complexity analysis discussed earlier, this significant accuracy gain is achieved while maintaining the same order of magnitude of parameters and inference overhead as MobileViT. This fully validates the effectiveness and high cost-effectiveness of the proposed module design for the fine-grained classification task of tree species in complex urban campus UAV environments.
4.6. Digital Tree Archive Results
Using representative species from the NJFUDataset as examples, Table 7 lists the key fields in the digital archive. The table includes species name, crown area, equivalent diameter, major and minor diameters, and perimeter. These values highlight morphological differences among species.
Table 7.
Core Parameters of Digital Archives for Representative Tree Species (NJFU Dataset).
The archived attributes illustrate how species labels and crown geometry can be integrated into structured individual-tree records. These records support several downstream applications, including differential maintenance, resource and carbon assessment, and preliminary risk screening. For example, crown area and perimeter provide references for crown-size evaluation, while the ratio can help identify asymmetric crowns that may require further inspection. These results demonstrate the practical value of converting recognition outputs into tree-level information for campus green-space inventory and management. At the same time, the digital tree archive is constructed from predicted species labels and extracted crown-level information, so its reliability is inherently affected by the accuracy of the classification model. Species-level misclassification may propagate to downstream ecological indicators, especially those related to species composition and species-specific statistics. Although the current framework shows practical value for campus-scale tree inventorying, future work could further improve the reliability of derived indicators through confidence-aware filtering or targeted manual verification.
4.7. Human–Vegetation Coupling Results
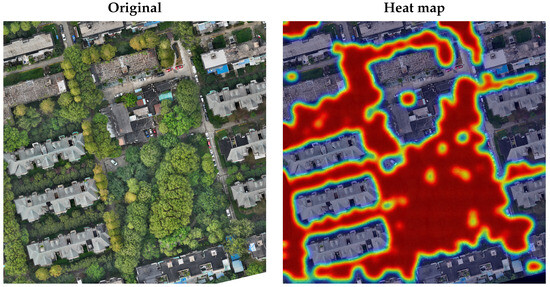
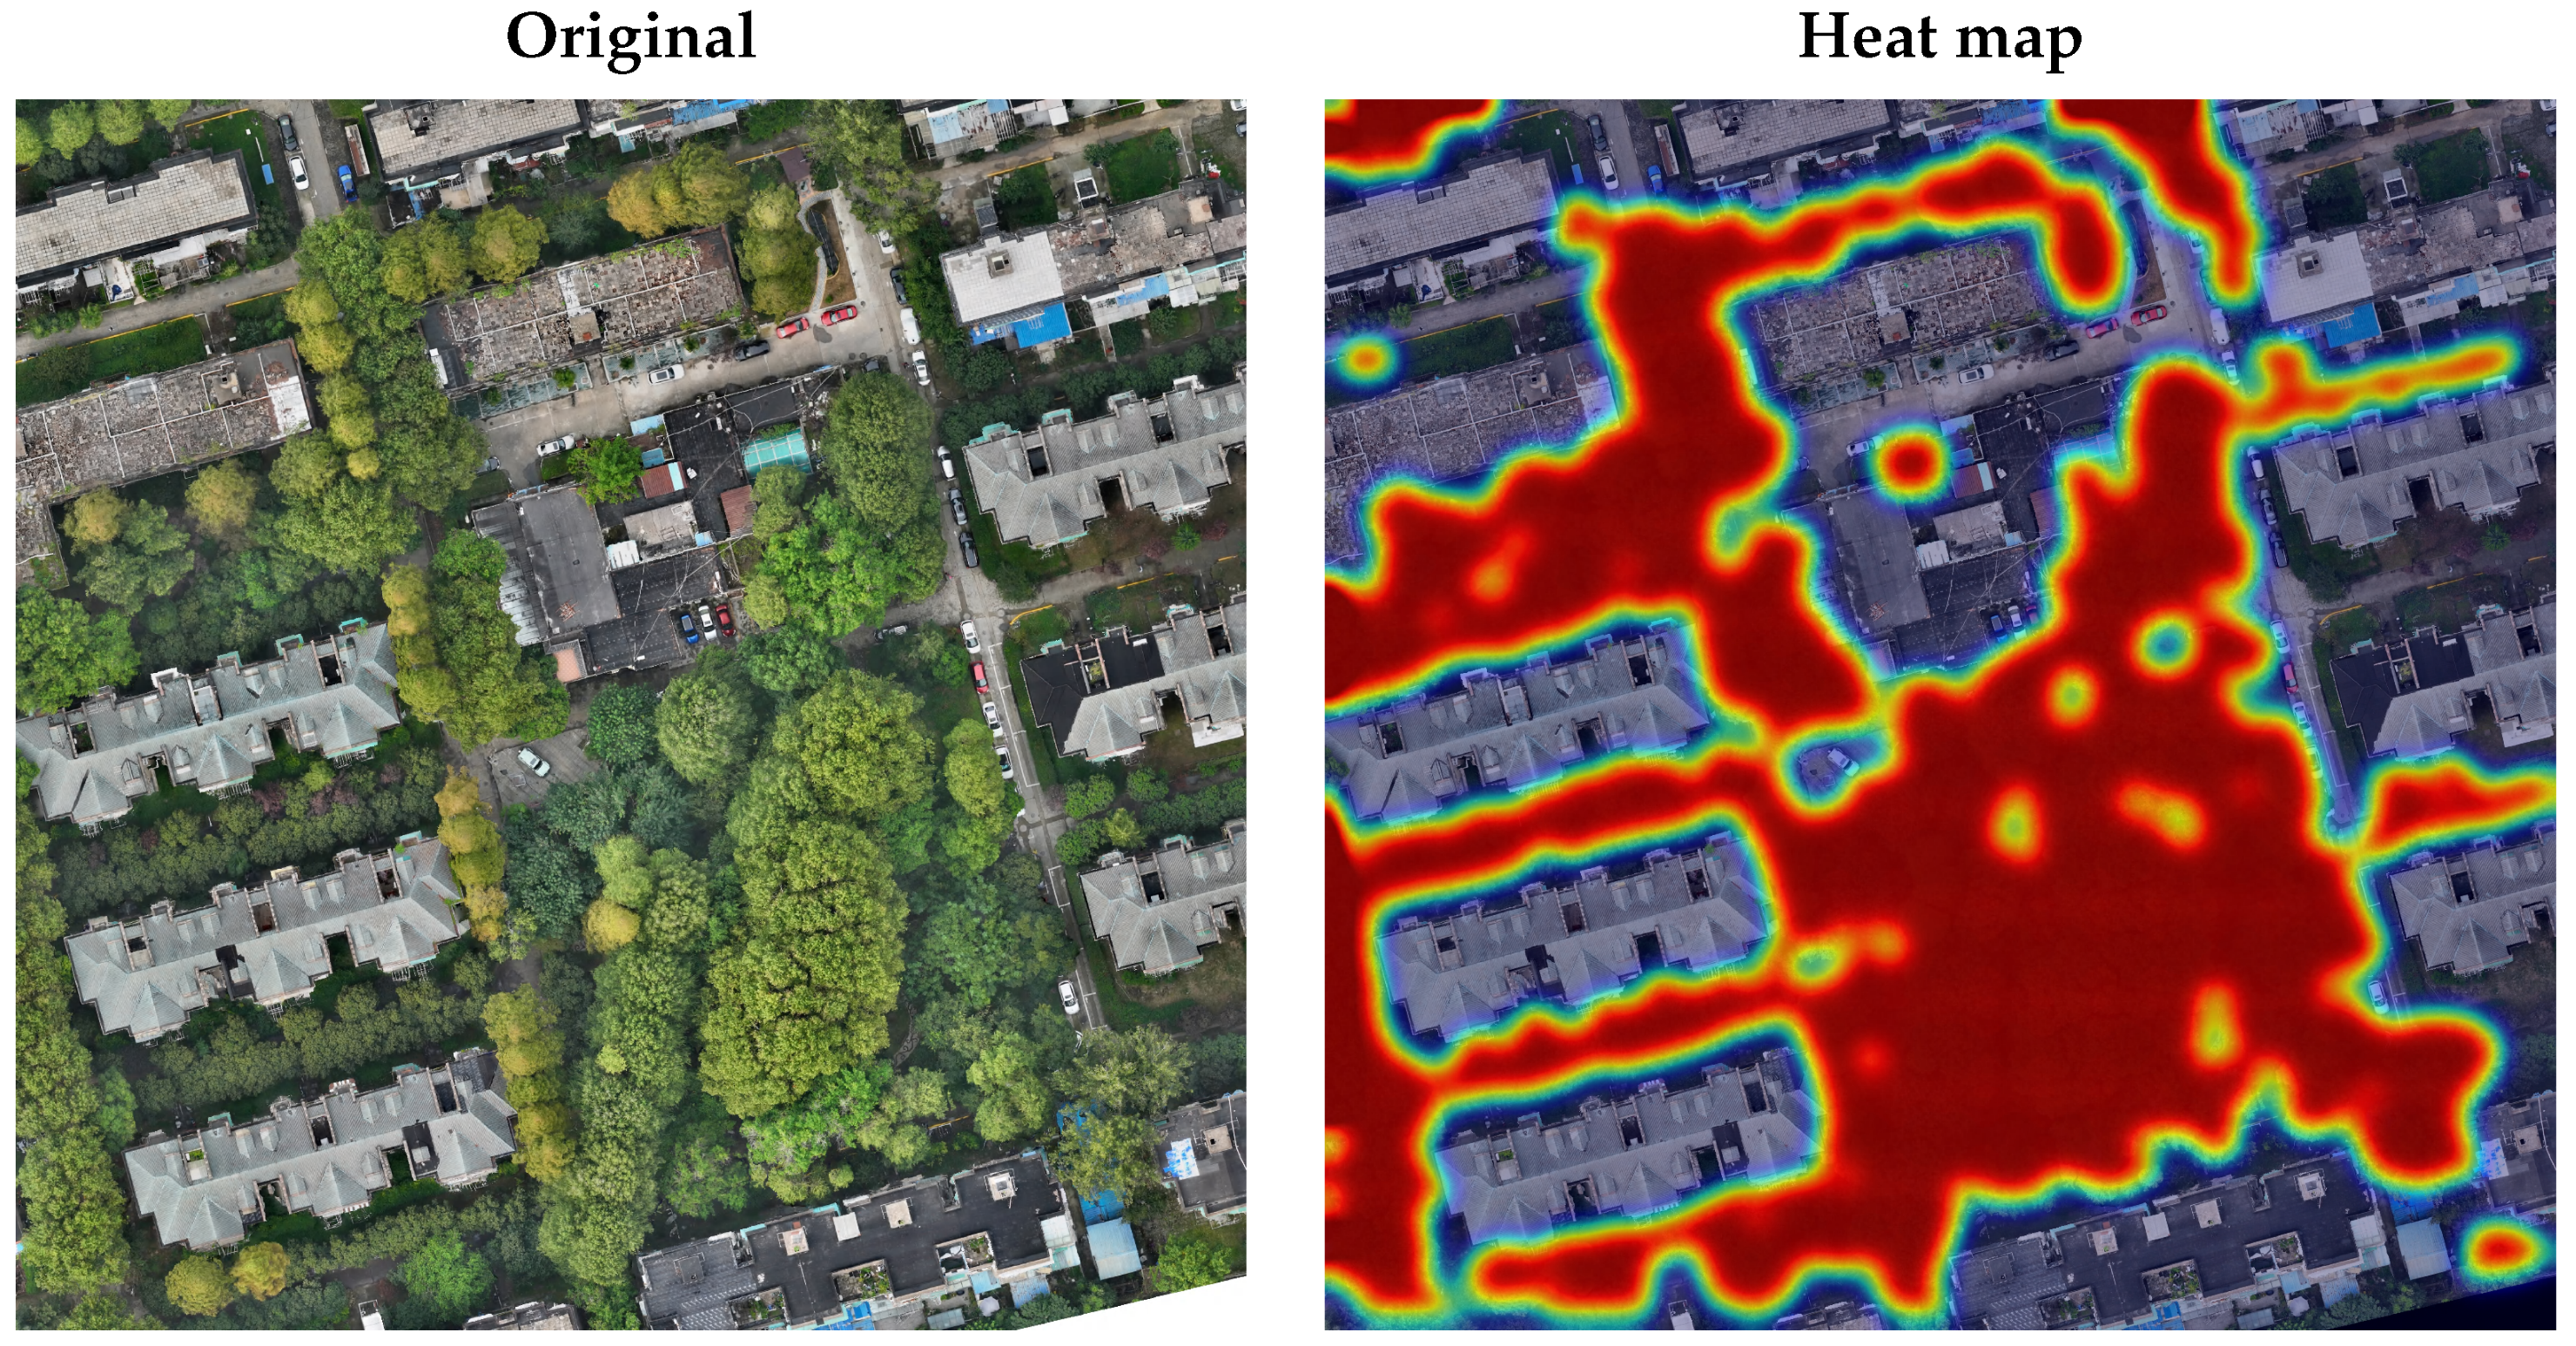
Based on the grid-level vegetation metrics defined in Section 3.5, we generate a vegetation-density heat map, as shown in Figure 12. In this framework, TreeSpecViT contributes to the coupling analysis by providing species-level labels for individual tree crowns, while crown delineation provides the geometric basis for canopy-area estimation and grid-level vegetation aggregation. These outputs jointly support the construction of the digital tree archive and the subsequent spatial coupling analysis. It should be noted, however, that uncertainty in the preceding recognition stage may propagate to downstream ecological interpretation, especially when the analysis involves species composition or species-aware summaries. For canopy-coverage-based indicators such as , the direct influence mainly depends on crown delineation quality, whereas the reliability of species-related interpretation is more closely tied to classification accuracy.
Figure 12.
Example of the vegetation-density heat map generated from UAV-derived crown information. The left panel shows the original UAV image of a representative campus subregion, and the right panel shows the corresponding vegetation-density heat map. Warmer colors indicate higher local vegetation density, whereas cooler colors indicate lower vegetation density.
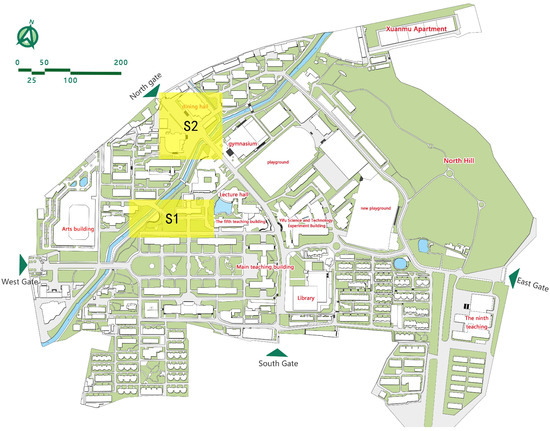
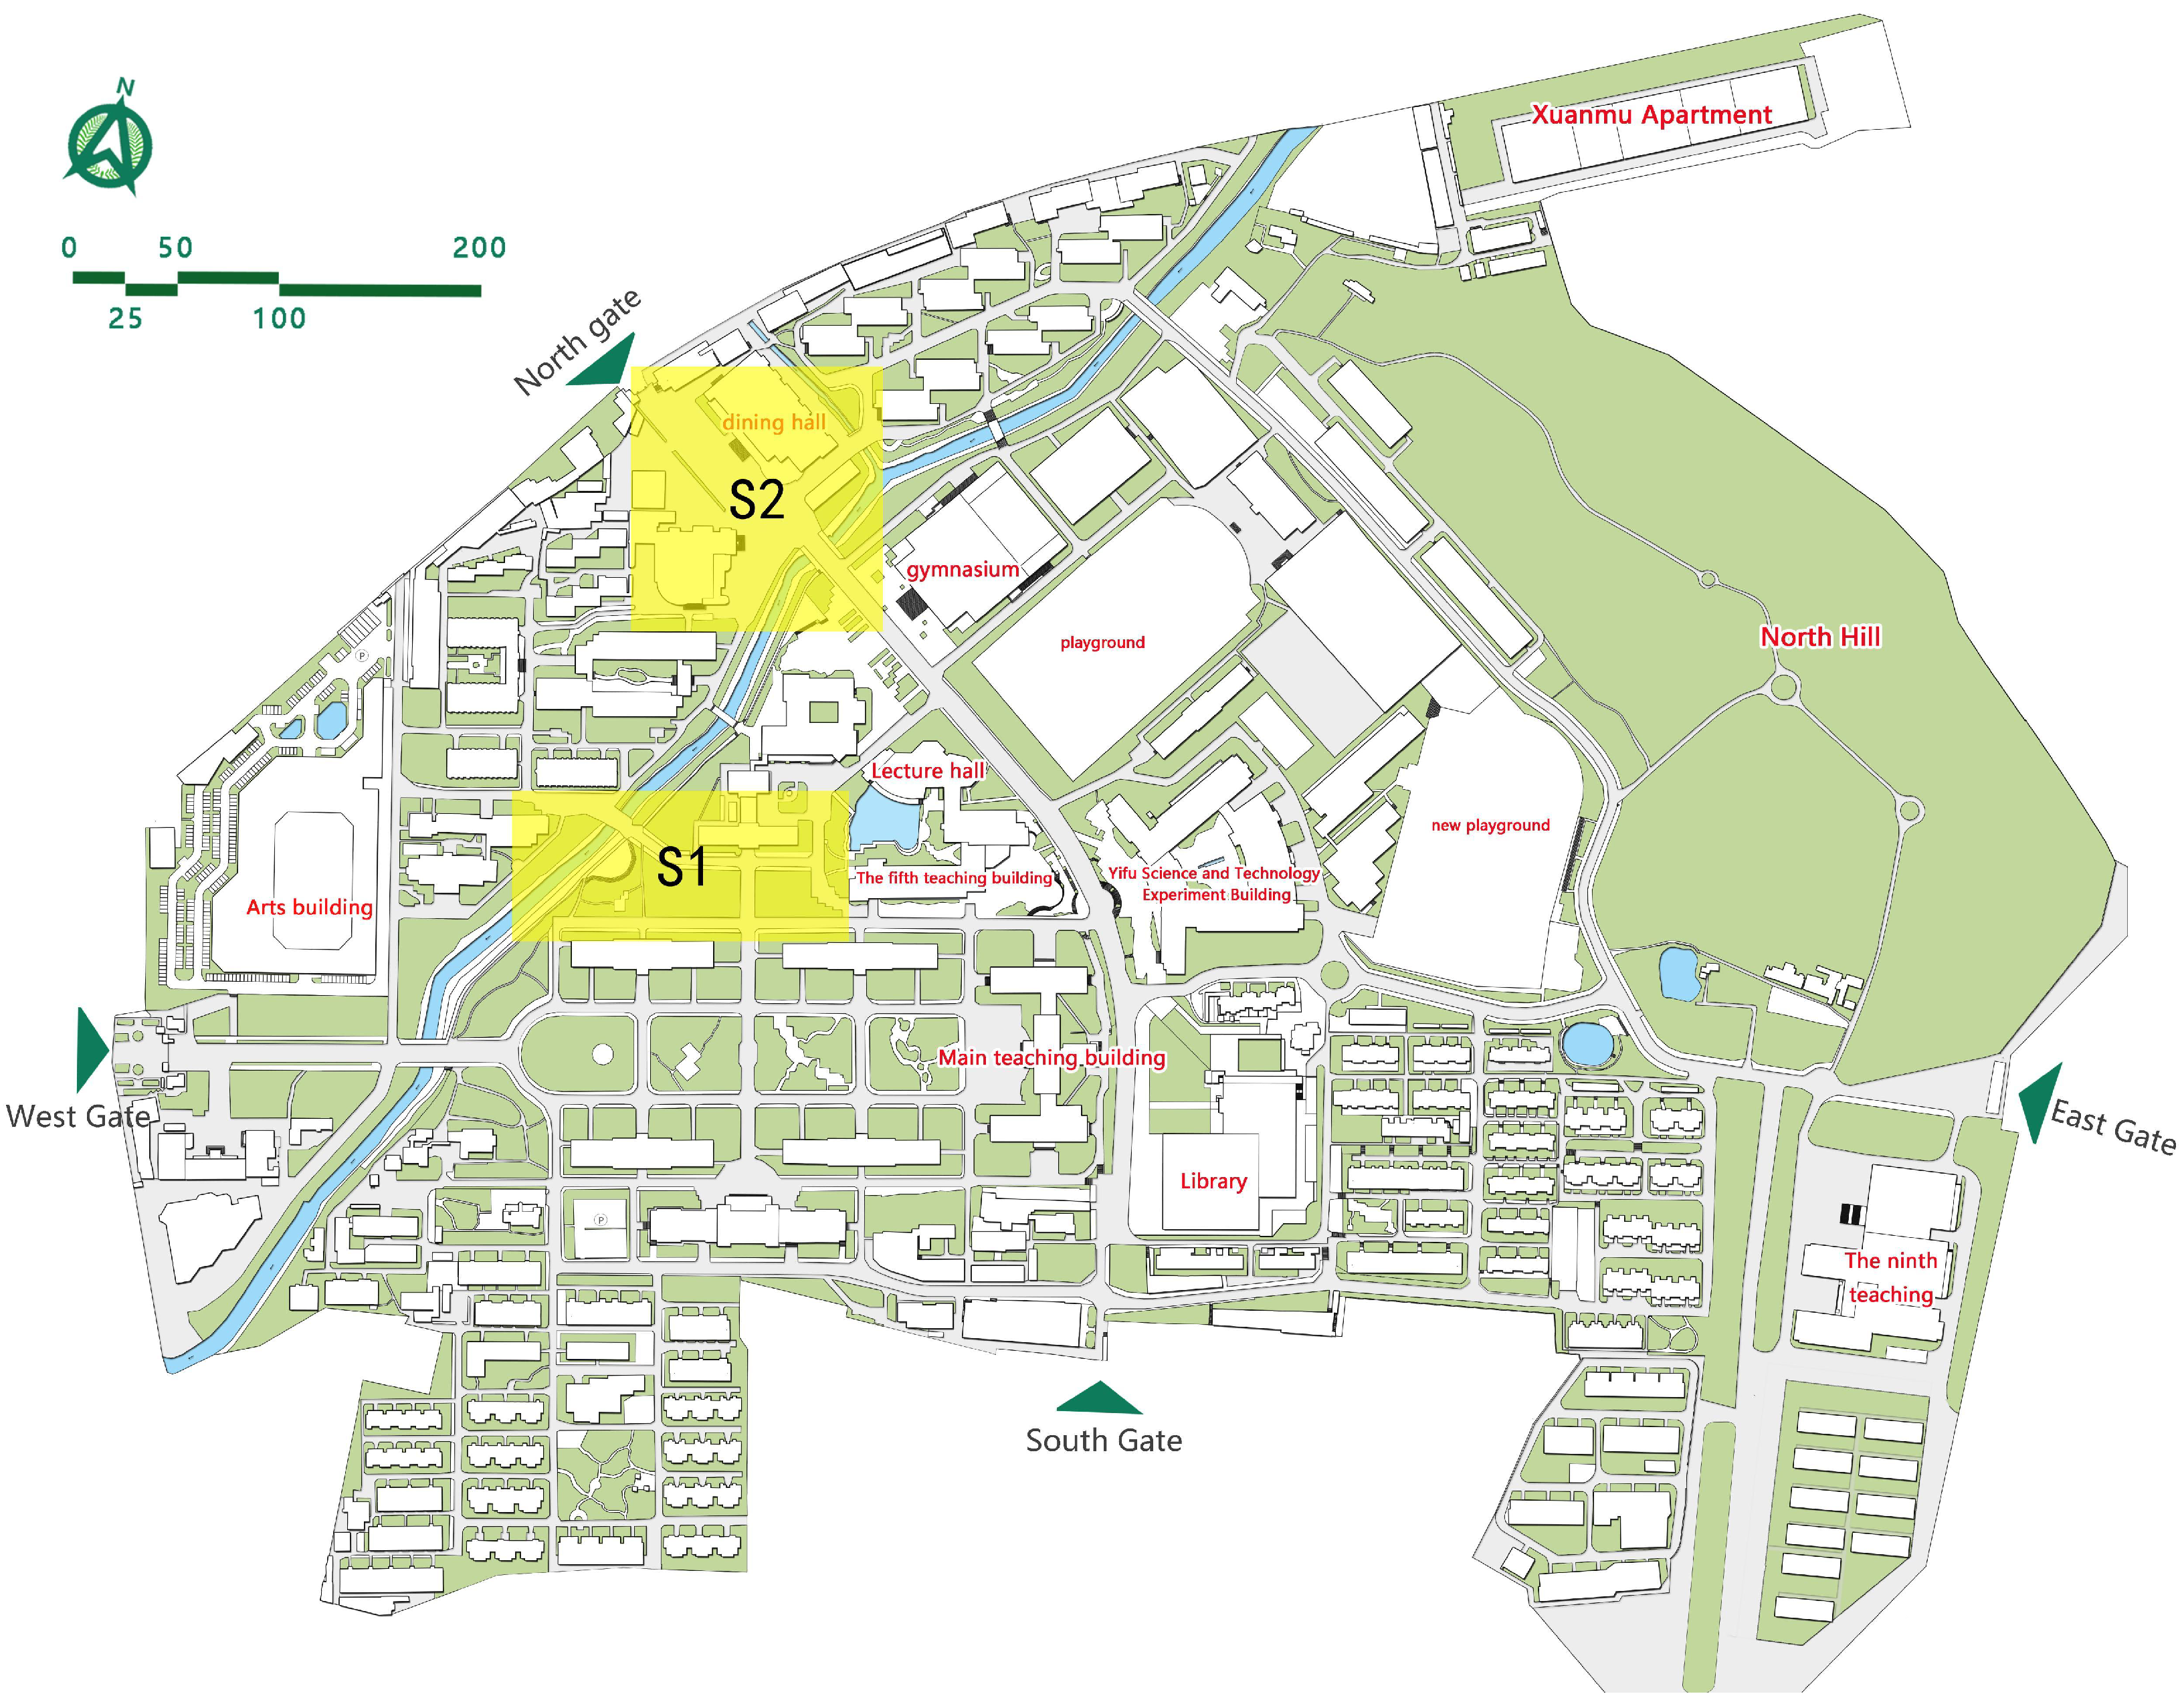
To calibrate the grid-level activity field, we collected pedestrian-flow observations at two representative campus corridors, S1 and S2, during three typical periods: morning peak, midday, and evening peak. Each observation lasted 30 min, and the observed pedestrian intensities are summarized in Table 8. The observation sites are shown in Figure 13. These observations were used to calibrate the potential activity field, yielding the grid-level activity intensity for the subsequent coupling analysis with vegetation coverage.
Table 8.
Observed pedestrian flows on a typical working day on campus.
Figure 13.
Locations of the two pedestrian-flow observation sites (S1 and S2) on the NJFU campus map. The highlighted yellow rectangular areas indicate the selected observation zones used for pedestrian-flow data collection and calibration of the grid-level activity field.
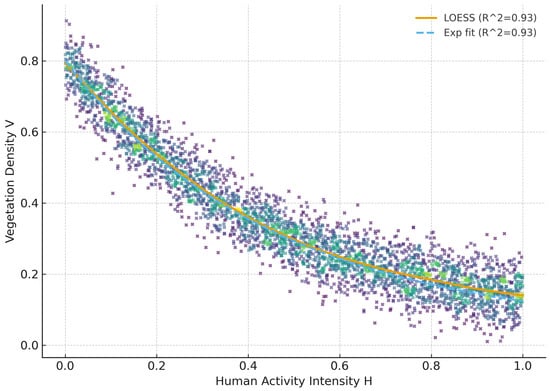
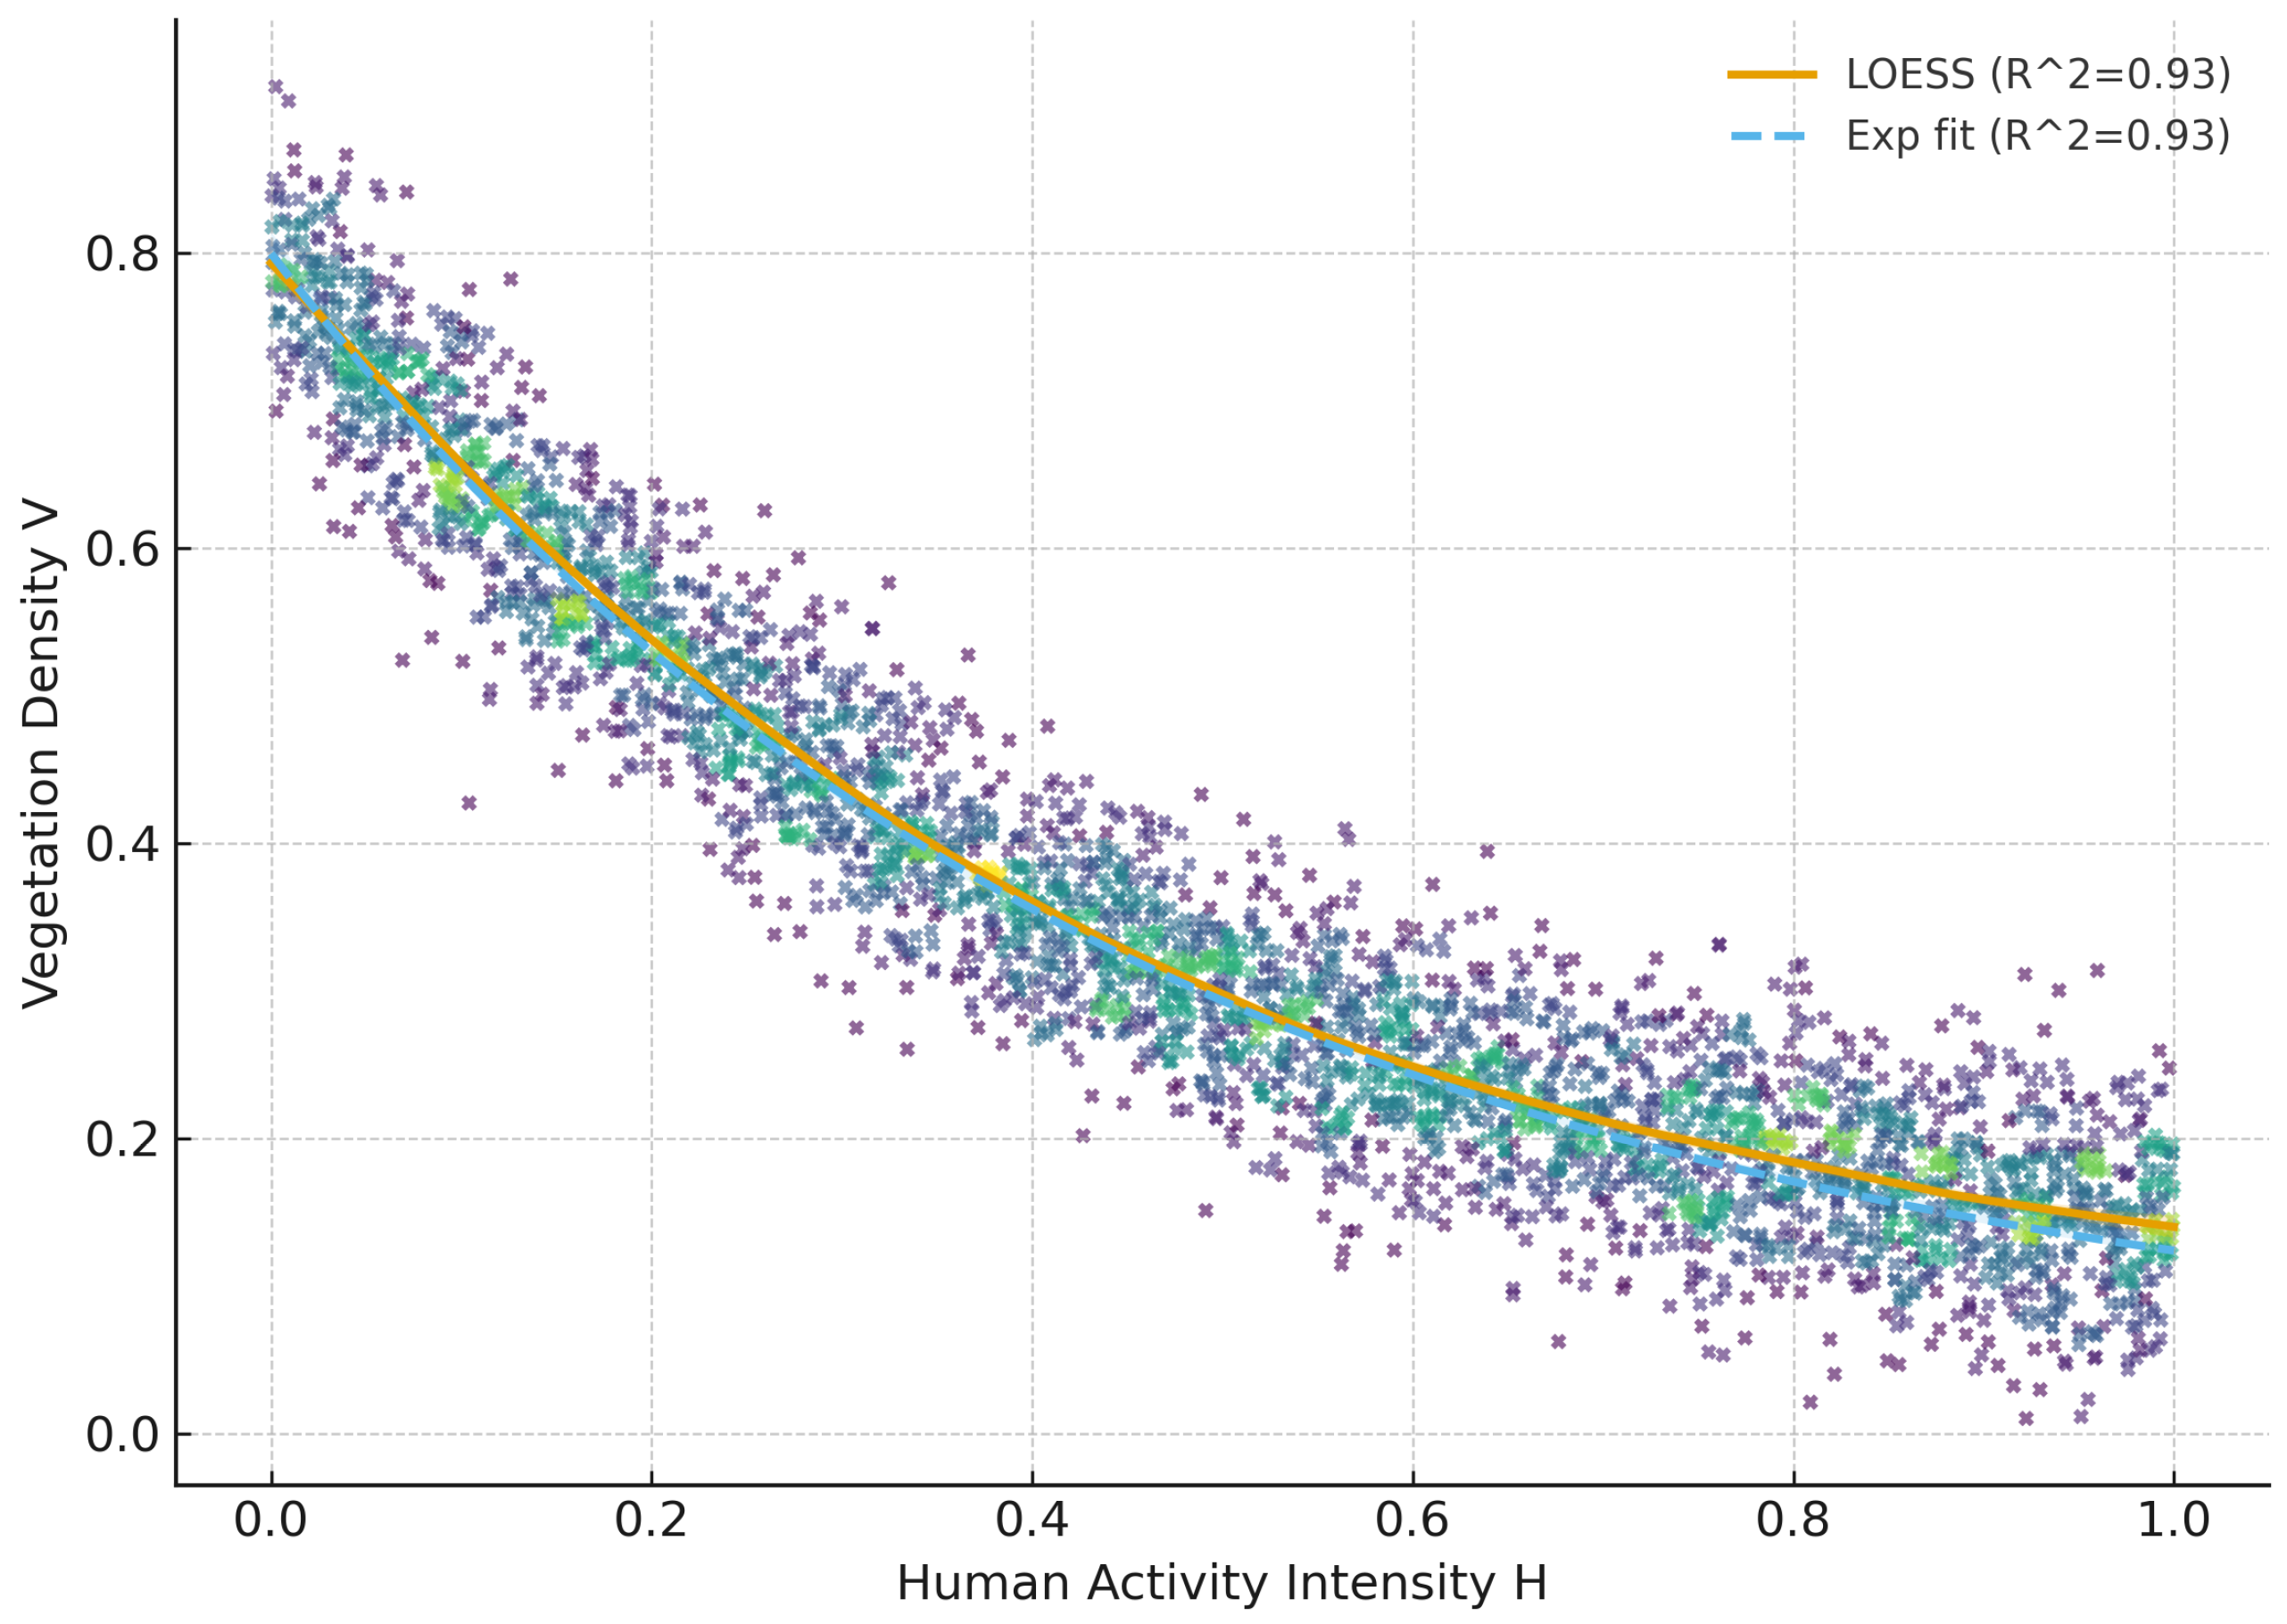
Figure 14 visualizes the relationship between calibrated human activity intensity and vegetation coverage V using a LOESS smoother and an exponential decay fit. Both curves show an overall decreasing trend of V with increasing , suggesting that high pedestrian-flow areas on campus are more often associated with relatively limited canopy coverage. This pattern is consistent with the functional structure of campuses, where movement is concentrated along paved corridors and near major facilities, while denser canopy coverage is more often found in less trafficked patches.
Figure 14.
Relationship between human activity intensity and vegetation coverage V. The scatter points represent the observed samples, the orange solid line denotes the LOESS smoother, and the blue dashed line denotes the exponential decay fit. Both fitted curves indicate a decreasing trend of V with increasing .
Importantly, this empirical coupling reflects a spatial association at the grid level rather than an individual behavioral preference. It does not imply that pedestrians avoid trees; instead, it indicates that some high-demand activity zones are not fully matched by canopy supply. This result provides practical evidence for prioritizing shade enhancement and greening interventions along high-use routes and functional hotspots.
5. Discussion
The results of this study support three main observations. First, deep feature learning is more effective than handcrafted spectral, texture, and shape descriptors for campus UAV tree-species classification. Across both datasets, MobileViT-style backbones and the proposed TreeSpecViT outperform lightweight CNN baselines such as MobileNetV3 and RegNet, suggesting that the combination of convolutional inductive bias and global context modeling is advantageous for crown-level recognition in complex scenes.
Second, task-aligned architectural design appears more beneficial than simply increasing model size. TreeSpecViT outperforms Swin-Tiny and ViT-Base on both datasets, indicating that for medium- and small-scale datasets, explicitly addressing background interference, weak fine-grained cues, and local crown variation can be more effective than relying only on generic Transformer scaling.
Third, the ablation results show that BSM, FGF, and GLF are complementary. BSM suppresses non-canopy interference, FGF enhances subtle discriminative cues before tokenization, and GLF combines global canopy semantics with local structural information at the prediction stage. Their joint effect suggests that fine-grained UAV tree-species recognition benefits from a staged design of background suppression, feature refinement, and global–local fusion. At the same time, the gain from BSM is smaller than that of FGF and GLF in some settings, implying that background information is not always purely harmful and may occasionally provide auxiliary contextual cues.
Beyond classification, the proposed framework also supports an individual-tree digital archive and a campus-scale human–vegetation coupling analysis. The archive results show that species labels and crown geometry can be integrated into structured tree-level records, while the coupling analysis reveals clear spatial heterogeneity between pedestrian activity intensity and vegetation coverage. The LOESS and quantile-regression results suggest that this relationship is not purely linear, and that some high-demand areas are not fully matched by canopy supply.
This point should be interpreted carefully. The coupling identified here reflects a grid-level spatial association rather than an individual behavioral preference. It does not imply that pedestrians avoid trees; instead, it indicates where movement corridors and functional hotspots may require improved shade support or localized greening interventions.
Several limitations should be noted. Long-tail classes remain vulnerable to confusion, especially when they are visually similar to dominant classes. In addition, the reliability of the digital archive and the downstream coupling analysis depends on the quality of crown delineation and species classification. The ecological interpretation is also influenced by the adopted grid resolution and pedestrian-flow calibration. Future work may address these issues through class-imbalance-aware learning, uncertainty-aware analysis, and more systematic sensitivity evaluation.
6. Conclusions
This work studies fine-grained tree species classification from campus UAV RGB imagery. We propose TreeSpecViT, which integrates BSM, FGF, and a GLF head. We evaluate TreeSpecViT on SZUTreeDataset and NJFUDataset. The results show that TreeSpecViT reduces background-induced errors and strengthens discriminative canopy cues. Global and local fusion further improves separability among visually similar species. We also construct a digital tree archive from individual-tree outputs and combine it with a calibrated campus human-activity grid. By quantifying pedestrian throughput intensity and canopy coverage on the same spatial grid, this enables a practical coupling analysis between activity demand/pressure and vegetation supply, providing evidence for green-space allocation and shade improvement along high-use routes.
The contributions are threefold. First, we present a UAV-based pipeline for refined campus tree management. The pipeline connects individual-tree classification, crown geometry extraction, and activity–vegetation coupling analysis, which supports maintenance planning, risk screening, and carbon-related assessment. Importantly, the coupling analysis characterizes grid-level spatial association rather than individual preference, and it helps reveal whether high-activity corridors and functional hotspots are sufficiently supported by canopy resources. Second, we design three task-oriented components in TreeSpecViT. BSM suppresses background responses at the input stage. FGF performs spatial–channel reweighting before tokenization. The GLF head fuses crown-level semantics with local textures. Third, TreeSpecViT achieves consistent gains under comparable parameter and inference budgets to the MobileViT-style backbone. It achieves an accuracy of 87.88% (+6.06%) and an F1 score of 76.48% (+5.08%) on the SZUTreeDataset. On our self-constructed NJFUDataset, it reaches 76.30% (+5.10%) accuracy and 70.10% (+7.20%) macro-F1. It also exceeds Swin-Tiny and ViT-Base in our comparisons.
These results indicate that task-aligned structure design can be effective for campus UAV imagery. TreeSpecViT can support tree species census, digital tree archiving, windthrow risk screening, and canopy-structure-based ecological assessment. Future work will proceed in two directions. The first direction is validation at larger spatial scales and in more cities and seasons. We will also integrate multi-source data such as hyperspectral imagery and LiDAR. The second direction is learning under real-world noise and data imbalance. We will study how to separate useful context from irrelevant background. We will explore weak supervision, semi-supervised learning, and cross-city transfer learning. We will also develop online update strategies. We plan to connect TreeSpecViT to urban digital twins and smart landscaping platforms, supporting scalable urban forest management and ecological service assessment.
Author Contributions
Resources, Z.C.; Data curation, Y.Y. (Yunfeng Yang); Writing—original draft, Y.Y. (Yinghui Yuan); Writing—review & editing, S.X.; Supervision, Z.C.; Funding acquisition, S.X. All authors have read and agreed to the published version of the manuscript.
Funding
This research was funded by the Biological Breeding-National Science and Technology Major Project, grant number 2023ZD0405605. The APC was also funded by this project.
Data Availability Statement
The raw data supporting the conclusions of this article will be made available by the authors on request.
Conflicts of Interest
The authors declare no conflicts of interest.
References
- Zheng, G.; Xu, H.; Liu, F.; Lin, X.; Wang, S.; Dong, J. Study Roadmap Selection Based on the Thermal Comfort of Street Trees in Summer: A Case Study from a University Campus in China. Sustainability 2024, 16, 4407. [Google Scholar] [CrossRef] [Scilit]
- Zhang, X.; Ludwig, F. Shade for pedestrians: A novel approach to calculate the spatio-temporal shade benefits of street trees considering pedestrian flow. Build. Environ. 2025, 272, 112662. [Google Scholar] [CrossRef] [Scilit]
- Harrison, J.F.; Lai, S.Y.J.; Yeh, Y.H. GIS-based management of a campus tree inventory for assessing optimal shade tree locations: A case study of National Cheng Kung University, Taiwan. Abstr. Int. Cartogr. Assoc. 2024, 7, 55. [Google Scholar] [CrossRef] [Scilit]
- Huang, Y.; Ou, B.; Meng, K.; Yang, B.; Carpenter, J.; Jung, J.; Fei, S. Tree Species Classification from UAV Canopy Images with Deep Learning Models. Remote Sens. 2024, 16, 3836. [Google Scholar] [CrossRef] [Scilit]
- Pierdicca, R.; Nepi, L.; Mancini, A.; Malinverni, E.S.; Balestra, M. UAV4TREE: Deep Learning-Based System for Automatic Classification of Tree Species Using RGB Optical Images Obtained by an Unmanned Aerial Vehicle. ISPRS Ann. Photogramm. Remote Sens. Spat. Inf. Sci. 2023, 10, 1089–1096. [Google Scholar] [CrossRef] [Scilit]
- Li, Z.; Yu, S.; Ye, Q.; Zhang, M.; Yin, D.; Zhao, Z. Tree Species Classification Using UAV-Based RGB Images and Spectral Information on the Loess Plateau, China. Drones 2025, 9, 296. [Google Scholar] [CrossRef] [Scilit]
- Li, X.; Wang, L.; Guan, H.; Chen, K.; Zang, Y.; Yu, Y. Urban tree species classification using UAV-based multispectral images and LiDAR point clouds. J. Geovisualization Spat. Anal. 2024, 8, 5. [Google Scholar] [CrossRef] [Scilit]
- Ferreira, M.P.; dos Santos, D.R.; Ferrari, F.; Coelho, L.C.T.; Martins, G.B.; Feitosa, R.Q. Improving urban tree species classification by deep-learning based fusion of digital aerial images and LiDAR. Urban For. Urban Green. 2024, 94, 128240. [Google Scholar] [CrossRef] [Scilit]
- Huang, Y.; Yang, B.; Carpenter, J.; Jung, J.; Fei, S. Temperate forest tree species classification with winter UAV images. Remote Sens. Appl. Soc. Environ. 2025, 37, 101422. [Google Scholar] [CrossRef] [Scilit]
- Wu, J.; Man, Q.; Yang, X.; Dong, P.; Ma, X.; Liu, C.; Han, C. Fine Classification of Urban Tree Species Based on UAV-Based RGB Imagery and LiDAR Data. Forests 2024, 15, 390. [Google Scholar] [CrossRef] [Scilit]
- Murray, B.A.; Coops, N.C.; White, J.C.; Dick, A.; Barbeito, I.; Ragab, A. Individual tree species prediction using airborne laser scanning data and derived point-cloud metrics within a dual-stream deep learning approach. Int. J. Appl. Earth Obs. Geoinf. 2025, 144, 104877. [Google Scholar] [CrossRef] [Scilit]
- Ma, Y.; Zhao, Y.; Im, J.; Zhao, Y.; Zhen, Z. A deep-learning-based tree species classification for natural secondary forests using unmanned aerial vehicle hyperspectral images and LiDAR. Ecol. Indic. 2024, 159, 111608. [Google Scholar] [CrossRef] [Scilit]
- Kwon, R.; Ryu, Y.; Yang, T.; Zhong, Z.; Im, J. Merging multiple sensing platforms and deep learning empowers individual tree mapping and species detection at the city scale. ISPRS J. Photogramm. Remote Sens. 2023, 206, 201–221. [Google Scholar] [CrossRef] [Scilit]
- Wang, R.; Ma, L.; He, G.; Johnson, B.A.; Yan, Z.; Chang, M.; Liang, Y. Transformers for Remote Sensing: A Systematic Review and Analysis. Sensors 2024, 24, 3495. [Google Scholar] [CrossRef] [Scilit]
- Dong, Y.; Ma, Z.; Zi, J.; Xu, F.; Chen, F. Multiscale feature fusion and enhancement in a transformer for the fine-grained visual classification of tree species. Ecol. Inform. 2025, 86, 103029. [Google Scholar] [CrossRef] [Scilit]
- Liu, H.; Fan, J.; Zhou, K.; Xu, X.; Zhang, H.; Guo, R.; Chen, S. Assessing the dynamics of human activity intensity and its natural and socioeconomic determinants in Qinghai–Tibet Plateau. Geogr. Sustain. 2023, 4, 294–304. [Google Scholar] [CrossRef] [Scilit]
- Fassnacht, F.E.; Latifi, H.; Stereńczak, K.; Modzelewska, A.; Lefsky, M.; Waser, L.T.; Straub, C.; Ghosh, A. Review of studies on tree species classification from remotely sensed data. Remote Sens. Environ. 2016, 186, 64–87. [Google Scholar] [CrossRef] [Scilit]
- He, K.; Zhang, X.; Ren, S.; Sun, J. Deep residual learning for image recognition. In Proceedings of the IEEE Conference on Computer Vision and Pattern Recognition (CVPR), Las Vegas, NV, USA, 27–30 June 2016; pp. 770–778. [Google Scholar]
- Huang, G.; Liu, Z.; Van Der Maaten, L.; Weinberger, K.Q. Densely connected convolutional networks. In Proceedings of the IEEE Conference on Computer Vision and Pattern Recognition, Honolulu, HI, USA, 21–26 July 2017; pp. 4700–4708. [Google Scholar]
- Zhang, L.; Zhang, L.; Du, B. Deep Learning for Remote Sensing Data: A Technical Tutorial on the State of the Art. IEEE Geosci. Remote Sens. Mag. 2016, 4, 22–40. [Google Scholar] [CrossRef] [Scilit]
- Kattenborn, T.; Leitloff, J.; Schiefer, F.; Hinz, S. Review on Convolutional Neural Networks (CNN) in vegetation remote sensing. ISPRS J. Photogramm. Remote Sens. 2021, 173, 24–49. [Google Scholar] [CrossRef] [Scilit]
- Nezami, S.; Khoramshahi, E.; Nevalainen, O.; Pölönen, I.; Honkavaara, E. Tree species classification of drone hyperspectral and RGB imagery with deep learning convolutional neural networks. Remote Sens. 2020, 12, 1070. [Google Scholar] [CrossRef] [Scilit]
- Qin, H.; Zhou, W.; Yao, Y.; Wang, W. Individual tree segmentation and tree species classification in subtropical broadleaf forests using UAV-based LiDAR, hyperspectral, and ultrahigh-resolution RGB data. Remote Sens. Environ. 2022, 280, 113143. [Google Scholar] [CrossRef] [Scilit]
- Dosovitskiy, A. An image is worth 16x16 words: Transformers for image recognition at scale. arXiv 2020, arXiv:2010.11929. [Google Scholar]
- Wang, D.; Zhang, J.; Du, B.; Xia, G.S.; Tao, D. An empirical study of remote sensing pretraining. IEEE Trans. Geosci. Remote Sens. 2022, 61, 1–20. [Google Scholar] [CrossRef] [Scilit]
- Liu, Z.; Lin, Y.; Cao, Y.; Hu, H.; Wei, Y.; Zhang, Z.; Lin, S.; Guo, B. Swin transformer: Hierarchical vision transformer using shifted windows. In Proceedings of the IEEE/CVF International Conference on Computer Vision, Montreal, QC, Canada, 10–17 October 2021; pp. 10012–10022. [Google Scholar]
- Liu, Z.; Mao, H.; Wu, C.Y.; Feichtenhofer, C.; Darrell, T.; Xie, S. A convnet for the 2020s. In Proceedings of the IEEE/CVF Conference on Computer Vision and Pattern Recognition, New Orleans, LA, USA, 18–24 June 2022; pp. 11976–11986. [Google Scholar]
- Koonce, B. MobileNetV3. In Convolutional Neural Networks with Swift for Tensorflow: Image Recognition and Dataset Categorization; Springer: Berlin/Heidelberg, Germany, 2021; pp. 125–144. [Google Scholar]
- Zhang, X.; Zhou, X.; Lin, M.; Sun, J. Shufflenet: An extremely efficient convolutional neural network for mobile devices. In Proceedings of the IEEE Conference on Computer Vision and Pattern Recognition, Salt Lake City, UT, USA, 18–22 June 2018; pp. 6848–6856. [Google Scholar]
- Radosavovic, I.; Kosaraju, R.P.; Girshick, R.; He, K.; Dollár, P. Designing network design spaces. In Proceedings of the IEEE/CVF Conference on Computer Vision and Pattern Recognition, Seattle, WA, USA, 13–19 June 2020; pp. 10428–10436. [Google Scholar]
- Mehta, S.; Rastegari, M. Mobilevit: Light-weight, general-purpose, and mobile-friendly vision transformer. arXiv 2021, arXiv:2110.02178. [Google Scholar]
- Li, Y.; Yuan, G.; Wen, Y.; Hu, J.; Evangelidis, G.; Tulyakov, S.; Wang, Y.; Ren, J. Efficientformer: Vision transformers at mobilenet speed. Adv. Neural Inf. Process. Syst. 2022, 35, 12934–12949. [Google Scholar]
- Mäyrä, J.; Keski-Saari, S.; Kivinen, S.; Tanhuanpää, T.; Hurskainen, P.; Kullberg, P.; Poikolainen, L.; Viinikka, A.; Tuominen, S.; Kumpula, T.; et al. Tree species classification from airborne hyperspectral and LiDAR data using 3D convolutional neural networks. Remote Sens. Environ. 2021, 256, 112322. [Google Scholar] [CrossRef] [Scilit]
- Zhong, H.; Lin, W.; Liu, H.; Ma, N.; Liu, K.; Cao, R.; Wang, T.; Ren, Z. Identification of tree species based on the fusion of UAV hyperspectral image and LiDAR data in a coniferous and broad-leaved mixed forest in Northeast China. Front. Plant Sci. 2022, 13, 964769. [Google Scholar] [CrossRef] [Scilit]
- Yun, T.; Eichhorn, M.P.; Jin, S.; Yuan, X.; Fang, W.; Lu, X.; Wang, X.; Zhang, H. A framework for phenotyping rubber trees under intense wind stress using laser scanning and digital twin technology. Agric. For. Meteorol. 2025, 361, 110319. [Google Scholar] [CrossRef] [Scilit]
- Feng, R.; Wang, F.; Liu, S.; Qi, W.; Zhengchen, R.; Wang, D. Synergistic effects of urban forest on urban heat island-air pollution-carbon stock in mega-urban agglomeration. Urban For. Urban Green. 2025, 103, 128590. [Google Scholar] [CrossRef] [Scilit]
- MathWorks. Regionprops: Measure Properties of Image Regions. MATLAB Image Processing Toolbox Documentation, 2025. Available online: https://ww2.mathworks.cn/help/images/ref/regionprops.html (accessed on 25 December 2025).
- Yang, Y.; Yu, C.; Li, S.; Bramston, D. A planting optimization strategy to improve the carbon sink benefit for urban green: Taking the communal green of Nanjing Forestry University as an example. Ecol. Indic. 2024, 159, 111619. [Google Scholar] [CrossRef] [Scilit]
- Chen, D.; Li, W.; Kong, W.; Shen, S. Jiyu dikong gaofenbianlv yingxiang de sanwei lvliang jisuan fangfa: Yi Nanjing Linye Daxue xiaoyuan wei li [A method for calculating three-dimensional green volume based on low-altitude high-resolution imagery: A case study of Nanjing Forestry University campus]. Chin. Landsc. Archit. 2015, 31, 22–26. (In Chinese) [Google Scholar] [CrossRef]



Disclaimer/Publisher’s Note: The statements, opinions and data contained in all publications are solely those of the individual author(s) and contributor(s) and not of MDPI and/or the editor(s). MDPI and/or the editor(s) disclaim responsibility for any injury to people or property resulting from any ideas, methods, instructions or products referred to in the content. |
© 2026 by the authors. Licensee MDPI, Basel, Switzerland. This article is an open access article distributed under the terms and conditions of the Creative Commons Attribution (CC BY) license.