


Highlights
What are the main findings?
- Integrating textural and geometric features with spectral data significantly improves classification accuracy by up to 10.5%, overcoming the limitations of spectral-only mapping.
- Extreme gradient boosting emerged as the most effective algorithm, achieving an 81.9% overall accuracy and consistently outperforming both support vector machine and random forest models.
What are the implications of the main findings?
- Multi-source feature fusion provides a robust solution for distinguishing co-occurring species that exhibit high spectral similarity in complex biodiverse ecosystems.
- The established framework offers a high-precision tool for ecological assessment, enabling more accurate monitoring and targeted conservation strategies in wetlands.
Abstract
Accurate mapping of grass species in biodiverse ecosystems, such as wetlands, is critical for ecological protection. Rapid advancements in remote sensing have established satellite data as a critical tool for wetland grass species mapping; however, its relatively coarse spatial resolution and susceptibility to cloud contamination limit the distinction of co-occurring species at fine scales. While Unmanned Aerial Vehicle (UAV) remote sensing offers high resolution and operational flexibility, relying on single-source features is often insufficient for fine-scale wetland species mapping due to the spectral similarity of co-occurring species. On the other hand, the fusion of multi-source remote sensing features (i.e., spectral, textural, and geometric features) likely provides a promising solution for achieving accurate, fine-scale grass species mapping in biodiverse ecosystems. In this study, we developed a wetland grass species mapping framework integrating spectral, textural, and geometric features derived from UAV RGB and multispectral imagery. Using a dataset of 95,880 image objects representing 24 wetland grass species classes collected in two years in Dajiu Lake National Wetland Park of China, we evaluated three machine learning algorithms—Support Vector Machine (SVM), Random Forest (RF), and eXtreme Gradient Boosting (XGBoost)—across various feature combinations. We found that while spectral features (i.e., red edge, normalized green–red difference index [NGRDI], and normalized difference vegetation index [NDVI]) (related to leaf pigment concentrations and cellular structures) exhibited the highest importance in wetland grass species mapping, textural (i.e., contrast) and geometric features (i.e., aspect ratio) significantly enhanced classification performance as complementary information, yielding improvements of up to 10.5% in overall accuracy (OA) and 0.103 in Macro-F1 scores. Specifically, the fusion of spectral, textural, and geometric features achieved optimal performance with an OA of 81.9% and a Macro-F1 of 0.807. Furthermore, the XGBoost model outperformed SVM and RF, improving OA by 9.4% and 2.8%, and Macro-F1 by 0.08 and 0.035, respectively. By identifying the optimal feature combination and machine learning algorithm, this study establishes an accurate method for wetland grass species mapping, offering new opportunities for ecological assessment and precision conservation in biodiverse landscapes.
1. Introduction
Accurate wetland grass mapping is hindered by the limitations of traditional field surveys [1,2] and the spatial constraints of satellite imagery [3,4]. While Unmanned Aerial Vehicles (UAVs) provide the necessary resolution for fine-scale analysis [5,6,7,8], reliance on multispectral features (visible to near-infrared) remains problematic in biodiverse wetlands. Specifically, taxonomically distinct species often exhibit significant spectral overlap—a phenomenon known as spectral mimicry [9,10]. For instance, Calamagrostis epigejos and Phragmites australis produce nearly identical signatures, which fundamentally limits the classification accuracy of multispectral-only approaches [11,12].
Multi-source UAV remote sensing provides opportunities to overcome these constraints. Specifically, the fusion of textural and geometric features from high-resolution RGB imagery with multispectral data is critical for addressing the limitations of spectral-only approaches [1,13]. Texture features effectively capture fine-scale organizational structures and light-shadow variations on plant surfaces [14]. Methods such as the Gray-Level Co-occurrence Matrix (GLCM) allow researchers to calculate indicators including entropy, contrast, and correlation to quantify spatial distribution and repetition patterns [15]. These features represent spatial heterogeneity induced by leaf distribution, branch orientation, and canopy roughness [16]. Consequently, they provide a basis for distinguishing species with similar spectral signatures, such as Artemisia lavandulaefolia and Polygonum sieboldii.
Complementing texture, geometric features reveal taxonomic attributes at the object level [17]. These features are calculated from segmented image objects and characterize the geometric and topological properties of grass species [18]. Unlike texture, which focuses on statistical relationships between pixels, geometric features such as compactness, fractal dimension, aspect ratio, and boundary curvature directly reflect macroscopic growth forms and branching patterns [19]. These metrics are particularly effective for distinguishing species with similar spectral and textural characteristics but distinct physical outlines, such as Polytrichum commune and Juncus effusus. By integrating the complementary strengths of various feature sets, multi-source remote sensing data fusion has demonstrated greater potential for species mapping than single-source approaches [20,21]. Nevertheless, the fusion and optimal combination of multi-source remote sensing data for fine-scale wetland grass species mapping remain underexplored.
Several machine learning algorithms have been used in species mapping [22,23]. In biodiverse ecosystems such as wetlands, where grass species often exhibit significant spectral and morphological overlap, these non-parametric approaches offer distinct advantages over traditional statistical methods [24]. However, the scalability and transferability of current wetland grass species mapping methods remain constrained by the unique strengths and limitations of individual classifiers [25,26]. Therefore, a systematic comparison of prominent machine learning algorithms is necessary to establish a robust framework for mapping grass species.
This study evaluates three widely used algorithms: Support Vector Machines (SVM), Random Forest (RF), and eXtreme Gradient Boosting (XGBoost). SVM is assessed for its capacity to handle high-dimensional UAV-derived features by using kernel functions to establish optimal decision boundaries for morphologically similar grass species [27]. RF is evaluated for its ability to model complex interactions between spectral, textural and geometric variables through an ensemble approach that ensures robust classification across diverse vegetation patches [28]. Finally, XGBoost is analyzed to determine whether its iterative gradient boosting framework can achieve superior taxonomic accuracy and computational efficiency when processing large-scale, multi-feature datasets [29]. Comparing these algorithms aims to identify the optimal model for mapping wetland grass species.
Accordingly, the primary objective of this study is to develop a novel framework for fine-scale mapping of wetland grass species that utilize UAV-based multi-source remote sensing and machine learning. Specifically, this study aims to address the following research questions:
- What spectral, textural, and geometric features best discriminate among wetland grass species, and how do they contribute to species separability in our study area?
- To what extent can the fusion of different feature types (spectral, textural, and geometric) improve the accuracy of wetland grass species mapping?
- How do different machine learning algorithms (SVM, RF, and XGBoost) perform when classifying wetland grass species using UAV-derived multi-source data?
2. Materials and Methods
2.1. Study Area
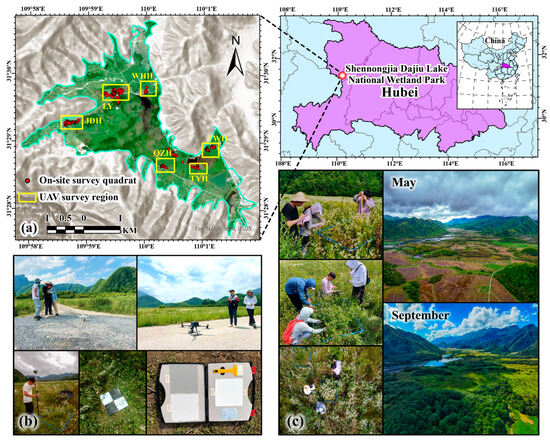
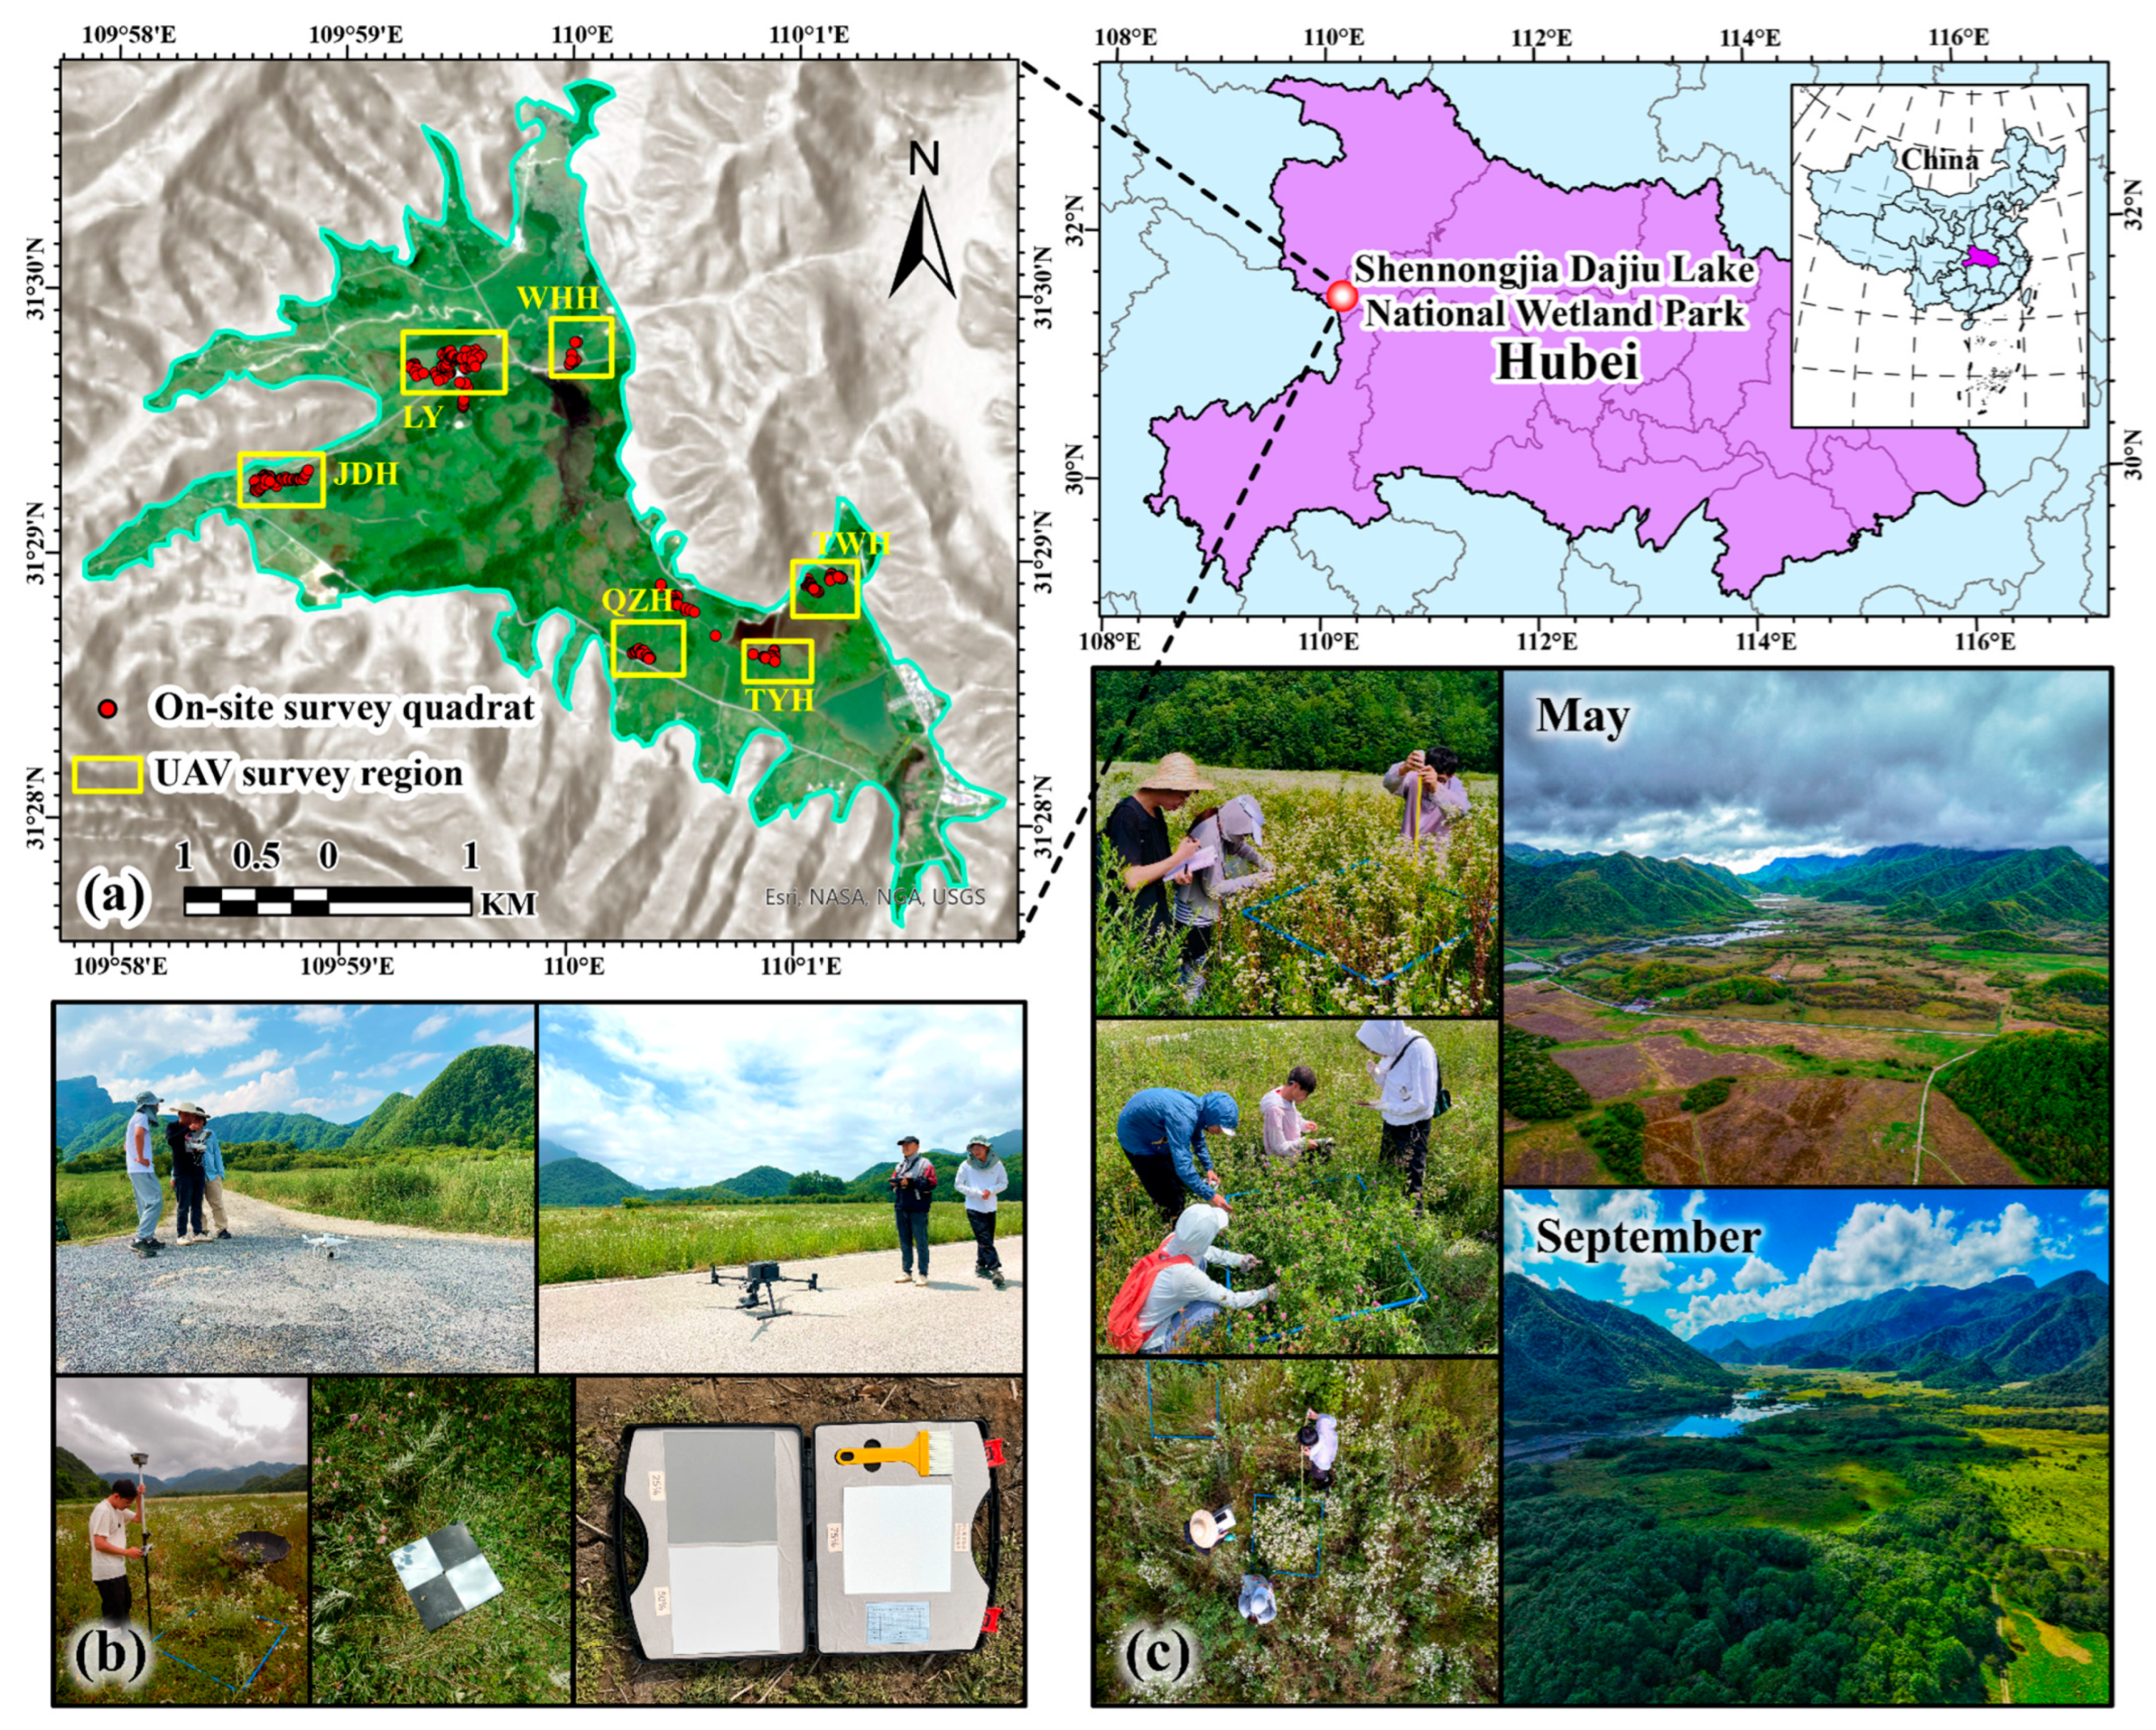
The study area is located in Dajiu Lake National Wetland Park (31°28′14′′N, 110°2′51′′E), situated on the northwestern margin of the Shennongjia Forestry District in Hubei Province, China (Figure 1). The park lies at an average elevation of approximately 1730 m and covers a total area of 93.2 km2. It represents a rare subalpine Sphagnum bog wetland in the subtropical zone, characterized by a typical closed high-altitude basin landform surrounded by mountains ranging from 2200 to 2800 m in elevation. Internally, the wetland comprises nine bead-like lakes interspersed with extensive marshes, meadows, and peatlands. This ecosystem harbors numerous plant species, such as Sanguisorba officinalis, Carex argyi, Juncus effusus, Polygonum sieboldii, Artemisia lavandulaefolia, Calamagrostis epigeios, Bidens pilosa and Fragaria orientalis, among others.
Figure 1.
(a) Location of the study area: Red dots indicate the positions of the quadrats, while yellow rectangles represent the extent of the survey plots. (b) UAV data acquisition in synchronization with the field surveys. (c) Field surveys and landform of Dajiu Lake Wetland.
2.2. Field Survey
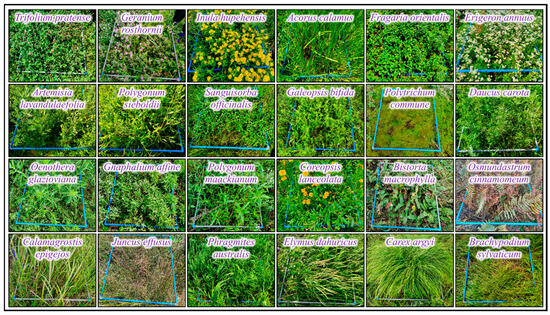
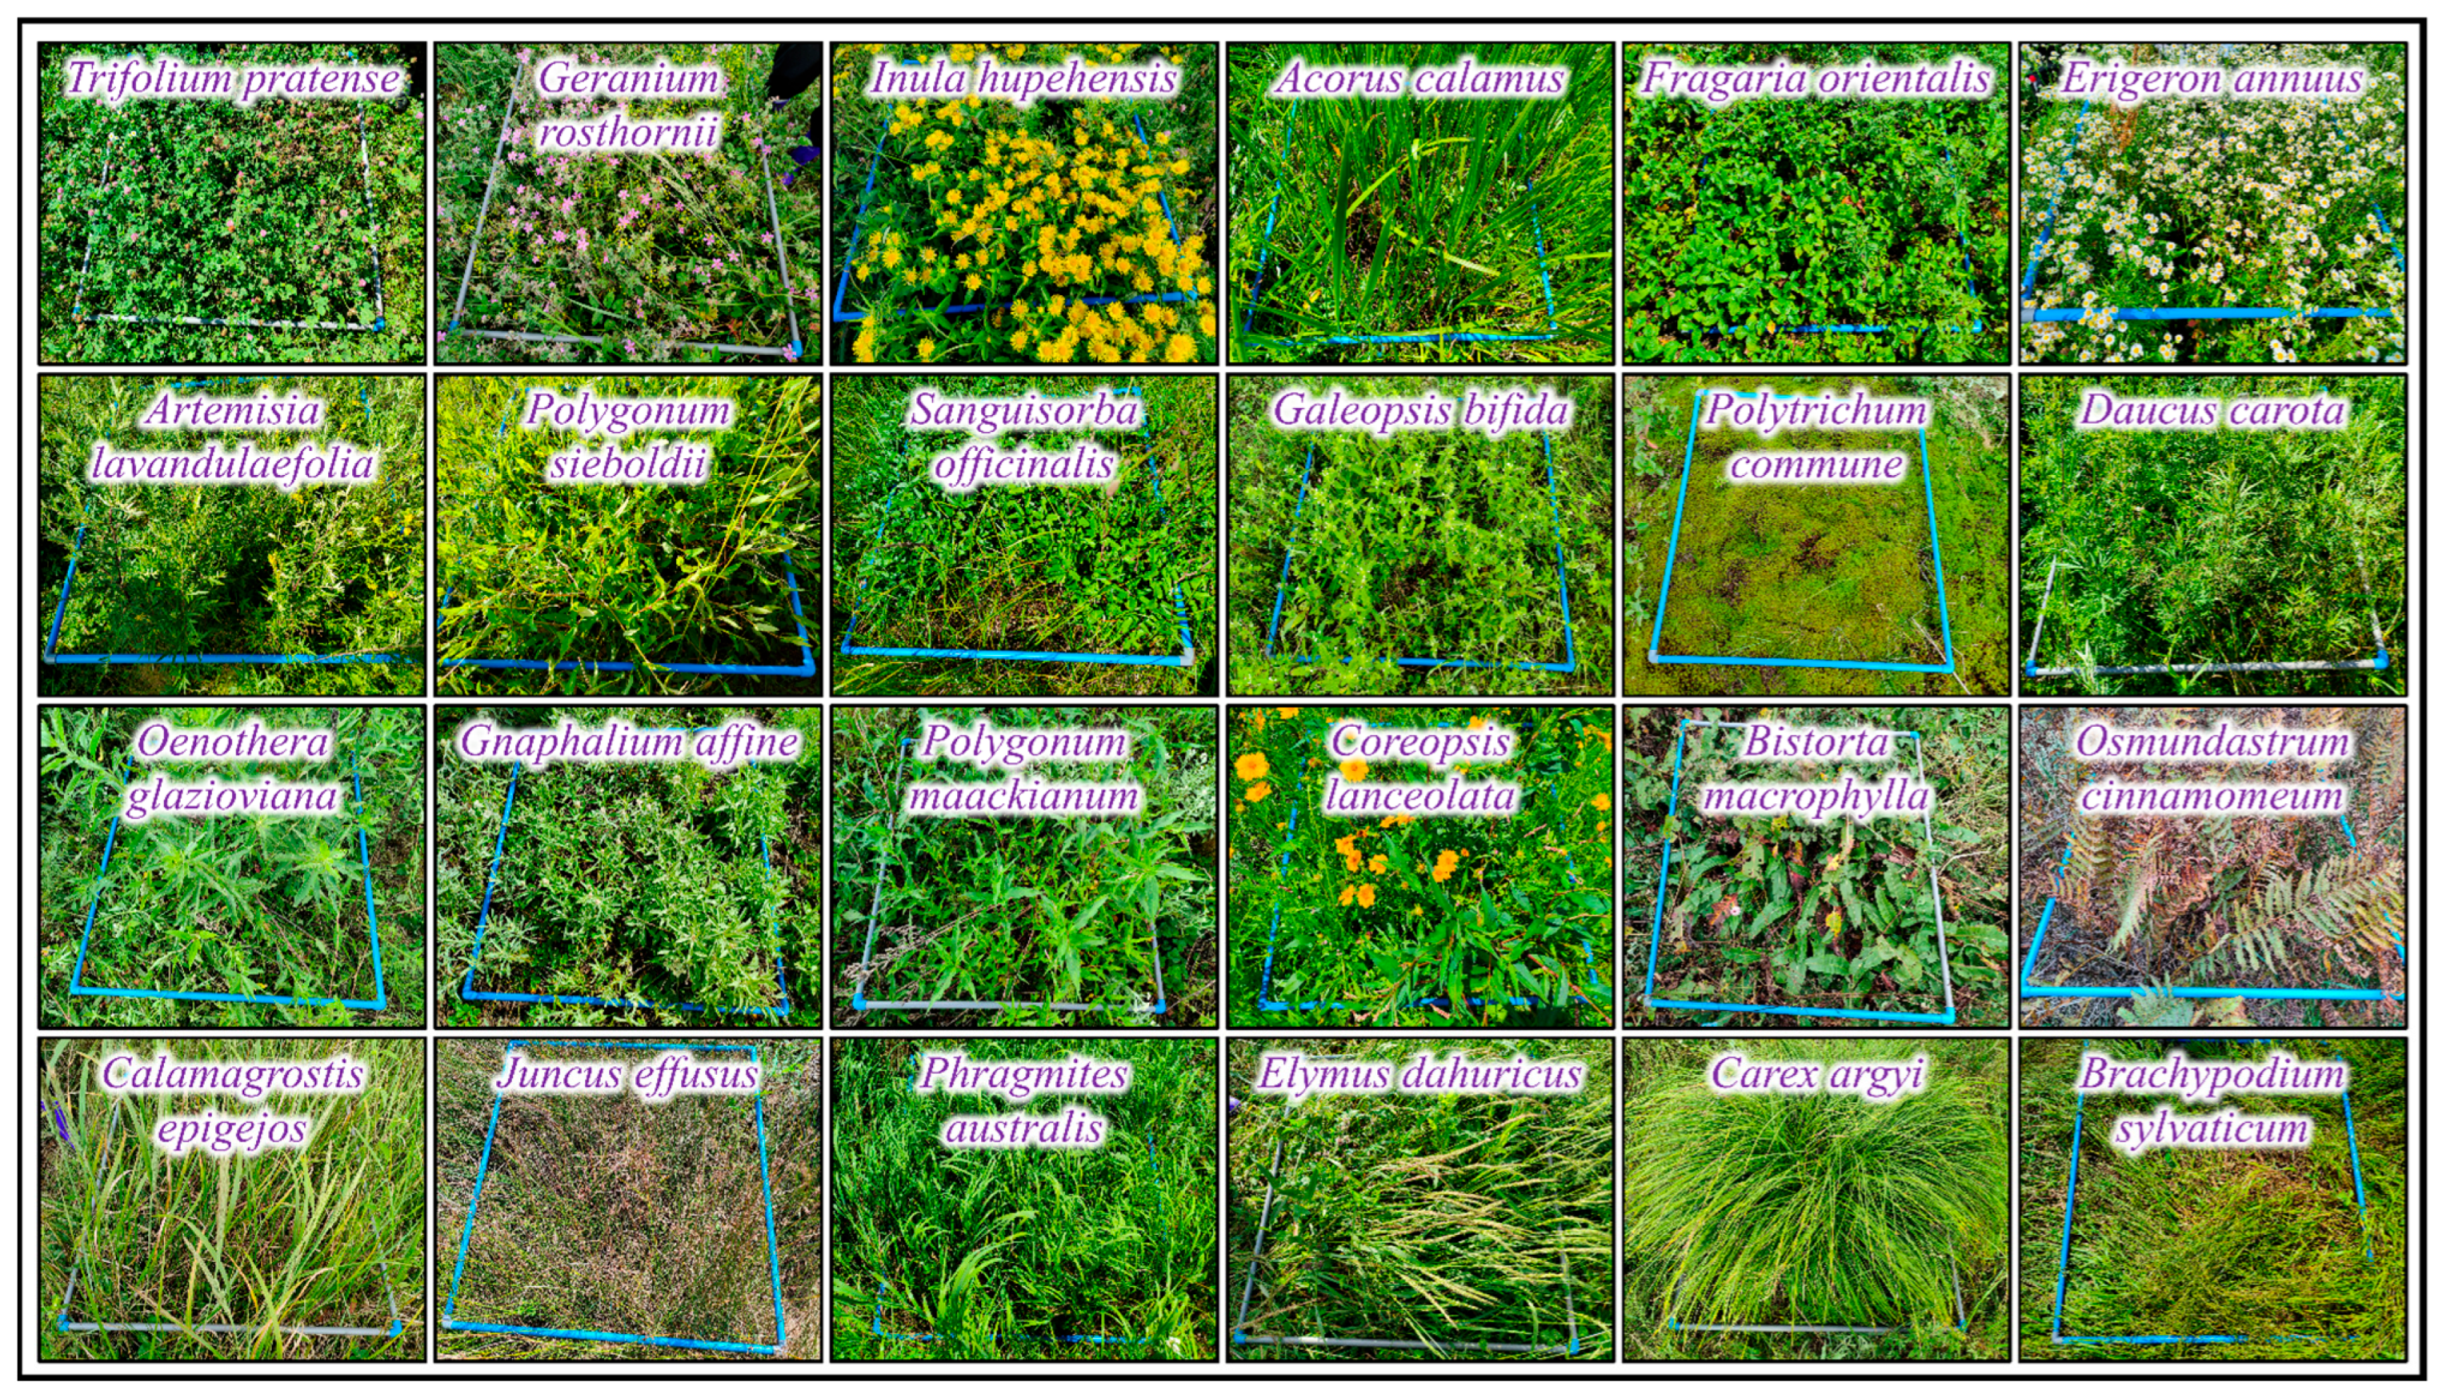
Field surveys were conducted across the entire region in July and September 2022, and again in August 2023. A total of 287 randomly distributed quadrats (1 m × 1 m), each separated by a minimum distance of 10 m, were established across six plots: TWH, TYH, WHH, LY, JDH, and QZH (Figure 1a). These quadrats encompassed the primary grass species within each plot (Figure 2). Within every quadrat, species composition and canopy cover (%) were recorded. The geographic coordinates of the four corners and the center of each quadrat were measured using a HUACE i90 GNSS RTK receiver (Huace, Beijing, China), achieving a positional accuracy of ±2.5 mm. Field surveys served to validate major species composition and calibrate their color and morphological features as observed in UAV data. These verified characteristics formed the foundation for selecting representative samples for visual interpretation, facilitating the scaling up of local expert knowledge to the full plot extent.
Figure 2.
Sample images of ground objects.
2.3. UAV Data Acquisition and Preprocessing
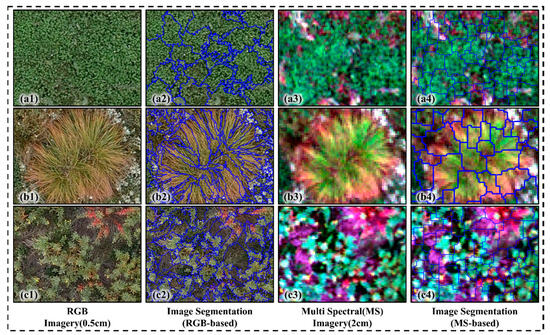
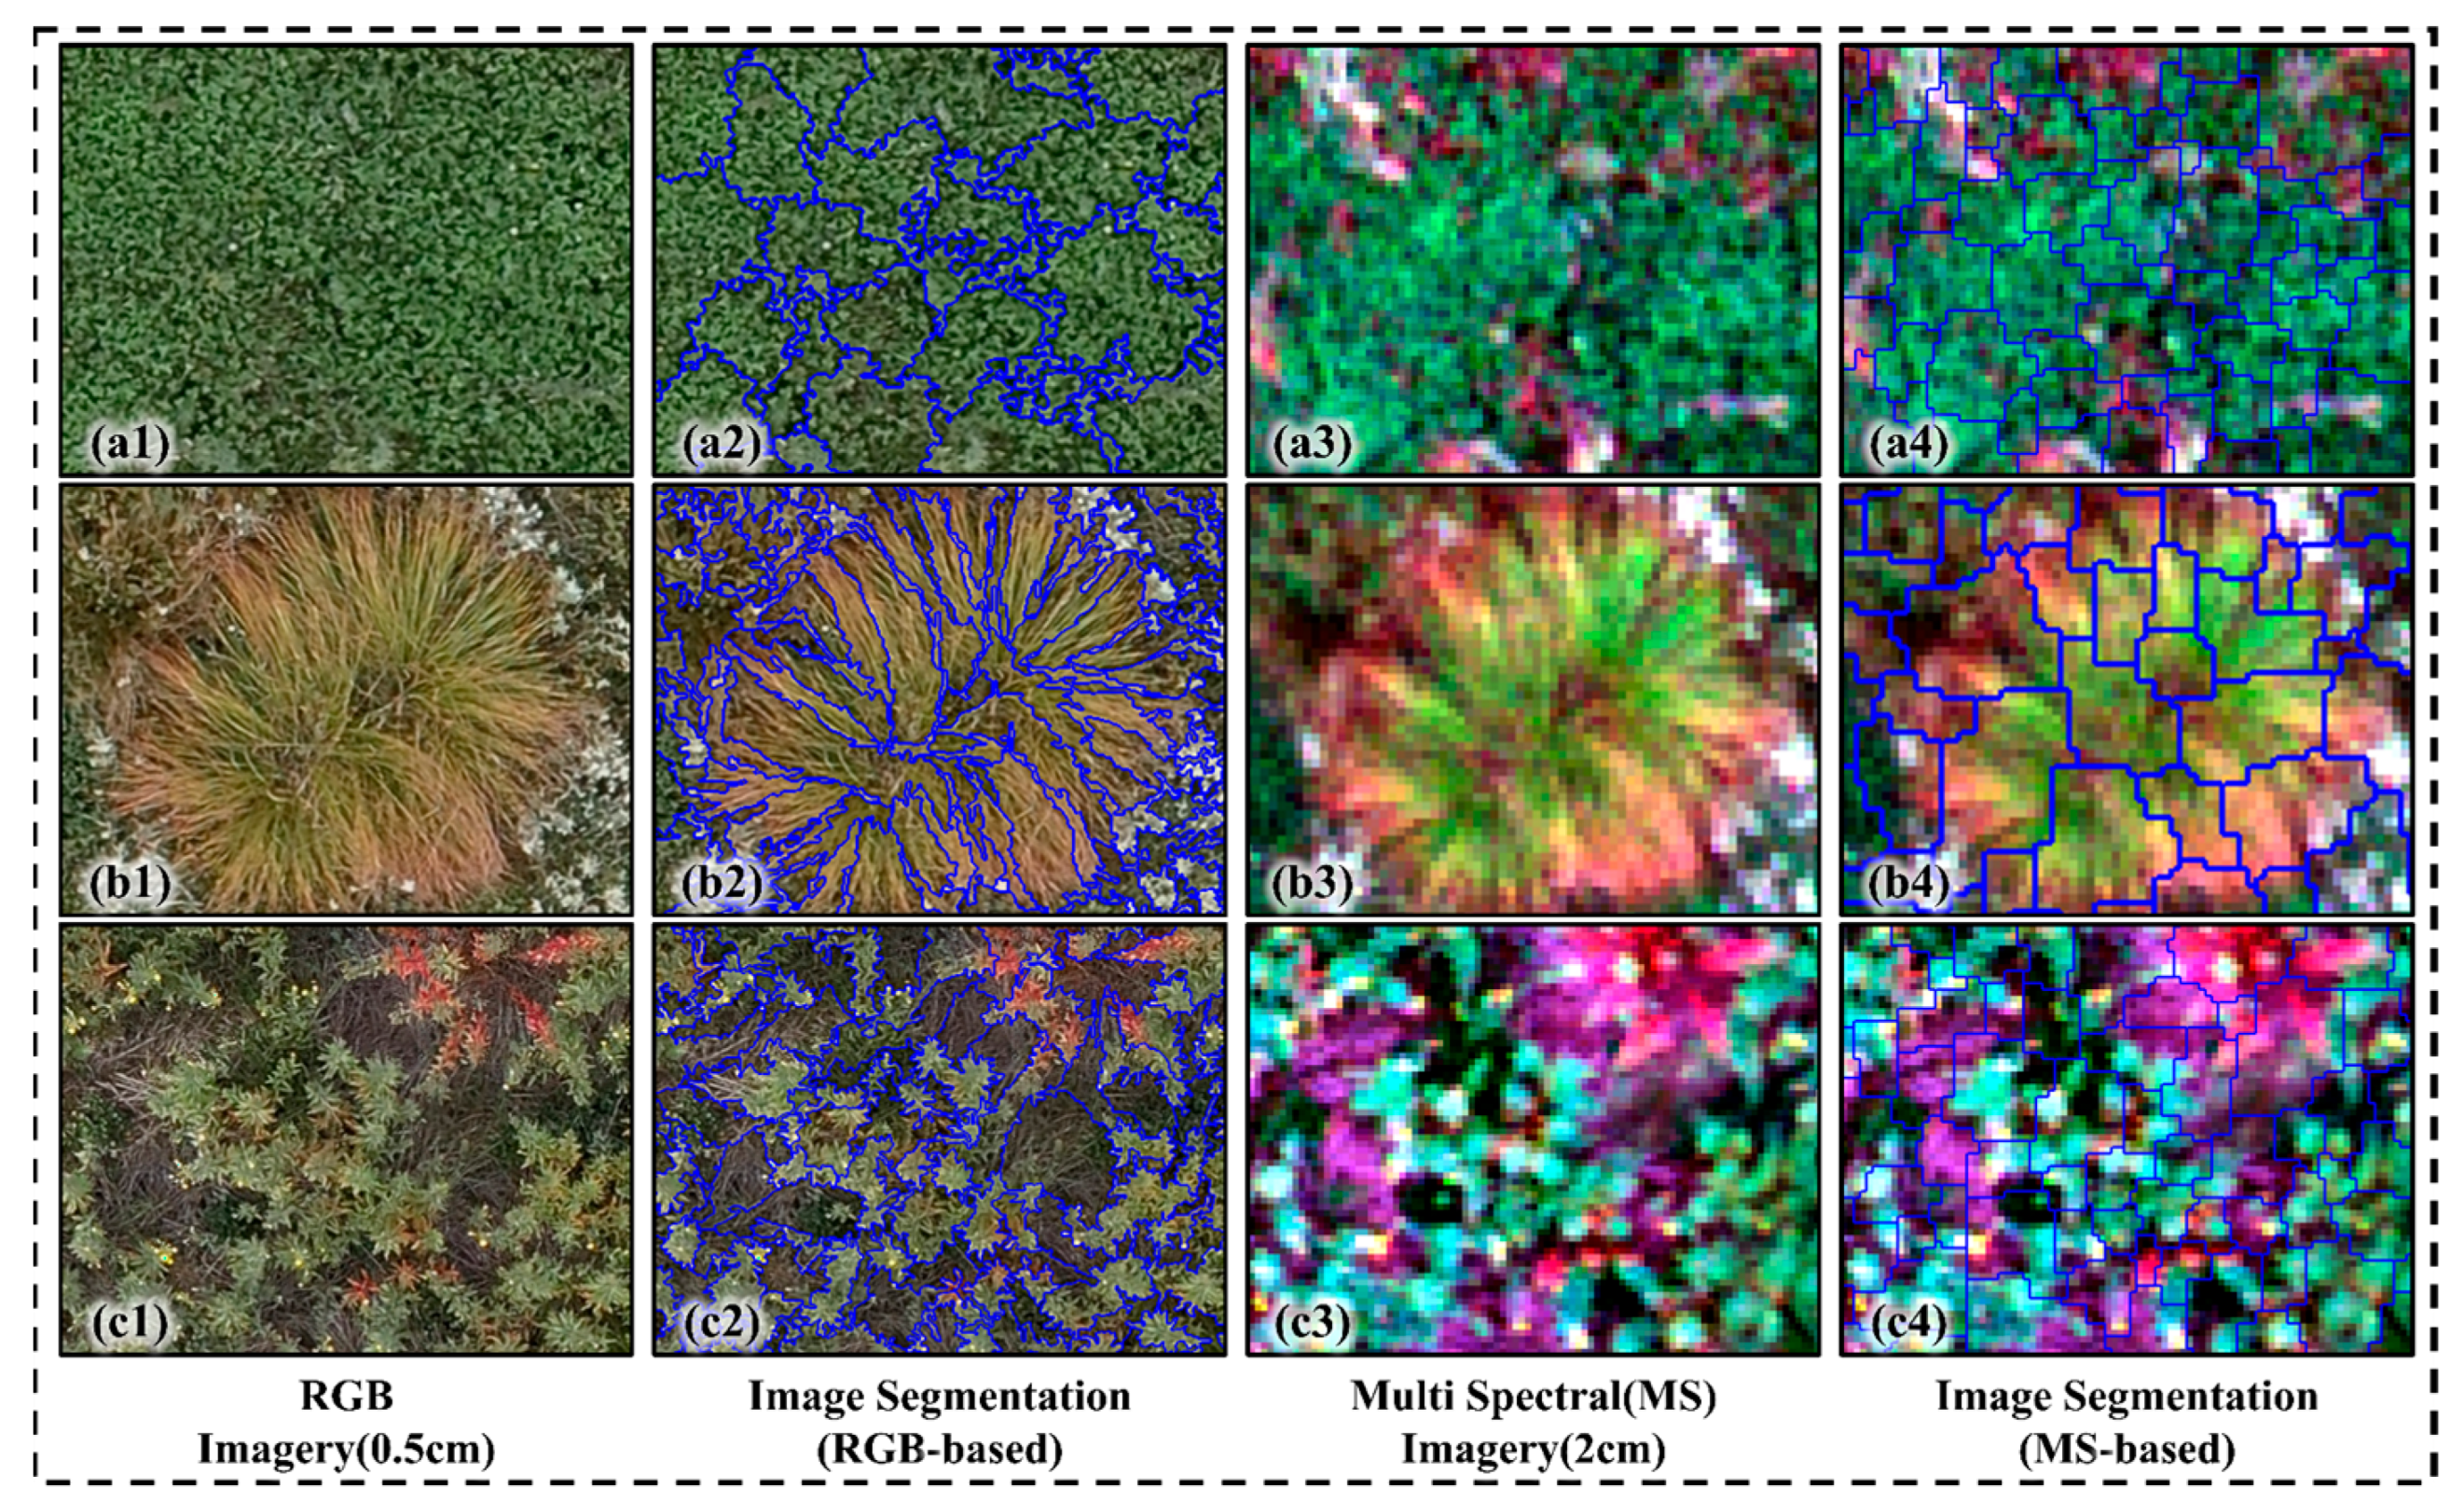
UAV-based RGB and multispectral imagery were acquired simultaneously during field surveys. RGB images at a ground sampling distance (GSD) of 0.5 cm were captured using a Zenmuse P1 camera (DJI, Shenzhen, China) mounted on a DJI Matrice 300 RTK UAV (DJI, Shenzhen, China) flown at an altitude of 40 m. Multispectral images with a GSD of 2 cm were collected using a DJI Phantom 4 Multispectral UAV system (DJI, Shenzhen, China) operating at the same flight altitude. The multispectral sensor captures five spectral bands: blue (B), green (G), red (R), red edge (REDEDGE), and near-infrared (NIR). While multispectral imagery provides enriched spectral information, its lower spatial resolution often results in the loss of fine-scale leaf texture and canopy structure; in contrast, RGB imagery leverages high spatial resolution to provide detailed textural and geometric features based on segmented objects (Figure 3). Prior to each flight, nine plastic ground control points (GCPs) were deployed across each survey plot, and their coordinates were recorded using HUACE i90 GNSS RTK for post-flight georeferencing. Image mosaicking was performed in DJI Terra V3.5, and all UAV-derived data were radiometrically calibrated using reflectance calibration panels.
Figure 3.
Object-based image segmentation results for dominant wetland grass species comparing high-resolution RGB and multispectral (MS) imagery. The three panels illustrate species-specific segmentation: (a1–a4) Trifolium pratense (Red Clover), (b1–b4) Carex spp. (Sedge), and (c1–c4) Oenothera glazioviana (Large-flowered Evening Primrose). Specifically: (a1,b1,c1) denote original RGB ortho-images; (a2,b2,c2) show corresponding RGB object-based segmentation results; (a3,b3,c3) denote original MS ortho-images; and (a4,b4,c4) represent MS object-based segmentation results. Blue vectors indicate segment boundaries throughout all sub-panels.
2.4. Methods
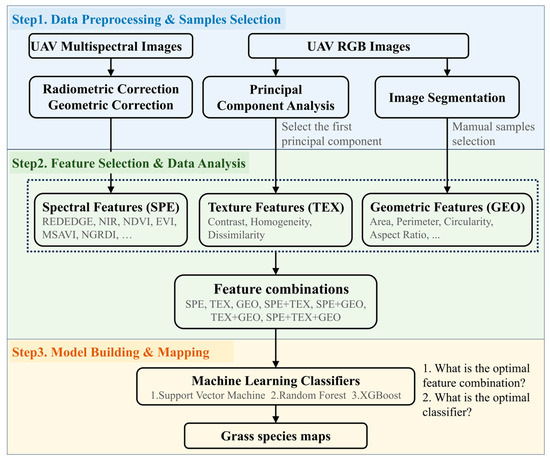
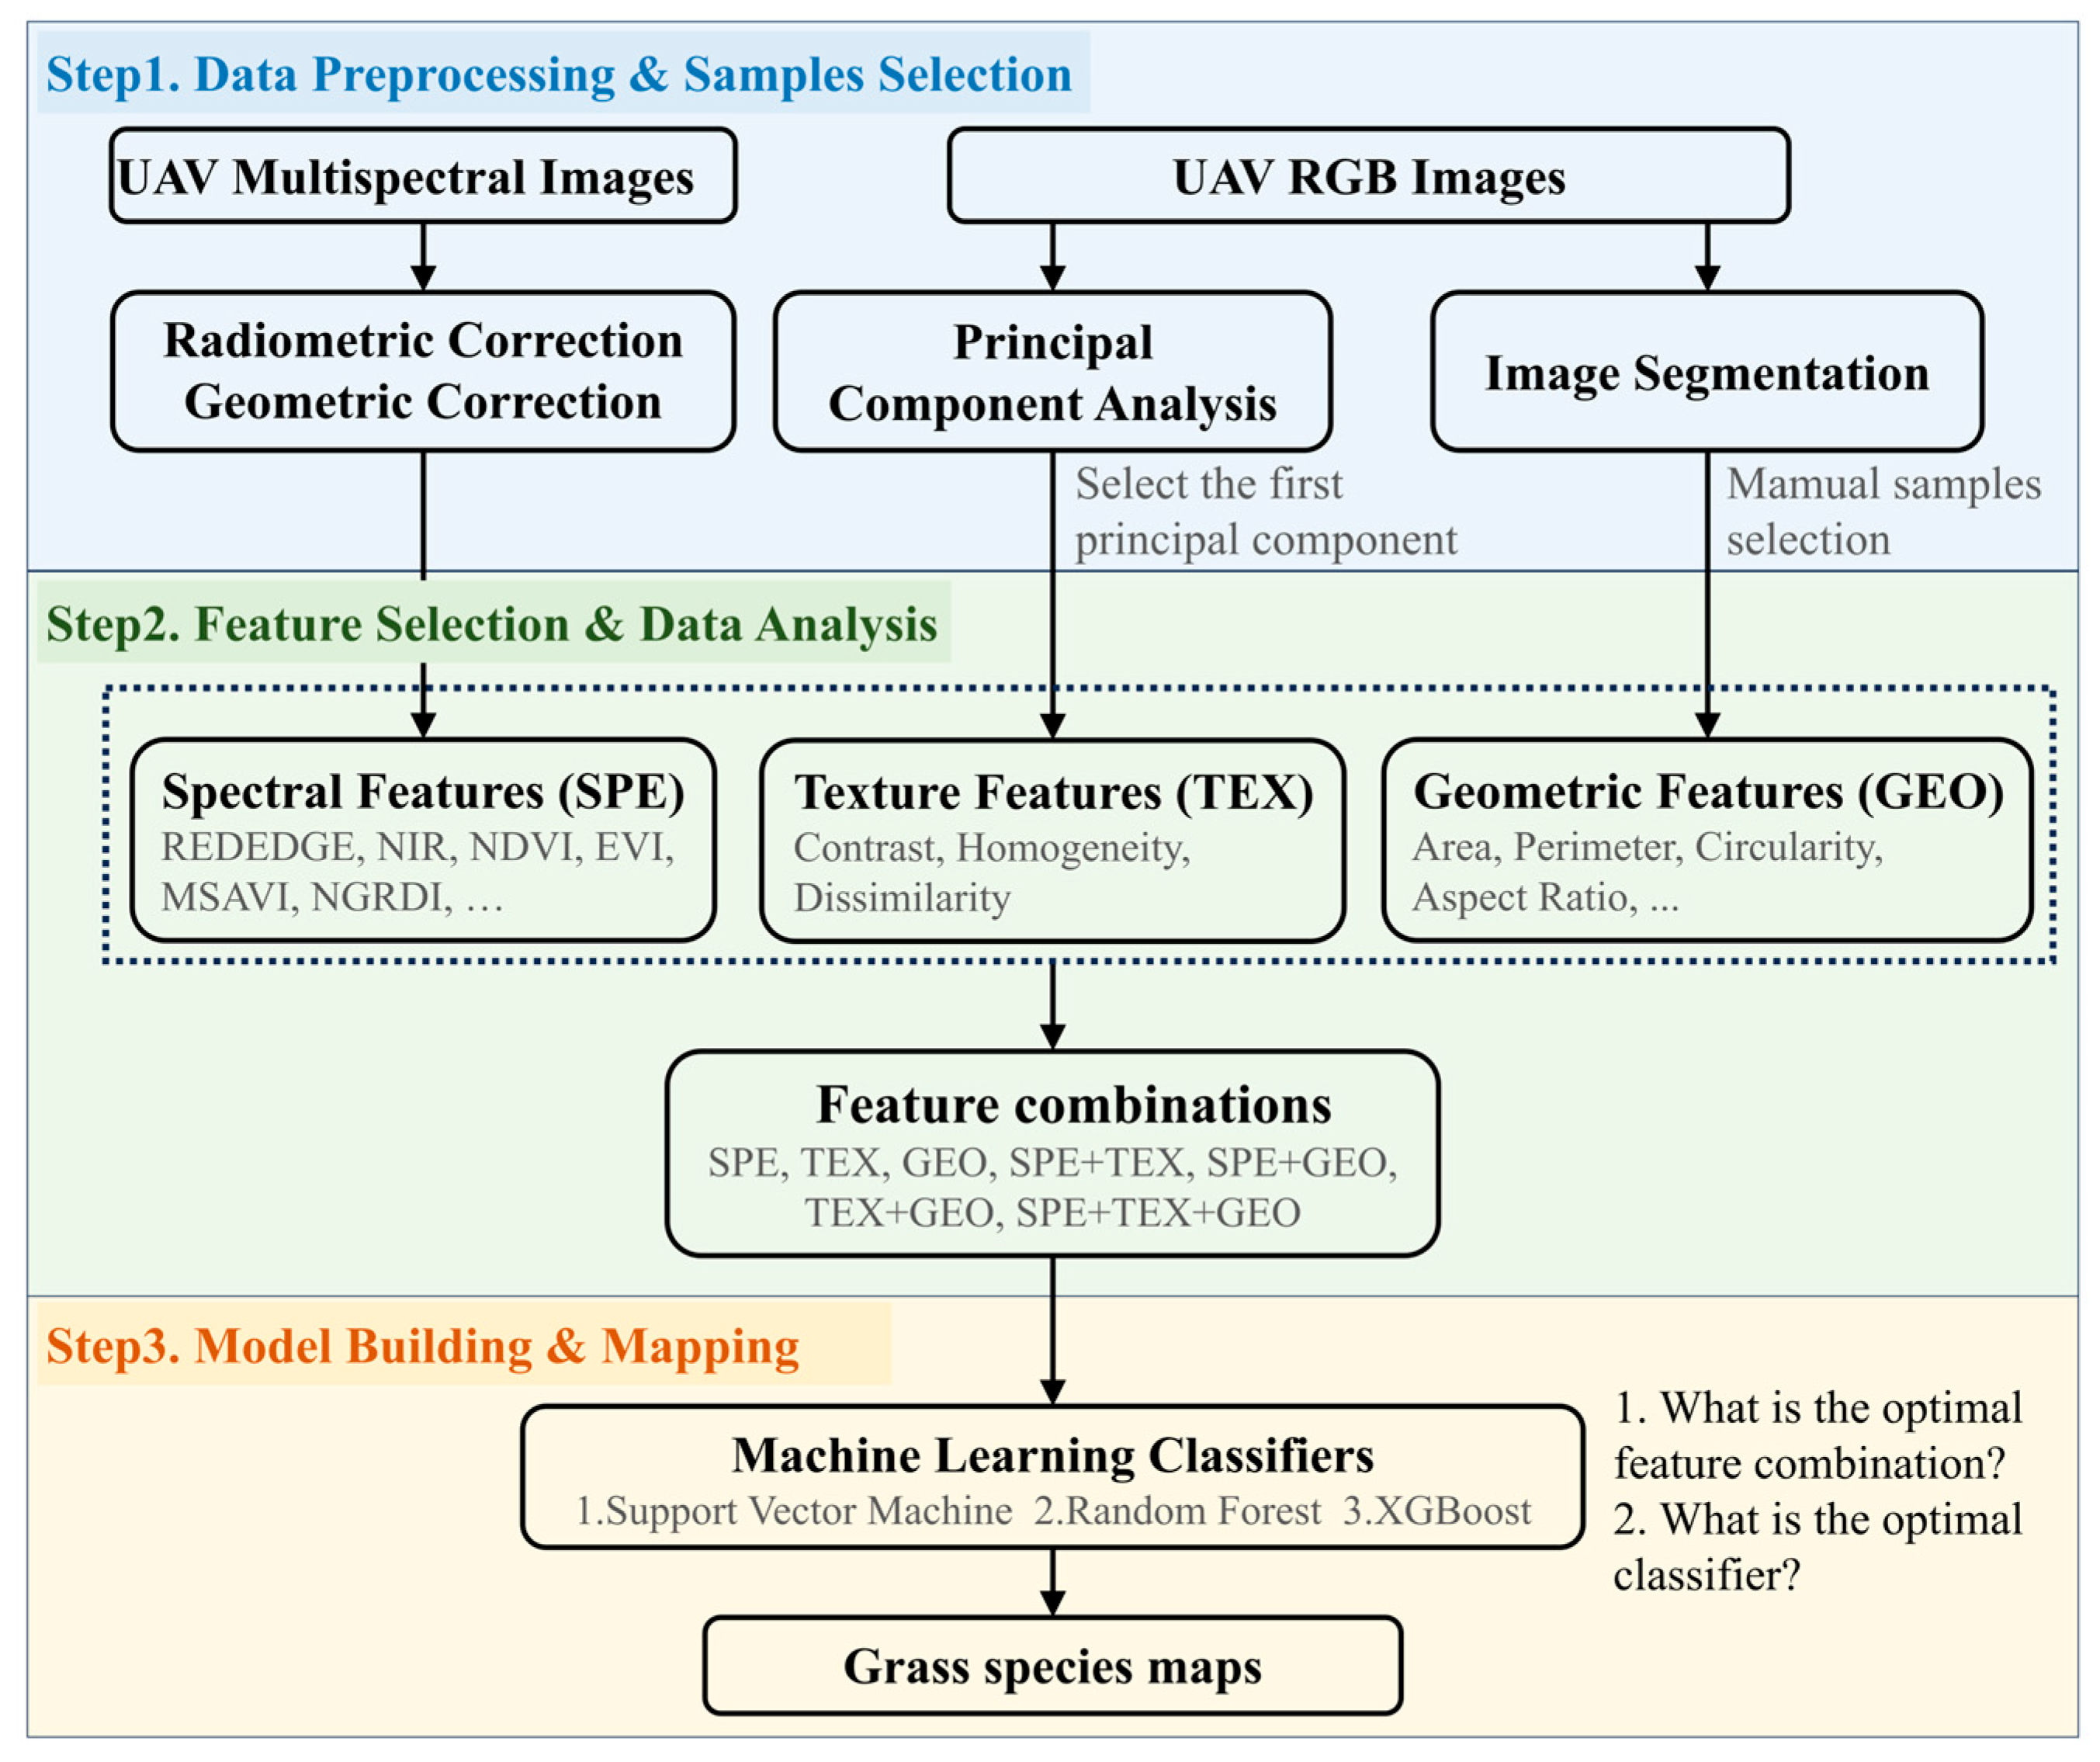
We developed a UAV-based grass species mapping framework integrating multi-source remote sensing features and machine learning algorithms, structured into three sequential steps (Figure 4). First, multispectral imagery underwent geometric and radiometric correction, while RGB images were segmented, and the first principal component was extracted via Principal Component Analysis (PCA) [30]. Second, spectral features were derived from the multispectral data, textural features were computed from the first principal component, and geometric features were calculated from the segmented image objects; these were then combined into multiple feature sets representing distinct combinations of feature types. Third, three machine learning algorithms (SVM, RF, and XGBoost) were used to evaluate model performance across all feature combinations and the best model was chosen for further wetland grass species mapping.
Figure 4.
Workflow of this study.
2.4.1. Image Segmentation and Ground Truth Samples Selection
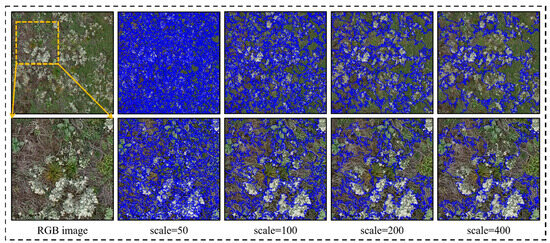
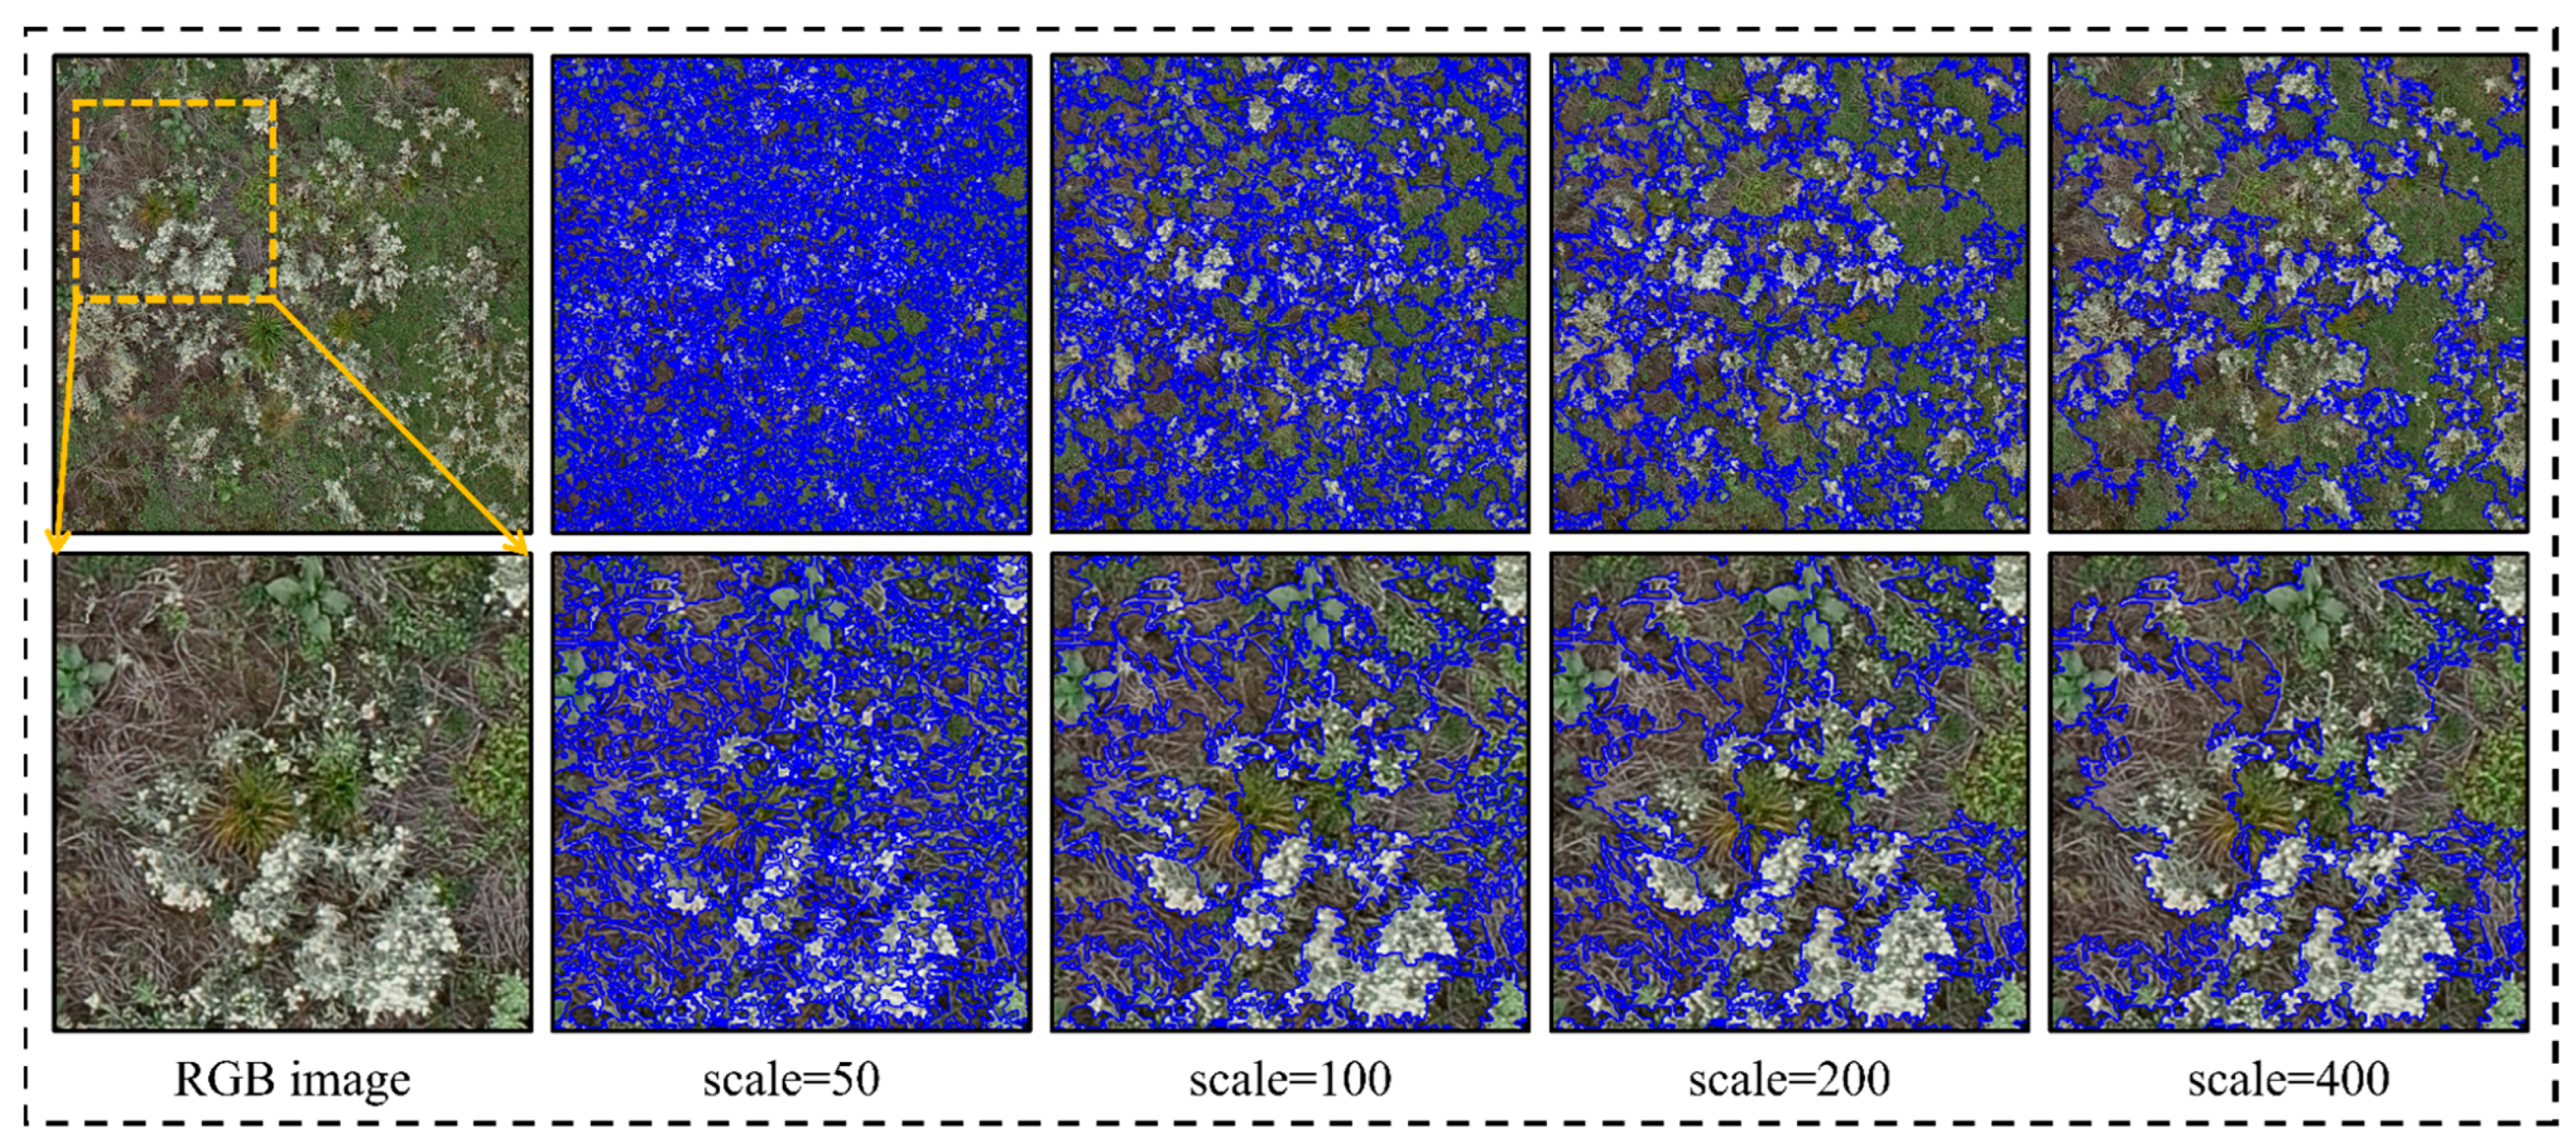
This study employs an OBIA approach for grass species mapping, in which image segmentation constitutes a critical step that directly influences subsequent mapping accuracy [31]. RGB imagery was used for image segmentation. To identify the optimal segmentation scale parameter, we used eCognition 9.0 software integrated with the Estimation of Scale Parameter 2 (ESP2) tool [32]. This method computes the rate of change of local variance (ROC-LV) across multiple segmentation scales to detect locally optimal segmentation scales. Based on the ROC-LV curve, we tested scale parameters of 50, 100, 200, and 400 (Figure 5). Based on prior studies in UAV multiresolution segmentation for some internal testing, the segmentation parameter values for shape and compactness weights are 0.1 and 0.8, respectively. Visual inspection of segmentation results revealed that scales below 100 resulted in over-segmentation, fragmenting patches of Gnaphalium affine, Coreopsis lanceolata and Galeopsis bifida, among others. Conversely, scales above 100 led to under-segmentation, causing distinct grass classes, such as Carex argyi, Fragaria orientalis, and Trifolium pratense, to be merged into single image objects. After comparative evaluation, a parameter of 100 was selected as the optimal scale.
Figure 5.
Illustration of different segmentation scales. Yellow dashed boxes indicate the enlarged areas shown in the respective sub-panels.
Using this parameter, we applied the multiresolution segmentation algorithm to generate a segmented object layer for each plot. Ground-truth reference samples were manually labeled based on segmented image objects through field surveys and visual interpretation of UAV imagery, encompassing 24 grass species as well as non-grass land-cover types including buildings, water bodies, and bare soil. Training and validation samples were partitioned using a 30 m × 30 m grid superimposed over the plots, thereby mitigating potential data leakage caused by neighboring image objects in the validation set (as illustrated in Figure A1 and Figure A2). Ultimately, the dataset comprised a total of 95,880 samples, consisting of 81,310 training samples and 14,570 validation samples (Table 1).
Table 1.
Distribution of training and validation samples.
2.4.2. Feature Extraction
The spectral, textural, and geometric features were chosen to build grass species mapping models (Table 2). Spectral features included the 5 multispectral bands and 12 vegetation indices. Texture features were extracted using the GLCM based on the first principal component (PC1) of the RGB imagery, which accounted for an average of 99% of the total variance. Among the GLCM metrics, 3 texture features exhibiting low inter-correlation and high discriminative potential were selected (contrast, homogeneity, dissimilarity). Based on segmented objects, 6 geometric features were calculated.
Table 2.
The spectral, textural, and geometric features extracted from UAV imagery.
2.4.3. Grass Species Mapping Models
In this study, to comprehensively evaluate the potential of a multidimensional feature space, comprising spectral, textural, and geometric features, for wetland grass species mapping and to ensure the robustness of the mapping results, we compared the performance of three widely used machine learning algorithms: SVM, RF, and XGBoost. Furthermore, to systematically assess the contribution of each feature type to grass species mapping, and specifically to evaluate the capacity of texture and geometric features derived from RGB imagery to enhance species separability. We designed seven feature sets: SPE, TEX, GEO, SPE + TEX, SPE + GEO, TEX + GEO, and SPE + TEX + GEO. During model development, Recursive Feature Elimination (RFE) was applied to remove redundant features from the full feature sets in the training dataset [45].
To achieve optimal predictive performance, a systematic hyperparameter tuning process was conducted for all machine learning algorithms. This study employed a Grid Search strategy coupled with 5-fold cross-validation to evaluate the generalization capability of each parameter combination [46]. Following the optimization process, the final configurations were determined as follows: for SVM, C = 100, gamma = ‘scale’, and a linear kernel; for RF, n_estimators = 500, max_depth = 20, max_features = ‘sqrt’, min_samples_leaf = 1, and min_samples_split = 2; and for XGBoost, n_estimators = 500, learning_rate = 0.1, max_depth = 5, and gamma = 0.1. A more detailed description of the exhaustive tuning process and the complete final parameter sets for all evaluated models are provided in Appendix A Table A1.
2.4.4. Accuracy Assessment
The performance of grass species mapping models based on different feature combinations was evaluated using overall accuracy (OA) and Macro-F1 score:
Specifically, true positives (), false positives (), true negatives (), and false negatives () were derived from the confusion matrix, and n is the number of land cover classes in this study.
3. Results
3.1. Plant Species Exhibit High Discriminability Based on Key Features
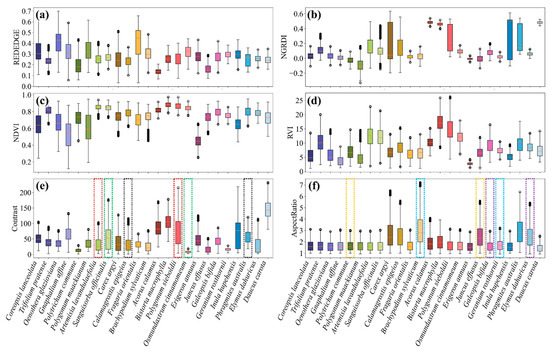
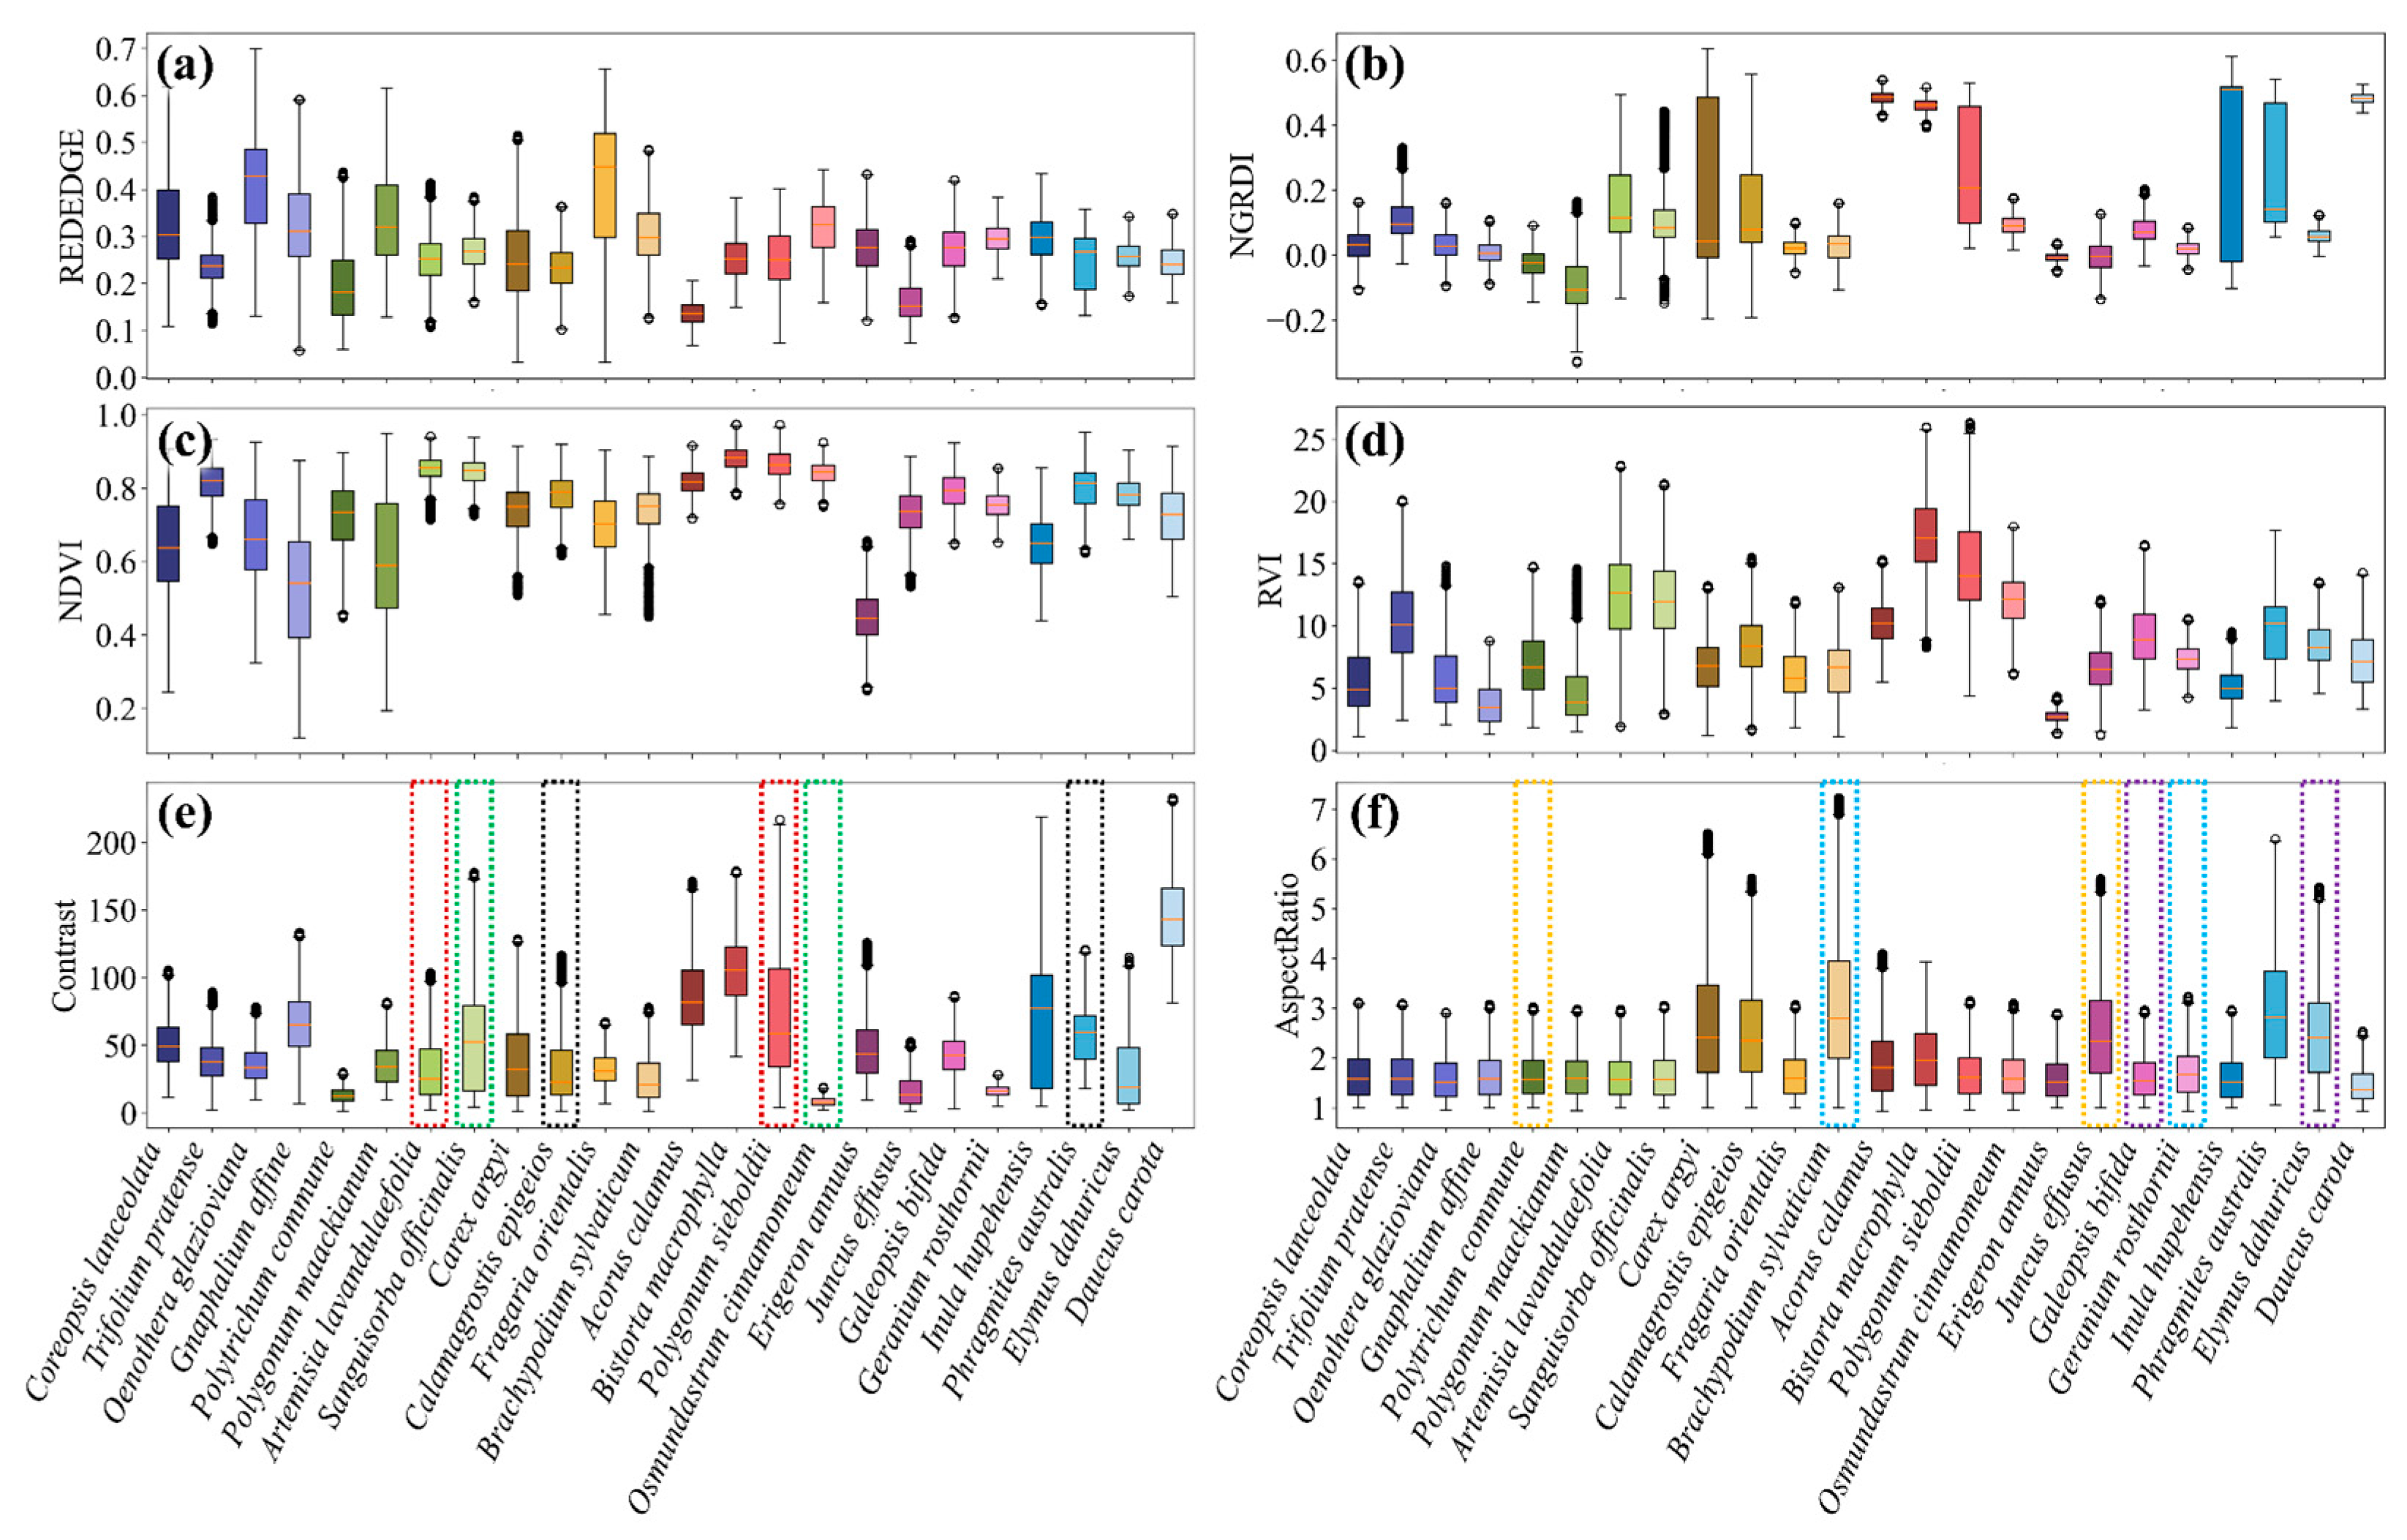
Figure 6 illustrates the distribution of 24 grass species across representative spectral features, textural features, and geometric features. Box plots effectively reveal the separability differences among species within a multidimensional feature space. Specifically, Figure 6a–d demonstrate that spectral features can distinguish species with markedly different pigment contents and cellular structures, such as Oenothera glazioviana, Polygonum maackianum, Fragaria orientalis, Bistorta macrophylla, and Acorus calamus. However, certain species pairs, including Artemisia lavandulaefolia and Polygonum sieboldii, Sanguisorba officinalis and Osmundastrum cinnamomeum, and Calamagrostis epigejos and Phragmites australis, are difficult to differentiate based solely on spectral features. The introduction of textural features (e.g., contrast) derived from RGB imagery provides additional discriminatory power for species that share similar spectral traits but differ in leaf morphology or canopy structure (Figure 6e).
Figure 6.
Statistical box plots of key spectral (a–d) (RedEdge, NGRDI, NDVI, and RVI), textural (e), and geometric (f) features across grass species. The dashed boxes of the same color highlight the classification gain provided by textural and geometric features for grass species that are difficult to distinguish based solely on spectral features.
Furthermore, geometric features serve as a critical mechanism for resolving spectral ambiguities among specific grass species in the study area by establishing a “morphological fingerprint” independent of biochemical composition. While spectral signatures often fail to distinguish between species with similar chlorophyll and moisture content, geometric metrics capture distinct physical growth strategies, effectively orthogonalizing the feature space. For instance, the high aspect ratio values characteristic of Carex argyi, Juncus effusus, and Phragmites australis directly quantify their elongated, linear stem and leaf structures, enabling clear separation from cushion-forming species like Polytrichum commune or broad-leaved taxa such as Geranium rosthornii (Figure 2). Consequently, these structural descriptors provide decisive evidence for separating spectrally confounded pairs—such as Brachypodium sylvaticum versus Geranium rosthornii and Galeopsis bifida versus Elymus dahuricus—by leveraging differences in plant architecture and spatial organization that spectral data alone cannot resolve (Figure 6f). Overall, incorporating texture and geometric features into the existing spectral features improves species separability.
3.2. Results of Feature Selection and Ranking of Contributions
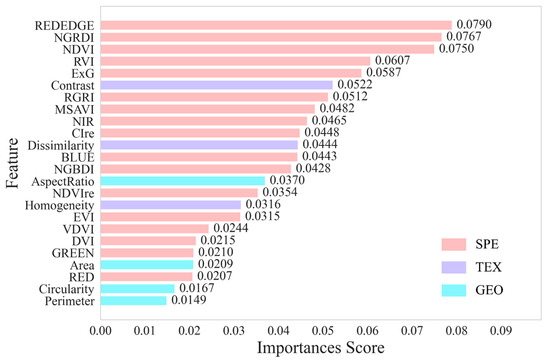
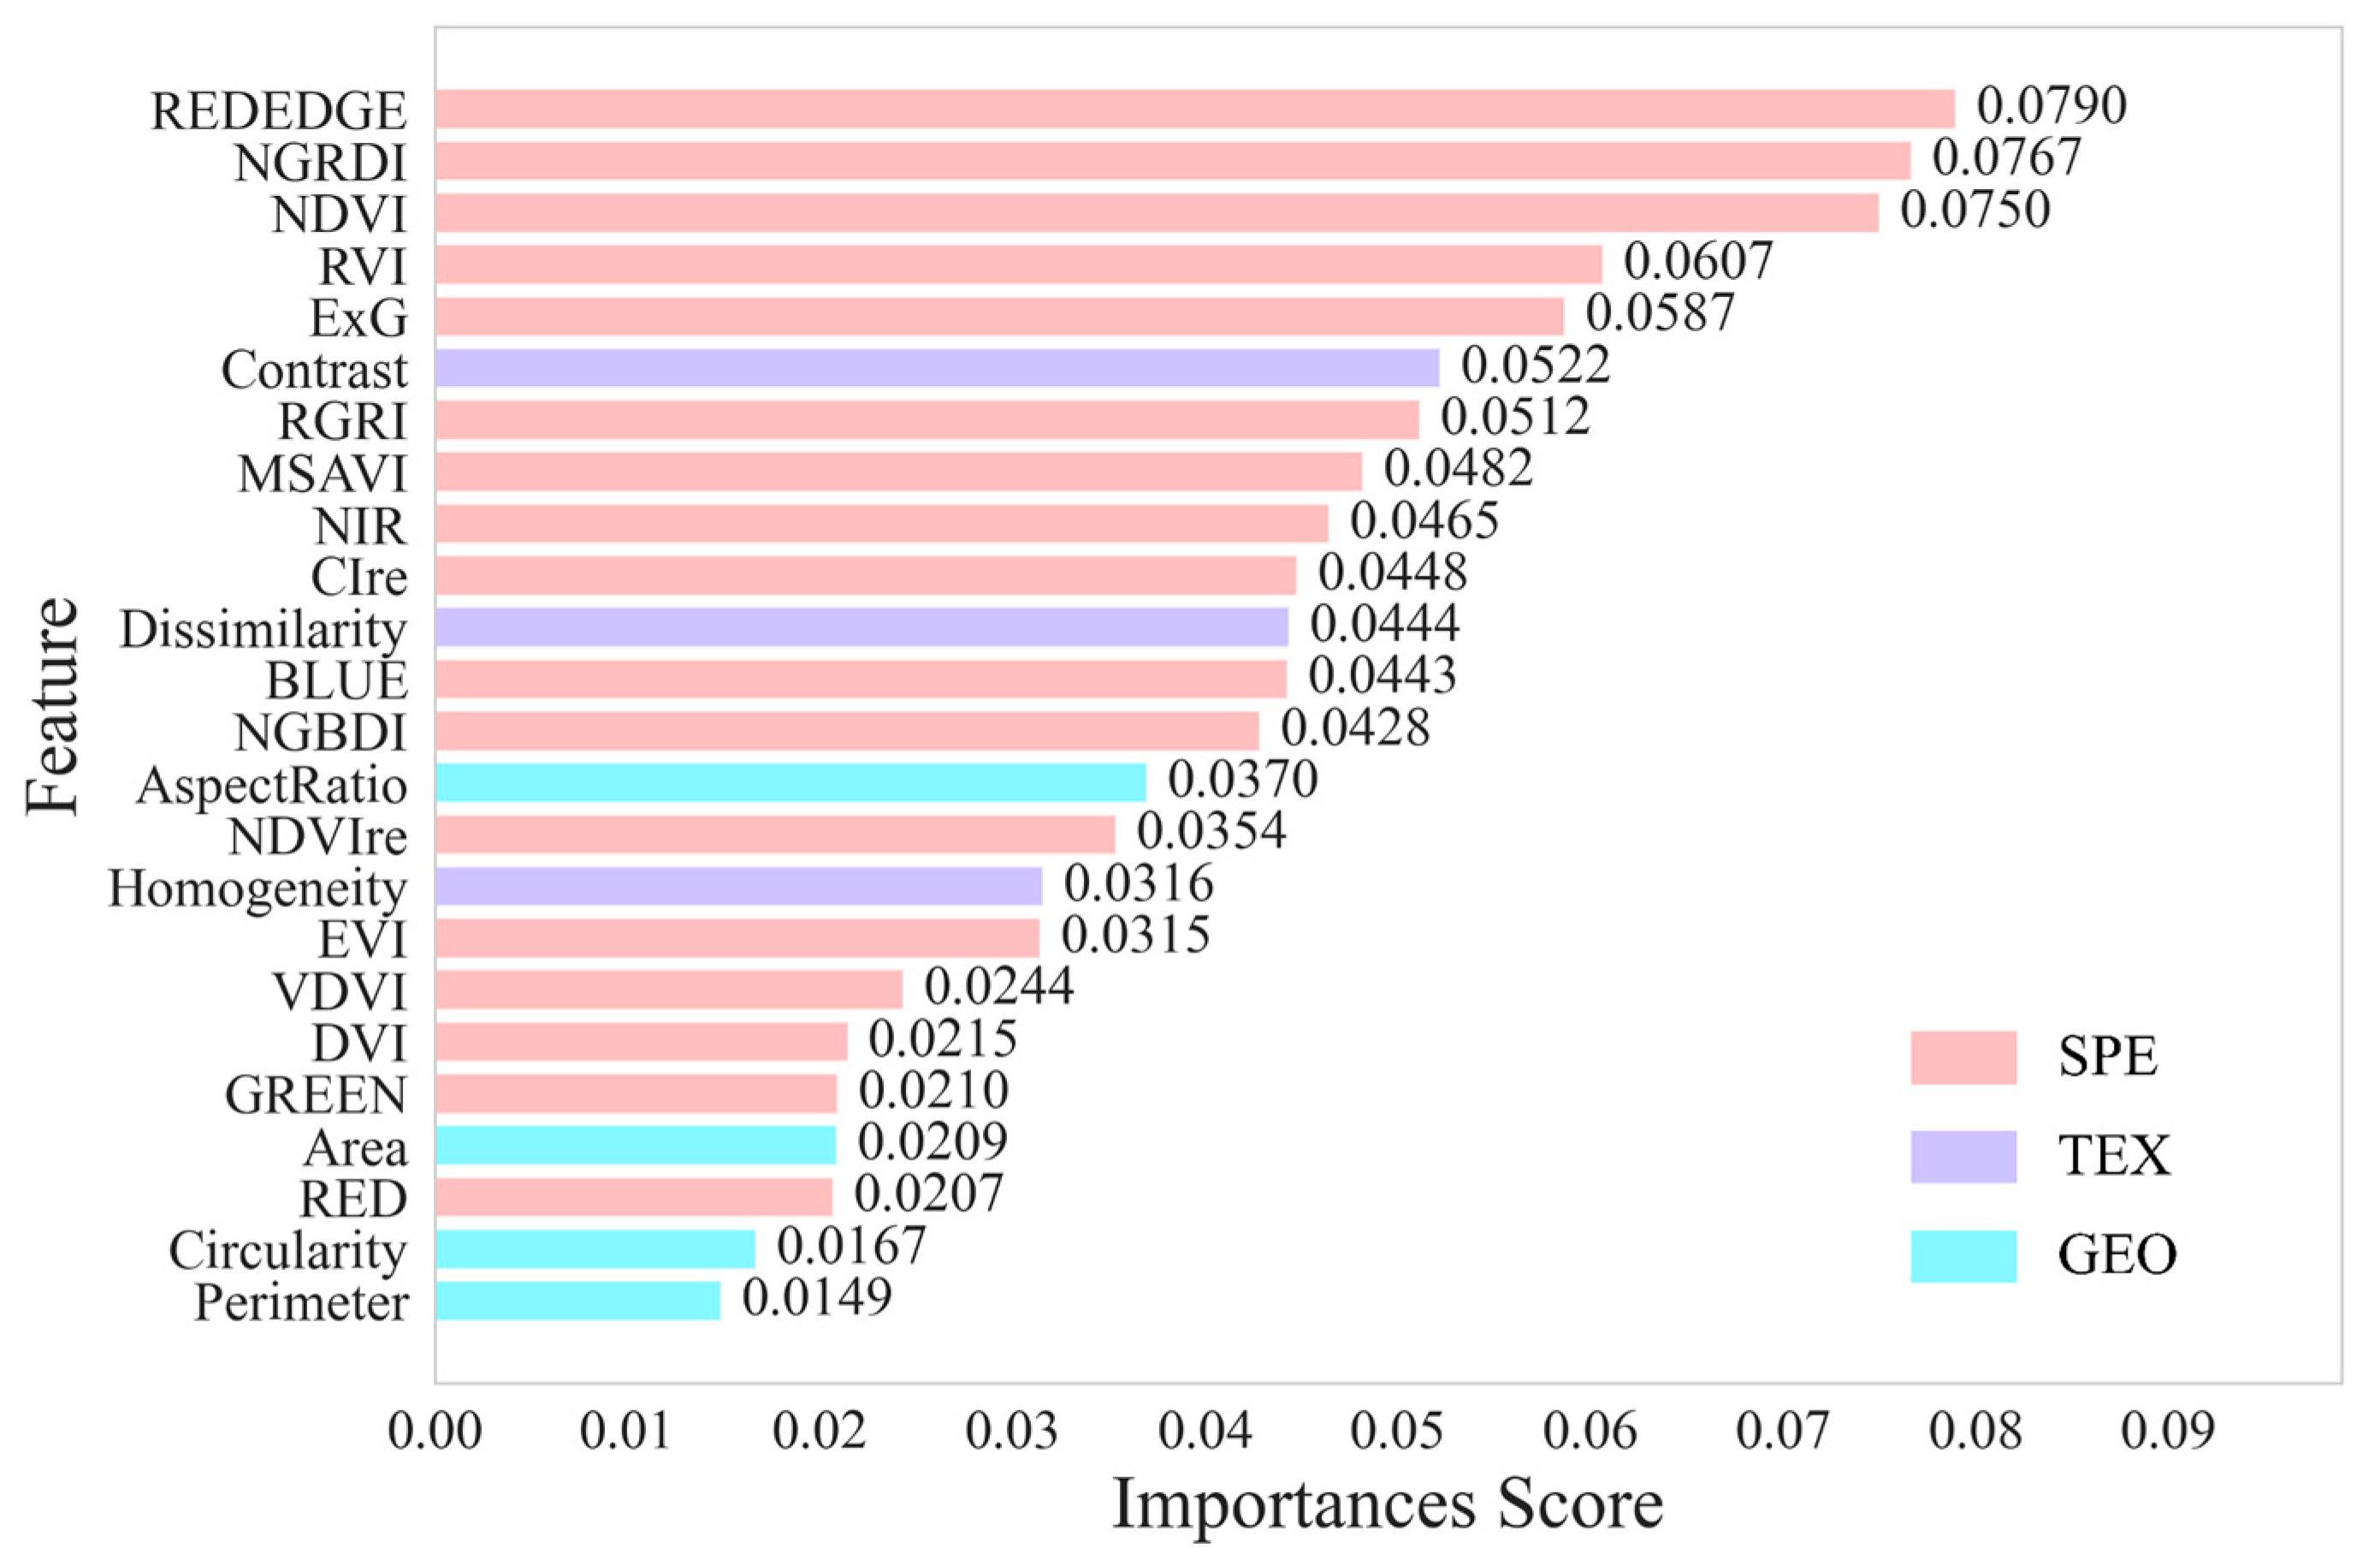
Following RFE, a total of 24 features were selected to form the optimal feature set. Feature importance scores were computed using an XGBoost model (Figure 7). The results indicate that REDEDGE, NGRDI, and NDVI are the most important features for wetland grass species mapping. Although spectral features remain the primary basis, texture and geometric features provide essential complementary information. Specifically, contrast and dissimilarity from the texture features, along with aspect ratio from the geometric features, rank highly in importance. This suggests that these features capture critical inter-species differences—particularly valuable for distinguishing grasses that exhibit minimal spectral variation but marked differences in leaf morphology and canopy structure.
Figure 7.
Importance score of features based on XGBoost.
3.3. Performance of Different Feature Combinations in Plant Classification
We developed and evaluated multiple models to assess the performance of different feature sets in grass species mapping (see Table 3). Among single feature type configurations, spectral features yielded the best results (SVM: OA = 65.1%, Macro-F1 = 0.617; RF: OA = 70.2%, Macro-F1 = 0.694; XGBoost: OA = 71.4%, Macro-F1 = 0.704). Models using only textural or geometric features performed poorly: textural-only models achieved OA = 17.3~22.7% and Macro-F1 = 0.072~0.13, while geometric-only models yielded OA = 14.2~16.2% and Macro-F1 = 0.059~0.101. However, augmenting spectral features with either textural or geometric features consistently improved model accuracy, with textural features providing greater gains. For instance, in XGBoost, adding textural features increased OA by 6.8% and Macro-F1 by 0.077, whereas adding geometric features improved OA by 3.2% and Macro-F1 by 0.027. The highest performance was achieved when spectral, textural, and geometric features were combined (SVM: OA = 72.5%, Macro-F1 = 0.727; RF: OA = 79.1%, Macro-F1 = 0.772; XGBoost: OA = 81.9%, Macro-F1 = 0.807). These results demonstrate that integrating textural and geometric information significantly enhances the accuracy of wetland grass species mapping.
Table 3.
Grass species mapping accuracy evaluation. SPE: spectral features; TEX: texture features; GEO: geometric features.
Furthermore, we compared the performance across all algorithms. XGBoost consistently outperformed both SVM and RF, achieving the highest OA (81.9%) and Macro-F1 (0.807) with the optimal feature set. Compared to SVM and RF, XGBoost improved OA by 9.4% and 2.8%, respectively, and increased Macro-F1 by 0.08 and 0.035, respectively. These findings indicate that XGBoost is superior to SVM and RF for wetland grass species mapping.
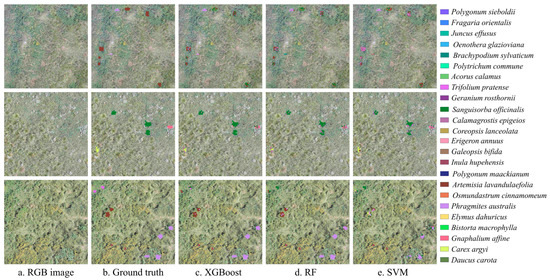
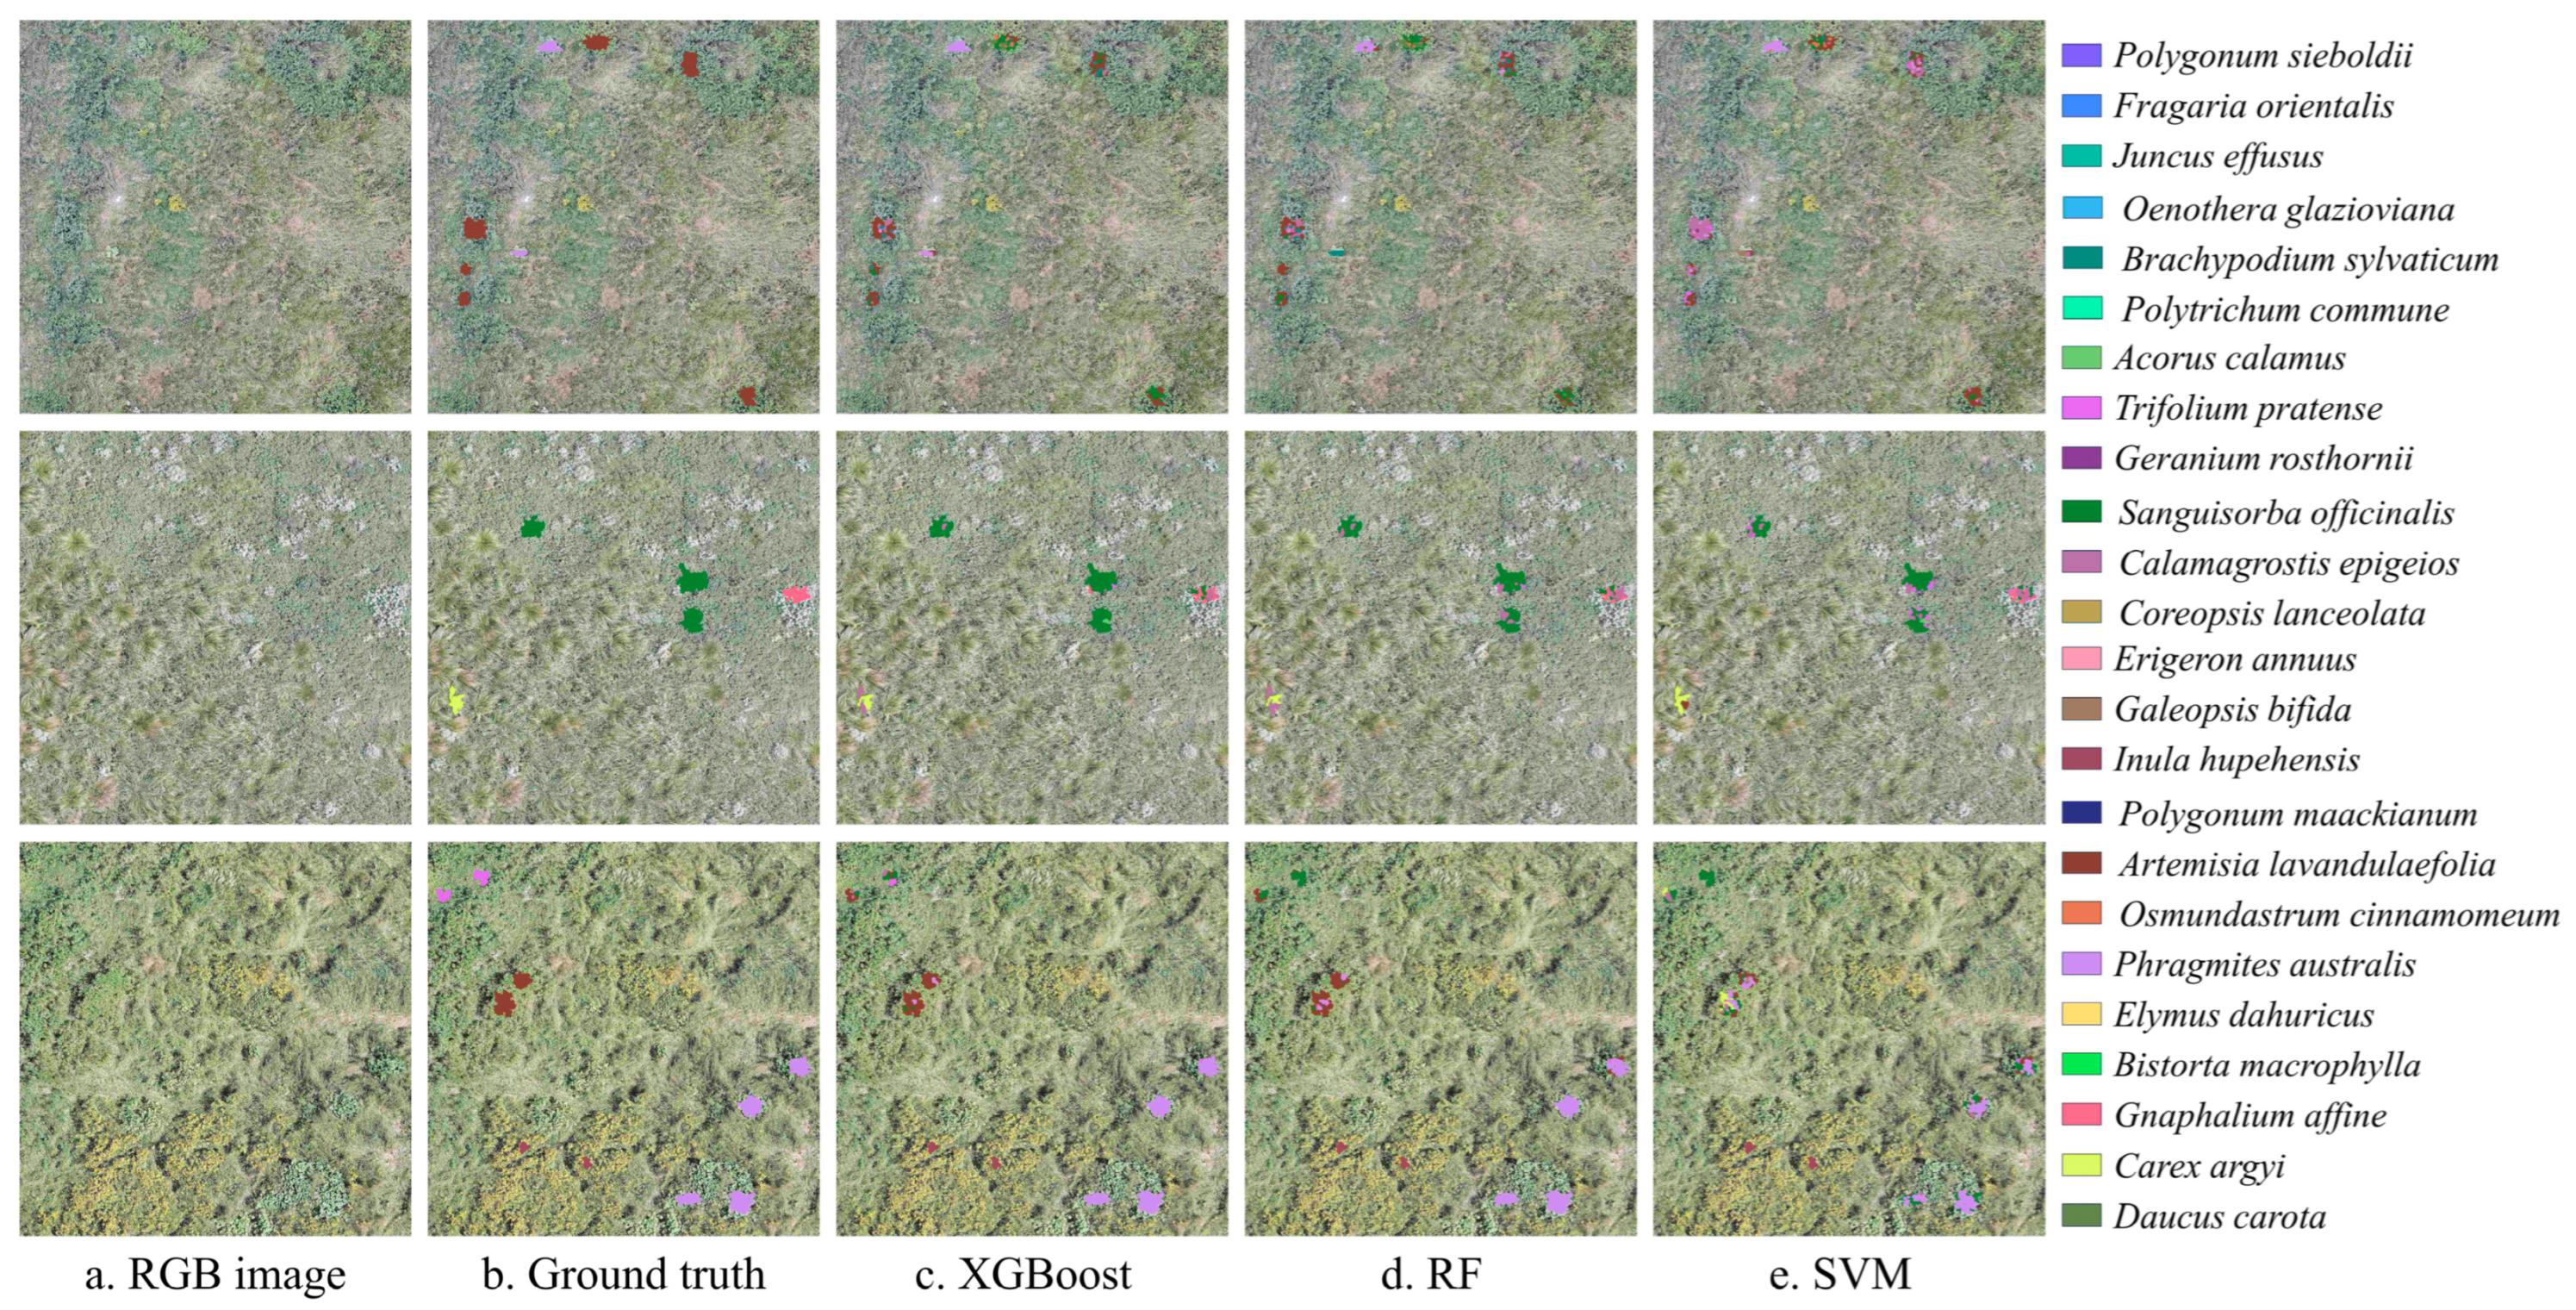
Figure 8 illustrates the visual classification results of each model on the validation dataset. The results indicate that RF and XGBoost exhibited similar overall classification performance, whereas SVM performed relatively poorly. A substantial proportion of misclassified samples originated from areas affected by shadowing. Furthermore, specific misclassification patterns were observed: Artemisia lavandulifolia and Trifolium pratense were frequently misidentified as Sanguisorba officinalis; Gnaphalium affine was misclassified as Calamagrostis epigejos; Galeopsis bifida was confused with Coreopsis lanceolata; and Brachypodium sylvaticum was erroneously identified as Carex argyi (Table A2). These species exhibit extreme spectral and structural similarities, leading to pronounced classification errors.
Figure 8.
Classification results of different algorithms based on optimal feature set.
3.4. Plant Mapping Results
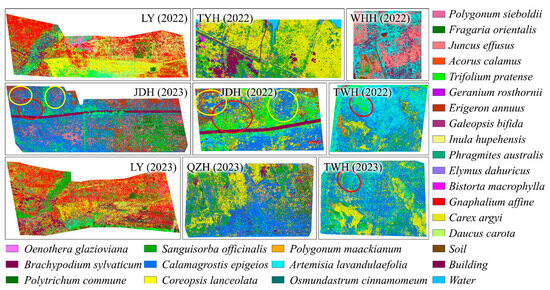
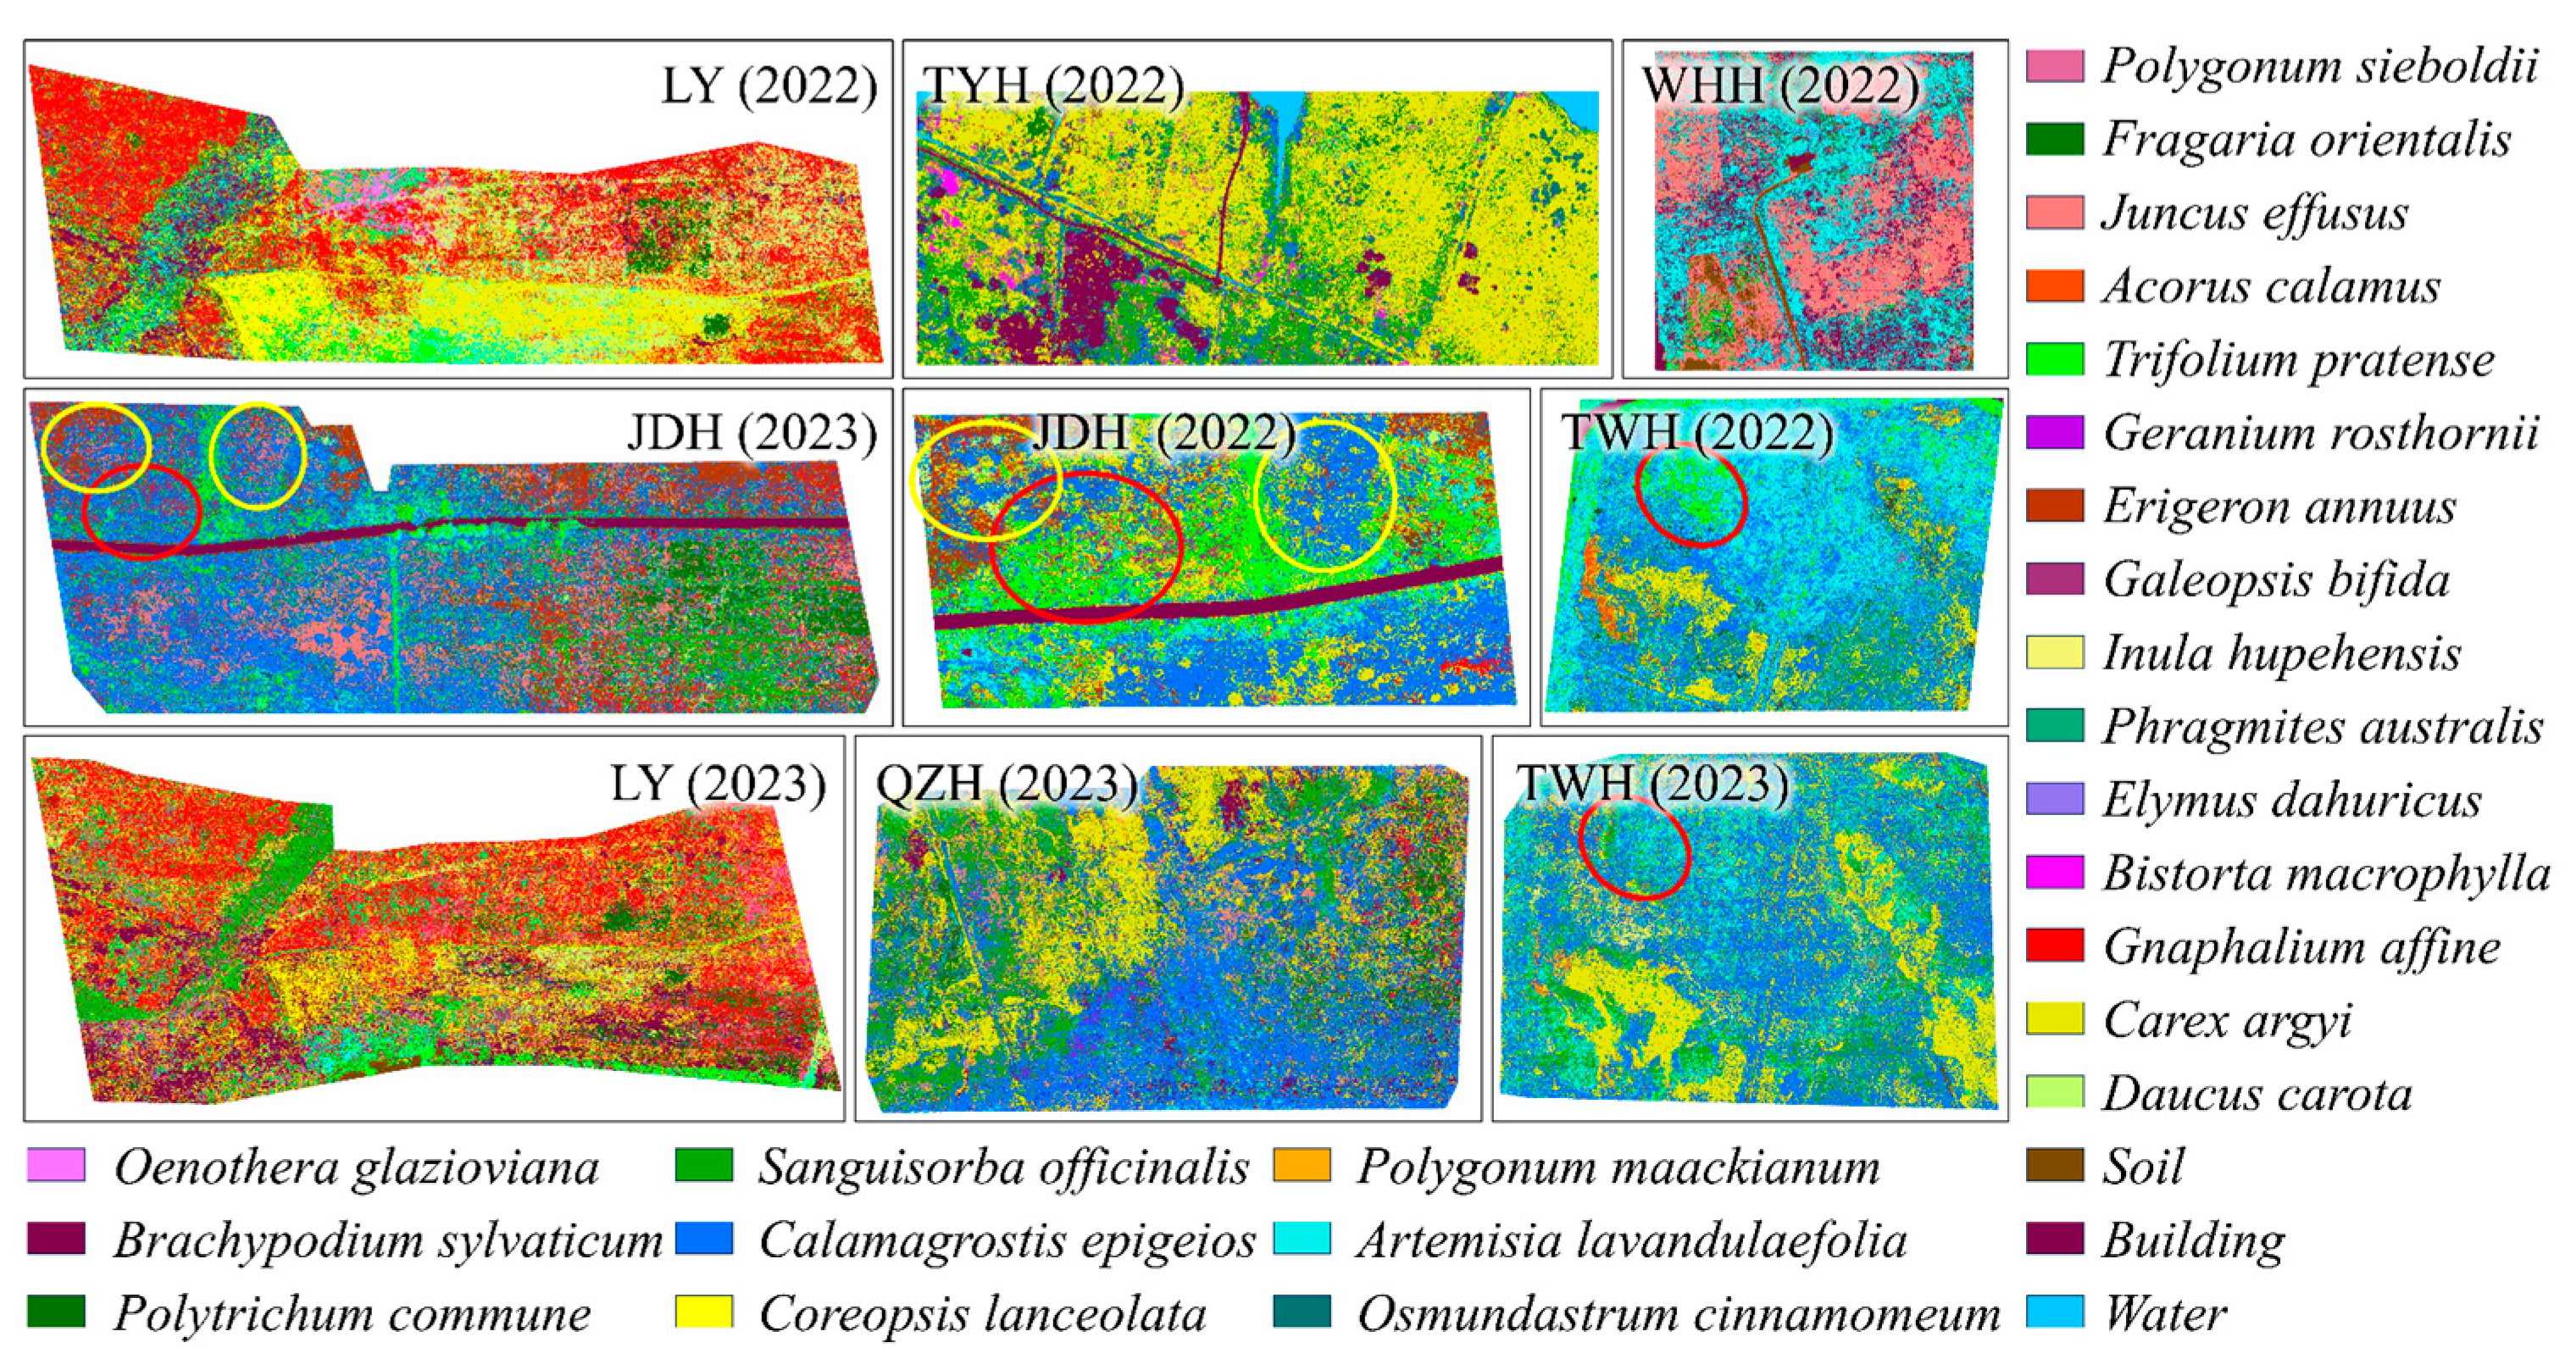
Figure 9 presents the grass species mapping results for the study area generated using the optimal feature set, comprising spectral, textural, and geometric features, and the best-performing grass species mapping model, XGBoost. The results indicate that Carex argyi, Artemisia lavandulaefolia, Gnaphalium affine, Calamagrostis epigejos, Sanguisorba officinalis, Fragaria orientalis, Galeopsis bifida, and Elymus dahuricus are the most widely distributed native species.
Figure 9.
Wetland grass species mapping across six study plots.
Among invasive species, Trifolium pratense and Erigeron annuus exhibit relatively extensive distributions. Trifolium pratense is primarily concentrated in the LY, JDH, and TWH subregions, with its coverage area in 2023 showing a notable decline compared to 2022 (red circle). Erigeron annuus is predominantly found in JDH, with minor occurrences in WHH and LY. Its distribution expanded between 2022 and 2023 (yellow circle), suggesting an urgent need for targeted monitoring and management interventions.
4. Discussion
4.1. Biophysical Trait-Driven Discrimination of Wetland Grasses Using Multisource Features
This study systematically investigates the differential contributions of three types of remote sensing features (spectral, textural, and geometric features) for fine-scale wetland grass species mapping. These features are sensitive to distinct biochemical and biophysical traits across hierarchical levels of plant organization.
Spectral features primarily reflect internal leaf biochemistry, including chlorophyll and carotenoid concentrations as well as photosynthetic activity [47,48]. Their effectiveness in vegetation mapping has been extensively validated, particularly for species exhibiting pronounced differences in pigment composition [8,9,24]. In this study, Sanguisorba officinalis, characterized by high chlorophyll content and strong near-infrared reflectance, was clearly distinguishable from Gnaphalium affine, which exhibits low chlorophyll levels, based solely on spectral metrics such as NDVI and red-edge bands (Figure 6).
In contrast, textural features, derived from the GLCM, including contrast, entropy, and homogeneity, effectively capture spatial heterogeneity within the canopy surface. These patterns are closely linked to leaf arrangement, size, surface roughness, and local patch configuration [49]. The sub-centimeter spatial resolution of UAV-acquired RGB imagery enables high-fidelity recording of these subtle textural variations. For instance, Acorus calamus, with its loosely structured, interwoven leaves, exhibits high-contrast texture, whereas Fragaria orientalis, a ground-hugging species with dense and uniform foliage, displays low-contrast texture [8]. Notably, this improvement is predicated on the ultra-high spatial resolution of UAV imagery, as these fine-scale structural details may become unresolvable and lose their discriminative power when using coarser datasets [50].
Notably, geometric features, extracted via object-based image segmentation, such as aspect ratio, compactness, and boundary complexity, directly encode species-specific growth forms (e.g., tussock-forming vs. slender upright architectures) [16,51]. Despite their high discriminative potential, such features have been underutilized in prior remote sensing classification studies [26]. Our results demonstrate that, under sub-centimeter spatial resolution, these morphological differences can be precisely quantified and serve as highly stable classification criteria. A compelling example is the separation of Juncus effusus and Polytrichum commune, which are spectrally nearly indistinguishable. However, Juncus effusus exhibits a significantly higher aspect ratio due to its slender, erect stems, enabling reliable discrimination at the segmented object level. This finding strongly supports the “form as signal” paradigm: in complex ecosystems where spectral information becomes saturated or ambiguous, the three-dimensional architecture and spatial arrangement of leaves and stems constitute a discernible ecological fingerprint detectable by remote sensing [52,53].
Spectral, textural, and geometric features are inherently complementary, and their fusion significantly improves the accuracy of wetland grass species mapping [4,54]. Specifically, the inclusion of texture and geometric features, serving as complementary sources of information to spectral features, increased overall accuracy (OA) by 5.5% to 7.1%. In all three models, the combined set of spectral, textural, and geometric features consistently yielded the highest mapping accuracy (Table 3). Future studies should focus on incorporating additional data sources, such as small-footprint hyperspectral LiDAR-derived canopy height models and vertical structure metrics, which could provide deeper insights into the three-dimensional properties of wetland vegetation, potentially further reducing the impact of spectral mimicry in complex ecosystems [55,56].
4.2. Influence and Challenge of Machine Learning Algorithms on Wetland Grass Species Mapping
To achieve the highest mapping accuracy, we evaluated the performance of three machine learning algorithms, namely SVM, RF, and XGBoost, for wetland grass species mapping [16]. The results indicate that XGBoost achieved the highest mapping accuracy across all feature combinations, followed by RF, while SVM yielded the lowest performance. These discrepancies highlight fundamental differences in how each algorithm adapts to high-dimensional feature spaces and large-scale datasets [45]. The superior performance of XGBoost can be attributed to its efficient optimization mechanism within the gradient boosting framework [29]. This allows the model to automatically learn high-order nonlinear interactions between different types of features while effectively controlling model complexity through regularization, thereby achieving precise discrimination within the multidimensional feature space that includes spectral, textural, and structural features [45,57]. Similarly, RF demonstrated strong generalization capabilities due to its bagging strategy, which aggregates multiple decision trees to maintain stability and prevent overfitting [28,58]. It has slightly lower accuracy compared to XGBoost, which may be due to the fact that there are more grass species with similar features in wetland scenes, and the boosting method has advantages in iteratively focusing on difficult-to-classify samples [59]. In contrast, SVM performed poorly in this study. This may be due to the large sample size (132, 196 samples) and high feature dimensionality (26 features), which can reduce the efficiency of kernel function optimization [60]. Furthermore, the value range of different feature types varies widely, and SVM is highly sensitive to feature scaling, which may make it difficult for the model to fully exploit discriminative information within complex vegetation characteristics [61].
Nevertheless, certain limitations remain. In areas with highly intermixed or lodged vegetation, object-based segmentation is prone to over- or under-segmentation, which compromises the reliability of derived geometric features [18]. Moreover, some closely related species with nearly identical spectral and morphological traits, such as Calamagrostis epigeios and Brachypodium sylvaticum, remain difficult to distinguish. Future work could address this challenge by incorporating time-series imagery to exploit phenological differences or by leveraging deep learning architectures (e.g., Vision Transformers) capable of automatically learning higher-level semantic representations of plant form [62,63,64].
4.3. Limitations, Spatial Transferability, and Management Implications
Although the proposed framework demonstrates superior performance within the target study area, its spatial transferability to other wetland ecosystems presents certain challenges. The geometric feature thresholds employed in this model, such as shape indices, are derived from the specific morphological biophysical characteristics of local dominant species. In wetlands with significantly different floral assemblages—for instance, those dominated by emergent macrophytes rather than herbaceous plants, or containing invasive species with divergent growth habits—the established relationships between these features and their spectral signatures may shift, potentially degrading model accuracy. Consequently, applying this framework to novel regions necessitates localized retraining (via transfer learning) or feature recalibration, rather than the direct application of default parameters [65].
Furthermore, the framework’s reliance on ultra-high-resolution UAV imagery entails substantial operational costs, including frequent flight missions, significant equipment investment, and extensive battery logistics for large-scale coverage. The computational complexity associated with image segmentation and feature extraction in the OBIA workflow further imposes rigorous demands on hardware resources. To balance precision with scalability, we propose a “multi-scale hierarchical monitoring strategy.” This approach involves utilizing low-resolution, cost-effective satellite data (e.g., Sentinel-2) for broad-scale preliminary screening to identify hotspots of change or suspected invasion; subsequently, high-precision UAV mapping is deployed exclusively within these critical areas [21]. This “satellite-based census + UAV-based inspection” paradigm maximizes the return on investment (ROI), enhancing the operational feasibility of this technology for large-scale ecological management.
Beyond providing static species distribution maps, this research offers a robust decision-support tool for precision wetland management. Specifically, high-resolution species-level mapping provides land managers with critical operational capabilities: while traditional surveys often fail to detect invasive species (such as Erigeron annuus) until they form expansive monocultures, this framework can accurately localize individual plants or small clusters (even those < 1 m2) during the incipient, sporadic stages of invasion [66]. Managers can leverage these data to generate GPS coordinates for targeted manual removal or localized herbicide application, effectively eradicating threats before an outbreak occurs and significantly reducing long-term mitigation costs. Moreover, following hydrological restoration or revegetation projects, the framework enables quarterly monitoring of target species coverage to evaluate intervention efficacy and adjust measures in real-time, thereby facilitating a proactive adaptive management approach.
5. Conclusions
This study developed a novel framework for mapping wetland grass species by integrating UAV-based multi-source remote sensing features (spectral, textural, and geometric) with machine learning algorithms. We first analyzed the separability of these features among multiple species to quantify their individual contributions. Subsequently, we quantitatively evaluated the performance of various feature combinations to identify the optimal feature set. Finally, we compared the classification performance of three machine learning algorithms: SVM, RF, and XGBoost. Our findings indicate that textural and geometric features (e.g., contrast and aspect ratio) effectively capture phenotypic variations in canopy roughness and growth architecture. These features complement spectral data to significantly enhance mapping accuracy, improving OA and Macro-F1 by up to 10.5% and 0.103, respectively. The fusion of spectral, textural, and geometric features yielded the highest performance across all models. Among the algorithms tested, XGBoost achieved the superior accuracy (OA = 81.9%, Macro-F1 = 0.807), outperforming both RF (OA = 79.1%, Macro-F1 = 0.772) and SVM (OA = 72.5%, Macro-F1 = 0.727). Overall, this study demonstrates the value of optimizing multi-source remote sensing feature combinations and presents a robust method for mapping wetland grass species. Future research should focus on cross-seasonal transferability or integrate other data sources to establish more reliable wetland grass species mapping models.
Author Contributions
Conceptualization, P.Z. and R.M.; methodology, P.Z. and R.M.; software, P.Z.; validation, P.Z.; formal analysis, P.Z.; investigation, P.Z., R.M., B.X. and Y.S.; resources, R.M.; data curation, P.Z.; writing—original draft preparation, P.Z.; writing—review and editing, P.Z., R.M., B.X., J.W., J.L., B.H., T.Y., M.P.F. and F.Z.; visualization, P.Z.; supervision, R.M. and P.Z.; project administration, P.Z. and R.M.; funding acquisition, R.M. All authors have read and agreed to the published version of the manuscript.
Funding
This research was funded by the National Natural Science Foundation of China (grant No. 42471362) and the Key Research and Development Program of Heilongjiang, China (grant No. JD2023GJ01; 2022ZX01A25), and J.W. was partly supported by the Innovation and Technology Fund (funding support to State Key Laboratory of Agrobiotechnology).
Data Availability Statement
The remote sensing features data of wetland grasses used in this study are publicly available from Kaggle under a CC0 Public Domain license and can be accessed via the following DOI: https://doi.org/10.34740/kaggle/dsv/14535853 [67].
Conflicts of Interest
The authors declare that they have no known conflicts of interest.
Abbreviations
The following abbreviations are used in this manuscript:
| UAV | Unmanned aerial vehicle |
| SVM | Support vector machine |
| RF | Random forest |
| XGBoost | Extreme gradient boosting |
| OA | Overall accuracy |
| MSI | Multispectral imagery |
| GLCM | Gray-level co-occurrence matrix |
| GSD | Ground sampling distance |
| RTK | Real-time kinematic |
| PCA | Principal component analysis |
| ESP2 | The estimation of scale parameter 2 |
| ROC-LV | The rate of change of local variance |
| SPE | Spectral features |
| TEX | Textural features |
| GEO | Geometric features |
| ExG | Excess green index |
| NGRDI | Normalized green–red difference index |
| NGBDI | Normalized green–blue difference index |
| VDVI | Visible-band difference vegetation index |
| RGRI | Red–green radio index |
| NDVI | Normalized difference vegetation index |
| NDVIre | Normalized difference red edge index |
| DVI | Difference vegetation index |
| RVI | Ratio vegetation index |
| EVI | Enhanced vegetation index |
| Cire | Chlorophyll index red edge |
| MSAVI | Modified soil adjustment vegetation index |
| TP | True positives |
| FP | False positives |
| TN | True negatives |
| FN | False negatives |
Appendix A
Figure A1.
The distributions of samples in training dataset.
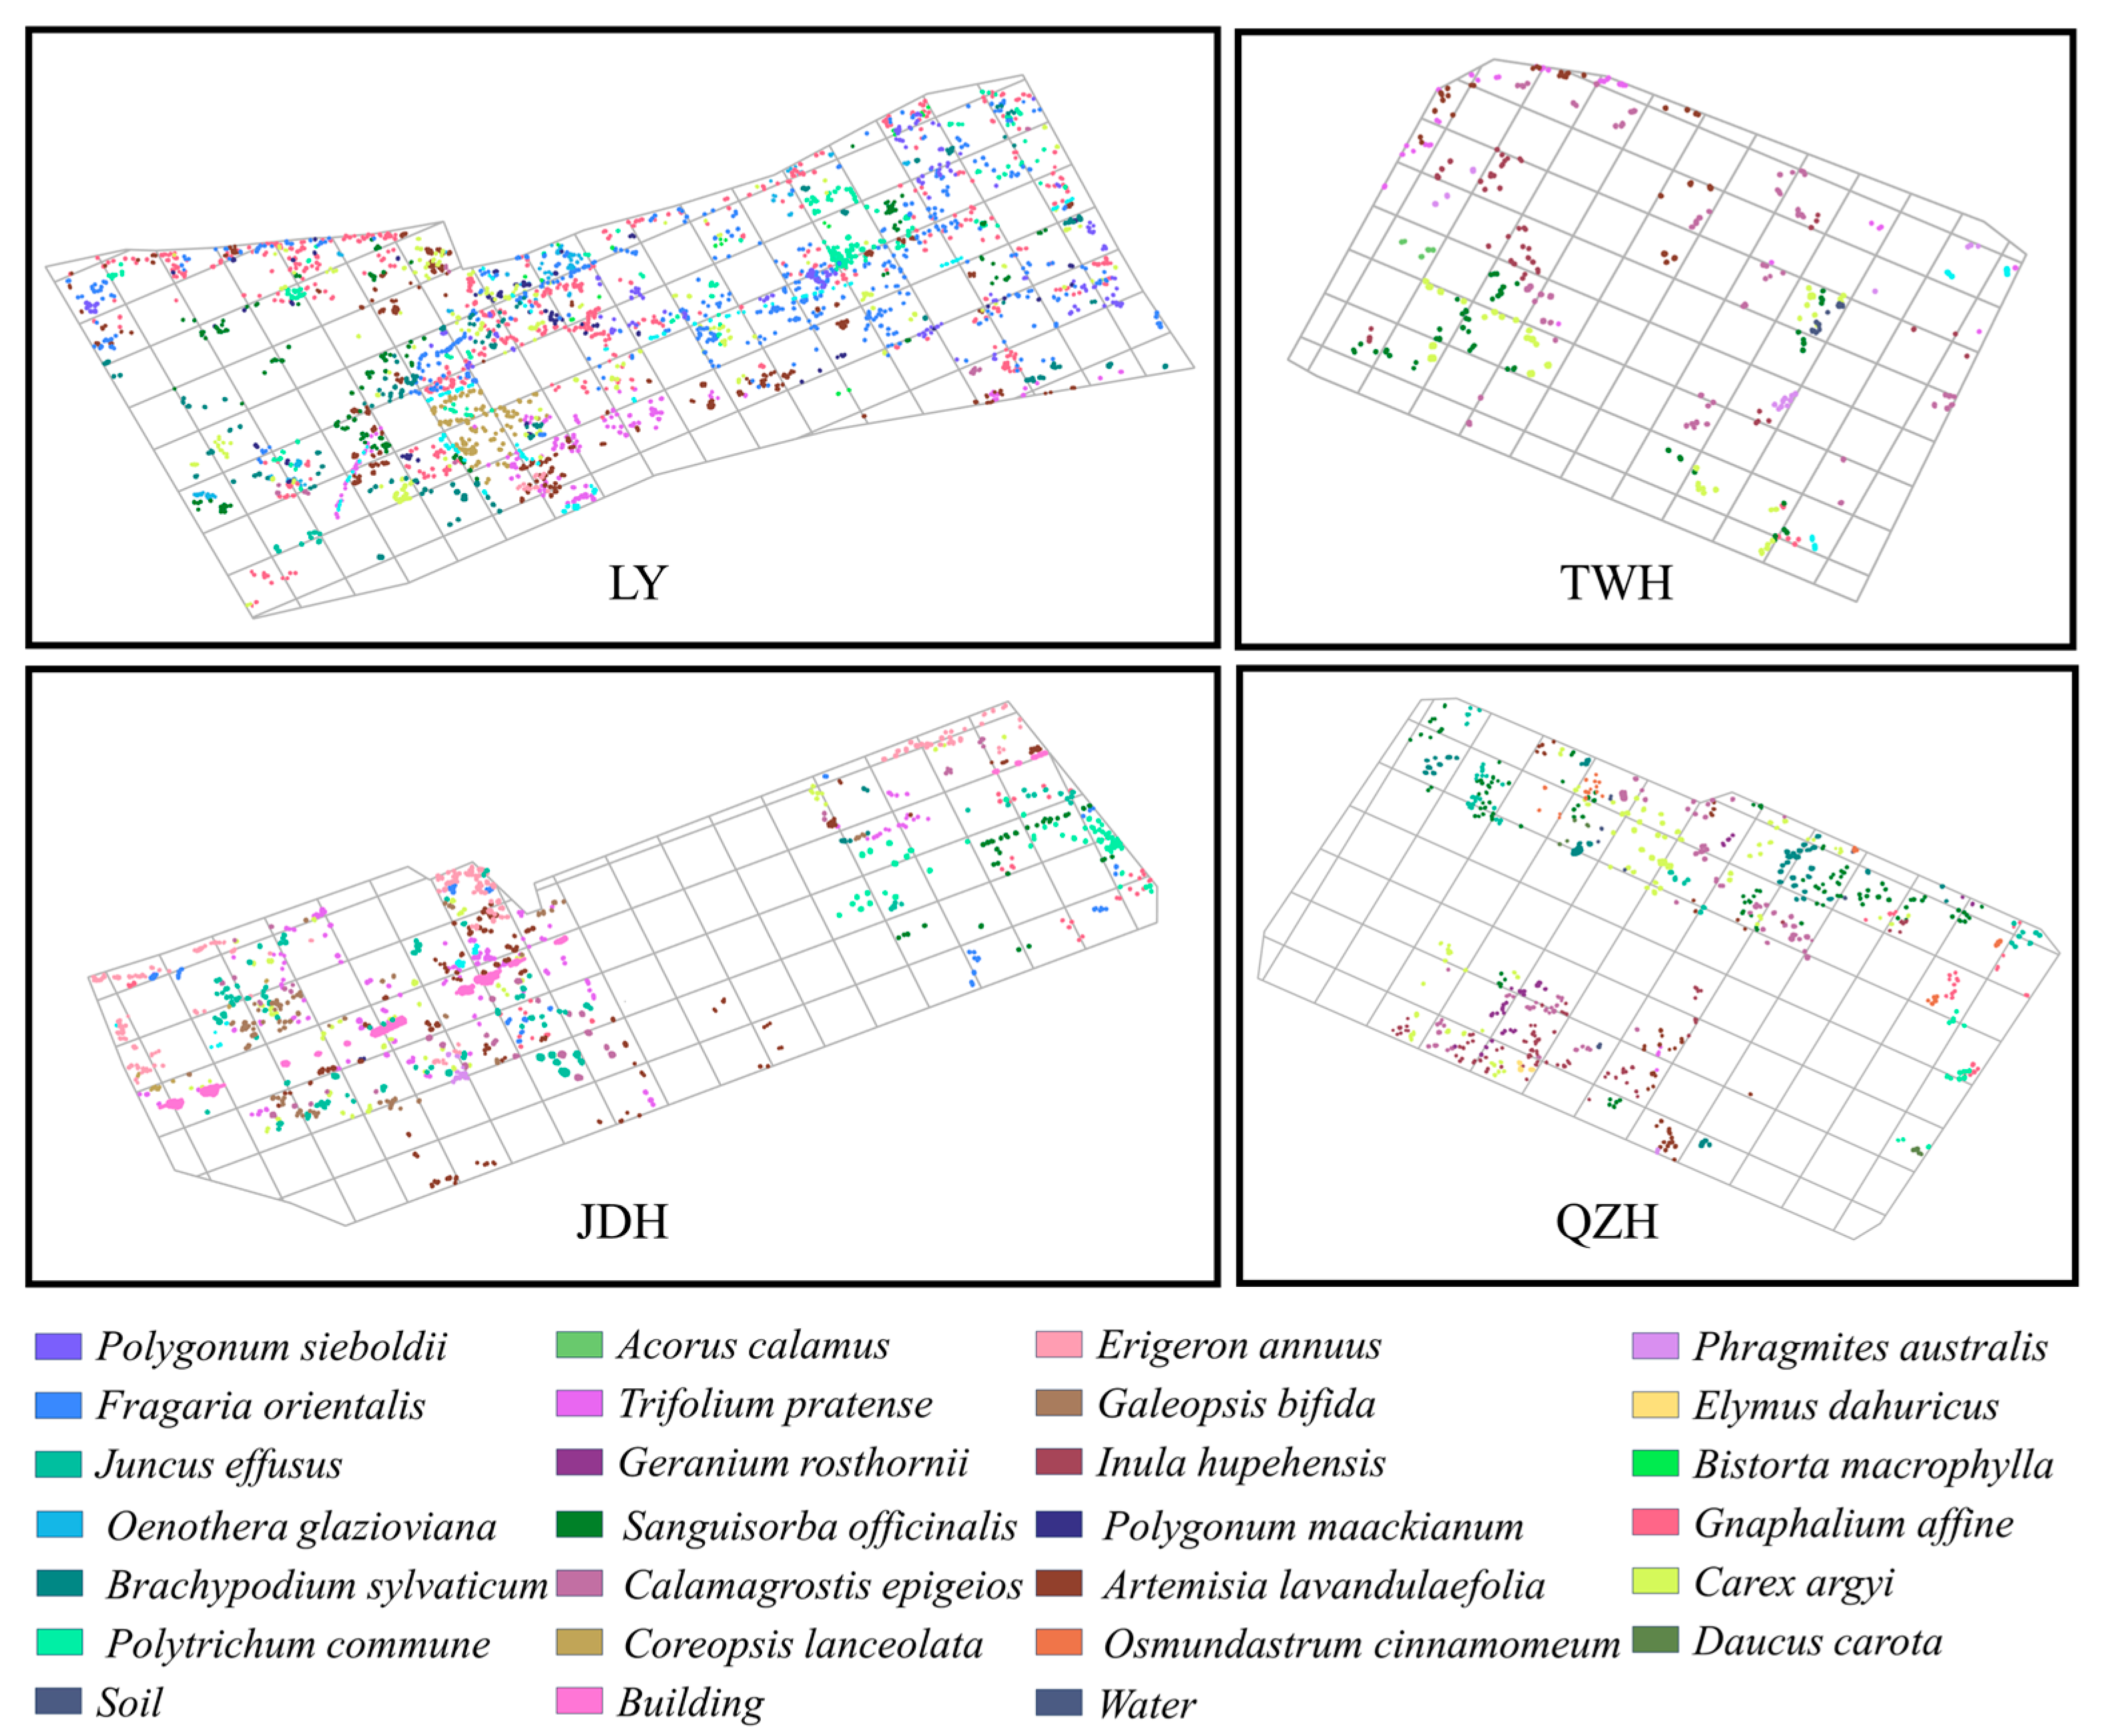
Figure A2.
The distributions of samples in validation dataset.
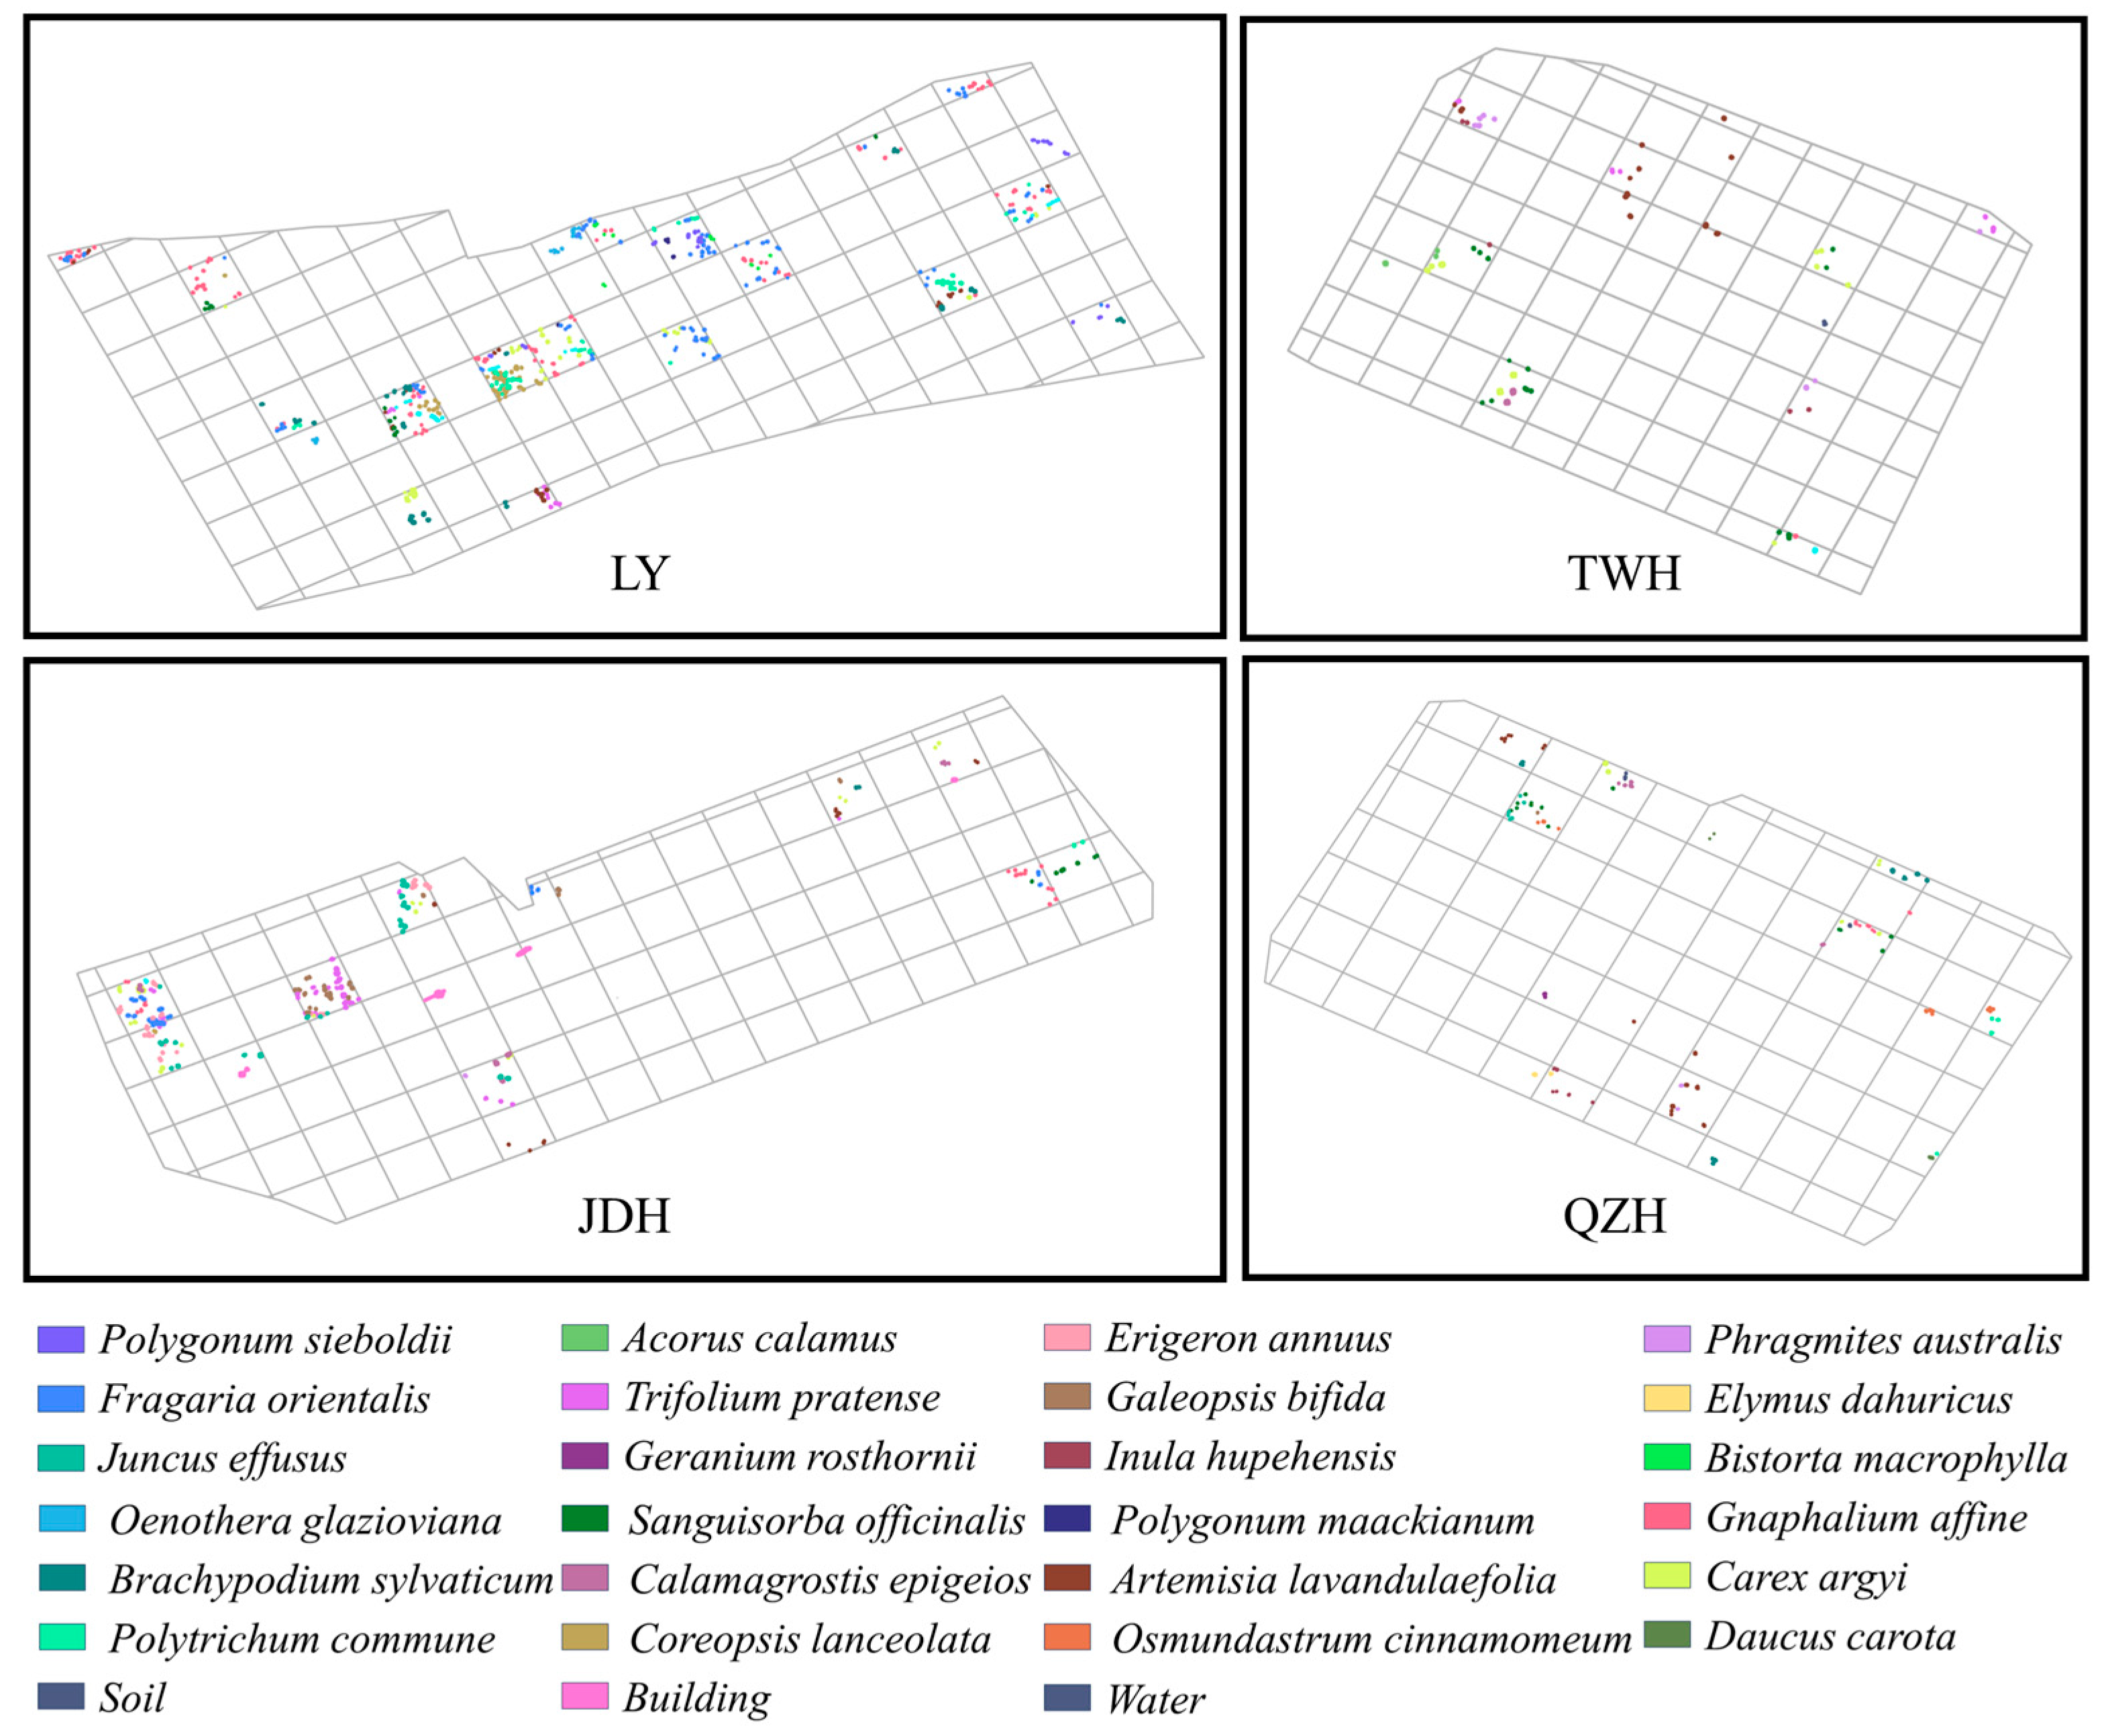
Table A1.
Range of hyperparameters for machine learning algorithms and final results.
Table A2.
Confusion matrix of XGBoost classifier test results.
Table A3.
The precision and F1-score of the XGBoost classifier for each class.
References
- Lane, C.R.; Liu, H.; Autrey, B.C.; Anenkhonov, O.A.; Chepinoga, V.V.; Wu, Q. Improved wetland classification using eight-band high resolution satellite imagery and a hybrid approach. Remote Sens. 2014, 6, 12187–12216. [Google Scholar] [CrossRef] [Scilit]
- Guo, M.; Li, J.; Sheng, C.; Xu, J.; Wu, L. A review of wetland remote sensing. Sensors 2017, 17, 777. [Google Scholar] [CrossRef] [Scilit]
- Ruwaimana, M.; Satyanarayana, B.; Otero, V.; Muslim, A.M.; Syafiq A., M.; Ibrahim, S.; Raymaekers, D.; Koedam, N.; Dahdouh-Guebas, F. The advantages of using drones over space-borne imagery in the mapping of mangrove forests. PLoS ONE 2018, 13, e0200288. [Google Scholar] [CrossRef] [Scilit] [PubMed]
- Zhou, R.; Yang, C.; Li, E.; Cai, X.; Yang, J.; Xia, Y. Object-based wetland vegetation classification using multi-feature selection of unoccupied aerial vehicle RGB imagery. Remote Sens. 2021, 13, 4910. [Google Scholar] [CrossRef] [Scilit]
- Rosso, P.H.; Ustin, S.L.; Hastings, A. Use of lidar to study changes associated with Spartina invasion in San Francisco Bay marshes. Remote Sens. Environ. 2006, 100, 295–306. [Google Scholar] [CrossRef] [Scilit]
- Wang, M.; Fei, X.; Zhang, Y.; Chen, Z.; Wang, X.; Tsou, J.Y.; Liu, D.; Lu, X. Assessing Texture Features to Classify Coastal Wetland Vegetation from High Spatial Resolution Imagery Using Completed Local Binary Patterns (CLBP). Remote Sens. 2018, 10, 778. [Google Scholar] [CrossRef] [Scilit]
- Boon, M.; Greenfield, R.; Tesfamichael, S. Wetland assessment using unmanned aerial vehicle (UAV) photogrammetry. Int. Arch. Photogramm. Remote Sens. Spat. Inf. Sci. 2016, 41, 781–788. [Google Scholar] [CrossRef] [Scilit]
- Lu, B.; He, Y. Species classification using Unmanned Aerial Vehicle (UAV)-acquired high spatial resolution imagery in a heterogeneous grassland. ISPRS J. Photogramm. Remote Sens. 2017, 128, 73–85. [Google Scholar] [CrossRef] [Scilit]
- Sun, C.; Li, J.; Liu, Y.; Zhao, S.; Zheng, J.; Zhang, S. Tracking annual changes in the distribution and composition of saltmarsh vegetation on the Jiangsu coast of China using Landsat time series–based phenological parameters. Remote Sens. Environ. 2023, 284, 113370. [Google Scholar] [CrossRef] [Scilit]
- Sun, C.; Fagherazzi, S.; Liu, Y. Classification mapping of salt marsh vegetation by flexible monthly NDVI time-series using Landsat imagery. Estuar. Coast. Shelf Sci. 2018, 213, 61–80. [Google Scholar] [CrossRef] [Scilit]
- Mahdavi, S.; Salehi, B.; Granger, J.; Amani, M.; Brisco, B.; Huang, W. Remote sensing for wetland classification: A comprehensive review. GISci. Remote Sens. 2018, 55, 623–658. [Google Scholar] [CrossRef] [Scilit]
- Henderson, F.M.; Lewis, A.J. Radar detection of wetland ecosystems: A review. Int. J. Remote Sens. 2008, 29, 5809–5835. [Google Scholar] [CrossRef] [Scilit]
- Maillard, P. Comparing texture analysis methods through classification. Photogramm. Eng. Remote Sens. 2003, 69, 357–367. [Google Scholar] [CrossRef] [Scilit]
- Proctor, C.; He, Y.; Robinson, V. Texture augmented detection of macrophyte species using decision trees. ISPRS J. Photogramm. Remote Sens. 2013, 80, 10–20. [Google Scholar] [CrossRef] [Scilit]
- Haralick, R.M.; Shanmugam, K.; Dinstein, I.H. Textural features for image classification. In IEEE Transactions on Systems, Man, and Cybernetics; IEEE: New York, NY, USA, 1973; pp. 610–621. [Google Scholar]
- Xu, B.; Meng, R.; Chen, G.; Liang, L.; Lv, Z.; Zhou, L.; Sun, R.; Zhao, F.; Yang, W. Improved weed mapping in corn fields by combining UAV-based spectral, textural, structural, and thermal measurements. Pest Manag. Sci. 2023, 79, 2591–2602. [Google Scholar] [CrossRef] [Scilit]
- Ghamisi, P.; Benediktsson, J.A.; Cavallaro, G.; Plaza, A. Automatic framework for spectral–spatial classification based on supervised feature extraction and morphological attribute profiles. IEEE J. Sel. Top. Appl. Earth Obs. Remote Sens. 2014, 7, 2147–2160. [Google Scholar] [CrossRef] [Scilit]
- Dronova, I. Object-Based Image Analysis in Wetland Research: A Review. Remote Sens. 2015, 7, 6380–6413. [Google Scholar] [CrossRef] [Scilit]
- Bruno, O.M.; de Oliveira Plotze, R.; Falvo, M.; de Castro, M. Fractal dimension applied to plant identification. Inf. Sci. 2008, 178, 2722–2733. [Google Scholar] [CrossRef] [Scilit]
- Szantoi, Z.; Escobedo, F.J.; Abd-Elrahman, A.; Pearlstine, L.; Dewitt, B.; Smith, S. Classifying spatially heterogeneous wetland communities using machine learning algorithms and spectral and textural features. Environ. Monit. Assess. 2015, 187, 262. [Google Scholar] [CrossRef] [Scilit]
- Xu, B.; Meng, R.; Zhao, P.; Zhao, F.; Wang, Y.; Deng, W.; Yang, X.; Liu, J.; Tian, H. Uncovering dominant drivers of Erigeron annuus distribution in Dajiuhu-Shennongjia wetland using multiscale remote sensing data. Pest Manag. Sci. 2025, 81, 6791–6806. [Google Scholar] [CrossRef] [Scilit]
- Gao, Y.; Hu, Z.; Wang, Z.; Shi, Q.; Chen, D.; Wu, S.; Gao, Y.; Zhang, Y. Phenology Metrics for Vegetation Type Classification in Estuarine Wetlands Using Satellite Imagery. Sustainability 2023, 15, 1373. [Google Scholar] [CrossRef] [Scilit]
- Gonzalez-Perez, A.; Abd-Elrahman, A.; Wilkinson, B.; Johnson, D.J.; Carthy, R.R. Deep and machine learning image classification of coastal wetlands using unpiloted aircraft system multispectral images and lidar datasets. Remote Sens. 2022, 14, 3937. [Google Scholar] [CrossRef] [Scilit]
- Bai, M.; Yin, X.; Li, M.; Zhang, X. Advances and challenges in remote sensing for grass species classification in coastal wetlands. Ecol. Indic. 2025, 178, 113912. [Google Scholar] [CrossRef] [Scilit]
- Pande-Chhetri, R.; Abd-Elrahman, A.; Liu, T.; Morton, J.; Wilhelm, V.L. Object-based classification of wetland vegetation using very high-resolution unmanned air system imagery. Eur. J. Remote Sens. 2017, 50, 564–576. [Google Scholar] [CrossRef] [Scilit]
- Geng, R.; Jin, S.; Fu, B.; Wang, B. Object-based wetland classification using multi-feature combination of ultra-high spatial resolution multispectral images. Can. J. Remote Sens. 2020, 46, 784–802. [Google Scholar] [CrossRef] [Scilit]
- Cortes, C.; Vapnik, V. Support-vector networks. Mach. Learn. 1995, 20, 273–297. [Google Scholar] [CrossRef] [Scilit]
- Breiman, L. Random forests. Mach. Learn. 2001, 45, 5–32. [Google Scholar] [CrossRef] [Scilit]
- Chen, T. XGBoost: A Scalable Tree Boosting System. In Proceedings of the 22nd Acm Sigkdd International Conference on Knowledge Discovery and Data Mining; Cornell University: Ithaca, NY, USA, 2016. [Google Scholar] [CrossRef] [Scilit]
- Greenacre, M.; Groenen, P.J.; Hastie, T.; d’Enza, A.I.; Markos, A.; Tuzhilina, E. Principal component analysis. Nat. Rev. Methods Primers 2022, 2, 100. [Google Scholar] [CrossRef] [Scilit]
- Ouyang, Z.-T.; Gao, Y.; Xie, X.; Guo, H.-Q.; Zhang, T.-T.; Zhao, B. Spectral discrimination of the invasive plant Spartina alterniflora at multiple phenological stages in a saltmarsh wetland. PLoS ONE 2013, 8, e67315. [Google Scholar] [CrossRef] [Scilit]
- Hong, S.-H.; Kim, H.-O.; Wdowinski, S.; Feliciano, E. Evaluation of polarimetric SAR decomposition for classifying wetland vegetation types. Remote Sens. 2015, 7, 8563–8585. [Google Scholar] [CrossRef] [Scilit]
- Meyer, G.E.; Mehta, T.; Kocher, M.F.; Mortensen, D.A.; Samal, A. Textural imaging and discriminant analysis for distinguishing weeds for spot spraying. Trans. ASABE 1998, 41, 1189–1197. [Google Scholar] [CrossRef] [Scilit]
- Meyer, G.E.; Neto, J.C. Verification of color vegetation indices for automated crop imaging applications. Comput. Electron. Agric. 2008, 63, 282–293. [Google Scholar] [CrossRef] [Scilit]
- Verrelst, J.; Schaepman, M.E.; Koetz, B.; Kneubühler, M. Angular sensitivity analysis of vegetation indices derived from CHRIS/PROBA data. Remote Sens. Environ. 2008, 112, 2341–2353. [Google Scholar] [CrossRef] [Scilit]
- Xiaoqin, W.; Miaomiao, W.; Shaoqiang, W.; Yundong, W. Extraction of vegetation information from visible unmanned aerial vehicle images. Trans. Chin. Soc. Agric. Eng. 2015, 31, 152. [Google Scholar] [CrossRef]
- Saberioon, M.M.; Amin, M.S.M.; Anuar, A.R.; Gholizadeh, A.; Wayayok, A.; Khairunniza-Bejo, S. Assessment of rice leaf chlorophyll content using visible bands at different growth stages at both the leaf and canopy scale. Int. J. Appl. Earth Obs. Geoinf. 2014, 32, 35–45. [Google Scholar] [CrossRef] [Scilit]
- Rouse, J.; Haas, R.; Schell, J.; Deering, D. Monitoring vegetation systems in the Great Plains with ERTS. In Proceedings of the Third Earth Resources Technology Satellite-1 Symposium; NASA SP-351; NASA: Washington, DC, USA, 1974. [Google Scholar]
- Gitelson, A.A.; Merzlyak, M.N. Remote estimation of chlorophyll content in higher plant leaves. Int. J. Remote Sens. 1997, 18, 2691–2697. [Google Scholar] [CrossRef] [Scilit]
- Tucker, C.J. Red and photographic infrared linear combinations for monitoring vegetation. Remote Sens. Environ. 1979, 8, 127–150. [Google Scholar] [CrossRef] [Scilit]
- Person, R. Remote mapping of standing crop biomass for estimation of the productivity of the short-grass Prairie, Pawnee National Grasslands, Colorado. In Proceedings of the Eighth International Symposium on Remote Sensing of Environment, Ann Arbor, MI, USA, 2–6 October 1972. [Google Scholar]
- Liu, H.Q.; Huete, A. A feedback based modification of the NDVI to minimize canopy background and atmospheric noise. IEEE Trans. Geosci. Remote Sens. 1995, 33, 457–465. [Google Scholar] [CrossRef] [Scilit]
- Gitelson, A.A.; Viña, A.; Ciganda, V.; Rundquist, D.C.; Arkebauer, T.J. Remote estimation of canopy chlorophyll content in crops. Geophys. Res. Lett. 2005, 32, L08403-1. [Google Scholar] [CrossRef] [Scilit]
- Qi, J.; Chehbouni, A.; Huete, A.R.; Kerr, Y.H.; Sorooshian, S. A modified soil adjusted vegetation index. Remote Sens. Environ. 1994, 48, 119–126. [Google Scholar] [CrossRef] [Scilit]
- Georganos, S.; Grippa, T.; Vanhuysse, S.; Lennert, M.; Shimoni, M.; Kalogirou, S.; Wolff, E. Less is more: Optimizing classification performance through feature selection in a very-high-resolution remote sensing object-based urban application. GISci. Remote Sens. 2018, 55, 221–242. [Google Scholar] [CrossRef] [Scilit]
- Kohavi, R. A study of cross-validation and bootstrap for accuracy estimation and model selection. In Proceedings of the Ijcai, Montreal, QC, Canada, 20–25 August 1995; pp. 1137–1145. [Google Scholar]
- Kokaly, R.F.; Despain, D.G.; Clark, R.N.; Livo, K.E. Mapping vegetation in Yellowstone National Park using spectral feature analysis of AVIRIS data. Remote Sens. Environ. 2003, 84, 437–456. [Google Scholar] [CrossRef] [Scilit]
- Tamouridou, A.; Alexandridis, T.; Pantazi, X.; Lagopodi, A.; Kashefi, J.; Moshou, D. Evaluation of UAV imagery for mapping Silybum marianum weed patches. Int. J. Remote Sens. 2017, 38, 2246–2259. [Google Scholar] [CrossRef] [Scilit]
- Guo, A.; Huang, W.; Ye, H.; Dong, Y.; Ma, H.; Ren, Y.; Ruan, C. Identification of wheat yellow rust using spectral and texture features of hyperspectral images. Remote Sens. 2020, 12, 1419. [Google Scholar] [CrossRef] [Scilit]
- Dronova, I.; Gong, P.; Clinton, N.E.; Wang, L.; Fu, W.; Qi, S.; Liu, Y. Landscape analysis of wetland plant functional types: The effects of image segmentation scale, vegetation classes and classification methods. Remote Sens. Environ. 2012, 127, 357–369. [Google Scholar] [CrossRef] [Scilit]
- Farooq, A.; Jia, X.; Zhou, J. Texture and shape features for grass weed classification using hyperspectral remote sensing images. In Proceedings of the IGARSS 2019–2019 IEEE International Geoscience and Remote Sensing Symposium, Yokohama, Japan, 28 July–2 August 2019; pp. 7208–7211. [Google Scholar]
- Lin, Y.; Herold, M. Tree species classification based on explicit tree structure feature parameters derived from static terrestrial laser scanning data. Agric. For. Meteorol. 2016, 216, 105–114. [Google Scholar] [CrossRef] [Scilit]
- Terryn, L.; Calders, K.; Disney, M.; Origo, N.; Malhi, Y.; Newnham, G.; Raumonen, P.; Å kerblom, M.; Verbeeck, H. Tree species classification using structural features derived from terrestrial laser scanning. ISPRS J. Photogramm. Remote Sens. 2020, 168, 170–181. [Google Scholar] [CrossRef] [Scilit]
- Xu, D.; Chen, B.; Shen, B.; Wang, X.; Yan, Y.; Xu, L.; Xin, X. The Classification of Grassland Types Based on Object-Based Image Analysis with Multisource Data. Rangel. Ecol. Manag. 2019, 72, 318–326. [Google Scholar] [CrossRef] [Scilit]
- Marcinkowska-Ochtyra, A.; Jarocińska, A.; Bzdęga, K.; Tokarska-Guzik, B. Classification of Expansive Grassland Species in Different Growth Stages Based on Hyperspectral and LiDAR Data. Remote Sens. 2018, 10, 2019. [Google Scholar] [CrossRef] [Scilit]
- Weiss, U.; Biber, P.; Laible, S.; Bohlmann, K.; Zell, A. Plant Species Classification Using a 3D LIDAR Sensor and Machine Learning. In Proceedings of the 2010 Ninth International Conference on Machine Learning and Applications, Washington, DC, USA, 12–14 December 2010; pp. 339–345. [Google Scholar]
- Keerthinathan, P.; Amarasingam, N.; Kelly, J.E.; Mandel, N.; Dehaan, R.L.; Zheng, L.; Hamilton, G.; Gonzalez, F. African Lovegrass Segmentation with Artificial Intelligence Using UAS-Based Multispectral and Hyperspectral Imagery. Remote Sens. 2024, 16, 2363. [Google Scholar] [CrossRef] [Scilit]
- Belgiu, M.; Drăguţ, L. Random forest in remote sensing: A review of applications and future directions. ISPRS J. Photogramm. Remote Sens. 2016, 114, 24–31. [Google Scholar] [CrossRef] [Scilit]
- Lin, W.-J.; Chen, J.J. Class-imbalanced classifiers for high-dimensional data. Brief. Bioinform. 2013, 14, 13–26. [Google Scholar] [CrossRef] [Scilit] [PubMed]
- Löw, F.; Michel, U.; Dech, S.; Conrad, C. Impact of feature selection on the accuracy and spatial uncertainty of per-field crop classification using Support Vector Machines. ISPRS J. Photogramm. Remote Sens. 2013, 85, 102–119. [Google Scholar] [CrossRef] [Scilit]
- Zhao, J.; Li, K.; Zhang, J.; Liu, Y.; Li, X. Mapping Invasive Species Pedicularis and Background Grassland Using UAV and Machine Learning Algorithms. Drones 2024, 8, 639. [Google Scholar] [CrossRef] [Scilit]
- Simpson, G.; Nichol, C.J.; Wade, T.; Helfter, C.; Hamilton, A.; Gibson-Poole, S. Species-Level Classification of Peatland Vegetation Using Ultra-High-Resolution UAV Imagery. Drones 2024, 8, 97. [Google Scholar] [CrossRef] [Scilit]
- Huang, Z.; Zhong, L.; Zhao, F.; Wu, J.; Tang, H.; Lv, Z.; Xu, B.; Zhou, L.; Sun, R.; Meng, R. A spectral-temporal constrained deep learning method for tree species mapping of plantation forests using time series Sentinel-2 imagery. ISPRS J. Photogramm. Remote Sens. 2023, 204, 397–420. [Google Scholar] [CrossRef] [Scilit]
- Kupková, L.; Červená, L.; Potůčková, M.; Lysák, J.; Roubalová, M.; Hrázský, Z.; Březina, S.; Epstein, H.E.; Müllerová, J. Towards reliable monitoring of grass species in nature conservation: Evaluation of the potential of UAV and PlanetScope multi-temporal data in the Central European tundra. Remote Sens. Environ. 2023, 294, 113645. [Google Scholar] [CrossRef] [Scilit]
- Weiss, K.; Khoshgoftaar, T.M.; Wang, D. A survey of transfer learning. J. Big Data 2016, 3, 9. [Google Scholar] [CrossRef] [Scilit]
- Reaser, J.K.; Burgiel, S.W.; Kirkey, J.; Brantley, K.A.; Veatch, S.D.; Burgos-Rodríguez, J. The early detection of and rapid response (EDRR) to invasive species: A conceptual framework and federal capacities assessment. Biol. Invasions 2020, 22, 1–19. [Google Scholar] [CrossRef] [Scilit]
- Zhao, P.; Meng, R. Wetland Grass Remote Sensing Feature Dataset [Data set]. Kaggle 2026. [Google Scholar] [CrossRef]

Disclaimer/Publisher’s Note: The statements, opinions and data contained in all publications are solely those of the individual author(s) and contributor(s) and not of MDPI and/or the editor(s). MDPI and/or the editor(s) disclaim responsibility for any injury to people or property resulting from any ideas, methods, instructions or products referred to in the content. |
© 2026 by the authors. Licensee MDPI, Basel, Switzerland. This article is an open access article distributed under the terms and conditions of the Creative Commons Attribution (CC BY) license.