


Highlights
What are the main findings?
- Thaw settlement exhibits strong spatial variability (dominated by Level III at 40.85%), primarily driven by MAGT and ICT through differentiated mechanisms: high-temperature zones are controlled by ice content, whereas low-temperature zones are governed by temperature.
- Among multi-source remote-sensing predictors, land surface temperature (LST) and the thawing index (TI) demonstrate the strongest significant correlations with thaw settlement.
What are the implications of the main findings?
- High-resolution (30 m) spatial zoning along separated subgrades provides precise decision support for corridor-scale risk management and route alternative selection.
- LST and TI can serve as reliable, low-cost, and scalable indicators for the rapid screening and long-term monitoring of settlement hazards in remote, high-altitude environments.
Abstract
Thaw settlement (TS) in warm and ice-rich permafrost presents a challenge to highway subgrade stability in the Qinghai–Tibet Engineering Corridor (QTEC). To conduct a regional risk assessment, this study develops a framework coupling multi-source data fusion with Random Forest (RF) machine learning. By connecting site-specific thermo-mechanical simulations with corridor-scale remote sensing predictors, a 30 m resolution thaw settlement zoning map for 13 m wide separated subgrades was generated. The results indicate the following: (1) Thaw settlement exhibits significant spatial variability, with Level III settlement (20–30 cm) being the dominant category, accounting for 40.85% of the total area; Level IV and V settlements are mainly distributed in warm and ice-rich permafrost regions such as the Chumar River, Wuli, and Tuotuo River areas. (2) Mean annual ground temperature (MAGT) and ice content type (ICT) are key factors influencing the spatial settlement pattern, with differentiated dominant mechanisms: 50% of the zones are dominated by ICT, corresponding to higher settlement (26.76–43.31 cm); 35.71% are influenced by both MAGT and ICT; and 14.29% are dominated by MAGT, with lower settlement (16.23–24.19 cm). This suggests a distinct spatial pattern where “high-temperature zones are largely controlled by ice content, while low-temperature zones are controlled by temperature.” (3) Among multi-source remote sensing factors, land surface temperature (LST) and the thawing index (TI) show significant correlations with thaw settlement, confirming their applicability for hazard identification in high-altitude regions. This study provides a scientific reference and decision support for engineering maintenance and route selection on the Qinghai–Tibet Plateau.
1. Introduction
The Qinghai–Tibet Plateau is the highest and largest permafrost region in the world’s mid- and low-latitude zones and occupies a key position in global permafrost distribution [1]. In recent decades, the fragile geo-environment of the plateau has experienced accelerated permafrost degradation driven by global climate warming, significantly altering the regional hydrothermal balance and exacerbating broad-scale engineering geological hazards [2,3,4]. Permafrost along the Qinghai–Tibet Engineering Corridor is typically warm and ice-rich, exhibiting strong thermal sensitivity and low thermal stability. Seasonal freeze–thaw processes can trigger ground-ice melt, soil-structure degradation, and deformation of subgrades, among which thaw settlement is a major threat to long-term serviceability and safety of transportation infrastructure [5].
In recent years, under the combined effects of climate warming and increasing engineering disturbance, thaw settlement in permafrost subgrades has become more pronounced. Field observations along the Qinghai–Tibet Highway and related infrastructure indicate that thaw settlement is a dominant contributor to subgrade distress in warm permafrost environments [6,7]. Mechanistically, thaw settlement is governed by the coupled response of the permafrost thermal regime and ground-ice conditions, and is influenced by mean annual ground temperature (MAGT), ice content, climatic forcing, and soil physical properties such as porosity and density [8,9,10,11]. Existing studies have further highlighted that warming intensifies settlement and that spatial thermal imbalance (e.g., sunny–shady effects) can accelerate deformation development [12,13,14,15,16].
To support hazard prediction and corridor-scale risk management, various approaches have been proposed for thaw settlement estimation and zoning. The thaw settlement coefficient has been widely used as a core indicator in engineering practice and laboratory-based evaluation [17,18,19,20,21,22]. In addition, Zaretskii [23] and Tang [24] constructed simplified calculation models of thaw settlement based on Terzaghi’s consolidation theory and frost heave ratio. In parallel, numerical simulations and data-driven approaches have been increasingly adopted to improve predictive capability under different scenarios (e.g., warming conditions and site-specific stratigraphy), including finite-element modeling, machine learning, and remote-sensing–assisted assessments [25,26,27,28,29,30,31]. At larger spatial scales, indicator-based frameworks and risk indices have been developed for thaw settlement hazard mapping. These include multi-factor risk evaluation systems established by Ni [32] and Zhang [33] using the geological disaster index and analytic hierarchy process (AHP), providing methodological references for large-area hazard assessment under climate warming [34,35]. Recent studies have also produced corridor-scale risk zoning and site-based simulations for thaw settlement along the Qinghai–Tibet Engineering Corridor [36,37].
Compared with conventional wide embankments, however, the spatial organization of thaw settlement in separated subgrades remains insufficiently understood. Existing research on separated subgrades mainly focuses on local-scale thermal disturbance mitigation, spacing/interval optimization, and comparative thermal performance between integral embankments and separated configurations, primarily through heat-transfer modeling and numerical simulations [38,39,40]. These studies provide important insights into the engineering advantages and mechanisms of separated subgrades, yet they do not fully resolve how thaw settlement in separated subgrades distributes and organizes spatially at the scale of a major engineering corridor. In particular, a systematic quantification of the collaborative effects of environmental controls (e.g., permafrost thermal state, ice content, and topographic setting) together with subgrade structure is still lacking.
To address this gap, this study integrates multi-source remote sensing, geological surveys, thermo-mechanical coupled numerical simulations, and random forest machine learning to delineate the spatial zoning characteristics of thaw settlement in separated subgrades along the Qinghai–Tibet Engineering Corridor. Notably, because the Qinghai–Tibet Expressway has not yet been constructed, the thaw settlement investigated here represents a scenario-based prediction over the first 20 years after subgrade completion, rather than an analysis tied to specific calendar years. The results aim to provide a scientific basis for corridor-scale risk-informed design optimization and permafrost-disaster prevention and control.
2. Materials and Methods
2.1. Study Area Overview and Data Sources
2.1.1. Study Area Overview
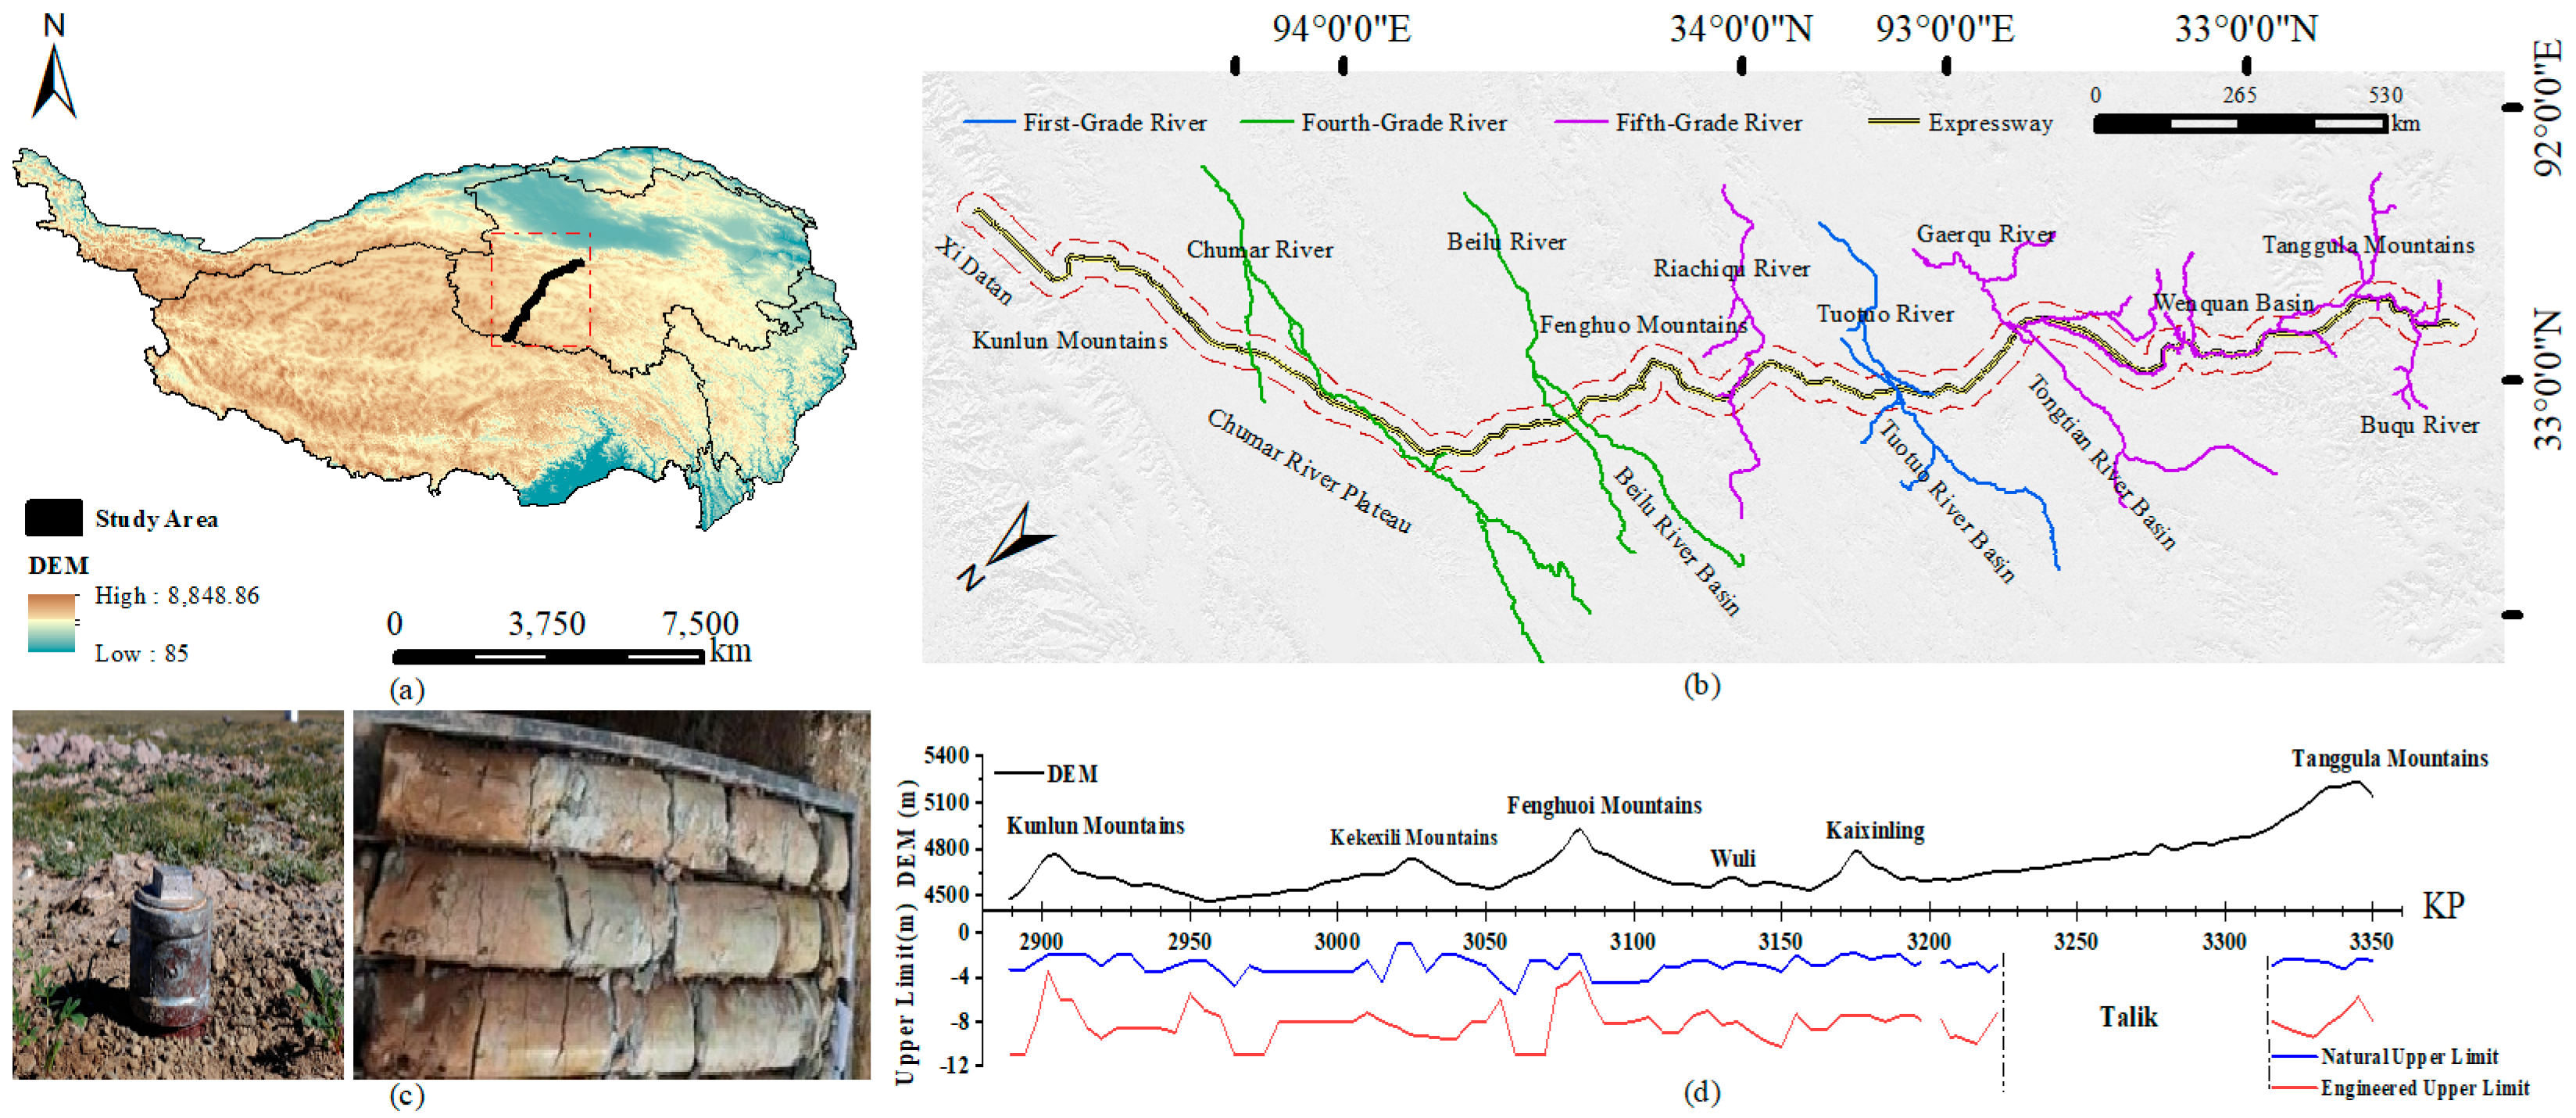
This study takes the planned alignment of the Qinghai–Tibet Highway (from Xidatan to Tanggula Mountain) as the baseline and delineates a 5 km buffer on both sides of the road centerline, resulting in a study area of approximately 5222 km2 (Figure 1), with geographical coordinates ranging from 91.5°E to 94.5°E and 32°N to 36°N. The study area is located in the northeastern Qinghai–Tibet Plateau, a core region of permafrost distribution along the Qinghai–Tibet Engineering Corridor [41,42]. The terrain exhibits pronounced spatial heterogeneity, mainly comprising high mountain ranges, cold-weathered plateaus, deeply incised valleys, and fault-controlled basins [43]. Elevations range from 4000 to 5538 m, representing a typical high-altitude cold environment [44]. As a key corridor facing engineering challenges in warm, ice-rich permafrost zones, the region provides an ideal natural laboratory for investigating the mechanisms of thaw settlement in permafrost subgrades [45,46].
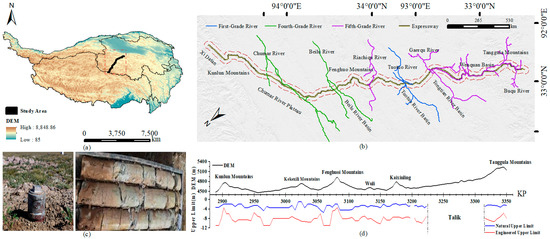
Figure 1.
Overview of the study area and corridor-scale geographic context: (a) location of the study area (indicated by the red dashed box) on the Qinghai–Tibet Plateau; (b) major rivers and planned expressway alignment; (c) field photographs of permafrost monitoring and core samples; (d) longitudinal elevation profile with natural and engineered upper limits.
As shown in Figure 1, the study area is located within the Qinghai–Tibet Engineering Corridor. Figure 1a shows the study area location on the Qinghai–Tibet Plateau with a DEM background; Figure 1b depicts the major rivers and the planned expressway alignment; Figure 1c presents representative field photographs; and Figure 1d presents the longitudinal elevation profile (KP chainage–elevation, where KP denotes kilometer-post chainage) of typical corridor segments together with their corresponding natural Upper Limit and engineered Upper Limit, thereby illustrating terrain variability and key geomorphic units along the corridor.
2.1.2. Survey Data
This study is based on a comprehensive analysis of a multi-source dataset comprising the following: (1) Mean annual ground temperature (MAGT) monitoring data from the permafrost region; (2) subsurface ice content parameters obtained through a combination of borehole exploration and geophysical surveys; and (3) Subgrade Orientation (SO) data calculated based on the designed route, referring to the included angle between the subgrade axis and the east–west direction (latitudinal line). This parameter reflects the spatial layout characteristics of the subgrade and serves as a key engineering topographic factor affecting permafrost heat exchange and subgrade thaw settlement.
The MAGT dataset was collected from long-term monitoring sections along the Qinghai–Tibet Engineering Corridor, yielding a total of 612 valid records. Among these records, 67 monitoring points were located on natural ground surface, 1 on road shoulder, and 72 on road surface, while the remaining 472 records were categorized as “Unspecified”, which indicates that these are authentic field measurements collected along the engineering corridor, but their exact transverse micro-locations (e.g., road center or shoulder) were not explicitly recorded in the original metadata.” According to relevant standards [47], permafrost in the study area is classified based on MAGT into: high-temperature unstable permafrost (−1.5 °C < T ≤ −0.5 °C), high-temperature extremely unstable permafrost (−0.5 °C < T ≤ 0 °C), low-temperature essentially stable permafrost (−3.5 °C < T ≤ −1.5 °C), and low-temperature stable permafrost (T ≤ −3.5 °C).
The ice content data in this study were primarily obtained from field borehole surveys conducted along the Qinghai–Tibet Highway. For each borehole, the maximum ice content value within 8 m below the natural ground surface was taken as the representative ICT, resulting in a total of 3124 records. In terms of borehole location labels, 884 records were associated with natural ground surface, 100 with road shoulder, 76 with toe of slope, and 955 with road surface, whereas 1109 records were labeled as “Unspecified” because the location information was not explicitly reported in the original datasets. According to relevant standards [47], ICT are classified into ice-less permafrost (S), ice-more permafrost (D), ice-rich permafrost (F), ice-saturated permafrost (B), and permafrost with soil-ice layers (H).
2.1.3. Remote Sensing Data
The remote sensing data used in this study were obtained from the Google Earth Engine platform database (https://developers.google.cn/earth-engine, accessed on 1 May 2024). A total of six types of remote sensing datasets covering the study area were collected and processed, with detailed information provided in Table 1.
Table 1.
Detailed Information on Remote Sensing Data.
Based on multi-source remote-sensing products and GIS-based processing, this study constructed a high-precision environmental predictor dataset for the study area. To ensure spatial consistency for model input, all predictors were co-registered to a common 30 m modeling grid for spatial alignment, while acknowledging that the effective spatial information content of each variable remains constrained by its native resolution. In total, nine surface predictors were prepared as follows:
(1) The Digital Elevation Model (DEM), directly obtained from the publicly available SRTM DEM (30 m) dataset (distributed by NASA and also accessible via the Google Earth Engine data catalog). No remote-sensing inversion was performed for DEM acquisition. Standard GIS preprocessing was applied only for spatial alignment and terrain analysis, including tile mosaicking, study-area clipping, reprojection to the common grid, and derivation of topographic variables. Although the SRTM data were acquired in 2000, the macro-topographic features (elevation, slope, and aspect) of the Qinghai–Tibet Corridor exhibit high decadal stability. Therefore, SRTM remains the standard topographic baseline for permafrost research in this region, ensuring spatial consistency with historical monitoring data and comparability with existing models.
(2) Land Surface Temperature (LST), obtained from the official MODIS 8-day composite LST product MOD11A2 (Collection 6.1) (native resolution: 1 km). In this study, LST was not newly inverted by the authors; instead, product scaling/unit conversion and quality-control (QC) screening were applied following the product specifications, and long-term LST statistics were derived by aggregating the time series over the selected period.
(3) The Normalized Difference Vegetation Index (NDVI), calculated from optical reflectance in the near-infrared and red bands (e.g., Landsat series) to represent vegetation conditions.
(4) The Surface Soil Moisture Index (SSM), derived from satellite soil-moisture observations (e.g., SMAP) and harmonized to the modeling grid through a consistent resampling/downscaling workflow (see the corresponding subsection for details).
(5) Slope and (6) Aspect, extracted from the DEM using standard terrain-analysis algorithms (Horn-type method) to quantify terrain gradients and exposition.
(7) Equivalent Latitude (EL), computed as a standardized indicator integrating latitude and topographic effects (slope/aspect) to represent long-term potential solar-radiation controls.
(8) Thawing Index (TI) and (9) Freezing Index (FI), calculated from the processed LST time series as degree-day indices relative to 0 °C, providing integrated measures of surface thermal forcing relevant to freeze–thaw conditions in permafrost environments.
Because MODIS LST represents the land-surface “skin temperature”, it may deviate from ground temperature in permafrost regions due to snow/ice cover, emissivity variability, vegetation effects, and residual atmospheric/cloud impacts. Therefore, QC-based screening was implemented to reduce low-quality and cloud-contaminated pixels. In subsequent analyses and interpretation, we emphasize that LST/TI/FI are used as surface thermal proxies to characterize corridor-scale spatial differences and relative gradients in thermal conditions rather than to replace in situ ground-temperature observations. Further validation using additional ground measurements is encouraged in future work.
2.2. Numerical Analysis Methods
2.2.1. Numerical Model
This study develops an integrated corridor-scale workflow that couples scenario-based thermo-mechanical simulation of thaw settlement for a 13 m wide separated subgrade with multi-source data fusion and random-forest mapping. The numerical model is used to generate physically consistent thaw settlement responses under representative combinations of mean annual ground temperature (MAGT) and ice-content type (ICT), which are subsequently linked with remote-sensing and terrain predictors to produce 30 m resolution thaw settlement zoning.
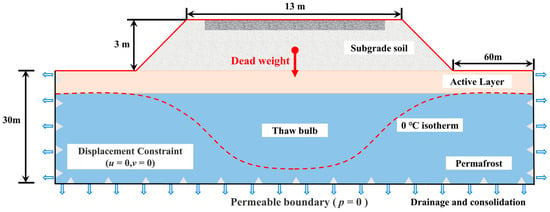
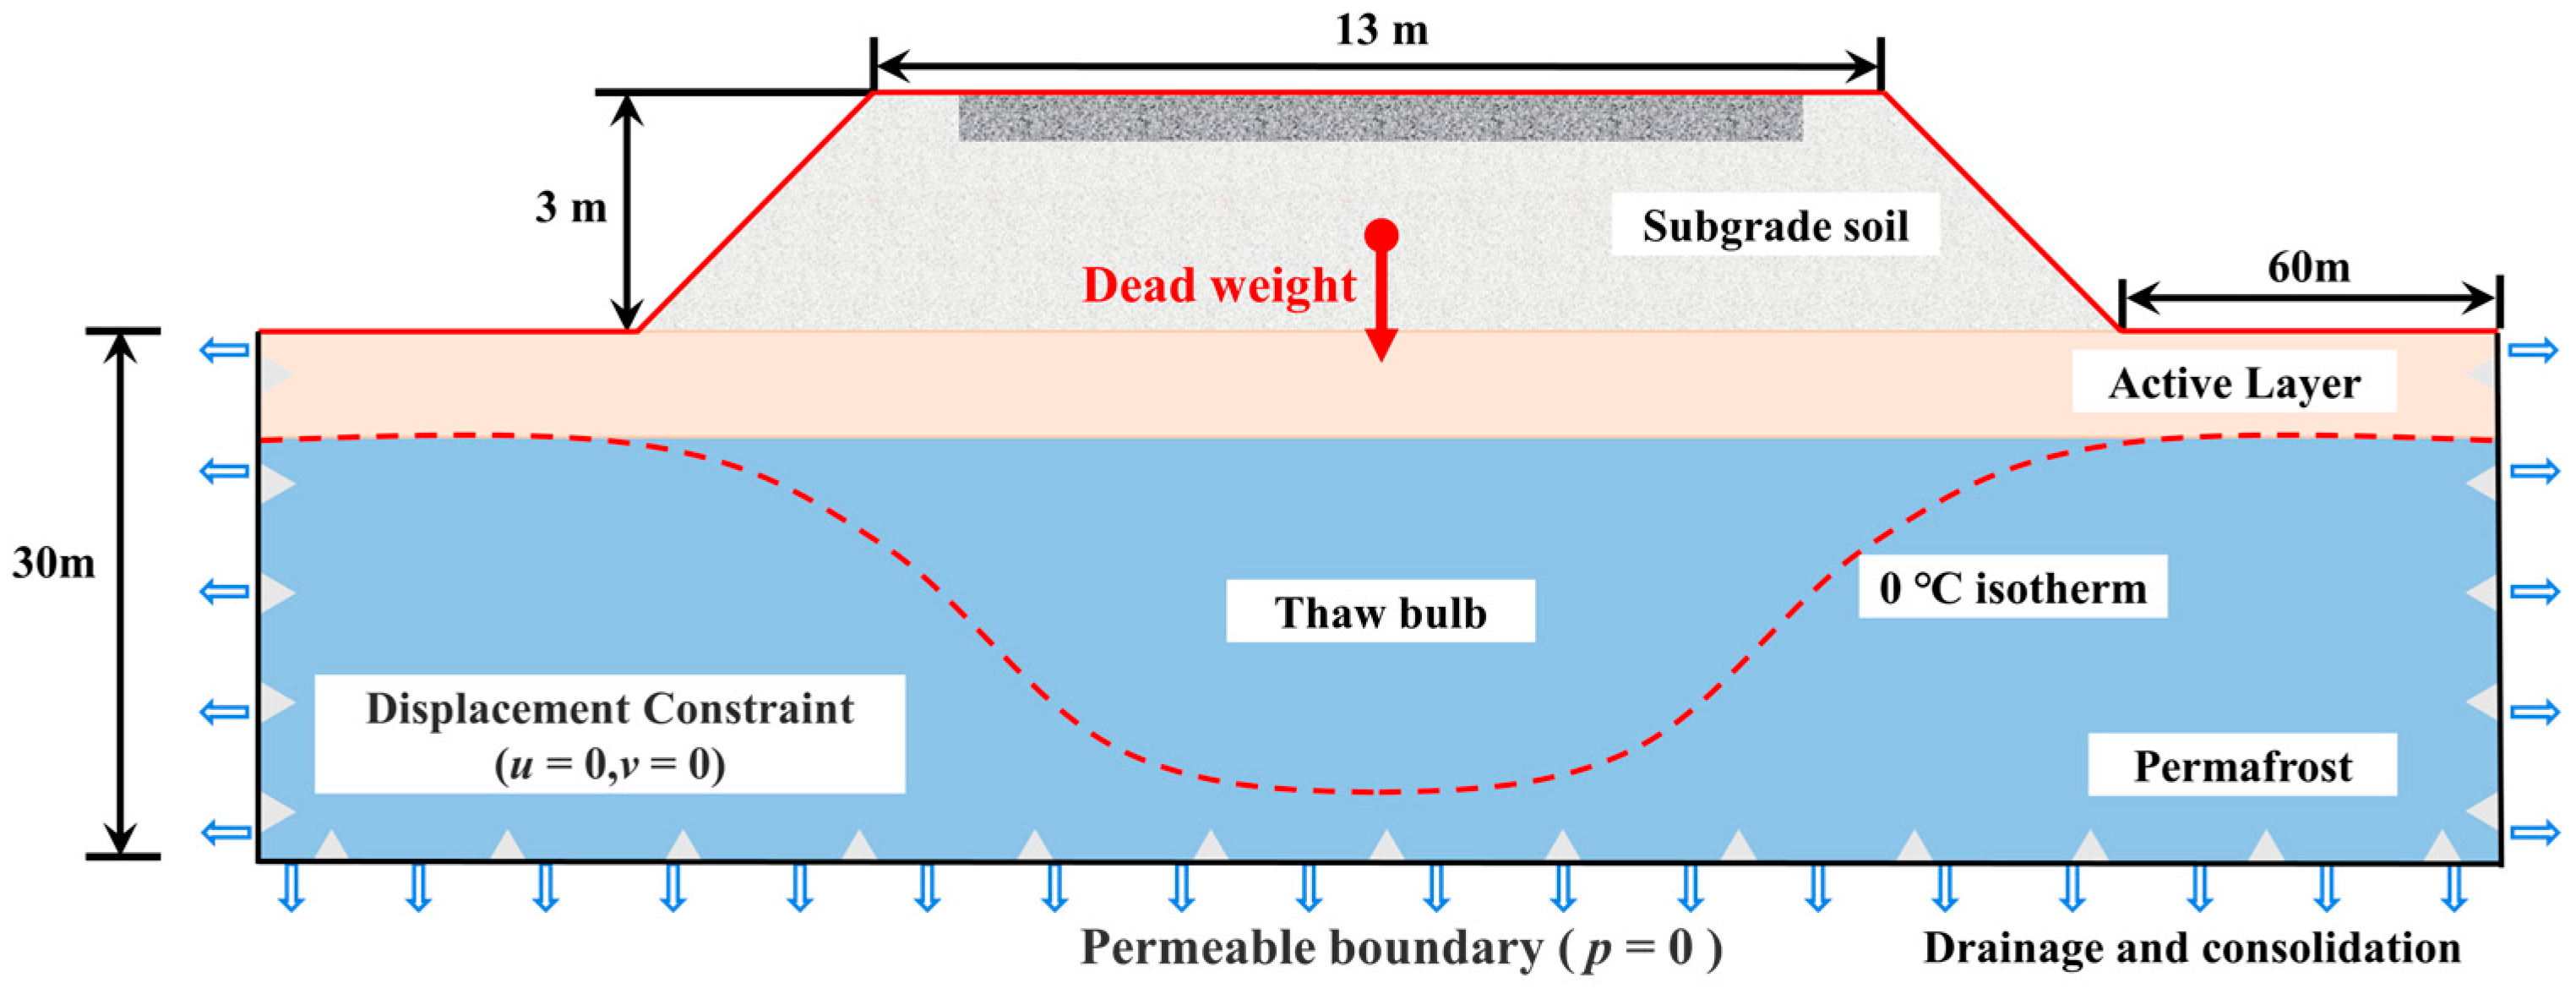
The geometric parameters of the model are as follows: subgrade height of 3 m, slope ratio of 1:1.5, and total pavement width of 13 m (including 0.75 m shoulders on both sides and 11.5 m asphalt pavement). To capture near-field deformation while maintaining computational tractability for large-sample scenario simulations, the model extends 60 m outward from the toe of the slope on each side and adopts a stratum thickness of 30 m. The pavement structural layers are uniformly treated as equivalent to the subgrade fill material (differences in surface courses are ignored). The computational model is shown in Figure 2.
Figure 2.
Numerical Model of Subgrade Thaw Settlement.
2.2.2. Numerical Calculation Procedure
- (1)
- Boundary Conditions
The lateral boundaries and the bottom boundary are fixed in translation to satisfy recommended domain settings for deformation analysis of permafrost subgrades [48]. Because this study focuses on thermo-mechanical coupling and does not explicitly solve seepage or pore-pressure fields, thaw-related consolidation is represented using a drained assumption; accordingly, boundaries are treated as permeable to allow dissipation of excess pore-water pressure during thawing. Only self-weight is considered, and no additional traffic load is applied.
- (2)
- Governing Equations
Deformation of permafrost subgrade during warming–thawing is described using a thermo-elastoplastic framework with Mohr–Coulomb yielding, in which the total strain increment is decomposed into elastic, plastic, and temperature-induced volumetric components (Equations (1)–(5)). The elastic relation, plastic yielding/flow, and temperature-induced volumetric strain follow standard formulations in elastoplasticity and thermoelasticity [49,50,51]. In this study, these relations are adopted to quantify thaw settlement strain driven by temperature change in warm and ice-rich permafrost without repeating textbook-level derivations.
where Δε is the total strain increment, and Δεe, Δεp, Δεθ are the elastic, plastic, and temperature-induced (thaw settlement) strain increments, respectively.
Elastic relation (generalized Hooke’s law):
where Δσ′ is the effective stress increment; De is the elastic stiffness matrix; and “:” denotes the tensor double-dot product.
Plastic flow rule (Mohr–Coulomb):
where Δλ is the plastic multiplier increment; f is the Mohr–Coulomb yield function; and is the plastic potential function.
Temperature-induced volumetric (thaw settlement) strain:
where α(T) is the temperature-dependent volumetric (thaw settlement) strain coefficient; ΔT is the temperature increment; I is the second-order identity tensor.
In summary, at each incremental step, the total strain of a permafrost subgrade element is the sum of the elastic, plastic, and temperature-induced volumetric components, and the governing relation can be written in the simplified (incremental) form:
- (3)
- Physical Properties Parameters
To represent the dominant thermodynamic behavior in an engineering-consistent manner, soil within the active layer and thaw bulb is treated as fine-grained soil, and its natural density and moisture content are taken as statistical averages from laboratory tests along the corridor. For the underlying permafrost beneath the thaw bulb, given the dominant role of volumetric ice content in latent-heat effects and settlement potential, permafrost is classified into five ICT categories (S, D, F, B, and H) with reference to relevant standards [47]. For each ICT category, the physical and mechanical parameters (e.g., Poisson’s ratio, unit weight, saturated unit weight, and porosity) are determined from corridor-scale statistical aggregates of borehole geotechnical tests (Table 2), rather than adopting generic literature values. This ICT-dependent statistical parameterization improves engineering representativeness and avoids subjective parameter tuning. Considering the design characteristics of new highways in cold-region strata, the integrated parameter system for the active layer and thaw bulb is determined by combining field survey data with literature and standards [48], while accounting for freeze–thaw–related degradation of elastic modulus.
Table 2.
Typical Physical and Mechanical Parameters of Each Stratum and Ice content Soil.
2.2.3. Module Validation
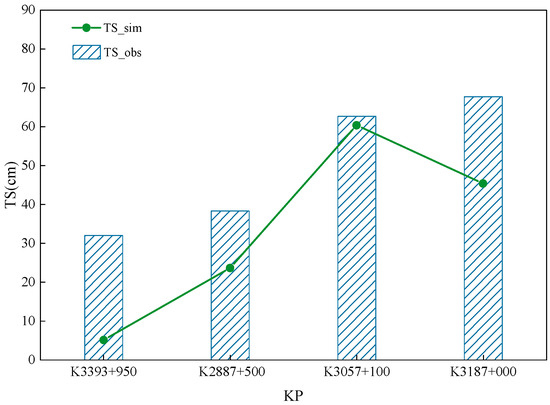
To verify the reliability of the numerical model, the simulated thaw settlement (TS_sim) was compared with field observation data (TS_obs) from four typical monitoring sections (Figure 3).
Figure 3.
Validation of the numerical model against field monitoring data.
As illustrated in Figure 3, the simulated results generally align well with the observed data in terms of deformation magnitude and spatial trend. Specifically, the simulation demonstrates high accuracy at sections K3393+950 and K3057+100, where the deviations are minimal. Although a noticeable discrepancy exists at section K3187+000, such deviation is considered acceptable for engineering simulations. This is primarily attributed to the inherent spatial heterogeneity of permafrost geology and ground ice distribution, which were necessarily simplified in the numerical model. Overall, the comparison confirms that the proposed model effectively captures the key thermo-mechanical behaviors and is sufficiently reliable for the subsequent predictive analysis.
2.2.4. Physics-to-Data Coupling for Corridor-Scale Mapping
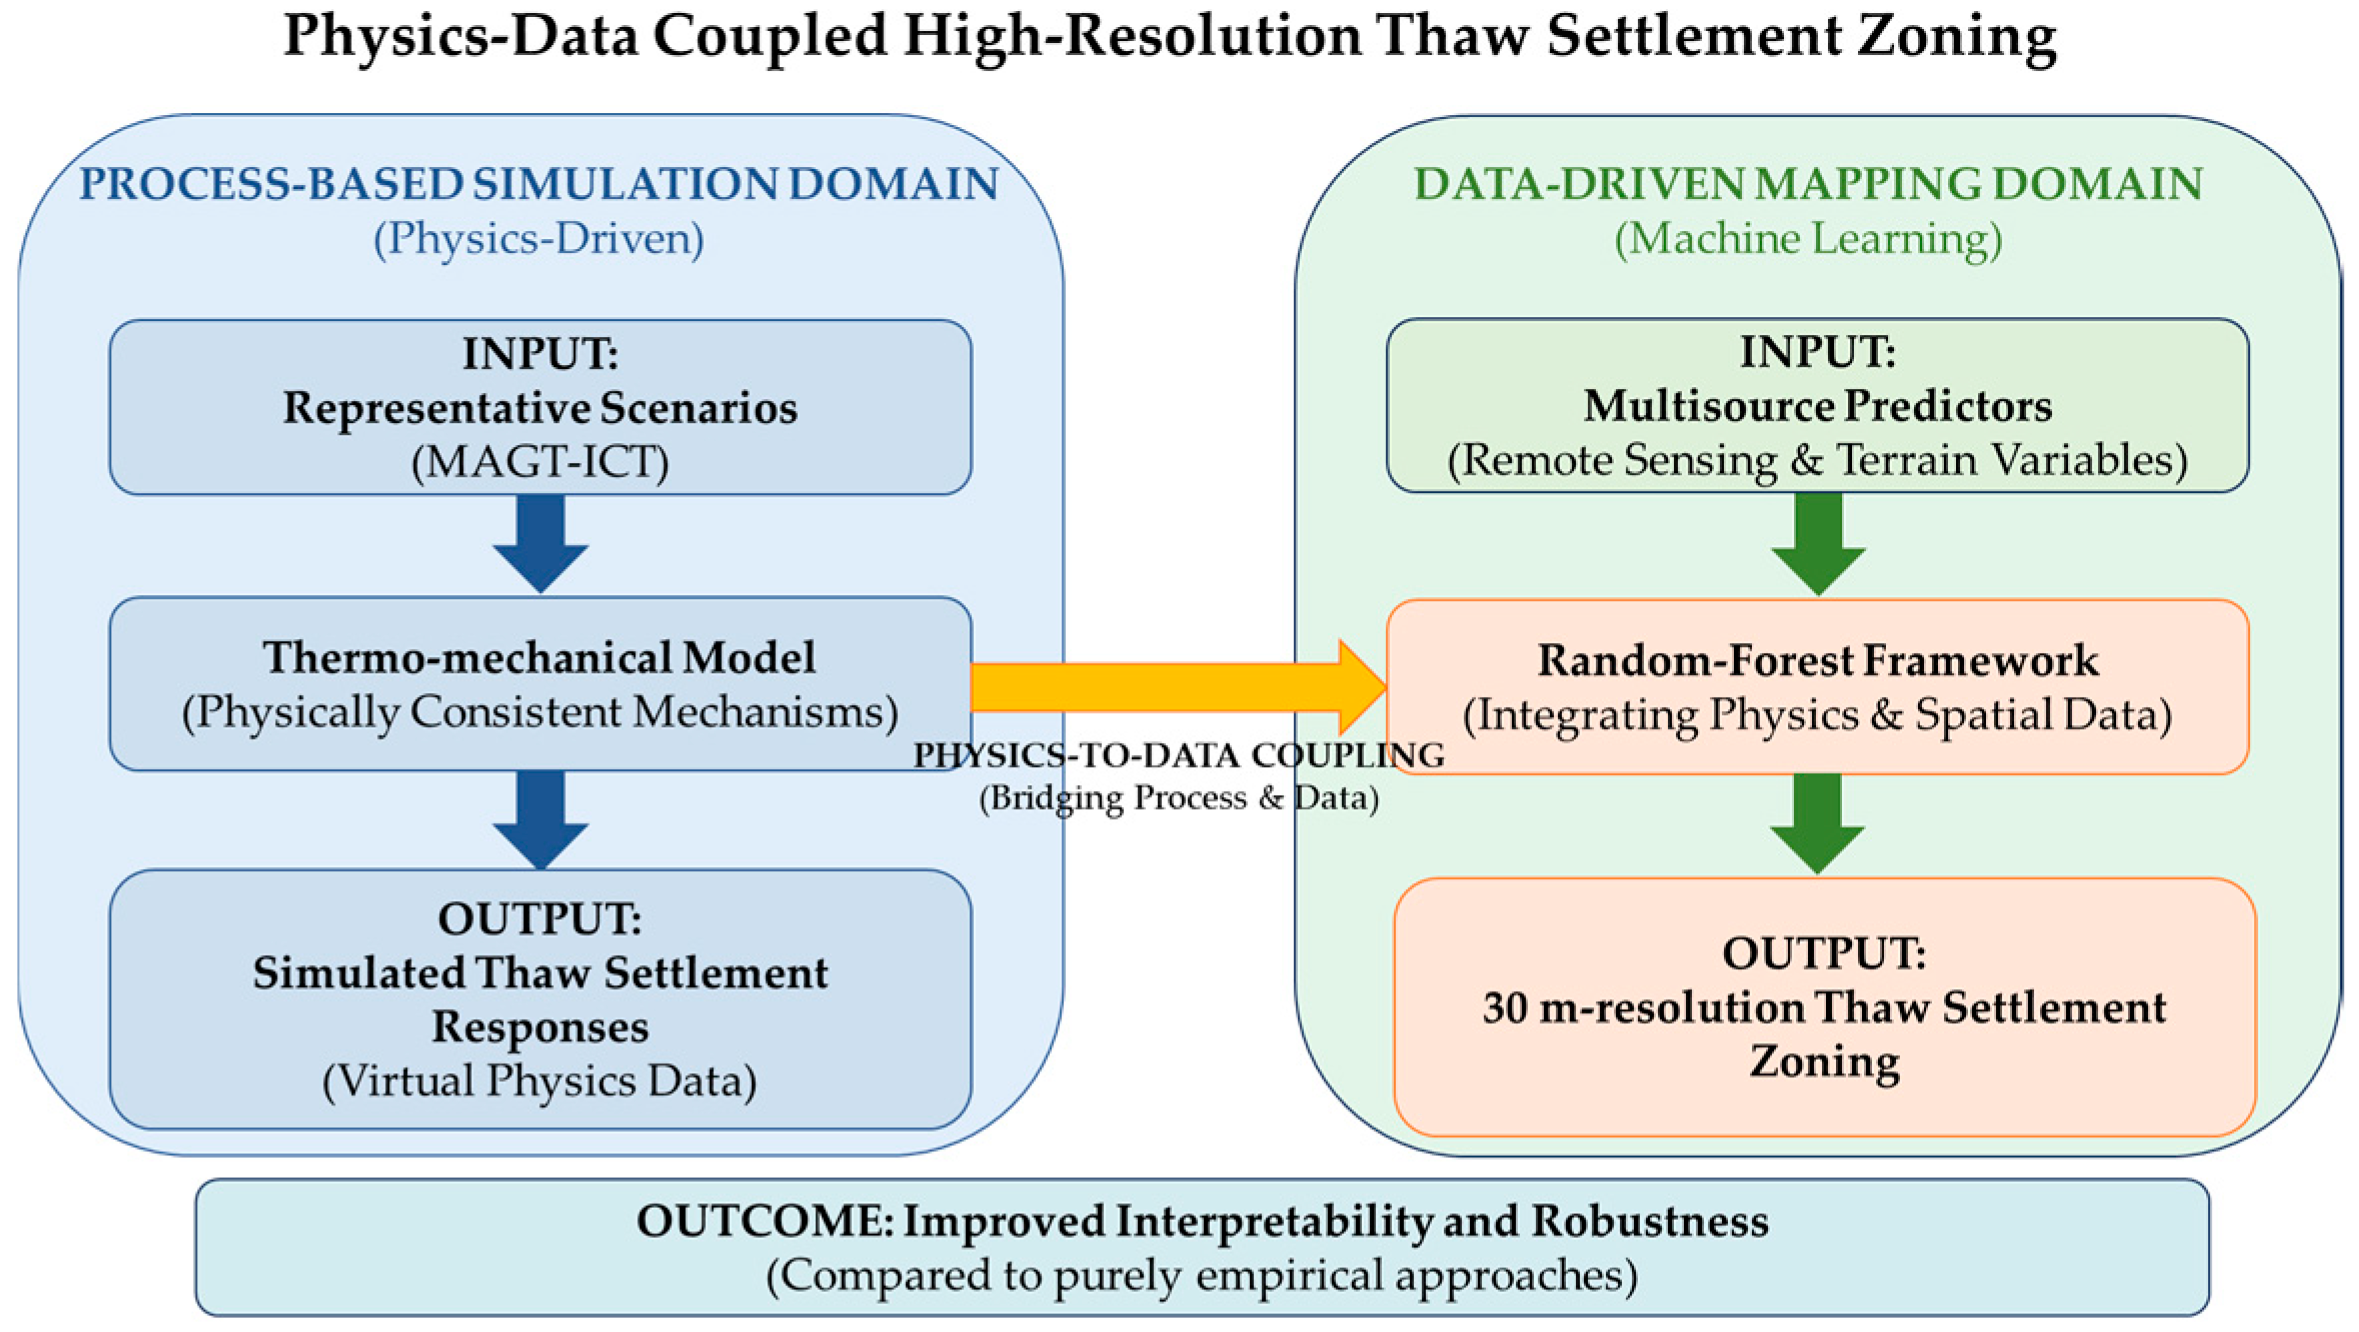
To address the limitations of empirical methods, we proposed an innovative “Physics-to-Data Coupling” strategy, as illustrated in Figure 4. The framework consists of two interconnected domains:
- (1)
- The Process-Based Simulation Domain (Left in Figure 4): The thermo-mechanical model is employed to generate physically consistent thaw settlement responses under representative MAGT–ICT scenarios, creating a “virtual physics” dataset.
- (2)
- The Data-Driven Mapping Domain (Right in Figure 4): These simulation outputs are then seamlessly coupled with multi-source environmental predictors (remote-sensing indicators and terrain variables) using the Random Forest framework.
This coupling bridge enables high-precision (30 m) thaw settlement zoning, effectively enhancing both the interpretability and robustness of the prediction model.
Figure 4.
Workflow of the physics–data coupled approach for high-resolution thaw settlement zoning.
2.3. Model Prediction Based on Machine Learning
2.3.1. Random Forest
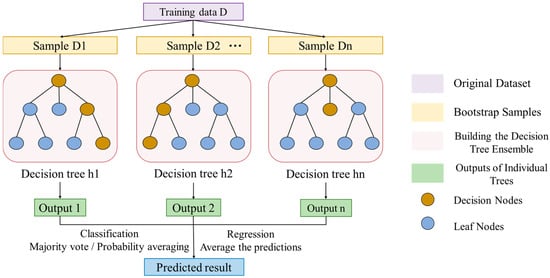
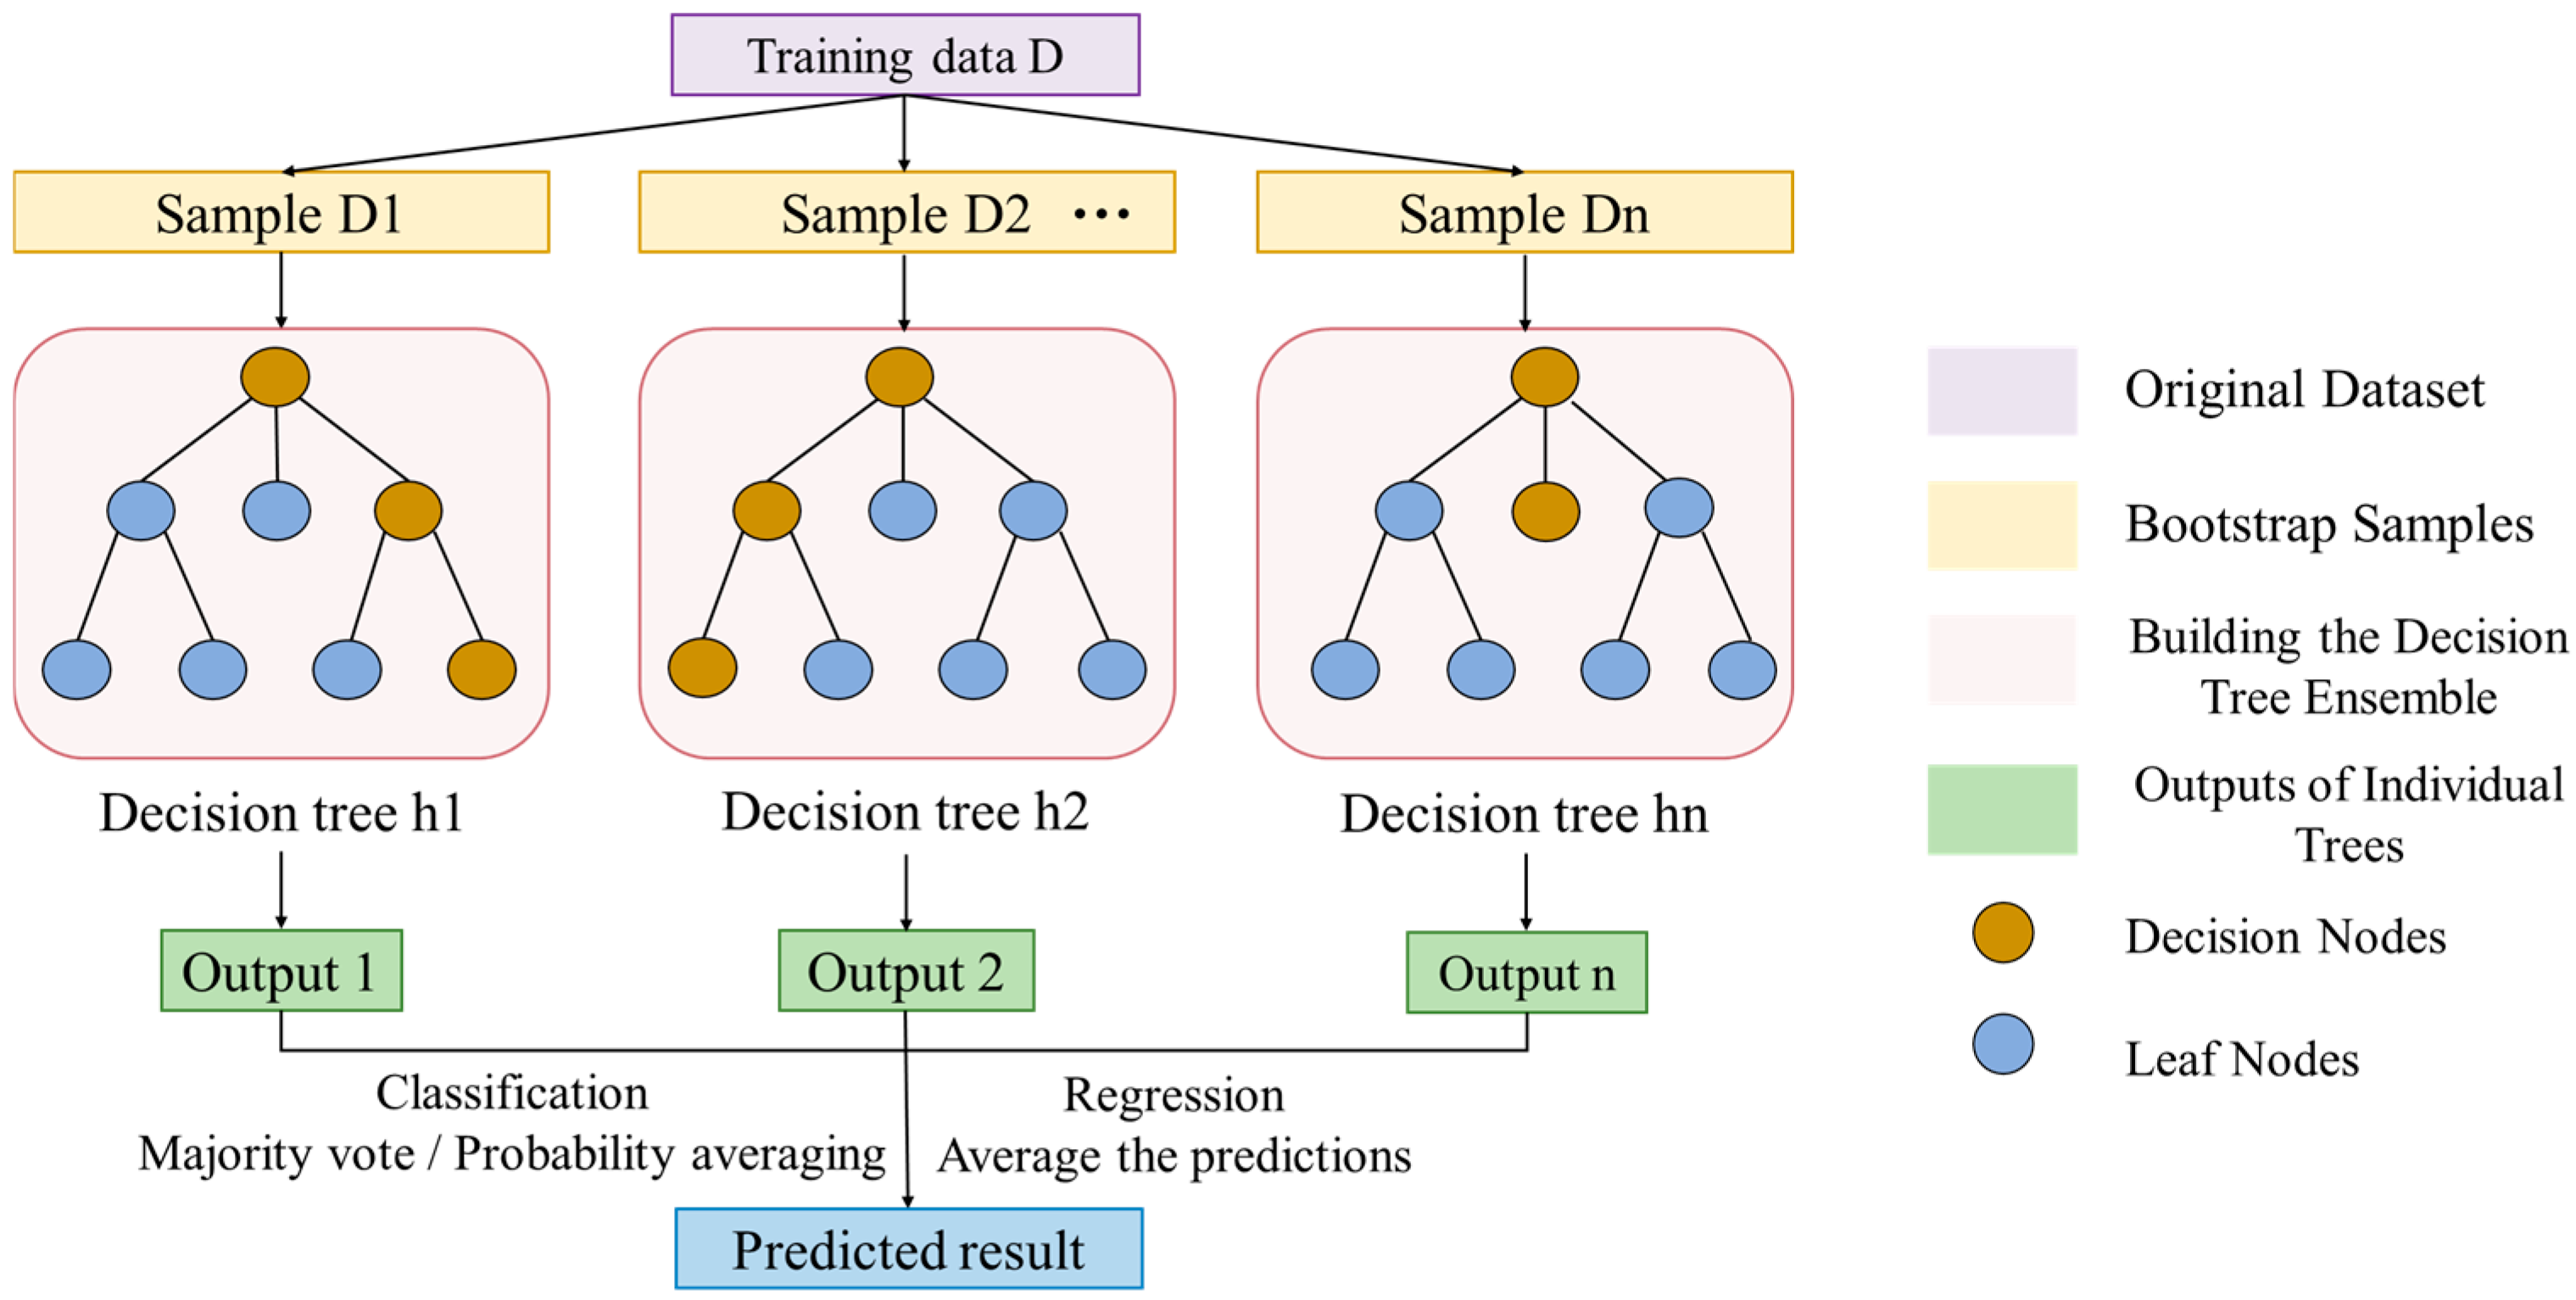
Random Forest (RF) is an ensemble learning method built on bagging. During training, the original dataset is resampled with replacement (bootstrap) to generate multiple subsamples {D1, D2, …, Dn}. A decision tree is trained on each subsample. To enhance inter-tree diversity and suppress overfitting, each node split is selected from a random subset of features rather than the full feature set. During inference, tree outputs are aggregated through arithmetic mean for regression. RF is robust to high dimensionality, nonlinearity, and feature interactions; it supports feature importance for variable interpretation (Figure 5).
Figure 5.
Workflow diagram of the Random Forest model.
To ensure the rigor and transparency of the model construction, the following strategies were implemented. The specific parameter settings determined for the RF model are summarized in Table 3.
Table 3.
Parameter Settings for the Random Forest Model.
Specifically, three key strategies were applied:
- (1)
- Hyperparameter Optimization: Key parameters, including the number of trees and maximum depth, were determined through iterative testing to achieve the optimal balance between model complexity and computational efficiency.
- (2)
- Generalization Validation: To ensure reproducibility, the dataset was partitioned into a training set (80%) and an independent test set (20%) using a fixed data-splitting seed (RandomState = 686). The internal stochastic processes of the RF algorithm were further controlled by a model seed (random_state = 48, Table 3). The high consistency of performance metrics (R2 > 0.97) between training and testing phases (as detailed in Section 2.3.2) confirms the model’s robustness against overfitting.
- (3)
- Feature Selection: Input variables (MAGT, ICT, SO, etc.) were initially selected based on their fundamental physical roles in permafrost thermo-mechanical processes. Their statistical contributions and dominance were further quantitatively verified using SHAP (SHapley Additive exPlanations) analysis and standardized regression, which are comprehensively discussed in Section 4.1.
2.3.2. Predictive Performance of the Random Forest Model
- (1)
- Talik Identification
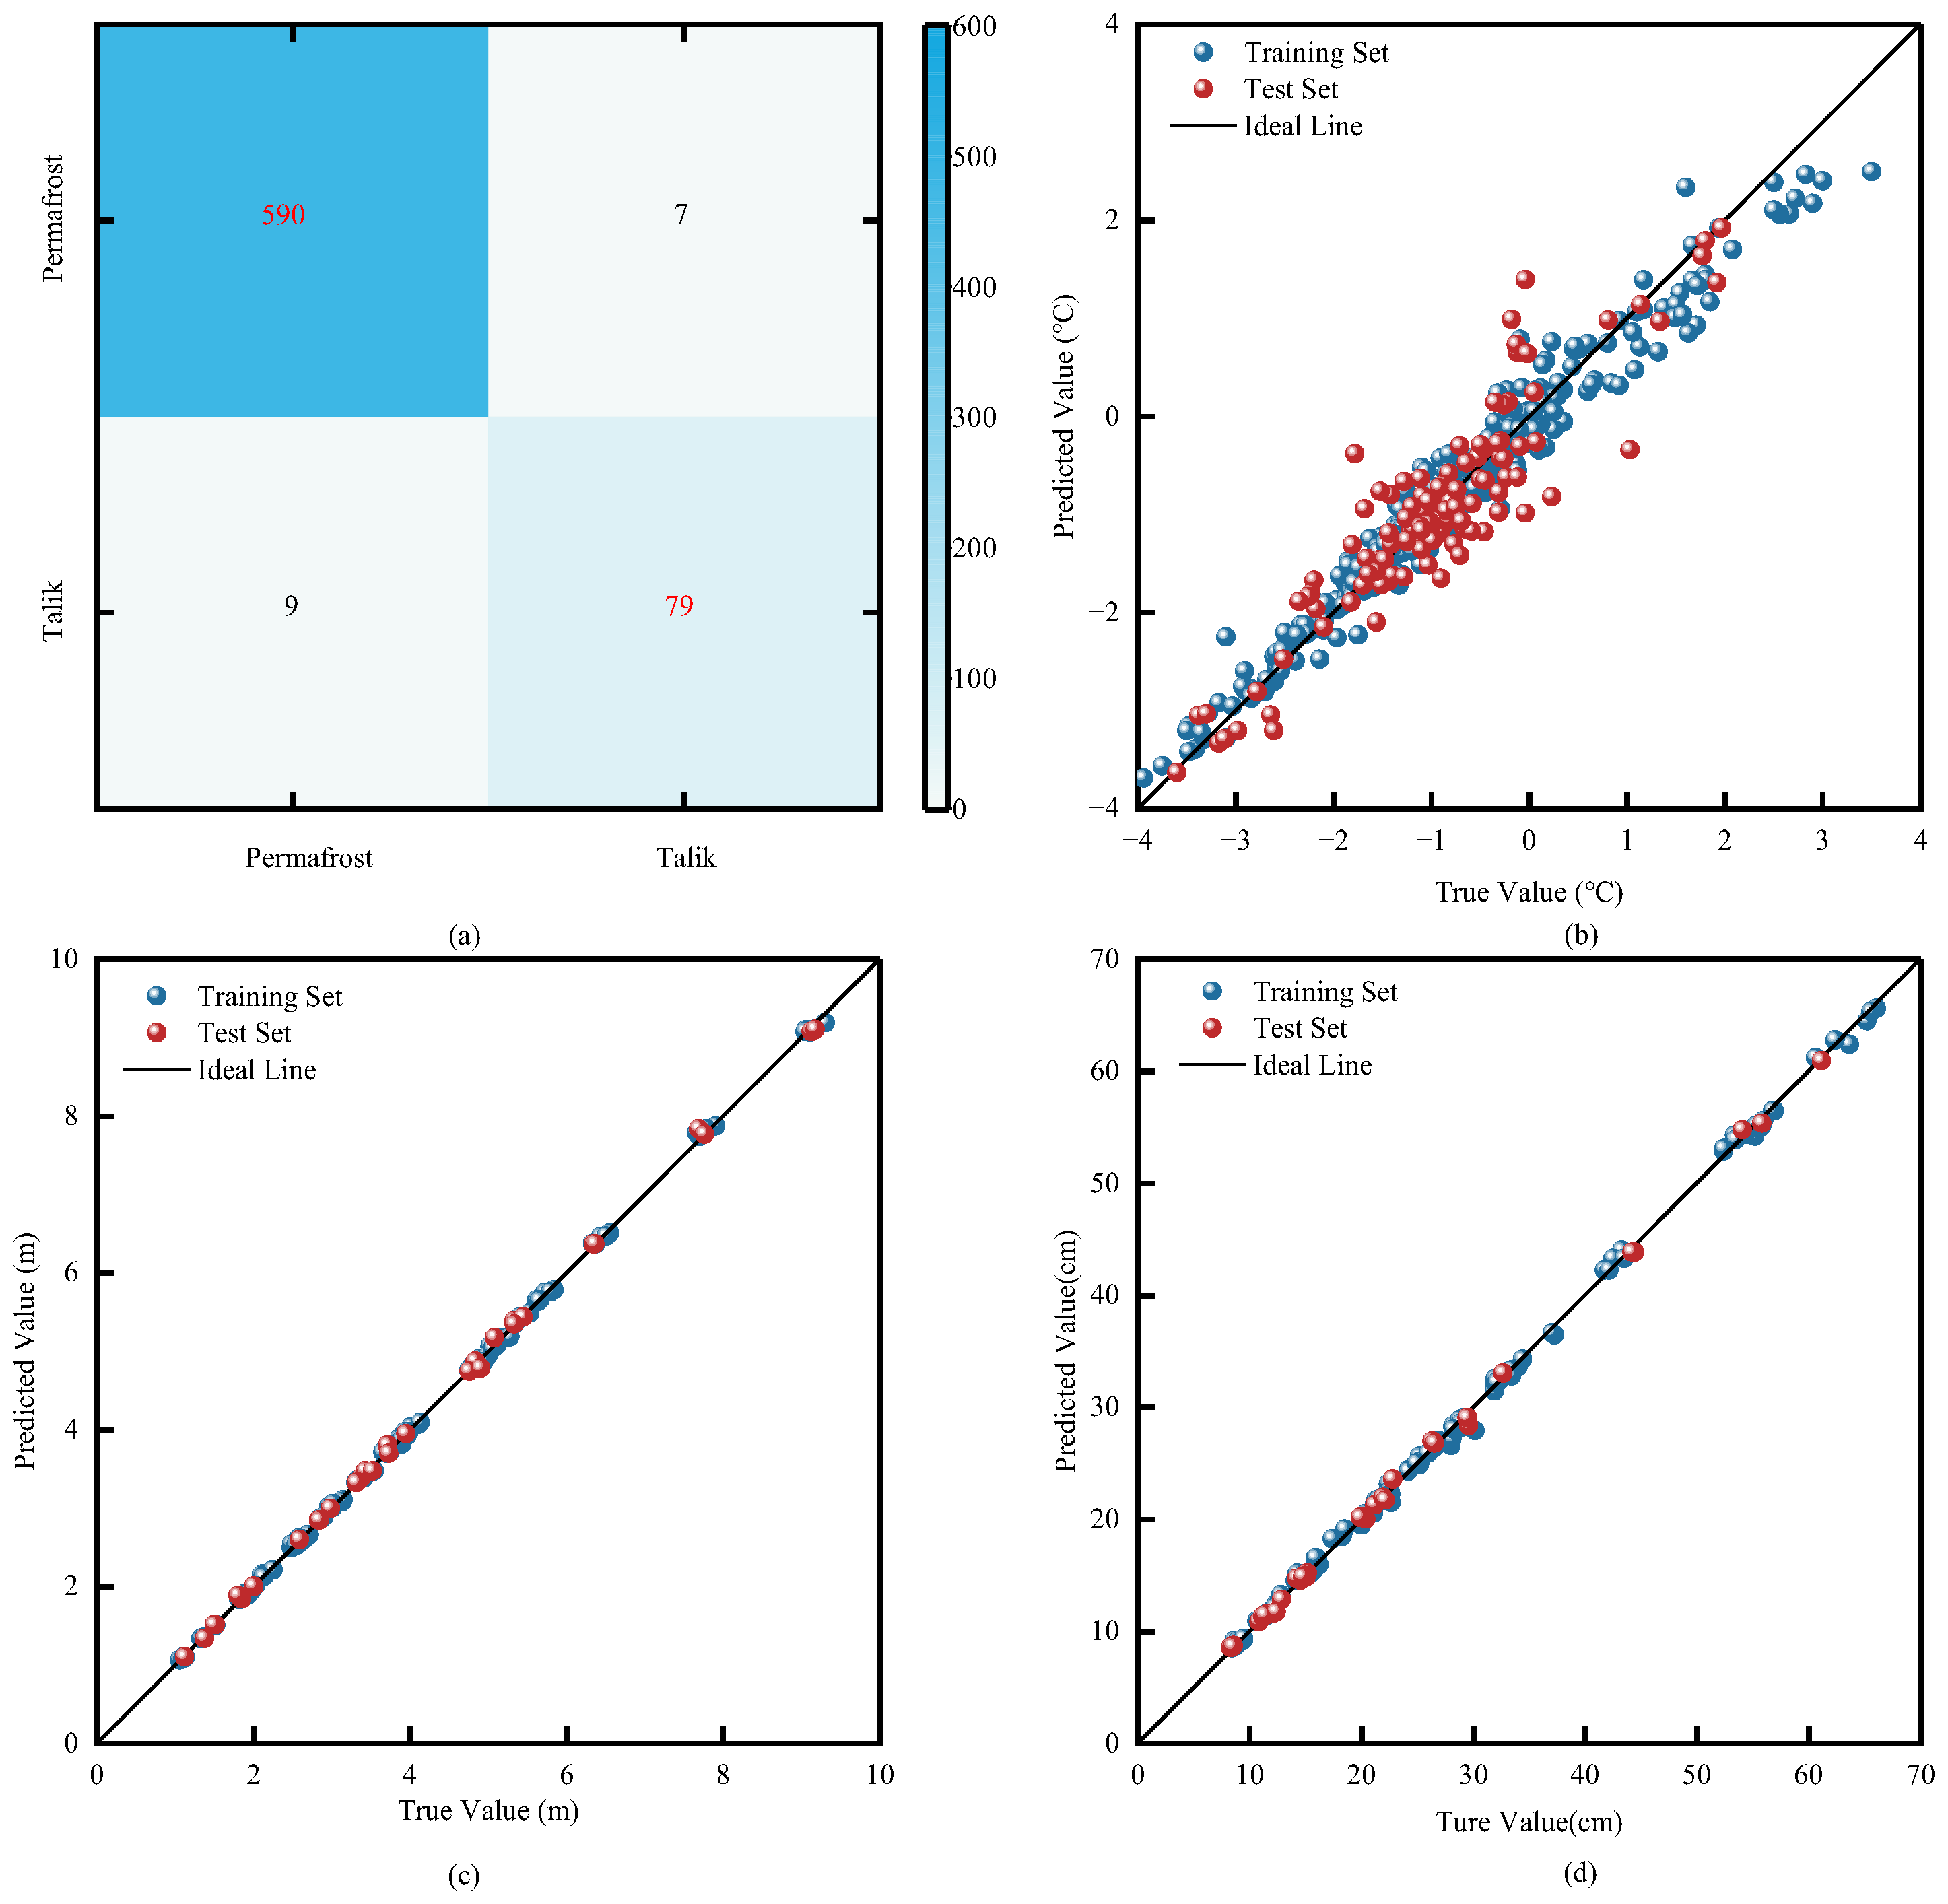
This study developed a random forest classification model for talik identification based on 3423 sets of talik monitoring data. Latitude, land surface temperature, normalized difference vegetation index, elevation, and equivalent latitude were selected as feature variables, with the binary talik label (yes/no) as the target variable. To validate the model’s generalization performance, the dataset was divided using stratified random sampling into a training set (80%, n = 2738) and a test set (20%, n = 685). The model achieved an accuracy of 0.98, precision of 0.99, and recall of 0.91, demonstrating high discriminative capability and strong robustness.
- (2)
- MAGT
A prediction model was established using 607 sets of valid monitoring data (after removing 19 outliers from the original 626 sets), with latitude, land surface temperature, elevation, and the thawing index as feature variables. The dataset was split 80:20 into training and test sets. On the training set (n = 486), the model achieved R2 = 0.94, RMSE = 0.27 °C, and MAE = 0.17 °C; on the test set (n = 121), it achieved R2 = 0.83, RMSE = 0.43 °C, and MAE = 0.31 °C.
- (3)
- Maximum Thaw Depth (MTD)
Based on 175 sets of ground-atmosphere coupling numerical solutions, a model was developed using MAGT, ICT, and SO as feature variables. The dataset was divided 80:20 into a training set (n = 140) and a test set (n = 35). On the training set, the model achieved R2 = 0.98, RMSE = 0.03 m, and MAE = 0.05 m; on the test set, it achieved = 0.97, RMSE = 0.02 m, and MAE = 0.03 m.
- (4)
- Thaw Settlement (TS)
Based on 175 sets of themo-mechanical coupling numerical results, a random forest regression model was used to predict subgrade thaw settlement. MAGT, ICT, and SO served as feature variables, with maximum thaw settlement as the target variable. The dataset was split 80:20 into a training set (n = 140) and a test set (n = 35). Model performance was as follows: on the training set, R2 = 0.97, RMSE = 0.44 cm, MAE = 0.30 cm; on the test set, R2 = 0.97, RMSE = 0.41 cm, MAE = 0.31 cm.
It is worth noting that the 175 sets of numerical results used in (3) and (4) were generated based on a systematic full-coverage design of key variables (MAGT, ice content, and soil properties), rather than random sparse sampling. These scenarios cover the entire parameter space of the study area. Therefore, the training process focuses on learning the thermo-mechanical constitutive relationships (i.e., mapping physical boundaries to deformation) rather than spatial interpolation, rendering spatial autocorrelation less relevant for this specific module. The high prediction accuracy (R2 > 0.97) further confirms that this sample size is sufficient to characterize the non-linear response surface for regional scaling.
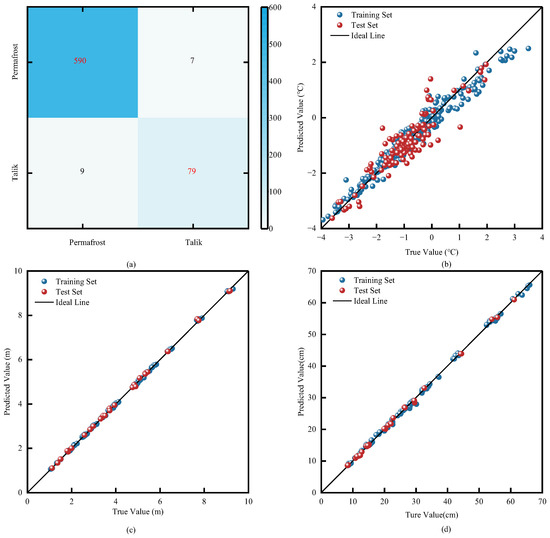
The validation results of the above four models collectively demonstrate that the random forest model exhibits excellent performance in predicting permafrost parameters. The prediction results of each model are shown in Figure 6.
Figure 6.
Random Forest Model Prediction Results: (a) Talik Identification Confusion Matrix (Color intensity indicates sample count); (b) MAGT Prediction Regression Model; (c) MTD Prediction Regression Model; (d) TS of Subgrade Prediction Regression Model.
2.3.3. Factor Zoning
- (1)
- Permafrost Occurrence Conditions
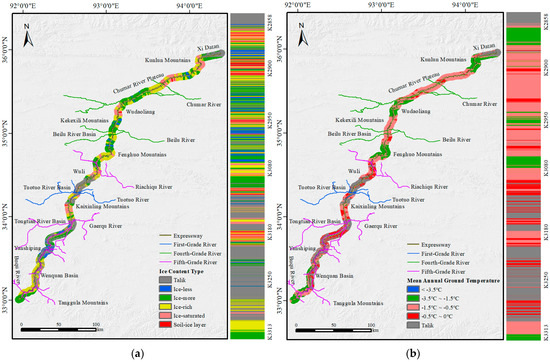
A total of 1993 off-road borehole data points along the route were used to determine the ICT. The spatial distribution of ICT was mapped through spatial interpolation using the Inverse Distance Weighting (IDW) method, as shown in Figure 7a. Simultaneously, the discretely predicted ground temperatures from the model were directly rasterized using the “Point to Raster” tool with the nearest neighbor assignment method at a 30 m resolution. This approach strictly preserves the accuracy of the original predicted values, avoids secondary interpolation errors, and ensures the complete transfer of the spatial authenticity of the model predictions, as illustrated in Figure 7b.
Figure 7.
Maps of permafrost occurrence conditions in the study area: (a) ICT; (b) MAGT.
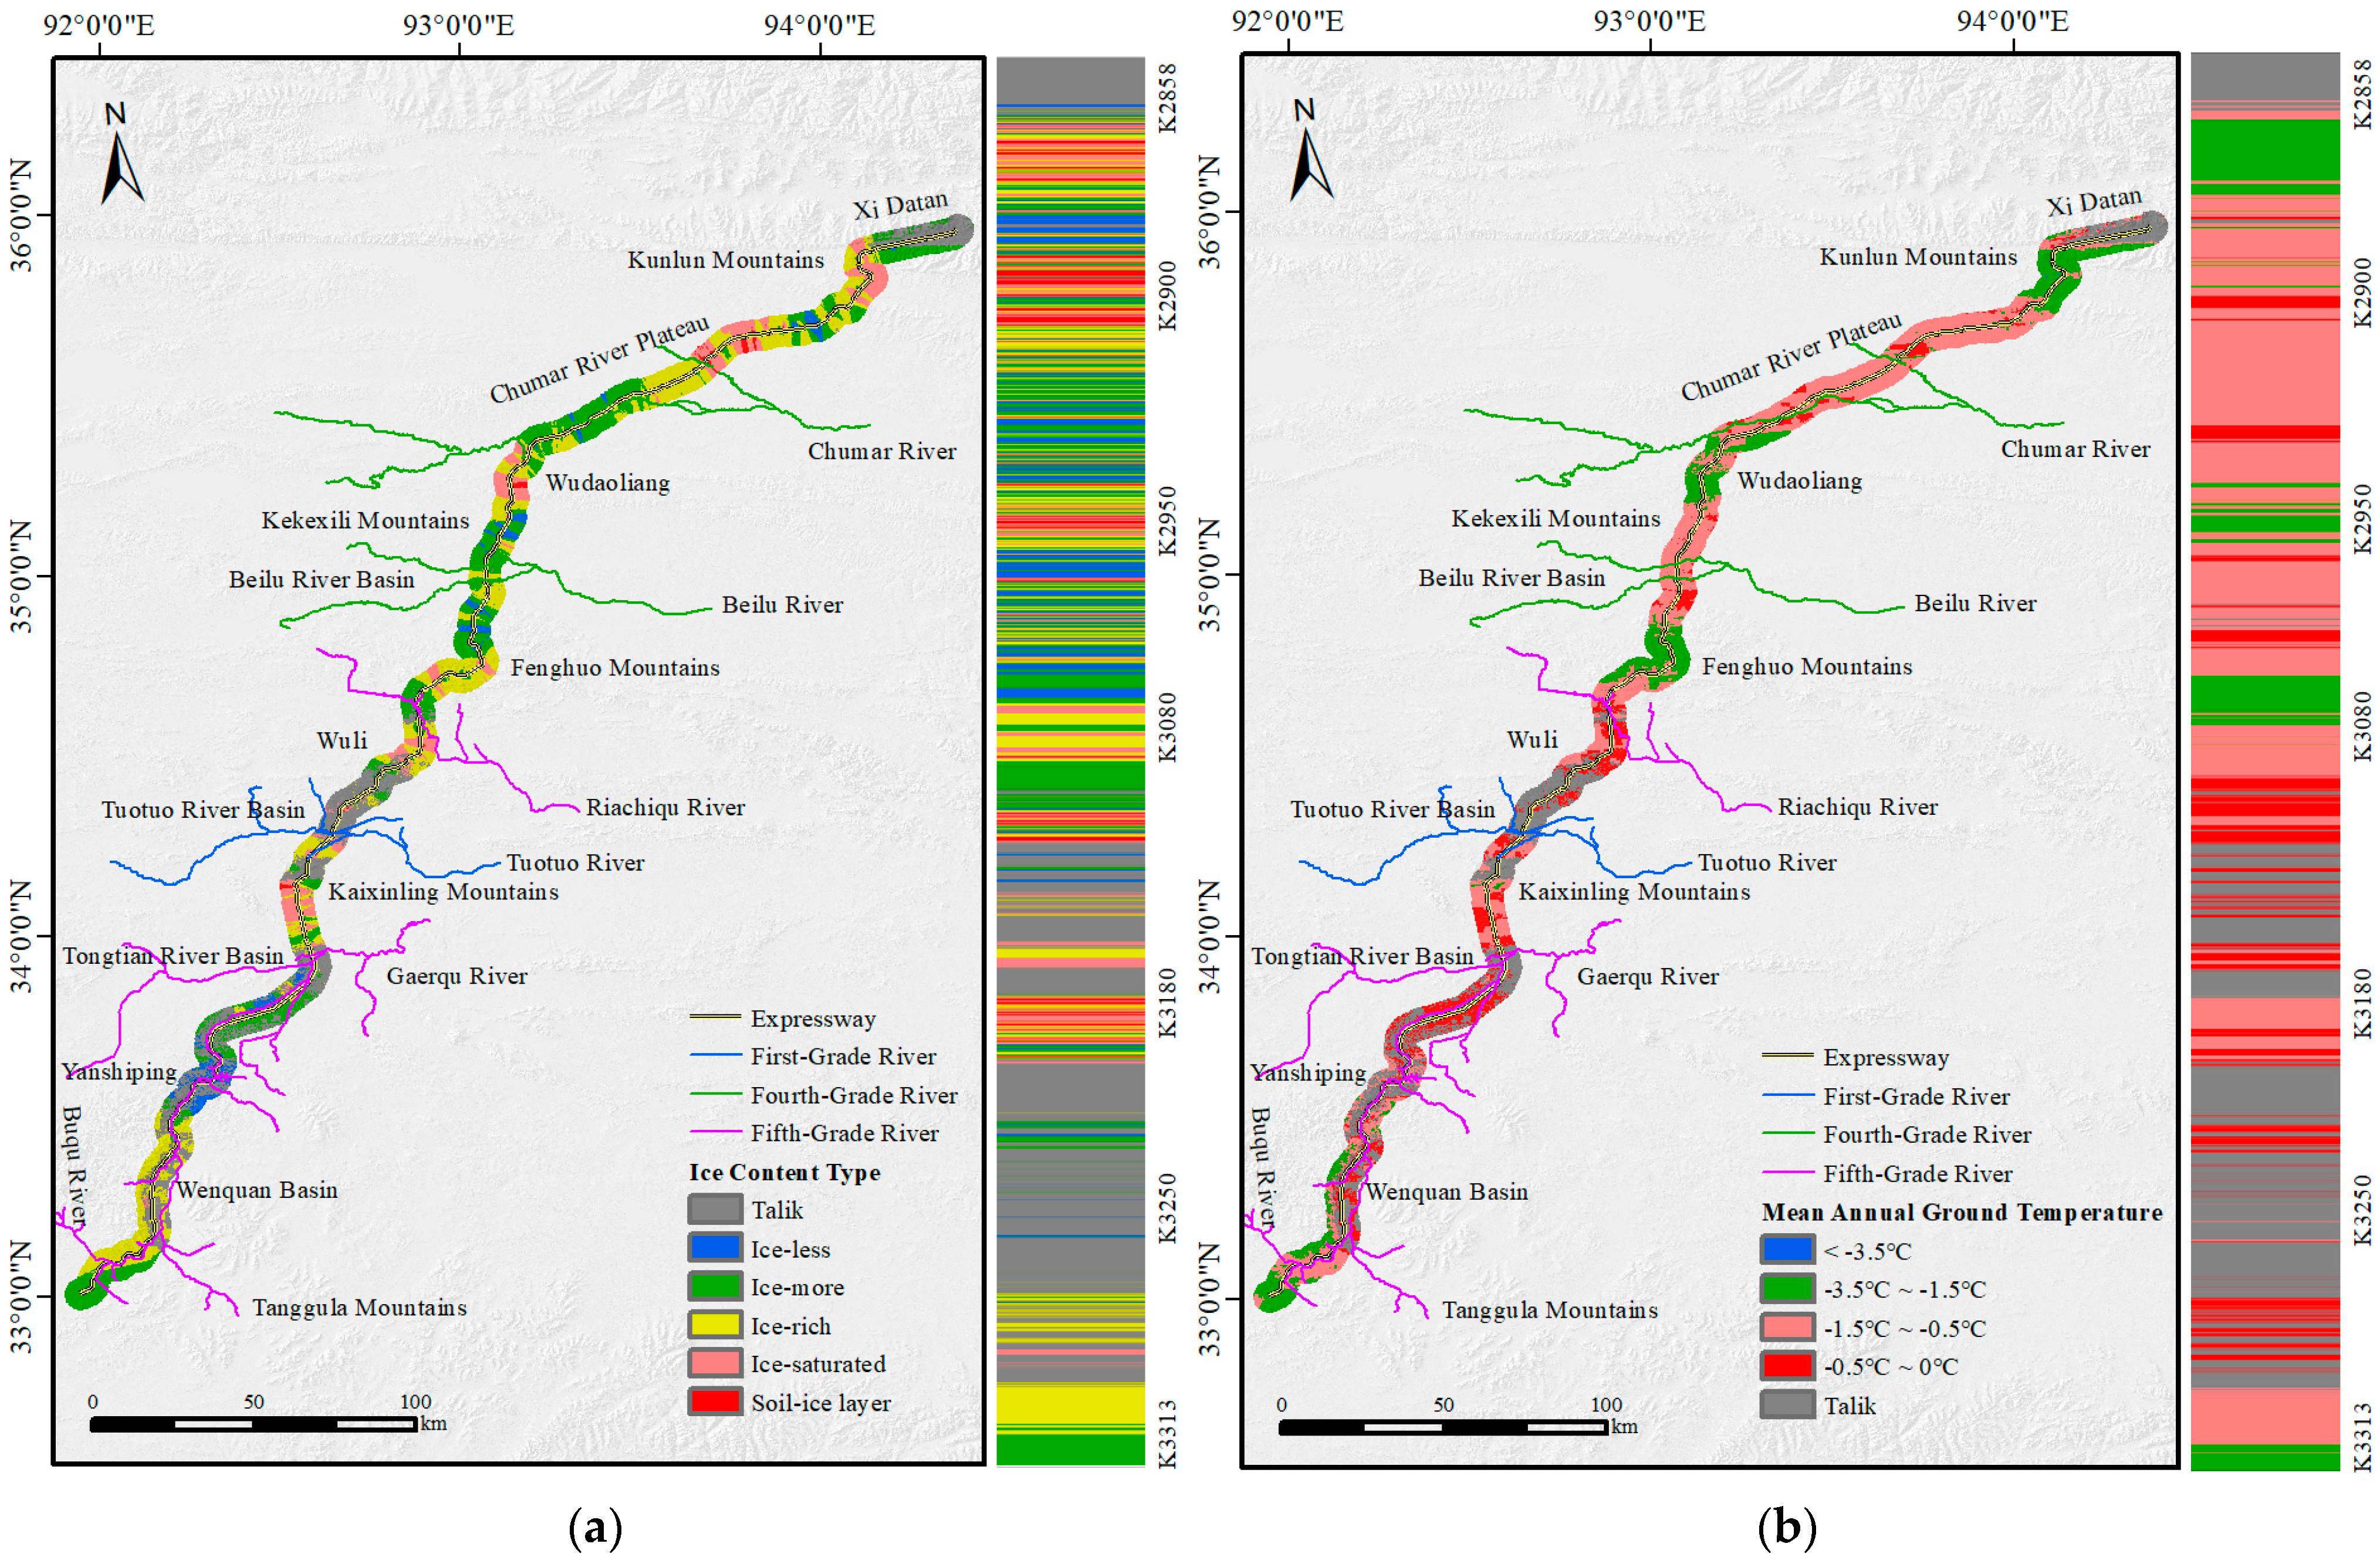
Based on the analysis of spatial distribution characteristics, permafrost types in the study area exhibit significant regional differentiation (Figure 7a). Type S occupies a relatively small proportion with localized distribution, primarily found in geomorphic units including the Chumar River Plateau, Kekexili Mountains, Fenghuo Mountains, Tongtian River Basin, and Yanshiping. Type D serves as the dominant type with strong spatial continuity, widely distributed across the Chumar River Plateau, Beilu River Basin, Fenghuo Mountains, and Tanggula Mountains. Type F is mainly concentrated in the Kunlun Mountains, Chumar River Plateau, Wudaoliang, Fenghuo Mountains, Wuli, Tuotuo River Basin, and Wenquan Basin. Due to their high ice content, Types B and H exhibit the most restricted distribution, primarily occurring in the Kunlun Mountains, Wudaoliang, Fenghuo Mountains, Wuli, and Tongtian River Basin.
The permafrost thermal stability zoning reveals distinct characteristics (Figure 7b). High-temperature unstable permafrost (−1.5 °C < T ≤ −0.5 °C) represents the dominant category in the region, forming continuous patches across geomorphic units including the Chumar River Plateau, Kekexili Mountains, Beilu River Basin, Fenghuo Mountains, Wuli, Tongtian River Basin, and the high-low mountainous areas of Yanshiping. Low-temperature essentially stable permafrost (−3.5 °C < T ≤ −1.5 °C) ranks as the second most prevalent type, mainly concentrated in the Kunlun Mountains, Wudaoliang Mountains, Fenghuo Mountains, and the piedmont zone of Tanggula Mountains, displaying clear vertical zonality. High-temperature extremely unstable permafrost (−0.5 °C < T ≤ 0 °C) shows discontinuous distribution, commonly observed in the Chumar River Plateau, Kekexili Mountains, Beilu River Basin, Wuli, Tuotuo River Basin, Kaixinling Mountains, Tongtian River Basin, and Wenquan Basin. In contrast, low-temperature stable permafrost (T ≤ −3.5 °C), while possessing the highest thermal stability, covers the smallest area and is only sporadically distributed in the Kunlun Mountains.
- (2)
- Distribution Characteristics of MTD
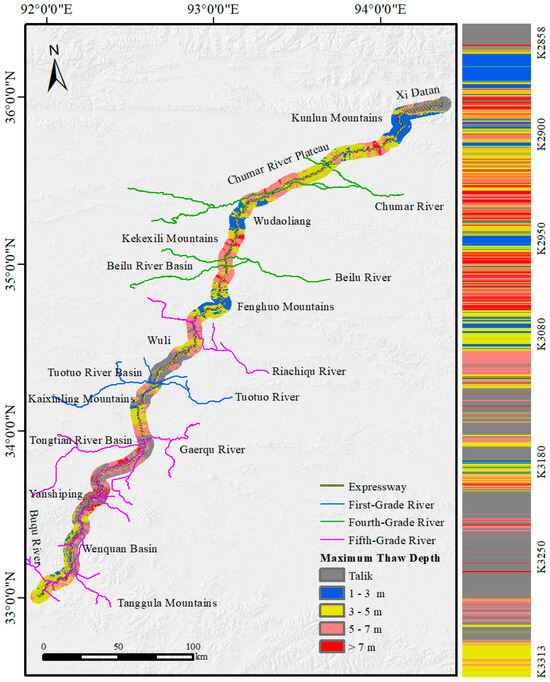
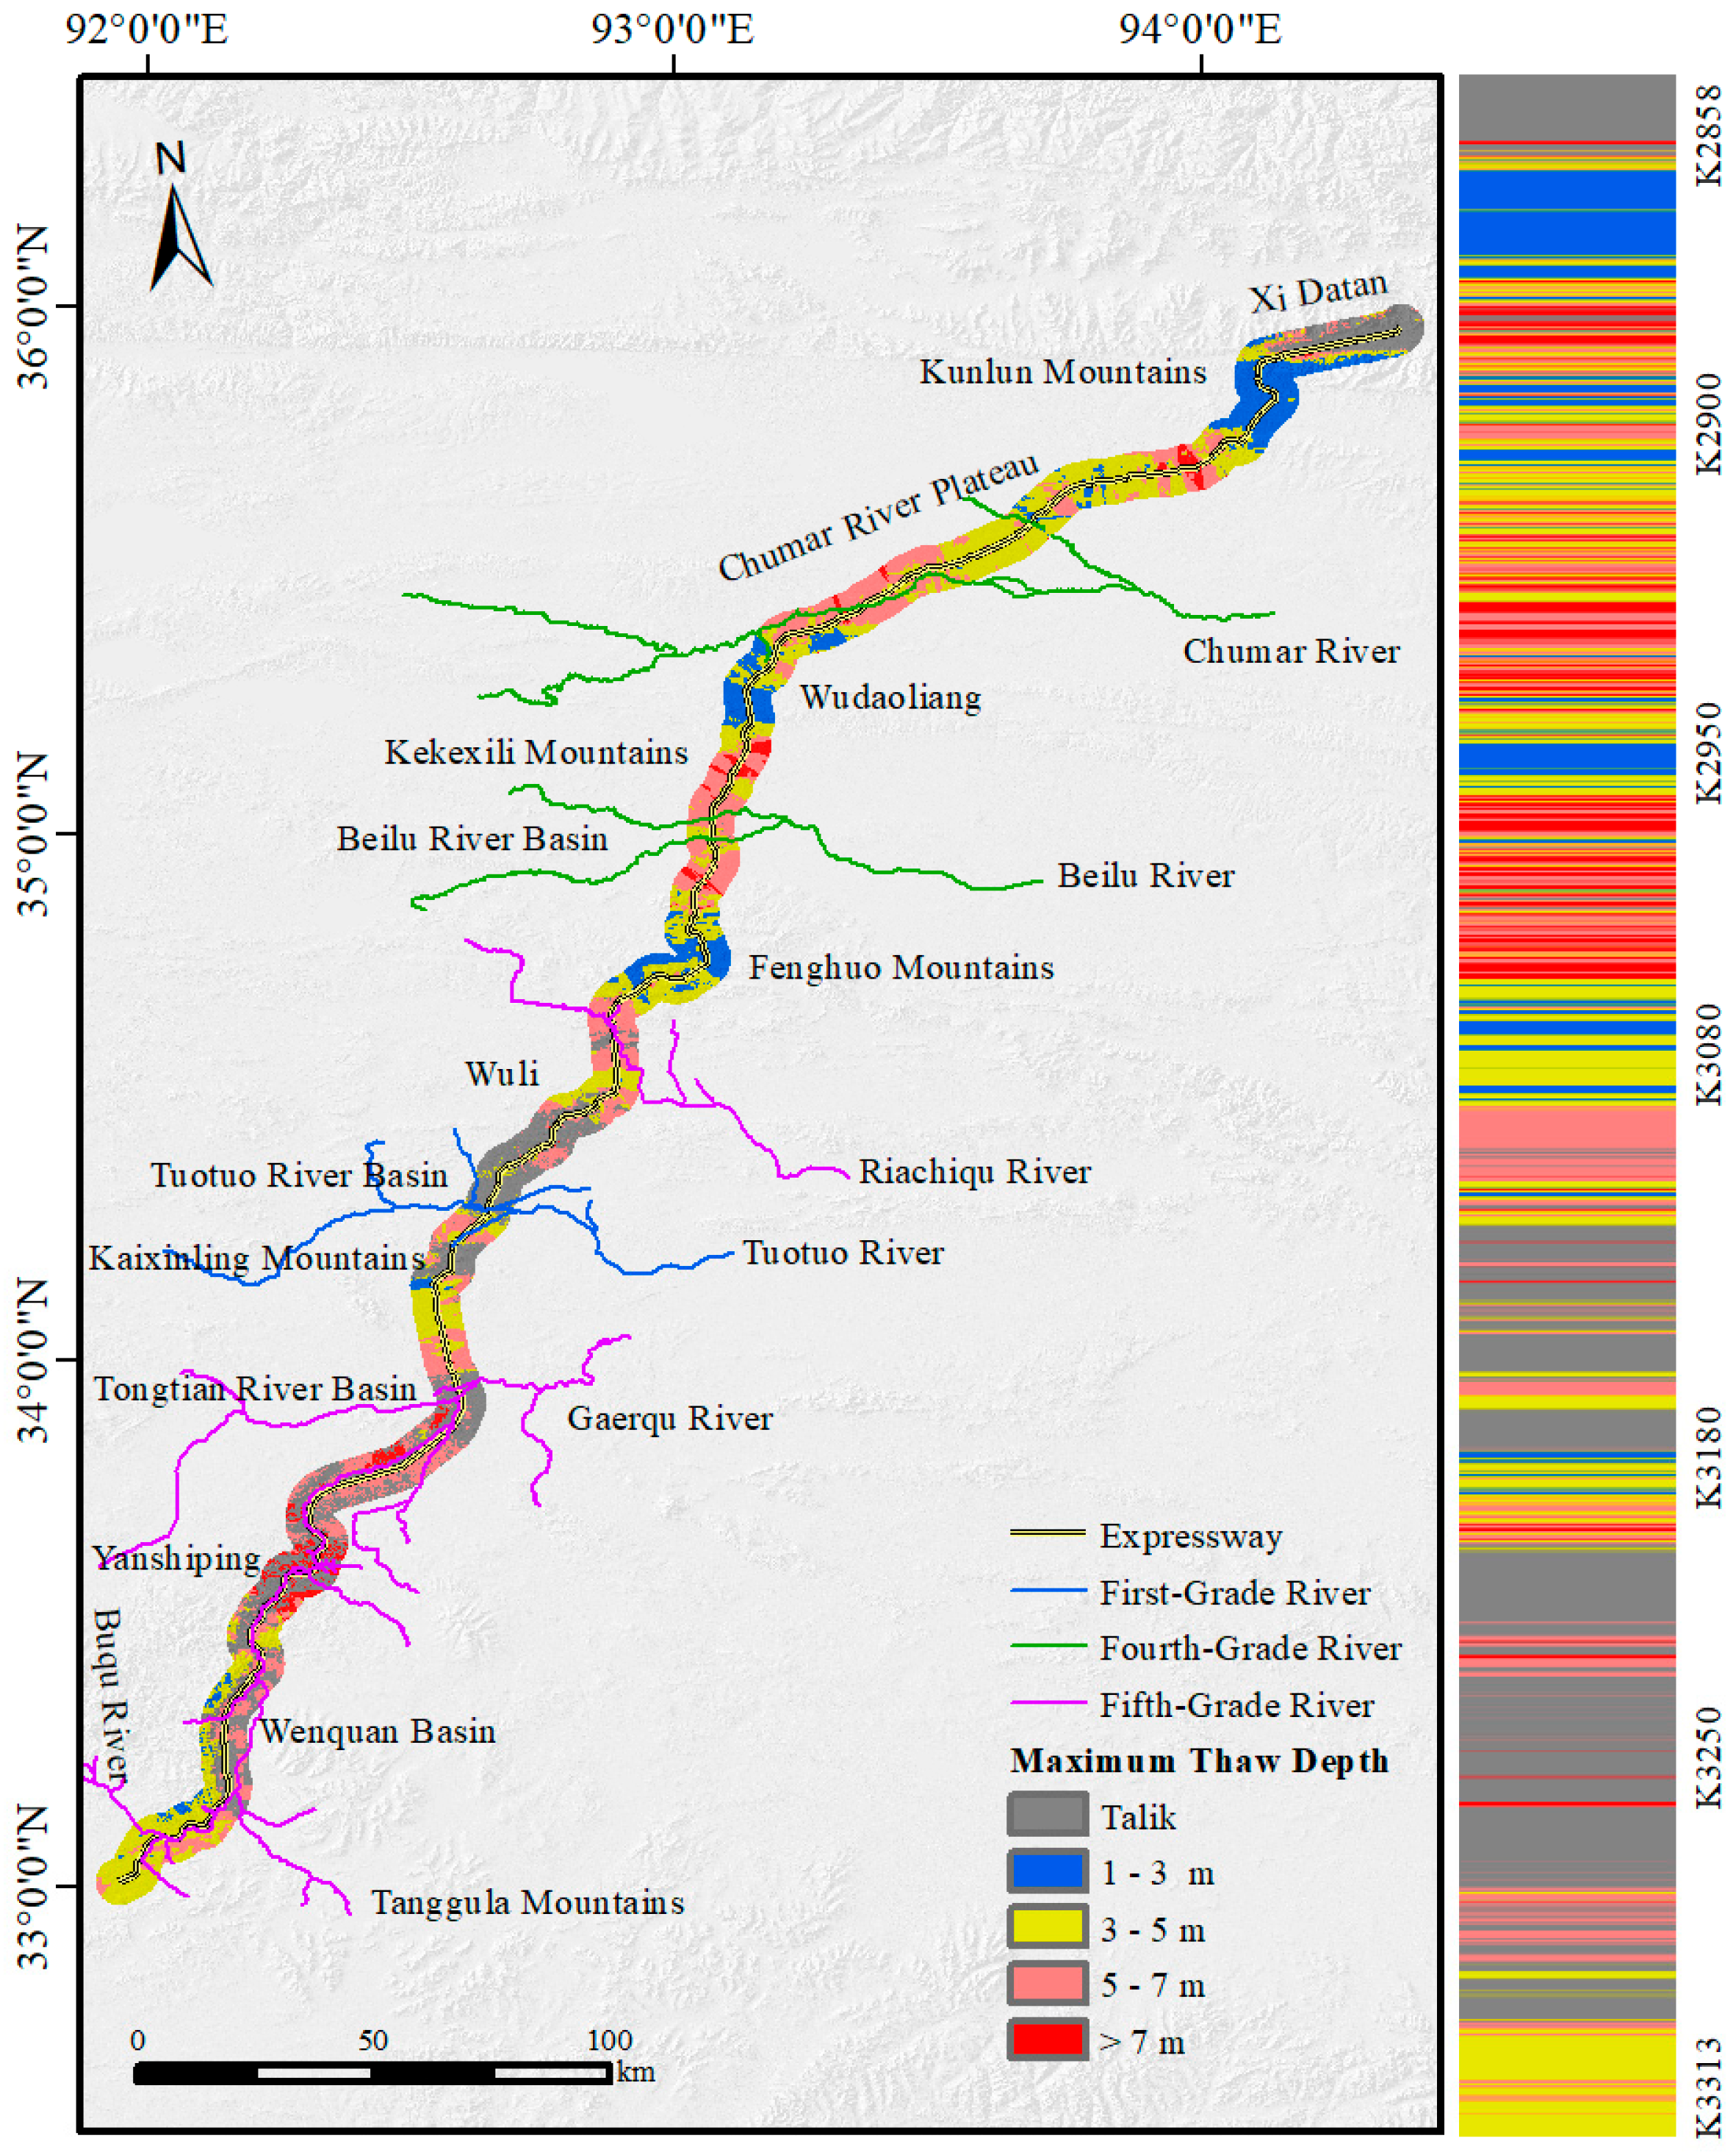
For thaw depth prediction data, the point-to-raster tool (using the nearest neighbor assignment principle, 30 m resolution) was also applied to convert discrete points to raster. This method directly maps the original values, maintaining the spatial fidelity of the prediction results and forming a high–precision zoning map of maximum thaw depth (Figure 8).
Figure 8.
Zoning Map of MTD in the Study Area.
The MTD in the study area ranges from 1.06 to 9.21 m, showing significant spatial variability. In terms of depth classification, the 3–5 m and 5–7 m intervals constitute the main types, forming continuous patches widely distributed within the primary extent of the permafrost zone. Specifically, the 3–5 m depth interval is mainly distributed in the Chumar River Plateau, Wudao Liang mountainous area, Fenghuo Mountains, Wuli, Tongtian River Basin, and Tanggula Mountains. The 5–7 m depth interval is primarily found in the Chumar River Plateau, Kekexili Mountains, Beilu River Basin, Fenghuo Mountains, Wuli, Tuotuo River Basin, Tongtian River Basin, and Wenquan Basin. Notably, the 0–1 m interval is absent in the study area, while the 1–3 m interval is concentrated in the Kunlun Mountains, Wudao Liang, and Fenghuo Mountains. The >7 m depth interval exhibits a highly localized distribution, mainly occurring in the Chumar River Plateau, Kekexili Mountains, Beilu River Basin, Tongtian River Basin, and Yanshiping areas.
2.4. Thaw Settlement Classification
Based on predicted thaw settlement for 13 m wide separated subgrades in the permafrost zone along the Qinghai–Tibet Corridor, thaw settlement was classified into five levels, and a spatial zoning map was generated.
According to the “Technical Specifications for Highway Design and Construction in Permafrost Regions” (JTG/T3331–04–2023) [52] and the “Code for Geological Investigation of Permafrost Engineering” (GB 50324–2014) [47], when the thaw settlement coefficient δ0 ≤ 1, the thaw settlement is classified as Level I (non-thaw settlement); when 1 < δ0 ≤ 3, it is Level II (weak thaw settlement); when 3 < δ0 ≤ 10, it is Level III (moderate thaw settlement); when 10 < δ0 ≤ 25, it is Level IV (strong thaw settlement); and when δ0 > 25, it is Level V (severe thaw subsidence).
According to the “Regulations for Engineering Geological Investigation in Permafrost Regions” (DZ/T 0061−1993) [53], when the thaw settlement amount I < 3 cm, it is classified as Level I; when 3 ≤ I < 15 cm, Level II; when 15 ≤ I < 30 cm, Level III; when 30 ≤ I < 75 cm, Level IV; and when I ≥ 75 cm, Level V.
However, the classification standards in [53] are primarily derived from natural geological surveys. For the 13 m wide separated subgrade in this study, the engineering characteristics and allowable deformation differ significantly from those of natural ground. According to the Specifications for Design of Highway Subgrades (JTG D30-2015) [48], the allowable post-construction settlement for general sections of expressways is typically 30 cm. Considering the structural stiffness of the embankment and practical maintenance requirements, the strict 3 cm threshold stipulated in [53] is deemed overly conservative. Therefore, by integrating the referenced standards [47,48,52,53] with the specific engineering adaptability of the 13 m wide subgrade, a modified classification scheme was established. Specifically, 30 cm was adopted as the upper limit for moderate settlement (Level III) to align with the engineering limits [48]. The final classes are: I (<10 cm), II (10 ≤ I < 20 cm), III (20 ≤ I < 30 cm), IV (30 ≤ I < 50 cm), and V (≥50 cm).
3. Results
3.1. Distribution Characteristics of Maximum Thaw Settlement of the Subgrade
3.1.1. Spatial Distribution Characteristics
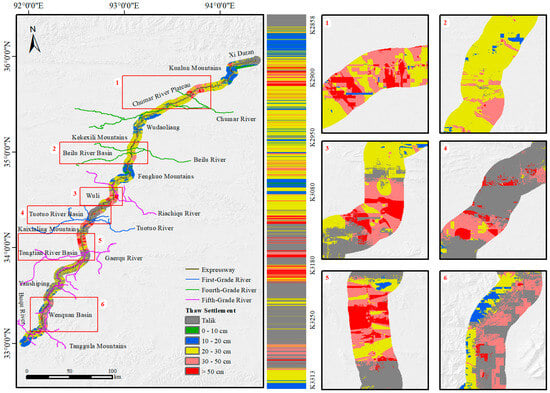
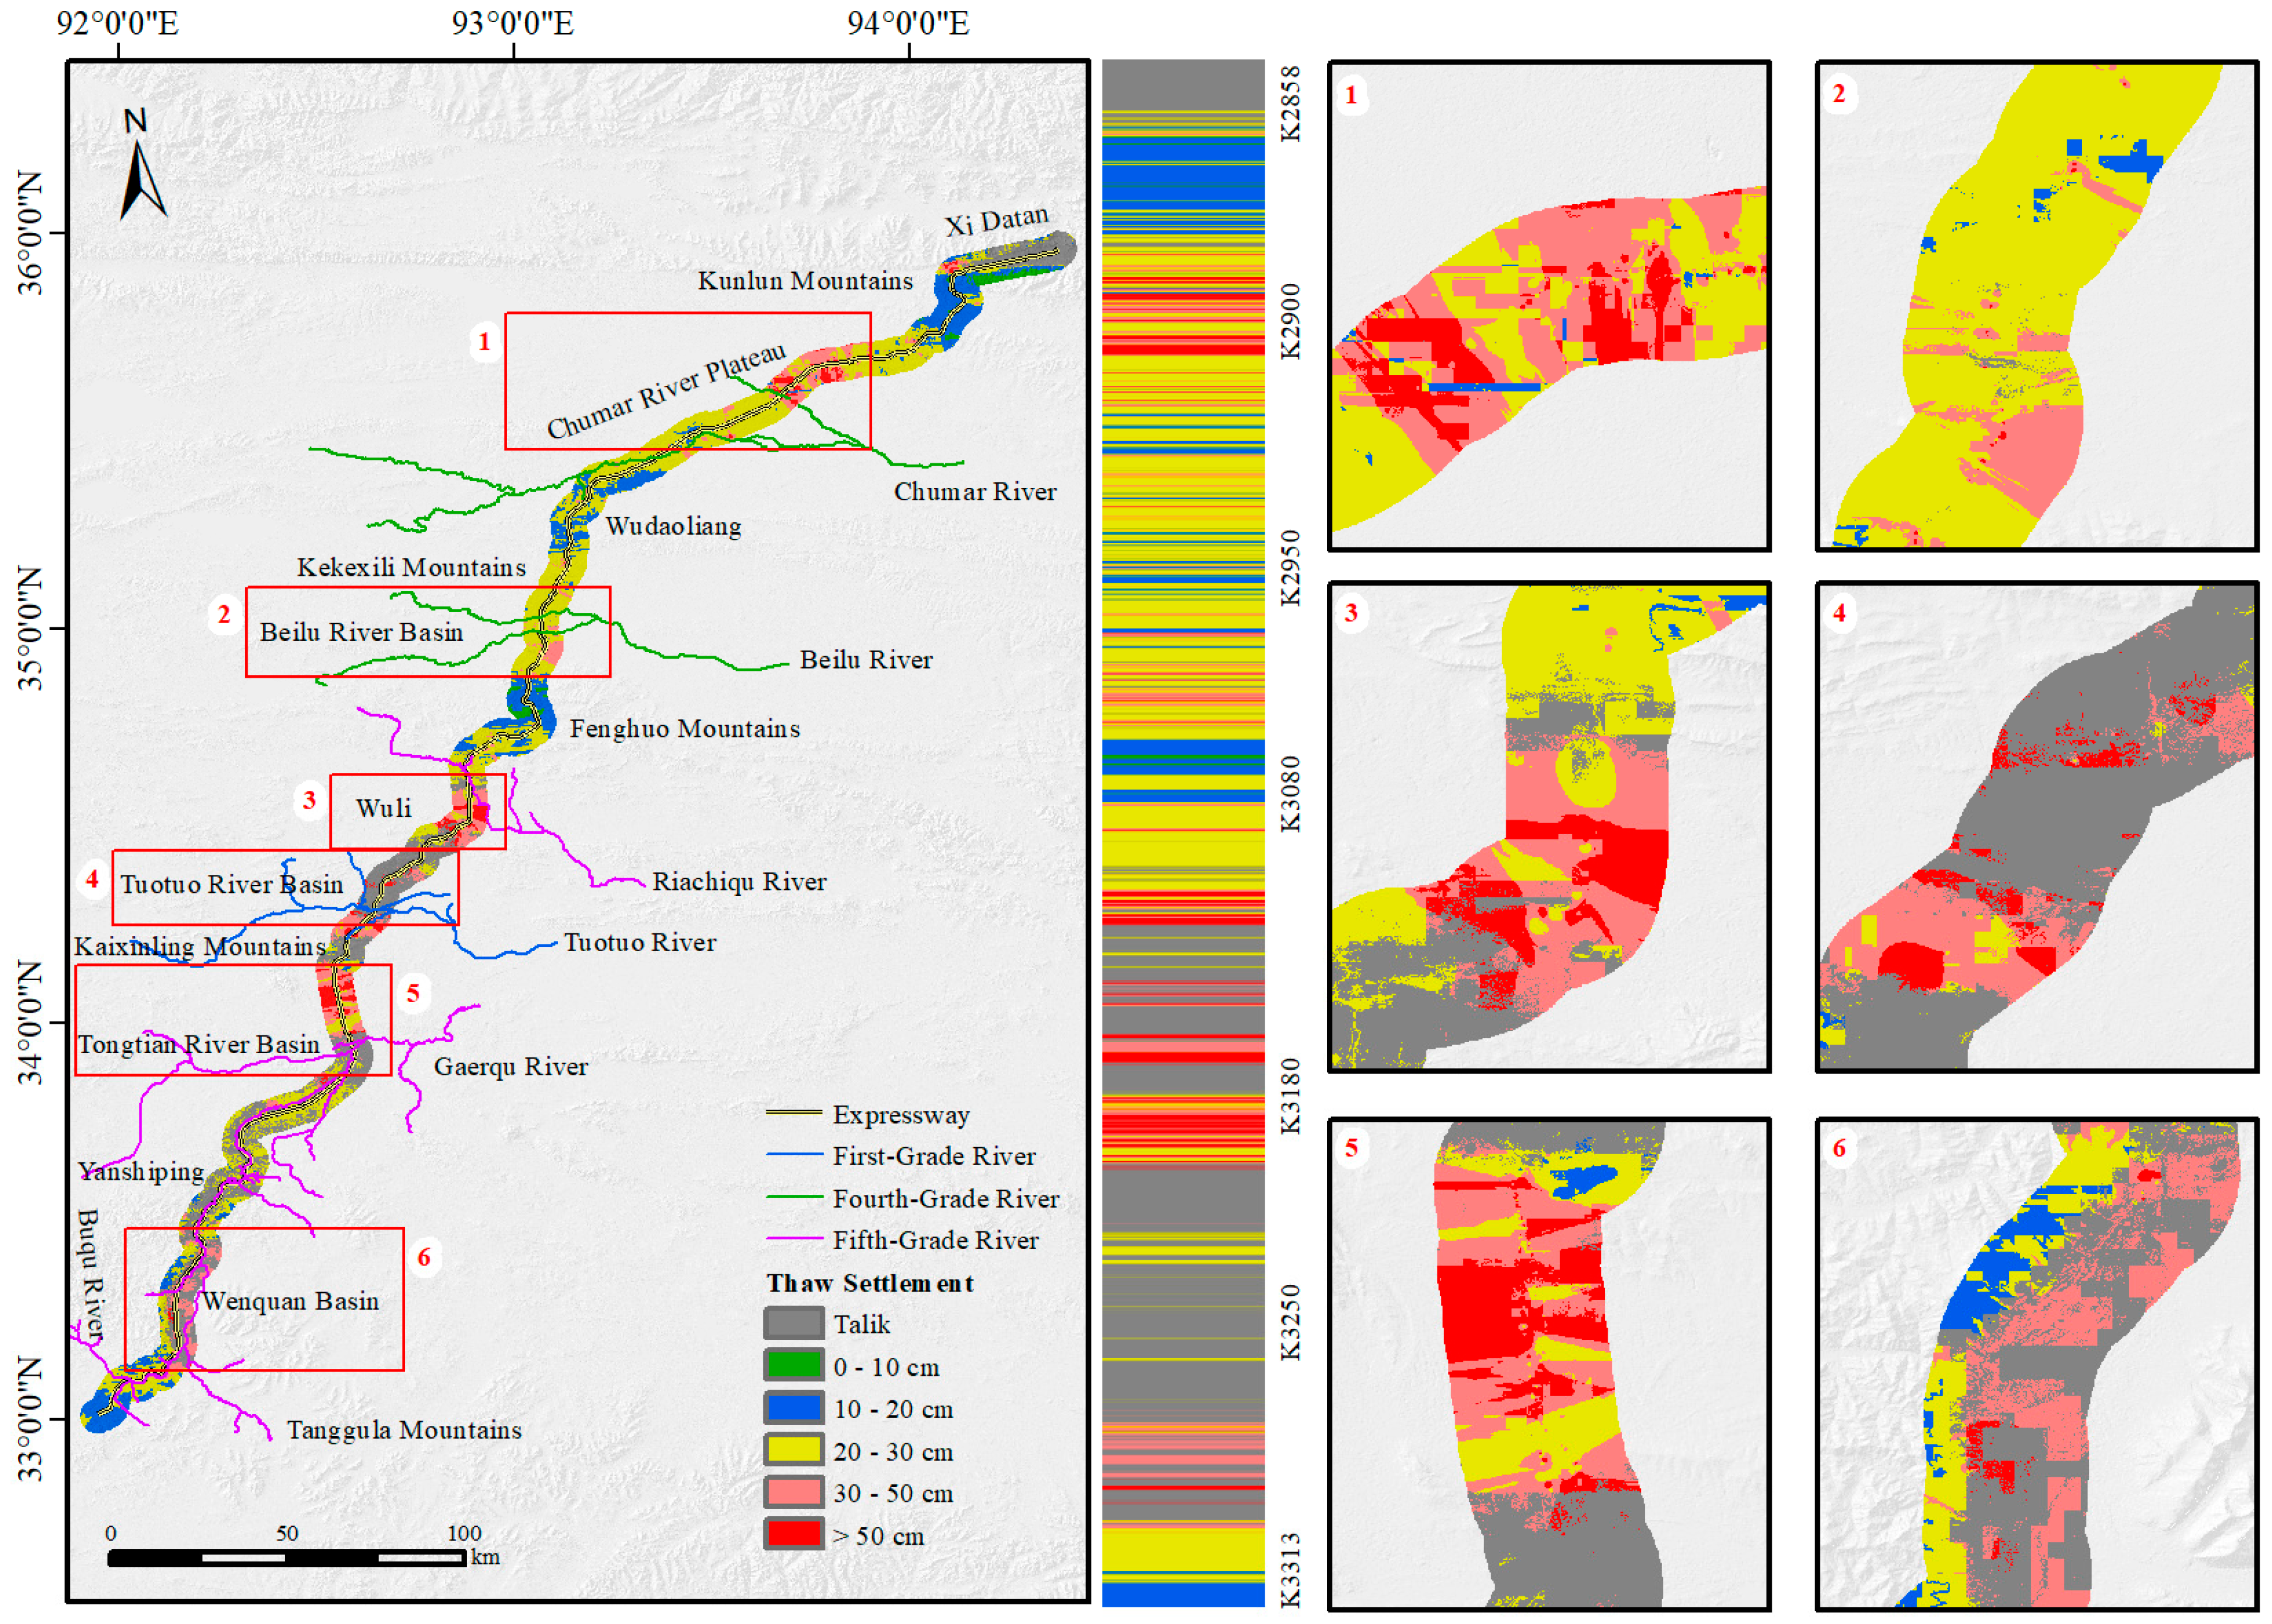
In this study, the discrete values of Thaw Settlement predicted based on feature variables (MAGT, ICT, aspect, and MTD) were imported into the ArcGIS platform (version 10.8.1). Using the point-to-raster tool, a zoning map of thaw settlement with a spatial resolution of 30 m was generated, as shown in Figure 9.
Figure 9.
Zoning Map of Thaw Settlement of Subgrades in the Study Area.
The spatial distribution characteristics of the Thaw Settlement of subgrades in the study area are as follows (Figure 9): The settlement ranges from 8.53 to 65.56 cm. Talik areas are mainly concentrated in Xidatan, Wuli, the Tuotuo River Basin, Tongtian River Basin, Yanshiping, and Wenquan Basin. Level I settlement zones demonstrate localized distribution patterns, primarily occurring in the Kunlun Mountains and Fenghuo Mountains. Level II settlement zones are predominantly distributed across the Kunlun Mountains, Wudaoliang, Fenghuo Mountains, and Tanggula Mountains. Level III settlement zones are extensively distributed throughout the Chumar River Plateau, Wudaoliang, Kekexili Mountains, Beilu River Basin, Fenghuo Mountains, Tongtian River Basin, Yanshiping, and Tanggula Mountains. Level IV settlement regions show limited distribution, mainly concentrated in the Chumar River Plateau, Beilu River Basin, Wuli, Tuotuo River Basin, and Wenquan Basin. Level V thaw settlement areas exhibit the most restricted and concentrated distribution pattern, primarily occurring in the Chumar River Plateau, Wuli, Tuotuo River Basin, and Tongtian River Basin.
3.1.2. Distribution Characteristics of Thaw Settlement Levels
- (1)
- Area Distribution Characteristics of Thaw Settlement Levels
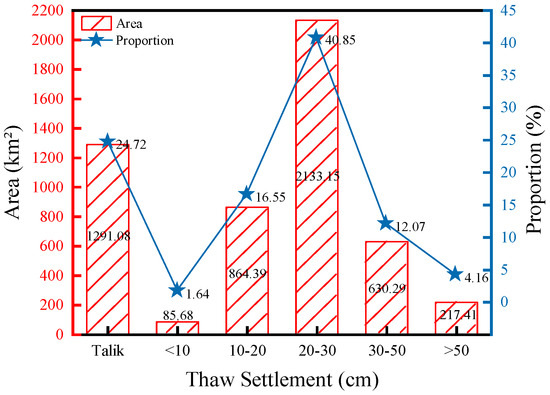
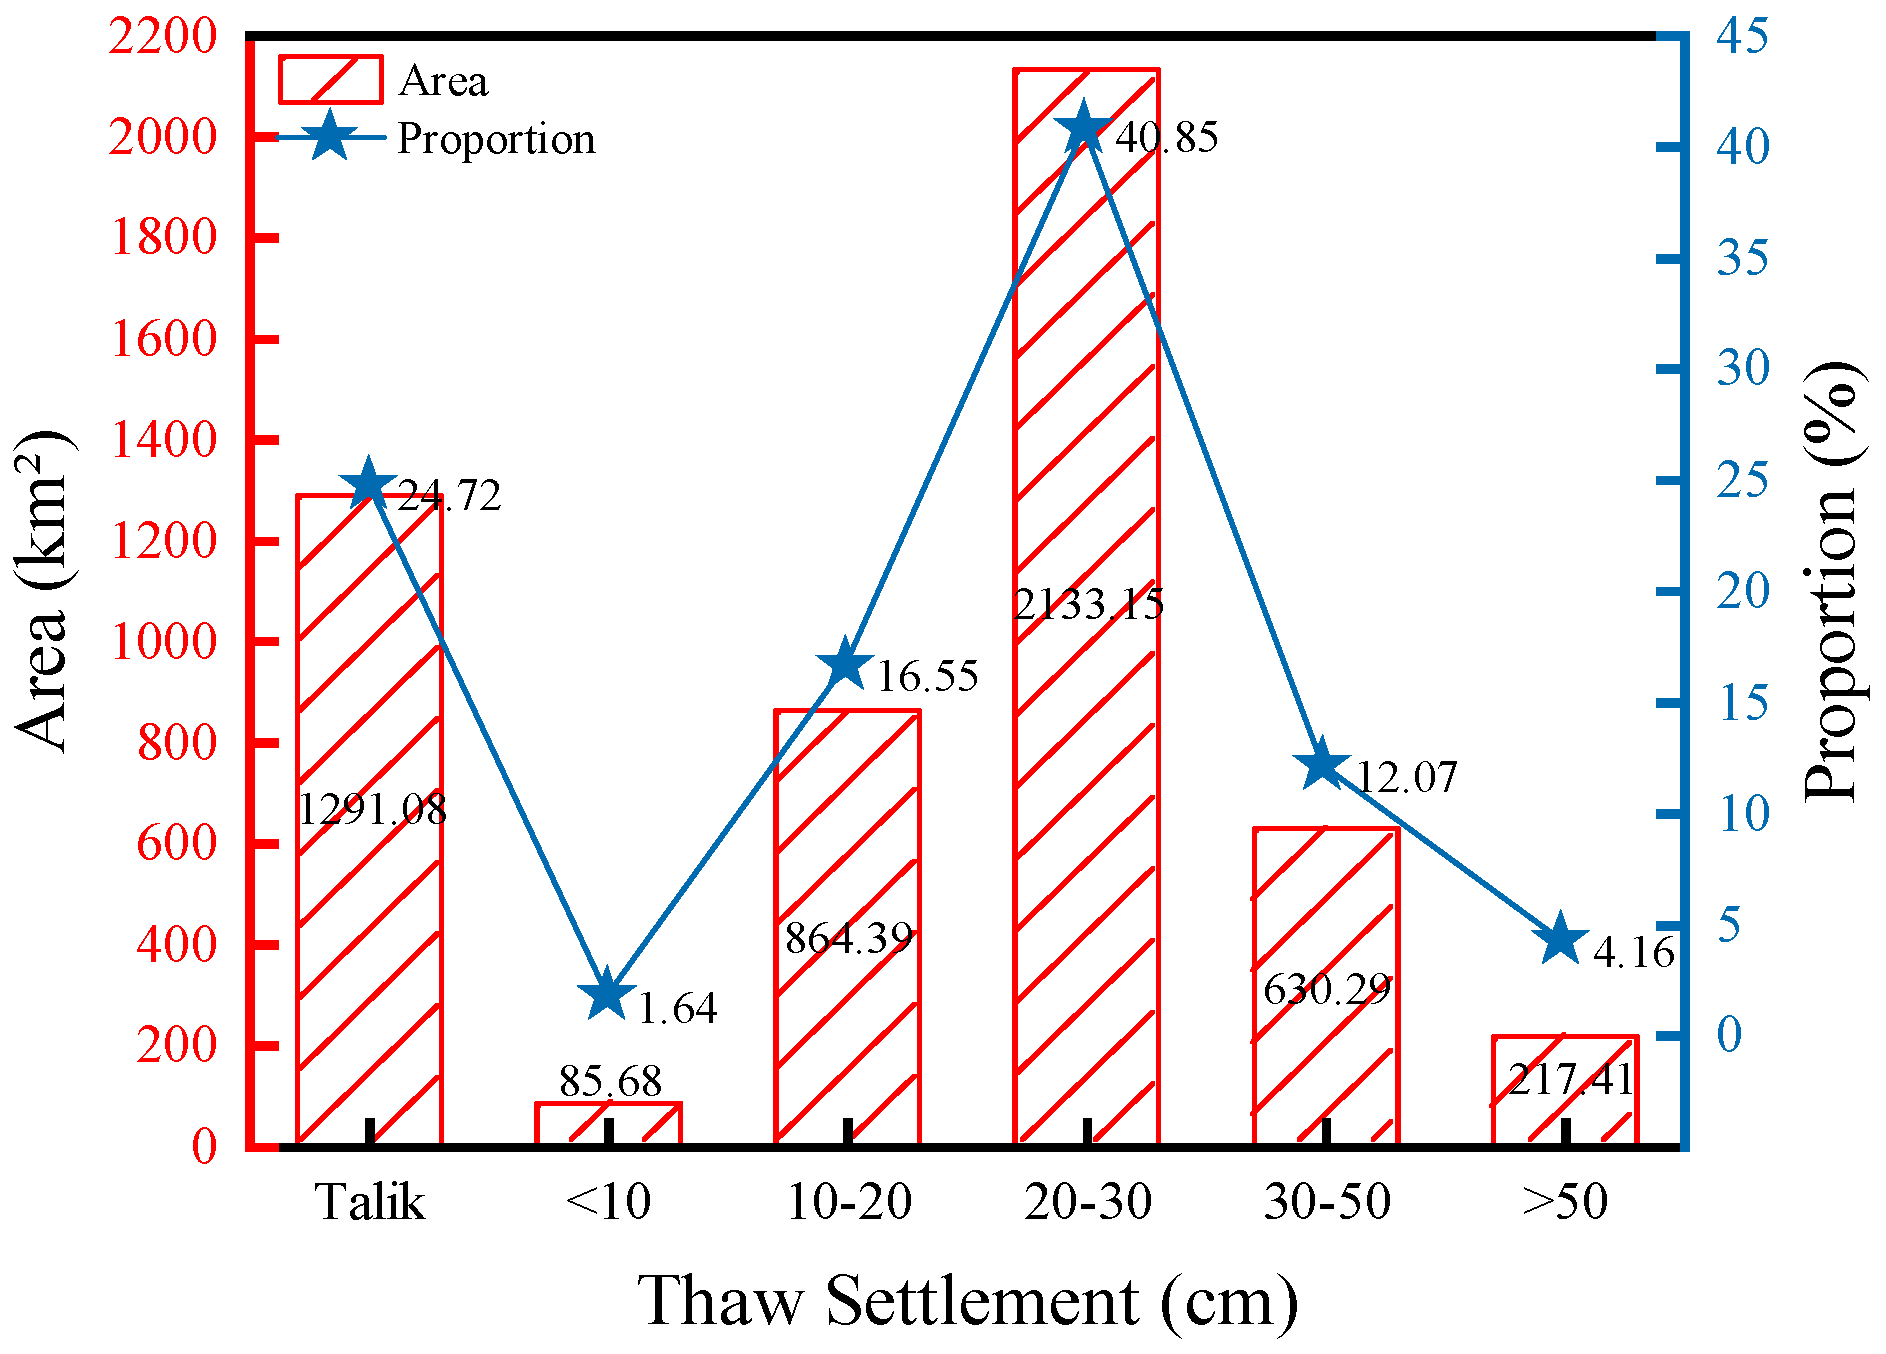
To further elucidate the spatial distribution of thaw settlement within the corridor, we compiled area statistics for each settlement grade, the results are shown in Figure 10.
Figure 10.
Quantitative Area Distribution of Subgrade Thaw Settlement Levels in the Study Area.
Within the total study area of 5222 km2, talik areas cover 1291.08 km2, accounting for 24.72% of the total area and constituting the main freeze–thaw transition zone. Level I thaw settlement areas cover 85.68 km2, representing 1.64% of the total area; Level II settlement areas extend over 864.39 km2, comprising 16.55%; Level III settlement areas encompass 2133.15 km2, accounting for 40.85%; Level IV settlement areas cover 630.29 km2, making up 12.07%; and Level V settlement areas occupy 217.41 km2, representing 4.16%.
Further analysis reveals that high-temperature, high-ice-content permafrost contributes most significantly to thaw settlement. The relevant statistics for Level IV and V settlement are presented in Table 4.
Table 4.
Statistics of Permafrost Occurrence Conditions for high thaw settlement levels.
- (2)
- Distribution Characteristics of Thaw Settlement Levels along the Route
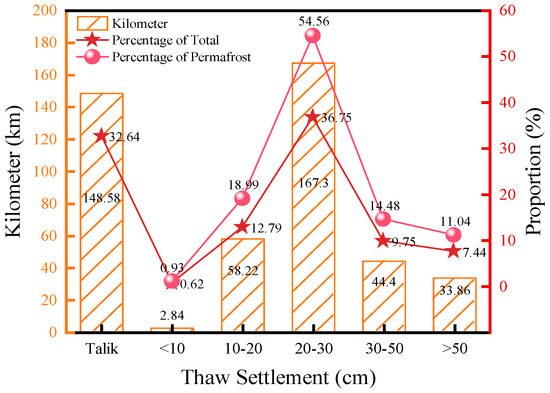
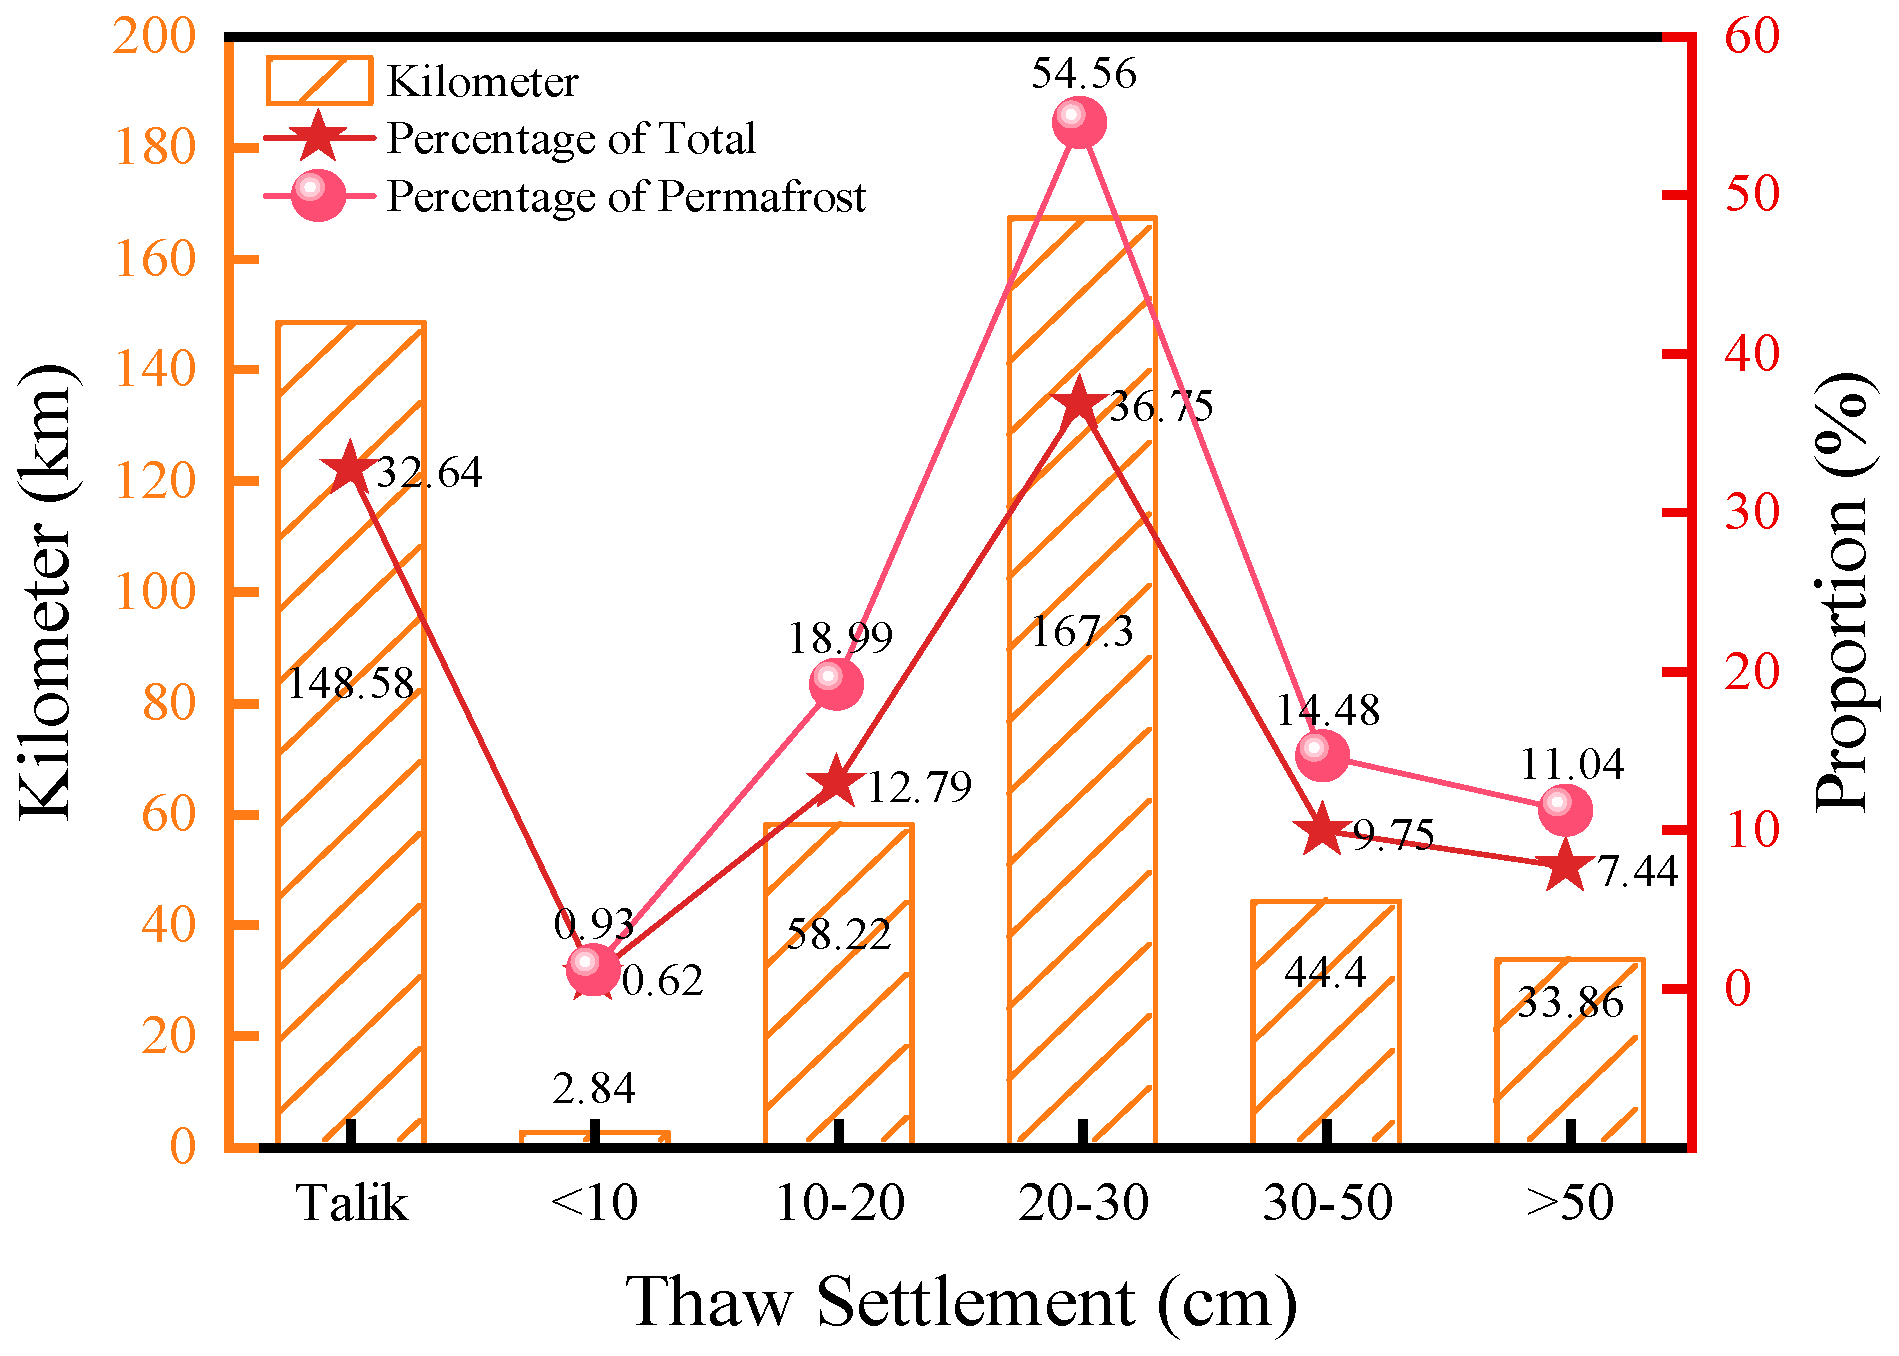
To systematically reveal the distribution patterns of permafrost thaw settlement along the highway, a statistical analysis of the lengths of sections with different thaw settlement grades was conducted, as illustrated in Figure 11.
Figure 11.
Distribution of Thaw Settlement along the Route.
Statistical results indicate a total route length of 455.2 km. Talik sections extend 148.58 km, accounting for 32.64% of the total length, while permafrost sections span 306.62 km. The distribution characteristics of thaw settlement levels are detailed as follows:
- Level I thaw settlement sections measure 2.84 km in length, representing 0.62% of the total route length and comprising 0.93% of the permafrost sections.
- Level II thaw settlement sections extend 58.22 km, accounting for 12.79% of the total length and 18.99% of the permafrost sections.
- Level III thaw settlement sections cover 167.3 km, constituting 36.75% of the total length and 54.56% of the permafrost sections.
- Level IV thaw settlement sections span 44.4 km, representing 9.75% of the total length and 14.48% of the permafrost sections.
- Level V thaw settlement sections measure 33.86 km, accounting for 7.44% of the total length and 11.04% of the permafrost sections.
3.2. Distribution Characteristics of Thaw Settlement
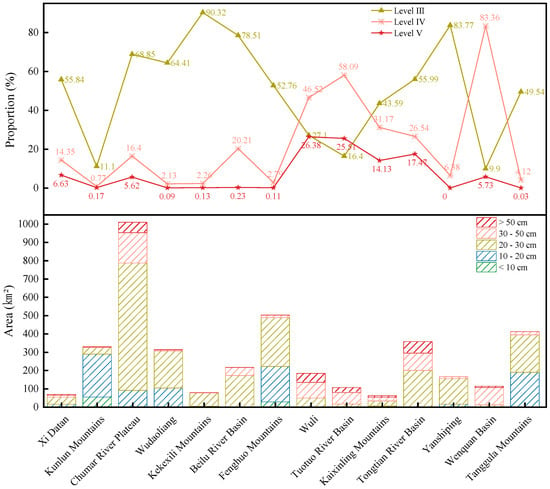
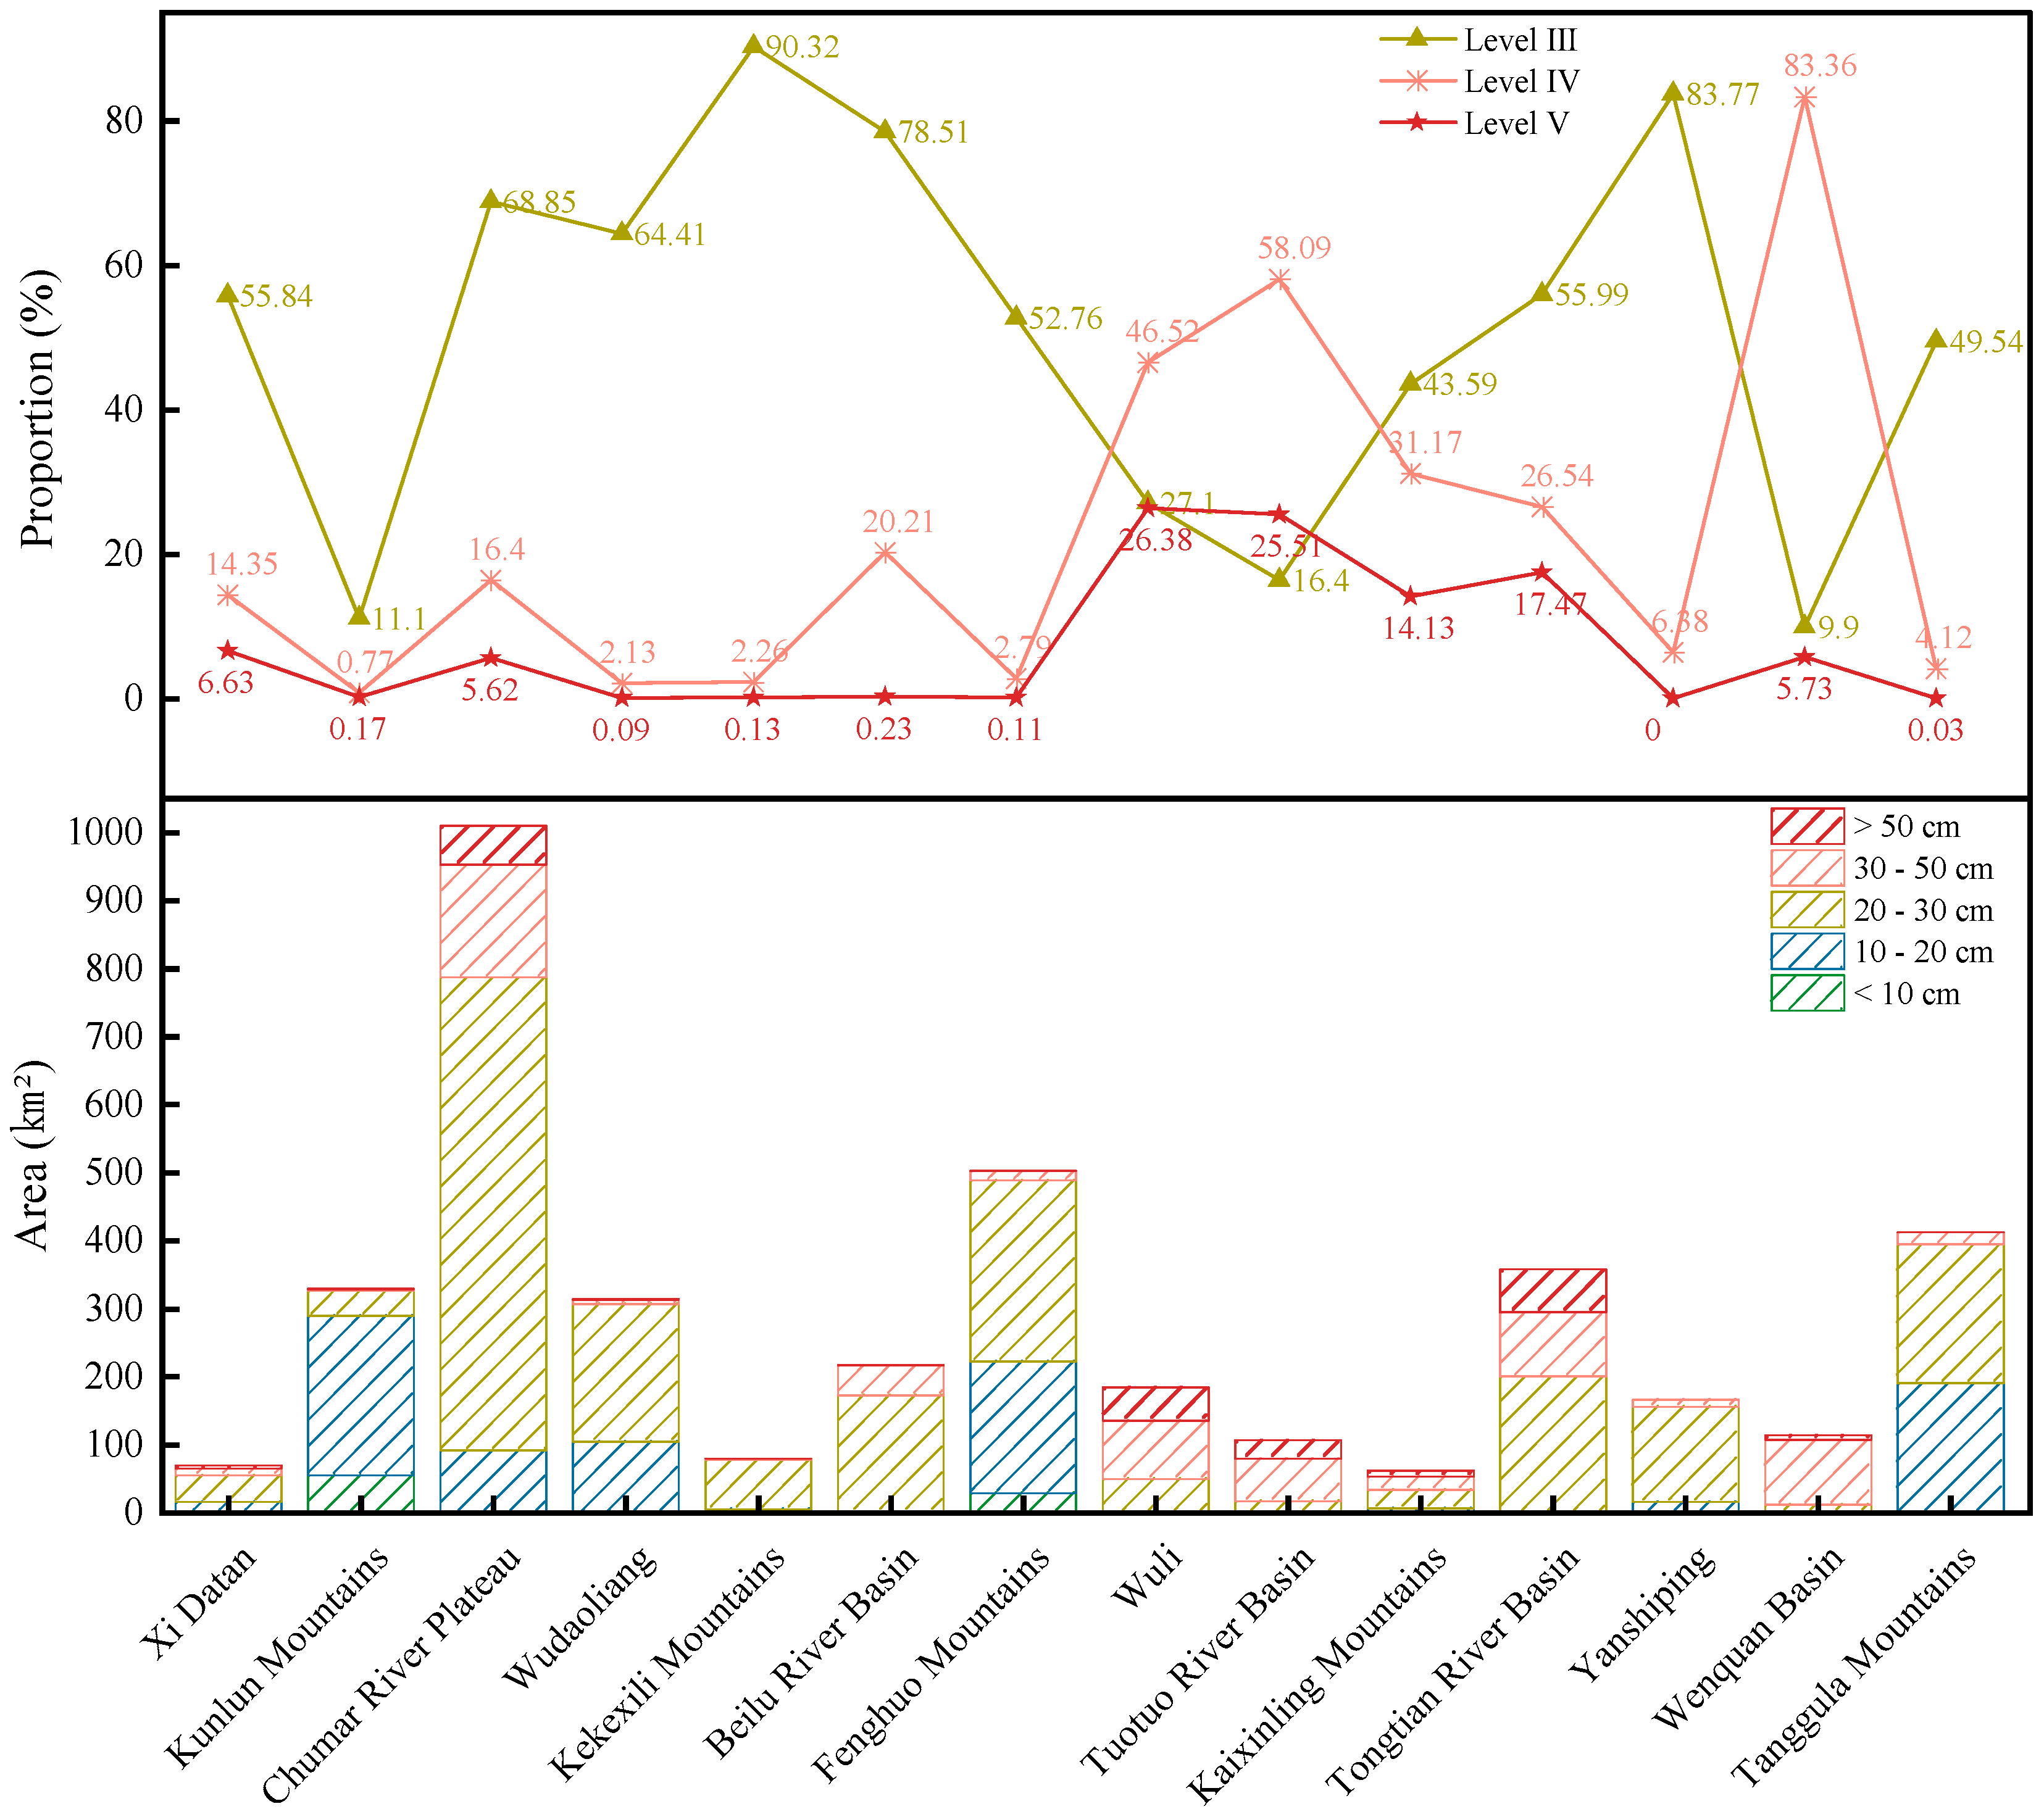
To further investigate the spatial differentiation patterns of thaw settlement, 14 typical geographical subdivisions spanning the entire region were systematically analyzed. After excluding talik areas, the resulting distribution characteristics across these subdivisions are illustrated in Figure 12, with the detailed analysis as follows:
Figure 12.
Distribution Characteristics of Thaw Settlement of the Study Area.
The study area demonstrates distinct spatial differentiation in thaw settlement grade distribution. Overall, Level I thaw settlement shows extremely limited distribution, occurring only sporadically in specific areas such as the Kunlun Mountains and Fenghuo Mountains. Level II settlement exhibits relatively higher proportions in subdivisions including the Kunlun Mountains, Tanggula Mountains, and Fenghuo Mountains. Level III settlement represents the most widespread category across the study area, accounting for over 78% of areas such as Kekexili, Yanshiping, and Beilu River Basin. Level IV settlement is concentrated in Wuli, Tuotuo River Basin, and Wenquan Basin, while Level V settlement primarily occurs in Wuli, Tuotuo River Basin, Tongtian River Basin, and Yanshiping.
Regarding the dominant settlement levels by subdivision, Xidatan is predominantly characterized by Level III settlement (55.84%); the Kunlun Mountains area is mainly composed of Level II settlement (71.09%); Chumar River Plateau is dominated by Level III settlement (68.85%), with areas exceeding 30 cm of settlement collectively accounting for 22.02%; Wudaoliang, Kekexili, Beilu River Basin, and Yanshiping all show Level III settlement as the primary category, each exceeding 64%; the Fenghuo Mountains area is mainly characterized by Level II (38.53%) and Level III settlement (52.76%); Wuli and Tuotuo River Basin are predominantly composed of high-level settlement (Level IV and V) exceeding 30 cm, with combined proportions of 72.90% and 83.60%, respectively; Kaixinling is mainly Level III settlement (43.59%), with relatively dispersed distribution across categories; the Tongtian River Basin is primarily Level III settlement (55.99%), with areas exceeding 30 cm settlement collectively comprising 44.01%; the Wenquan Basin is dominated by Level IV settlement (83.36%); and the Tanggula Mountains area is mainly characterized by Level II (46.30%) and Level III settlement (49.54%).
Based on the dominant settlement characteristics, the subdivisions can be categorized into three structural types: regions predominantly with Level II settlement, including the Kunlun Mountains and the Tanggula Mountains; regions predominantly with Level III settlement, covering Xidatan, Chumar River Plateau, Wudaoliang, Kekexili, the Beilu River Basin, the Fenghuo Mountains, Kaixinling, the Tongtian River Basin, and Yanshiping; and regions predominantly with high-level settlement (Level IV and V), including Wuli, the Tuotuo River Basin, and the Wenquan Basin.
4. Discussion
4.1. Factor Importance Analysis
4.1.1. SHAP-Based Analysis of Feature Contributions
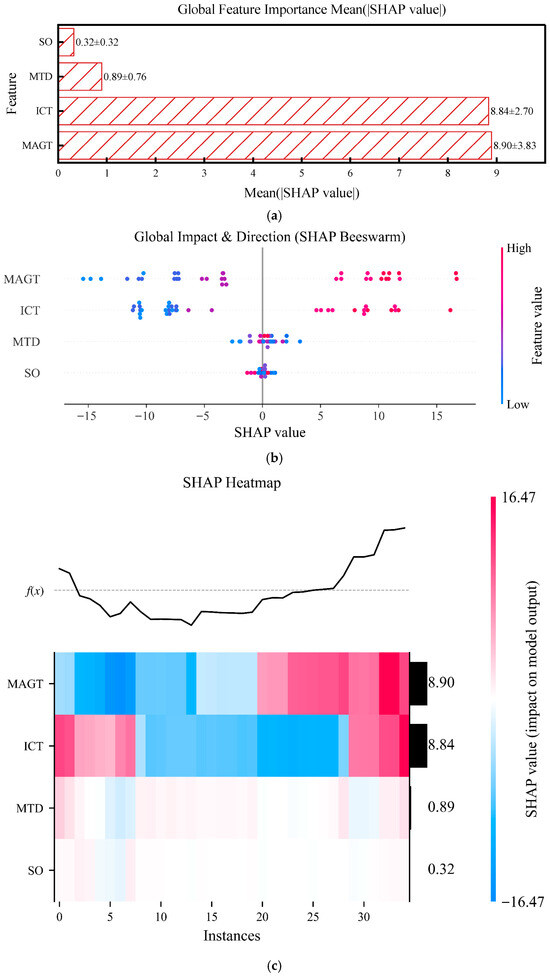
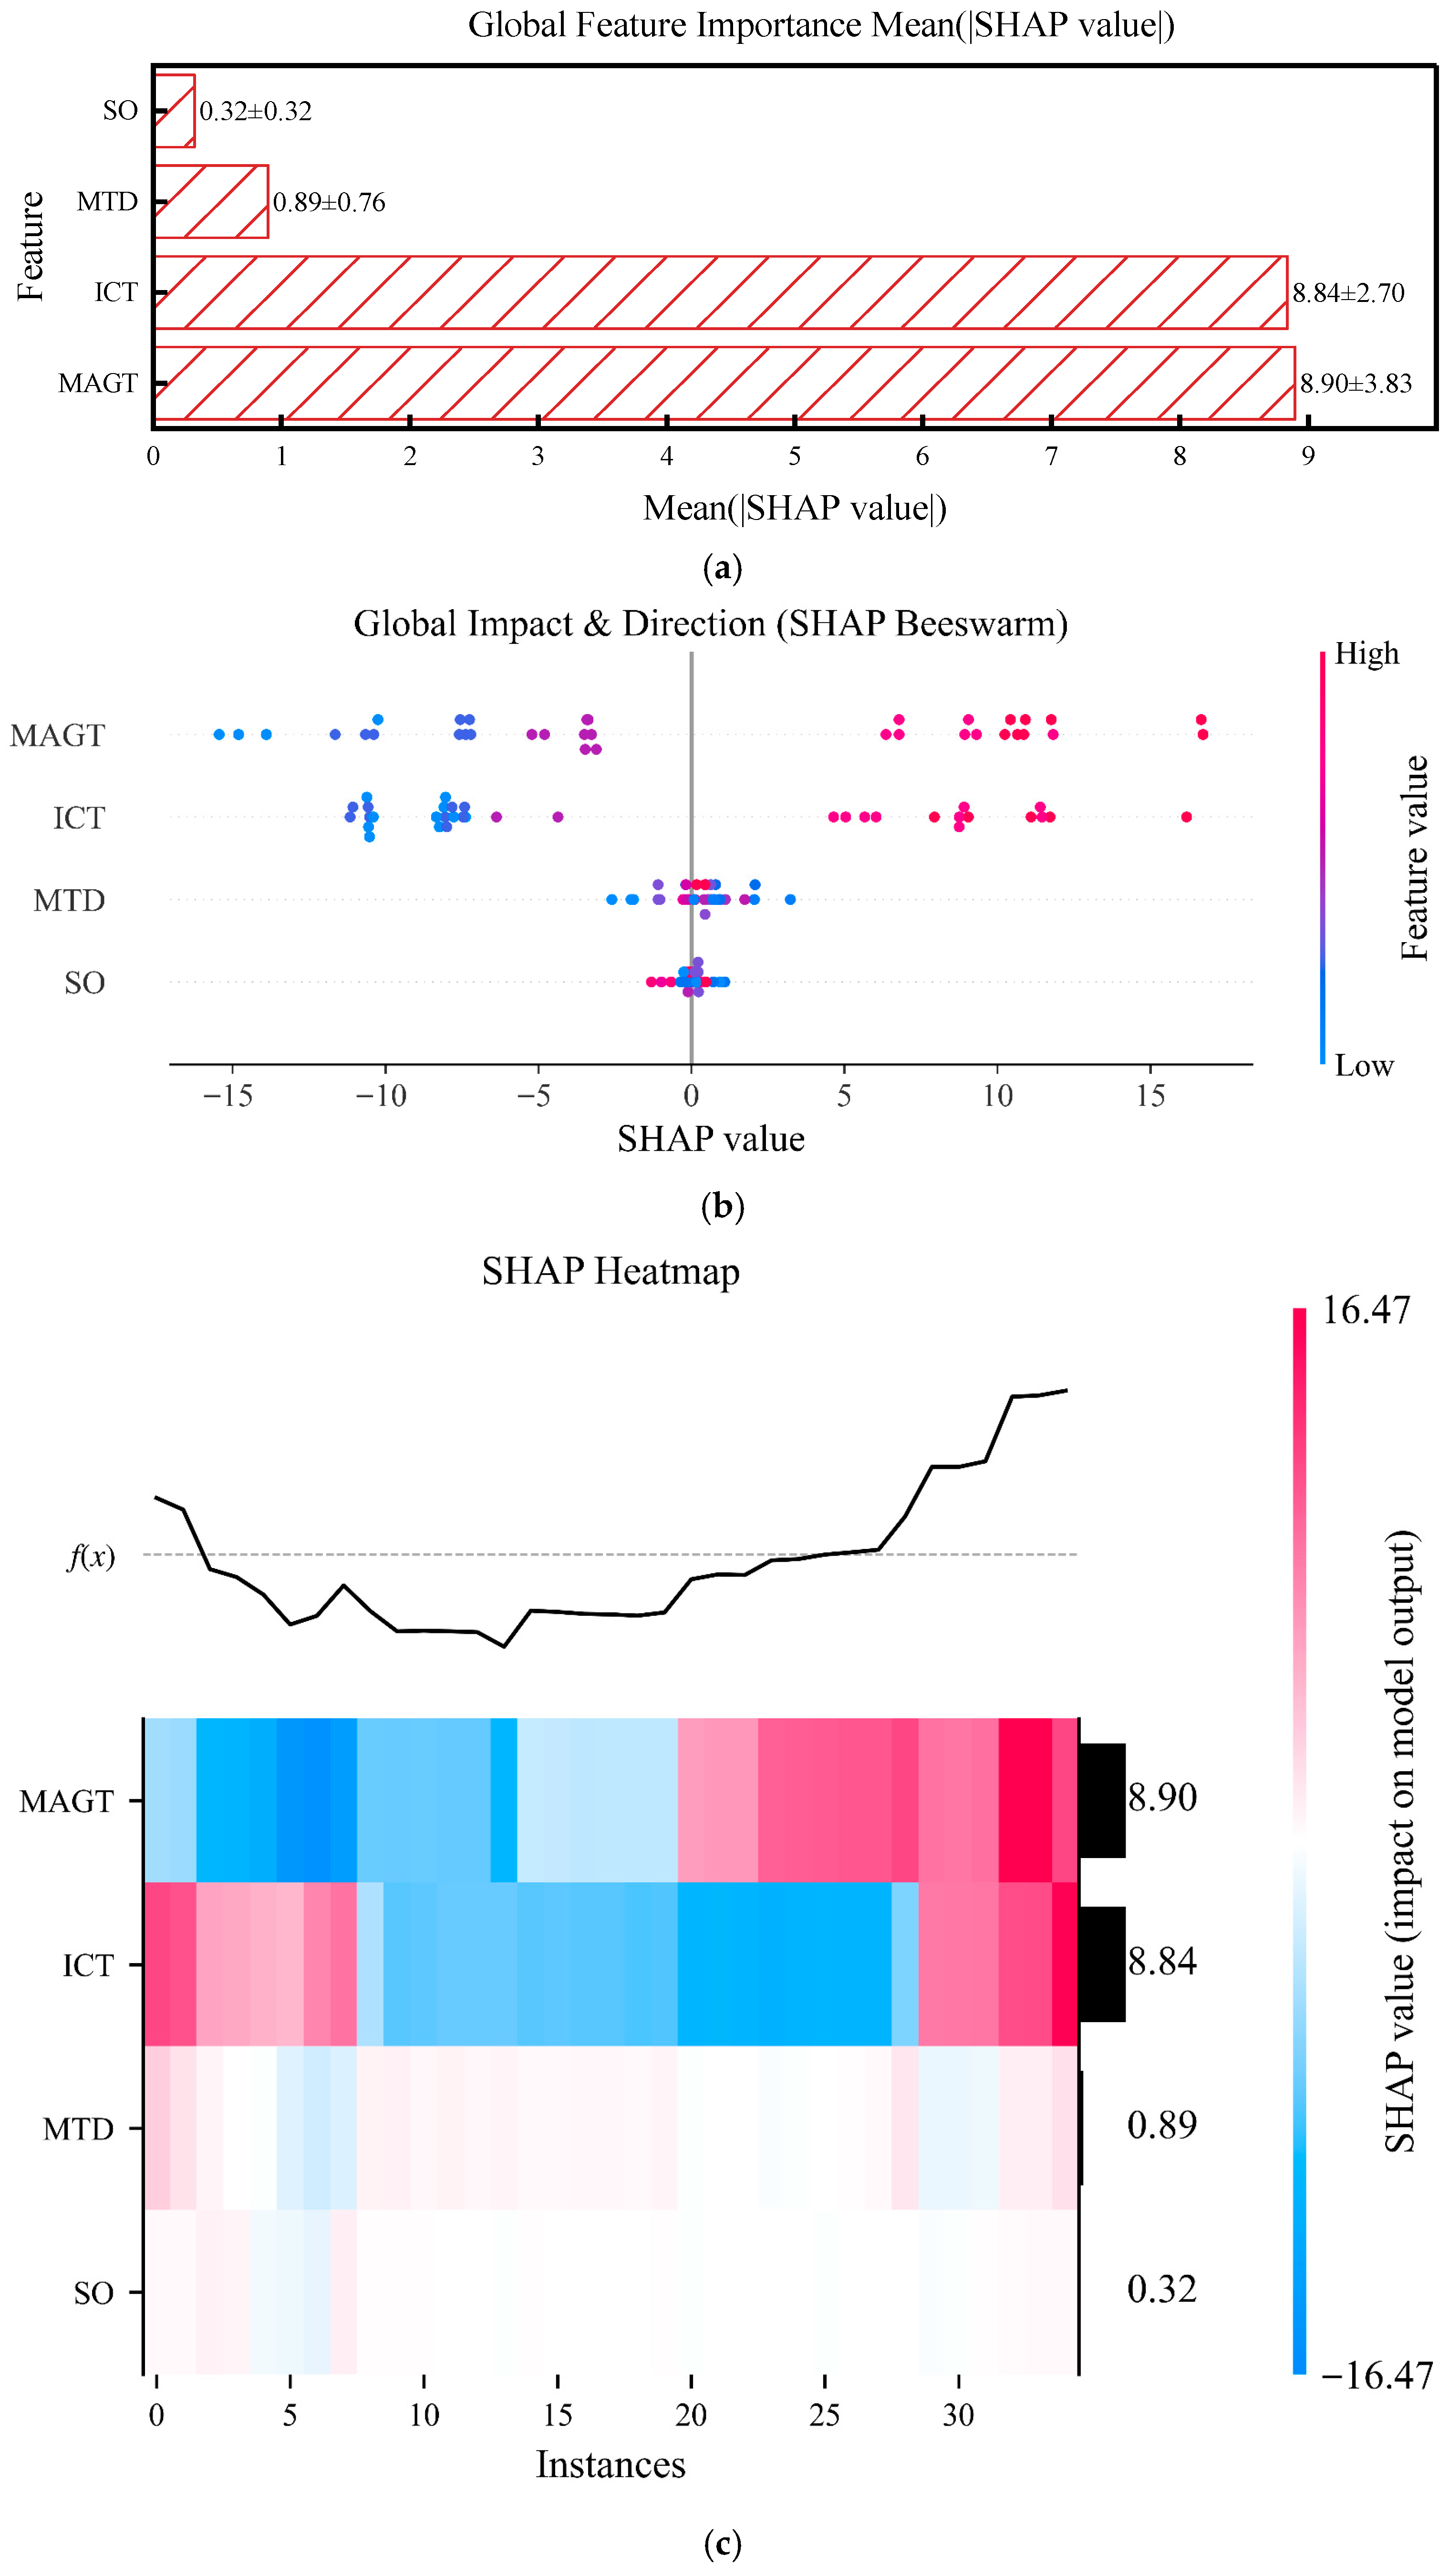
To quantitatively characterize the influence of environmental and engineering factors on subgrade thaw settlement, this study applied SHAP interpretation to the trained random forest model, yielding three complementary types of visualizations (Figure 13). These correspond to the global importance ranking of features, the direction and threshold characteristics of their influences, and the distribution of contributions at the sample scale.
Figure 13.
SHAP analysis results: (a) SHAP-based global feature importance bar chart; (b) SHAP-based feature contribution beeswarm plot; (c) SHAP-based feature contribution heatmap.
Based on the SHAP interpretability analysis, the study identified key driving factors influencing permafrost thaw settlement and their contribution levels. As shown in Figure 13a, the MAGT (SHAP value: 8.90 ± 3.83) and ICT (8.84 ± 2.70) are the two dominant factors contributing most significantly to the model output, with their importance substantially exceeding that of the MTD (0.89 ± 0.76) and SO (0.32 ± 0.32). Figure 13b further reveals the directional effects of the features: higher values of MAGT and ICT (shown in red) generally produce positive SHAP values, indicating they significantly increase the predicted thaw settlement; conversely, lower values (shown in blue) exert negative influences. Figure 13c, from the perspective of sample heterogeneity, confirms that MAGT and ICT are stable and dominant contributors across the vast majority of samples, whereas MTD and SO, despite their overall minor impact, still hold certain local importance.
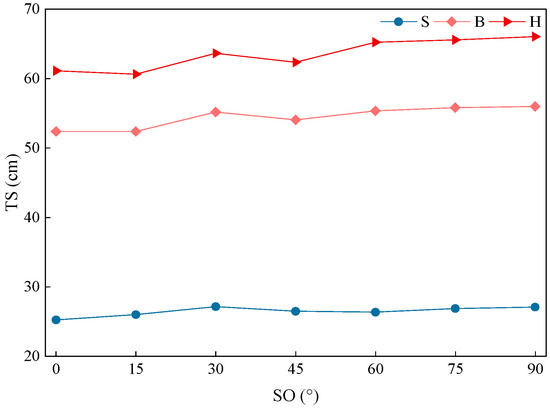
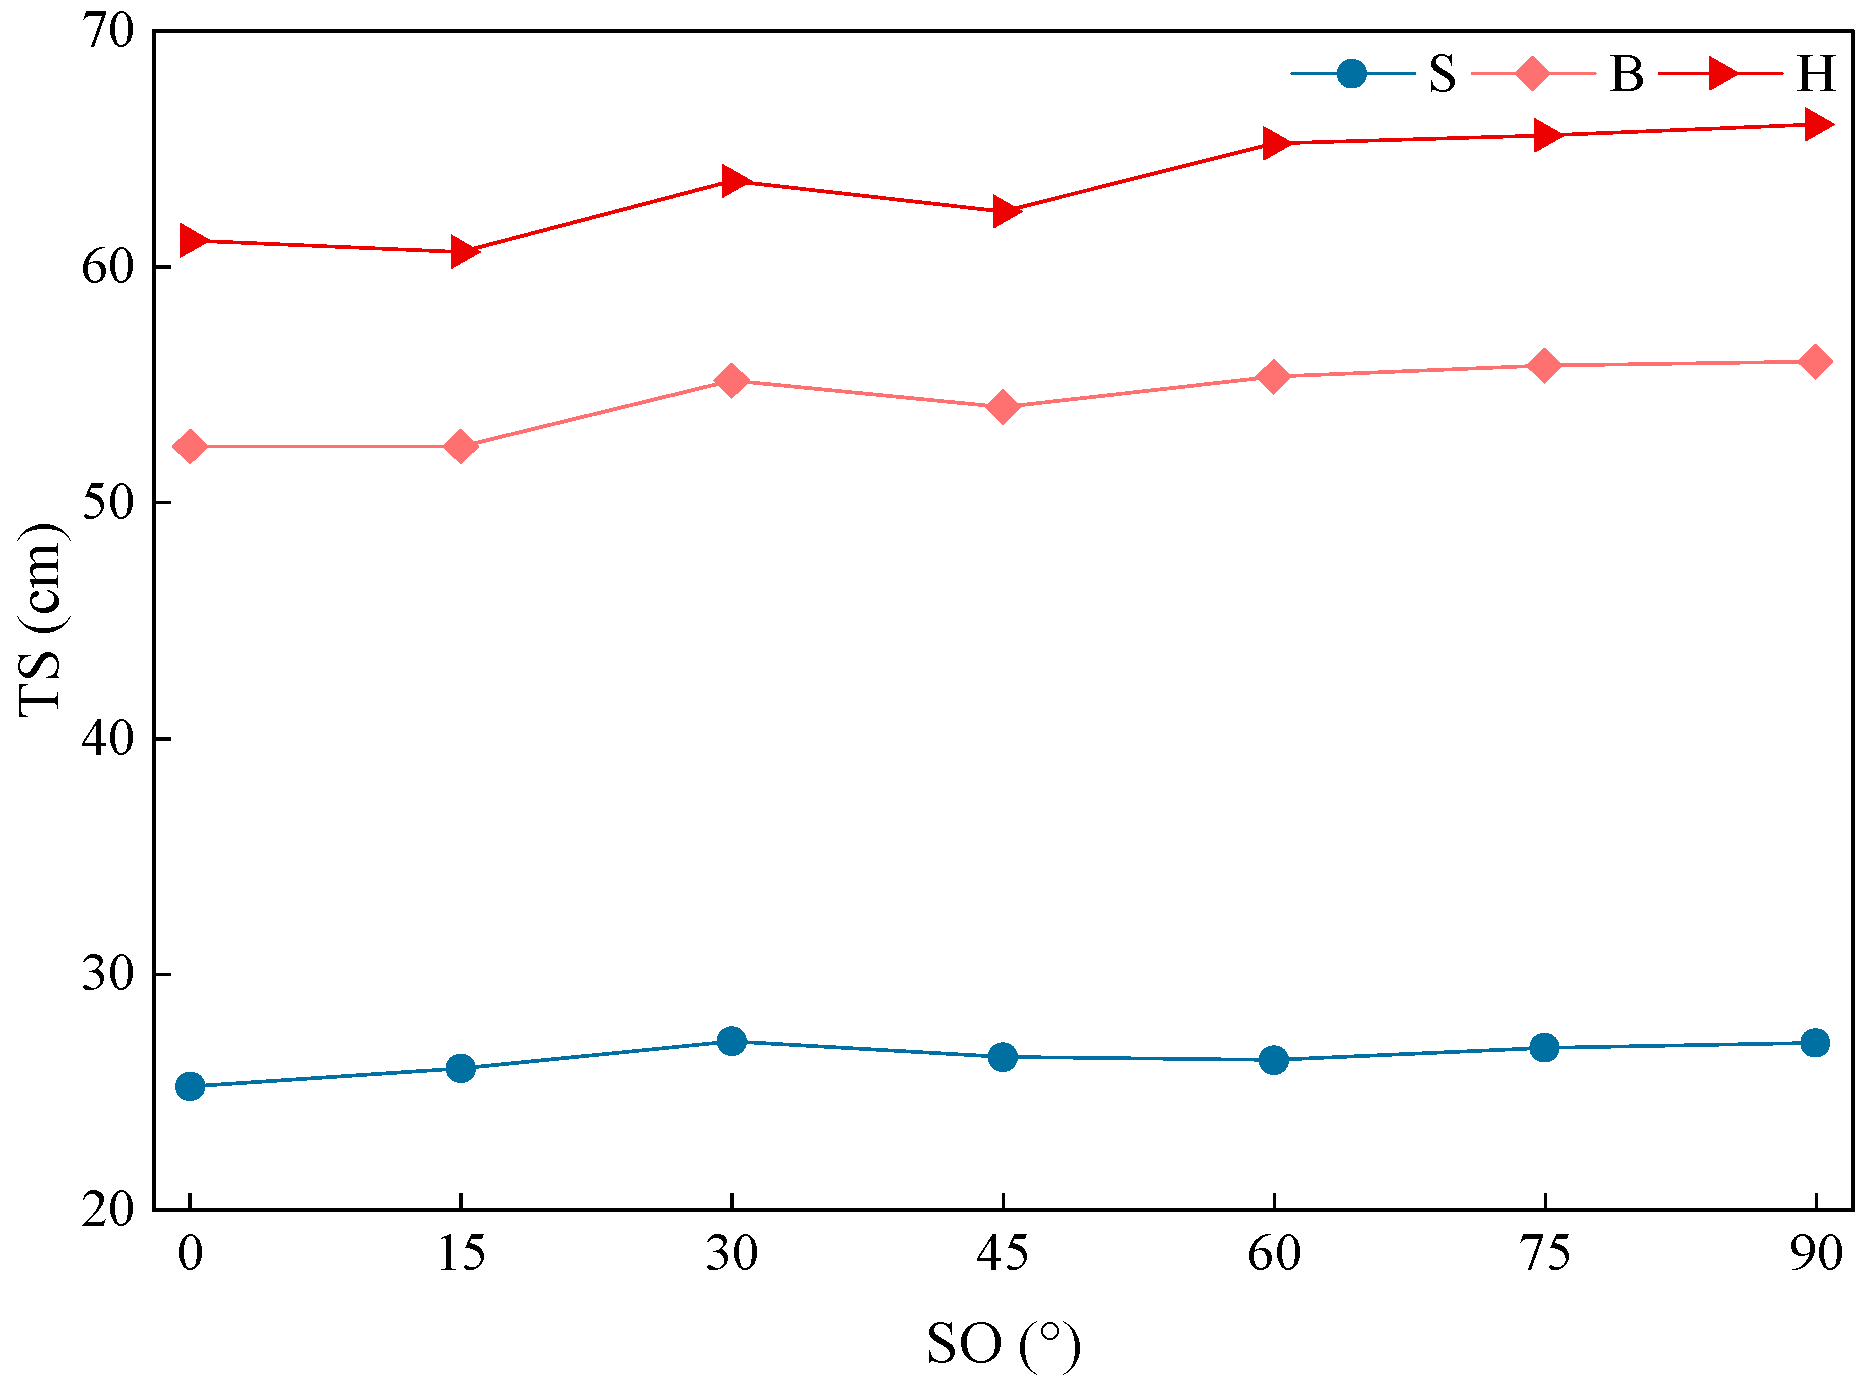
To further quantify the impact of the engineering factor SO, we analyzed representative numerical scenarios under the condition of MAGT = −0.5 °C, as shown in Figure 14.
Figure 14.
Relationship between TS and SO at MAGT = −0.5 °C for different ICT.
The results indicate that TS remains stable across orientations from 0° to 90°. For ICT-H, TS fluctuates between 60.63 cm and 66.05 cm as the orientation varies, with a maximum deviation of only 5.42 cm. In contrast, at a fixed orientation (e.g., 90°), the transition from ICT-S to ICT-H conditions results in a TS increase of 38.98 cm. This comparison demonstrates that orientation-induced variation (approx. 8.2% of the total magnitude in this scenario) is marginal, providing numerical evidence for its classification as a secondary factor in the SHAP importance ranking.
In summary, the SHAP analysis quantitatively demonstrates that MAGT and ICT are the primary drivers controlling the spatial pattern of subgrade thaw settlement, while MTD and SO are secondary factors.
4.1.2. Mechanism Analysis of Dominant Factors
To clarify the primary control mechanisms of permafrost thaw settlement in each subdivision, standardized multiple linear regression was employed to quantitatively evaluate the relative contributions of MAGT and ICT to thaw settlement. The dominant controlling factors for each subdivision were identified by comparing the absolute values of the standardized regression coefficients. All models passed the significance test (p < 0.001), with the analysis results presented in Table 5.
Table 5.
Standardized multiple linear regression results and identification of dominant controlling factors across subdivisions.
The standardized multiple linear regression model is expressed as:
In the equation, β0 is the intercept, representing the baseline TS when all independent variables are at their mean values; β1 denotes the standardized coefficient of MAGT, where MAGT* denotes the standardized MAGT; β2 represents the standardized coefficient of ICT, where ICT* denotes the standardized ICT. In this context, the absolute values of the standardized regression coefficients (|β1| and |β2|) are utilized to quantify the parameter gradient sensitivity. Because the predictors are standardized, the β coefficients directly represent the response magnitude of TS per unit standard-deviation change in MAGT or ICT, allowing for a dimensionless and objective comparison of their sensitivities. The dominant controlling factors for each subdivision were identified by comparing these absolute values.
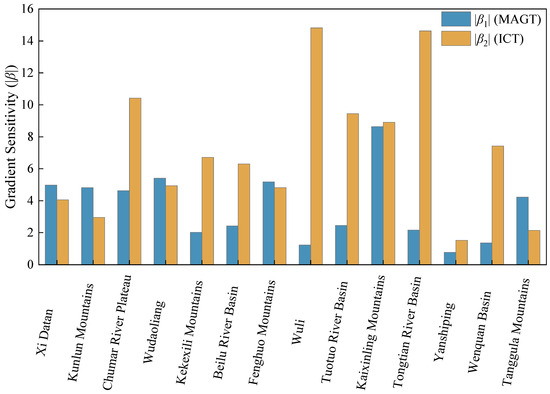
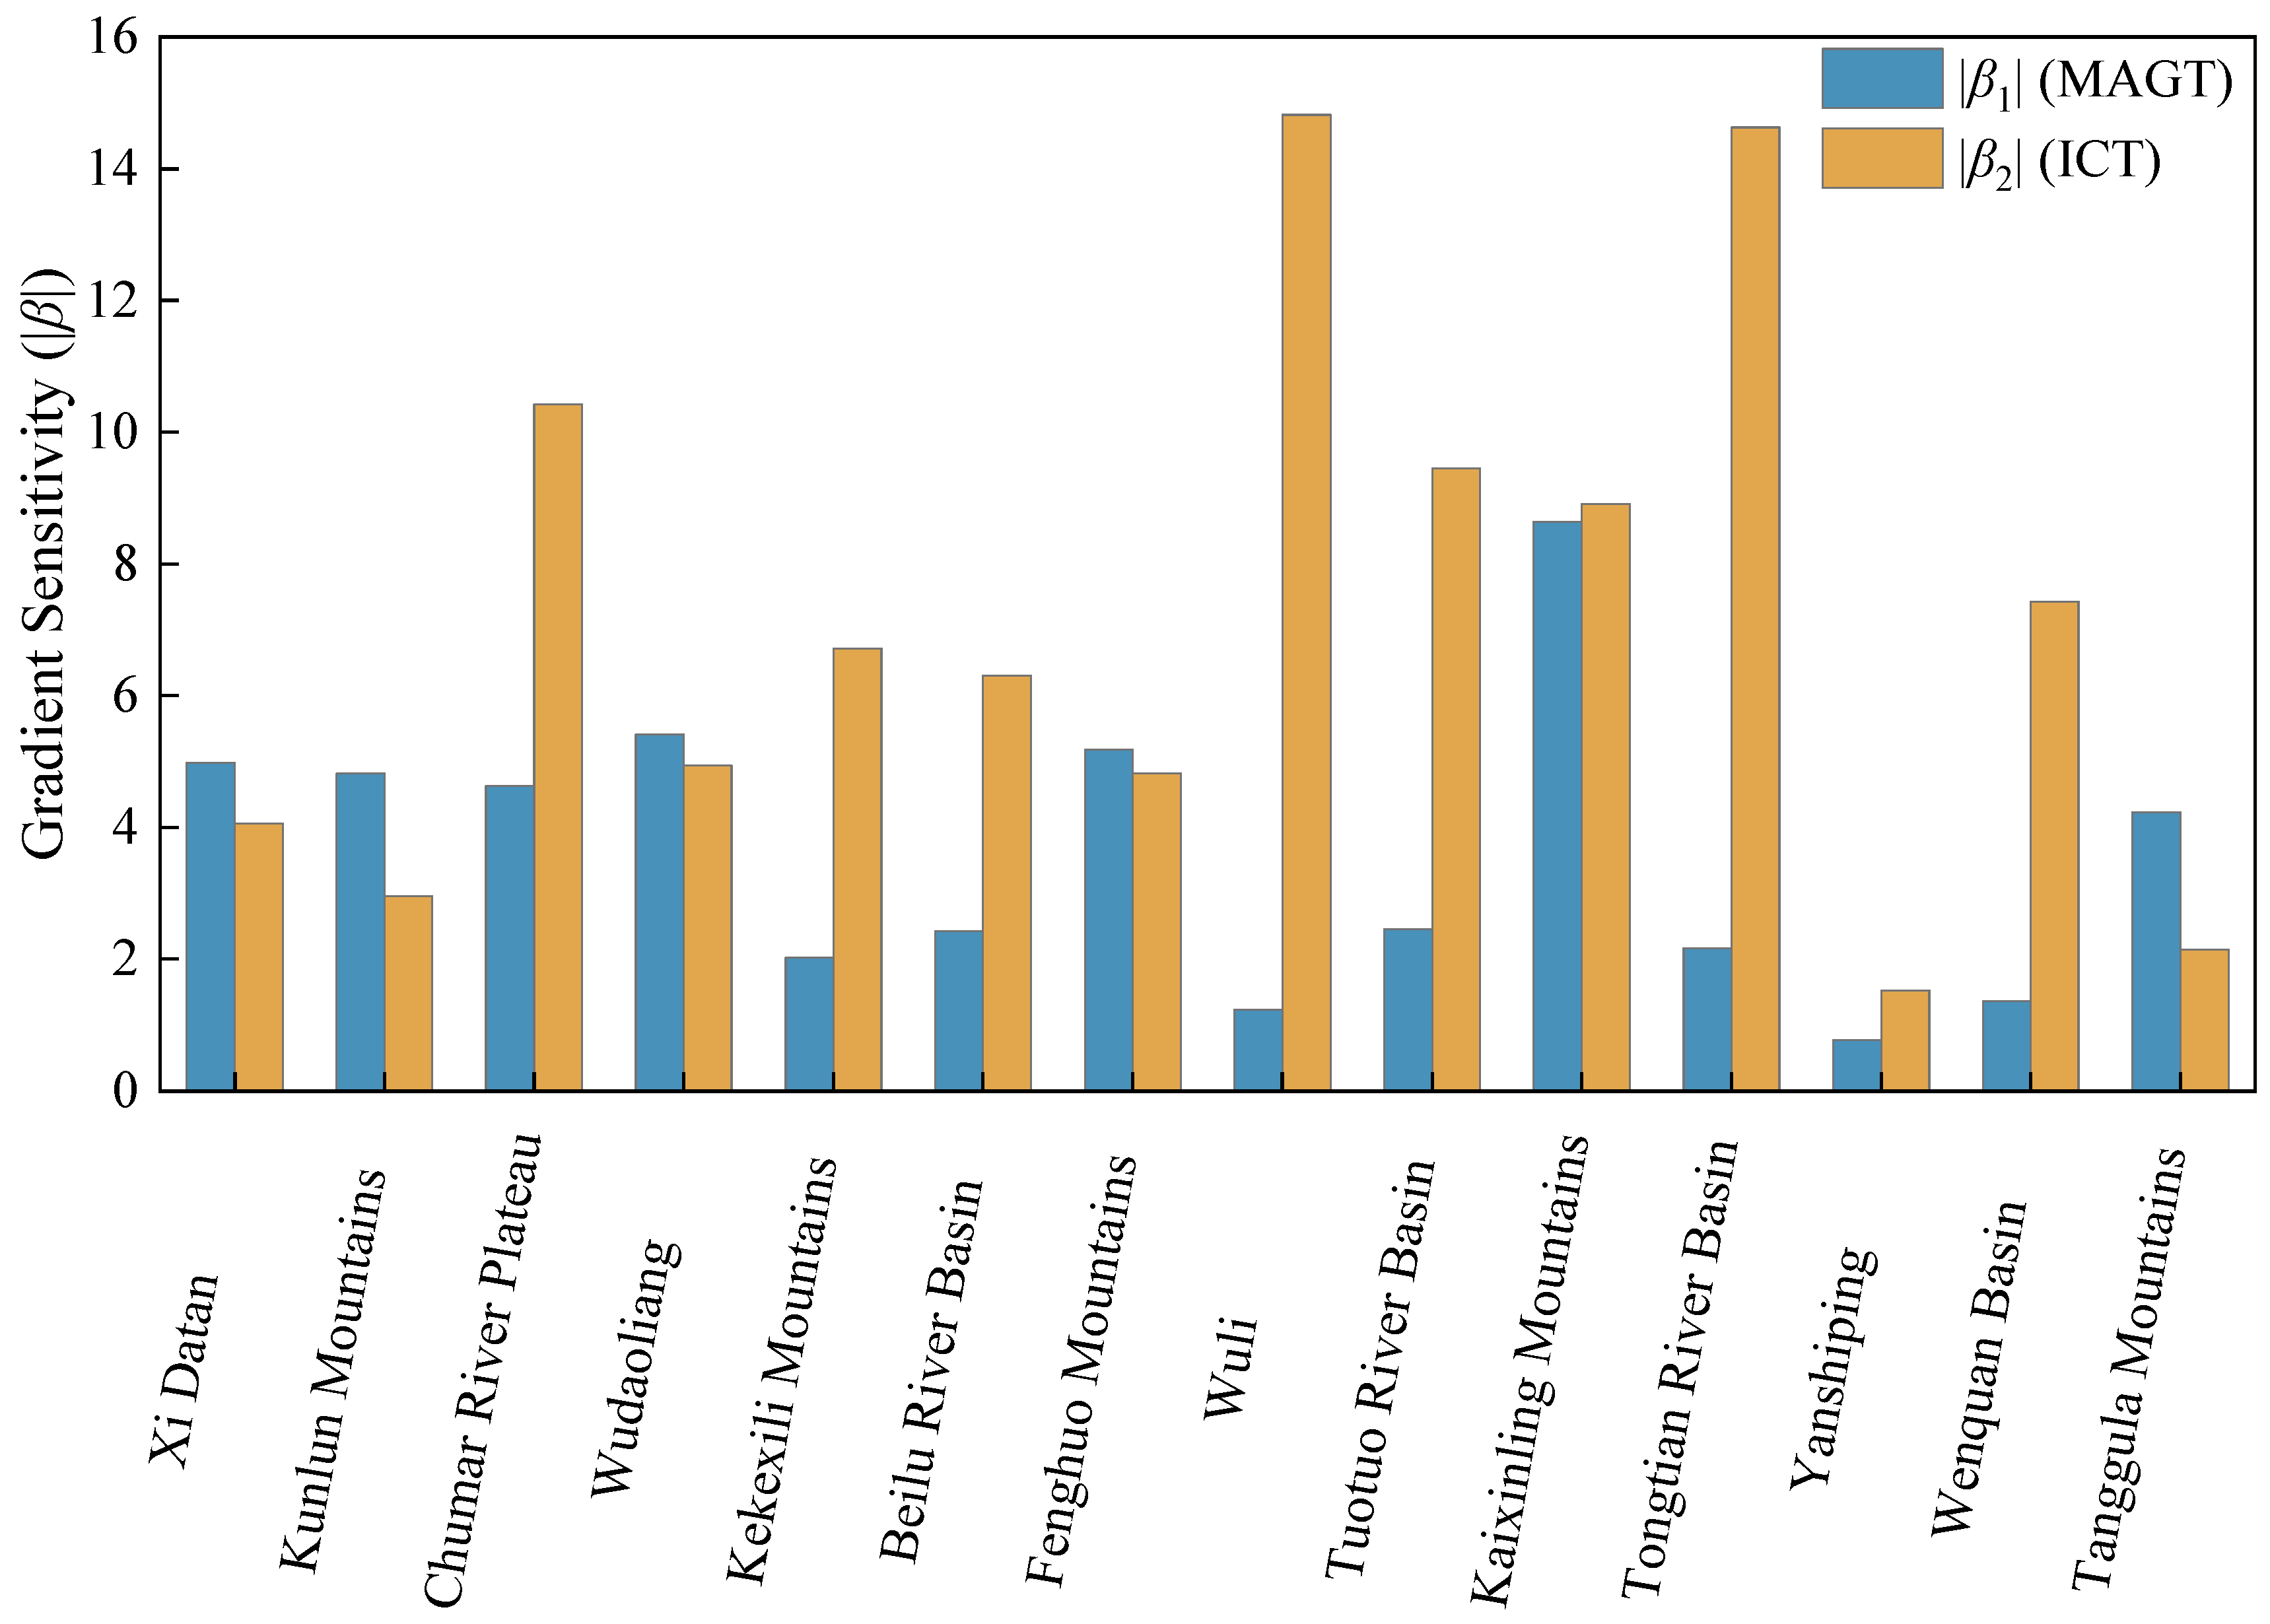
To intuitively illustrate the regional disparities in parameter gradient sensitivity, the absolute values of the standardized regression coefficients (|β1| and |β2|) from Table 5 are compared in Figure 15.
Figure 15.
Comparison of parameter gradient sensitivity (|β1| and |β2|) across 14 subdivisions.
Based on the quantitative analysis of dominant factors governing thaw settlement across the subdivisions, the following patterns are observed among the 14 geographical subdivisions: 7 subdivisions (50%) are dominated by ICT, and these regions generally exhibit higher thaw settlement magnitudes (26.76–43.31 cm); 5 subdivisions (35.71%) are under the joint control of MAGT and ICT; while only 2 subdivisions (14.29%) are dominated by MAGT, with relatively smaller thaw settlement values (16.23–24.19 cm).
The standardized regression coefficients (Figure 15) clearly indicate the spatial variation in gradient sensitivity. In ICT-dominated subdivisions, the gradient sensitivity to ICT is overwhelmingly dominant (|β2| is generally significantly greater than |β1|). Conversely, in MAGT-dominated subdivisions, TS is highly sensitive to the MAGT gradient (|β1| exceeds |β2|). For the joint-control type, the contributions of MAGT and ICT are comparable (i.e., the absolute difference between |β1| and |β2| is small), suggesting that both factors contribute similarly to settlement variability.
MAGT-dominated subdivisions are mainly distributed in low-temperature regions such as the Kunlun Mountains and Tanggula Mountains, where permafrost is relatively cold and thermally stable, and thaw settlement is primarily constrained by the long-term thermal state. In contrast, ICT-dominated subdivisions are primarily located in warm permafrost regions such as Wuli, the Tuotuo River Basin, and the Tongtian River Basin, where permafrost thermal stability is poor and close to the thawing threshold, making spatial variability in ground-ice conditions a decisive control on settlement magnitude. Meanwhile, subdivisions such as Xidatan, Wudaoliang, Fenghuo Mountains, Kaixinling, and Yanshiping are governed by the joint influence of MAGT and ICT, reflecting transitional permafrost conditions.
From a thermodynamic perspective, MAGT represents the long-term ground thermal state and determines how close permafrost is to the thawing threshold (0 °C), thereby controlling whether thawing can be initiated and how far the thawing front can migrate under a given climatic forcing. In colder, more stable permafrost regions, thawing is limited and settlement is therefore mainly constrained by temperature-related conditions, which explains the MAGT-dominated behavior. In warmer permafrost regions near 0 °C, thawing can be triggered more readily; once thawing occurs, the magnitude of thaw settlement becomes strongly dependent on the amount and spatial heterogeneity of excess ground ice, because melting of ice-rich layers and subsequent consolidation/structural collapse provide the primary source of volumetric loss. Joint control commonly emerges in transitional zones where MAGT governs thaw activation/thaw depth, whereas ICT governs settlement potential after thawing is activated. Additionally, in some subdivisions (e.g., the Chumar River Plateau), although MAGT is moderate, strong spatial heterogeneity in ICT can still lead to ICT-dominated behavior.
Global warming may lead to an increase in MAGT in low-temperature zones (such as the Kunlun Mountains and Tanggula Mountains), and the dominant controlling factor may gradually shift from MAGT to ICT in the future, which requires long-term monitoring and verification.
4.2. Correlation Between Remote Sensing Factors and Thaw Settlement
Because estimating MAGT and MTD requires complex coupled inversions with substantial uncertainty, we adopt two cost-effective and interpretable approaches—Mutual Information (MI) and Pearson correlation—to systematically assess the association between remote-sensing predictors and thaw settlement.
- (1)
- Pearson correlation
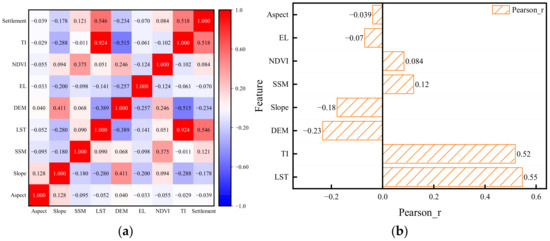
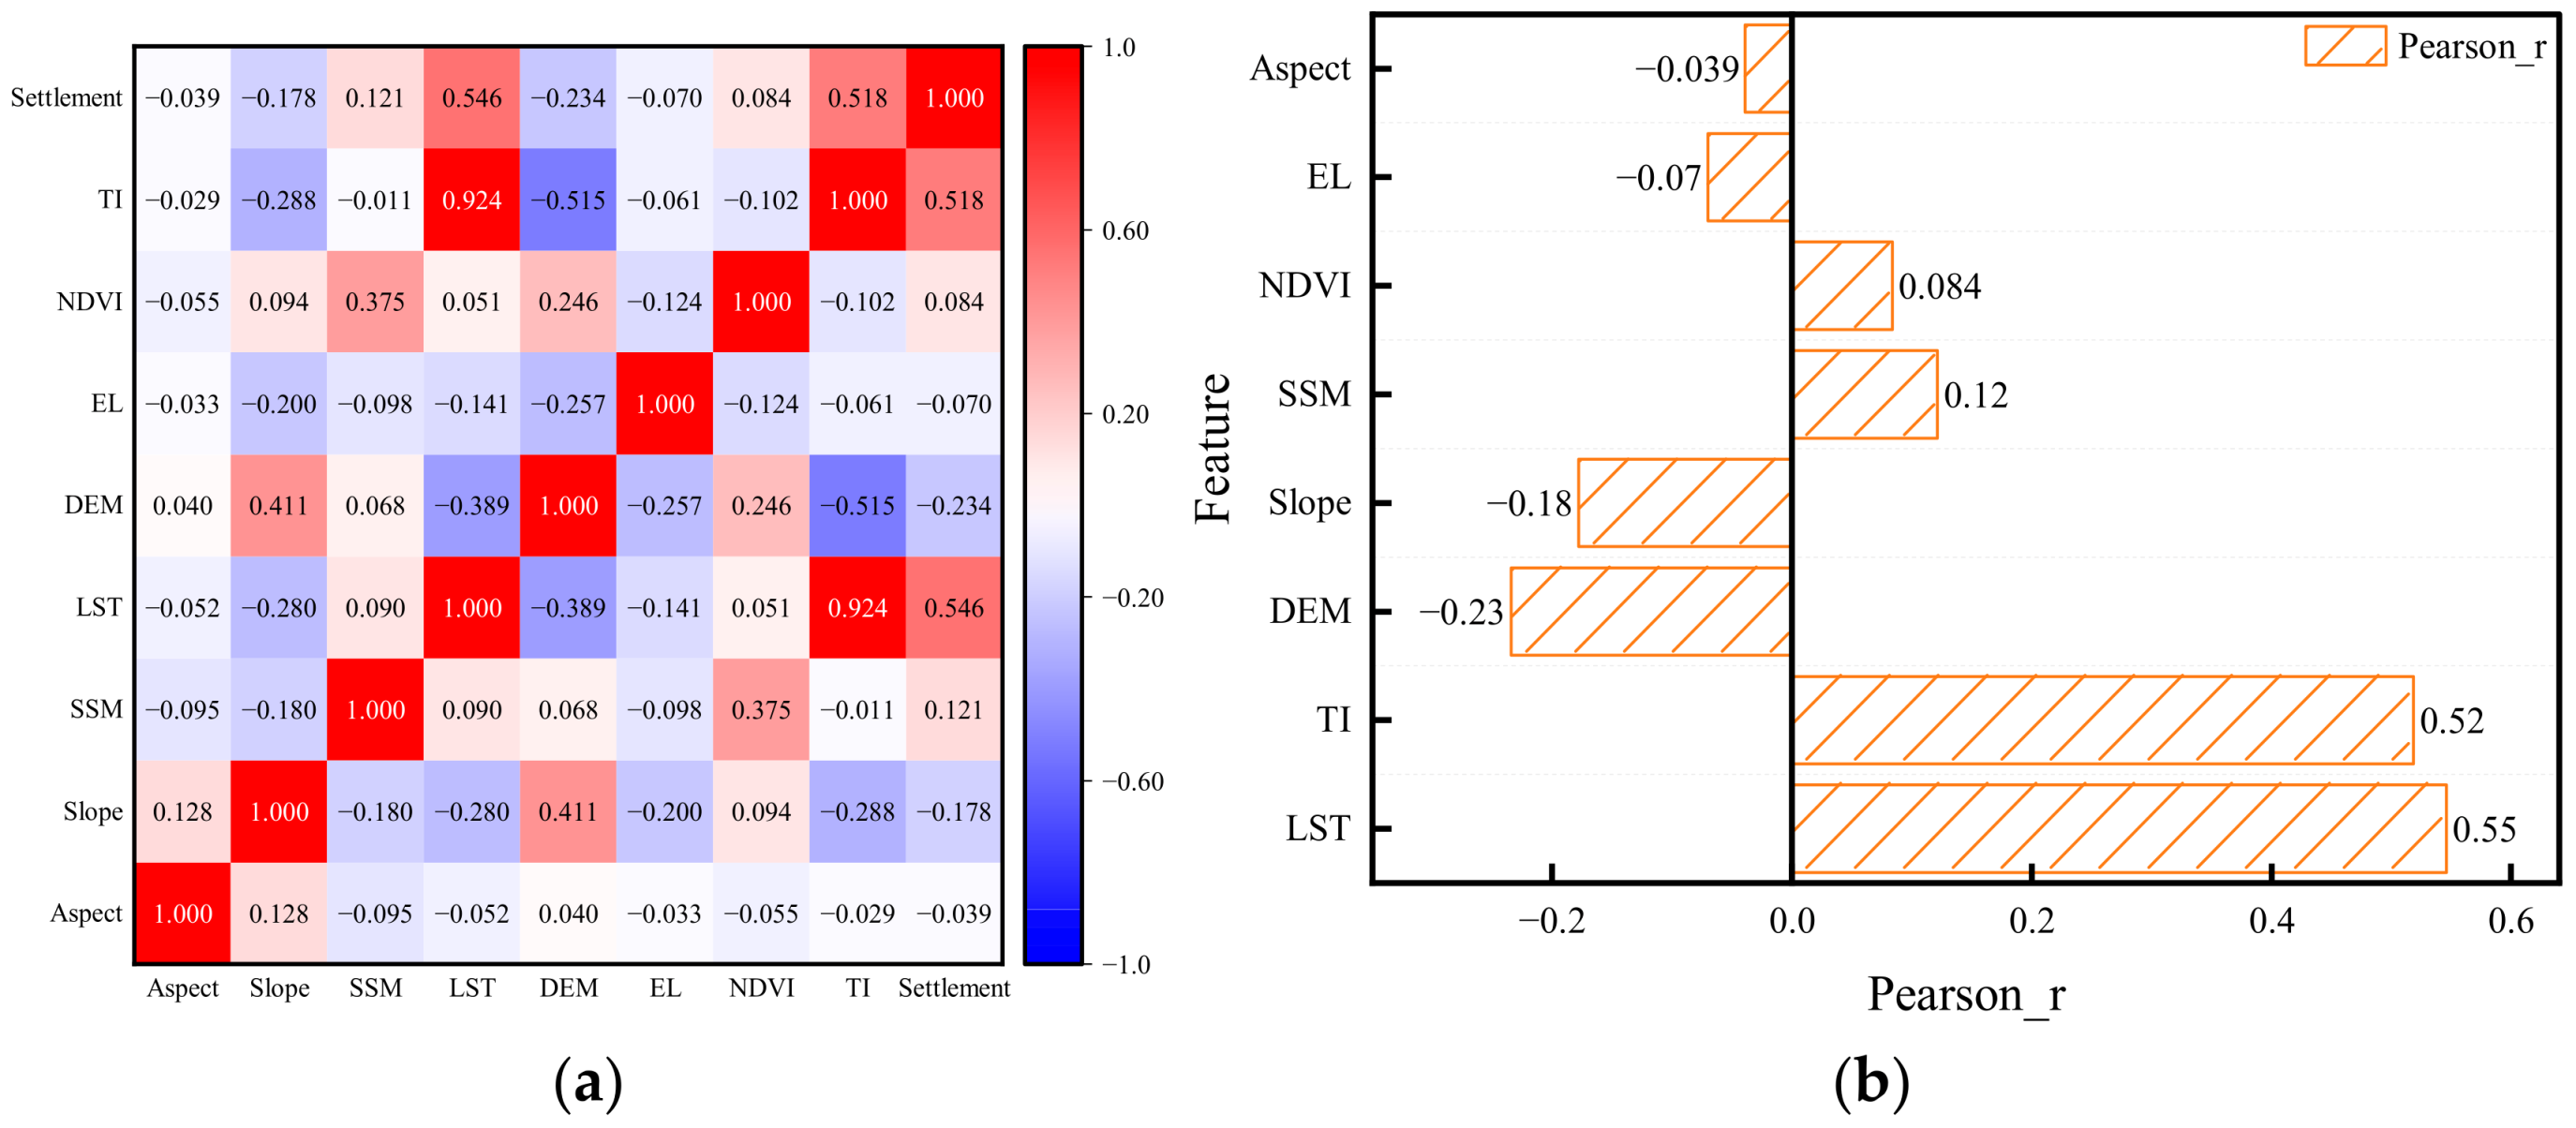
Pearson’s coefficient quantifies linear dependence between variables, providing intuitive diagnostics for identifying primary linear drivers. Figure 16 summarizes the correlations between each factor and thaw settlement.
Figure 16.
Pearson correlation results: (a) Correlation matrix heatmap; (b) Bar chart of factor–target correlations.
Thaw settlement shows significant positive correlations with LST and TI, with correlation coefficients R = 0.55 and R = 0.52, respectively, while exhibiting a clear negative correlation with elevation (DEM, R = −0.23). Additionally, thaw settlement demonstrates a weak negative correlation with slope (R = −0.18) and a weak positive correlation with SSM (R = 0.12). The remaining factors, including aspect, normalized difference vegetation index (NDVI), and EL, show no significant correlation with thaw settlement, indicating limited overall contribution.
- (2)
- Mutual Information (MI)
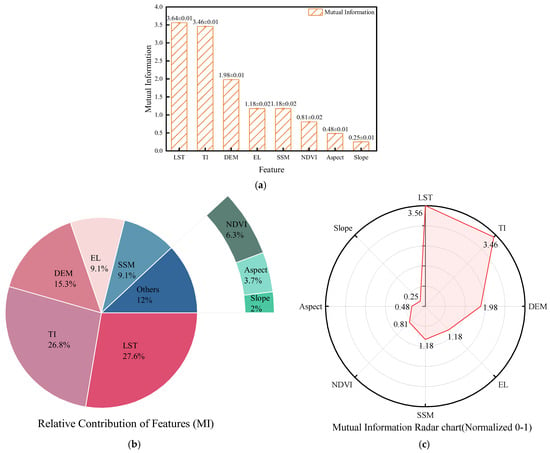
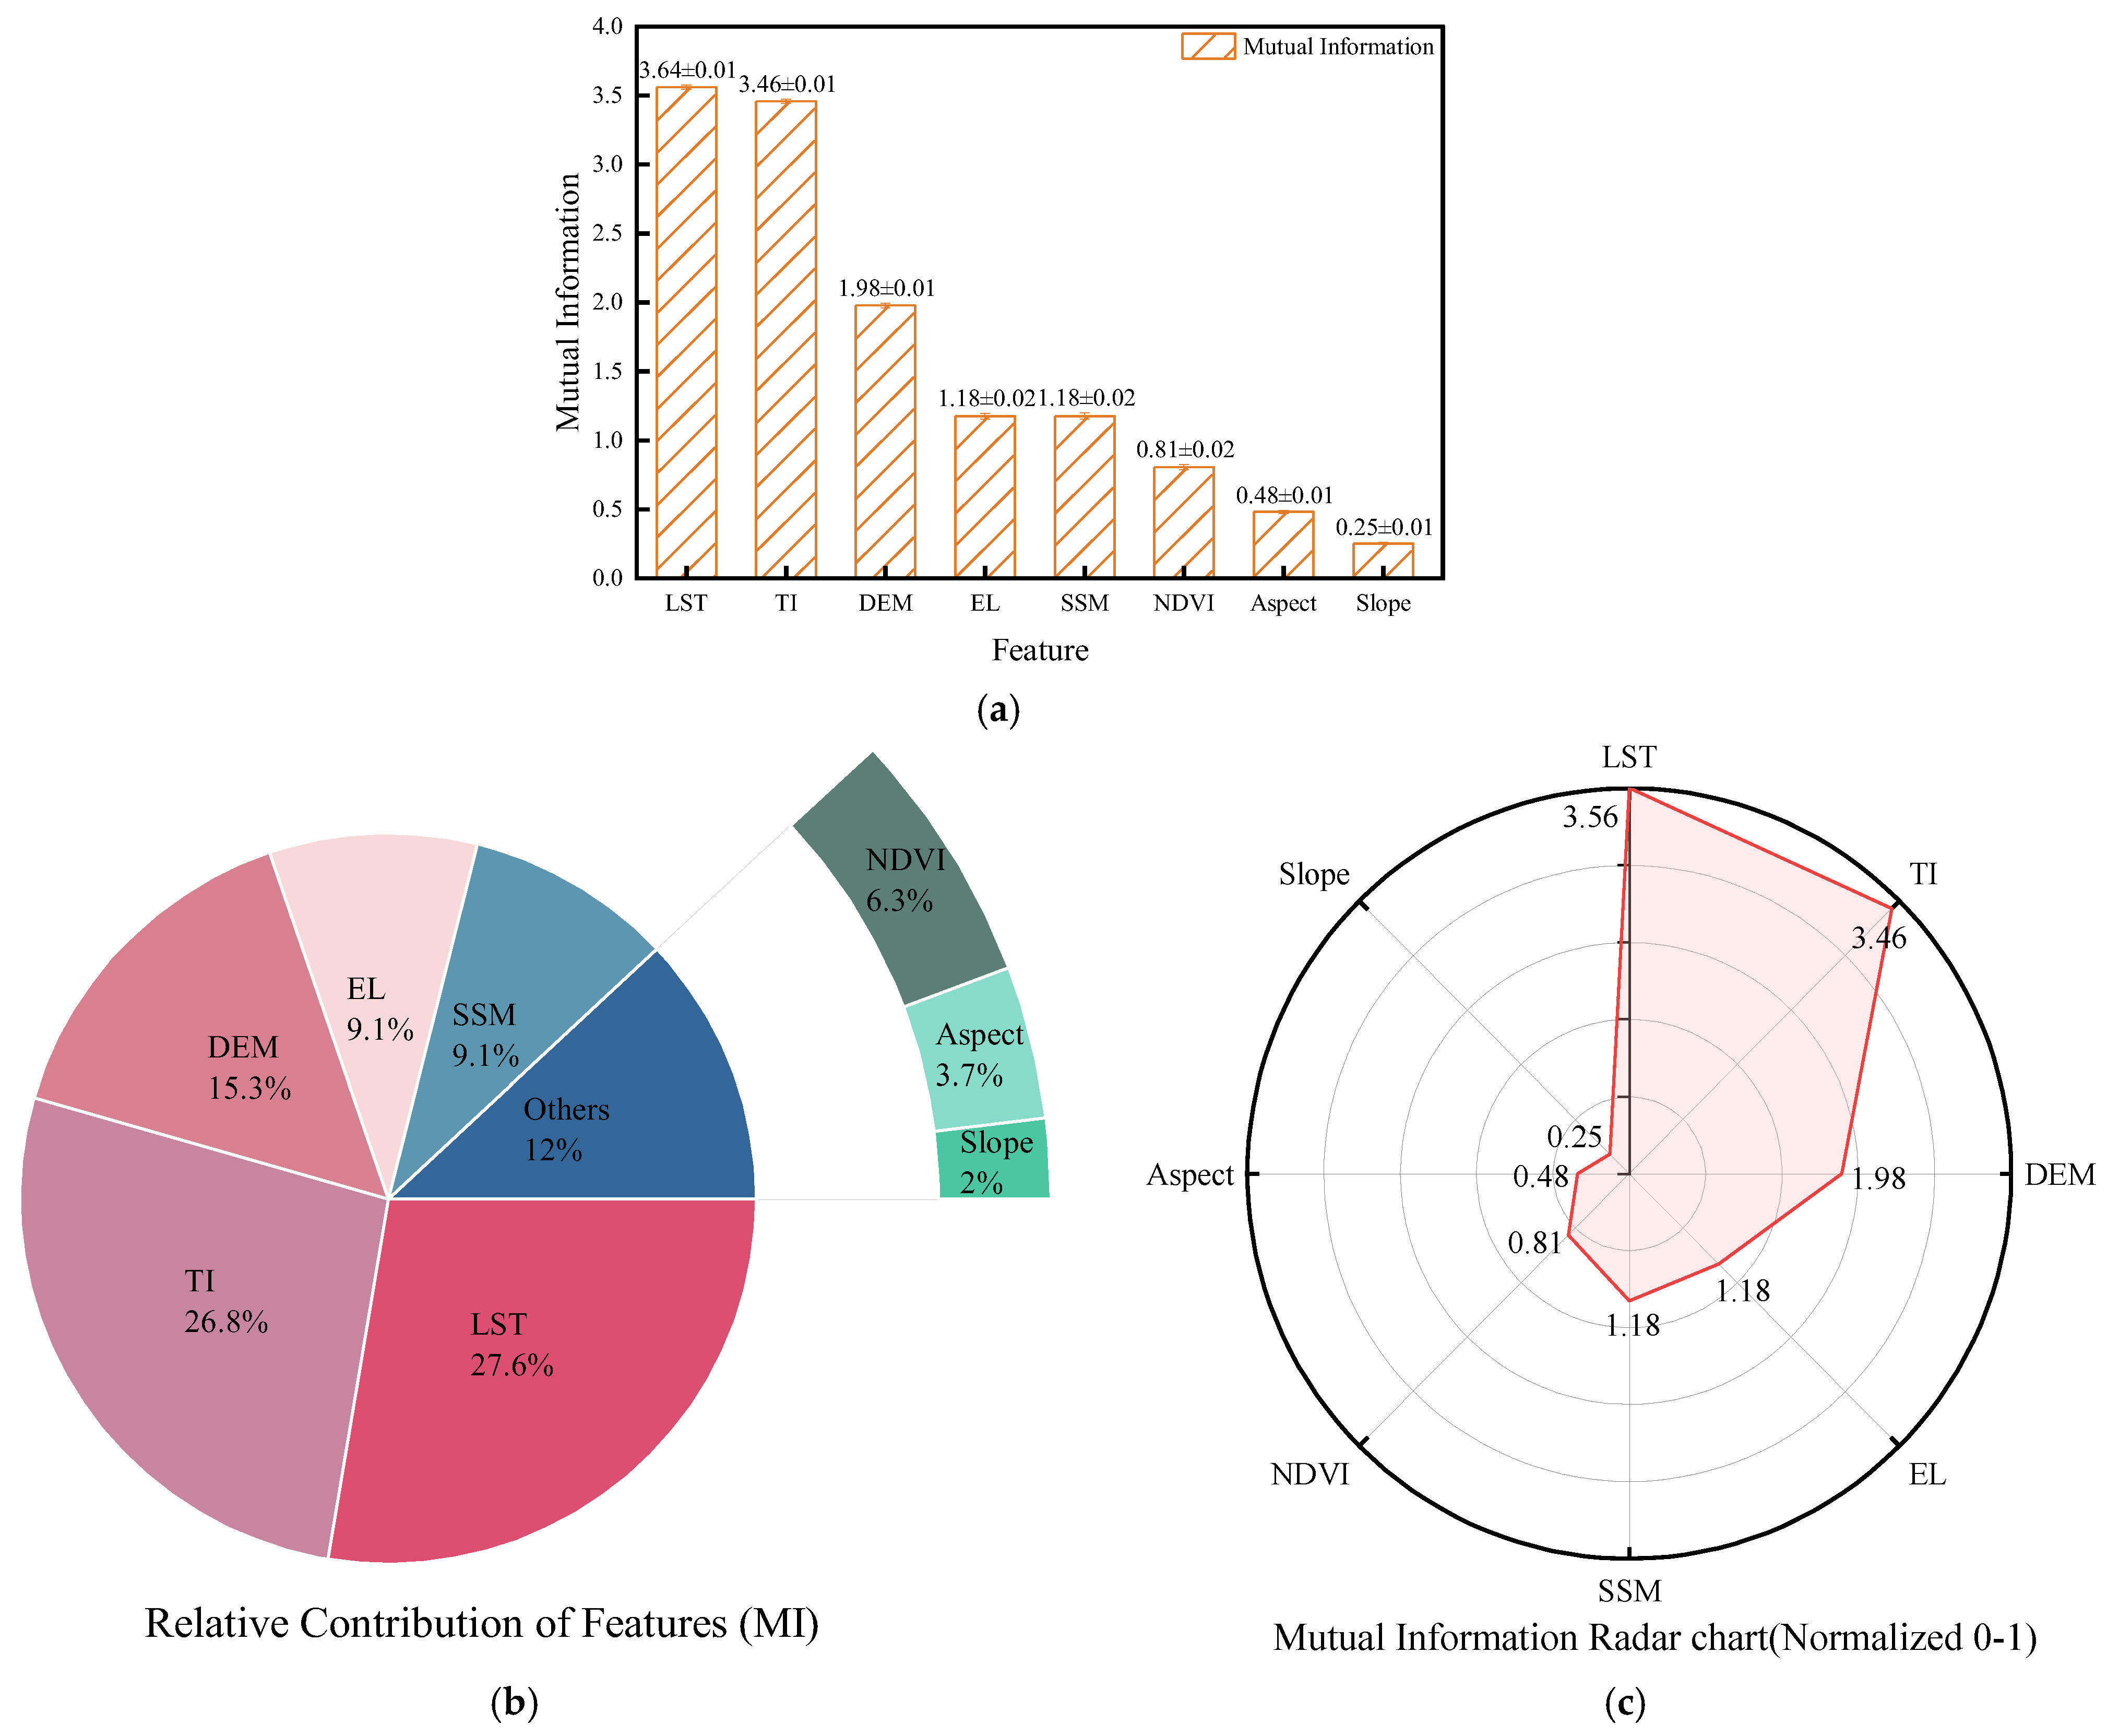
Unlike linear-assumption methods, MI captures dependencies of any functional form and is therefore well suited for characterizing the complex coupling between surface factors and thaw settlement in permafrost regions. We quantify each predictor’s explanatory power using MI and assess robustness with uncertainty ranges, as shown in Figure 17.
Figure 17.
MI analysis results: (a) Bar chart; (b) Donut chart of relative contributions; (c) Radar chart.
Based on the MI analysis results shown in Figure 17a,b, the contribution of various factors to thaw settlement shows significant differences. LST demonstrates the most prominent contribution (MI = 3.64 ± 0.01), accounting for 27.6% of the total influence. TI follows as the second most significant factor (MI = 3.46 ± 0.01), contributing 26.8%. DEM shows an MI value of 1.98 ± 0.01, representing 15.0% of the total contribution. EL and SSM share identical MI values (1.18 ± 0.02), each accounting for 9.1% of the contribution. NDVI exhibits an MI value of 0.81 ± 0.02, contributing 6.3%. In contrast, aspect and slope show minimal MI values of only 0.48 ± 0.01 and 0.25 ± 0.01, respectively, with their combined contribution remaining below 5%, indicating that vegetation coverage and slope geometry have limited overall influence on thaw settlement development.
Figure 17c further validates the relative importance of these factors. After normalization, LST achieves the highest importance score of 1.0 among all factors, followed closely by TI at 0.97. DEM shows a substantially lower score of 0.56, while both EL and SSM score 0.33, and NDVI scores 0.23. Aspect and slope register minimal scores of only 0.14 and 0.07, respectively, further confirming their negligible role among the influencing factors.
Both Pearson correlation and MI analyses consistently identify LST and TI as the most crucial factors influencing thaw settlement, with their explanatory power significantly surpassing other variables. Both methods confirm DEM as an important negative influencing factor, while demonstrating complementary characteristics in identifying secondary factors. Pearson correlation reveals a certain linear negative correlation between slope and thaw settlement (R = −0.18), whereas MI uncovers its extremely low contribution (<2%) in nonlinear systems, highlighting the limited practical significance of slope. Meanwhile, MI results indicate that EL and SSM play more important roles in nonlinear relationships than revealed by linear analysis.
Mechanistically, the strong association of LST and TI with thaw settlement is not merely statistical. LST serves as a proxy for the ground-surface thermal boundary condition (surface “thermal forcing”), which governs the amount of heat transferred downward into the active layer and the underlying warm permafrost. TI, defined as the cumulative positive degree-days relative to 0 °C, integrates the seasonal heat input that drives thaw-front migration and increases thawing intensity. In warm permafrost close to the melting point, even modest surface warming can markedly enhance ice–water phase transition (including latent-heat effects), reduce ice cementation, and promote soil-structure rearrangement and consolidation, thereby amplifying temperature-induced volumetric (settlement) strain. Consequently, higher LST and TI generally imply stronger seasonal thawing intensity, greater ice-melt potential, and larger thaw settlement, especially in warm and ice-rich permafrost zones where latent heat and ice-content heterogeneity make settlement highly sensitive to surface thermal conditions.
4.3. Limitations and Uncertainties
It is essential to clarify the impact of resolution differences on the spatial inversion of thaw settlement. The spatial resolution of input variables directly determines the spatial distribution accuracy of the inverted settlement results. Thaw settlement is fundamentally governed by highly heterogeneous local factors, such as ground ice content and micro-topography. If a coarse resolution (e.g., 1 km) were uniformly applied, these localized geological anomalies would be mathematically smoothed, rendering the high-risk “hotspots” unclear and undetected.
In this study, although the source LST is 1 km, the final inversion is executed on a 30 m grid where both MAGT and ICT are unified. This high-resolution approach clarifies the spatial pattern of thaw settlement by capturing site-specific engineering risks that would otherwise be lost in regional averages. Future research could further improve the characterization of local thermal-mechanical coupling by incorporating advanced LST downscaling algorithms.
5. Conclusions
This study integrates multi-source remote sensing and geotechnical survey data with thermo-mechanical numerical modeling to develop a Random Forest predictor of thaw settlement magnitude for 13 m wide separated subgrades in permafrost along the Qinghai–Tibet Engineering Corridor. The model successfully reveals the spatial heterogeneity of settlement across the corridor. The main conclusions are as follows:
- (1)
- The distribution characteristics of thaw settlement grades in the study area show remarkable consistency between spatial extent and roadway segments. Level I settlements occupy 1.64% of the total area and 0.62% of the roadway length, sporadically distributed in low-temperature permafrost zones including the Kunlun Mountains and Fenghuo Mountains. Level II settlements account for 16.55% of the area and 12.79% of the roadway, primarily developing in medium-to-low temperature regions. Level III settlements represent the dominant grade, covering 40.85% of the area and 36.75% of the roadway, extensively distributed across major geographical units. Levels IV and V settlements occupy 12.07% and 4.16% of the area, respectively, exhibiting a highly concentrated pattern in high-temperature, high-ice-content permafrost areas (e.g., Chumar River Plateau, Wuli, and Tuotuo River Basin), thus forming critical hazard segments for engineering safety.
- (2)
- ICT and MAGT are fundamental factors controlling thaw settlement grades. SHAP analysis quantitatively demonstrates these two factors as the primary drivers of the spatial settlement pattern. Standardized regression further reveals the spatial differentiation of their dominant types: 50% of the subdivisions show ICT dominance, corresponding to higher settlement magnitudes (26.76–43.31 cm); 35.71% exhibit joint control by MAGT and ICT; and 14.29% demonstrate MAGT dominance, corresponding to lower settlement values (16.23–24.19 cm). This clearly reflects the mechanistic difference that “high-temperature zones are controlled by ice content while low-temperature zones are governed by temperature.”
- (3)
- This study validates the substitutive analytical value of multi-source remote sensing factors. LST and TI are confirmed as the remote sensing indicators most closely associated with thaw settlement, with explanatory power significantly superior to other factors. This finding provides a low-cost, efficient technical approach for large-scale permafrost settlement monitoring, possessing substantial engineering application value.
Author Contributions
Conceptualization, J.C. and Z.L.; methodology, J.C.; software, M.L.; validation, X.L. (Xiaona Liu), Z.L. and F.C.; formal analysis, J.L.; investigation, J.C.; resources, P.C.; data curation, X.L. (Xiang Long); writing—original draft preparation, J.C.; writing—review and editing, X.L. (Xiaona Liu); visualization, X.L. (Xiaona Liu); supervision, F.C.; project administration, X.L. (Xiang Long); funding acquisition, F.C. All authors have read and agreed to the published version of the manuscript.
Funding
This research was funded by the National Natural Science Foundation of China, grant numbers 42371149 and U25B20218; the Natural Science Foundation of Shaanxi Province, grant number 2025JC-YBMS-267; and the Open Fund of the National Key Laboratory of Green and Long-Life Road Engineering in Extreme Environment, grant number YGY2021KFKT03.
Data Availability Statement
The raw data supporting the conclusions of this article will be made available by the authors on request.
Conflicts of Interest
Authors Jianbing Chen, Jinping Li and Pan Chen were employed by the State Key Laboratory of Road Engineering Safety and Health in Cold and High-Altitude Regions, CCCC First Highway Consultants Co. Ltd. The remaining authors declare that the research was conducted in the absence of any commercial or financial relationships that could be construed as a potential conflict of interest.
References
- Cao, B.; Zhang, T.J.; Wu, Q.B. Permafrost zonation index map and statistics over the Qinghai−Tibet Plateau based on field evidence. Permafr. Periglac. Process. 2019, 30, 178–194. [Google Scholar] [CrossRef] [Scilit]
- Wang, Z.H.; Wen, T.; Chen, N.S. Assessment of Landslide Susceptibility Based on the Two-Layer Stacking Model—A Case Study of Jiacha County, China. Remote Sens. 2025, 17, 1177. [Google Scholar] [CrossRef] [Scilit]
- Jia, W.J.; Wen, T.; Wang, Y.K. Deformation and failure mechanisms of shallow landslides in the Qinghai-Tibet Plateau, China: A case study of Zhaxuecun landslide. Bull. Eng. Geol. Environ. 2026, 85, 133. [Google Scholar] [CrossRef] [Scilit]
- Wen, T.; Jia, W.J.; Quan, Z. Shear behavior of gravel-block soil of the Qinghai-Tibet Plateau based on large-scale direct shear test and numerical simulation. Bull. Eng. Geol. Environ. 2025, 84, 294. [Google Scholar] [CrossRef] [Scilit]
- Zhao, Y.C.; Wei, H.L.; Kuang, C. Analysis and prediction of semi-parametric model for settlement of frozen soil subgrade on Qinghai-Tibet Railway. J. Nat. Disasters 2023, 32, 85–95. [Google Scholar] [CrossRef]
- Wu, Q.B.; Liu, Y.Z.; Shi, B. Advance Research on Frozen Engineering Permafrost Region along Qinghai-Xizang Plateau Highway. J. Eng. Geol. 2002, 10, 55–61. [Google Scholar]
- Liu, Y.Z.; Wu, Q.B.; Zhang, J.M. Deformation of Highway Roadbed in Permafrost Regions of the Tibetan Plateau. J. Glaciol. Geocryol. 2002, 24, 10–15. [Google Scholar] [CrossRef]
- Jiang, L.K. Analysis on Difficulties in Highway Subgrade Design in Permafrost Regions. Eng. Technol. Res. 2023, 8, 168–170. [Google Scholar] [CrossRef]
- Wang, G.F.; Wu, H.; Tian, Y.L. Technology and efficiency analysis of thermosyphon for frozen soil subgrade freezing settlement prevention of Heilongjiang Province. J. Heilongjiang Inst. Technol. 2023, 37, 1–6+24. [Google Scholar] [CrossRef]
- Fu, Z.G.; Yu, B.; Zhu, J. Thaw Characteristics of Soil around Buried Pipeline in Permafrost Regions Based on Numerical Simulation of Temperature Fields. J. Therm. Sci. Technol. 2012, 7, 322–333. [Google Scholar] [CrossRef] [Scilit]
- Shiklomanov, N.I.; Streletskiy, D.A.; Little, J.D. Isotropic thaw subsidence in undisturbed permafrost landscapes. Geophys. Res. Lett. 2013, 40, 6356–6361. [Google Scholar] [CrossRef] [Scilit]
- Bao, W.X.; Liu, Y.L.; Mao, X.S. Characteristics of subgrade temperature field of gravel road in high altitude permafrost region. J. Traffic Transp. Eng. 2023, 23, 60–74. [Google Scholar] [CrossRef]
- Zhang, J.M.; Liu, R.; Qi, J.L. Estimation on the Settlement and Deformation of Subgrade along Qinghai—Tibet Railway in Permafrost Regions. Chin. Railw. Sci. 2007, 28, 12–17. [Google Scholar]
- Zhao, R.; Li, Z.W.; Feng, G.C. Monitoring surface deformation over permafrost with an improved SBAS-InSAR algorithm: With emphasis on climatic factors modeling. Remote Sens. Environ. 2016, 184, 276–287. [Google Scholar] [CrossRef] [Scilit]
- Hazirbaba, K. Effects of freeze thaw on settlement of fine grained soil subjected to cyclic loading. Cold Reg. Sci. Technol. 2019, 160, 222–229. [Google Scholar] [CrossRef] [Scilit]
- Ma, W.; Liu, R.; Wu, Q.B. Monitoring and analysis of subgrade deformation in permafrost regions of Qinghai-Tibet Railway. Rock Soil Mech. 2008, 29, 571–579. [Google Scholar] [CrossRef]
- Cai, H.B.; Hong, R.B.; Xu, L.X. Frost heave and thawing settlement of the ground after using a freeze-sealing pipe-roof method in the construction of the Gongbei Tunnel. Tunn. Undergr. Space Technol. 2022, 125, 104503. [Google Scholar] [CrossRef] [Scilit]
- Dai, W.T.; Wei, H.B.; Liu, H.B. Dynamic damage model of silty clay after freeze-thaw cycles. J. Jilin Univ. Eng. Technol. Ed. 2007, 37, 790–793. [Google Scholar] [CrossRef]
- Chai, M.T.; Zhang, J.M. Improvement of Compressibility and Thaw-Settlement Properties of Warm and Ice-Rich Frozen Soil with Cement and Additives. Materials 2019, 12, 1068. [Google Scholar] [CrossRef] [Scilit]
- Zhang, J.X.; Song, Y.W.; Yang, H. Influences of load and fine soil content on frost heave and thawing settlement properties of sandy gravel. Mechanics 2022, 43, 213–221. [Google Scholar] [CrossRef]
- Song, D.J.; Zhao, W.; Wen, H. Geological Formation and Thaw Settlement Characteristics of Frozen Soil in Sulijian Gully, Southern Tian Mountains. J. Eng. Geol. 2023, 31, 1225–1234. [Google Scholar] [CrossRef]
- He, P.; Cheng, G.D.; Yang, C.S. The Evaluation of Thawing-Settlement Coefficient of Frozen Soils. J. Glaciol. Geocryol. 2003, 25, 608–613. [Google Scholar]
- Zaretskii, Y.K. Scientific legacy of N. A. Tsytovich. Soil Mech. Found. Eng. 2000, 37, 131–139. [Google Scholar] [CrossRef] [Scilit]
- Tang, L.Y.; Yang, L.J.; Wang, X.G. Numerical analysis of frost heave and thawing settlement of the pile-soil system in degraded permafrost region. Environ. Earth Sci. 2021, 80, 693. [Google Scholar] [CrossRef] [Scilit]
- Wang, X.B.; Yang, P.; Hu, J. A numerical simulation study on ground displacement field of thaw-settlement in artificial freezing soil. Coal Geol. Explor. 2011, 39, 54–57. [Google Scholar]
- Wang, X.B.; Yang, P. Study on Prediction Method of the Thaw Settlement Coefficient of Freezing Soil Based on BP Artificial Neural Network. For. Eng. 2008, 24, 18–21. [Google Scholar] [CrossRef]
- Liu, X.L.; Chen, Y.X.; Meng, Q.L. Thaw settlement of runways in permafrost regions under aircraft load. Eur. J. Environ. Civ. Eng. 2023, 27, 500–518. [Google Scholar] [CrossRef] [Scilit]
- Sun, Z.Z.; Ma, W.; Zhang, S.J. Characteristics of thawed interlayer and its effect on subgrade settlement along the Qinghai-Tibet Railway in permafrost regions. J. Mt. Sci. 2018, 15, 1090–1100. [Google Scholar] [CrossRef] [Scilit]
- Wang, L. Calculation Model of Subgrade Cooling Load in Permafrost Region and Research on Anti-Thawing Effect of Artificial Cooling. Master’s Thesis, Chang’an University, Xi’an, China, 2023. [Google Scholar]
- Zhou, D.M.; Zhang, Y.F.; Pan, L. Thawing Settlement Amount of Lop Nur’s Natural Sulphate Saline Soil. J. Water Resour. Archit. Eng. 2017, 15, 81–83+142. [Google Scholar] [CrossRef]
- Yin, Y.M.; Wei, C.Q.; Wang, H.C. Prediction of thawing settlement coefficient of frozen soil using 5G communication. Soft Comput. 2022, 26, 10837–10852. [Google Scholar] [CrossRef] [Scilit]
- Ni, J.; Wu, T.H.; Zhu, X.F. Risk assessment of potential thaw settlement hazard in the permafrost regions of Qinghai-Tibet Plateau. Sci. Total Environ. 2021, 776, 145855. [Google Scholar] [CrossRef] [Scilit]
- Zhang, Z.J.; Lin, H.; Chen, F.L. Risk Assessment of Permafrost Thawing along Qinghai-Tibet Engineering Corridor Integration Ground Deformation. J. Geo-Inf. Sci. 2024, 26, 2552–2566. [Google Scholar] [CrossRef]
- Hong, E.; Perkins, R.; Trainor, S. Thaw Settlement Hazard of Permafrost Related to Climate Warming in Alaska. Arctic 2014, 67, 93–103. [Google Scholar] [CrossRef] [Scilit]
- Ruan, G.F.; Zhang, J.M.; Chai, M.T. Risk division of thaw settlement hazard along Qinghai-Tibet Engineering Corridor under climate change. J. Eng. Geol. 2014, 36, 811–817. [Google Scholar]
- Sun, Z.; Zhao, L.; Hu, G.J. Numerical Simulation of Thaw Settlement and Permafrost Changes at Three Sites Along the Qinghai-Tibet Engineering Corridor in a Warming Climate. Geophys. Res. Lett. 2022, 49, e2021GL097334. [Google Scholar] [CrossRef] [Scilit]
- Liu, Z.Y.; Zhu, Y.; Chen, J.B. Risk Zoning of Permafrost Thaw Settlement in the Qinghai–Tibet Engineering Corridor. Remote Sens. 2023, 15, 3913. [Google Scholar] [CrossRef] [Scilit]
- Liu, Z.Y.; Cui, F.Q.; Chen, J.B. Study on the permafrost heat transfer mechanism and reasonable interval of separate subgrade for the Qinghai-Tibet expressway. Cold Reg. Sci. Technol. 2020, 170, 102952. [Google Scholar] [CrossRef] [Scilit]
- Zhu, Y. Study on the Risk and Zoning Characteristics of Permafrost Subgrade Thawing Settlement in the Qinghai-Tibet Expressway. Master’s Thesis, Chang’an University, Xi’an, China, 2024. [Google Scholar] [CrossRef]
- Li, X.L.; Ma, W.; Mu, Y.H. Comparing thermal performances of expressways constructed with an integral subgrade and two separated embankments in permafrost zones. Cold Reg. Sci. Technol. 2020, 170, 102939. [Google Scholar] [CrossRef] [Scilit]
- Niu, F.J.; Yin, G.A.; Luo, J. Permafrost Distribution along the Qinghai-Tibet Engineering Corridor, China Using High-Resolution Statistical Mapping and Modeling Integrated with Remote Sensing and GIS. Remote Sens. 2018, 10, 215. [Google Scholar] [CrossRef] [Scilit]
- Yang, M.X.; Nelson, F.E.; Shiklomanov, N.I.; Guo, D.; Wan, G. Permafrost degradation and its environmental effects on the Tibetan Plateau: A review of recent research. Earth-Sci. Rev. 2010, 103, 31–44. [Google Scholar] [CrossRef] [Scilit]
- Zhu, L.D.; Wang, C.S.; Zheng, H.B. Tectonic and sedimentary evolution of basins in the northeast of Qinghai-Tibet Plateau and their implication for the northward growth of the Plateau. Palaeogeogr. Palaeoclimatol. Palaeoecol. 2006, 241, 49–60. [Google Scholar] [CrossRef] [Scilit]
- Kuang, X.X.; Jiao, J.J. Review on climate change on the Tibetan Plateau during the last half century. J. Geophys. Res.-Atmos. 2016, 121, 3979–4007. [Google Scholar] [CrossRef] [Scilit]
- Guo, D.L.; Sun, J.Q. Permafrost Thaw and Associated Settlement Hazard Onset Timing over the Qinghai-Tibet Engineering Corridor. Int. J. Disaster Risk Sci. 2015, 6, 347–358. [Google Scholar] [CrossRef] [Scilit]
- Xia, Z.X.; Huang, L.C.; Fan, C.F. Retrogressive thaw slumps along the Qinghai–Tibet Engineering Corridor: A comprehensive inventory and their distribution characteristics. Earth Syst. Sci. Data 2022, 14, 3875–3887. [Google Scholar] [CrossRef] [Scilit]
- GB 50324-2014; Code for Engineering Geological Investigation of Frozen Ground. China Architecture & Building Press: Beijing, China, 2014.
- JTG D30-2015; Specifications for Design of Highway Embankments. China Communications Press: Beijing, China, 2015.
- Bennett, K.C.; Zecevic, M.; Luscher, D.J.; Lebensohn, R.A. A thermo-elastoplastic self-consistent homogenization method for inter-granular plasticity with application to thermal ratcheting of TATB. Adv. Model. Simul. Eng. Sci. 2020, 7, 3. [Google Scholar] [CrossRef] [Scilit]
- Sloan, S.W.; Booker, J.R. Integration of Tresca and Mohr–Coulomb constitutive relations in plane strain elastoplasticity. Int. J. Numer. Methods Eng. 1992, 33, 163–196. [Google Scholar] [CrossRef] [Scilit]
- NPTEL. Thermoelasticity (Chapter 6). Available online: https://archive.nptel.ac.in/content/storage2/courses/105108072/mod03/hyperlink-4.pdf (accessed on 6 February 2026).
- JTG/T 3331-04-2023; Guidelines for Design and Construction of Highway in Permafrost Area. China Communications Press: Beijing, China, 2023.
- DZ/T 0061-1993; Code for Engineering Geological Survey in Frozen Soil Area (Scale: 1:100000~1:200000). Geological Publishing House: Beijing, China, 1993.

Disclaimer/Publisher’s Note: The statements, opinions and data contained in all publications are solely those of the individual author(s) and contributor(s) and not of MDPI and/or the editor(s). MDPI and/or the editor(s) disclaim responsibility for any injury to people or property resulting from any ideas, methods, instructions or products referred to in the content. |
© 2026 by the authors. Licensee MDPI, Basel, Switzerland. This article is an open access article distributed under the terms and conditions of the Creative Commons Attribution (CC BY) license.