


Highlights
What are the main findings?
- Mean Teacher improves held-out detection relative to the source-only model and controls trained with the same optimization budget.
- Adaptation varies across mine classes and sequence assignments; additional alignment provides limited improvement over Mean Teacher on the primary assignment.
What are the implications of the main finding?
- Class-specific performance, sequence variation and source retention help interpret pooled adaptation scores.
- RGB adaptation may assist visible-target candidate generation, with further validation needed for operational use.
Abstract
Domain shift remains a challenge for RGB-based surface-landmine detection, particularly when labeled imagery from a new environment is unavailable. This study examines unsupervised domain adaptation on SULAND_v2 using YOLOv8-S and a teacher–student framework. Complete acquisition sequences are separated between adaptation and evaluation, and seven adaptation configurations are compared across three source-training seeds. On the primary assignment, mean average precision at an intersection-over-union threshold of 0.50 () increases from 53.70% for the source-only model to 63.56% for Mean Teacher and 64.22% for the CMT-style configuration. Controls with the same optimization budget indicate that additional training alone does not account for the Mean Teacher improvement. The pooled gain is concentrated in PMA-2, whereas PFM-1 performance decreases. Reversing the adaptation and evaluation sequences yields improvements for both classes, suggesting that the class response depends on the sequence assignment. Individual-sequence results and class-specific recall and false positives further reveal variation within the pooled scores. Additional alignment objectives provide small, inconsistent gains over Mean Teacher on the primary assignment, while source-domain accuracy decreases modestly. These findings suggest that unlabeled target imagery can improve detection within the evaluated dataset, although its benefits vary across classes and acquisitions. The intended application is candidate generation for visible surface targets and analyst review; operational reliability requires further validation.
1. Introduction
Landmine and unexploded-ordnance contamination continues to restrict access to agricultural land, transportation corridors, and civilian infrastructure while posing hazards long after active conflict has ended [1]. Humanitarian mine action therefore relies on complementary survey and sensing approaches rather than on a single detection technology. Metal detectors, ground-penetrating radar, magnetometry, thermal imaging, hyperspectral sensing, and optical imaging respond to different physical properties of the target and surrounding environment and consequently have different strengths and limitations [2,3,4]. Within this broader sensing framework, RGB cameras mounted on unmanned aerial vehicles (UAVs) and unmanned ground vehicles (UGVs) provide a comparatively low-cost means of remotely screening areas for visible surface-laid objects. Such imagery cannot reveal fully buried mines or certify that land is free of explosive hazards; instead, detections can support analyst review, survey prioritization, and the targeted deployment of confirmatory sensing or technical assets. In this role, remote imagery may also augment the evidence available during non-technical survey (NTS) and subsequent land-release activities [5,6].
The increasing availability of high-resolution UAV/UGV imagery and modern deep-learning detectors has motivated growing research on automated optical detection of surface landmines. Baur et al. demonstrated UAV-based detection of scatterable PFM-1-type targets using multispectral and thermal observations and showed the feasibility of convolutional object detection from RGB imagery [7]. Later work showed that vegetation and partial occlusion can substantially reduce optical detectability [8]. Qiu et al. combined UAV RGB and near-infrared imagery with a YOLOv5-based framework for scatterable-landmine detection [9]. Vivoli et al. subsequently introduced the SUrface LANDmine (SULAND) dataset and a real-time RGB object-detection workflow for PFM-1 and PMA-2 surface mines [10]. Together, these studies established the feasibility of deep-learning-based optical mine detection while also demonstrating sensitivity to environmental and acquisition conditions.
Lekhak et al. introduced SULAND_v2 by correcting annotation and class-label inconsistencies in SULAND and benchmarking 35 configurations from nine detector families under in-distribution (IID) and out-of-distribution (OOD) conditions [11]. The benchmark showed that high IID accuracy did not necessarily carry over to OOD imagery. Its common target classes and acquisition-sequence structure provide a basis for examining whether unlabeled target-domain imagery can help address this gap.
Identifying an IID–OOD performance gap, however, does not determine how a detector should be adapted after deployment to a new environment. In practice, collecting imagery from a new terrain or acquisition configuration may be considerably easier than obtaining verified target annotations, which motivates unsupervised domain adaptation (UDA). In unsupervised domain adaptation for object detection (UDAOD), labeled source-domain data and unlabeled target-domain imagery are used jointly to improve target-domain performance [12]. Existing approaches employ teacher-generated pseudo-labels, adversarial feature alignment, contrastive learning, and class-aware adaptation [13,14,15,16]. Their behavior in surface-landmine imagery remains uncertain because the targets are small and sparse, background terrain occupies most of the image area, and adaptation may affect different mine classes differently. Evaluation must also account for the sequential nature of the imagery. Because temporally adjacent video frames can contain nearly identical targets, terrain, and viewing geometry, separating adaptation and evaluation data at the frame level can overstate generalization [10,11,17]. Treating the acquisition sequence, rather than the individual frame, as the unit of separation provides a more stringent assessment of transfer to different target-domain acquisitions.
This study investigates sequence-held-out UDA for RGB surface-landmine detection on SULAND_v2. YOLOv8-S provides a common detector for comparing teacher–student adaptation mechanisms [11,18]. We examine whether adaptation transfers to acquisition sequences excluded from training and whether its effects are consistent across PFM-1 and PMA-2. Seven adaptation configurations are evaluated from three independently trained source models. Controls with the same optimization budget distinguish pseudo-label supervision from continued training, while a complementary sequence assignment examines sensitivity to the adaptation/test division. The study contributes a sequence-based evaluation protocol, a comparison of adaptation mechanisms within a common detector, and an analysis of class- and sequence-dependent transfer together with source-domain retention.
2. Background and Related Work
2.1. Deep Learning for Surface-Landmine Detection
Optical surface-landmine detection involves localizing small, sparsely distributed targets against heterogeneous terrain. Previous studies have examined RGB and multispectral detection, robotic deployment, vegetation occlusion and cross-environment generalization [7,8,9,10]. Related remote-sensing work considers the loss of small-object information when targets occupy few pixels [19]. Studies of uncertainty-aware RGB classification and hyperspectral detection also emphasize the roles of uncertainty and target rarity [20,21,22]. These findings motivate examining adaptation alongside class-specific errors, rather than relying on aggregate detection accuracy alone.
2.2. Unsupervised Domain Adaptation for Object Detection
Unsupervised domain adaptation for object detection (UDAOD) transfers a detector trained with labeled source-domain data to an unlabeled target domain. Detection is more demanding than image-level classification because adaptation must preserve both semantic discrimination and localization while avoiding alignment of irrelevant background structure [12]. Early approaches emphasized adversarial alignment: Domain Adaptive Faster R-CNN introduced image- and instance-level domain classifiers [13], while Strong–Weak Distribution Alignment argued that excessive global matching can suppress useful domain-specific structure [23]. Teacher–student self-training subsequently became a major direction. Mean Teacher stabilizes target predictions through an exponential moving average (EMA) of student weights [24]; MTOR and Unbiased Mean Teacher adapted this idea specifically to cross-domain detection [25,26], while Unbiased Teacher, Soft Teacher, and LabelMatch demonstrated how pseudo-label quality, confidence filtering, and teacher consistency affect object-detection self-training more broadly [27,28,29]. Cross-Domain Adaptive Teacher combines pseudo-labeling with adversarial feature alignment [14], CMT adds object-level contrastive alignment [15], and CAT introduces class-aware mechanisms for unequal category behavior [16].
Teacher–student learning provides a common basis for comparing these mechanisms: pseudo-labels supply target supervision, while EMA updates stabilize the teacher used to generate them. Recent adaptation work considers remote-sensing feature alignment, low-confidence pseudo-label recovery, history-aware updates, domain-aware prompting and expert guidance [30,31,32,33,34]. These approaches address different aspects of domain discrepancy and pseudo-label quality. Here, Mean Teacher serves as the reference for assessing the additional alignment terms under the same detector and training schedule.
Other mechanisms target class-conditional or appearance-related discrepancies. Prototype alignment encourages corresponding source and target class embeddings to approach one another [35], whereas feature-statistic matching reduces differences in channel-wise means and variances, following ideas related to adaptive instance normalization [36]. Such mechanisms may be helpful when domain shift is concentrated in foreground appearance, but they may also align terrain more strongly than mines when background pixels dominate. This imbalance is particularly important for SULAND_v2 because PFM-1 and PMA-2 occupy a small portion of each frame and differ in shape, visibility, and contextual appearance. Accordingly, adaptation should be evaluated not only through pooled mAP but also through class-specific performance and recall, since increased recall corresponds to fewer false negatives at a chosen operating point.
2.3. Evaluation Under Correlated Image Sequences
A separate issue is how target-domain generalization is measured. Standard object-detection benchmarks often treat images as independent samples, whereas video-derived remote-sensing data contain strong temporal and spatial correlation. Consecutive frames can show the same target, terrain, illumination, and camera geometry with only minor changes, so frame-level partitioning can introduce visual overlap between adaptation and evaluation. Related work on online mapping has shown that shared acquisition locations can inflate generalization estimates [17]. The distinction is especially important in UDAOD: evaluating on the same unlabeled images used during adaptation is a valid transductive setting when declared, but it answers a different question from transfer to later target-domain acquisitions. The present study therefore uses complete acquisition sequences as the unit of separation and reports held-out sequences as the primary generalization result, while adaptation-sequence and complete-OOD scores are included as secondary diagnostics. This design tests whether target-domain adaptation transfers beyond the exact imagery observed during training while keeping the claim bounded to unseen sequences within SULAND_v2 rather than to unseen sensors, countries, or minefields.
3. Materials and Methods
3.1. Dataset and Sequence-Held-Out Study Design
This study uses SULAND_v2, an RGB object-detection dataset containing surface-laid PFM-1 and PMA-2 landmines acquired under in-distribution (IID) and out-of-distribution (OOD) conditions [11]. The data used here comprise 22,756 IID training images, 2836 IID validation images, 3743 IID test images, and 4436 OOD images. The IID training partition serves as the labeled source domain, the IID validation partition is used for source-model selection, and the IID test partition is reserved for post-training source-retention evaluation. The OOD collection forms the target domain and is divided into an unlabeled adaptation subset and a held-out evaluation subset, as summarized in Table 1.
Table 1.
SULAND_v2 partitions used in this study. Ground-truth labels from the OOD adaptation subset are not used during adaptation.
The OOD collection comprises ten acquisition sequences, US1–US10. Complete sequences are assigned to adaptation or evaluation to reduce overlap between neighboring video frames. The primary random assignment uses US4, US5, US6, US9 and US10 for adaptation (2550 images) and US1, US2, US3, US7 and US8 for evaluation (1886 images). A complementary assignment reverses these roles to examine sensitivity to the division. For each assignment, held-out images and labels are excluded from adaptation and model or threshold selection. The three training seeds characterize variation conditional on each assignment.
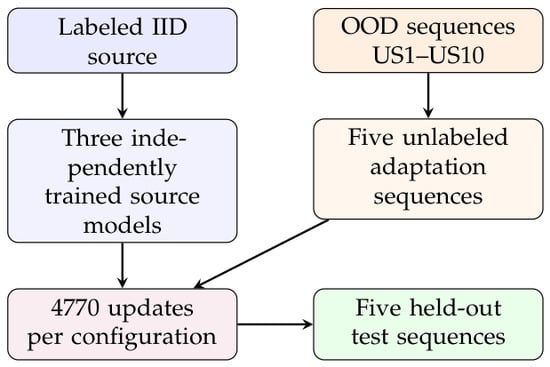
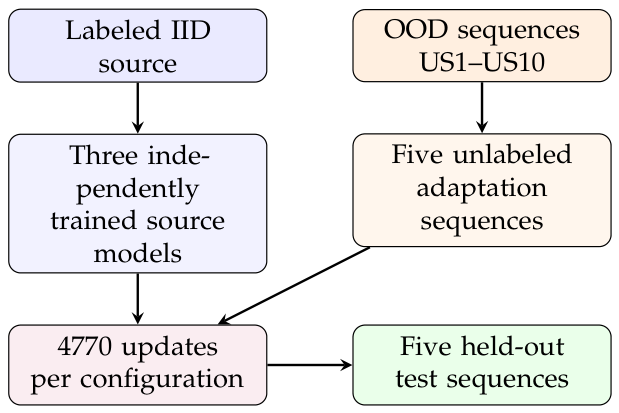
Perceptual overlap is screened across all 4436 OOD images using difference hashes (dHash). Images are converted to grayscale and resized to pixels; adjacent horizontal intensity comparisons produce a 64-bit hash. A cross-partition pair is flagged when its Hamming distance is at most four. None of the 4,809,300 pairs meets this criterion, and the partitions have disjoint sequence identities and image paths. This screening may miss similar scenes or repeated objects and therefore does not establish acquisition independence. Figure 1 summarizes the primary assignment.
Figure 1.
Sequence-held-out study design. Labeled IID data are used to train three source models. Five OOD acquisition sequences provide unlabeled target-domain imagery for adaptation, while five different OOD sequences are reserved for final evaluation. Test images and labels do not enter adaptation or model selection.
Table 2 summarizes image counts, class composition and object sizes for each sequence. After resizing the longest image side to 1024 pixels, 41.5% of US2 boxes have an area smaller than pixels, compared with 0.3–0.7% in the primary adaptation sequences. These distributions indicate variation in target scale across sequences. Terrain, illumination and platform metadata could not be verified from the available acquisition records.
Table 2.
Sequence composition and object sizes. Size is in pixels after resizing the longest image side to 1024 pixels, summarized as median [Q1, Q3] across both classes. Small denotes box area below pixels. All original images are pixels; sequence roles refer to the primary assignment.
3.2. Detector and Domain-Adaptation Framework
All experiments use YOLOv8-S with letterboxed RGB input [18]. YOLOv8-S was selected as a practical balance between accuracy, computational cost, and inference requirements for UAV/UGV applications. Fixing the detector architecture also isolates adaptation effects from differences in model capacity. Three source models are trained independently using seeds 1, 2, and 42 for at most 60 epochs. IID validation is performed every two epochs using teacher ; early stopping uses a patience of eight validation events and a minimum required improvement of 0.001. For each seed, the checkpoint with the highest IID validation teacher is retained and reused as the common initialization for every adaptation configuration associated with that seed.
Mean Teacher (MT) provides the shared teacher–student adaptation backbone [24]. The student is optimized using labeled source images together with pseudo-labeled target images, while the teacher is maintained as an exponential moving average (EMA) of the student. For each target image, the teacher predicts from a weakly augmented view. Predictions above confidence 0.45 are retained after non-maximum suppression (NMS) at intersection-over-union (IoU) 0.45. These settings are shared across the applicable configurations and fixed without tuning on held-out OOD labels. The pseudo-label detection term is included only when at least five retained pseudo-boxes are available in the target batch; the supervised source detection term is always included. The student receives a stronger photometric view containing color changes, grayscale conversion, blur, noise, and cutout. No geometric transformation is applied after pseudo-label generation so that teacher-generated boxes remain spatially aligned with the student image.
Both source pretraining and adaptation use the standard YOLOv8 detection loss for labeled or pseudo-labeled images. The detection loss is
where is the bounding-box regression term, is the classification term, and is the distribution focal loss (DFL) term used for bounding-box localization. The coefficients 7.5, 0.5 and 1.5 follow the Ultralytics configuration. The same detection criterion is applied to source ground-truth labels and retained target pseudo-labels [18].
The Mean Teacher objective is
where denotes a labeled source batch, an unlabeled target batch, the pseudo-labels generated by the teacher, and the number of retained pseudo-boxes in the target batch. The target pseudo-label loss weight is fixed at for all adapted configurations, so the retained target detection term contributes one-half the nominal weight of the supervised source detection term before any additional adaptation objectives are applied. The indicator function sets the target pseudo-label term to zero when fewer than five retained pseudo-boxes are available; the source detection term remains active in every update.
After each student update, the teacher parameters are updated according to
where 0.999 is the EMA decay applied to the previous teacher parameters and 0.001 is the complementary weight applied to the updated student parameters. Source and target batches each contain 16 images and are processed jointly during adaptation.
For configurations containing additional adaptation objectives, the general optimization objective is
where is the adversarial domain-alignment loss, is the cross-domain contrastive loss, is the class-prototype alignment loss, and is the feature-statistic alignment loss. The adversarial and contrastive coefficients are fixed at and , respectively. For prototype and texture alignment, and denote nominal target fractions used by the relative detached-scaling procedure described below rather than fixed loss coefficients. Terms not used by a configuration are inactive. The CAT-style configuration retains the adversarial loss and also changes pseudo-label selection through class-dependent thresholds. The thresholding mechanism introduces no further additive loss term.
Seven adaptation configurations are evaluated in addition to the source-only baseline. Mean Teacher uses pseudo-label supervision alone. Adaptive Teacher-style augments the teacher–student objective with a spatial domain discriminator and gradient reversal [14,37]. The discriminator is trained to distinguish source from target features, while gradient reversal encourages the detector backbone to learn less domain-specific representations. The adversarial term is weighted by .
Contrastive Mean Teacher (CMT)-style adaptation additionally applies region-of-interest (ROI)-level cross-domain contrastive learning using source ground-truth boxes and target pseudo-boxes [15]. Same-class source–target ROI pairs are treated as positives, whereas different-class pairs act as negatives. A supervised cross-domain contrastive objective of the following form is used:
where z is an -normalized ROI feature and . For anchor i, contains the retained ROIs from the opposite domain and its same-class positives. The set includes anchors from both domains with at least one positive and one negative in the opposite domain. The loss averages over positives within each anchor, then over valid anchors; it is zero when no valid anchor exists. The temperature is , ROI features are pooled to , and at most 128 ROIs are retained per domain. The contrastive term is weighted by .
Class-Aware Teacher (CAT)-style adaptation combines the same adversarial alignment used in the Adaptive Teacher-style configuration with class-dependent confidence thresholds for pseudo-label selection [16]. Let denote the exponentially averaged pseudo-label acceptance count for class c at update index t. The relative acceptance frequency is computed as
where C denotes the number of classes. The class-specific pseudo-label confidence threshold is then
with base confidence threshold and scaling factor . The acceptance statistics are updated from accepted pseudo-label counts using EMA momentum . Classes with acceptance frequencies above the across-class mean therefore receive higher confidence thresholds, whereas classes with lower relative acceptance frequencies receive lower thresholds, subject to the fixed bounds. The threshold mechanism changes pseudo-label selection without directly reweighting the source detection loss or using target-domain ground-truth labels. The complete CAT-style configuration also retains the adversarial loss with weight 0.1; therefore its comparison with Mean Teacher does not isolate class-dependent thresholding alone.
Prototype alignment encourages class-conditional agreement between source and target object representations [35]. Source and target ROI features are pooled within the current batch and averaged separately for each class. For the set of classes represented in both domains, the prototype loss is
where and denote the current-batch source and target ROI-feature centroids for class c, respectively, and D is the ROI-feature dimension. Source centroids are computed from source ground-truth ROIs, whereas target centroids are computed from pseudo-labeled target ROIs. If no class has usable ROIs in both domains, the prototype loss is set to zero, and the prototype term is applied only when at least four usable target ROIs are available. Momentum prototype banks with momentum 0.9 are maintained for diagnostic purposes only and are not used in the optimization loss. The nominal prototype-loss weight is .
Feature-statistic alignment, referred to here as texture alignment, matches channel-wise means and standard deviations between source and target feature maps at selected feature levels, following the general principle of feature-statistic transfer [36]:
where is the set of selected feature levels, is the number of channels at level l, and and are source and target feature maps. For each image and channel, the spatial mean and sample standard deviation are computed and then averaged across the domain batch. The squared differences are averaged over channels and feature levels, consistent with the mean reduction used in training. The nominal texture-alignment weight is .
For , the auxiliary contribution uses the dynamically recomputed coefficient
where t indexes optimizer updates and sg denotes stop-gradient. The source detection loss, rather than the total objective, is the reference magnitude. Both nominal fractions are . The coefficients are recomputed from the current batch whenever the corresponding contribution is eligible and are detached from gradient computation; they are not fixed for the training run. The denominator floor prevents division by zero and the upper cap is 100. Consequently, clipping can prevent a contribution from reaching its nominal fraction. In Equation (4), is one only when prototype alignment is enabled and at least four usable target ROIs are present; otherwise the prototype contribution is zero. A batch with no common source/target class has zero prototype loss. Inactive objectives are omitted. Adversarial and contrastive terms retain their fixed coefficients, and prototype and texture alignment are evaluated independently and jointly with Mean Teacher.
The suffix “-style” identifies configurations inspired by the cited methods and implemented within the common YOLOv8-S framework [14,15,16]. AT-style retains EMA self-training, weak and strong views and adversarial alignment. CMT-style adds symmetric class-based source–target contrast on student ROI features, whereas the original CMT uses teacher–student object-feature contrast. CAT-style applies acceptance-dependent class thresholds but omits the original inter-class relation module, class-relation augmentation and relation-weighted loss. Table 3 summarizes these distinctions, and Table 4 lists the active components. The comparison therefore concerns the implemented mechanisms under a common architecture.
Table 3.
Components of the YOLOv8-S configurations and their relationship to the original adaptation methods [14,15,16].
Table 4.
Adaptation configurations evaluated under the same detector architecture, source checkpoint, target images, and adaptation budget.
3.3. Training and Evaluation Protocol
All adaptation configurations receive the same target-domain exposure and optimization budget. In the primary assignment, each target epoch comprises 159 joint source–target updates with target batches sampled from 2550 images; each configuration is trained for the full 30 target epochs, yielding 4770 updates. Early stopping is disabled. IID validation is evaluated every five epochs using teacher as a monitoring metric, and the best validation checkpoint is saved for record keeping; however, training continues to the full budget and the reported OOD results use the final fixed-budget checkpoint. Consequently, held-out OOD labels do not influence stopping, checkpoint selection, or threshold tuning. Optimization uses stochastic gradient descent with learning rate 0.00147, momentum 0.937, weight decay 0.0005, and three warm-up epochs. The contrastive and adversarial loss weights are 0.05 and 0.1, respectively, while prototype and feature-statistic alignment each use a nominal weight of 0.05. The principal settings are summarized in Table 5.
Table 5.
Parameters used for source training, target-domain adaptation, evaluation, and reproducibility. Method-specific activation follows Table 4.
For each adapted configuration, both the final student and EMA-teacher checkpoints are evaluated. The held-out OOD test labels are never used to choose an adaptation epoch, tune a confidence threshold, or modify training. The source-only baseline is evaluated from the IID-selected source checkpoint. The Ultralytics validator uses a confidence floor of 0.001 to construct precision–recall curves, NMS IoU 0.50, and no test-time augmentation. Primary metrics are and COCO-style [38]. Here, AP denotes average precision for one class, and mAP denotes its mean across the evaluated classes. The subscripts indicate IoU 0.50 or the mean over IoU thresholds from 0.50 to 0.95 in steps of 0.05. All AP and mAP values are expressed as percentages, with precision, recall, and F1 reported as descriptive operating-point summaries. Recall is included explicitly because false negatives correspond to missed target detections; however, the validator-selected operating point is not treated as a deployment threshold. In addition to the primary held-out evaluation, is computed post hoc on the adaptation sequences and on the complete OOD collection using ground-truth labels only after training. These two diagnostic evaluations do not influence model fitting or selection: the held-out sequences remain the primary measure of generalization, while adaptation-sequence and all-OOD scores indicate whether gains are confined to the imagery observed during adaptation. Results are reported as mean and sample standard deviation over seeds 1, 2, and 42; with three training replicates per fixed assignment, small differences among adapted methods are interpreted descriptively rather than as evidence of statistical superiority.
3.4. Control Experiments and Diagnostic Analyses
Two controls are trained from each selected source teacher to separate the contribution of pseudo-label supervision from continued optimization. Both initialize student and teacher from the same source weights and reset the optimizer and scheduler. The joint control retains the Mean Teacher forward passes, source/target batches of 16/16, mixed-domain BatchNorm, augmentations, learning-rate schedule, EMA and 4770 updates, with and all auxiliary target losses disabled. Source continuation uses only the 16 source images at each update under the same source-supervision schedule. The comparison between Mean Teacher and the joint control estimates the contribution of pseudo-label supervision within this training procedure. The comparison between the joint control and source continuation also reflects differences in forward passes and random-number use, so it does not isolate BatchNorm.
For the complementary assignment, the joint control, Mean Teacher and CMT-style are each trained from all three source teachers for 4770 updates. The assignment and training schedule are fixed before these runs. Because this adaptation subset contains 1886 images, target batches repeat within each of the 30 epochs; equal update budgets therefore involve different numbers of traversals through the target images. Final epoch-30 teachers are evaluated without early stopping. The complementary assignment examines sensitivity within the same ten sequences rather than providing an independent geographic replication.
Teachers and controls are evaluated on the IID test set and on pooled and individual held-out sequences. Results include mean and sample standard deviation across seeds, together with differences paired by source seed. Sequence-level AP is recomputed from the corresponding detections; it is undefined for a class with no reference instances. Pooled AP is computed from pooled detections rather than by averaging sequence scores. These summaries distinguish training variation from variation across acquisitions.
Class-specific precision, recall and false positives per image (FP/image) are evaluated at confidence thresholds of 0.10, 0.25, 0.45, 0.60 and 0.75, with NMS IoU 0.50. Class-correct one-to-one matching at IoU 0.50 is recomputed after filtering at each threshold. This fixed grid describes the recall–false-positive tradeoff without selecting a deployment threshold. Final teachers also generate pseudo-label snapshots on adaptation images using the training letterbox, confidence 0.45 and NMS IoU 0.45; CAT-style uses its saved class thresholds. Class counts, precision, recall, confidence and size distributions are recorded. These deterministic snapshots characterize the final teacher but cannot recover the labels or class-specific supervision used throughout training.
All evaluations use explicit image lists linked to the curated SULAND_v2 annotations, with independent checks of image and class counts. Table 6 summarizes the data available at each stage. Seed-level metrics and diagnostic results are provided in Supplementary Material S1. Numerical results were computed from the recorded model outputs and curated annotations, with the image counts, class counts and pooled metrics checked as described above.
Table 6.
Use of images and annotations during training, model selection and evaluation.
4. Results
4.1. Aggregate Held-Out Performance
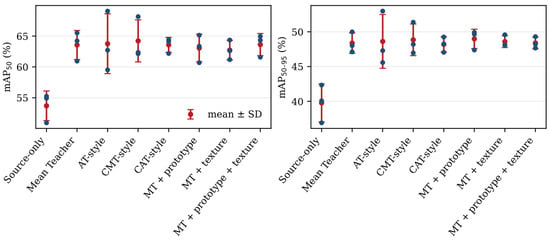
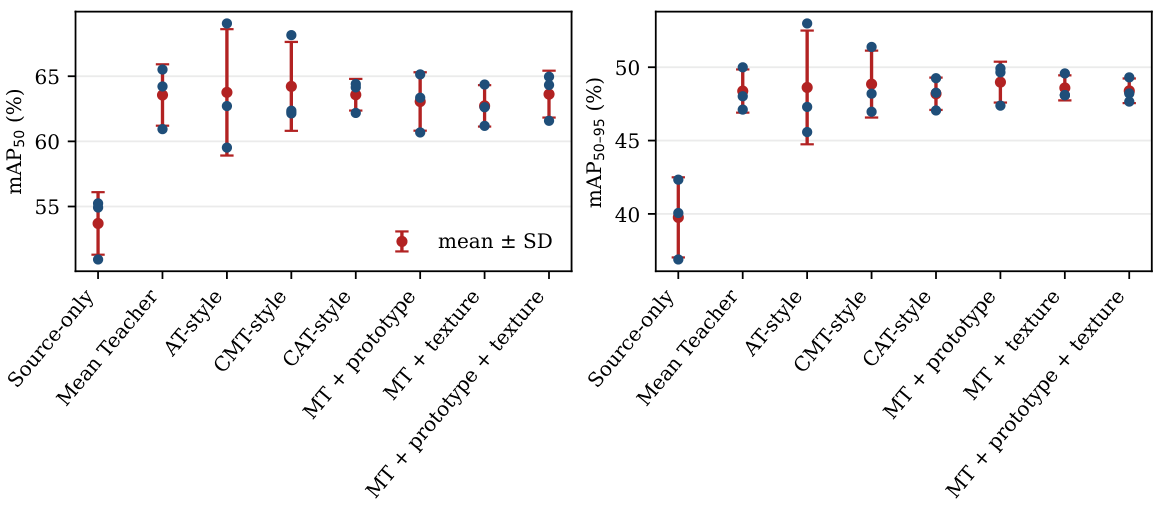
Table 7 summarizes teacher performance on the five sequences excluded from adaptation. The source-only model achieves and . All adaptation configurations have higher means for both metrics. CMT-style has the highest mean (), 10.52 percentage points above source-only, while MT + prototype has the highest mean (). Mean Teacher reaches and increases recall from to at the validator-selected operating point. Figure 2 shows the seed-level variation; the differences among adapted configurations are smaller than their gains over the source-only baseline.
Table 7.
Held-out OOD performance on the primary assignment using EMA-teacher checkpoints. Values are percentages and report mean ± sample standard deviation across seeds 1, 2, and 42.
Figure 2.
Held-out teacher performance by method and training seed. Points represent seeds 1, 2, and 42; summary markers show mean and sample standard deviation.
Table 8 compares post-training on the adaptation sequences, held-out sequences and complete OOD collection. Mean Teacher achieves on adaptation sequences and on held-out sequences; the corresponding CMT-style values are and . Improvements over source-only thus extend to sequences excluded from adaptation. The held-out results remain the primary evaluation because the other two partitions include images observed without labels during training.
Table 8.
EMA-teacher across target-domain partitions. Values are percentages and report mean ± sample standard deviation over seeds 1, 2, and 42. Adaptation-sequence labels are used only for post hoc evaluation.
4.2. Contribution of Pseudo-Label Supervision
Table 9 compares adaptation with controls receiving the same number of updates. Source continuation and the joint control achieve 48.33% and 44.60% on the primary held-out sequences, compared with 53.70% for source-only and 63.56% for Mean Teacher. Mean Teacher exceeds the joint control by percentage points, and CMT-style by points (mean ± paired sample SD; Table 10). Thus, additional source optimization alone does not account for the adaptation gain under this schedule. The joint control is points below source continuation, with appreciable variation across seeds.
Table 9.
Teacher performance for the primary assignment and controls trained for 4770 updates. The joint control uses batches of 16 source and 16 target images with no target loss. Values are percentages (mean ± sample SD across three seeds).
Table 10.
Paired changes in mAP relative to the indicated reference on the primary assignment (percentage points; mean ± sample SD across three seeds).
4.3. Sequence- and Class-Specific Performance
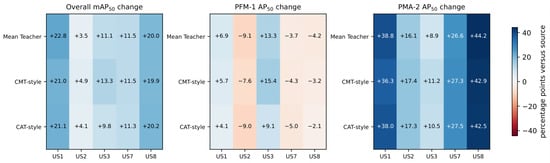
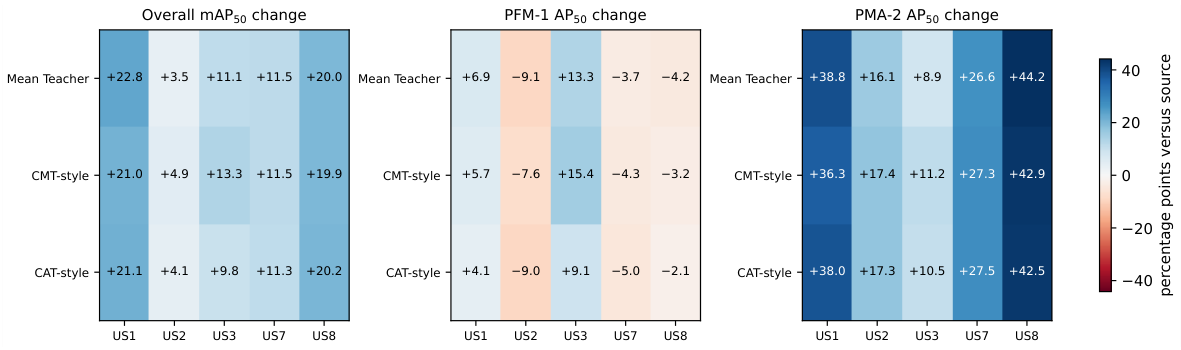
Table 11 reports and for each primary held-out sequence. Mean Teacher, CMT-style and CAT-style have positive mean changes on all five sequences, although the magnitude varies. Their PFM-1 decreases on US2, US7 and US8, rather than on every sequence. Figure 3 displays these aggregate and class-specific changes. Complete class results, instance counts and seed standard deviations are given in Table A3 in Appendix C.
Table 11.
Performance on the primary held-out sequences, reported as / (percentages; means across three seeds). Class counts list PFM-1/PMA-2 instances. Complete class-specific results are provided in Appendix C.
Figure 3.
Changes in aggregate and class-specific on the primary held-out sequences, relative to the same-seed source teacher and averaged across three seeds (percentage points).
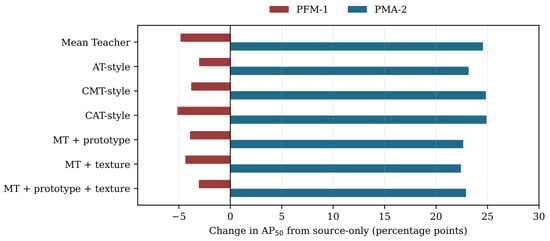
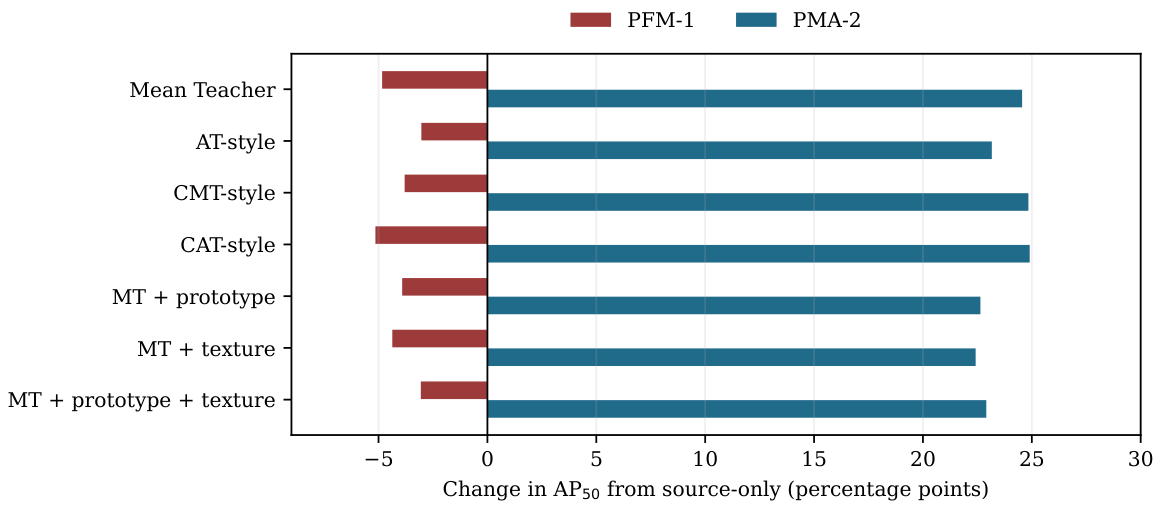
Table 12 shows a different response for the two mine classes on the primary assignment. Source-only is for PFM-1 and for PMA-2. All adaptation configurations have higher PMA-2 means and lower PFM-1 means. For CMT-style, these changes are and percentage points, respectively. Figure 4 summarizes the changes, indicating that PMA-2 accounts for the pooled improvement on this assignment.
Table 12.
Teacher by mine class on the primary assignment. Values are percentages and report mean ± sample standard deviation across three source-model seeds.
Figure 4.
Change in class-specific relative to source-only on the primary held-out sequences, averaged across three seeds (percentage points).
4.4. Sensitivity to the Complementary Assignment
When the sequence roles are reversed, source-only achieves 51.14% , the joint control 44.32%, Mean Teacher 78.82% and CMT-style 80.00% (Table 13). Mean Teacher and CMT-style exceed their joint control by 34.50 and 35.68 percentage points, respectively, and improve both class means relative to the source-only model evaluated on the same sequences. CMT-style exceeds Mean Teacher by points, compared with on the primary assignment. The change in PFM-1 response indicates sensitivity to the sequence assignment. Absolute scores across assignments concern different test images and should be interpreted accordingly.
Table 13.
Teacher performance on the complementary assignment, evaluated on US4, US5, US6, US9 and US10 (2550 images). Values are percentages (mean ± sample SD across three seeds).
4.5. Contribution of Additional Alignment
Table 14 compares prototype and feature-statistic alignment with Mean Teacher. Prototype alignment changes by points and by points. The corresponding changes are and for feature-statistic alignment and and for their combination. These small, mixed changes suggest limited benefit from the additional terms under this protocol.
Table 14.
Component analysis using EMA-teacher checkpoints. values are paired changes from Mean Teacher in percentage points, averaged across the same three source-model seeds.
The seed-matched comparisons in Table 15 show a similar pattern for the other mechanisms. CMT-style changes relative to Mean Teacher by , and percentage points for seeds 1, 2 and 42, respectively (mean ; sample SD 3.71). AT-style and CAT-style also yield changes of both signs. The higher CMT-style mean therefore represents a numerical advantage in these runs, with inconsistent improvement across seeds.
Table 15.
Changes from Mean Teacher paired by source-training seed (percentage points). Summary columns report mean ± sample SD of the three paired differences on the primary assignment.
4.6. Source-Domain Retention
On the 3743-image IID test set, source-only, Mean Teacher, CMT-style and MT + prototype + texture achieve 90.52%, 89.16%, 89.17% and 88.19% , respectively (Table 16). The paired mean decreases from source-only are 1.37 points for Mean Teacher and 2.33 points for the full combination. The OOD improvements are therefore accompanied by modest source-domain losses despite retaining source supervision.
Table 16.
Teacher performance on the 3743-image IID test set (percentages; mean ± sample SD). Changes from source-only are paired by seed and expressed in percentage points.
4.7. Student Checkpoint Results
Student results broadly follow the teacher results (Table 17). CMT-style has the highest mean student (), while MT + prototype has the highest (). Differences between student and teacher checkpoints are generally small and depend on the metric and configuration. The teacher checkpoints remain the primary reference for the adaptation comparisons.
Table 17.
Held-out OOD performance using student checkpoints. Values are percentages and report mean ± sample standard deviation across seeds 1, 2, and 42.
4.8. Recall, False Positives and Pseudo-Label Quality
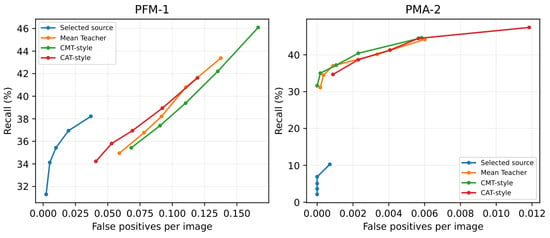
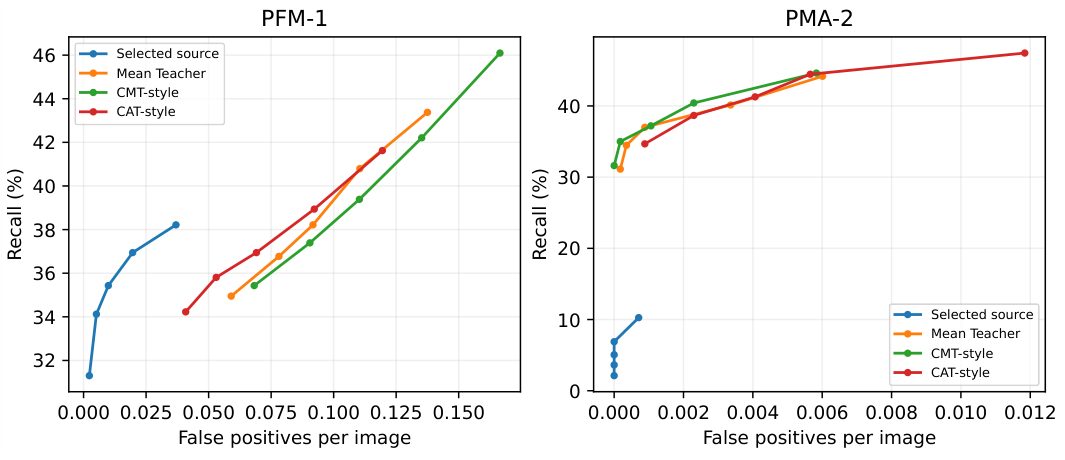
Table 18 compares class-specific performance at a common confidence threshold of 0.45. From source-only to Mean Teacher, PFM-1 recall increases from 35.43% to 38.22%, while FP/image rises from 0.010 to 0.092. PMA-2 recall increases from 5.05% to 37.00%, with FP/image increasing from zero to approximately 0.001. Figure 5 shows the corresponding tradeoffs across the fixed confidence grid. These results complement AP, which summarizes performance over confidence thresholds.
Table 18.
Class-specific precision, recall and false positives per image on the primary held-out sequences at confidence 0.45 and NMS IoU 0.50. Values are mean ± sample SD across seeds; precision and recall are percentages.
Figure 5.
Class-specific recall versus false positives per image on the primary held-out sequences at confidence thresholds of 0.10, 0.25, 0.45, 0.60 and 0.75. Each point is a mean across three seeds.
Final pseudo-label snapshots also differ by class (Table 19). Mean Teacher accepts an average of 785.3 PFM-1 and 262.7 PMA-2 boxes, with precision of 78.77% and 95.50% and recall of 41.64% and 43.09%, respectively. More accepted PFM-1 boxes therefore do not imply more accurate supervision. The supplementary CSV files include confidence and size quantiles. These final snapshots describe the trained teacher; historical class-specific supervision cannot be inferred from them.
Table 19.
Final-teacher pseudo-labels on the 2550 primary adaptation images (mean ± sample SD across seeds). Precision and recall use matching IoU 0.50 with the training confidence and NMS filters; CAT-style uses its saved class thresholds.
5. Discussion
5.1. Contribution of Target Supervision
The results suggest that pseudo-label supervision can improve detection on acquisition sequences excluded from adaptation. Mean Teacher performs better than both source continuation and the joint control under the same update budget. Its gains over the joint control, 18.96 and 34.50 points on the two assignments, support a contribution from target supervision beyond additional optimization under the evaluated schedule. The variable difference between the two controls leaves the separate role of mixed-domain normalization less clear.
Teacher–student methods use the teacher to supply supervision in the unlabeled domain, making pseudo-label quality central to transfer [14,15,24]. In the present experiments, additional alignment produces limited improvement over Mean Teacher on the primary assignment. The CMT-style advantage changes sign across seeds, while prototype, feature-statistic and class-threshold components have small or mixed effects. This finding concerns the mechanisms implemented within YOLOv8-S; the differences from the original systems in Table 3 limit comparison with their published results.
5.2. Class- and Sequence-Dependent Transfer
The pooled improvement on the primary assignment is concentrated in PMA-2, with lower PFM-1 across the adaptation configurations. However, sequence-level results show that the PFM-1 decrease is not shared by every acquisition, and both classes improve with Mean Teacher and CMT-style on the complementary assignment. The class response therefore appears to depend on the adaptation and evaluation imagery. Differences in target scale and class composition provide possible contributing factors, but the present comparisons do not isolate their effects.
The 1485 PFM-1 and 584 PMA-2 reference boxes in the primary adaptation subset describe class availability, whereas effective target supervision depends on the teacher’s accepted pseudo-labels. This distinction is relevant to class bias in teacher–student adaptation [16]. The final snapshots show lower pseudo-label precision for PFM-1, which is compatible with unequal supervision quality. Historical class-specific counts were not recorded for the original runs, so differences in the amount and quality of supervision remain possible explanations of negative transfer. Target geometry, occlusion and background correlation may also contribute, as optical mine detection is sensitive to visibility conditions [8]; these factors require controlled investigation.
5.3. Generalization and Practical Implications
Separating complete sequences addresses direct overlap between neighboring adaptation and test frames. Related work on online mapping shows that shared acquisition locations can inflate apparent generalization [17]. Here, the absence of flagged dHash pairs provides a limited overlap check, while both assignments still draw from the same ten sequences. The three-seed standard deviations describe training variation within an assignment rather than uncertainty across future sites or acquisition conditions. The IID results further indicate a modest cost in source-domain accuracy, which should be considered alongside the OOD gains.
The class-specific recall–false-positive curves help qualify the aggregate improvement. For PFM-1, the small recall increase at confidence 0.45 is accompanied by more false positives; the PMA-2 tradeoff is more favorable at that point. FP/image is nevertheless only an image-based error measure: repeated frames, unknown surveyed area and unmeasured review time prevent translating it directly into analyst workload. Operational thresholds would require separate development data and validation under the intended conditions. RGB imagery is most relevant to visible-target candidate generation and survey prioritization, within a broader evidence-based mine-action process [5,6]. The present benchmark does not establish clearance reliability.
5.4. Limitations and Future Work
The study is limited to one dataset, two visible mine classes, one detector and three source-training seeds. The complementary assignment covers the joint control, Mean Teacher and CMT-style, so sensitivity of the remaining configurations to sequence assignment remains unresolved. Acquisition-condition records could not be verified, and final pseudo-label snapshots cannot reconstruct the supervision received throughout training.
Evaluation on independent sites and sensors, repeated sequence assignments and additional mine types would help assess the extent of transfer. Recording class-specific pseudo-labels throughout training would also support a closer examination of negative transfer. Foreground-aware and uncertainty-guided adaptation are possible directions for this investigation.
6. Conclusions
This study examined unsupervised domain adaptation for RGB surface-landmine detection using sequence-held-out evaluation on SULAND_v2. On the primary assignment, increased from 53.70% for source-only to 63.56% for Mean Teacher and 64.22% for CMT-style. Comparisons with controls trained for the same number of updates support a contribution from pseudo-label supervision, while additional alignment offered limited and inconsistent improvement over Mean Teacher across seeds.
The pooled gain was accompanied by different class responses: PMA-2 improved and PFM-1 declined on the primary assignment, whereas both classes improved under the complementary Mean Teacher and CMT-style experiments. Together with sequence-level variation, false-positive behavior and modest source-domain losses, these findings suggest that adaptation benefits should be assessed beyond pooled accuracy. Unlabeled target imagery may assist candidate generation for visible surface mines, with independent acquisition data and operational validation needed to assess its practical reliability.
Supplementary Materials
The following supporting information can be downloaded at https://www.mdpi.com/article/10.3390/rs18223981/s1, Supplementary Material S1 provides seed-level evaluation metrics, class-specific operating points, final pseudo-label summaries, paired comparisons and object-size measurements in CSV format.
Author Contributions
Conceptualization, S.L.; methodology, S.L. and L.J.; software, S.L. and L.J.; validation, S.L. and L.J.; formal analysis, S.L. and L.J.; investigation, S.L. and L.J.; resources, S.L.; data curation, S.L. and L.J.; writing—original draft preparation, S.L. and L.J.; writing—review and editing, S.L., L.J. and E.J.I.; visualization, S.L.; supervision, A.S., K.C.D. and E.J.I. All authors have read and agreed to the published version of the manuscript.
Funding
This research received no external funding.
Institutional Review Board Statement
Not applicable.
Informed Consent Statement
Not applicable.
Data Availability Statement
The data analyzed in this study are publicly available in the SULAND_v2 RGB Surface Landmine Dataset at https://huggingface.co/datasets/SagarLekhak/SULAND_v2_RGB_Surface_Landmine_Dataset (accessed on 8 August 2026). The dataset is described in the associated SULAND_v2 publication (https://doi.org/10.48550/arXiv.2607.28996).
Acknowledgments
The authors acknowledge the creators and contributors of the SULAND and SULAND_v2 datasets and the computing resources provided by the Rochester Institute of Technology. The authors take responsibility for the content of this publication.
Conflicts of Interest
The authors declare no conflicts of interest.
Abbreviations
The following abbreviations are used in this manuscript:
| AP | Average precision |
| mAP | Mean average precision |
| MT | Mean Teacher |
| CAT | Class-Aware Teacher |
| CMT | Contrastive Mean Teacher |
| EMA | Exponential moving average |
| F1 | F1 score |
| IID | In-distribution |
| IoU | Intersection over union |
| NMS | Non-maximum suppression |
| OOD | Out-of-distribution |
| ROI | Region of interest |
| UDA | Unsupervised domain adaptation |
| UDAOD | Unsupervised domain adaptation for object detection |
| UAV | Unmanned aerial vehicle |
| UGV | Unmanned ground vehicle |
Appendix A. Implementation Details
Source models use seeds 1, 2 and 42 and the same public YOLOv8-S initialization. The selected source checkpoints originate from epochs 18, 28 and 34, respectively; early stopping occurs at epochs 26, 36 and 42. Within each seed, both student and teacher initialize from the selected source teacher, with the optimizer, scheduler and epoch counter reset for adaptation. Table 5 and Table A1 summarize the settings; the details below specify component-level computation.
Appendix A.1. Target Adaptation and Final Evaluation
For the primary assignment, the target loader accesses only RGB images from US4, US5, US6, US9 and US10. Each epoch comprises 159 joint updates, giving 4770 updates over 30 epochs. The complementary assignment reverses sequence roles and repeats target batches to retain this budget. Fixed-threshold configurations use confidence 0.45 and NMS IoU 0.45, with at least five pseudo-boxes required for target detection loss. CAT-style thresholds vary within 0.25–0.70.
All reported adapted models use the final epoch-30 checkpoint. IID validation is monitored every five epochs and a best-validation checkpoint is archived, but it does not replace the final checkpoint in the reported evaluation. Neither IID-test nor held-out OOD labels select checkpoints or thresholds. Student and EMA-teacher weights are evaluated with confidence floor 0.001 and NMS IoU 0.50, and all three seeds enter the reported summaries.
Appendix A.2. Training Parameters
Table A1 collects the training, adaptation and evaluation parameters used across configurations.
Table A1.
Training, adaptation and evaluation parameters.
The spatial adversarial discriminator uses layer 6, hidden width 128, two convolution/ReLU stages and a output; binary cross-entropy uses GRL scale 1.0. CMT-style pools layer-4 ROIs to , averages spatially, normalizes, retains the first at most 128 eligible ROIs per domain, and uses temperature 0.1. An ROI must span at least 1.5 feature cells in both dimensions; contrastive anchors need both a cross-domain positive and a negative. Prototype alignment uses layer 4, the same minimum ROI span and pool size, per-class current-batch centroids, at least four usable target ROIs, and no background prototype. Texture statistics use layers 4 and 6 with mean reduction. Scale consistency is inactive. The shared objective weights, dynamic scaling, thresholds, EMA and augmentation settings are listed above and in the archived effective configurations.
The strong student target view uses brightness, contrast, and saturation amplitudes of 0.4, hue amplitude of 0.1, Gaussian-noise standard deviation of 0.05, grayscale probability of 0.2, blur probability of 0.5, and cutout probability of 0.5 with three erased regions. These transformations are photometric and do not alter the geometry of teacher-generated pseudo boxes.
Appendix B. Complete Seed-Level Results
Table A2 gives the individual teacher and student results underlying the main-text summaries.
Table A2.
Held-out OOD performance by checkpoint and source-training seed (percentages).
Appendix C. Sequence-Level Results and Object Sizes
Table A3 provides aggregate and class-specific teacher performance by sequence, with sample standard deviations across seeds. Table A4 reports class-specific bounding-box widths, heights and the square root of box area after resizing. The accompanying CSV files retain individual-seed metrics and object-size measurements.
Table A3.
Sequence-level teacher performance (percentages; mean ± sample SD across seeds). Class counts are given in Table 2.
Table A4.
Class-specific box dimensions after resizing the longest image side to 1024 pixels. Width, height and are expressed in pixels as median [Q1, Q3].
References
- International Campaign to Ban Landmines. Landmine Monitor 2025. 2025. Available online: https://the-monitor.org/reports/landmine-monitor-2025 (accessed on 25 September 2026).
- Makki, I.; Younes, R.; Francis, C.; Bianchi, T.; Zucchetti, M. A Survey of Landmine Detection Using Hyperspectral Imaging. ISPRS J. Photogramm. Remote Sens. 2017, 124, 40–53. [Google Scholar] [CrossRef] [Scilit]
- Yoo, L.S.; Lee, J.H.; Ko, S.H.; Jung, S.K.; Lee, S.H.; Lee, Y.K. Application of a Drone Magnetometer System to Military Mine Detection in the Demilitarized Zone. Sensors 2021, 21, 3175. [Google Scholar] [CrossRef] [Scilit] [PubMed]
- Baur, J.; Lekhak, S.; Steinberg, G.; Nikulin, A.; de Smet, T.; Brinkley, A.; Ientilucci, E.J.; Nitsche, F.; Myers, H.; Elliott, J.; et al. A Comparative Evaluation of UAV-Based Remote Sensing and Geophysical Techniques for Landmine Detection on a Seeded Minefield. Remote Sens. 2026, 18, 2182. [Google Scholar] [CrossRef] [Scilit]
- United Nations Mine Action Service. IMAS 08.10: Non-Technical Survey; International Mine Action Standards, Amendment 4; United Nations Mine Action Service: New York, NY, USA, 2019. [Google Scholar]
- United Nations Mine Action Service. IMAS 07.11: Land Release; International Mine Action Standards; United Nations Mine Action Service: New York, NY, USA, 2026. [Google Scholar]
- Baur, J.; Steinberg, G.; Nikulin, A.; Chiu, K.; de Smet, T.S. Applying Deep Learning to Automate UAV-Based Detection of Scatterable Landmines. Remote Sens. 2020, 12, 859. [Google Scholar] [CrossRef] [Scilit]
- Baur, J.; Dewey, K.; Steinberg, G.; Nitsche, F.O. Modeling the Effect of Vegetation Coverage on Unmanned Aerial Vehicles-Based Object Detection: A Study in the Minefield Environment. Remote Sens. 2024, 16, 2046. [Google Scholar] [CrossRef] [Scilit]
- Qiu, Z.; Guo, H.; Hu, J.; Jiang, H.; Luo, C. Joint Fusion and Detection via Deep Learning in UAV-Borne Multispectral Sensing of Scatterable Landmine. Sensors 2023, 23, 5693. [Google Scholar] [CrossRef] [Scilit] [PubMed]
- Vivoli, E.; Bertini, M.; Capineri, L. Deep Learning-Based Real-Time Detection of Surface Landmines Using Optical Imaging. Remote Sens. 2024, 16, 677. [Google Scholar] [CrossRef] [Scilit]
- Lekhak, S.; Pulakurthi, P.R.; Joshi, L.; Bhatta, R.; Ientilucci, E.J. SULAND v2: A Refined RGB Dataset and Deep Learning Object Detection Benchmark for UAV/UGV-Based Surface Landmine Detection under Domain Shift. arXiv 2026. [Google Scholar] [CrossRef] [Scilit]
- Oza, P.; Sindagi, V.A.; VS, V.; Patel, V.M. Unsupervised Domain Adaptation of Object Detectors: A Survey. IEEE Trans. Pattern Anal. Mach. Intell. 2024, 46, 4018–4040. [Google Scholar] [CrossRef] [Scilit] [PubMed]
- Chen, Y.; Li, W.; Sakaridis, C.; Dai, D.; Van Gool, L. Domain Adaptive Faster R-CNN for Object Detection in the Wild. In Proceedings of the IEEE Conference on Computer Vision and Pattern Recognition; IEEE: Piscataway, NJ, USA, 2018; pp. 3339–3348. [Google Scholar] [CrossRef] [Scilit]
- Li, Y.J.; Dai, X.; Ma, C.Y.; Liu, Y.C.; Chen, K.; Wu, B.; He, Z.; Kitani, K.; Vajda, P. Cross-Domain Adaptive Teacher for Object Detection. In Proceedings of the IEEE/CVF Conference on Computer Vision and Pattern Recognition; IEEE: Piscataway, NJ, USA, 2022; pp. 7581–7590. [Google Scholar] [CrossRef] [Scilit]
- Cao, S.; Joshi, D.; Gui, L.Y.; Wang, Y.X. Contrastive Mean Teacher for Domain Adaptive Object Detectors. In Proceedings of the IEEE/CVF Conference on Computer Vision and Pattern Recognition; IEEE: Piscataway, NJ, USA, 2023; pp. 23839–23848. [Google Scholar] [CrossRef] [Scilit]
- Kennerley, M.; Wang, J.G.; Veeravalli, B.; Tan, R.T. CAT: Exploiting Inter-Class Dynamics for Domain Adaptive Object Detection. In Proceedings of the IEEE/CVF Conference on Computer Vision and Pattern Recognition; IEEE: Piscataway, NJ, USA, 2024; pp. 16541–16550. [Google Scholar] [CrossRef] [Scilit]
- Lilja, A.; Fu, J.; Stenborg, E.; Hammarstrand, L. Localization Is All You Evaluate: Data Leakage in Online Mapping Datasets and How to Fix It. In Proceedings of the IEEE/CVF Conference on Computer Vision and Pattern Recognition; IEEE: Piscataway, NJ, USA, 2024; pp. 22150–22159. [Google Scholar] [CrossRef] [Scilit]
- Ultralytics. Ultralytics YOLO. Version 8.2.34. 2024. Available online: https://github.com/ultralytics/ultralytics (accessed on 8 August 2026).
- Wang, Y.; Li, Z.; Zhu, S.; Wei, X. EFCNet for Small Object Detection in Remote Sensing Images. Sci. Rep. 2025, 15, 20393. [Google Scholar] [CrossRef] [Scilit] [PubMed]
- Lekhak, S.; Ientilucci, E.J.; Dera, D.; Ghosh, S. Uncertainty Quantification in Surface Landmines and UXO Classification Using MC Dropout. In Proceedings of the 2025 IEEE International Geoscience and Remote Sensing Symposium (IGARSS); IEEE: Piscataway, NJ, USA, 2025; pp. 1177–1181. [Google Scholar] [CrossRef] [Scilit]
- Lekhak, S.; Ientilucci, E.J.; Baur, J.; Ghosh, S. A UAV-Based VNIR Hyperspectral Benchmark Dataset for Landmine and UXO Detection. In Proceedings of the 2025 IEEE India Geoscience and Remote Sensing Symposium (InGARSS); IEEE: Piscataway, NJ, USA, 2025; pp. 990–994. [Google Scholar] [CrossRef] [Scilit]
- Lekhak, S.; Pulakurthi, P.R.; Bhatta, R.; Ientilucci, E.J. Benchmarking Deep Learning and Statistical Target Detection Methods for PFM-1 Landmine Detection in UAV Hyperspectral Imagery. arXiv 2026. [Google Scholar] [CrossRef] [Scilit]
- Saito, K.; Ushiku, Y.; Harada, T.; Saenko, K. Strong-Weak Distribution Alignment for Adaptive Object Detection. In Proceedings of the IEEE/CVF Conference on Computer Vision and Pattern Recognition; IEEE: Piscataway, NJ, USA, 2019; pp. 6956–6965. [Google Scholar] [CrossRef] [Scilit]
- Tarvainen, A.; Valpola, H. Mean Teachers Are Better Role Models: Weight-Averaged Consistency Targets Improve Semi-Supervised Deep Learning Results. In Proceedings of the Advances in Neural Information Processing Systems; Curran Associates Inc.: Red Hook, NY, USA, 2017; Volume 30. [Google Scholar]
- Cai, Q.; Pan, Y.; Ngo, C.W.; Tian, X.; Duan, L.; Yao, T. Exploring Object Relation in Mean Teacher for Cross-Domain Detection. In Proceedings of the IEEE/CVF Conference on Computer Vision and Pattern Recognition; IEEE: Piscataway, NJ, USA, 2019; pp. 11457–11466. [Google Scholar] [CrossRef] [Scilit]
- Deng, J.; Li, W.; Chen, Y.; Duan, L. Unbiased Mean Teacher for Cross-Domain Object Detection. In Proceedings of the IEEE/CVF Conference on Computer Vision and Pattern Recognition; IEEE: Piscataway, NJ, USA, 2021; pp. 4091–4101. [Google Scholar] [CrossRef] [Scilit]
- Liu, Y.C.; Ma, C.Y.; He, Z.; Kuo, C.W.; Chen, K.; Zhang, P.; Wu, B.; Kira, Z.; Vajda, P. Unbiased Teacher for Semi-Supervised Object Detection. In Proceedings of the International Conference on Learning Representations, Virtual, 3–7 May 2021. [Google Scholar]
- Xu, M.; Zhang, Z.; Hu, H.; Wang, J.; Wang, L.; Wei, F.; Bai, X.; Liu, Z. End-to-End Semi-Supervised Object Detection with Soft Teacher. In Proceedings of the IEEE/CVF International Conference on Computer Vision; IEEE: Piscataway, NJ, USA, 2021; pp. 3060–3069. [Google Scholar] [CrossRef] [Scilit]
- Chen, B.; Chen, W.; Yang, S.; Xuan, Y.; Song, J.; Xie, D.; Pu, S.; Song, M.; Zhuang, Y. Label Matching Semi-Supervised Object Detection. In Proceedings of the IEEE/CVF Conference on Computer Vision and Pattern Recognition; IEEE: Piscataway, NJ, USA, 2022; pp. 14381–14390. [Google Scholar] [CrossRef] [Scilit]
- Fang, F.; Kang, J.; Li, S.; Tian, P.; Liu, Y.; Luo, C.; Zhou, S. Multi-Granularity Domain-Adaptive Teacher for Unsupervised Remote Sensing Object Detection. Remote Sens. 2025, 17, 1743. [Google Scholar] [CrossRef] [Scilit]
- Kim, J.; Park, J.; Jang, H.; Ha, N.; Sohn, K. Source-Free Domain Adaptation for Remote Sensing Object Detection Using Low-Confidence Pseudolabels. IEEE Geosci. Remote Sens. Lett. 2025, 22, 6006705. [Google Scholar] [CrossRef] [Scilit]
- Jin, H.; Hu, Y.; Liu, X.; Niu, A.; Yan, Q.; Sun, J.; Zhang, Y. History-Aware Adaptive Teacher for Cross-Domain Object Detection. Expert Syst. Appl. 2026, 319, 132060. [Google Scholar] [CrossRef] [Scilit]
- Zhang, X.; Yao, X.; Cheng, G.; Han, J. Domain Adaptation for Object Detection Based on Domain-Aware Prompting in Remote Sensing Imagery. IEEE Trans. Geosci. Remote Sens. 2026, 64, 5607916. [Google Scholar] [CrossRef] [Scilit]
- Cui, Y.; Li, L.; Yin, H.; Gao, Y.; Sheng, X.; Yan, C. Expert-Teacher-Student Collaborative Learning for Domain Adaptive Object Detection. In Proceedings of the IEEE/CVF Conference on Computer Vision and Pattern Recognition; IEEE: Piscataway, NJ, USA, 2026; pp. 25557–25567. [Google Scholar]
- Kang, G.; Jiang, L.; Yang, Y.; Hauptmann, A.G. Contrastive Adaptation Network for Unsupervised Domain Adaptation. In Proceedings of the IEEE/CVF Conference on Computer Vision and Pattern Recognition; IEEE: Piscataway, NJ, USA, 2019; pp. 4893–4902. [Google Scholar] [CrossRef] [Scilit]
- Huang, X.; Belongie, S. Arbitrary Style Transfer in Real-Time with Adaptive Instance Normalization. In Proceedings of the IEEE International Conference on Computer Vision; IEEE: Piscataway, NJ, USA, 2017; pp. 1501–1510. [Google Scholar] [CrossRef] [Scilit]
- Ganin, Y.; Ustinova, E.; Ajakan, H.; Germain, P.; Larochelle, H.; Laviolette, F.; Marchand, M.; Lempitsky, V. Domain-Adversarial Training of Neural Networks. J. Mach. Learn. Res. 2016, 17, 1–35. [Google Scholar]
- Lin, T.Y.; Maire, M.; Belongie, S.; Hays, J.; Perona, P.; Ramanan, D.; Dollár, P.; Zitnick, C.L. Microsoft COCO: Common Objects in Context. In Proceedings of the European Conference on Computer Vision; Springer: Cham, Switzerland, 2014; pp. 740–755. [Google Scholar] [CrossRef] [Scilit]

Disclaimer/Publisher’s Note: The statements, opinions and data contained in all publications are solely those of the individual author(s) and contributor(s) and not of MDPI and/or the editor(s). MDPI and/or the editor(s) disclaim responsibility for any injury to people or property resulting from any ideas, methods, instructions or products referred to in the content. |
© 2026 by the authors. Licensee MDPI, Basel, Switzerland. This article is an open access article distributed under the terms and conditions of the Creative Commons Attribution (CC BY) license.