


Highlights
What are the main findings?
- We integrated Sentinel-1 SAR and Sentinel-2 optical multi-source remote sensing data combined with ensemble machine learning to accurately map mangrove and invasive S. alterniflora distribution in Zhangjiang Estuary, and realized long-term dynamic monitoring from 2016 to 2025.
- Large-scale eradication of S. alterniflora has been accompanied by significant improvement in mangrove community structure. Mangrove area expanded to 183.5 ha after 2022, and the reduction in S. alterniflora of over 98% was highly consistent with the 118.3% increase in above-ground vegetation carbon stock during 2021–2025, suggesting a close temporal association between invasive-species management and the observed blue-carbon sink enhancement.
What are the implications of the main findings?
- The cloud-based multi-source remote sensing monitoring framework proposed in this study provides a low-cost, high-precision technical scheme for long-term blue carbon dynamic assessment of subtropical coastal mangrove wetlands.
- The quantitative carbon sink recovery results offer direct data support for coastal wetland restoration planning, S. alterniflora management and regional blue carbon accounting decision-making.
Abstract
Mangroves are critical components of coastal wetland ecosystems, providing essential services such as high-capacity carbon sequestration, biodiversity conservation, and shoreline protection. They play an irreplaceable role in mitigating climate change and maintaining coastal ecological balance. However, the effects of S. alterniflora management on mangrove carbon sinks in coastal wetlands remain poorly quantified, particularly with respect to canopy structural constraints. To address this issue, this study took the Zhangjiang Estuary Mangrove National Nature Reserve in Fujian Province as the study area and constructed a retrieval framework for mangrove above-ground vegetation carbon stock integrating Sentinel-1/2 multi-source remote sensing and ICESat-2 spaceborne LiDAR data. Based on the 10-year time series data from 2016 to 2025, we analyzed the spatiotemporal evolution patterns of mangroves and S. alterniflora. Mangrove area was calculated by counting valid mangrove pixels from 10-m annual land-cover maps generated by the accuracy-validated Random Forest classifier, with pixel area used for areal conversion. We further selected three key years (2021, 2023, and 2025) to explore the phased-variation characteristics of mangrove canopy height and above-ground vegetation carbon stock. The results showed that: (1) the mangrove area in Zhangjiang Estuary increased significantly from 2016 to 2025, with two phases, namely stable at 75.78–81.34 ha (2016–2022) and rapid growth to 183.49 ha by 2025, which is consistent with the expected outcomes of local conservation and restoration practices; (2) mangrove canopy height was retrieved using the random forest model, with a coefficient of determination R2 of 0.75 and a root mean square error (RMSE) of 0.92 m, which reliably characterized the spatial distribution patterns of mangrove canopy height in the study area; and (3) from 2021 to 2025, S. alterniflora coverage dropped by more than 98%, while mangrove carbon storage rose 118.3% and vegetation expanded outward to tidal flats. The enhancement of mangrove carbon sink function was highly consistent with the implementation progress of S. alterniflora governance and associated mangrove restoration practices. The results of this study provide a scientific basis for evaluating invasive alien species management outcomes, guiding mangrove ecological restoration, and optimizing blue carbon resource management in coastal wetland ecosystems.
1. Introduction
Mangroves rank among Earth’s most productive coastal wetland ecosystems and deliver key functions for climate regulation, biodiversity conservation and coastal security, supporting SDG 11 and SDG 13 [1,2,3,4]. As vital blue-carbon ecosystems, mangroves possess remarkable carbon sequestration potential, storing large amounts of organic carbon in both above-ground vegetation and subsurface sediment pools and playing an irreplaceable role in offsetting anthropogenic carbon emissions. Nevertheless, global mangroves are suffering widespread habitat degradation caused by climate change, coastal reclamation, urban expansion and invasive species, which damages community structure and carbon-sink capacity [5]. Against such a backdrop, accurate spatial mapping and long-term observation become prerequisites for understanding mangrove ecosystem evolution. Hence, high-precision dynamic monitoring and quantitative carbon-stock assessment are urgently needed for conservation practice, whereas current remote-sensing approaches still suffer from accuracy limits, estimation bias and difficulties capturing fine-scale spatiotemporal variation [6].
Accurate mangrove classification is fundamental to coastal wetland monitoring and conservation, and the choice of data sources directly influences classification accuracy, making multi-source data fusion a prevailing trend in mangrove mapping. Early large-scale mapping efforts predominantly relied on medium-to-low resolution imagery, such as Landsat and SPOT series. Bullock et al. [7] applied multi-temporal Landsat time series to classify mangrove communities in the Mekong Delta and revealed their long-term zonation succession patterns. However, Valderrama-Landeros et al. [8] mapped mangrove distribution in Mexico using only Landsat imagery and achieved an overall accuracy of only 64.0%, confirming that single-source medium-to-low resolution optical data fall short of the requirements for fine-scale ecological surveys. Hyperspectral data excel at capturing subtle spectral variations in vegetation and offer unique advantages for fine-scale mangrove identification, yet spaceborne hyperspectral sensors suffer from low spatial resolution, while airborne surveys are costly and involve complex data processing, limiting their wider application. Synthetic Aperture Radar (SAR) enables all-weather observation to compensate for cloud and fog interference in coastal areas, but it lacks fine spectral information and cannot readily distinguish mangrove species with similar structural traits. Given the inherent limitations of each individual data source, optical-SAR data fusion has emerged as a key approach to balancing large-scale monitoring with refined analytical needs. Aja Daniel et al. [9] integrated Landsat optical imagery and Sentinel-1 SAR data on the GEE platform to map mangroves along Ghana’s western coast, achieving an overall accuracy of 99.1%. Multi-source remote sensing collaborative modeling supported by GEE cloud computing power can greatly improve the efficiency and accuracy of blue carbon stock estimation in coastal wetlands. Datasets fusing optical and SAR data deliver much higher inversion accuracy than single-source data, and such fusion techniques have become the mainstream technical solution for wetland carbon estimation [10].
The continuous advancement of classification methods is critical for improving accuracy and adapting to multi-source data fusion. Early classification techniques, including visual interpretation and pixel-based maximum likelihood classification [11], were plagued by high labor costs, spectral confusion, and severe salt-and-pepper noise. Support Vector Machine (SVM) and Random Forest (RF), leveraging their capacity for multi-source feature fusion, have become mainstream algorithms for complex land cover classification. Michałowska et al. [12] confirmed through a review that SVM and RF perform stably and excellently in fine-scale tree species identification. Sun et al. [13] applied XGBoost combined with Landsat time-series data to classify salt marsh species in Jiangsu, China. Zhou et al. [14] compared multiple ensemble learning models and demonstrated that tree-based models can achieve over 91% accuracy using high-dimensional hyperspectral features. Traditional statistical classification models cannot describe complex correlations among multi-source remote sensing features and fail to meet the requirements of refined mapping. In contrast, machine learning models including Random Forest and gradient boosting trees can fully extract multi-dimensional spectral, texture and structural features, and have become the prevailing technology for fine mangrove classification.
Mangroves constitute the core component of coastal wetland carbon pools, and soil organic carbon accounts for 50–90% of total carbon storage and the per-unit-area carbon density of mangroves is 2–3 times that of terrestrial forests [15]. Carbon stock estimation is divided into two categories: allometric equation method and remote sensing inversion method [16]. The former estimates biomass through destructive sampling and regression analysis using parameters such as tree height, diameter at breast height, and crown width. Fromard et al. [17] Komiyama et al. [18], and Clough [19] have explored this from the perspectives of species-specific models, universal allometric equations, and fractal theory fitting, respectively. Although these methods offer high accuracy, they are labor-intensive and suffer from significant regional and species-specific limitations. The latter, relying on satellite remote sensing, has become the mainstream tool for large-scale estimation. Castillo et al. [20] mapped mangrove carbon stock distribution in the Philippines using canopy leaf area index and vegetation indices. Li et al. [21] integrated Sentinel-1 radar backscatter features with deep learning models to achieve high-precision quantitative inversion. Multi-source data synergy has been widely adopted, with optical (Landsat, Sentinel-2, WorldView-2), microwave (Sentinel-1, ALOS PALSAR, Radarsat-2), and LiDAR (ICESat/GLAS, ICESat-2, UAV LiDAR) data sources jointly applied to biomass estimation and canopy height retrieval [22,23,24,25,26,27]. Among these, Zhu et al. [26] systematically evaluated and compared the capacity of ICESat-2 and GEDI spaceborne LiDAR for mangrove aboveground biomass estimation, clarifying the respective advantages of the two datasets. Machine learning further boosts accuracy, with Random Forest (RF) being most common. Staben et al. [28] applied RF to Landsat data for woody plant height (R2 = 0.53); Wang et al. [29] integrated field samples, UAV LiDAR, and Sentinel-2 for mangrove height mapping in Hainan (R2 = 0.67). Other algorithms include XGBoost, SVM, and KNN. Xu et al. [30] combined RF, SVM, and XGBoost with remote sensing to analyze mangrove carbon stocks in China (1986–2019), demonstrating the potential of machine learning in this field.
In summary, considerable progress has been made in both data fusion strategies and carbon stock estimation methods. However, notable limitations remain. At the data fusion level, most existing studies have concentrated on accuracy validation within specific regions or time periods, demonstrating the effectiveness of particular fusion strategies, yet a generalizable framework applicable to the complex canopy structures and tidal dynamics of mangrove ecosystems has yet to be established. At the carbon estimation level, the majority of studies present “snapshot-style” static carbon stock assessments, lacking dynamic tracking aligned with the timelines of specific ecological management events. Furthermore, the trade-off between accuracy and spatial extent in allometric equation methods versus remote sensing inversion approaches has not been effectively reconciled.
The Zhangjiang Estuary National Nature Reserve for Mangroves in Fujian Province is located at the northern limit of natural mangrove distribution in China, dominated by Kandelia obovata, and holds significant ecological and scientific value. Since the 1990s, land reclamation and aquaculture have led to severe mangrove degradation, with the spread of S. alterniflora becoming a major threat. In response, Zhangzhou City launched a comprehensive S. alterniflora eradication campaign in 2022. This management intervention provides an ideal study context for addressing the aforementioned research gaps: on the one hand, the well-defined pre- and post-treatment timeline enables dynamic tracking aligned with ecological management events; on the other hand, the long-term foundational data accumulated in the reserve offer a valuable basis for developing a generalizable fusion framework. Nevertheless, quantitative assessments of the spatiotemporal dynamics and carbon stock evolution of mangroves under this management context remain absent.
To address these research gaps, the scientific rationale of this study is to integrate multi-source data (Sentinel-1/2 optical and SAR imagery, ICESat-2 LiDAR) with ensemble machine learning algorithms, and to construct an annual land cover time-series map from 2016 to 2025 on a cloud computing platform, thereby enabling temporal alignment of dynamic mangrove distribution monitoring and carbon stock inversion before and after the management intervention. Unlike existing single-period static estimation studies, this study quantitatively anchors carbon stock changes to the actual implementation timeline of S. alterniflora eradication, systematically addressing the key question of “how much blue carbon gain has been achieved by the eradication campaign,” and providing a quantifiable reference paradigm for assessing ecological management effectiveness in subtropical estuarine wetlands.
2. Materials and Methods
2.1. Study Area
The Zhangjiang Estuary Mangrove National Nature Reserve is located in Yunxiao County, Zhangzhou City, on the southeast coast of Fujian Province, China. Situated at the mouth of the Zhangjiang River, it is one of the key mangrove distribution areas along the northern margin of China (Figure 1). The study area spans approximately 23°50′ –23°56′N and 117°24′–117°30′E, bordering the Taiwan Strait to the east and the coastal plain of Yunxiao County to the west. It is a representative estuarine coastal-wetland ecosystem. Subject to strong ocean-tide influences, the area possesses well-developed intertidal flats that provide favourable natural conditions for mangrove development.
Figure 1.
Geographical location of the study area.
As the largest mangrove habitat in Fujian Province, the Zhangjiang Estuary wetland constitutes the northern biogeographical limit of naturally occurring mangroves in China and bears high ecological-conservation value. The reserve supports diverse mangrove plant communities, dominated by typical mangrove species including Kandelia obovata and Bruguiera gymnorhiza. It also serves as a critical habitat for numerous fish, bird and benthic organisms [31]. Owing to its unique geographical location and ecological characteristics, this region plays a vital role in maintaining coastal ecological security, conserving biodiversity and enhancing carbon sink functions.
However, anthropogenic coastal disturbances together with rapid invasion and expansion of exotic S. alterniflora have substantially reshaped the ecosystem structure of local mangrove wetlands over recent decades [32]. To restore wetland ecological functions, local authorities have implemented systematic S. alterniflora control and mangrove ecological restoration programs, which have gradually altered mangrove coverage and community composition. The Zhangjiang Estuary mangrove wetland thus serves as an ideal study area to investigate mangrove ecosystem dynamics and carbon storage changes, which is essential for evaluating ecological governance effectiveness and strengthening wetland conservation efforts.
2.2. Data Acquisition and Preprocessing
2.2.1. Sentinel Data and Preprocessing
The remote sensing data used in this study primarily include Sentinel-1 synthetic aperture radar data and Sentinel-2 multispectral imagery, covering the Zhangjiang Estuary study area from 2016 to 2025. Both datasets are provided by the European Space Agency (ESA) through the Copernicus Programme and were accessed and processed on the Google Earth Engine (GEE) cloud platform (https://code.earthengine.google.com/). The Sentinel satellite series features high spatial resolution and short revisit cycles, and has been widely applied in wetland ecosystem monitoring and vegetation classification research.
The Sentinel-2 satellite carries a multispectral imager acquiring 13-band imagery, with spatial resolutions of 10 m, 20 m, and 60 m for visible, near-infrared, and short-wave infrared bands, respectively. These data deliver fine spatial resolution and rich spectral information, which effectively reflect vegetation growth conditions and ground-object spectral signatures. We selected Sentinel-2 imagery spanning the 2016–2025 study period. Considering that the study area is an intertidal wetland strongly affected by tidal levels, single-date optimal low-tide images were selected year-by-year as the annual reference dataset to avoid spectral bias caused by tidal aliasing. Single-date low-tide observations with scene-level cloud-pixel percentage less than 20% were retained. Cloud- and shadow-induced artifacts were mitigated using bitwise cloud masking based on the QA60 band. Based on the pre-processed imagery, multiple remote-sensing indices were computed: Normalized Difference Vegetation Index (NDVI), Normalized Difference Water Index (NDWI), Land Surface Water Index (LSWI), and Enhanced Vegetation Index (EVI). The corresponding calculation formulas are presented in Section 2.3.1, and these indices were used to improve the separability among different land-cover types.
The Sentinel-1 satellite carries a C-band SAR sensor that enables all-weather and day-night surface observations, overcoming the limitation of optical imagery susceptible to cloud-fog contamination. In this work, Sentinel-1 GRD products were employed, yet raw GRD datasets were not used directly. A complete preprocessing pipeline within GEE was executed, including thermal-noise removal, radiometric calibration, and terrain correction to generate terrain-flattened backscatter coefficients. VV and VH polarization backscatters were then extracted as radar feature variables. Polarization-ratio parameters were further calculated to enhance the discrimination between mangroves and other land-cover classes.
By fusing Sentinel-1 radar data and Sentinel-2 optical data, the spectral and structural information can be comprehensively utilized to improve the accuracy of mangrove identification and classification, providing a reliable data foundation for subsequent mangrove distribution extraction and canopy height retrieval.
2.2.2. LiDAR Data
Space-borne LiDAR data were employed to acquire sampling points for mangrove canopy-height retrieval. The Ice, Cloud, and land Elevation Satellite-2 (ICESat-2), NASA’s successor mission to the original ICESat satellite, was launched in 2018 for global surface-elevation observations. All ICESat-2 data used in this study were freely downloaded from the NASA Earthdata Search platform (https://search.earthdata.nasa.gov/search (accessed on 14 July 2026)), which is the official data distribution portal of NASA Earth Science Data Systems. This satellite carries the Advanced Topographic Laser Altimeter System (ATLAS), which adopts advanced single-photon detection technology and emits 6 beams to the Earth’s surface, including 3 high-energy beams and 3 low-energy beams, which can adapt to targets with different reflectance. The sensor operates at a pulse-sampling rate of 10,000 laser pulses per second with a ranging precision of approximately 0.1 m. Along-track sampling yields photon footprints spaced approximately 0.7 m apart, while the across-track beam separation is approximately 3 km, enabling precise acquisition of global surface elevation measurements. The satellite provides multiple levels of data ranging from raw detection data to derived application products, covering the observation needs of various surface types such as polar ice sheets, terrestrial vegetation, and inland water bodies. Among them, ATL03, as the core basic data product, records global raw photon height information and provides high-quality raw data support for various specialized studies. ATL08 is a land and vegetation height data product further processed based on ATL03 data, which clearly distinguishes elevation information of different targets such as the ground surface and vegetation canopy. Both ATL03 and ATL08 datasets were selected for this study. All ATL03 and ATL08 data used in this study are the V6 release (NASA NSIDC). Combined with local terrain features and analytical requirements of the Zhangjiang Estuary, they provide essential inputs for our subsequent analytical workflows.
2.2.3. Auxiliary Data
To improve the accuracy of mangrove classification and canopy height retrieval, multiple auxiliary datasets were introduced in addition to remote sensing and LiDAR data, including Digital Elevation Model data, study area boundary vector data, and land cover classification sample data.
Topographic conditions influence vegetation distribution; in coastal wetlands, elevation is often closely linked to tidal inundation frequency and vegetation type. Therefore, Digital Elevation Model (DEM) data were introduced to obtain topographic information of the study area, including elevation and slope. The DEM data were acquired via the Google Earth Engine platform, and topographic features such as slope were calculated. These topographic variables help distinguish different land cover types (e.g., mangroves, water bodies, and tidal flats), thereby improving classification accuracy.
The study area boundary vector data were primarily used to define the research scope and perform spatial cropping of remote sensing imagery, reducing the impact of irrelevant areas on the analysis results. This vector dataset was downloaded from the Databox platform (https://www.databox.store/ (accessed on 14 July 2026)). Meanwhile, mask processing of the study area was conducted using the vector data to improve data processing efficiency and result accuracy.
Land cover classification sample data were mainly obtained through visual interpretation of high-resolution imagery, and manual annotation was performed in combination with existing research data to establish training and validation samples for major land cover types including mangroves, S. alterniflora, water, tidal flats and other vegetation. These sample data were used for the training and accuracy verification of the Random Forest classification model. Reference sample points were independently interpreted and collected for each year from 2016 to 2025. The number of reference samples was adjusted annually according to the actual land cover conditions of the study area. Rather than adopting a fixed static sample dataset for all years, we updated samples year by year: samples were retained for locations with stable land cover conditions, while sample points were supplemented, corrected, or deleted for areas undergoing prominent land cover transitions such as S. alterniflora removal and mangrove replanting. This update strategy balances temporal sample consistency with real-world annual land cover dynamics. For each annual dataset, samples were randomly divided into 70% training subsets and 30% independent test subsets. The training subsets were used for classifier parameter optimization, while the independent test subsets were used to construct 5 × 5 confusion matrices and calculate overall accuracy (OA) and Kappa coefficients for quantitative accuracy evaluation. To ensure stable and reliable classification accuracy for long-term land cover monitoring, independent reference samples were manually collected and calibrated year by year according to actual surface conditions. The annual number of samples for each land cover type is shown in Table S1 in the Supplementary Materials.
2.3. Research Methods
This study developed a research framework for accurate mangrove classification and carbon storage estimation based on multi-source remote sensing data fusion, with the technical roadmap shown in Figure 2. First, targeting the mangroves in the study area, a multi-dimensional feature set was constructed by integrating optical and microwave remote sensing data. Specifically, spectral bands, vegetation indices, and water indices were extracted from Sentinel-2 imagery, VV and VH dual-polarization features were extracted from Sentinel-1 SAR imagery, and topographic features including elevation and slope were extracted from DEM data simultaneously, forming a comprehensive feature set covering spectral, index, polarization, and topographic dimensions. In addition, three classifiers, namely Random Forest (RF), Support Vector Machine (SVM), and Extreme Gradient Boosting (XGBoost), were employed, and model training was conducted separately for each classifier using the training dataset. Subsequently, the three optimized classifiers were applied to perform mangrove classification on the imagery of the study area, generating multiple sets of classification results. Finally, a confusion matrix was used to conduct accuracy assessment of the results, with evaluation metrics including Overall Accuracy (OA) and Kappa coefficient. The best-performing classifier was selected to generate the final mangrove classification map and calculate the mangrove area. On this basis, the classification results were spatially correlated with ICESat-2 vegetation canopy height data. A tree height retrieval model was established through the fitting between remote sensing features and canopy height to obtain mangrove tree height data. Furthermore, aboveground biomass was derived by combining with allometric growth equations, and finally, the mangrove vegetation carbon storage in the study area was calculated.
Figure 2.
Technical research approach.
2.3.1. Feature Set Extraction
In remote sensing-based mangrove information extraction, the rational construction of feature variables serves as a critical foundation for improving classification accuracy. Owing to the unique spectral, structural, and growth characteristics of mangrove ecosystems, single-source data often fail to accurately distinguish mangroves from other land cover types. Therefore, this study integrates optical, radar, and topographic data to construct multi-source feature variables, enhancing separability among different land cover types and improving mangrove classification accuracy.
For optical remote sensing features, visible, near-infrared, and shortwave infrared bands were extracted from Sentinel-2 multispectral imagery, which effectively capture vegetation growth status and surface spectral properties. The vegetation and water indices used in this study were computed during preprocessing (Section 2.2.1), and their calculation formulas are presented as Equations (1)–(5) [33]:
Note: In Equations (1)–(5), Green, Blue, Red, NIR, and SWIR1 represent surface reflectance values of specific Sentinel-2 spectral bands: Green = Band 3 (560 nm), Blue = Band 2 (490 nm), Red = Band 4 (665 nm), NIR = Band 8 (842 nm), SWIR1 = Band 11 (1610 nm).
In the aspect of radar features, VV and VH polarization backscattering coefficients are extracted from Sentinel-1 SAR images, and radar features such as polarization ratio are calculated. Radar signals can reflect the structural characteristics of mangrove vegetation because of the comparison between the surface structure and the vegetation canopy structure, and to a certain extent make up for the shortcomings of optical remote sensing in cloudy weather conditions. The terrain factor is based on SRTM-1arc-secondDEM to calculate DEM, Slope, and two texture features: Entropy_4 and Homogeneity_2. The specific classification characteristics are summarized in Table S2 in the Supplementary Materials.
2.3.2. Classifier Filtering
Three representative machine learning algorithms were selected for comparative classification experiments in this study: Random Forest (RF), Support Vector Machine (SVM), and Extreme Gradient Boosting (XGBoost). The selection was based on three primary considerations. First, these classifiers have been widely employed in mangrove and coastal wetland remote sensing mapping studies, and are capable of integrating multi-source heterogeneous features, including spectral, radar, and topographic variables. Second, they represent three mainstream machine learning paradigms, namely bagging ensemble learning, kernel-based support vector learning, and boosting ensemble learning. Their inclusion ensures the representativeness and comprehensiveness of the comparative analysis. Third, these algorithms differ considerably in feature adaptability, noise robustness, and computational efficiency. Such differences make them suitable for systematic performance evaluation on multi-source remote sensing datasets through side-by-side comparison, without requiring prior assumption of which algorithm will perform best in our study area.
All classification experiments in this study were conducted on the Google Earth Engine (GEE) platform [34] and partly performed in a local Python environment (Python version 3.12.7). First, spectral features, vegetation index features, and polarization features extracted from multi-source remote sensing data were integrated to construct a comprehensive classification feature set. Labeled land-cover samples were randomly split into training and test datasets at a 7:3 ratio, and different hyperparameter-determination strategies were adopted for the three classifiers.
For the Random Forest (RF) algorithm, core parameters were empirically configured as follows: number of trees = 100, number of features per split = square root of total features, and bootstrap sampling ratio = 0.8. Classification was performed via majority voting across the ensemble. A preliminary RF run was used to compute feature importance, retaining the top 10 features for final model training. These empirically selected values fall within typical ranges for land cover classification, and no iterative hyperparameter sweeping was performed. RF exhibits strong robustness and mitigates the overfitting risk inherent in single decision trees. It simultaneously performs classification and feature selection, effectively suppresses noise, and adapts well to multi-source feature complexity without requiring dimensionality reduction. It also tolerates missing values and outliers commonly found in remote sensing data. However, RF performs poorly on high-dimensional sparse data and is susceptible to classification bias when features are redundant. Additionally, it has poor model interpretability, and minor local variations in land cover types can negatively impact classification accuracy [34].
For the Support Vector Machine (SVM), the radial basis function (RBF) kernel implemented in the GEE libsvm classifier was adopted. Optimal classification hyperplanes were identified for land cover discrimination, with the same 7:3 data split. SVM automatically adapts to high-dimensional data via kernel transformation, efficiently processing multi-source remote sensing features without manual dimensionality reduction. It offers strong generalization, effective noise suppression, and accurate detection of subtle differences among land cover types. Nevertheless, SVM hyperparameter tuning requires extensive grid search validation, which is computationally time-consuming and inefficient for large-scale remote sensing sample processing. It is therefore less suitable for large-area classification tasks. Moreover, missing values and outliers can shift classification boundaries. Although SVM is inherently a binary classifier, multi-class land cover classification requires additional extension strategies.
For the Extreme Gradient Boosting (XGBoost) algorithm, parameter sweeps over key hyperparameters—including learning rate, tree depth, minimum child weight, and subsample ratio—were conducted to achieve satisfactory model performance. The optimal configuration was selected based on overall accuracy on the held-out test set, without cross-validation during parameter selection. Model training and evaluation followed the 7:3 split. XGBoost with this parameter configuration achieves high classification accuracy, accurately captures subtle feature differences in remote sensing land cover types, and adapts well to complex land cover classification tasks. It efficiently handles high-dimensional, nonlinear multi-source data without dimensionality reduction and natively manages missing values. However, XGBoost has a large number of hyperparameters that are difficult to optimize. It is prone to overfitting when the sample size is small or features are redundant, and has poor model interpretability. Furthermore, its computational cost is higher than that of RF, and large-scale remote sensing classification tasks impose certain hardware requirements [35,36].
2.3.3. Vegetation Canopy Height Retrieval Algorithm
Canopy Dataset Construction Method
The canopy height dataset in this study was constructed by fusing ICESat-2 ATL03 and ATL08 products, followed by point-level alignment with Sentinel imagery. ATL03 is the raw photon-counting product that provides precise geolocation and elevation for each detected photon. ATL08 is a higher-level derived product containing photon classification labels (ground-photon/canopy-photon flags) and segment-wise relative photon-index attributes.
In the ATL03 product, each photon is indexed by segment ID (segment_id) and starting photon index of each segment (ph_index_beg). In the ATL08 product, each photon is indexed by segment number (ph_segment_id) and relative position index within the segment (classed_pc_indx). As illustrated in Formula (6), the matching between the two products is performed by identifying corresponding segments (ph_segment_id = segment_id). For each matched photon, the global photon index in ATL03 is calculated as:
This conversion accounts for the zero-based indexing convention in Python and links each ATL08 classification label to the corresponding ATL03 geolocation and elevation record. Photons with confidence flags ≥ 3 for canopy and ≥2 for ground were retained.
Through this conversion, each photon in ATL08 is linked to its corresponding record in ATL03, yielding an integrated dataset containing geolocation, absolute elevation, and classification labels (0 = noise; 1 = ground; 2 = canopy; 3 = canopy top) for each photon. This index-based conversion is deterministic and strictly follows the ICESat-2 product indexing rules. In our processing workflow, we applied a confidence-based filtering strategy: only photons with high-confidence classification labels (signal_conf_ph ≥ 3 for canopy and ≥2 for ground) were retained, and along-track sliding windows containing fewer than five ground photons were excluded to ensure reliable ground elevation estimation. According to the ICESat-2 mission calibration and validation study [37], individual photon elevations are accurate to approximately 0.3 m vertically. Under the flat intertidal terrain conditions of our study area, the geolocation-derived uncertainty is acceptable for point-level alignment with Sentinel imagery.
Subsequently, photons located within the mangrove extent were sorted along the satellite orbit direction. For canopy height retrieval, we adopted an along-track sliding window approach: for each canopy photon, a window containing the 150 preceding and 150 following photons (a total of up to 301 photons) was defined along the track, centered on the target photon. To characterize local ground elevation and mitigate disturbances from tidal fluctuations and micro-topography, ground photons within the window were filtered, and their median elevation was calculated, with a minimum of five ground photons required for a valid estimate. The canopy height at each photon position was derived as the difference between the canopy photon elevation and the median ground elevation within the corresponding window. Quality control was implemented by applying confidence thresholds (photon confidence flags ≥ 3 for canopy photons and ≥2 for ground photons) and a biophysically reasonable range of mangrove canopy heights (0.5–15 m). Following the above matching and quality-control procedures, a total of 833 valid canopy-height sample points were finally obtained. Each final canopy height sample was spatially registered to Sentinel imagery at the point level, without raster resampling, to avoid scale-mismatch bias, resulting in a high-precision standardized canopy height dataset [38].
Canopy Height Retrieval Method Based on Random Forest
Canopy height is a critical biophysical parameter for biomass estimation and can be reliably retrieved from multi-source remote sensing features. The 833 canopy-height sample points generated in the previous step were used for model building. The full dataset was split into training and validation subsets via stratified random sampling at a 7:3 ratio, yielding 583 training samples and 250 validation samples, with no overlap between the two subsets to ensure independent validation. Random Forest, a widely adopted ensemble learning algorithm that aggregates outputs from multiple decision trees trained on random subsets of the data, was employed for mangrove canopy height retrieval. Using the validated point-level canopy height samples as response variables and multi-source remote sensing features as predictors, the trained model was applied to the full study area to achieve spatially continuous and accurate estimation of mangrove canopy height [39].
To quantify the contribution of each feature to canopy height predictions and improve model interpretability, the Shapley Additive exPlanations (SHAP) method was adopted for post-hoc model interpretation. Derived from game theory, SHAP assigns a contribution value to each input feature for every individual prediction, enabling systematic evaluation of feature performance from two dimensions: overall contribution weight and directional influence on prediction results. This analysis provides a quantitative basis for subsequent feature importance assessment and mechanism interpretation.
2.3.4. Biomass Allometric Model
Allometric equations are the core tool for quantifying tree biomass in ecological research, establishing the mathematical relationship between biomass and tree morphological parameters. Their underlying principle is based on the theory of allometric growth, which states that tree biomass accumulation follows a specific nonlinear relationship rather than being proportional to morphological growth. Tree height, as a key indicator of vertical tree growth, is an indispensable core variable in these equations.
In this study, mangrove aboveground biomass was estimated using allometric equations, which enable non-destructive indirect biomass estimation through models built from field measurements of tree height, diameter at breast height, and corresponding biomass values. Based on the spatial distribution of mangrove canopy height in the study area, a tree height-based allometric model was adopted. Specifically, we applied the linear mangrove height-biomass relationship model developed by Wen et al. [40] using multi-source remote sensing data. The allometric equation used in this study is as follows:
where AGB represents mangrove aboveground biomass (t ha−1) and H represents mangrove canopy height (m).
AGB = 10.8 × H + 34.9
It should be noted that this empirical model was built using samples from other regions and may bring certain uncertainties for local application. Nevertheless, existing studies have indicated a strong universal correlation between mangrove canopy height and above-ground biomass. Hence, this method remains reasonable in the absence of local destructive-sampling field data and can offer effective support for regional-scale carbon-stock assessment.
Mangrove vegetation carbon storage directly reflects the carbon sink potential of mangrove ecosystems and is a key indicator for evaluating the carbon sink value of mangrove wetlands. For carbon stock estimation, mangrove biomass is typically multiplied by a standard carbon conversion coefficient of 0.5, which was adopted in this study.
2.3.5. Accuracy Evaluation Indicators
External accuracy verification was performed for the classification results of the three classifiers. A 5 × 5 confusion matrix was constructed based on the independent test dataset for the five land-cover classes (mangrove, S. alterniflora, water body, tidal flat, and other vegetation), from which Overall Accuracy (OA) and Kappa coefficient were derived to evaluate classification performance. The classifier with the highest accuracy was selected for subsequent analysis. Subsequently, annual classification was conducted for the period 2016–2025. Manual visual inspection was performed to correct obvious misclassifications, resulting in 10 m resolution annual classification maps of mangroves and S. alterniflora for 2016 to 2025.
3. Results
3.1. Classification Results and Spatial Analysis
The spatial distribution of mangroves and S. alterniflora exhibited distinct spatial separation and a trade-off dynamic over time, and these patterns are visualized in Figure 3. The mangroves in the study area are mainly distributed in the middle beach of the inner bay of the Zhangjiang Estuary, the spatial distribution area is relatively fixed, and the overall pattern is stable; S. alterniflora is mostly distributed in the low tidal flat outside the estuary and the tidal flat on the edge of mangroves. From 2016 to 2022, the vegetation spatial pattern in the study area is relatively stable as a whole, and there is no significant extension change in the scope of mangrove patches, with only small local fluctuations. At the same time, S. alterniflora spread to the tidal flat of the inner bay, and the patches continued to expand contiguously. From 2023, S. alterniflora will recede on a large scale, patches will be fragmented, and the originally occupied tidal flat habitats will be released. The mangroves expanded to the peripheral tidal flats, and the spatial coverage was stable.
Figure 3.
Land Cover Classification Results of Zhangjiang Estuary (2016–2025).
Combined with the area data in Table 1, the spatiotemporal distribution trend of mangroves and S. alterniflora in Zhangjiang Estuary from 2016 to 2025 is completely opposite. From 2016 to 2022, the mangrove area was stable as a whole, fluctuating slightly between 75.78 and 81.34 ha, falling to the lowest level in 2018 and then rebounding, and recovering to 81.22 ha in 2022, with no significant expansion overall. During the same period, S. alterniflora increased from 158.30 ha to 277.90 ha, reaching the maximum value in ten years. From 2022 to 2025, the mangrove area increased annually from 81.22 ha to 183.49 ha, representing a substantial increase. The area of S. alterniflora dropped sharply, falling to 80.45 ha in 2023, 44.08 ha in 2024, and only 3.26 ha in 2025.
Table 1.
Annual Area Variation in Two Types of Land Features.
3.2. Evaluation of Land Cover Classification Accuracy
This study conducted comparative classification experiments using 2021 remote sensing imagery under different algorithms. As shown in Table 2, all three algorithms achieved overall accuracy exceeding 95% and Kappa coefficients greater than 0.93, indicating their effectiveness in remote sensing extraction of mangroves and S. alterniflora. However, significant differences exist in their classification performance. Among them, Random Forest and XGBoost exhibited highly comparable classification performance. Random Forest achieved an average overall accuracy of 97.00% and an average Kappa coefficient of 0.958, while XGBoost yielded an average overall accuracy of 96.86% and an average Kappa coefficient of 0.960. Although XGBoost obtained a marginally higher Kappa coefficient, the discrepancy between the two models was minimal. Considering the relatively balanced sample distribution among different land-cover types in this study, overall accuracy can adequately reflect the comprehensive mapping effect. Therefore, Random Forest was selected for subsequent annual land-cover classification. Its advantage lies in mitigating the overfitting risk of single models through ensemble learning of multiple decision trees, and it demonstrates stronger recognition capability for subtle feature differences. The XGBoost algorithm ranked second, mainly due to the algorithm’s sensitivity to sample distribution, which led to frequent misclassifications at the boundary between bare mudflats and S. alterniflora. The SVM algorithm showed relatively lower accuracy, with an average overall accuracy of 95.30% and an average Kappa coefficient of 0.933. Limited by the fitting ability of a single kernel function to the spectral distribution of complex ground objects, it exhibited certain errors in distinguishing mangroves from other vegetation types.
Table 2.
Accuracy Comparison of Various Classifiers.
As shown in Table 3, the overall land cover classification accuracy in the study area remained consistently above 95% throughout the 2016–2025 period, with Kappa coefficients maintained above 0.93. Per standard remote sensing classification accuracy evaluation criteria, the classification results for all years achieved an excellent accuracy level, demonstrating that the classification model exhibits robust discriminative ability for all land cover types included in this study and that the overall classification results are highly reliable. Regarding interannual variations, classification accuracy showed an improving trend from 2016 to 2019, with overall accuracy reaching 97.61% in 2019, the highest level in the early study period. Although a slight decline occurred during 2020–2024, accuracy remained above 95%, which falls within an acceptable range of normal variation. In 2025, classification accuracy improved significantly, achieving an overall accuracy of 98.03% and a Kappa coefficient of 0.971, the highest classification accuracy over the entire ten-year study period.
Table 3.
Annual Accuracy Comparison.
3.3. Retrieval and Analysis of Mangrove Canopy Height
3.3.1. Mangrove Canopy Height Retrieval Results
This study utilized ICESat-2 LiDAR data to extract mangrove tree height samples, integrated multi-source remote sensing feature variables from Sentinel-1 and Sentinel-2, and constructed a Random Forest retrieval model to achieve accurate retrieval of mangrove crown height in the Zhangjiang Estuary. Three key time nodes (2021, 2023, and 2025) were selected for time-series comparative analysis, and the spatial distribution of mangrove canopy height for these three phases is presented in Figure 4. From the perspective of spatial distribution characteristics, mangrove tree heights in the study area were concentrated in the range of 2–9 m, with significant spatial differentiation. Specifically, mangrove tree heights around the estuary and inner intertidal zones were generally higher, while those in peripheral tidal flat areas were relatively lower, forming a clear regional growth difference pattern.
Figure 4.
Canopy Height Map of Mangroves in Zhangjiang Estuary.
The mean canopy height was 3.02 m in 2021, 3.19 m in 2023, and 2.68 m in 2025, representing a 5.63% increase from 2021 to 2023 and a 16.0% decrease from 2023 to 2025. Combined with the regional ecological governance background, in accordance with policy requirements such as the Fujian Province S. alterniflora Eradication Action Plan and the Special Action Plan for Mangrove Protection and Restoration (2020–2025), the Zhangjiang Estuary was designated as a key mangrove management and ecological restoration area. From 2022 to 2025, a series of projects for S. alterniflora removal and mangrove ecological reconstruction were intensively implemented. During the treatment period, a large number of S. alterniflora-invaded tidal flats in the area were cleaned up and renovated, and large-scale artificial mangrove planting was carried out. According to the Master Plan for Zhangjiang Estuary Mangrove National Nature Reserve, as of 2025, the study area had completed ecological restoration of more than 53 ha of mangroves, with over 500,000 mangrove seedlings artificially planted.
3.3.2. Importance Analysis of Canopy Height Retrieval Features
The SHAP analysis results of the mangrove canopy height retrieval model are shown in Figure 5; the B3 band was the most important contributing feature in this tree height retrieval model, exhibiting the widest distribution range and largest dispersion of SHAP values, and having the most significant impact on model prediction results. Slope, Homogeneity_2 texture feature and B5 band ranked second, also exerting strong driving effects on tree height retrieval results. The contributions of Entropy_4, B2, B12, MNDWI, B4 and VV were relatively limited. From the perspective of feature influence direction, high-value samples (red dots in the figure) in optical bands such as B3, B5 and B4 generally corresponded to positive SHAP values, meaning that higher feature values led to more obvious increases in predicted tree height. High values of the Homogeneity_2 texture feature also mainly contributed positively, indicating that higher texture uniformity resulted in higher tree heights predicted by the model. High-value samples of Entropy_4 and VV also showed a significant positive contribution trend. However, the contributions of features such as Slope and MNDWI exhibited obvious heterogeneity, with some high-value samples showing strong positive contributions, and the overall contribution direction and intensity were not uniform. These results clarify the functional weights and influence mechanisms of each feature in the tree height retrieval model, provide a key basis for feature screening, optimization and mechanism interpretation of subsequent models, and further verify the reliability and interpretability of the Random Forest model in mangrove tree height retrieval.
Figure 5.
SHAP Analysis and Comparison between Observed and Predicted Canopy Height.
Model accuracy evaluation produced a coefficient of determination (R2) of 0.75, a root-mean-square error (RMSE) of 0.92 m, a relative RMSE (rRMSE) of 0.348, and a Bias of 0.166 m. These outputs reveal the contribution weights and underlying influence mechanisms of individual features in the retrieval workflow, and further validate the reliability of the Random-Forest-based approach for mangrove canopy-height estimation.
3.4. Estimation of Mangrove Carbon Stocks
3.4.1. Estimation of Aboveground Biomass of Mangroves
This study selected three key time points (2021, 2023, and 2025) for spatial analysis of mangrove AGB, covering periods before and after the treatment of S. alterniflora. The results are shown in Table 4. Overall, the total aboveground biomass of mangroves in the study area exhibited an increasing trend from 2021 to 2025. To assess the reasonableness of our biomass estimates, we compared our 2021 result (5366.85 t) with an independent estimate reported by Wen [41] for the same reserve. Wen estimated the aboveground biomass of the core zone of the Zhangjiang Estuary reserve in 2020 using airborne LiDAR and Sentinel-2 data, with a total biomass of approximately 5200.67 t. The two estimates differ by only 3%, suggesting general consistency between independent estimation frameworks. However, we emphasize that this comparison does not constitute a strict validation, as the estimates are from different years (2020 vs. 2021) and spatial extents (core zone vs. entire reserve). Since no significant large-scale disturbances occurred in the reserve during 2020–2021, and S. alterniflora management did not begin until 2022, the temporal mismatch has limited impact on this consistency check. The primary reliability of our carbon stock estimates is supported by the accuracy of the canopy height retrieval and the use of established allometric equations.
Table 4.
Spatiotemporal Changes in AGB.
Regarding temporal evolution characteristics, mangrove area in the study area increased year by year from 2021 to 2025, with the most pronounced expansion occurring during 2023–2025. Mangrove area increased from 106.95 ha to 183.49 ha during this period. Aboveground biomass per unit area was 67.52 t ha−1 in 2021, 69.35 t ha−1 in 2023, and 63.84 t ha−1 in 2025.
3.4.2. Spatial Distribution of Above-Ground Vegetation Carbon Stock
The spatial distribution of mangrove carbon stocks in the study area exhibited significant heterogeneity, with clear differences in spatial patterns across different periods (Figure 6). During 2021–2023, the spatial distribution range of mangroves in the study area remained relatively stable. High-carbon-stock patches were concentrated in the primary mature mangrove area at the center of the region, showing strong spatial aggregation. There was almost no mangrove distribution in peripheral tidal flats, and the overall spatial pattern of carbon stocks was stable with no obvious expansion trend. After 2023, the spatial distribution of mangroves expanded significantly toward peripheral tidal flats, with numerous newly added patches distributed along the edge of the study area.
Figure 6.
Carbon Storage Distribution of Mangrove Forests.
As shown in Table 5, mangrove carbon stocks in the study area exhibited distinct phased characteristics in the temporal dimension, presenting an overall pattern of steady accumulation in the early stage followed by a sharp leap in the later stage, while per-unit-area carbon density showed a fluctuation pattern of slight initial increase followed by mild decline.
Table 5.
Spatiotemporal Changes in Above-ground Vegetation Carbon Stock.
The 2021–2023 period represented the steady carbon stock accumulation stage for mangroves in the study area. During this phase, no large-scale artificial afforestation projects were implemented, and mangrove vegetation coverage area and community structure remained relatively stable. Total carbon stocks increased moderately from 2683.43 t in 2021 to 3708.60 t in 2023, while per-unit-area carbon density rose slightly from 33.76 t ha−1 to 34.68 t ha−1.
The 2023–2025 period constituted a critical turning point in the evolution of mangrove carbon stocks in the Zhangjiang Estuary, with significant changes observed in the temporal characteristics of carbon storage. During this stage, total carbon stocks in the study area achieved leapfrog growth, increasing from 3708.60 t to 5857.37 t, with a markedly accelerated carbon sink growth rate. However, per-unit-area carbon density declined to 31.92 t ha−1, representing a notable decrease from 2023 levels and reversing the previous slight upward trend.
4. Discussion
4.1. Assessment of S. alterniflora Governance Effects
To assess the effectiveness of S. alterniflora control in the study area from 2021–2025, this study verified the pre-control invasion background and analyzed the spatial distribution and area dynamics of S. alterniflora based on annual remote sensing data, long-term records, and existing research (Figure 7). To validate the reliability of the pre-governance invasion trend, we compared our 2016–2018 classification results with contemporaneous findings from an existing study [32]. The two sets of results were highly consistent, jointly confirming that S. alterniflora in the study area expanded rapidly from 158.30 ha to 262.89 ha during 2016–2018, with the invasion situation intensifying. This expansion trend continued into 2021 and 2022, with S. alterniflora area reaching 267.26 ha and 277.90 ha respectively, the highest level in the past decade. In contrast, mangrove area remained stable at 75.78–81.34 ha from 2016 to 2022, with growth largely stagnant due to habitat displacement by S. alterniflora. This imbalanced pattern confirms the deficiencies of the lack of systematic governance measures in the early stage, highlighting the necessity of implementing targeted special governance.
Figure 7.
Distribution of S. alterniflora (2021–2025).
Notably, S. alterniflora maintained continuous expansion throughout 2016–2022 with no signs of natural recession, and no large-scale natural die-off of the species has been documented in the Zhangjiang Estuary in local literature. This baseline indicates that the subsequent area decline cannot be attributed to natural mortality.
In 2022, the Chinese government officially issued and implemented the Special Action Plan for S. alterniflora Prevention and Control (2022–2025), which assigned a governance target of 9300 hectares for Fujian Province and set a rigid requirement of over 90% removal rate. Subsequently, Zhangzhou City formulated and implemented the Action Plan for S. alterniflora Eradication and Tackling, launching a comprehensive eradication campaign targeting 5565 mu of S. alterniflora across the entire region. A scientific approach combining mechanical deep excavation and landfill with manual precise removal was adopted for full-coverage precise management and control, marking the official entry of the study area into a stage of standardized and centralized governance.
From the perspective of governance spatial patterns (Figure 8), the S. alterniflora removal process exhibited significant phased characteristics. The period from 2021 to 2023 was the first critical governance phase, during which S. alterniflora retreated extensively in two key zones. The period from 2021 to 2023 was the first critical governance phase, during which S. alterniflora retreated extensively in two key zones. It was the main concentrated distribution area of S. alterniflora before governance, presenting a large contiguous patch shape. The second is the northern coastal tidal flats (approximately 117°24′E–117°28′E, 23°57′N–23°58′N), distributed in a strip along the high tidal flat on the northern bank of the estuary. The spatial extent of the retreated areas is highly consistent with the documented scope of treated tidal flats in the official governance plan. The 2023–2025 period represented the refined consolidation and residual removal phase, where remaining scattered patches were systematically eliminated. By 2025, only a negligible number of isolated invasion points persisted.
Figure 8.
The treatment process of S. alterniflora from 2021 to 2025.
Region-wide targeted management has fundamentally transformed the distribution pattern of S. alterniflora from large contiguous patches to fragmented remnants, and the spatial clearance progress is highly synchronized with the implementation timeline of governance policies. Concurrently, the synergistic implementation of multiple ecological restoration measures—including wetland restoration projects to remove aquaculture facilities, eliminate ecological disturbances, replant native mangroves in treated areas, and enhance wetland hydrological connectivity—drove a precipitous decline in S. alterniflora area from its 2022 peak to 80.45 ha in 2023, 44.08 ha in 2024, and 3.26 ha in 2025. Between 2022 and 2025, the cumulative removal area reached 274.64 ha, with an overall removal rate exceeding 98%. These decisive governance outcomes completely reversed the long-term invasion and expansion trend of S. alterniflora.
From the perspective of positive ecological feedback, the large-scale removal of S. alterniflora directly liberated high-quality intertidal habitats, which was closely associated with rapid mangrove expansion. Mangrove coverage expanded to 106.95 ha in 2023, 136.07 ha in 2024, and 183.49 ha in 2025, representing a 130.8% increase relative to 2021 levels. The stark contrast between mangrove stagnation before 2022 and rapid expansion thereafter reflects the positive regulatory effect of targeted governance, supporting the scientific validity and practicality of the national–local joint governance framework.
The massive reduction in S. alterniflora coverage freed up extensive intertidal space for native mangrove colonization. This reciprocal dynamic results from the synergy of environmental conditions, national policies, and local management practices. It demonstrates that the competitive balance between invasive and native species is highly sensitive to human intervention, and aligns with the general pattern of positive succession in coastal wetland ecosystems. In the study area, S. alterniflora expanded in a disorderly manner during 2021–2022, severely suppressing mangrove growth. Following the national special action initiated in 2022, S. alterniflora was rapidly cleared, and mangroves entered a window of rapid restoration. This evolution is consistent with national coastal governance trends.
Despite remarkable achievements, normalized monitoring and maintenance remain essential. Future efforts should strengthen dynamic habitat monitoring to prevent risks such as S. alterniflora recurrence and fluctuations in mangrove seedling survival rates, while continuously optimizing governance and restoration measures to ensure long-term ecosystem stability. This study also provides a replicable and referenceable model for invasive species control and mangrove restoration in similar coastal wetlands nationwide.
4.2. Retrieval Error Analysis of Mangrove Crown Height Data
4.2.1. Interpretation of Feature Importance: The Dominance of the Green Band
The SHAP analysis revealed that the green band (B3, 560 nm) was the most important feature for mangrove canopy height retrieval, outranking the near-infrared band (B8, 842 nm) and radar backscatter features. This result appears counter-intuitive at first glance, as near-infrared reflectance is generally considered highly sensitive to vegetation structure and biomass in terrestrial forest studies. However, in tidally inundated mangrove wetlands, the underlying water-saturated substrates substantially attenuate the near-infrared signal, particularly over extensive low- and medium-height mangrove stands where canopy closure is incomplete. Under such conditions, the green band maintains a stronger indirect statistical linkage with canopy chlorophyll status, which is positively correlated with tree vigor and, consequently, canopy height in our study area.
This finding is consistent with several recent studies. Chen [42] mapped mangroves in Dongzhaigang, China using Sentinel-2 imagery and found that among 15 variables, band 3 (green) ranked third in importance, following CMRI and NDVI, providing important information for distinguishing mangroves from land and water classes. Baloloy et al. [33] developed the Mangrove Vegetation Index (MVI) utilizing Sentinel-2 green, NIR, and SWIR bands, demonstrating that the green band effectively captures the distinct greenness of mangroves and shows moderate to high correlation with canopy chlorophyll content. These studies collectively support the importance of the green band in intertidal vegetation remote sensing.
Whether this pattern is site-specific or broadly applicable remains an open question. The unique tidal regime, sediment characteristics, and mangrove community composition of the Zhangjiang Estuary may contribute to the elevated importance of the green band. Nevertheless, similar green-band dominance has been observed in Dongzhaigang and in the Philippines, suggesting that this phenomenon may not be unique to our study area but may hold a certain degree of cross-regional generality, particularly in tidally influenced wetland ecosystems. Given the limited number of studies reporting such patterns, we emphasize that this phenomenon warrants further investigation in future tidal-wetland remote sensing studies.
4.2.2. Sources of Retrieval Uncertainty
Uncertainties in mangrove canopy height retrieval primarily arise from four aspects: the alignment between ICESat-2 ATL03 and ATL08 datasets, scale mismatches among multi-source data, dynamic habitat changes, and the effective sample size after data alignment and filtering. These factors collectively compromise photon classification accuracy, multi-source data synergy, and model adaptability, ultimately leading to fluctuations in retrieval errors. First, data alignment errors constitute a major source of uncertainty. ATL03 and ATL08 datasets are linked via segment IDs and index mappings to transfer photon classification information. However, in complex intertidal habitats, spectral and structural similarities between different vegetation types and missed detection of small patches can lead to inaccurate canopy photon identification. Any deviations in index mapping can cause misalignment between classification labels and corresponding elevation/geolocation data, leading to distorted height values for retrieval samples. Second, scale mismatches between multi-source data introduce additional errors. LiDAR data and satellite imagery have different spatial resolutions, making it challenging to resolve fine-scale mangrove canopy structures and capture height variations in individual trees or small patches. Furthermore, tidal fluctuations in intertidal zones cause inconsistent observation conditions across different data sources, reducing temporal synergy and compromising information matching during data fusion, which negatively impacts model stability. Third, limited effective sample size after data processing contributes to retrieval uncertainty. Following data alignment, rigorous quality filtering removes low-confidence photons, which can result in insufficient effective sample sizes for retrieval modeling. Insufficient samples prevent the model from fully capturing canopy height variation patterns, reducing both model fitting accuracy and the stability/reliability of retrieval results, and further amplifying overall errors.
In addition to the above-mentioned canopy-height retrieval uncertainties, uncertainties originating from land-cover classification will further propagate to subsequent carbon-stock estimation. Training and test samples for land-cover mapping were randomly split at a 7:3 ratio without applying spatial-distance constraints. Owing to spatial autocorrelation among remote-sensing pixels, this sampling scheme may produce a slight optimistic bias for overall accuracy and Kappa coefficient, constituting another potential error source for our carbon-stock analysis.
In this study, 12 independent feature ablation experiments were designed to systematically and quantitatively evaluate the contributions of five remote sensing feature categories to mangrove tree height retrieval (Table 6). The experimental framework included three modules: single-feature baseline modeling, forward gradient feature superposition, and reverse loss verification. All experimental groups used identical model parameters, dataset partitioning, and training protocols, strictly adhering to the single-variable control principle to ensure result rigor and comparability.
Table 6.
Ablation Scheme of Feature Combinations.
Single-feature baseline experiments revealed significant differences in the independent modeling capabilities of the five feature categories. Spectral features (SF) exhibited the strongest performance, achieving a retrieval accuracy of R2 = 0.72 and RMSE = 0.95 m as a single feature, making them the absolute dominant factor in mangrove tree height retrieval. Index features (IF) ranked second (R2 = 0.68), followed by texture features (TEF) and radar features (RF) with moderate performance. Terrain features (TF) showed the weakest independent modeling capability (R2 = 0.30) and could only serve as auxiliary constraint factors.
Forward gradient superposition experiments demonstrated that retrieval accuracy initially improved rapidly with increasing feature dimensionality and then gradually approached saturation. Adding terrain features to the spectral feature baseline improved model R2 by 0.02 and reduced RMSE by 0.02 m, verifying the effective correction effect of terrain information on spectral-based retrieval. Subsequent sequential superposition of index, radar, and texture features resulted in only minor accuracy fluctuations with no statistically significant improvements. The optimal retrieval performance was achieved using the full feature combination (R2 = 0.75, RMSE = 0.92 m). Reverse loss verification experiments further supported this conclusion: although removing any single non-spectral feature category did not cause a significant decline in retrieval accuracy, the full fusion of all five feature categories still yielded the highest accuracy. This indicates the existence of weak but non-negligible synergistic gain effects among different feature types. These synergistic effects cannot be detected through individual feature addition/removal experiments and only emerge under the overall coupling of multi-source features.
Generally, the full feature combination not only achieved the highest retrieval accuracy in this study, but also significantly enhanced model generalization ability and robustness through multi-source cross-validation of optical, radar, and terrain data. This effectively mitigates uncertainties caused by single-sensor interference factors such as atmospheric scattering and cloud cover occlusion. Therefore, the full-feature combination model was selected as the benchmark model for mangrove tree height retrieval in this study, providing a robust foundation for subsequent analyses of spatiotemporal mangrove height distribution patterns and accurate carbon storage estimation in the Zhangjiang Estuary.
4.3. Drivers and Restoration-Related Patterns of Mangrove Ecosystem Change
4.3.1. Statistical Associations Among Environmental and Human-Related Drivers
It should be noted that significant correlation does not equal causal relationships. Correlation analysis was performed based on n = 10 annual observations (2016–2025). Due to limited data availability, mangrove above-ground vegetation carbon stock was only acquired for three discrete years (2021, 2023, and 2025) and was not included in the Pearson correlation calculation; its interannual variation is interpreted qualitatively. Therefore, the correlation analysis presented in Figure 9 focuses on the relationships between driving factors and mangrove area (n = 10). Potential biases from temporal autocorrelation, shared temporal trends, and multicollinearity should be considered when interpreting these results.
Figure 9.
Correlation Matrix between influencing factors.
To disentangle the impacts of environmental conditions and S. alterniflora invasion on mangrove area, the relative explanatory capacity of each factor was quantified (Figure 9). Temperature exhibited a moderate negative correlation with mangrove area (R = −0.67). Annual average temperatures in the study area have exceeded the optimal growth range for mangroves. Rainfall showed a weak positive correlation (R = 0.18). The effects of annual average tide level were bidirectional: higher tide levels facilitated area expansion by transporting nutrients and increasing growth space, but prolonged inundation may restrain mangrove development.
Among anthropogenic factors, GDP (R = 0.79), nighttime light index (R = 0.77), and population size (R = 0.77) all showed strong positive correlations with mangrove area. However, these statistical associations may stem from shared temporal trends rather than direct ecological driving effects. Population growth has not led to disorderly reclamation; instead, community co-management and protection measures have optimized habitat conditions.
In contrast, S. alterniflora area showed a strong negative correlation with mangrove area (R = −0.89), as its invasion directly occupied mangrove habitats. Population size and GDP were negatively correlated with S. alterniflora area, indicating that control measures have effectively curbed its expansion. At the natural level, temperature was positively correlated with S. alterniflora (R = 0.69), while rainfall was negatively correlated, highlighting the opposing hydrothermal adaptation preferences of the two species.
Although carbon stock was not directly included in the correlation analysis, its temporal dynamics were qualitatively consistent with mangrove area changes. Total carbon stock increased from 2683.43 t in 2021 to 5857.37 t in 2025, following the same trajectory as area expansion. This correspondence suggests that area expansion, driven by the combined effects of natural conditions and human interventions, was the primary factor controlling carbon stock increase during the study period.
Collectively, these correlations reveal a multi-layer interactive chain. S. alterniflora eradication is a human-driven prerequisite that releases intertidal habitats for mangrove recolonization. However, whether mangroves can occupy these tidal flats and accumulate carbon stocks depends on natural hydro-thermal and tidal conditions, as well as ongoing conservation policies. No single factor independently drives carbon-stock variation; mangrove carbon sink performance results from the coupled effects of natural background and human interventions.
4.3.2. Interpretation of Temporal Patterns in Canopy Height and Carbon-Stock
Our multi-temporal canopy-height retrievals reveal a contrasting trend: regional-mean mangrove canopy height rose moderately from 2021 to 2023 but dropped markedly in 2025, alongside continuous mangrove areal expansion. This pattern is largely associated with the dilution effect of mass-planted seedlings on restored tidal flats, while stable growth of core-zone mature mangroves partially counteracts this downward pull. Besides the dilution effect caused by extensive newly planted seedlings, mechanical operations for S. alterniflora eradication may bring short-term ecological disturbances. Mechanical deep-excavation and burial were mainly implemented on S. alterniflora-occupied tidal flats, spatially isolated from core native mangrove zones, suggesting that direct root damage to most mature trees is likely limited. However, mangrove individuals located at patch boundaries may experience indirect sediment redistribution and hydrological alterations; young mangrove individuals are more vulnerable to such external interferences than mature trees. Large-scale invasive-species control inevitably brings localized short-term ecological perturbations, although the core mangrove area remains relatively unaffected. Nevertheless, seedling recruitment cannot fully explain the height variation. Mechanical S. alterniflora removal may trigger local short-term ecological perturbations. Though deep-excavation operations are mostly confined to former invaded tidal flats away from mature mangrove cores, patch-edge mangroves can experience indirect disturbances such as sediment redistribution and temporary hydrological shifts, with juvenile mangroves being more susceptible than mature individuals. Thus, large-scale invasive-species management produces localized short-term disturbance despite minimal impacts on core mangrove habitats. Canopy-height retrieval uncertainty and stand-structure spatial heterogeneity also contribute to the observed temporal height fluctuation.
Mirroring canopy-height changes, carbon-stock results demonstrate a “scale-expansion first, quality-improvement later” restoration trajectory. Total above-ground vegetation carbon stock increased greatly, yet per-unit-area carbon density declined after 2023 owing to the growing proportion of low-biomass young plantations. Native mature mangroves sustained steady productivity, and newly planted seedling patches possess substantial future carbon-accumulation potential, subject to seedling survival and normal stand development.
Nevertheless, the “scale-expansion-first, quality-improvement-later” restoration trajectory introduces uncertainties for future carbon sink outcomes. In an optimistic scenario, planted seedlings survive and grow well; as young stands mature, canopy height and per-unit-area carbon stock increase, unlocking regional blue carbon potential. In a risk scenario, seedling survival and stand growth may be limited by environmental stress, disease, or S. alterniflora reinvasion, potentially slowing or stalling carbon density gains and undermining long-term sink benefits. It should also be noted that our long-term carbon-sink scenarios do not account for climate-change factors such as sea-level rise or increased storm frequency, which could introduce additional uncertainty into the projected carbon-sink trajectories. Restoration management should therefore emphasize not only area expansion but also long-term monitoring of seedling survival, stand development, habitat stability, and reinvasion risks.
In summary, understanding the relationships between mangrove carbon storage and its influencing factors is essential for developing conservation strategies and enhancing carbon sequestration. A balance must be struck between maintaining natural environments and coordinating human activities. Based on our findings, we recommend continuous monitoring of S. alterniflora dynamics, restoration under suitable tidal-flat conditions with optimized hydrological connectivity, long-term field observations of restored stands, increased investment in ecological management, and targeted policies to curb S. alterniflora spread. Only through such integrated efforts can the long-term health and carbon sink function of mangrove ecosystems be sustained and improved.
5. Conclusions
This study constructed a technical framework for accurate mangrove classification and carbon storage estimation based on multi-source remote sensing data fusion, integrated the multi-dimensional features of optical, microwave remote sensing and topographic data, and adopted Random Forest, Support Vector Machine and XGBoost classifiers to achieve fine classification of mangroves. The optimal model was screened through accuracy evaluation to generate classification maps and conduct area statistics. Furthermore, a tree height retrieval model was established combined with ICESat-2 canopy height data, and aboveground biomass was derived through allometric equations, finally completing the remote sensing estimation of above-ground vegetation carbon storage in the study area. The research results show the following: (1) From 2016 to 2025, the evolution of mangrove area in the Zhangjiang Estuary can be divided into two stages, namely stable fluctuation from 2016 to 2022, with the area maintained at 75.78–81.34 ha, and rapid growth from 2023 to 2025. The minimum area was 75.78 ha in 2018, and the maximum area was 183.49 ha in 2025, representing an increase of 1.4 times compared with 2018. (2) The distribution range of mangroves in the Zhangjiang Estuary has gradually expanded. In 2016, they were mainly concentrated in the core area of the Zhangjiang Estuary Mangrove National Nature Reserve, and then gradually spread to the coastal tidal flats around the reserve. At present, in addition to the contiguous distribution in the core area, scattered small patches have also formed along the coast of the Zhangjiang Estuary and the surrounding intertidal zones, with significantly improved distribution continuity and coverage compared with 2016. (3) Among the three classification algorithms used in this study (Random Forest, Support Vector Machine and XGBoost), the Random Forest algorithm had the highest classification accuracy, while the Support Vector Machine algorithm had the lowest. The selected optimal algorithm provided high-precision data support for mangrove area statistics and distribution extraction. (4) From 2016 to 2025, the mangrove area in the Zhangjiang Estuary increased significantly, the distribution range continued to expand, and the spatial distribution diversity improved remarkably, which is highly consistent with the implementation progress of local mangrove conservation, S. alterniflora eradication and habitat restoration initiatives. The mangrove distribution and carbon storage estimation results obtained in this study can provide basic data for remote sensing monitoring and carbon sink assessment of mangrove ecosystems in protected areas, and have important practical significance for mangrove ecological protection and carbon sink function enhancement.
Nevertheless, several limitations of this study should be explicitly acknowledged. First, this study only estimated above-ground mangrove vegetation carbon stocks, while below-ground biomass and soil organic carbon pools were not included in the carbon accounting system. Second, the canopy-height-based allometric biomass model may introduce potential uncertainties during regional-scale application and parameter transfer. Third, the relationship between invasive S. alterniflora management and mangrove carbon stock recovery is summarized based on long-term observational time-series trends. In the absence of controlled field experiments, strict causal relationships cannot be fully determined. Future studies should incorporate field soil carbon surveys, multi-year below-ground biomass monitoring, and controlled comparison experiments to further reduce estimation uncertainty and verify the driving mechanisms of wetland carbon sink evolution.
Supplementary Materials
The following supporting information can be downloaded at https://www.mdpi.com/article/10.3390/rs18193334/s1, Table S1. Annual quantity of reference sample points for five land-cover types from 2016 to 2025. Table S2. Summary of multi-source remote sensing classification features.
Author Contributions
Writing—Original Draft, Software, Methodology, Investigation, and Formal Analysis, B.Z.; Writing—Review & Editing, Supervision, and Data Curation, N.W.; Review & Editing, Funding Acquisition, and Writing—Review & Editing, W.Z.; Review & Editing, L.Z.; Supervision and Review & Editing, M.Z.; Writing—Review & Editing, X.L.; Writing—Review, Data Curation, and Supervision, J.W. All authors have read and agreed to the published version of the manuscript.
Funding
This research was supported by the National Natural Science Foundation of China (Grant No. 42501401, No. 42601580); the Natural Science Foundation of Anhui Province (Grant No. 2508085QD125, No. 2208085US12); the Key Laboratory of Southeast Coast Marine Information Intelligent Perception and Application, MNR (Grant No. 24103); the Natural Science Research Project of the Anhui Provincial Department of Education (Grant No. 2022AH050193); the National College Student Innovation and Entrepreneurship Training Program of China (Grant No. 2025034811, No. 202510370628); and the Anhui Normal University Student Innovation and Entrepreneurship Training Program (Grant No. pyjh2024334, No. S202510370649).
Informed Consent Statement
Not applicable.
Data Availability Statement
Data is contained within the article. Further inquiries can be directed to the corresponding author.
Conflicts of Interest
The authors declare no conflicts of interest.
References
- Jia, M.; Wang, Z.; Mao, D.; Huang, C.; Lu, C. Spatial-temporal changes of China’s mangrove forests over the past 50 years: An analysis towards the Sustainable Development Goals. Chin. Sci. Bull. 2021, 66, 3886–3901. [Google Scholar] [CrossRef] [Scilit]
- Macreadie, P.I.; Costa, M.D.; Atwood, T.B.; Friess, D.A.; Kelleway, J.J.; Kennedy, H.; Lovelock, C.E.; Serrano, O.; Duarte, C.M. Blue carbon as a natural climate solution. Nat. Rev. Earth Environ. 2021, 2, 826–839. [Google Scholar] [CrossRef] [Scilit]
- Wang, F.; Liu, J.; Qin, G.; Zhang, J.; Zhou, J.; Wu, J.; Zhang, L.; Thapa, P.; Sanders, C.J.; Santos, I.R.; et al. Coastal blue carbon in China as a nature-based solution toward carbon neutrality. Innovation 2023, 4, 100469. [Google Scholar] [CrossRef] [Scilit] [PubMed]
- Zhang, J.F.; Gan, S.C.; Yang, P.; Zhou, J.; Huang, X.; Chen, H.; He, H.; Saintilan, N.; Sanders, C.J.; Wang, F. A global assessment of mangrove soil organic carbon sources and implications for blue carbon credit. Nat. Commun. 2024, 15, 8994. [Google Scholar] [CrossRef] [Scilit] [PubMed]
- Ju, C.; Fu, D.; Lyne, V.; Xiao, H.; Su, F.; Yu, H. Global declines in mangrove area and carbon-stock from 1985 to 2020. Geophys. Res. Lett. 2025, 52, e2025GL1153. [Google Scholar] [CrossRef] [Scilit]
- Wang, F.M.; Sanders, C.J.; Santos, I.R.; Tang, J.; Schuerch, M.; Kirwan, M.L.; Kopp, R.E.; Zhu, K.; Li, X.; Yuan, J.; et al. Global blue carbon accumulation in tidal wetlands increases with climate change. Natl. Sci. Rev. 2021, 8, nwaa296. [Google Scholar] [CrossRef] [Scilit] [PubMed]
- Bullock, E.L.; Fagherazzi, S.; Nardin, W.; Vo-Luong, P.; Nguyen, P.; Woodcock, C.E. Temporal patterns in species zonation in a mangrove forest in the Mekong Delta, Vietnam, using a time series of Landsat imagery. Cont. Shelf Res. 2017, 147, 144–154. [Google Scholar] [CrossRef] [Scilit]
- Valderrama-Landeros, L.; Flores-de-Santiago, F.; Kovacs, J.M.; Flores-Verdugo, F. An assessment of commonly employed satellite-based remote sensors for mapping mangrove species in Mexico using an NDVI-based classification scheme. Environ. Monit. Assess. 2018, 190, 1–13. [Google Scholar] [CrossRef] [Scilit] [PubMed]
- Aja, D.; Miyittah, M.K.; Angnuureng, D.B. Quantifying mangrove extent using a combination of optical and radar images in a wetland complex, Western region, Ghana. Sustainability 2022, 14, 16687. [Google Scholar] [CrossRef] [Scilit]
- Xue, Y.; Zhang, S.; Bai, N.; Yuan, F.; Liu, J.; Chen, Y.; Huang, X.; Xiong, L.; Fu, Y. Classification of mangrove species using coupled Sentinel-1/2 multi-source time-series remote sensing image features. J. Geo-Inf. Sci. 2024, 26, 2626–2642. [Google Scholar]
- Zhang, D.; Hu, Y.; Liu, M.; Chang, Y.; Yan, X.; Bu, R.; Zhao, D.; Li, Z. Introduction and spread of an exotic plant, Spartina alterniflora, along coastal marshes of China. Wetlands 2017, 37, 1181–1193. [Google Scholar] [CrossRef] [Scilit]
- Michałowska, M.; Rapiński, J. A review of tree species classification based on airborne LiDAR data and applied classifiers. Remote Sens. 2021, 13, 353. [Google Scholar] [CrossRef] [Scilit]
- Sun, C.; Li, J.; Liu, Y.; Zhao, S.; Zheng, J.; Zhang, S. Tracking annual changes in the distribution and composition of saltmarsh vegetation on the Jiangsu coast of China using Landsat time series–based phenological parameters. Remote Sens. Environ. 2023, 284, 113370. [Google Scholar] [CrossRef] [Scilit]
- Yang, Y.; Meng, Z.; Zu, J.; Cai, W.; Wang, J.; Su, H.; Yang, J. Fine-scale mangrove species classification based on UAV multispectral and hyperspectral remote sensing using machine learning. Remote Sens. 2024, 16, 3093. [Google Scholar] [CrossRef] [Scilit]
- Alongi, D.M. Carbon cycling and storage in mangrove forests. Annu. Rev. Mar. Sci. 2014, 6, 195–219. [Google Scholar] [CrossRef] [Scilit] [PubMed]
- Pham, T.D.; Yokoya, N.; Bui, D.T.; Yoshino, K.; Friess, D.A. Remote sensing approaches for monitoring mangrove species, structure, and biomass: Opportunities and challenges. Remote Sens. 2019, 11, 230–254. [Google Scholar] [CrossRef] [Scilit]
- Fromard, F.; Puig, H.; Mougin, E.; Marty, G.; Betoulle, J.L.; Cadamuro, L. Structure, above-Ground Biomass and Dynamics of Mangrove Ecosystems. Oecologia 1998, 115, 39–53. [Google Scholar] [CrossRef] [Scilit] [PubMed]
- Komiyama, A.; Poungparn, S.; Kato, S. Common allometric equations for estimating the tree weight of mangroves. J. Trop. Ecol. 2005, 21, 471–477. [Google Scholar] [CrossRef] [Scilit]
- Clough, B.F. Allometric Relationships for Estimating Biomass in Multi-stemmed Mangrove Trees. Aust. J. Bot. 1997, 45, 1023–1031. [Google Scholar] [CrossRef] [Scilit]
- Castillo, J.A.A.; Apan, A.A.; Maraseni, T.N.; Salmo, S.G., III. Soil C quantities of mangrove forests, their competing land uses, and their spatial distribution in the coast of Honda Bay, Philippines. Geoderma 2017, 293, 82–90. [Google Scholar] [CrossRef] [Scilit]
- Li, Y.; Yuan, L.; Song, Z.; Yu, S.; Zhang, X.; Tian, B.; Liu, M. Salt marsh carbon stock estimation using deep learning with Sentinel-1 SAR of the Yangtze River estuary, China. Int. J. Appl. Earth Obs. Geoinf. 2024, 133, 104138. [Google Scholar] [CrossRef] [Scilit]
- Li, Y.; Li, M.; Li, C.; Liu, Z. Forest aboveground biomass estimation using Landsat 8 and Sentinel-1A data with machine learning algorithms. Sci. Rep. 2020, 10, 9865. [Google Scholar] [CrossRef] [Scilit] [PubMed]
- Singha, C.; Chandra Swain, K.; Sahoo, S.M.; Fadhil Al-Quraishi, A.; Omeiza Alao, J.; Almohamad, H.; Fatahalla Mohamed Ahmed, M.; Ghassan Abdo, H. Predicting forest above-ground biomass using SAR imagery and GEDI data through machine learning in GEE cloud. For. Sci. Technol. 2025, 21, 187–206. [Google Scholar] [CrossRef] [Scilit]
- Ghosh, S.M.; Behera, M.D.; Paramanik, S. Canopy height estimation using sentinel series images through machine learning models in a mangrove forest. Remote Sens. 2020, 12, 1519. [Google Scholar] [CrossRef] [Scilit]
- Zhang, B.; Smith, K.; Wdowinski, S.; Lin, C.; Gann, D.; Chavez, S.; Zhang, J. Space-Based Mapping of Mangrove Canopy Height with Multi-Sensor Observations and Deep Learning Techniques. In Proceedings of the IEEE International Geoscience and Remote Sensing Symposium (IGARSS), Kuala Lumpur, Malaysia, 17–22 July 2022; IEEE: New York, NY, USA, 2022; pp. 3389–3392. [Google Scholar]
- Zhu, X.; Fang, M. Evaluating and comparing the performance of ICESat-2 and GEDI data for estimating aboveground biomass in mangroves. Int. J. Remote Sens. 2026, 47, 2627082. [Google Scholar]
- Yu, J.; Nie, S.; Liu, W.; Zhu, X.; Lu, D.; Wu, W.; Sun, Y. Accuracy Assessment of ICESat-2 Ground Elevation and Canopy Height Estimates in Mangroves. IEEE Geosci. Remote Sens. Lett. 2022, 19, 1–5. [Google Scholar] [CrossRef] [Scilit]
- Staben, G.; Lucieer, A.; Scarth, P. Modelling LiDAR derived tree canopy height from Landsat TM, ETM+ and OLI satellite imagery—A machine learning approach. Int. J. Appl. Earth Obs. Geoinf. 2018, 73, 666–681. [Google Scholar] [CrossRef] [Scilit]
- Wang, L.; Jia, M.; Yin, D.; Tian, J. A review of remote sensing for mangrove forests: 1956– 2018. Remote Sens. Environ. 2019, 231, 111223. [Google Scholar] [CrossRef] [Scilit]
- Xu, M.; Sun, C.; Du, Z.; Zhu, X. Impacts of aquaculture on the area and soil carbon stocks of mangrove: A machine learning study in China. Sci. Total Environ. 2023, 859, 160173. [Google Scholar] [CrossRef] [Scilit] [PubMed]
- Ikhumhen, H.O.; Fang, Q.H.; Lin, Q.; Yang, S.; Matomela, N.; Meilana, L. Coastal waterbird eco-habitat stability assessment in Zhangjiangkou Mangrove National Nature Reserve Based on habitat function-coordination coupling. Ecol. Inform. 2022, 72, 101871. [Google Scholar] [CrossRef] [Scilit]
- Tian, Y.; Jia, M.; Wang, Z.; Mao, D.; Du, B.; Wang, C. Monitoring invasion process of Spartina alterniflora by seasonal Sentinel-2 imagery and an object-based random forest classification. Remote Sens. 2020, 12, 1383. [Google Scholar] [CrossRef] [Scilit]
- Baloloy, A.B.; Blanco, A.C.; Ana, R.R.; Nadaoka, K. Development and application of a new mangrove vegetation index (MVI) for rapid and accurate mangrove mapping. ISPRS J. Photogramm. Remote Sens. 2020, 166, 95–117. [Google Scholar] [CrossRef] [Scilit]
- Chen, Q.; Shen, C.; Du, H.; Tang, D. Comparing supervised classification algorithm–feature combinations for Spartina alterniflora extraction: A case study in Zhanjiang, China. Front. Remote Sens. 2025, 6, 1606549. [Google Scholar] [CrossRef] [Scilit]
- Qian, H.; Bao, N.; Meng, D.; Zhou, B.; Lei, H.; Li, H. Mapping and classification of Liao River Delta coastal wetland based on time series and multi-source GaoFen images using stacking ensemble model. Ecol. Inform. 2024, 80, 102488. [Google Scholar] [CrossRef] [Scilit]
- Shen, Z.; Miao, J.; Wang, J.; Zhao, D.; Tang, A.; Zhen, J. Evaluating Feature Selection Methods and Machine Learning Algorithms for Mapping Mangrove Forests Using Optical and Synthetic Aperture Radar Data. Remote Sens. 2023, 15, 5621. [Google Scholar] [CrossRef] [Scilit]
- Neumann, T.; Brunt, K.; Marguder, L.; Kurtz, N. Validation activities for the Ice, Cloud, and Land Elevation Satellite-2 (ICESat-2) Mission. In Proceedings of the EGU General Assembly, Online, 4–8 May 2020; p. EGU2020-20671. [Google Scholar]
- Huang, J.; Madushani, J.A.T.; Xia, T.; Gan, X. Optimizing Forest Canopy Height Estimation Through Varied Photon-Counting Characteristic Parameter Analysis, Window Size, and Forest Cover. Forests 2024, 15, 1957. [Google Scholar] [CrossRef] [Scilit]
- Zhang, R.; Fan, J. Classification and Carbon-Stock Estimation of Mangroves in Dongzhaigang Based on Multi-Source Remote Sensing Data Using Google Earth Engine. Remote Sens. 2025, 17, 964. [Google Scholar] [CrossRef] [Scilit]
- Wen, X.; Liu, K.; Cao, J.; Zhu, Y.; Wang, Z. Estimation of Mangrove Aboveground Biomass in China Using Forest Canopy Height through an Allometric Equation. Trop. Geogr. 2023, 43, 1–11. [Google Scholar]
- Wen, X. Extraction of Spatial Distribution Information and Inversion of Aboveground Biomass of Mangrove Wetlands Based on Multi-source Remote Sensing Data. Master’s Thesis, Jilin University, Changchun, China, 2021. [Google Scholar]
- Chen, N. Mapping mangrove in Dongzhaigang, China using Sentinel-2 imagery. J. Appl. Remote Sens. 2020, 14, 014508. [Google Scholar] [CrossRef] [Scilit]
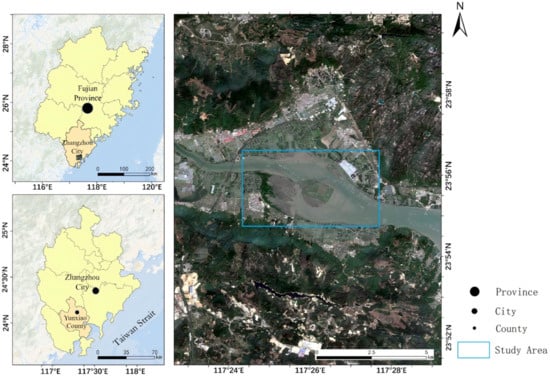
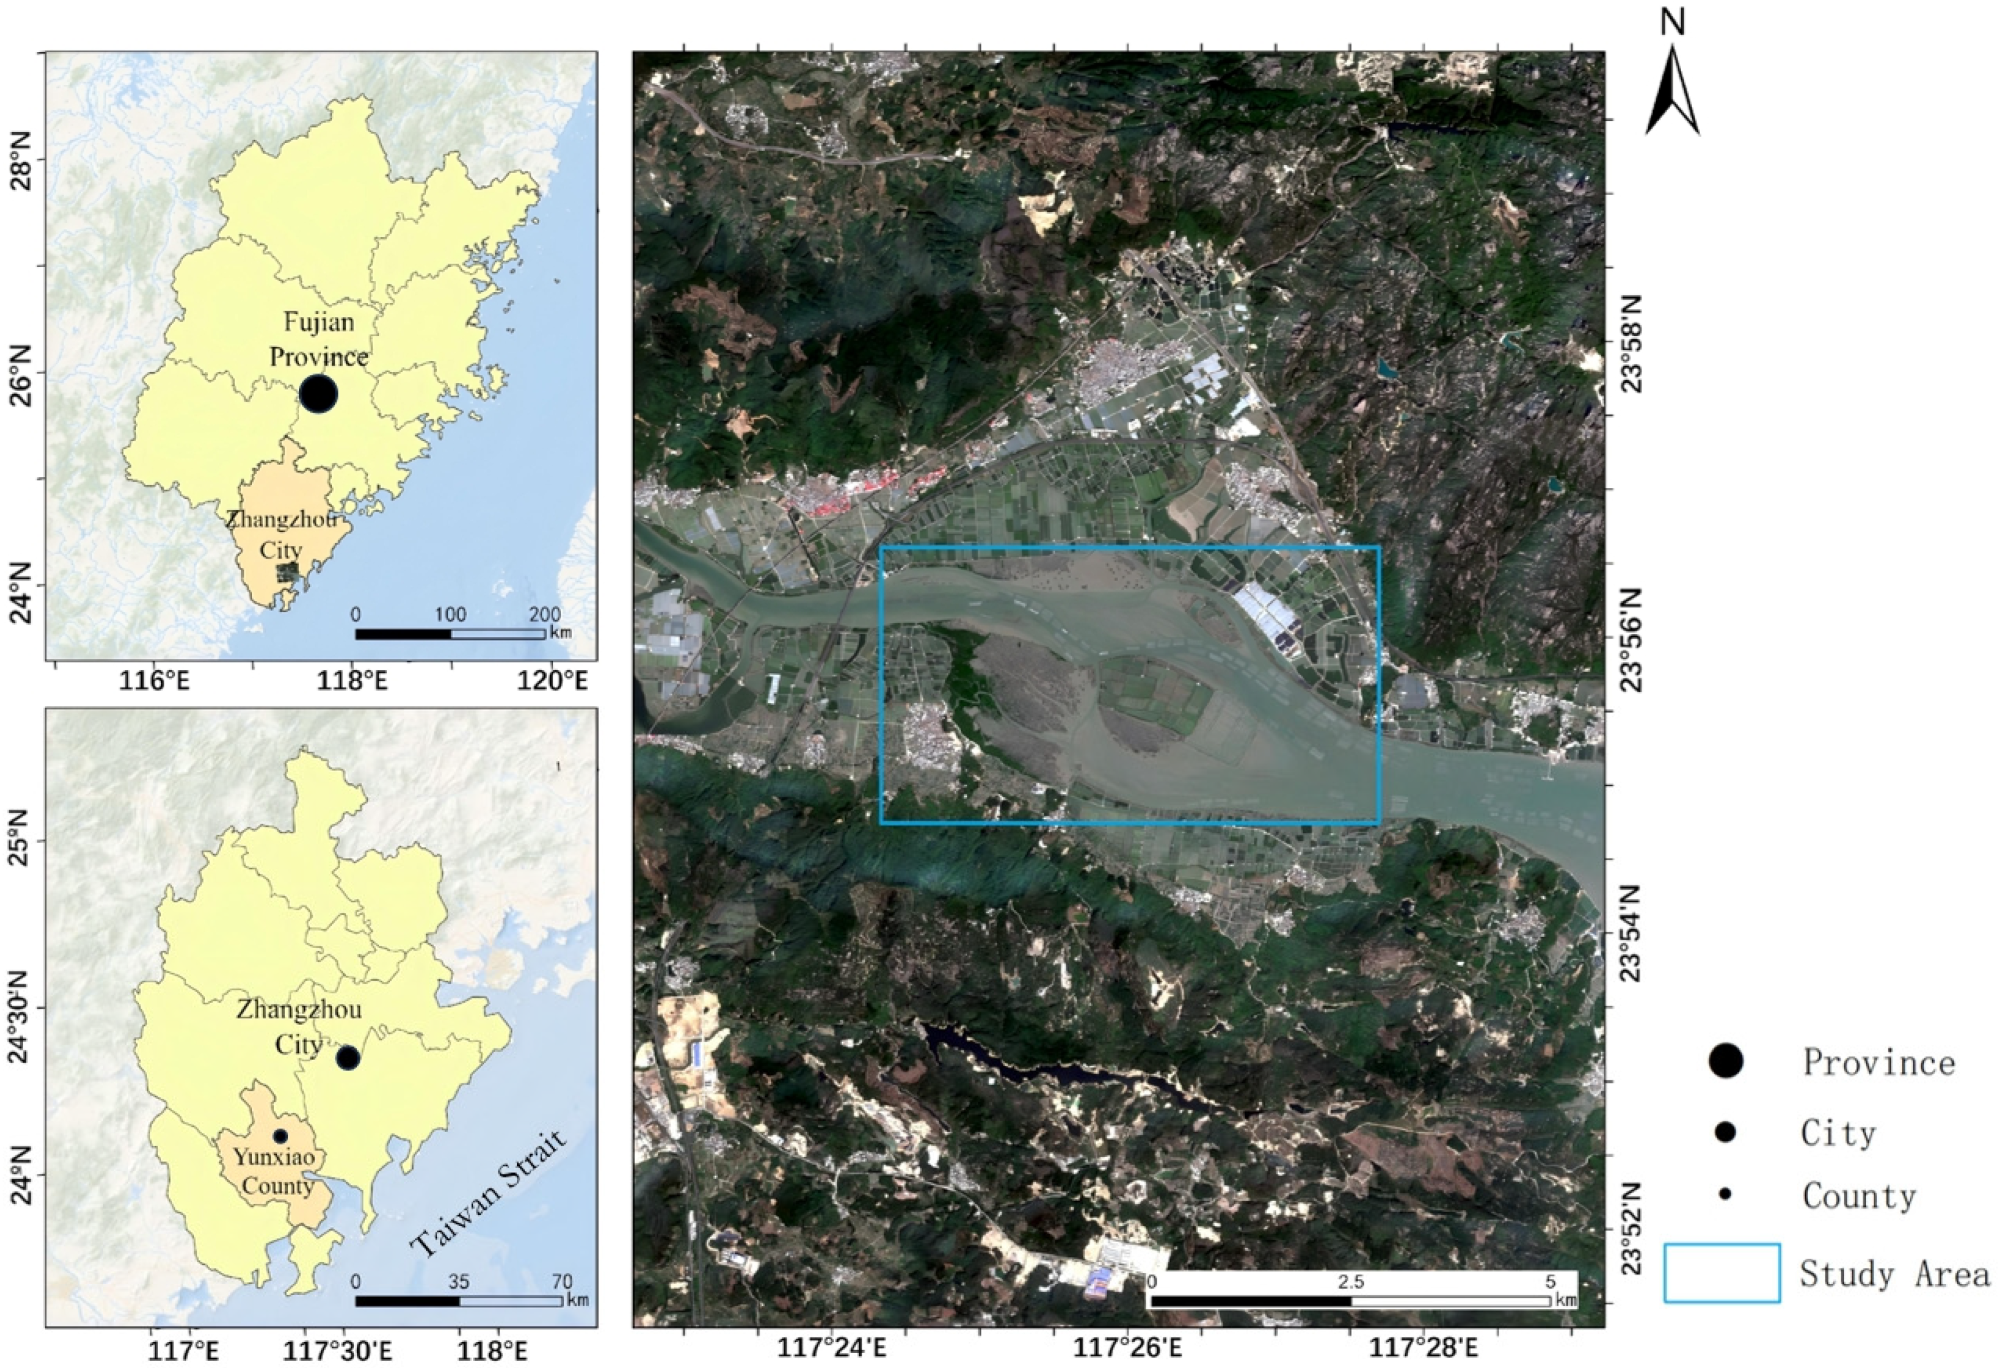
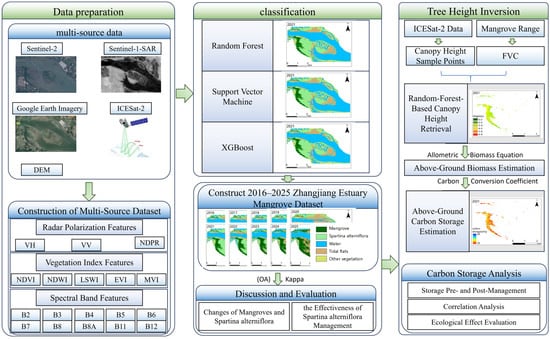
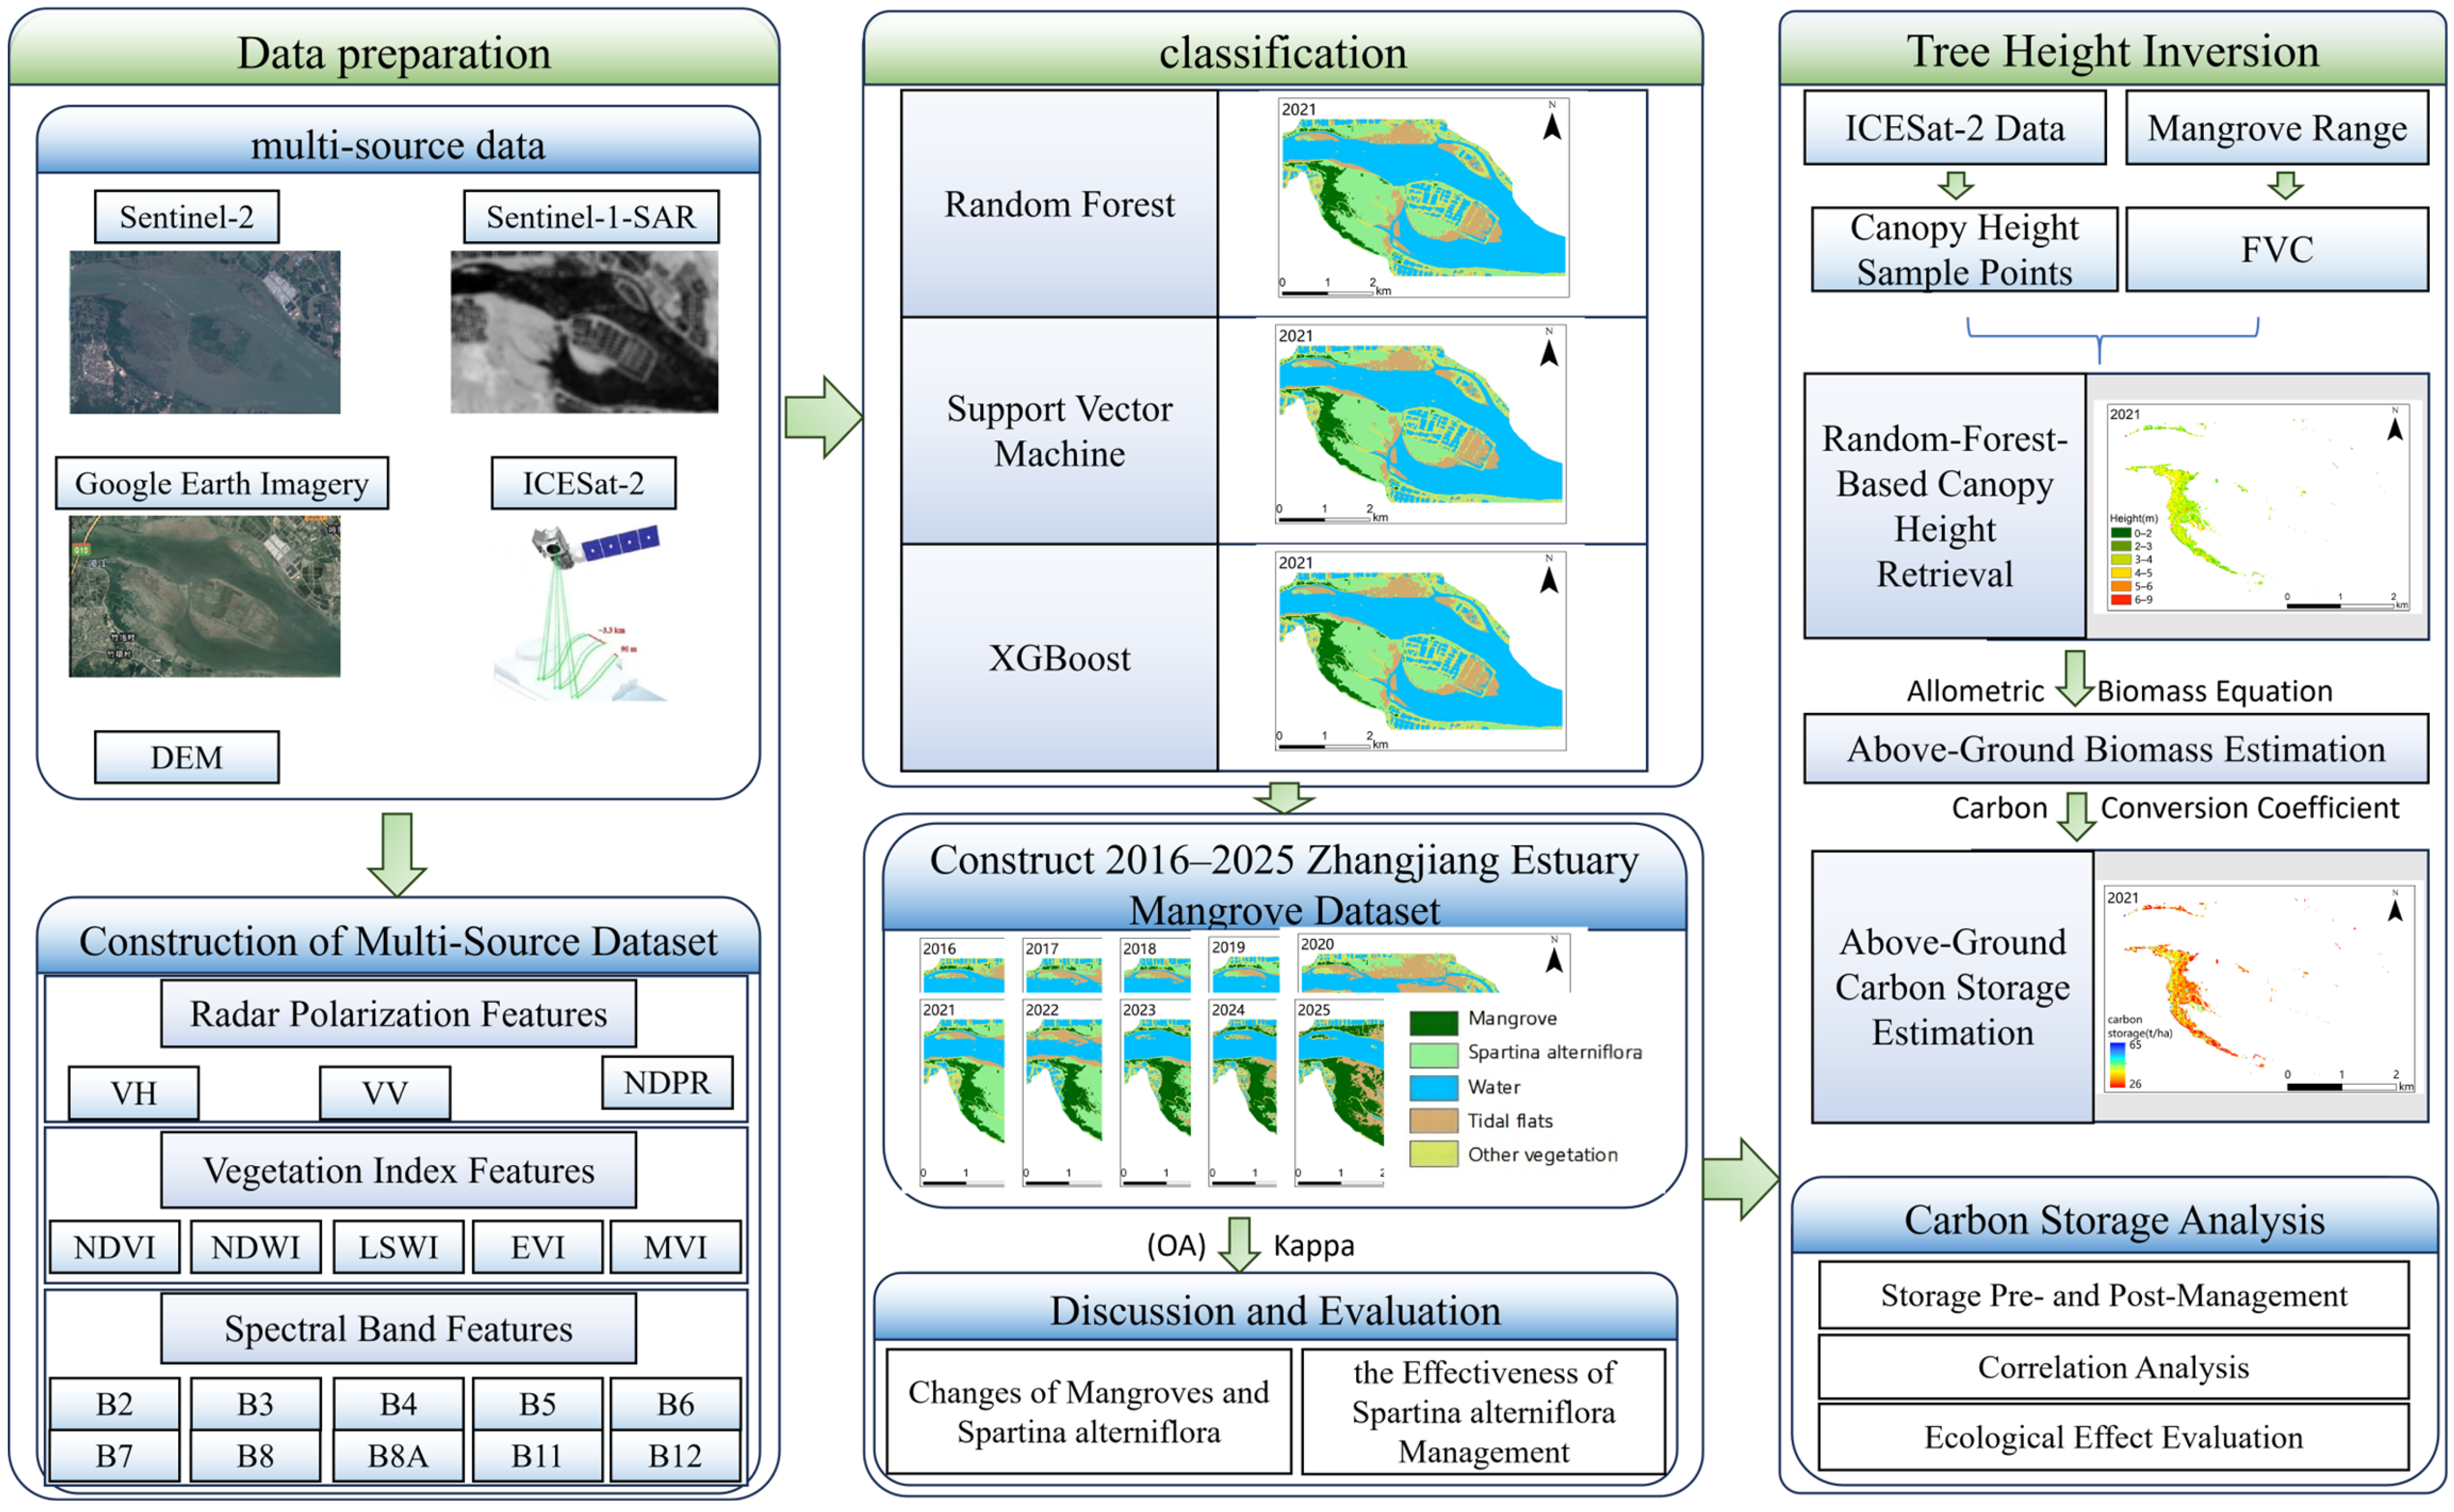
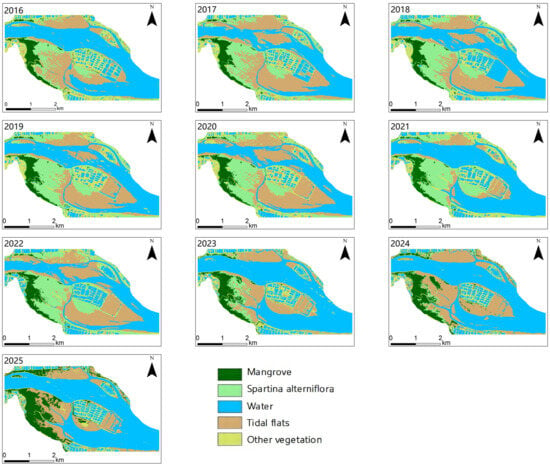
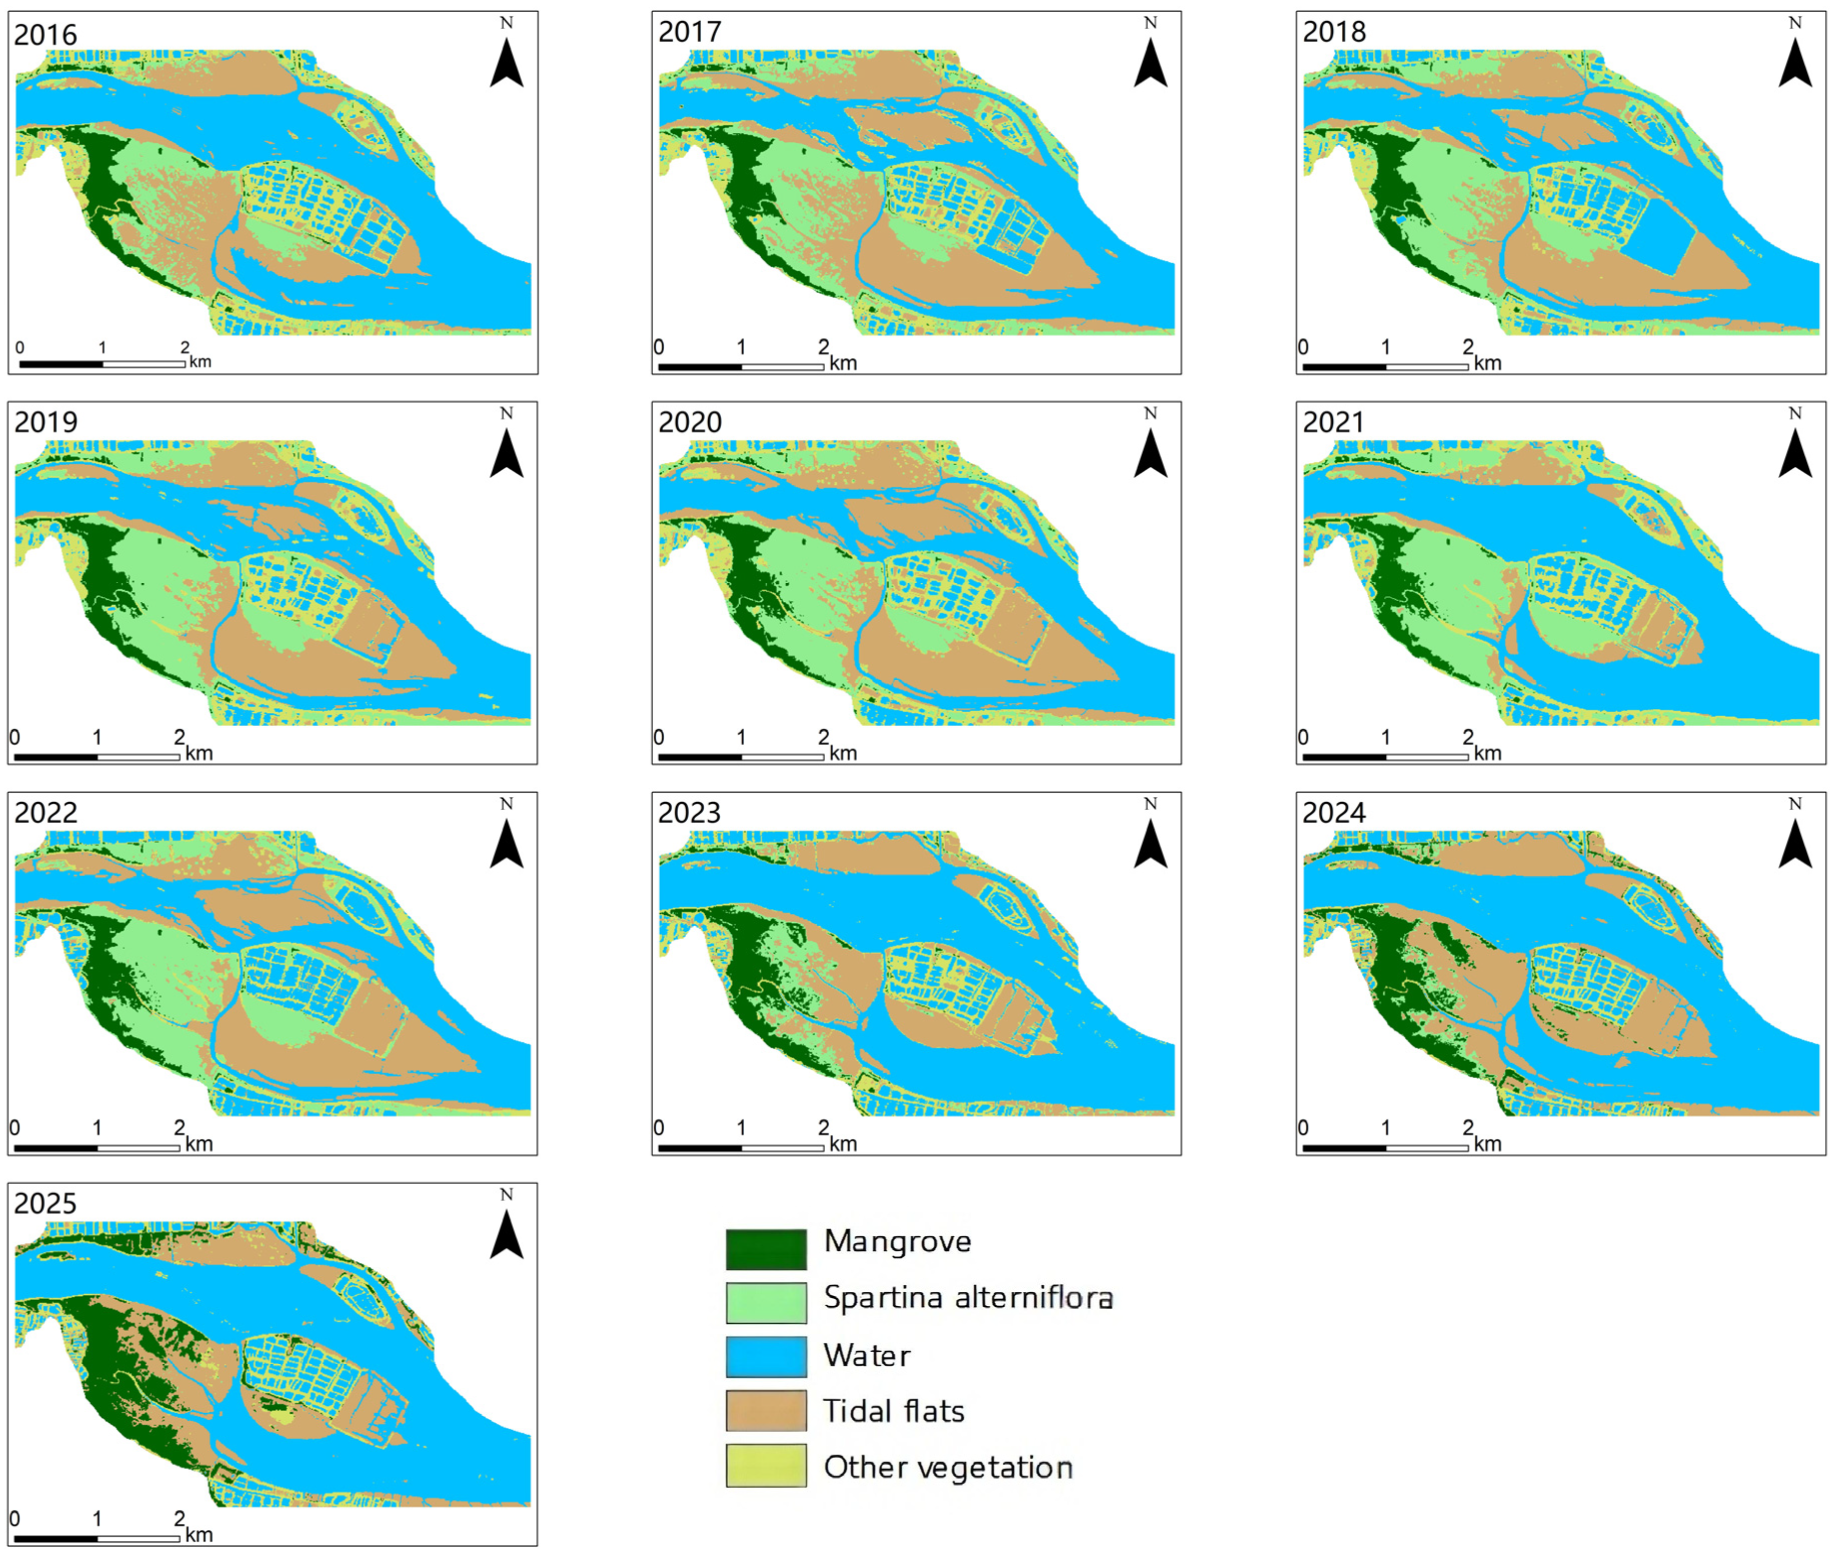
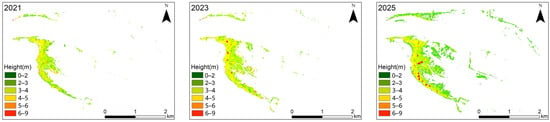
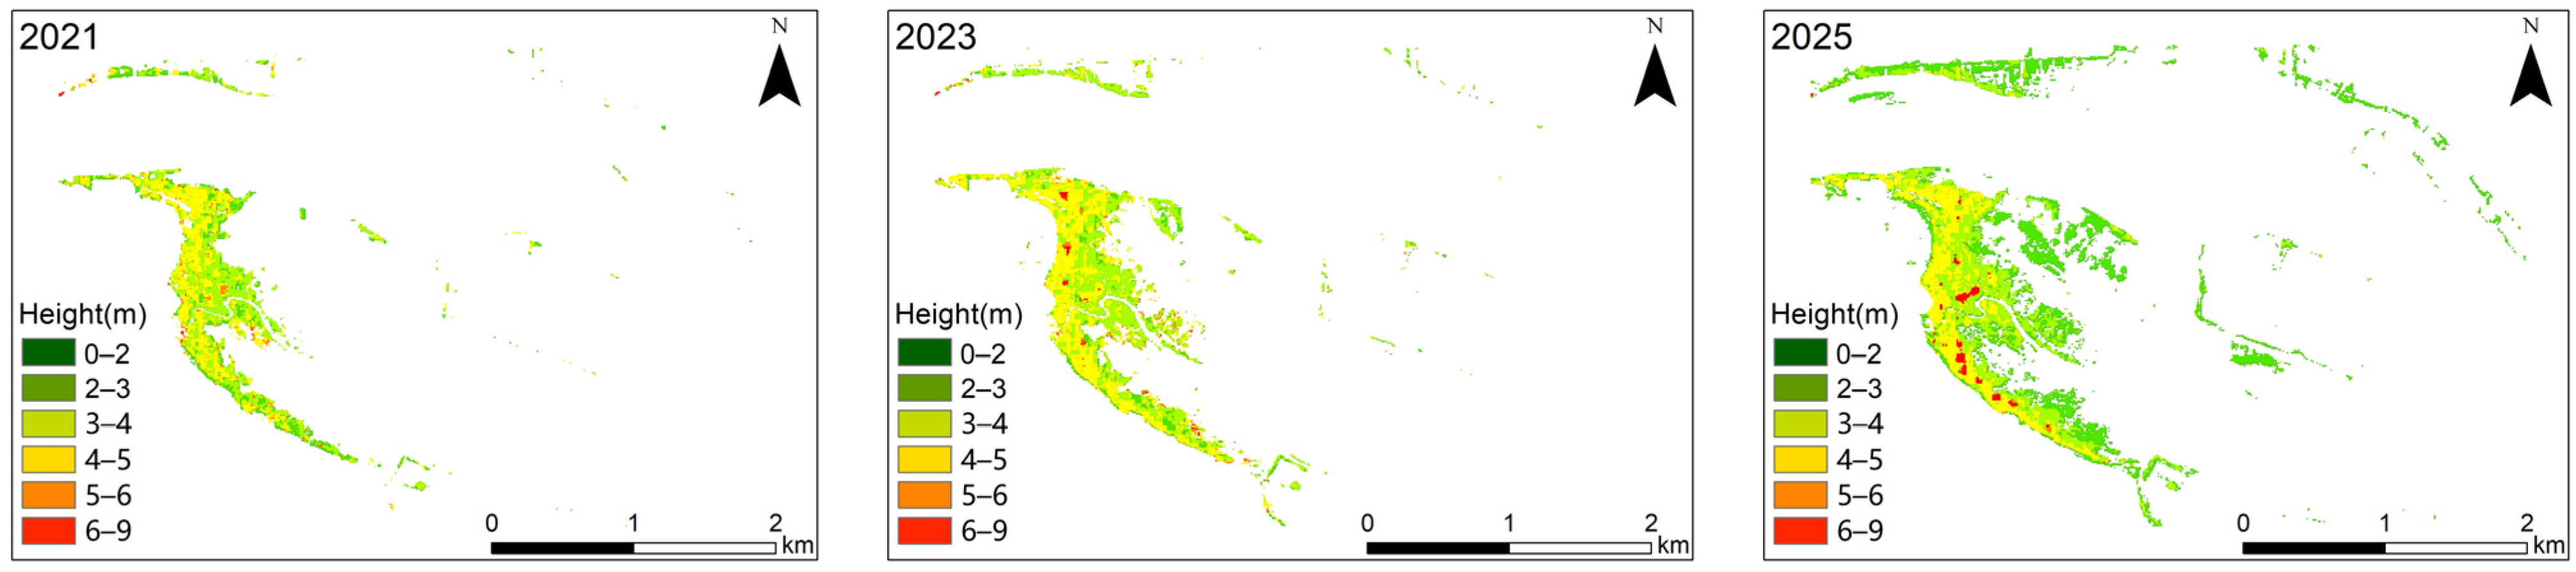
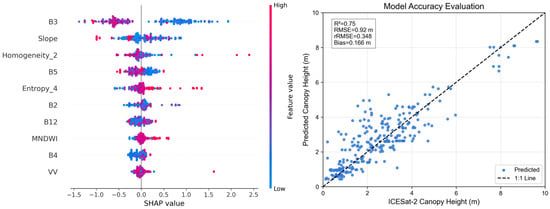
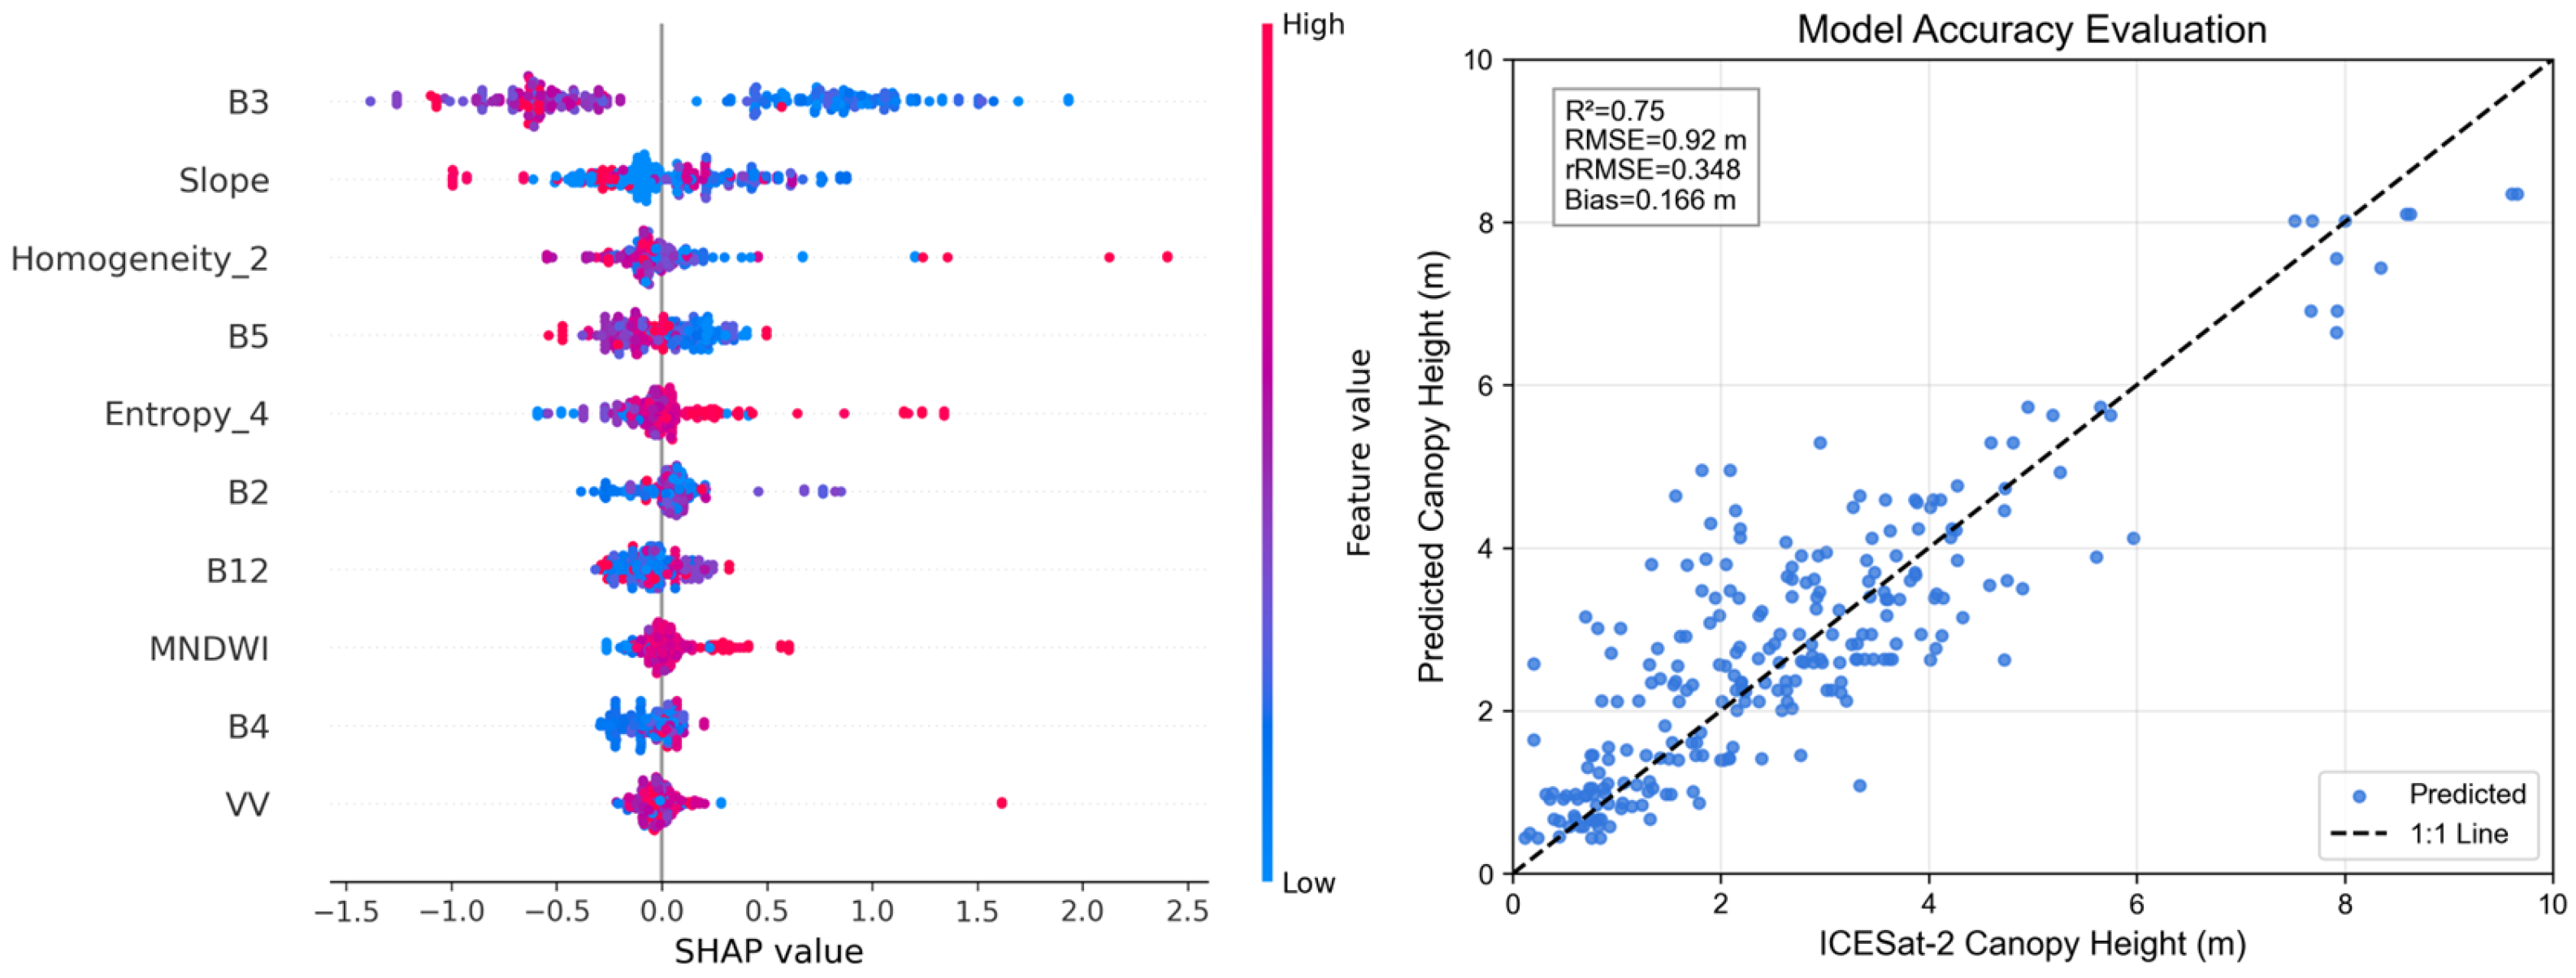
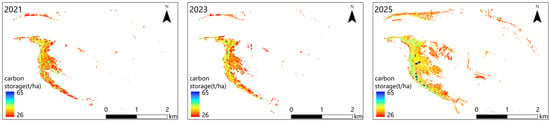
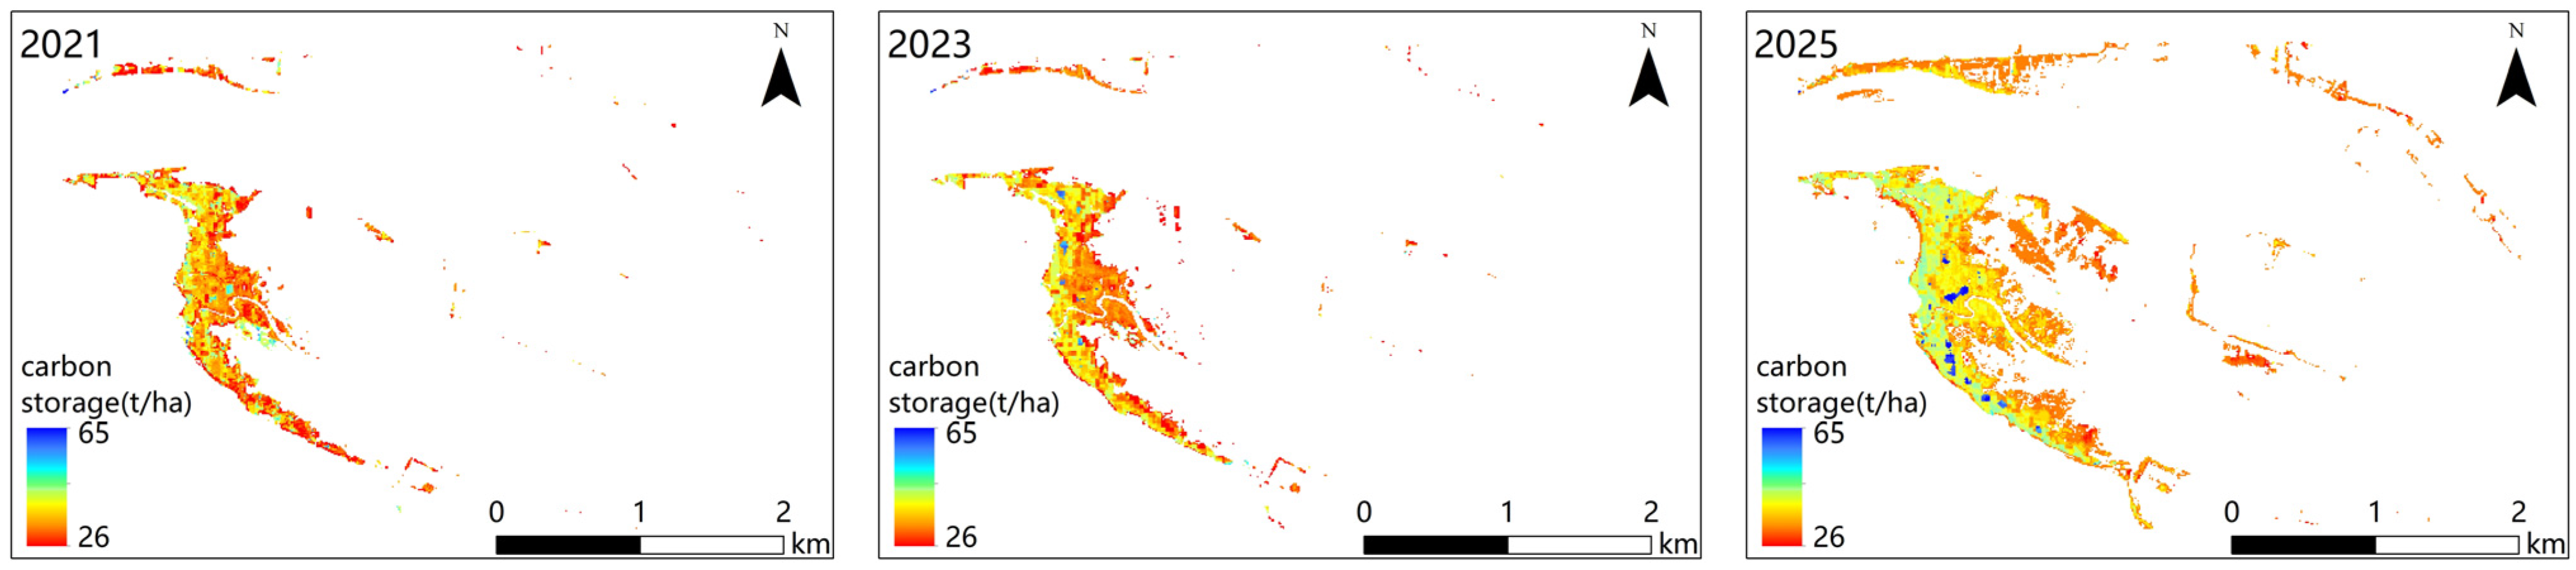
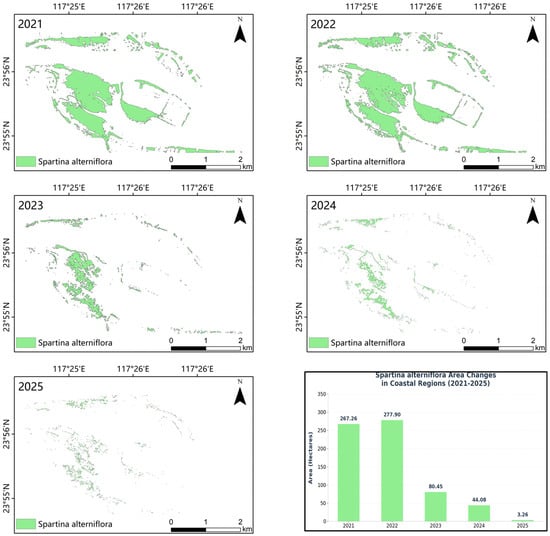
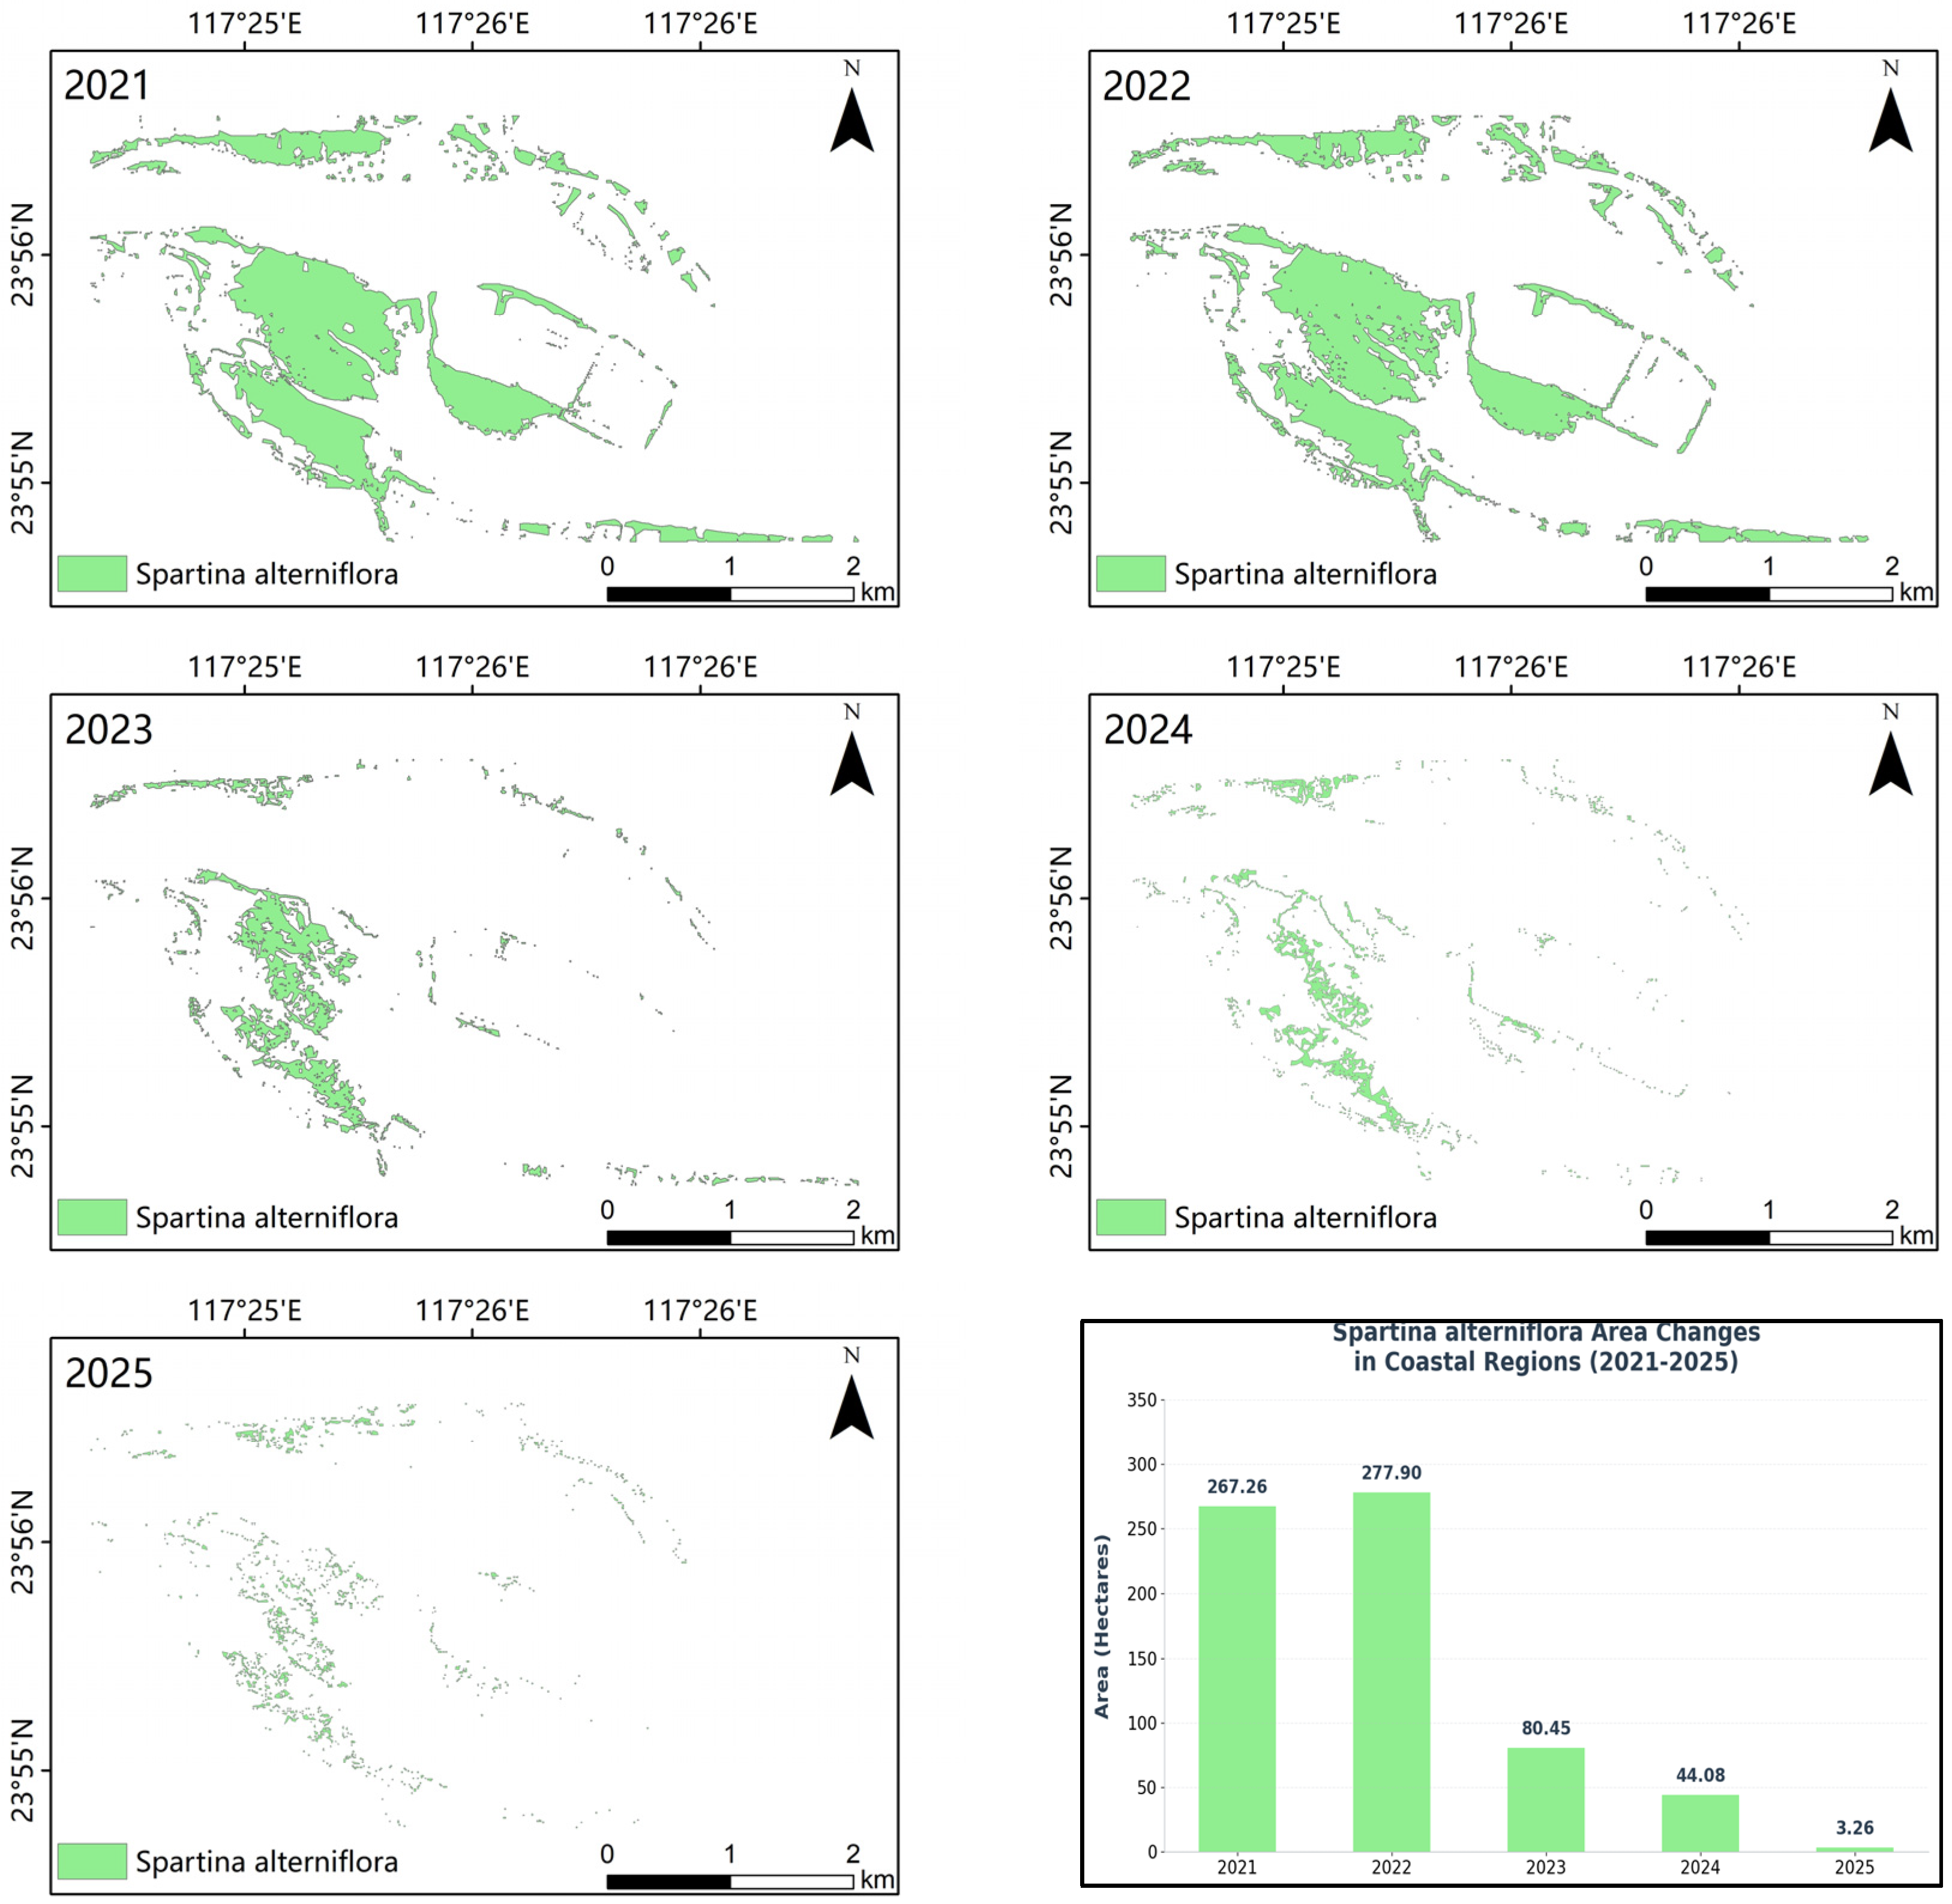
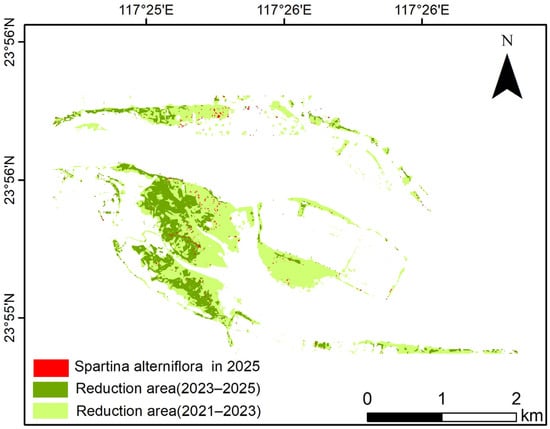
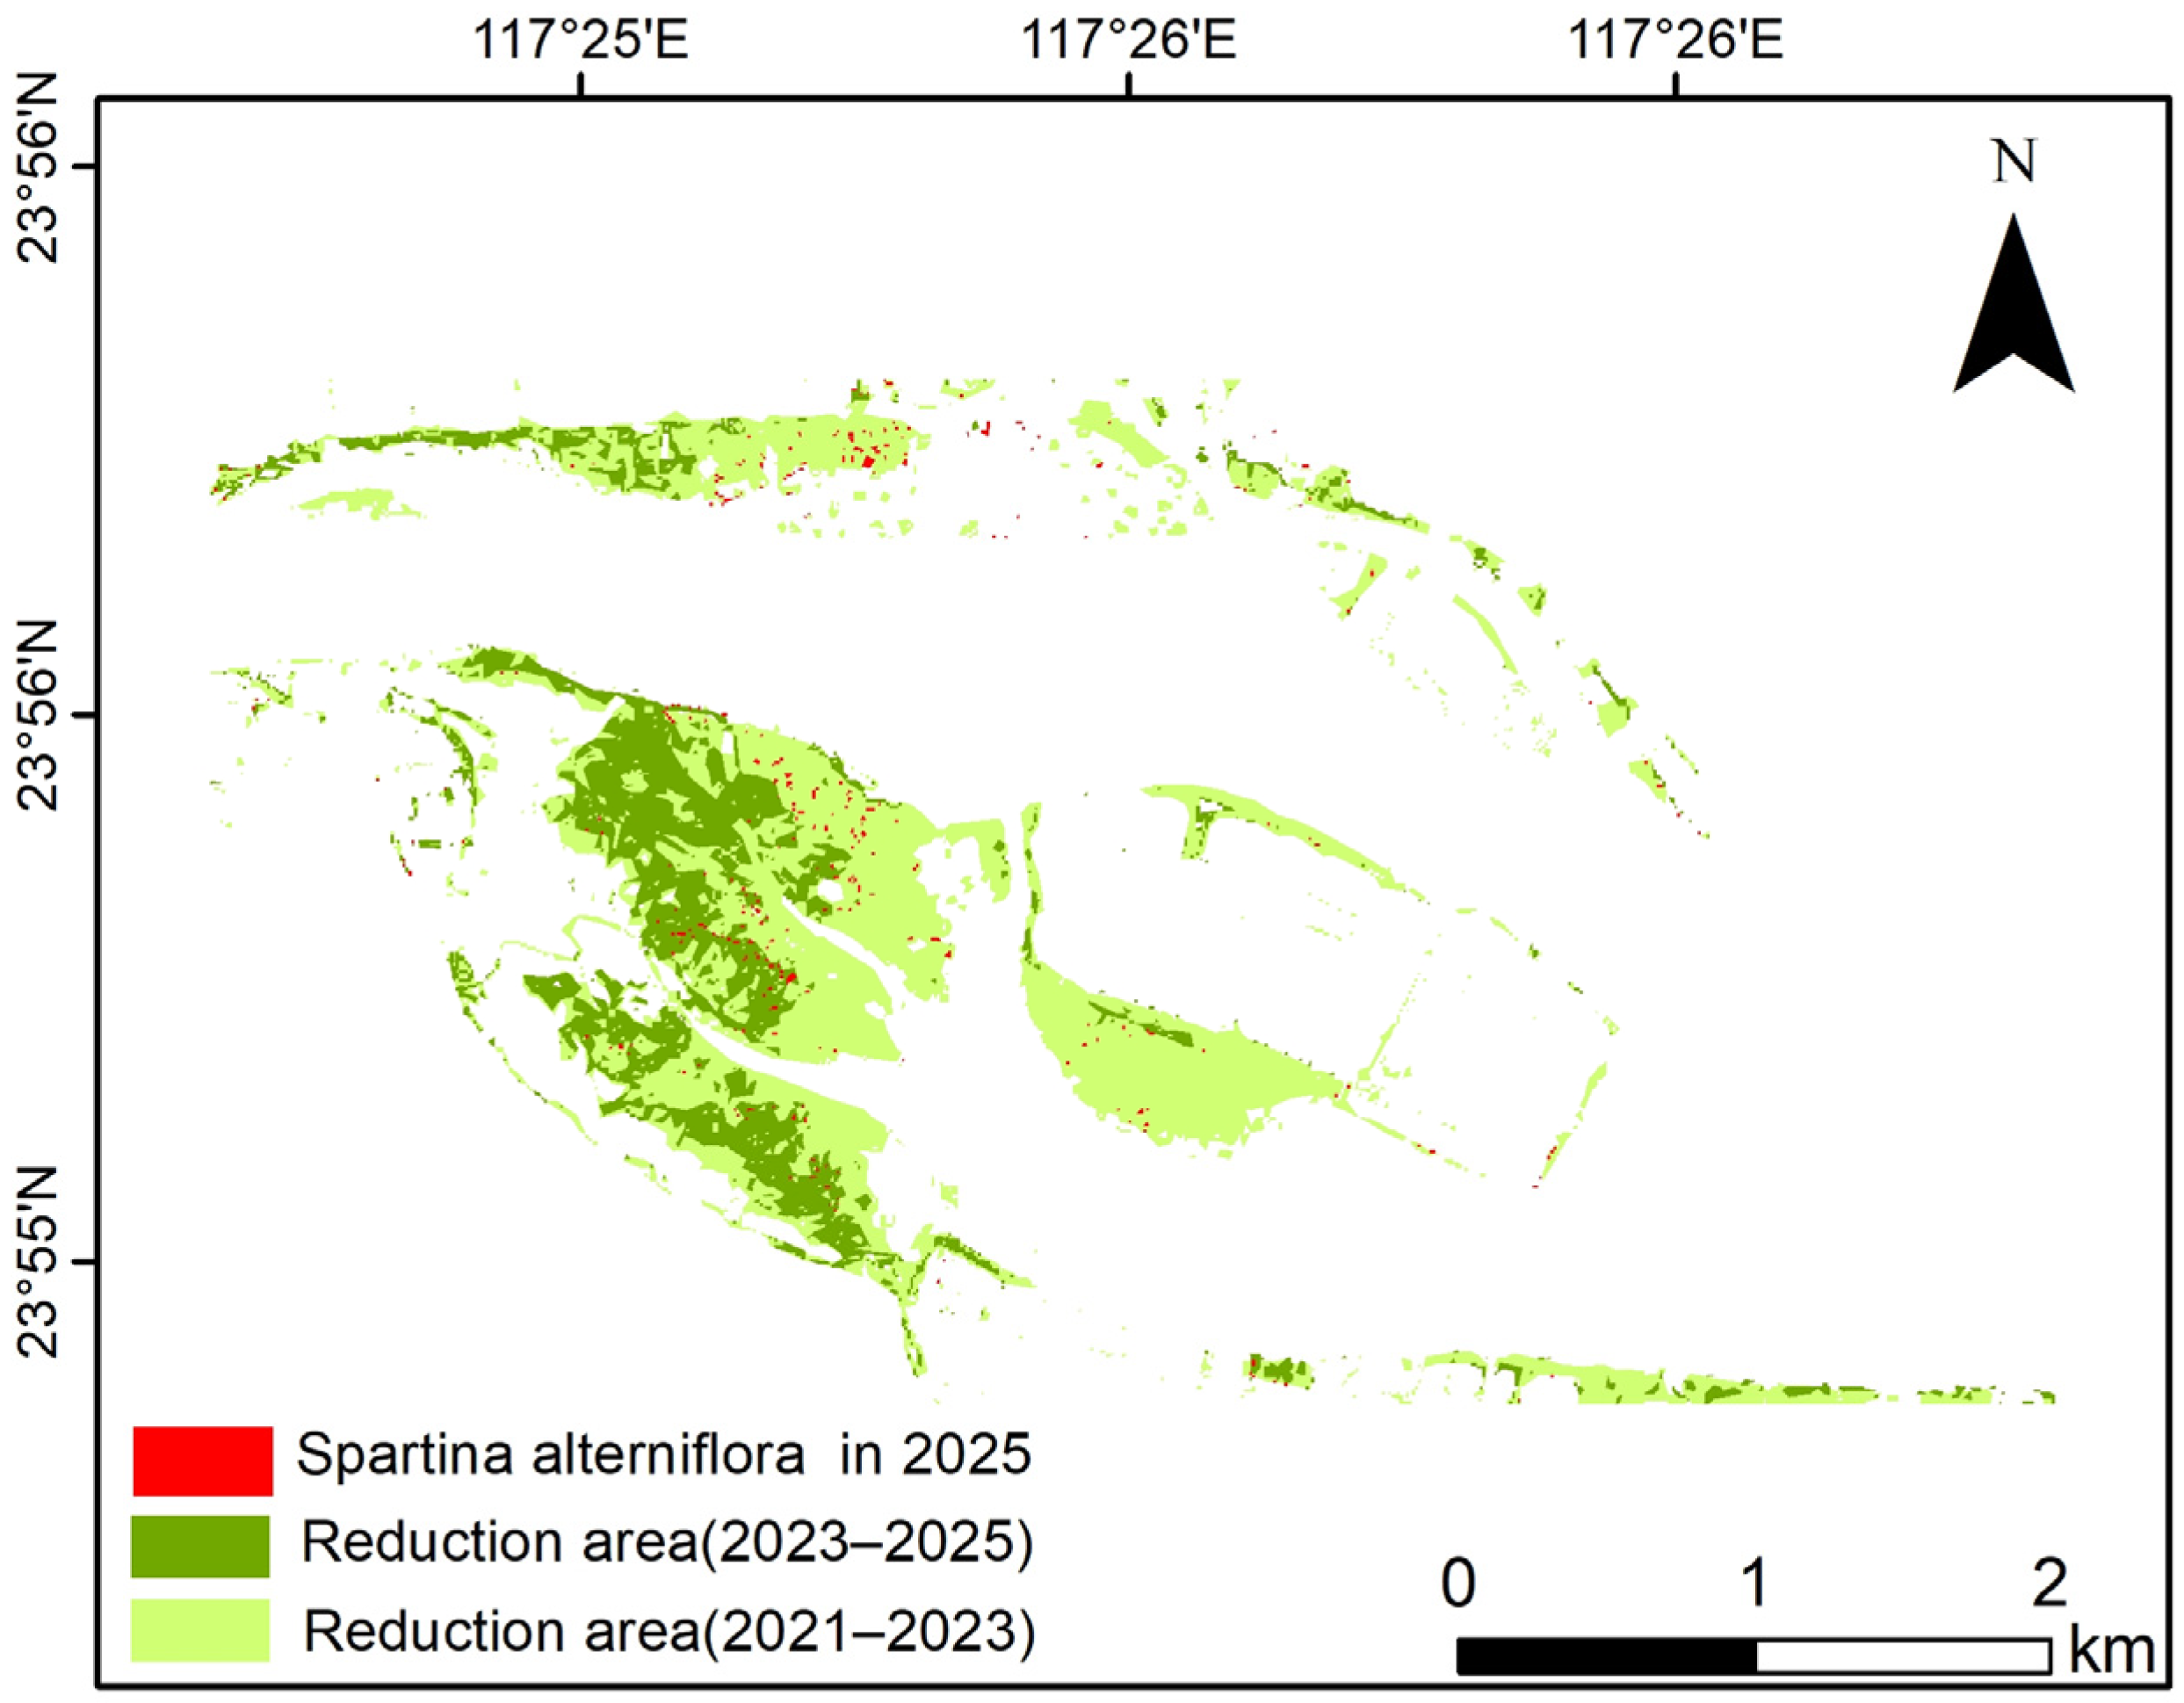
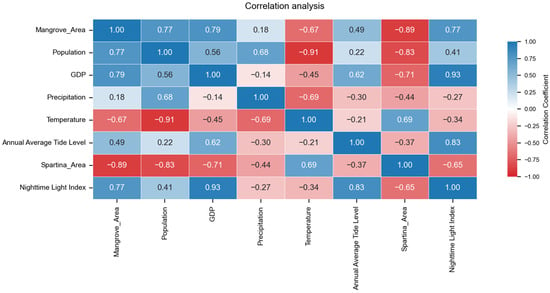
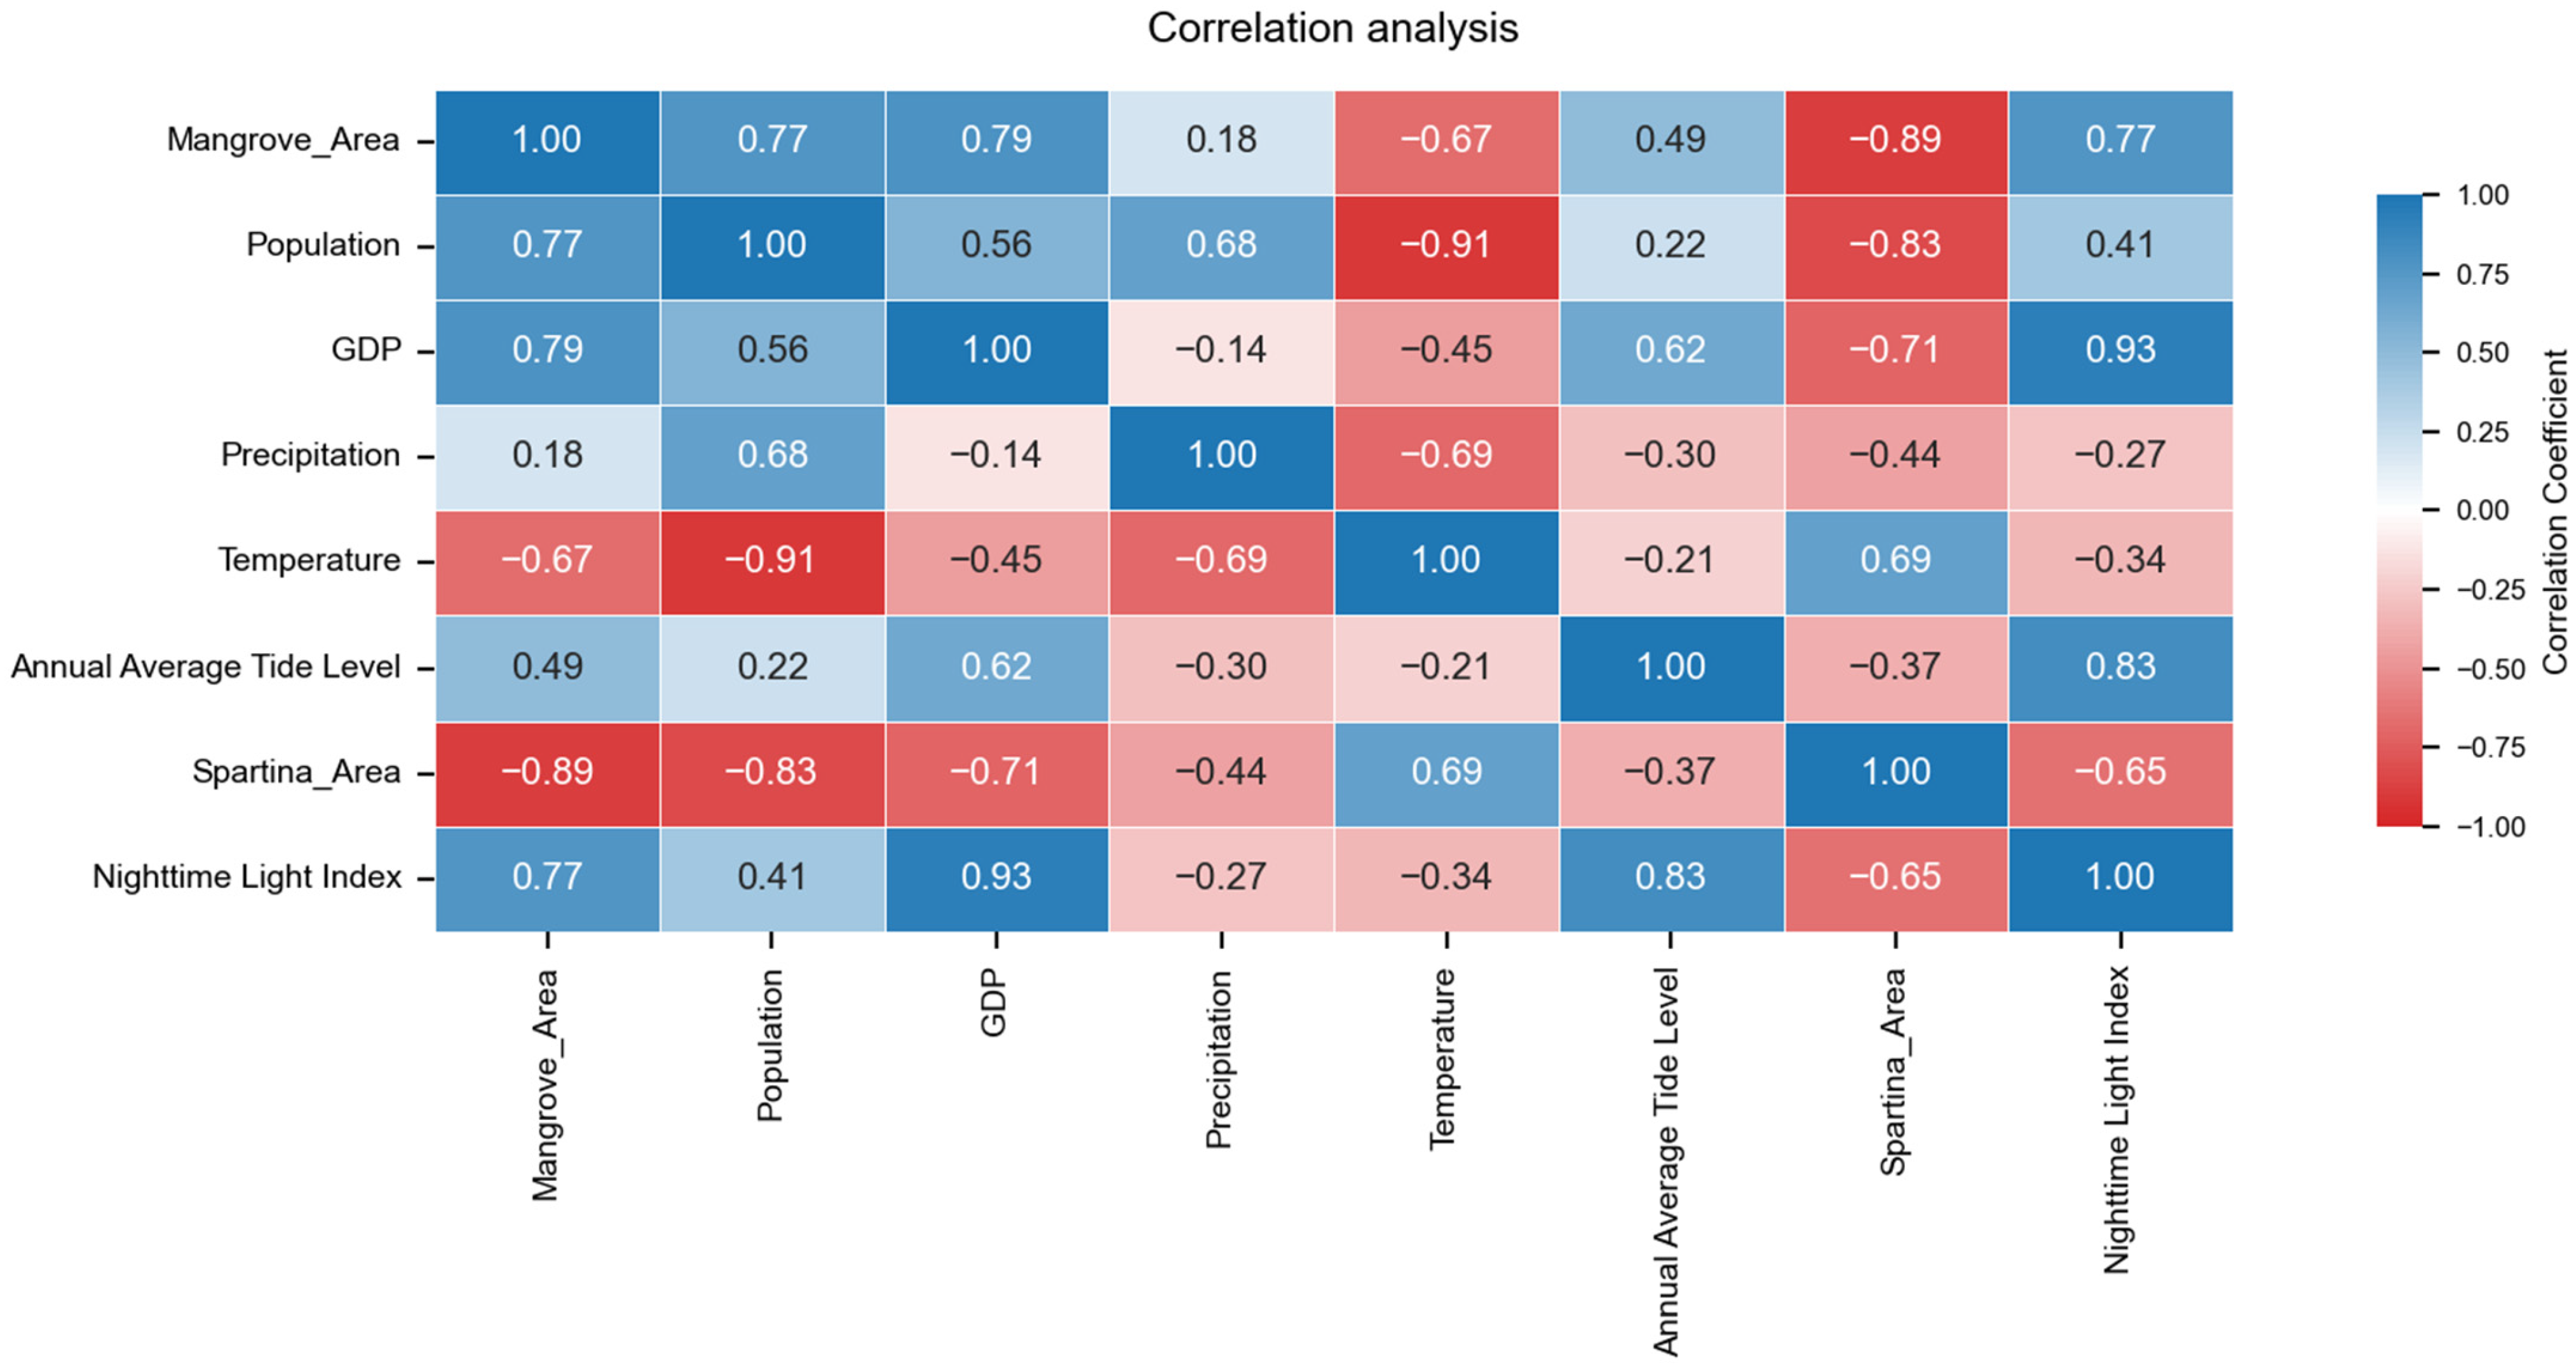

Disclaimer/Publisher’s Note: The statements, opinions and data contained in all publications are solely those of the individual author(s) and contributor(s) and not of MDPI and/or the editor(s). MDPI and/or the editor(s) disclaim responsibility for any injury to people or property resulting from any ideas, methods, instructions or products referred to in the content. |
© 2026 by the authors. Licensee MDPI, Basel, Switzerland. This article is an open access article distributed under the terms and conditions of the Creative Commons Attribution (CC BY) license.