


Highlights
What are the main findings?
- Combining multi-sensor satellite data spanning from the ultraviolet (UV) to thermal infrared (TIR) enables comprehensive characterization of volcanic plumes.
- Evaluating three major eruptions from the past decade—Raikoke (2019), Kīlauea (2025), and Hayli Gubbi (2025)—demonstrates the advanced capabilities of modern spaceborne Earth observation.
What are the implications of the main findings?
- This study establishes a global satellite-based framework to systematically monitor and characterize volcanic plumes using integrated multi-sensor observations.
- The study delivers high-resolution empirical data on SO2 and ash emissions, significantly reducing uncertainties in climate models predicting volcanic radiative forcing.
Abstract
Volcanic eruptions represent a significant natural forcing mechanism within the Earth’s climate system, capable of inducing profound atmospheric perturbations. Major explosive events inject vast quantities of volcanic ash and trace gases into the atmosphere, among which sulfur dioxide () has the biggest influence on climate variability. Once injected into the atmosphere, the oxidizes to form sulphate aerosols which can produce negative radiative forcing and cool the Earth’s surface. At the same time, fine ash particles block sunlight and create a “dust veil” that further changes atmospheric temperatures. These complex cooling and warming effects highlight the need for accurate characterization of volcanic emissions. In this context, satellite remote sensing provides continuous global observations, making it an essential tool for monitoring volcanic emissions and assessing their long-term climatic impacts. This review provides a comprehensive synthesis of multi-sensor satellite observations to trace emissions from major volcanic eruptions. To highlight the potential of modern satellite observations to characterize volcanic emissions, we exploit data spanning the entire electromagnetic spectrum, from the ultraviolet (UV) to thermal infrared (TIR). We examine three key eruptions from the past decade representing this new era of spaceborne monitoring: Raikoke (Russia, 2019), Kīlauea (USA, 2025), and Hayli Gubbi (Ethiopia, 2025). These case studies demonstrate how contemporary satellite instruments deliver reliable data worldwide, which is crucial for both the scientific community and society in assessing the climatic impacts of volcanism.
1. Introduction
Volcanic eruptions are a major natural forcing of climate change, strongly affecting the Earth’s atmosphere, climate and habitability [1,2,3,4]. Catastrophic eruptions, characterized by their large-scale explosiveness, eject vast quantities of volcanic material, including ash and gases such as sulfur dioxide (), carbon dioxide (), and water vapor (). These emissions play a critical role in atmospheric processes, contributing to both short- and long-term climate change [5,6,7,8]. Extended periods of elevated volcanism, such as those associated with large igneous provinces and prolonged tectonic activity, have been linked to long-term warming episodes, changes in ocean circulation, and shifts in global climate states [9,10,11]. Moreover, repeated volcanic aerosol forcing may interact with ocean processes and create climate responses that persist beyond the immediate atmospheric cooling phase, extending into decadal timescales [12,13]. Among volcanic emissions, plays a key role in atmospheric processes. Once injected into the atmosphere, the is oxidized to form sulphate aerosols (), which increase the atmosphere’s reflectivity (albedo), producing negative radiative forcing and cooling the Earth’s surface [14]. For example, the 1991 eruption of Mount Pinatubo caused a measurable decrease in global surface temperatures of approximately 0.4–0.6 °C during the following years [15]. Volcanic aerosols can also alter atmospheric circulation patterns, modify precipitation regimes, and influence ozone chemistry in the stratosphere [15,16]. Moreover, the injection of large amounts of volcanic materials, such as fine tephra, into the stratosphere or troposphere can trigger “dust veil” events [17]. These events have the potential to significantly alter the Earth’s climate at regional or global scales for periods typically ranging from several years to decades [18]. In the stratosphere, these aerosols can absorb infrared radiation, leading to localized warming [8,19,20]. The dual cooling and warming effects of volcanic aerosols highlights the need to better characterize these emissions to understand the complex interplay between volcanic forcing and climate dynamics. Understanding the climatic impacts of these eruptions is essential for assessing the climate response to external forcings and improving predictions of future volcanic effects on society, particularly in the context of the current anthropogenic warming trend.
Within this context, satellite remote sensing has emerged as an indispensable tool for volcanological observation [21,22,23,24,25,26,27]. Offering continuous global coverage and synoptic views, satellite observations play a crucial role in monitoring volcanic emissions and retrieving crucial data required to assess their long-term impacts on climate change. Early satellite missions demonstrated that spaceborne sensors could detect the distinct spectral signatures of volcanic plumes from space. The first satellite observations of volcanic gas emissions, particularly , were made during the 1982 eruption of El Chichón (Mexico) using the Total Ozone Mapping Spectrometer (TOMS) [28,29]. Subsequent advances in remote sensing have enabled the detection and analysis of emissions from major eruptions, such as those of Pinatubo (Philippines) and Cerro Hudson (Chile) in 1991 [30,31,32,33]. To comprehensively capture information about volcanic emissions, we should exploit data across the full electromagnetic spectrum, from ultraviolet (UV) to infrared (IR) and radar wavelengths. Spectral radiometers operating in the IR channels are particularly well suited for monitoring volcanic emissions, as they can operate effectively both during day and night. IR observations are used to detect thermal anomalies associated with volcanic activity, allowing the identification of ongoing eruptions [34,35,36]. Thermal infrared (TIR) channels are also valuable for discriminating between the different components of volcanic clouds (ash, , ice, etc.) [37,38]. Beyond compositional analysis, TIR measurements are useful for retrieving plume height, a critical parameter that determines whether volcanic aerosols remain in the troposphere or are injected into the stratosphere [39,40]. Complementing the infrared, the UV spectrum provides exceptional sensitivity for gas retrieval, particularly under low-ash conditions [41,42]. Modern UV satellite sensors have vastly improved our ability to map emissions with unprecedented spatial and temporal resolution [43,44,45]. Active remote sensing techniques also provide valuable complementary information for volcanic plume characterization. Ground-based and spaceborne radar systems are widely used to detect and track volcanic ash clouds, estimate plume height, and retrieve ash concentration and particle size distributions, particularly under conditions where passive optical observations are limited by cloud cover or illumination [46,47]. LiDAR observations, thanks to their high vertical resolution, enable detailed profiling of volcanic aerosol and ash layers, providing accurate measurements of plume altitude, layer thickness, and optical properties, which are essential for validating satellite retrievals and improving atmospheric transport models [48].
This paper presents a comprehensive review exploring the role of satellite remote sensing in investigating volcano–climate interactions, using multi-sensor observations to trace and characterize emissions from major volcanic eruptions. By integrating advanced UV capabilities with established TIR techniques and radar observations, it becomes possible to achieve a more comprehensive monitoring of the full spectrum of volcanic emissions, thereby improving our understanding of how volcanic activity influences the Earth’s climate system. To highlight the importance of satellite observations, we examined three eruptions from the past ten years, representing the new era of satellite-based monitoring. The three eruptions are the 2019 Raikoke eruption (Kuril Islands, Russia), the 2025 Kīlauea eruption (Hawaii, USA), and the 2025 Hayli Gubbi eruption (Ethiopia). This paper is intended to serve as a standalone reference and a structural guide for the scientific community, illustrating how space-based observations from multiple sources bridge the gap between raw satellite data and quantitative modeling of climate impacts.
2. Materials and Methods
2.1. Volcano–Climate Interactions
Volcanic eruptions represent one of the most dynamic and complex natural phenomena on Earth, capable of profoundly affecting both local populations and global environmental systems [49,50]. The main component of volcanic products transported into the atmosphere is magmatic material, which breaks down into fine particles called ash or tephra [51]. These particles fall out of the atmosphere very quickly, within a few minutes to a few weeks in the troposphere. Small amounts may remain in the troposphere for several months, but they have a very limited impact on the climate. Volcanic eruptions can also release huge amounts of different types of gases, with , , and being the most abundant, into the stratosphere, affecting the Earth’s radiative balance and climate and disrupting the stratospheric chemical balance [52,53]. Of these gases, both and are important greenhouse gases, but their atmospheric concentrations are so high that individual eruptions have a negligible effect on their concentrations. Rather, the most important climatic effect of explosive volcanic eruptions is due to their emission of sulfur species into the stratosphere, mainly in the form of [54,55]. These sulfur species react with and to form (sulfate aerosols) on a timescale of weeks, and the resulting sulfate aerosols produce the dominant radiative effect from volcanic eruption [56]. The volcanic cloud, rich in sulfate aerosols, has an e− of about one year [57] and can be rapidly transported around the globe.
The main radiative effects of the stratospheric aerosol cloud produced by large volcanic eruptions derive from its interaction with solar radiation. Sulfate particles effectively scatter light: some of it is backscattered into space, increasing the planetary albedo and reducing the solar energy reaching the surface, with a consequent cooling effect [55]. However, sulfate aerosols also absorb infrared radiation, which can cause warming of the stratosphere [20,58]. Both cooling and warming effects cause a series of further cascading impacts. Large volcanic eruptions are defined by Marshall et al. [8] as explosive eruptions that inject more than 5 Tg of into the stratosphere. Such eruptions can have substantial and long-lasting impacts on the climate system. According to Marshall et al. [8] and Robock et al. [55], these impacts include changes in atmospheric circulation, ozone depletion, reductions in global and regional precipitation, and weakened monsoon systems. Volcanic eruptions can also influence ocean heat content, the position of the intertropical convergence zone (ITCZ), and sea ice extent. Additional impacts include changes in major modes of climate variability, such as the North Atlantic Oscillation and El Niño Southern Oscillation (ENSO), alterations in the Atlantic Meridional Overturning Circulation, disruptions in the quasi-biennial oscillation, and changes in the carbon cycle.
It is also important to highlight that volcanic eruptions differ in size, duration, and style, resulting in differences in the severity of the climate response. Observations of surface temperature following historical eruptions clearly show that there is often no systematic correlation between the magnitude of the eruption, represented by the Volcanic Explosivity Index (VEI) [59], and the severity of the climatic response [54,60,61,62]. For example, despite being highly explosive, the 1980 eruption of Mount St. Helens, classified as VEI 5, released a relatively small amount of sulfur and had negligible effects on the global climate [63]. In addition, the complex dependencies of the chemical and microphysical processes affecting sulfate aerosol formation, growth, and removal underscore how two eruptions with essentially the same eruption parameters could affect climate very differently. The background atmospheric conditions, eruption season, latitude, injection height, and eruption style further complicate the picture [64,65,66]. The eruption season is particularly important for high-latitude eruptions because of varying insolation and its effects on oxidation chemistry.
Finally, the role of small explosive or long-lasting effusive eruptions in increasing stratospheric opacity and modulating climate is increasingly recognized [54,67,68,69,70,71]. Studies based on satellite observations and climate simulations indicate that the global effects on surface temperature of a single eruption generally become detectable for injections of at least ca. 5 Tg of into the stratosphere. However, analyses of the period 1979–2014 show that even smaller eruptions (ca. 0.1 Tg of ) can produce observable variations in stratospheric aerosols, while emissions greater than ca. 1 Tg are also detectable in tropospheric and stratospheric temperatures [72,73]. These eruptions contribute to climate cooling both through direct aerosol–radiation interactions and through indirect effects related to aerosol–cloud interactions.
Volcano Selection
During the last ten years, climate forcing due to volcanic activity has generally been characterized by sporadic and low-intensity eruptions. We have selected three case studies to demonstrate how modern satellite tools provide detailed and reliable information that is invaluable to the scientific community and society in assessing the climate impacts of volcanic eruptions: the Raikoke eruption in 2019, the Hayli Gubbi volcano in 2025, and finally the Kīlauea eruption in 2025. The selected volcanoes are reported in Figure 1.
Figure 1.
Overview of the selected volcanoes modified using Google Earth Pro http://www.earth.google.it (accessed on 4 June 2026).
Raikoke is a stratovolcano located in the Kuril Islands (Russia). After 95 years of inactivity, a Plinian eruption occurred on 21 June 2019, lasting approximately 24 h, which released one of the largest amounts of sulfur emissions into the stratosphere since the Nabro eruption in 2011 [74,75,76]. The eruptive column reached an altitude of approximately 9.5–12.5 km above the crater during the most intense phase of the eruption. The paroxysmal phase lasted about 15 h, after which eruptive activity continued until 23 June [77,78].
Hayli Gubbi is one of the shield volcano systems in the Afar Rift of north-eastern Ethiopia. After 12,000 years of inactivity, and with its latest southeastern basaltic flows dated to the last 8000 years [79], the volcano erupted on 23 November 2025, producing a significant gas-and-ash plume that rose 10–15 km [80].
Kīlauea shield volcano is located on the island of Hawaii. Recent eruptive activity at the summit began on 23 December 2024, characterized by sporadic lava fountains within the Halema’uma’u crater. At the time of writing, a total of 52 lava fountain events have occurred (https://www.usgs.gov/volcanoes/kilauea/volcano-updates; accessed on 23 July 2026). We analyze Episode 38, which occurred on 6 December 2025. During this specific event, both the North and South vents sustained simultaneous lava fountains. Preliminary data from USGS reports indicate that the volcano erupted approximately 12 of lava and generated an ash plume that reached an altitude of 6 km a.g.l. (https://www.usgs.gov/volcanoes/kilauea/science/eruption-information; accessed on 23 July 2026).
The location (latitude and longitude) of each of the selected volcanoes and the onset and conclusion of the specific eruptions considered are reported in Table 1.
Table 1.
Selected volcanic eruptions and their activity periods. Times are derived from the sources cited in the respective volcano descriptions (Section 2.1).
Satellite observations are valuable tools for monitoring volcanic emissions, providing crucial data for understanding volcanic activity and assessing its potential impacts. They enable rapid responses to major volcanic eruptions, offer global coverage (including remote regions that are inaccessible to ground-based instruments) and provide continuous records that support the study of past eruptions and long-term volcanic trends [55,68,81]. Satellites can be broadly divided into two categories: polar-orbiting and geostationary satellites [82]. Polar-orbiting satellites pass over both the North and South Poles and provide high spatial resolution, enabling the retrieval of detailed quantitative information such as and ash mass. In contrast, geostationary satellites remain fixed above the same equatorial region and continuously observe it. Their high temporal resolution makes them particularly suitable for monitoring rapidly evolving phenomena, such as the dispersion of volcanic clouds. In general, the term volcanic cloud refers to any gaseous or particulate emissions released by volcanoes that reach the atmosphere.
Volcanic clouds are monitored using satellite-based remote sensing techniques that span a wide range of the electromagnetic spectrum, from microwave to ultraviolet (UV) radiation, including visible (VIS) and infrared (IR) wavelengths, as well as radar and LiDAR observations. These techniques can be broadly classified into passive and active sensing systems. Passive sensors detect the natural radiation emitted, reflected, or scattered by the Earth’s surface and atmosphere, whereas active sensors emit their own signal and measure its interaction with the target, enabling observations independent of solar illumination and providing detailed information on the vertical structure of volcanic plumes [82]. The following sections discuss the contributions of passive UV and IR observations, together with active sensing techniques such as radar and LiDAR, to the monitoring of volcanic emissions.
2.2. Earth Observations
2.2.1. Passive Ultraviolet Remote Sensing
The foundations of satellite ultraviolet atmospheric remote sensing were established well before the advent of dedicated volcanic gas monitoring instruments. Among the various spectral regions available for atmospheric remote sensing, the UV domain is particularly well suited for detection because the molecule exhibits strong absorption features in the Hartley absorption band between approximately 300 and 330 nm [83]. Within this spectral interval, the absorption cross-section of is significantly larger than in the visible or infrared regions, allowing even relatively low atmospheric concentrations to be detected with high sensitivity. UV measurements typically provide higher sensitivity for the detection and quantification of volcanic , particularly for optically thin plumes and passive volcanic degassing.
Table 2 shows the different UV missions’ evolution. The first spaceborne UV spectrometers were primarily designed for stratospheric ozone observations, beginning with the Backscatter Ultraviolet (BUV) instrument aboard Nimbus-4 in 1970, followed by the Solar Backscatter Ultraviolet (SBUV) series flown on Nimbus-7 and subsequent NOAA satellites. These instruments demonstrated the capability of nadir-viewing UV measurements to retrieve atmospheric trace gases on a global scale and provided some of the longest continuous records of atmospheric ozone. Although their spatial resolution (approximately 170 × 170 km2 for BUV and about 170 × 170 km2 for SBUV nadir observations) was insufficient for detailed volcanic plume studies, they established the measurement principles, calibration methodologies, and retrieval techniques that later enabled the detection of volcanic sulfur dioxide from space [84,85].
Table 2.
Evolution of satellite UV–Vis missions for volcanic gas monitoring, including operational periods, orbit types, and main detected volcanic gas species.
A major advance occurred with the launch of the Total Ozone Mapping Spectrometer (TOMS) aboard Nimbus-7 in 1978 and later on Meteor-3 and Earth Probe satellites. TOMS was the first instrument to routinely detect large volcanic clouds globally, providing unprecedented observations of major eruptions such as El Chichón (1982) and Mount Pinatubo (1991) [29,31,86]. These observations significantly improved the understanding of volcanic impacts on atmospheric chemistry, aerosol formation, and climate forcing, demonstrating the scientific value of UV satellite measurements for volcanic applications and paving the way for the next generation of hyperspectral UV–Vis sensors. TOMS provided a nominal nadir spatial resolution of approximately 50 × 50 km2, enabling the first routine global observations of large volcanic SO2 clouds, although its resolution remained insufficient for resolving small-scale volcanic plumes. The Global Ozone Monitoring Experiment (GOME), launched aboard ERS-2 in 1995, represented a major breakthrough by demonstrating that UV–Vis spectrometers could detect and quantify volcanic emissions on a global scale, enabling the first long-term inventories of volcanic degassing and improving estimates of the atmospheric sulfur burden [87]. However, its relatively coarse spatial resolution (approximately 40 × 320 km2 in nominal mode) and limited temporal coverage restricted its capability to resolve small-scale plumes or short-lived eruptive events, particularly for persistently degassing volcanoes. An important intermediate step was represented by the Scanning Imaging Absorption Spectrometer for Atmospheric Chartography (SCIAMACHY), launched aboard ENVISAT in 2002 [88]. SCIAMACHY extended the spectral coverage from the ultraviolet to the near-infrared and provided improved capabilities for the retrieval of atmospheric trace gasses and the spatial resolution approximately 30 × 60 km2 (depending on the acquisition mode). Its measurements contributed significantly to the study of volcanic emissions, plume transport, and volcanic impacts on atmospheric composition. Although its temporal coverage remained limited by the orbital revisit cycle and its spatial resolution was still relatively coarse compared with modern sensors, SCIAMACHY demonstrated the benefits of broader spectral coverage and advanced retrieval methodologies, further bridging the technological gap between GOME and later instruments such as OMI (Ozone Monitoring Instrument) and TROPOMI [73,89]. The launch of OMI aboard NASA’s Aura satellite in 2004 partially addressed these limitations through improved spatial resolution of approximately 13 × 24 km2 (reduced to about 13 × 12 km2 after 2007) and daily global coverage, allowing more accurate tracking of plume dispersion, better quantification of eruptive emissions, and more detailed analyses of volcanic aerosol transport and chemistry [73]. Nevertheless, OMI observations were progressively affected by the so-called “row anomaly”, which introduced data gaps and reduced spatial coverage after 2007, complicating the continuity of long-term volcanic monitoring. OMPS (Ozone Mapping and Profiler Suite), operational since 2011, helped restore observational continuity and improved the operational capability for near-real-time volcanic hazard assessment [90]. Yet, despite its robustness and stability, OMPS retained relatively coarse pixel sizes of approximately 50 × 50 km2 and lower sensitivity to weak or localized emissions, limiting its effectiveness for detecting passive degassing and subtle variations in volcanic activity.
The launch of the Tropospheric Monitoring Instrument (TROPOMI) aboard Sentinel-5 Precursor (Sentinel-5P) in 2017 marked a substantial step forward in atmospheric volcanic gas monitoring. TROPOMI initially provided a nadir spatial resolution of approximately km2, improved to km2 from August 2019 onward, together with high radiometric sensitivity and daily near-global coverage [91]. Compared with its predecessors, TROPOMI significantly reduced the observational gap between large-scale satellite monitoring and the fine spatial variability of volcanic plumes. Its enhanced resolution allows the detection of weaker and more localized emissions that were frequently unresolved by previous instruments, including emissions from persistently degassing volcanoes and moderate eruptive events. This capability has substantially improved the quantification of volcanic fluxes, the characterization of plume morphology and temporal evolution, and the identification of rapid changes in volcanic activity [42,92]. Moreover, the higher-quality datasets produced by TROPOMI have strengthened the integration of satellite observations with atmospheric transport and climate models, enabling more reliable assessments of volcanic impacts on aerosol formation, radiative forcing, and atmospheric chemistry. Despite these advances, challenges remain, including difficulties in accurately retrieving concentrations under cloudy conditions or in ash-rich plumes, as well as uncertainties linked to plume altitude assumptions and radiative transfer effects. Nonetheless, TROPOMI currently represents the most advanced operational UV–VIS satellite sensor for volcanic gas monitoring and has become a benchmark for next-generation atmospheric composition missions.
Future atmospheric composition missions are expected to address several of the remaining limitations of TROPOMI, particularly those related to retrieval uncertainties under complex atmospheric conditions and the need for long-term continuity in high-resolution volcanic gas observations. In this context, the upcoming Sentinel-5 mission, carrying the Ultraviolet–Visible Near-Infrared Short-Wave Infrared Spectrometer (UVNS) aboard the MetOp Second Generation satellites, represents the next step in the evolution of polar-orbiting UV–VIS atmospheric sensors [93]. Building upon the heritage of GOME, OMI, OMPS, and TROPOMI, Sentinel-5 UVNS is expected to provide a nadir spatial resolution of approximately 7.5 × 7.5 km2, together with improved spectral and radiometric performance. While TROPOMI significantly improved the detection of weak and localized volcanic emissions through its unprecedented spatial resolution, uncertainties remain under conditions of high cloud coverage, optically thick ash plumes, and poorly constrained plume heights, all of which can affect retrieval accuracy. Sentinel-5 UVNS aims to further improve the consistency and quality of atmospheric composition measurements while ensuring the continuity of long-term datasets that are essential for volcanic degassing inventories, atmospheric chemistry studies, and climate analyses.
Beyond Sentinel-5, a new generation of geostationary atmospheric composition missions is transforming the observation of trace gases through unprecedented temporal sampling. The Geostationary Environment Monitoring Spectrometer (GEMS) provides a nominal spatial resolution of approximately 7 × 8 km2 over East Asia, launched by South Korea in 2020, the Tropospheric Emissions: Monitoring of Pollution (TEMPO) mission launched by NASA in 2023, provides a spatial resolution of approximately 2.1 × 4.5 km2 over North America at nadir, and the upcoming Sentinel-4 instrument aboard Meteosat Third Generation (MTG) satellites will provide a spatial resolution of approximately 8 × 8 km2 over Europe [93,94,95]. Although primarily designed for air-quality applications, their UV–VIS spectrometers are capable of observing volcanic emissions with revisit times far superior to those achievable from polar-orbiting platforms [73,94]. This capability offers new opportunities for monitoring rapidly evolving eruptions, characterizing short-term variations in volcanic degassing, and improving the assimilation of volcanic emissions into atmospheric transport models.
Looking further ahead, future atmospheric composition missions are expected to combine the high spatial resolution achieved by TROPOMI with the high temporal sampling of geostationary platforms. Advances in detector technology, radiometric calibration, and retrieval algorithms may enable the routine detection of weaker volcanic emissions, more accurate plume-height retrievals, and improved discrimination between volcanic gases, aerosols, and meteorological clouds. Such developments will enhance the capability to quantify volcanic emissions in near-real-time and improve assessments of their impacts on atmospheric chemistry, aviation safety, and climate.
2.2.2. Passive Infrared Remote Sensing
Infrared (IR) observations provide valuable information for monitoring volcanic activity, as they detect both thermal anomalies associated with heat transfer from the Earth’s interior to the surface and the radiative properties of volcanic emissions [96]. These measurements enable the identification of high-temperature features such as lava flows and active lava lakes, as well as the detection and characterization of volcanic ash clouds and gas emissions. IR observations are widely used for the detection of thermal anomalies and the mapping of lava flows [35,36,97,98]. However, this work focuses on the application of IR remote sensing for the detection and characterization of volcanic emissions.
In the IR spectrum, the principal wavelength regions employed for the detection of volcanic gases and ash particles are approximately 3–4 μm and 7–14 μm [99]. Among these, the 8–12 μm range is particularly valuable, as volcanic ash exhibits characteristic dispersive behavior within this window, while presents a strong absorption feature centered near 8.6 μm [37]. The mid-infrared (3–4 μm) region also provides important insights into volcanic activity, primarily through the thermal signatures associated with molten material and elevated surface temperatures. Although SO2 exhibits a weaker absorption band near 4 μm, its detection is generally limited to intense, near-surface emissions. Furthermore, observations in the 3–4 μm range are complicated by the combined contributions of thermal emission and reflected solar radiation, requiring the separation of these components to accurately retrieve volcanic signals.
The first applications of IR satellite measurements for volcanic cloud monitoring were developed using meteorological satellites. The Geostationary Meteorological Satellite (GMS-1) was among the first systems used to track volcanic eruptions and ash cloud dispersion in the western Pacific region [100]. Similarly, Malingreau and Kaswanda [101] used Advanced Very-High-Resolution Radiometer (AVHRR) observations to investigate the 28 July 1983 eruption of Colo volcano, Indonesia, demonstrating the potential of satellite imagery for monitoring ash clouds and assessing their impact on aviation operations. The theoretical basis for the discrimination of volcanic ash clouds from meteorological clouds using IR observations was introduced by Prata [102,103] and further developed by Wen and Rose [104]. The proposed approach relies on the brightness temperature difference (BTD) between two infrared channels within the 8–12 μm atmospheric window. Volcanic ash particles, mainly composed of silicates, exhibit different absorption, scattering, and emission properties compared with water and ice clouds, allowing ash plumes to be distinguished from meteorological clouds. However, the presence of mixed ash–ice clouds or ice-coated ash particles can reduce the effectiveness of this technique [105]. Despite these limitations, the reverse absorption technique remains one of the most widely applied methods for operational volcanic ash detection. With the development of new satellite platforms, improvements in spatial, temporal, and spectral resolution have progressively enhanced the detection and characterization of volcanic ash clouds. Instruments such as the AVHRR and Moderate-Resolution Imaging Spectroradiometer (MODIS) provided improved capabilities for monitoring ash dispersion and retrieving ash properties on regional and global scales [106,107,108].
Beyond ash monitoring, infrared observations have also become an important tool for the detection of volcanic emissions. exhibits strong absorption features in the infrared spectrum, particularly around 7–9 μm, which can be exploited for gas retrieval, especially during large explosive eruptions when volcanic plumes reach high altitudes and contain significant gas concentrations [109,110]. The transition from multispectral sensors to hyperspectral infrared instruments, such as the Atmospheric Infrared Sounder (AIRS), Infrared Atmospheric Sounding Interferometer (IASI), and Cross-track Infrared Sounder (CrIS), has significantly improved detection capabilities due to their high spectral resolution. These sensors enable the characterization of volcanic gas emissions at a global scale and provide valuable information on plume transport and atmospheric impacts [73,111].
Different geostationary satellites are equipped with radiometers operating in the IR region, providing continuous and high-temporal-resolution observations of volcanic emissions. Their fixed position relative to the Earth’s surface, at an altitude of approximately 35,786 km, enables frequent monitoring of volcanic plumes and their evolution over time. This orbital configuration enables rapid detection of volcanic ash and SO2 with repeat imaging every 5–10 min. For example, the Advanced Baseline Imager (ABI) onboard GOES-16 and GOES-18 provides 16 spectral bands ranging from 0.47 μm to 13.3 μm at spatial resolutions of 0.5–2 km. Volcanic ash detection is primarily achieved using the split-window brightness temperature difference between the 11.2 μm and 12.3 μm thermal infrared channels, while SO2 retrievals exploit absorption features near 8.4–8.7 μm. In Europe, the Meteosat Second Generation (MSG) and Meteosat Third Generation (MTG) satellites are equipped respectively with the Spinning Enhanced Visible and Infrared Imager (SEVIRI) and Flexible Combined Imager (FCI). SEVIRI offers 12 spectral bands and a temporal resolution of 15 min, while FCI 16 spectral channels with improved radiometric sensitivity and 10-min full-disk repeat cycles. Over the Asia–Pacific region, Himawari-8 and Himawari-9 carry the Advanced Himawari Imager (AHI), also featuring 16 bands and 10-min full-disk coverage at 0.5–2 km resolution. Collectively, these systems provide near-global longitudinal coverage (excluding high polar latitudes) through coordinated orbital placement at different longitudes, enabling rapid eruption detection, quantitative ash cloud height estimation, mass loading retrievals, continuous plume tracking, aviation hazard mitigation, and near-real-time input to atmospheric transport and dispersion models. The main characteristics of the geostationary satellite sensors used to monitor volcanic clouds are summarized in Table 3.
Table 3.
Comparison of geostationary sensors used for volcanic emission monitoring.
2.2.3. Active Remote Sensing: Radar and LiDAR
Radar and LiDAR are active remote sensing techniques which are becoming increasingly important in the study of volcano–climate interactions since they provide critical information on the vertical structure, transport, and radiative properties of volcanic plumes and aerosol layers [46,48,112]. Radar emits microwave pulses and measure the backscattered signal from atmospheric targets, such as ash particles and aerosols, allowing the retrieval of plume structure, particle concentration, and transport dynamics. LiDAR (Light Detection and Ranging) instruments, in contrast, emit laser pulses at optical wavelengths and measure the backscattered radiation from particles and gases, providing high-resolution observations of aerosol layers, plume height, and vertical distribution. Unlike ultraviolet and infrared spectrometers, which retrieve the chemical composition of volcanic emissions such as and BrO, radar and LiDAR observations primarily constrain the physical structure and atmospheric evolution of volcanic clouds. Early active remote sensing observations demonstrated the potential of microwave and LiDAR measurements to operate independently of daylight conditions and with limited sensitivity to meteorological cloud cover, overcoming important limitations of passive optical sensors during explosive eruptions and adverse atmospheric conditions [107].
Spaceborne cloud-profiling radars operate at microwave frequencies (typically Ka- or W-band) and are primarily sensitive to larger atmospheric particles such as hydrometeors and dense volcanic ash. Although their sensitivity to fine sulfate aerosols is limited, radar observations provide valuable information on the vertical extent, internal structure, and microphysical evolution of volcanic ash clouds, as well as on ash–cloud interactions and precipitation processes. Early spaceborne radar missions, including the Cloud Profiling Radar (CPR) aboard CloudSat, launched in 2006, demonstrated the capability of active microwave observations to characterize the vertical structure of clouds and dense ash plumes, complementing passive satellite measurements and improving the understanding of volcanic cloud evolution [113].
One of the major advances in this field was represented by the Cloud–Aerosol LiDAR with Orthogonal Polarization (CALIOP) aboard the CALIPSO satellite, launched in 2006, which enabled unprecedented global observations of volcanic aerosol layers and stratospheric plume injections [114]. CALIOP observations have been extensively used to investigate the vertical distribution, transport pathways, and residence time of volcanic aerosols, substantially improving the understanding of how eruptions perturb atmospheric composition and Earth’s radiation balance [70]. In particular, the capability to resolve plume altitude and aerosol stratification is essential for quantifying volcanic radiative forcing, since the climatic impact of volcanic emissions strongly depends on whether aerosols are injected into the troposphere or the stratosphere. Active remote sensing observations are also increasingly integrated with UV–VIS volcanic gas retrievals because plume height information provides important constraints for retrieval algorithms and atmospheric transport models [73].
Recent atmospheric profiling missions are further extending these capabilities. The Earth Cloud, Aerosol and Radiation Explorer (EarthCARE), developed jointly by ESA and JAXA, is the first satellite mission specifically designed to combine a 94-GHz Cloud Profiling Radar (CPR) with a high-spectral-resolution LiDAR (ATLID), enabling simultaneous observations of clouds, aerosols, and their radiative interactions [115]. The complementary sensitivities of the two active sensors allow dense volcanic ash clouds to be characterized by the radar, while the LiDAR provides detailed information on optically thin aerosol layers, including volcanic sulfate plumes. This synergistic approach is expected to significantly improve the characterization of volcanic aerosol transport, aerosol–cloud interactions, and volcanic radiative forcing, thereby reducing uncertainties in atmospheric chemistry and climate models.
3. Results
Three case studies are presented to highlight the role of modern satellite observations in monitoring explosive volcanic eruptions and assessing volcanic impacts: Raikoke (2019), Hayli Gubbi (2025), and Kīlauea (2025). For each selected volcano, we aim to determine which kind of information can be extracted from satellite observations, depending on data availability, specific monitoring goals, and how technological advancements and new spaceborne instruments can provide more detailed insights. The following sections present the satellite sensors used in this review, along with the related products employed for the analysis and characterization of the selected case studies.
3.1. Satellite Products
In the following sections, the satellites products used to analyze the three case studies are described in details.
3.1.1. Ash RGB and RGB from IR Observations
The Ash RGB and RGB products are multispectral IR satellite products designed to detect and characterize volcanic emissions. Both products exploit the different absorption and emission properties of volcanic ash, and atmospheric constituents in the thermal infrared (TIR) spectral range. They are commonly generated from geostationary satellite observations (e.g., MTG-FCI, GOES-ABI, Himawari-AHI) using combinations of brightness temperature (BT) differences between channels.
The Ash RGB product is primarily designed for the detection and monitoring of volcanic ash clouds and for their discrimination from meteorological clouds. It exploits the different spectral emissivity properties of volcanic ash in the split-window infrared channels located around 10–12 μm. The main physical principle is based on the spectral difference between the 11 and 12 μm channels, where volcanic ash exhibits lower emissivity compared with water and ice clouds. A typical Ash RGB configuration is composed of three components. The red component is defined as the brightness temperature difference between the channels around 12 and 11 μm, which enhances the spectral signature of volcanic ash. The green component corresponds to the difference between the channels around 11 and 8.5 μm and provides sensitivity to volcanic emissions. The blue component consists of the brightness temperature measured in the channel around 11 μm and provides thermal contrast while reducing the influence of cold, high-level clouds. The BT channel combinations used for the Ash RGB product for three geostationary satellite sensors, namely MTG-FCI, GOES-ABI, and Himawari-AHI, are summarized in Table 4.
Table 4.
Band combinations used to generate Ash RGB composites for geostationary sensors (Himawari-AHI, MTG-FCI and GOES-ABI).
Figure 2 presents examples of Ash RGB imagery from Himawari-AHI, MTG-FCI, and GOES-18 ABI. In Ash RGB imagery, ash-rich regions generally appear red, whereas regions dominated by emissions are typically displayed in green. Areas where volcanic ash and are simultaneously present within the plume may appear yellow, indicating a mixed ash–gas signature.
Figure 2.
Examples of Ash RGB imagery captured by geostationary sensors showing volcanic plumes from (a) Raikoke observed by Himawari-8 AHI (22 June 2019, 02:10 UTC), (b) Hayli Gubbi observed by MTG-FCI (23 November 2025, 10:30 UTC), and (c) Kīlauea observed by GOES-18 ABI (6 December 2025, 22:30 UTC). Red pixels indicate the presence of ash, green pixels indicate , and yellow pixels indicate the presence of both components.
The RGB product can be used as a complementary tool for volcanic plume characterization. This product is a modified version of the Ash RGB, specifically designed to enhance the detection of sulfur dioxide emissions. In the RGB configuration, the red component differs from the Ash RGB by using the brightness temperature difference between the channels at 6.95 μm and 7.34 μm. This spectral combination exploits the stronger absorption features of in the water vapor infrared region. The green component is based on spectral channels similar to those used in the Ash RGB, but with adjusted wavelength ranges to capture the weaker absorption signal around 8.5 μm. The blue component remains unchanged and provides thermal information from the infrared window channel. However, generating the RGB product is not possible for MTG-FCI, as it lacks the channel centered at 6.95 μm. The BT channel combinations used for the RGB product for GOES-ABI and Himawari-AHI are summarized in Table 5.
Table 5.
Band combinations used to generate RGB products for geostationary sensors (Himawari-AHI and GOES-ABI).
Figure 3 presents examples of RGB imagery from Himawari-AHI and GOES-18 ABI. In RGB imagery, sulfur dioxide emissions generally appear orange when located above cold cloud tops, whereas they appear white over warm ocean surfaces due to the different thermal background conditions. Conversely, in the Ash RGB product, signatures typically appear green over ocean surfaces, while they are not distinguishable in single-channel infrared imagery at 10.35 μm. Although the RGB product is still under investigation and requires further validation, it represents a valuable complementary product, particularly in situations where meteorological clouds overlap volcanic plumes and reduce the effectiveness of Ash RGB detection.
Figure 3.
Examples of RGB imagery captured by geostationary sensors showing volcanic plumes from (a) Raikoke observed by Himawari-8 AHI (22 June 2019, 02:10 UTC) and (b) Kīlauea observed by GOES-18 ABI (6 December 2025, 22:30 UTC).
3.1.2. Vertical Column Density Product from TROPOMI UV Observations
Modern UV retrieval algorithms exploit the Differential Optical Absorption Spectroscopy (DOAS) technique, which isolates the narrow-band absorption structures of atmospheric trace gases from broadband scattering processes [83]. The measured top-of-atmosphere radiances are compared with reference solar spectra to retrieve the volcanic slant column density, which is subsequently converted into a vertical column density (VCD) through the application of an air mass factor (AMF). Since the AMF strongly depends on the plume altitude, surface albedo, cloud fraction, and viewing geometry, assumptions regarding the vertical distribution of volcanic emissions remain one of the main sources of uncertainty in satellite retrievals.
The operational TROPOMI Level-2 SO2 product provides volcanic SO2 VCDs assuming three standard plume heights, namely 1 km, 7 km, and 15 km, which are representative of emissions occurring within the planetary boundary layer, the free troposphere, and the lower stratosphere, respectively. In this review, volcanic observations are derived from the operational Level-2 Sentinel-5P TROPOMI VCD product at 7 km, which represents the standard retrieval for volcanic emissions in the free troposphere and lower stratosphere. This product provides daily global coverage with a spatial resolution of approximately km2, enabling detailed monitoring of plume morphology, transport, and temporal evolution. Whenever available, complementary information on plume altitude from active sensors, such as CALIOP and EarthCARE/ATLID, is used to support the interpretation of the retrieved distributions and to better constrain the vertical location of the volcanic cloud. Figure 4 shows the TROPOMI acquisition for the three case studies.
Figure 4.
TROPOMI SO2 VCD at 7 km for the Raikoke, Hayli Gubbi, and Kīlauea eruptions, illustrating the diversity in volcanic plume extent and morphology.
3.1.3. LiDAR Observations at 355 and 532 nm
The injection height of a volcanic plume is one of the key parameters controlling its atmospheric transport, residence time, and climatic impact. In particular, whether volcanic emissions remain confined within the troposphere or are injected into the lower stratosphere strongly influences the lifetime of both volcanic gases and aerosols, their transport pathways, and their contribution to radiative forcing. Moreover, accurate knowledge of plume altitude is essential for improving the retrieval of volcanic from ultraviolet satellite observations, since the conversion from slant column density to vertical column density depends on the assumed plume height through the AMF [116].
Active LiDAR observations provide the most direct spaceborne measurements of the vertical structure of volcanic plumes. Unlike passive UV or infrared sensors, which retrieve column-integrated quantities, LiDAR instruments directly measure the vertical distribution of atmospheric particles by recording the backscattered laser signal. This capability enables the identification of aerosol layers, the estimation of plume base and top heights, and the characterization of aerosol stratification with high vertical resolution. For nearly two decades, CALIOP aboard the CALIPSO satellite represented the primary source of global spaceborne LiDAR observations for volcanic plume studies.
CALIOP measurements have been extensively used to investigate plume injection heights, long-range transport, and the vertical evolution of volcanic aerosol layers following major eruptions. In this review, we exploit the CALIOP 532 nm Total Attenuated Backscatter profiles to characterize the vertical distribution of volcanic aerosol layers, together with the corresponding Vertical Feature Mask (VFM) product, which provides the classification of atmospheric targets and allows volcanic aerosol layers to be distinguished from clouds and other atmospheric features. Since the decommissioning of the CALIPSO mission in August 2023, the availability of spaceborne LiDAR observations for volcanic plume monitoring has been significantly reduced. This limitation has recently been overcome by the launch of the ESA EarthCARE (Earth Cloud, Aerosol and Radiation Explorer) mission in May 2024. EarthCARE carries the Atmospheric LiDAR (ATLID), a high-spectral-resolution UV LiDAR operating at 355 nm, specifically designed to provide accurate vertical profiles of clouds and aerosols together with advanced atmospheric target classification products. Compared with CALIOP, ATLID offers improved sensitivity to optically thin aerosol layers and provides additional information on aerosol type, making it particularly suitable for investigating the three-dimensional structure of volcanic plumes. For the most recent eruptions analyzed in this work, we use the ATLID Level-1B Mie Co-polar Attenuated Backscatter product to investigate the vertical structure of the volcanic plume, together with the ATLID Level-2 Low -esolution Classification product, which automatically classifies atmospheric targets, including stratospheric sulfate and stratospheric ash. The combined use of these products enables a detailed characterization of plume height, vertical stratification, and aerosol type, complementing the column-integrated SO2 observations derived from TROPOMI.
3.2. Case Studies
For the three selected case studies (Raikoke 2019, Hayli Gubbi 2025, and Kīlauea 2025), all satellite sensors and products described in Section 3.1 were analyzed to maximize the available information. This multi-sensor approach provides a comprehensive overview of the eruptive events, allowing the characterization of their magnitude, atmospheric impact, and potential implications for future climate forcing.
Table 6 shows the products used for the analysis of the three selected volcanic eruptions and the corresponding satellite sensors.
Table 6.
Satellite sensors and products selected for the analysis of the volcanic eruptions.
3.2.1. Raikoke
On 21 June 2019, Raikoke erupted in a Plinian eruption that lasted around 24 h, resulting in one of the largest emissions of sulfur into the stratosphere since the 2011 Nabro eruption [74,75,76].
The generation and propagation of volcanic clouds produced by the Raikoke eruption were monitored using Himawari-8 AHI imagery, specifically the Ash RGB and RGB sequences. Figure 5 presents the Ash RGB and RGB image sequences captured on 21–22 June 2019 at 20:10, 22:10, 00:10, and 02:10 UTC. The Ash RGB images initially show a prevalence of volcanic ash, indicated by red pixels. Over time, the ash disperses, leaving predominantly . This transition is further confirmed by the RGB sequence, which clearly demonstrates ongoing emissions.
Figure 5.
Himawari-8 AHI satellite imagery showing the dispersion of the Raikoke volcanic eruption plume from 21 to 22 June 2019. The top row (a–d) tracks the volcanic ash cloud (Ash RGB), while the bottom row (e–h) shows the spreading over time ( RGB).
Figure 6 shows the TROPOMI SO2 acquisitions on 22–23 June 2019, corresponding to the onset of the Raikoke eruption. During this initial phase, the volcanic SO2 plume begins to develop and spread into the atmosphere. The TROPOMI observations in Figure 6 show a compact SO2 cloud on 22 June, followed on 23 June by pronounced deformation, fragmentation and long-range transport over the North Pacific. TROPOMI data revealed that the SO2 cloud from Raikoke remained compact and persistent in the stratosphere, circulating around itself for over 10 days. This phenomenon, identified by Gorkavyi et al. [77] as coherent circular clouds (CCCs), approximately 300 km in diameter, likely contributed to the unusually long residence time of SO2 and may have produced a measurable local climate forcing. The Raikoke eruption has generated a Vorticized Volcanic Plume (VVP), identified for the first time related to a volcanic emission, usually related to biomass burning smokes plumes [117].
Figure 6.
TROPOMI SO2 acquisitions over the Raikoke eruption on 22 June 2019 02:16 UTC (a) and 23 June 2019 01:05 UTC (b).
As illustrated in Figure 7a, which reports the TROPOMI SO2 acquisition on 26 June 2019, the plume subsequently expands over several thousand kilometers, demonstrating the long-range atmospheric transport of volcanic SO2. However, SO2 column observations alone do not fully determine the climatic significance of an eruption. A key additional parameter is the vertical distribution of the volcanic material, since the atmospheric residence time and the probability of conversion of SO2 into long-lived sulfate aerosol strongly depend on the injection altitude and, in particular, on whether volcanic material reaches the upper troposphere or lower stratosphere. This information is further complemented by spaceborne LiDAR observations. The TROPOMI measurements show the extensive horizontal dispersion of the Raikoke SO2 plume on 26 June 2019, while the collocated CALIOP observations provide a vertical cross-section of the associated aerosol layers along the satellite ground track (Figure 7a,b). The CALIOP 532 nm total attenuated backscatter curtain plot reveals several vertically separated features, including elevated layers between approximately 13 and 15 km that are clearly distinguishable from the lower cloud systems. To characterize this vertical structure, a track-averaged backscatter profile was calculated over the highlighted portion of the CALIOP transect intersecting the elevated plume (Figure 7c). The resulting profile shows distinct backscatter enhancements at approximately 13–15 km, consistent with the presence of vertically stratified aerosol layers. The 25th–75th percentile range represents the spatial variability among the profiles included in the selected track segment. Thus, whereas TROPOMI characterizes the large-scale horizontal dispersion of the sulfur-rich plume, CALIOP constrains the altitude, vertical extent, and internal stratification of the associated aerosol layers.
Figure 7.
Satellite observations of the Raikoke volcanic plume on 26 June 2019. (a) TROPOMI SO2 distribution at 7 km, with the CALIOP ground track shown in blue. (b) CALIOP 532 nm total attenuated backscatter curtain plot along the satellite track. (c) Enlarged view of the elevated plume and corresponding track-averaged vertical backscatter profile. The shaded region indicates the track segment used for averaging, while the envelope represents the 25th–75th percentile range. Enhanced backscatter between approximately 13 and 15 km indicates vertically separated aerosol layers.
Table 7 summarizes the estimated altitude range of the volcanic aerosol layers derived from CALIOP observations. The measurements indicate that the plume initially reached altitudes of up to approximately 20 km and subsequently persisted mainly between 10 and 15 km, confirming the long-term presence of volcanic aerosols within the upper troposphere–lower stratosphere (UTLS). Unfortunately, the Sentinel-5P TROPOMI SO2 products available for the acquisition dates considered in this review do not yet include the SO2 Layer Height product (range 0–30 km [118]).
Table 7.
Estimated vertical properties of the elevated volcanic layers observed by CALIOP following the 2019 Raikoke eruption.
3.2.2. Hayli Gubbi
Hayli Gubbi erupted on 23 November 2025, producing a massive plume of gas and ash that rose to a height of 10–15 km [80].
Geostationary data from the MTG FCI sensor were also used to trace the dispersion of volcanic clouds from Hayli Gubbi. However, analysis was restricted to the Ash RGB sequence because the RGB product could not be generated, as the FCI instrument lacks the 6.9 μm spectral channel. Figure 8 shows the sequence on 23 November 2025 at 09:00, 11:00, 13:00, and 13:50 UTC. The Ash RGB images indicate that both and ash were initially emitted; however, starting from 13:00 UTC, the ash component became predominant over and remained in the atmosphere for several hours.
Figure 8.
MTG FCI satellite imagery showing the dispersion of the Hayli Gubbi volcanic eruption plume on 23 November 2025 at 09:00 UTC (a), 11:00 UTC (b), 13:00 UTC (c) and 13:50 UTC (d).
Figure 9 presents multiple information to characterize the Hayli Gubbi eruption on 24 November 2025. Figure 9a shows SO2 TROPOMI acquisition on 23 November 2025. No EarthCARE/ATLID overpass intersected the volcanic plume on the day of the eruption because the satellite ground track was located too far west; the first suitable ATLID overpass intersecting the transported plume occurred on 24 November, as shown together with the GEO-RING observations in Figure 9b. The corresponding ATLID Level-1B co-polar attenuated backscatter profile—as shown in Figure 9c— on 24 November 2025, reveals a little sniff at 17.5 km, indicating that the volcanic cloud became vertically stratified following the eruption.
Figure 9.
(a) TROPOMI SO2 VCD at 7km on 23 November 2025 at 09:57 UTC, showing the plume emitted by Hayli Gubbi volcano. (b) GEO-RING image on 24 November 2025 at 10:00 UTC with the EarthCARE overpass track (green line). (c) Vertical profile of the ATLID Level-1B co-polar attenuated backscatter measured along the track shown in (b), highlighting the vertical structure of the volcanic plume.
Table 8 summarizes the estimated altitude range of the Hayli Gubbi volcanic plume derived from EarthCARE/ATLID and Sentinel-5P TROPOMI observations only for the available acquisitions. The ATLID observations indicate that the main volcanic aerosol layer remained confined between approximately 16 and 17.5 km on 24 November 2025, as shown in Figure 9c, confirming the persistence of the plume within the UTLS. In contrast, the TROPOMI SO2 Layer Height retrieval exhibits a larger variability in the estimated plume altitude, particularly for the acquisition on 24 November 2025, where the retrieved layer extends from approximately 0.17 to 11.5 km. This discrepancy should be interpreted with caution, as the TROPOMI Layer Height product for this overpass is only partially populated, with a substantial fraction of pixels containing missing or invalid retrievals, which limits the reliability of the derived altitude range. The Sentinel-5P TROPOMI overpasses were acquired at 09:57 UTC on 23 November 2025 and at 09:38 UTC on 24 November 2025, whereas the EarthCARE/ATLID overpass was acquired later, between 10:53 and 11:05 UTC on 24 November 2025. Consequently, the observed differences may reflect not only the different retrieval methodologies of the two sensors, but also the temporal evolution of the volcanic plume during the interval separating the satellite acquisitions.
Table 8.
Estimated altitude range of the volcanic plume derived from EarthCARE/ATLID and Sentinel-5P TROPOMI observations for Hayli Gubbi 2025 eruption.
3.2.3. Kīlauea
Within the framework of Kīlauea’s 2024–2026 eruptive activity, this review analyzes Episode 38, which occurred on 6 December 2025.
The sequence of GOES-18 ABI images provides a detailed view of the volcanic cloud evolution. Figure 10 presents the Ash RGB and RGB image sequences captured on 6 December 2025 at 20:30 and 22:30 and 7 December 2025 at 00:30 and 02:30 UTC. At 20:30 UTC, from Ash RGB images it is evident that the initial emissions contain both ash and , indicated by the yellow pixels. Over time, becomes the predominant component. Specifically, between 20:30 and 22:30 UTC, the RGB images reveal that reached high altitudes (represented by red and orange pixels). Shortly thereafter (7 December 2025 00:30 and 02:30 UTC), only low-altitude remains, as indicated by the green pixels.
Figure 10.
GOES-18 ABI satellite imagery showing the dispersion of the Kīlauea volcanic eruption plume from 6 to 7 December 2025. The top row (a–d) tracks the volcanic ash cloud (Ash RGB), while the bottom row (e–h) shows the spreading over time ( RGB).
By jointly analyzing the TROPOMI and EarthCARE/ATLID observations, it is possible to reconstruct the evolution of the volcanic plume following the Kīlauea eruption. On 6 December 2025 (Figure 11a), only a few hours after the onset of the eruption, the SO2 cloud remained relatively compact and concentrated near the volcano. By 7 December 2025 (Figure 11b), the plume was advected toward the east–northeast, developing a more elongated and filamentous structure while becoming progressively more diffuse, indicating the onset of atmospheric dispersion.
Figure 11.
Evolution of the Kīlauea volcanic plume observed by Sentinel-5P TROPOMI and EarthCARE/ATLID. Panels (a,b) show the SO2 plume on 6–7 December 2025, while panels (c–e) present the EarthCARE ground track, ATLID Level-1B attenuated backscatter, and the corresponding Level-2 atmospheric target classification.
The EarthCARE overpass acquired on 7 December 2025 (Figure 11c) intersects the eastern portion of the transported plume identified by TROPOMI. The corresponding ATLID Level-1B attenuated backscatter profile (Figure 11d) reveals several elevated atmospheric features between approximately 10 and 16 km, although no well-defined and continuous aerosol layer is readily distinguishable from visual inspection alone. Nevertheless, the corresponding ATLID Level-2 Low-Resolution Classification (Figure 11e) identifies part of these elevated features as stratospheric sulfate and, locally, stratospheric ash, suggesting the presence of volcanic aerosols within the UTLS. The apparent discrepancy between the weak backscatter signal and the Level-2 classification can be explained by both the retrieval methodology and the eruptive style of Kīlauea. Unlike highly explosive eruptions such as Raikoke, Kīlauea is predominantly effusive, releasing large amounts of SO2 but relatively small quantities of coarse volcanic ash. During atmospheric transport, the emitted SO2 is progressively converted into fine sulfate aerosols, producing optically thin layers that generate only a weak LiDAR backscatter signal. Furthermore, the ATLID Level-2 retrieval combines attenuated backscatter, depolarization ratio, and ancillary atmospheric information within a dedicated classification algorithm, allowing these weak aerosol layers to be identified even when they are not clearly distinguishable in the Level-1B backscatter observations.
Table 9 summarizes the estimated altitude range of the Kīlauea volcanic plume derived from EarthCARE/ATLID and Sentinel-5P TROPOMI observations only for the available acquisitions.
Table 9.
Estimated altitude range of the volcanic plume derived from EarthCARE/ATLID and Sentinel-5P TROPOMI observations for Kīlauea 2025 eruption.
4. Discussions
This review demonstrates that the synergistic application of multi-sensor satellite remote sensing, combining geostationary thermal infrared imagery, polar-orbiting ultraviolet backscatter spectrometers, and spaceborne active LiDARs, provides a powerful observational baseline for tracking volcanic emissions across diverse eruptive regimes. The evaluation of the Raikoke (2019), Kīlauea (2025), and Hayli Gubbi (2025) eruptions highlights the distinct operational advantages of each platform while illustrating how cross-sensor integration compensates for the limitations of individual observational systems.
Geostationary platforms serving operational Ash and RGB composite imagery provide an unparalleled temporal sampling frequency, capturing eruptive dynamics and plume dispersion every few minutes. This high refresh rate is critical for operational aviation safety and early detection. However, geostationary RGB composites remain fundamentally qualitative or semi-quantitative. Their reliability degrades significantly when volcanic plumes are overlaid by dense, cold meteorological ice clouds, which often leads to signal misclassification and masks the spectral signature of underlying ash and sulfur dioxide. Conversely, polar-orbiting passive ultraviolet sensors, such as Sentinel-5P TROPOMI, deliver exceptional spatial resolution and sensitivity to total column densities, resolving fine spatial structures within diffuse or low-altitude plumes that geostationary sensors miss. Nevertheless, passive UV retrievals are constrained by significant quantitative uncertainties. Most notably, the Air Mass Factor used in TROPOMI retrievals relies heavily on a priori assumptions regarding the center-of-mass altitude of the plume. If the assumed injection height deviates from reality, the resulting column densities can suffer from substantial systematic biases. Furthermore, optically dense volcanic ash layers attenuate ultraviolet backscatter, severely distorting or suppressing the retrieved signal. Spaceborne active LiDARs, including CALIOP and the recently deployed EarthCARE ATLID address these vertical profiling limitations by offering the critical third dimension of plume architecture. By transmitting laser pulses directly through atmospheric layers, active LiDARs penetrate diffuse cloud structures to precisely resolve the vertical injection boundaries, depolarization ratios, and optical thickness of volcanic aerosol layers. Their main constraint lies in their spatial sampling geometry: because spaceborne LiDARs operate along an extremely narrow ground track, direct overpasses of active volcanic plumes are opportunistic and infrequent, precluding independent volumetric integration of total plume mass. Furthermore, the integration of geostationary, polar-orbiting, and active satellite sensors provides a scalable template that can be systematically applied across diverse eruptive intensities, from continuous low-altitude passive degassing to highly explosive stratospheric injections. This global applicability is essential for establishing standardized satellite-based catalogs of volcanic emissions, which serve as crucial input data for atmospheric transport models, climate hazard assessments, and international aviation safety networks. Ultimately, this unified global perspective ensures that volcanic events anywhere on Earth can be rapidly detected, monitored, and integrated into broader atmospheric and climatic impact frameworks.
The advantage of this framework is the possibility to characterize volcanic emissions worldwide, providing a standardized and globally consistent observational approach regardless of ground-based monitoring infrastructure. By leveraging spaceborne platforms, this multi-sensor methodology circumvents the geographic limitations and logistical challenges of ground networks, enabling continuous surveillance over remote island arcs, ocean basins, and isolated volcanic regions. To advance volcanic remote sensing from qualitative tracking to rigorous, quantitative climate analysis, prospective methodologies must focus on automated data assimilation workflows. Coupling co-located active LiDAR vertical profiles with high-resolution passive UV column retrievals eliminates the reliance on assumed injection heights, allowing for accurate quantification of total stratospheric sulfur mass injections. In turn, these observationally constrained sulfur burdens and vertical aerosol distributions provide the necessary inputs for radiative transfer models to compute negative top-of-atmosphere radiative forcing. Establishing this multi-sensor framework ensures that satellite remote sensing moves beyond simple plume detection to serve as a driver of quantitative atmospheric and climatic modeling.
5. Conclusions
Satellite remote sensing has become an indispensable tool for monitoring volcanic emissions by providing rapid, global-coverage observations of eruptive events. Characterizing these emissions is critical to understanding how explosive volcanic eruptions inject vast amounts of ash and volatile gases into the atmosphere, directly influencing atmospheric dynamics and climate variability. In particular, SO2 acts as a key driver of negative radiative forcing. Accurate quantification of these emissions is critical to fully understanding volcanic processes and assessing their impacts on climate. To trace volcanic plumes, modern satellite-based remote sensing techniques exploit a wide band of the electromagnetic spectrum, from microwave to UV radiation, including visible and infrared wavelengths, as well as radar and LiDAR observations. Passive geostationary IR imagery, such as Ash and SO2 RGB composite products, allows for continuous tracking of plume dispersion and spatiotemporal evolution. Complementarily, passive polar-orbiting UV instruments, including TROPOMI, yield high-precision SO2 vertical column densities. Finally, spaceborne active LiDARs, such as CALIOP aboard CALIPSO and ATLID aboard EarthCARE, provide fine-scale vertical profiling to resolve exact plume injection heights.
This review has provided a comprehensive overview of how modern satellite remote sensing serves as an indispensable framework for characterizing volcanic emissions relevant to atmospheric dynamics and climate forcing. By integrating passive UV/IR sensors with active spaceborne LiDAR (CALIPSO/CALIOP and EarthCARE/ATLID) across three large eruptions from the recent satellite era (Raikoke 2019, Kīlauea 2025, and Hayli Gubbi 2025), we have highlighted both the individual strengths and the necessary synergies of current space-based platforms. Combining multi-sensor satellite data enabled us to analyze varying eruption styles and determine how long each volcanic cloud remained in the atmosphere. Kīlauea represented a lower-intensity explosive event with largely localized effects, whereas Hayli Gubbi generated long-lived volcanic clouds that persisted in the troposphere and lower stratosphere. In contrast, Raikoke emerged as the most powerful eruption analyzed, injecting substantial masses of SO2 that persisted across vast spatial and temporal scales.
Overall, these findings demonstrate how multi-sensor satellite integration provides vital insights into volcanic emissions, underscoring its essential role in both real-time natural hazard monitoring and long-term climate impact assessments. Ultimately, satellite-derived products provide high-quality, observational data that can serve as essential inputs for future climate models, enhancing our ability to predict volcanic impacts on global climate change.
Author Contributions
Conceptualization, F.T., S.C. and A.B.M.; methodology, F.T., S.C. and A.B.M.; software, F.T. and S.C.; validation, A.B.M., V.Z. and C.D.N.; formal analysis, F.T., S.C. and A.B.M.; investigation, F.T., S.C. and A.B.M.; writing—original draft preparation, F.T., S.C. and A.B.M.; writing—review and editing, F.T., S.C., A.B.M., V.Z. and C.D.N.; visualization, F.T., S.C. and A.B.M.; project administration, V.Z. and C.D.N.; funding acquisition, V.Z. and C.D.N. All authors have read and agreed to the published version of the manuscript.
Funding
This research was supported by the DEMETRA research line within the ROSE (Reinforcement of the Observational Systems of the Earth) infrastructural project of INGV (OB.FU.: 1215.010), funded by the Italian Ministry of University and Research.
Data Availability Statement
Data used in this paper can be downloaded from EUMETSAT’s website and are accessible via the TechnoLab webpage of the INGV-Etna Volcano Observatory.
Acknowledgments
This work was developed within the framework of the Laboratory of Technologies for Volcanology (TechnoLab) at the INGV in Catania (Italy). We are grateful to the European Organisation for the Exploitation of Meteorological Satellites (EUMETSAT), the European Space Agency (ESA), the Italian Space Agency (ASI), and the National Aeronautics and Space Administration (NASA) for satellite data.
Conflicts of Interest
The authors declare no conflicts of interest.
References
- Humphreys, W. Volcanic dust as a factor in the production of climatic changes. J. Wash. Acad. Sci. 1913, 3, 365–371. [Google Scholar]
- Sigl, M.; Winstrup, M.; McConnell, J.R.; Welten, K.C.; Plunkett, G.; Ludlow, F.; Büntgen, U.; Caffee, M.; Chellman, N.; Dahl-Jensen, D.; et al. Timing and climate forcing of volcanic eruptions for the past 2500 years. Nature 2015, 523, 543–549. [Google Scholar] [CrossRef] [Scilit]
- Bethke, I.; Outten, S.; Otterå, O.H.; Hawkins, E.; Wagner, S.; Sigl, M.; Thorne, P. Potential volcanic impacts on future climate variability. Nat. Clim. Change 2017, 7, 799–805. [Google Scholar] [CrossRef] [Scilit]
- Hagen, M.; Azevedo, A. Influence of volcanic activity on weather and climate changes. Atmos. Clim. Sci. 2023, 13, 138–158. [Google Scholar]
- Hegerl, G.C.; Crowley, T.J.; Baum, S.K.; Kim, K.Y.; Hyde, W.T. Detection of volcanic, solar and greenhouse gas signals in paleo-reconstructions of Northern Hemispheric temperature. Geophys. Res. Lett. 2003, 30, 1242. [Google Scholar] [CrossRef] [Scilit]
- Schurer, A.P.; Hegerl, G.C.; Mann, M.E.; Tett, S.F.; Phipps, S.J. Separating forced from chaotic climate variability over the past millennium. J. Clim. 2013, 26, 6954–6973. [Google Scholar] [CrossRef] [Scilit]
- Schurer, A.P.; Tett, S.F.; Hegerl, G.C. Small influence of solar variability on climate over the past millennium. Nat. Geosci. 2014, 7, 104–108, Addendum in Nat. Geosci. 2015, 8, 159. [Google Scholar] [CrossRef] [Scilit]
- Marshall, L.R.; Maters, E.C.; Schmidt, A.; Timmreck, C.; Robock, A.; Toohey, M. Volcanic effects on climate: Recent advances and future avenues. Bull. Volcanol. 2022, 84, 54. [Google Scholar] [CrossRef] [Scilit]
- Racki, G. Volcanism as a prime cause of mass extinctions: Retrospectives and perspectives. In Mass Extinctions, Volcanism, and Impacts: New Developments; Geological Society of America: Boulder, CO, USA, 2020. [Google Scholar]
- Black, B.A.; Karlstrom, L.; Mather, T.A. The life cycle of large igneous provinces. Nat. Rev. Earth Environ. 2021, 2, 840–857. [Google Scholar] [CrossRef] [Scilit]
- Schultz, M.H. Plate Tectonics and Long-Term Climate Change. In Climate Change: A Geoscience Perspective; Springer: Berlin/Heidelberg, Germany, 2025; pp. 239–278. [Google Scholar]
- Cheong, H.J.; Mittal, T.; Sprain, C.J.; Fendley, I.M. Large Igneous Province Sulfur Emissions Have Long-Term (>1000 Years) Effects on the Ocean Carbon Cycle. Geochem. Geophys. Geosyst. 2025, 26, e2024GC011893. [Google Scholar] [CrossRef] [Scilit]
- Swingedouw, D.; Ortega, P.; Mignot, J.; Guilyardi, E.; Masson-Delmotte, V.; Butler, P.G.; Khodri, M.; Séférian, R. Bidecadal North Atlantic ocean circulation variability controlled by timing of volcanic eruptions. Nat. Commun. 2015, 6, 6545. [Google Scholar] [CrossRef] [Scilit]
- Krishnamohan, K.P.S.P.; Bala, G.; Cao, L.; Duan, L.; Caldeira, K. Climate system response to stratospheric sulfate aerosols: Sensitivity to altitude of aerosol layer. Earth Syst. Dyn. 2019, 10, 885–900. [Google Scholar] [CrossRef] [Scilit]
- Parker, D.E.; Wilson, H.; Jones, P.D.; Christy, J.R.; Folland, C.K. The impact of Mount Pinatubo on world-wide temperatures. Int. J. Climatol. A J. R. Meteorol. Soc. 1996, 16, 487–497. [Google Scholar] [CrossRef] [Scilit]
- McCormick, M.P.; Thomason, L.W.; Trepte, C.R. Atmospheric effects of the Mt Pinatubo eruption. Nature 1995, 373, 399–404. [Google Scholar] [CrossRef] [Scilit]
- Lamb, H.H. Volcanic dust in the atmosphere; with a chronology and assessment of its meteorological significance. Philos. Trans. R. Soc. London. Ser. A Math. Phys. Sci. 1970, 266, 425–533. [Google Scholar] [CrossRef] [Scilit]
- Cooper, C.L.; Swindles, G.T.; Savov, I.P.; Schmidt, A.; Bacon, K.L. Evaluating the relationship between climate change and volcanism. Earth-Sci. Rev. 2018, 177, 238–247. [Google Scholar] [CrossRef] [Scilit]
- Dutton, E.G.; Christy, J.R. Solar radiative forcing at selected locations and evidence for global lower tropospheric cooling following the eruptions of El Chichón and Pinatubo. Geophys. Res. Lett. 1992, 19, 2313–2316. [Google Scholar] [CrossRef] [Scilit]
- Labitzke, K.; McCormick, M.P. Stratospheric temperature increases due to Pinatubo aerosols. Geophys. Res. Lett. 1992, 19, 207–210. [Google Scholar] [CrossRef] [Scilit]
- Corradino, C.; Amato, E.; Torrisi, F.; Del Negro, C. Data-driven random forest models for detecting volcanic hot spots in Sentinel-2 MSI images. Remote Sens. 2022, 14, 4370. [Google Scholar] [CrossRef] [Scilit]
- Amato, E.; Corradino, C.; Torrisi, F.; Del Negro, C. Spectral analysis of lava flows: Temporal and physicochemical effects. Il Nuovo Cimento C 2023, 46, 1–4. [Google Scholar]
- Torrisi, F.; Corradino, C.; Cariello, S.; Di Bella, G.; Del Negro, C. Challenges and Opportunities in Deep Learning and Geostationary Satellite Remote Sensing for Volcanic Cloud Monitoring. In Proceedings of the 2024 IEEE 8th Forum on Research and Technologies for Society and Industry Innovation (RTSI), Milano, Italy, 18–20 September 2024; IEEE: New York, NY, USA, 2024; pp. 120–124. [Google Scholar]
- Corradino, C.; Malaguti, A.B.; Ramsey, M.S.; Del Negro, C. Quantitative assessment of volcanic thermal activity from space using an isolation forest machine learning algorithm. Remote Sens. 2024, 16, 2001. [Google Scholar] [CrossRef] [Scilit]
- Cariello, S.; Malaguti, A.B.; Corradino, C.; Del Negro, C. V-STAR: A Cloud-Based Tool for Satellite Detection and Mapping of Volcanic Thermal Anomalies. GeoHazards 2025, 6, 24. [Google Scholar] [CrossRef] [Scilit]
- Cariello, S.; Corradino, C.; Del Negro, C. How artificial intelligence can enhance monitoring of volcanoes from space. Il Nuovo Cimento 2024, 100, 47. [Google Scholar]
- Malaguti, A.B.; Corradino, C.; Di Bella, G.S.; La Spina, A.; Miraglia, L.; Cariello, S.; Torrisi, F.; Del Negro, C. Eruptive dynamics of the 2024 lava fountains at Etna’s Voragine Crater analyzed using unsupervised learning of multi-sensor satellite data. J. Volcanol. Geotherm. Res. 2026, 480, 108737. [Google Scholar] [CrossRef] [Scilit]
- Krueger, A.J. Sighting of El Chichon sulfur dioxide clouds with the Nimbus 7 total ozone mapping spectrometer. Science 1983, 220, 1377–1379. [Google Scholar] [CrossRef] [Scilit]
- Krueger, A.; Krotkov, N.; Carn, S. El Chichon: The genesis of volcanic sulfur dioxide monitoring from space. J. Volcanol. Geotherm. Res. 2008, 175, 408–414. [Google Scholar] [CrossRef] [Scilit]
- Doiron, S.D.; Bluth, G.J.; Schnetzler, C.C.; Krueger, A.J.; Walter, L.S. Transport of Cerro Hudson SO2 clouds. Eos Trans. Am. Geophys. Union 1991, 72, 489–498. [Google Scholar] [CrossRef] [Scilit]
- Bluth, G.J.; Doiron, S.D.; Schnetzler, C.C.; Krueger, A.J.; Walter, L.S. Global tracking of the SO2 clouds from the June, 1991 Mount Pinatubo eruptions. Geophys. Res. Lett. 1992, 19, 151–154. [Google Scholar] [CrossRef] [Scilit]
- Schneider, D.J.; Rose, W.I.; Coke, L.R.; Bluth, G.J.; Sprod, I.E.; Krueger, A.J. Early evolution of a stratospheric volcanic eruption cloud as observed with TOMS and AVHRR. J. Geophys. Res. Atmos. 1999, 104, 4037–4050. [Google Scholar] [CrossRef] [Scilit]
- Guo, S.; Bluth, G.J.; Rose, W.I.; Watson, I.M.; Prata, A. Re-evaluation of SO2 release of the 15 June 1991 Pinatubo eruption using ultraviolet and infrared satellite sensors. Geochem. Geophys. Geosyst. 2004, 5, Q04001. [Google Scholar] [CrossRef] [Scilit]
- Marchese, F.; Neri, M.; Falconieri, A.; Lacava, T.; Mazzeo, G.; Pergola, N.; Tramutoli, V. The contribution of multi-sensor infrared satellite observations to monitor Mt. Etna (Italy) activity during May to August 2016. Remote Sens. 2018, 10, 1948. [Google Scholar] [CrossRef] [Scilit]
- Cariello, S.; Corradino, C.; Torrisi, F.; Del Negro, C. Cascading machine learning to monitor volcanic thermal activity using orbital infrared data: From detection to quantitative evaluation. Remote Sens. 2023, 16, 171. [Google Scholar] [CrossRef] [Scilit]
- Torrisi, F.; Di Bella, G.S.; Corradino, C.; Cariello, S.; Malaguti, A.B.; Del Negro, C. From MSG-SEVIRI to MTG-FCI: Advancing Volcanic Thermal Monitoring from Geostationary Satellites. Remote Sens. 2025, 18, 6. [Google Scholar] [CrossRef] [Scilit]
- Torrisi, F. Automatic detection of volcanic ash clouds using MSG-SEVIRI satellite data and machine learning techniques. Il Nuovo Cimento C 2022, 45, 1–10. [Google Scholar]
- Torrisi, F.; Amato, E.; Corradino, C.; Mangiagli, S.; Del Negro, C. Characterization of volcanic cloud components using machine learning techniques and SEVIRI infrared images. Sensors 2022, 22, 7712. [Google Scholar] [CrossRef] [Scilit]
- Guerrieri, L.; Corradini, S.; Theys, N.; Stelitano, D.; Merucci, L. Volcanic clouds characterization of the 2020–2022 sequence of Mt. Etna lava fountains using MSG-SEVIRI and products’ cross-comparison. Remote Sens. 2023, 15, 2055. [Google Scholar] [CrossRef] [Scilit]
- Torrisi, F. Integrated machine learning approach for volcanic cloud tracking: A Case Study of Etna’s Lava Fountains (2020–2022). Ann. Geophys. 2025, 68, V224. [Google Scholar] [CrossRef] [Scilit]
- Carn, S.A.; Krueger, A.J.; Krotkov, N.A.; Yang, K.; Evans, K. Tracking volcanic sulfur dioxide clouds for aviation hazard mitigation. Nat. Hazards 2009, 51, 325–343. [Google Scholar] [CrossRef] [Scilit]
- Carn, S.; Fioletov, V.; McLinden, C.; Li, C.; Krotkov, N. A decade of global volcanic SO2 emissions measured from space. Sci. Rep. 2017, 7, 44095. [Google Scholar] [CrossRef] [Scilit]
- Carn, S.A.; Krotkov, N.A.; Theys, N.; Li, C. Advances in UV Satellite Monitoring of Volcanic Emissions. In Proceedings of the 2021 IEEE International Geoscience and Remote Sensing Symposium IGARSS, Brussels, Belgium, 11–16 July 2021; IEEE: New York, NY, USA, 2021; pp. 973–976. [Google Scholar]
- Corradino, C.; Jouve, P.; La Spina, A.; Del Negro, C. Monitoring Earth’s atmosphere with Sentinel-5 TROPOMI and Artificial Intelligence: Quantifying volcanic SO2 emissions. Remote Sens. Environ. 2024, 315, 114463. [Google Scholar] [CrossRef] [Scilit]
- Cariello, S.; Corradino, C.; La Spina, A.; Del Negro, C. Volcanic SO2 monitoring from space using SAM2 Foundation model. IEEE Trans. Geosci. Remote Sens. 2026, 64, 4110513. [Google Scholar] [CrossRef] [Scilit]
- Marzano, F.S.; Barbieri, S.; Vulpiani, G.; Rose, W.I. Volcanic ash cloud retrieval by ground-based microwave weather radar. IEEE Trans. Geosci. Remote Sens. 2006, 44, 3235–3246. [Google Scholar] [CrossRef] [Scilit]
- Mereu, L.; Scollo, S.; Bonadonna, C.; Corradini, S.; Donnadieu, F.; Montopoli, M.; Vulpiani, G.; Barsotti, S.; Freret-Lorgeril, V.; Gudmundsson, M.; et al. Observations and Retrievals of Volcanic Ash Clouds Using Ground-and Satellite-Based Sensors. In Proceedings of the 2023 17th European Conference on Antennas and Propagation (EuCAP), Florence, Italy, 26–31 March 2023; IEEE: New York, NY, USA, 2023; pp. 1–5. [Google Scholar]
- Ansmann, A.; Tesche, M.; Groß, S.; Freudenthaler, V.; Seifert, P.; Hiebsch, A.; Schmidt, J.; Wandinger, U.; Mattis, I.; Müller, D.; et al. The 16 April 2010 major volcanic ash plume over central Europe: EARLINET lidar and AERONET photometer observations at Leipzig and Munich, Germany. Geophys. Res. Lett. 2010, 37, L13810. [Google Scholar] [CrossRef] [Scilit]
- Huppert, H.E.; Sparks, R.S.J. Extreme natural hazards: Population growth, globalization and environmental change. Philos. Trans. R. Soc. A Math. Phys. Eng. Sci. 2006, 364, 1875–1888. [Google Scholar] [CrossRef] [Scilit]
- Brown, S.K.; Loughlin, S.C.; Sparks, R.; Vye-Brown, C.; Barclay, J.; Calder, E.; Cottrell, E.; Jolly, G.; Komorowski, J.; Mandeville, C.; et al. Global volcanic hazard and risk. Glob. Volcan. Hazards Risk 2015, 1, 81–172. [Google Scholar] [CrossRef] [Scilit]
- Pardini, F.; Barsotti, S.; Bonadonna, C.; de’Michieli Vitturi, M.; Folch, A.; Mastin, L.; Osores, S.; Prata, A.T. Dynamics, monitoring, and forecasting of tephra in the atmosphere. Rev. Geophys. 2024, 62, e2023RG000808. [Google Scholar] [CrossRef] [Scilit]
- LeGrande, A.N.; Tsigaridis, K.; Bauer, S.E. Role of atmospheric chemistry in the climate impacts of stratospheric volcanic injections. Nat. Geosci. 2016, 9, 652–655. [Google Scholar] [CrossRef] [Scilit]
- Zhu, Y.; Bardeen, C.G.; Tilmes, S.; Mills, M.J.; Wang, X.; Harvey, V.L.; Taha, G.; Kinnison, D.; Portmann, R.W.; Yu, P.; et al. Perturbations in stratospheric aerosol evolution due to the water-rich plume of the 2022 Hunga-Tonga eruption. Commun. Earth Environ. 2022, 3, 248. [Google Scholar] [CrossRef] [Scilit]
- Rampino, M.R.; Self, S. Sulphur-rich volcanic eruptions and stratospheric aerosols. Nature 1984, 310, 677–679. [Google Scholar] [CrossRef] [Scilit]
- Robock, A. Volcanic eruptions and climate. Rev. Geophys. 2000, 38, 191–219, Correction in Rev. Geophys. 2007, 45, RG3005. [Google Scholar] [CrossRef] [Scilit]
- Martin, E.; Bekki, S.; Ninin, C.; Bindeman, I. Volcanic sulfate aerosol formation in the troposphere. J. Geophys. Res. Atmos. 2014, 119, 12–660. [Google Scholar] [CrossRef] [Scilit]
- Barnes, J.E.; Hofmann, D.J. Lidar measurements of stratospheric aerosol over Mauna Loa Observatory. Geophys. Res. Lett. 1997, 24, 1923–1926. [Google Scholar] [CrossRef] [Scilit]
- Stenchikov, G.L.; Kirchner, I.; Robock, A.; Graf, H.F.; Antuna, J.C.; Grainger, R.G.; Lambert, A.; Thomason, L. Radiative forcing from the 1991 Mount Pinatubo volcanic eruption. J. Geophys. Res. Atmos. 1998, 103, 13837–13857. [Google Scholar] [CrossRef] [Scilit]
- Newhall, C.G.; Self, S. The volcanic explosivity index (VEI) an estimate of explosive magnitude for historical volcanism. J. Geophys. Res. Ocean. 1982, 87, 1231–1238. [Google Scholar] [CrossRef] [Scilit]
- Self, S.; Rampino, M.R. The 1883 eruption of Krakatau. Nature 1981, 294, 699–704. [Google Scholar] [CrossRef] [Scilit]
- Rampino, M.R.; Self, S. Historic eruptions of Tambora (1815), Krakatau (1883), and Agung (1963), their stratospheric aerosols, and climatic impact. Quat. Res. 1982, 18, 127–143. [Google Scholar] [CrossRef] [Scilit]
- Self, S. The effects and consequences of very large explosive volcanic eruptions. Philos. Trans. R. Soc. A Math. Phys. Eng. Sci. 2006, 364, 2073–2097. [Google Scholar] [CrossRef] [Scilit]
- Gerlach, T.; McGee, K. Total sulfur dioxide emissions and pre-eruption vapor-saturated magma at Mount St. Helens, 1980–1988. Geophys. Res. Lett. 1994, 21, 2833–2836. [Google Scholar] [CrossRef] [Scilit]
- Toohey, M.; Krüger, K.; Niemeier, U.; Timmreck, C. The influence of eruption season on the global aerosol evolution and radiative impact of tropical volcanic eruptions. Atmos. Chem. Phys. 2011, 11, 12351–12367. [Google Scholar] [CrossRef] [Scilit]
- Aubry, T.J.; Jellinek, A.M.; Degruyter, W.; Bonadonna, C.; Radić, V.; Clyne, M.; Quainoo, A. Impact of global warming on the rise of volcanic plumes and implications for future volcanic aerosol forcing. J. Geophys. Res. Atmos. 2016, 121, 13326–13351. [Google Scholar] [CrossRef] [Scilit]
- Marshall, L.; Johnson, J.S.; Mann, G.W.; Lee, L.; Dhomse, S.S.; Regayre, L.; Yoshioka, M.; Carslaw, K.S.; Schmidt, A. Exploring how eruption source parameters affect volcanic radiative forcing using statistical emulation. J. Geophys. Res. Atmos. 2019, 124, 964–985. [Google Scholar] [CrossRef] [Scilit]
- Pyle, D.M.; Beattie, P.D.; Bluth, G.J. Sulphur emissions to the stratosphere from explosive volcanic eruptions. Bull. Volcanol. 1996, 57, 663–671. [Google Scholar] [CrossRef] [Scilit]
- Miles, G.; Grainger, R.; Highwood, E. The significance of volcanic eruption strength and frequency for climate. Q. J. R. Meteorol. Soc. 2004, 130, 2361–2376. [Google Scholar] [CrossRef] [Scilit]
- Solomon, S.; Daniel, J.S.; Neely, R.R., III; Vernier, J.P.; Dutton, E.G.; Thomason, L.W. The persistently variable “background” stratospheric aerosol layer and global climate change. Science 2011, 333, 866–870. [Google Scholar] [CrossRef] [Scilit]
- Vernier, J.P.; Thomason, L.W.; Pommereau, J.P.; Bourassa, A.; Pelon, J.; Garnier, A.; Hauchecorne, A.; Blanot, L.; Trepte, C.; Degenstein, D.; et al. Major influence of tropical volcanic eruptions on the stratospheric aerosol layer during the last decade. Geophys. Res. Lett. 2011, 38, L12807. [Google Scholar] [CrossRef] [Scilit]
- Schmidt, A.; Mills, M.J.; Ghan, S.; Gregory, J.M.; Allan, R.P.; Andrews, T.; Bardeen, C.G.; Conley, A.; Forster, P.M.; Gettelman, A.; et al. Volcanic radiative forcing from 1979 to 2015. J. Geophys. Res. Atmos. 2018, 123, 12491–12508. [Google Scholar] [CrossRef] [Scilit]
- Santer, B.D.; Bonfils, C.; Painter, J.F.; Zelinka, M.D.; Mears, C.; Solomon, S.; Schmidt, G.A.; Fyfe, J.C.; Cole, J.N.; Nazarenko, L.; et al. Volcanic contribution to decadal changes in tropospheric temperature. Nat. Geosci. 2014, 7, 185–189. [Google Scholar] [CrossRef] [Scilit]
- Carn, S.; Clarisse, L.; Prata, A.J. Multi-decadal satellite measurements of global volcanic degassing. J. Volcanol. Geotherm. Res. 2016, 311, 99–134. [Google Scholar] [CrossRef] [Scilit]
- Goitom, B.; Oppenheimer, C.; Hammond, J.O.; Grandin, R.; Barnie, T.; Donovan, A.; Ogubazghi, G.; Yohannes, E.; Kibrom, G.; Kendall, J.M.; et al. First recorded eruption of Nabro volcano, Eritrea, 2011. Bull. Volcanol. 2015, 77, 85. [Google Scholar] [CrossRef] [Scilit]
- Degterev, A.; Chibisova, M. The eruption of Raikoke volcano in June of 2019 (Raikoke Island, Central Kuril Islands). Geosyst. Transit. Zones 2019, 3, 304–309. [Google Scholar] [CrossRef] [Scilit]
- Vernier, J.P.; Aubry, T.J.; Timmreck, C.; Schmidt, A.; Clarisse, L.; Prata, F.; Theys, N.; Prata, A.T.; Mann, G.; Choi, H.; et al. The 2019 Raikoke eruption as a testbed used by the Volcano Response group for rapid assessment of volcanic atmospheric impacts. Atmos. Chem. Phys. 2024, 24, 5765–5782. [Google Scholar] [CrossRef] [Scilit]
- Gorkavyi, N.; Krotkov, N.; Li, C.; Lait, L.; Colarco, P.; Carn, S.; DeLand, M.; Newman, P.; Schoeberl, M.; Taha, G.; et al. Tracking aerosols and SO2 clouds from the Raikoke eruption: 3D view from satellite observations. Atmos. Meas. Tech. 2021, 14, 7545–7563. [Google Scholar] [CrossRef] [Scilit]
- Smirnov, S.; Nizametdinov, I.; Timina, T.Y.; Kotov, A.; Sekisova, V.; Kuzmin, D.; Kalacheva, E.; Rashidov, V.; Rybin, A.; Lavrenchuk, A.; et al. High explosivity of the June 21, 2019 eruption of Raikoke volcano (Central Kuril Islands); mineralogical and petrological constraints on the pyroclastic materials. J. Volcanol. Geotherm. Res. 2021, 418, 107346. [Google Scholar] [CrossRef] [Scilit]
- Barberi, F.; Varet, J. The Erta Ale volcanic range (Danakil depression, northern afar, ethiopia). Bull. Volcanol. 1970, 34, 848–917. [Google Scholar] [CrossRef] [Scilit]
- Global Volcanism Program. Report on Hayli Gubbi (Ethiopia). Weekly Volcanic Activity Report 26 November–2 December 2025, Smithsonian Institution and United States Geological Survey. 2025. Available online: https://volcano.si.edu/showreport.cfm?gvpvar=GVP.WVAR20251126-221091 (accessed on 27 July 2026).
- Self, S.; Marti, J.; Ernst, G. Effects of volcanic eruptions on the atmosphere and climate. In Volcanoes and the Environment; Cambridge University Press: Cambridge, UK, 2005; pp. 152–174. [Google Scholar]
- Corradino, C. How Artificial Intelligence and Earth Observation Satellites are re-shaping volcano monitoring. Ann. Geophys. 2025, 68, V228. [Google Scholar] [CrossRef] [Scilit]
- Platt, U.; Stutz, J. Differential absorption spectroscopy. In Differential Optical Absorption Spectroscopy: Principles and Applications; Springer: Berlin/Heidelberg, Germany, 2008; pp. 135–174. [Google Scholar]
- Heath, D.; Krueger, A.J.; Roeder, H.; Henderson, B. The solar backscatter ultraviolet and total ozone mapping spectrometer (SBUV/TOMS) for Nimbus G. Opt. Eng. 1975, 14, 323–331. [Google Scholar] [CrossRef] [Scilit]
- McPeters, R. Earth Probe Total Ozone Mapping Spectrometer (TOMS) Data Product User’s Guide; National Aeronautics and Space Administration, Goddard Space Flight Center: Greenbelt, MD, USA, 1998; Volume 206895.
- Krueger, A.J.; Jaross, G. TOMS/ADEOS instrument characterization. IEEE Trans. Geosci. Remote Sens. 1999, 37, 1543–1549. [Google Scholar] [CrossRef]
- Burton, M.R.; Sawyer, G.M.; Granieri, D. Deep carbon emissions from volcanoes. Rev. Mineral. Geochem. 2013, 75, 323–354. [Google Scholar] [CrossRef] [Scilit]
- Noël, S.; Burrows, J.; Bovensmann, H.; Frerick, J.; Chance, K.; Goede, A.; Muller, C. Atmospheric trace gas sounding with SCIAMACHY. Adv. Space Res. 2000, 26, 1949–1954. [Google Scholar] [CrossRef] [Scilit]
- Loyola, D.; van Geffen, J.; Valks, P.; Erbertseder, T.; Van Roozendael, M.; Thomas, W.; Zimmer, W.; Wißkirchen, K. Satellite-based detection of volcanic sulphur dioxide from recent eruptions in Central and South America. Adv. Geosci. 2008, 14, 35–40. [Google Scholar] [CrossRef] [Scilit]
- Flynn, L.; Long, C.; Wu, X.; Evans, R.; Beck, C.; Petropavlovskikh, I.; McConville, G.; Yu, W.; Zhang, Z.; Niu, J.; et al. Performance of the ozone mapping and profiler suite (OMPS) products. J. Geophys. Res. Atmos. 2014, 119, 6181–6195. [Google Scholar] [CrossRef] [Scilit]
- Veefkind, J.P.; Aben, I.; McMullan, K.; Förster, H.; De Vries, J.; Otter, G.; Claas, J.; Eskes, H.; De Haan, J.; Kleipool, Q.; et al. TROPOMI on the ESA Sentinel-5 Precursor: A GMES mission for global observations of the atmospheric composition for climate, air quality and ozone layer applications. Remote Sens. Environ. 2012, 120, 70–83. [Google Scholar] [CrossRef] [Scilit]
- Theys, N.; Hedelt, P.; De Smedt, I.; Lerot, C.; Yu, H.; Vlietinck, J.; Pedergnana, M.; Arellano, S.; Galle, B.; Fernandez, D.; et al. Global monitoring of volcanic SO2 degassing with unprecedented resolution from TROPOMI onboard Sentinel-5 Precursor. Sci. Rep. 2019, 9, 2643. [Google Scholar] [CrossRef] [Scilit]
- Ingmann, P.; Veihelmann, B.; Langen, J.; Lamarre, D.; Stark, H.; Courrèges-Lacoste, G.B. Requirements for the GMES Atmosphere Service and ESA’s implementation concept: Sentinels-4/-5 and-5p. Remote Sens. Environ. 2012, 120, 58–69. [Google Scholar] [CrossRef] [Scilit]
- Kim, J.; Jeong, U.; Ahn, M.H.; Kim, J.H.; Park, R.J.; Lee, H.; Song, C.H.; Choi, Y.S.; Lee, K.H.; Yoo, J.M.; et al. New era of air quality monitoring from space: Geostationary Environment Monitoring Spectrometer (GEMS). Bull. Am. Meteorol. Soc. 2020, 101, E1–E22. [Google Scholar] [CrossRef] [Scilit]
- Zoogman, P.; Liu, X.; Suleiman, R.; Pennington, W.; Flittner, D.; Al-Saadi, J.; Hilton, B.; Nicks, D.; Newchurch, M.; Carr, J.; et al. Tropospheric emissions: Monitoring of pollution (TEMPO). J. Quant. Spectrosc. Radiat. Transf. 2017, 186, 17–39. [Google Scholar] [CrossRef] [Scilit]
- Blackett, M. An overview of infrared remote sensing of volcanic activity. J. Imaging 2017, 3, 13. [Google Scholar] [CrossRef] [Scilit]
- Torrisi, F.; Amato, E.; Corradino, C.; Del Negro, C. The FastVRP automatic platform for the thermal monitoring of volcanic activity using VIIRS and SLSTR sensors: FastFRP to monitor volcanic radiative power. Ann. Geophys. 2022, 65, RS642. [Google Scholar] [CrossRef] [Scilit]
- Di Bella, G.S.; Corradino, C.; Cariello, S.; Torrisi, F.; Del Negro, C. Advancing volcanic activity monitoring: A near-real-time approach with remote sensing data fusion for radiative power estimation. Remote Sens. 2024, 16, 2879. [Google Scholar] [CrossRef] [Scilit]
- Prata, F.; Lynch, M. Passive earth observations of volcanic clouds in the atmosphere. Atmosphere 2019, 10, 199. [Google Scholar] [CrossRef] [Scilit]
- Sawada, Y. Study on analyses of volcanic eruptions based on eruption cloud image data obtained by the geostationary meteorological satellite (GMS). Tech. Rep. Meteorol. Res. Inst. 1987, 22, 1–335. [Google Scholar]
- Malingreau, J.P.; Kaswanda. Monitoring volcanic eruptions in Indonesia using weather satellite data: The Colo eruption of 28 July 1983. J. Volcanol. Geotherm. Res. 1986, 27, 179–194. [Google Scholar] [CrossRef] [Scilit]
- Prata, A. Infrared radiative transfer calculations for volcanic ash clouds. Geophys. Res. Lett. 1989, 16, 1293–1296. [Google Scholar] [CrossRef] [Scilit]
- Prata, A. Observations of volcanic ash clouds in the 10–12 μm window using AVHRR/2 data. Int. J. Remote Sens. 1989, 10, 751–761. [Google Scholar] [CrossRef] [Scilit]
- Wen, S.; Rose, W.I. Retrieval of sizes and total masses of particles in volcanic clouds using AVHRR bands 4 and 5. J. Geophys. Res. Atmos. 1994, 99, 5421–5431. [Google Scholar] [CrossRef] [Scilit]
- Rose, W.I.; Delene, D.; Schneider, D.; Bluth, G.; Krueger, A.; Sprod, I.; McKee, C.; Davies, H.; Ernst, G.G. Ice in the 1994 Rabaul eruption cloud: Implications for volcano hazard and atmospheric effects. Nature 1995, 375, 477–479. [Google Scholar] [CrossRef] [Scilit]
- Watkin, S. The application of AVHRR data for the detection of volcanic ash in a Volcanic Ash Advisory Centre. Meteorol. Appl. 2003, 10, 301–311. [Google Scholar] [CrossRef] [Scilit]
- Prata, A.J. Satellite detection of hazardous volcanic clouds and the risk to global air traffic. Nat. Hazards 2009, 51, 303–324. [Google Scholar] [CrossRef] [Scilit]
- Arias, L.; Cifuentes, J.; Marín, M.; Castillo, F.; Garcés, H. Hyperspectral imaging retrieval using MODIS satellite sensors applied to volcanic ash clouds monitoring. Remote Sens. 2019, 11, 1393. [Google Scholar] [CrossRef] [Scilit]
- Realmuto, V.J.; Abrams, M.J.; Buongiorno, M.F.; Pieri, D.C. The use of multispectral thermal infrared image data to estimate the sulfur dioxide flux from volcanoes: A case study from Mount Etna, Sicily, July 29, 1986. J. Geophys. Res. Solid Earth 1994, 99, 481–488. [Google Scholar] [CrossRef] [Scilit]
- Realmuto, V.; Sutton, A.; Elias, T. Multispectral thermal infrared mapping of sulfur dioxide plumes: A case study from the East Rift Zone of Kilauea Volcano, Hawaii. J. Geophys. Res. Solid Earth 1997, 102, 15057–15072. [Google Scholar] [CrossRef] [Scilit]
- Carboni, E.; Grainger, R.G.; Mather, T.A.; Pyle, D.M.; Thomas, G.E.; Siddans, R.; Smith, A.J.; Dudhia, A.; Koukouli, M.E.; Balis, D. The vertical distribution of volcanic SO2 plumes measured by IASI. Atmos. Chem. Phys. 2016, 16, 4343–4367. [Google Scholar] [CrossRef] [Scilit]
- Pyle, D.M.; Mather, T.A.; Biggs, J. Introduction. In Remote Sensing of Volcanoes and Volcanic Processes: Integrating Observation and Modelling; Geological Society of London: London, UK, 2013. [Google Scholar][Green Version]
- Stephens, G.L.; Vane, D.G.; Tanelli, S.; Im, E.; Durden, S.; Rokey, M.; Reinke, D.; Partain, P.; Mace, G.G.; Austin, R.; et al. CloudSat mission: Performance and early science after the first year of operation. J. Geophys. Res. Atmos. 2008, 113, D00A18. [Google Scholar] [CrossRef] [Scilit]
- Winker, D.M.; Tackett, J.; Getzewich, B.; Liu, Z.; Vaughan, M.; Rogers, R. The global 3-D distribution of tropospheric aerosols as characterized by CALIOP. Atmos. Chem. Phys. 2013, 13, 3345–3361. [Google Scholar] [CrossRef] [Scilit]
- Illingworth, A.J.; Barker, H.; Beljaars, A.; Ceccaldi, M.; Chepfer, H.; Clerbaux, N.; Cole, J.; Delanoë, J.; Domenech, C.; Donovan, D.P.; et al. The EarthCARE satellite: The next step forward in global measurements of clouds, aerosols, precipitation, and radiation. Bull. Am. Meteorol. Soc. 2015, 96, 1311–1332. [Google Scholar] [CrossRef] [Scilit]
- Krotkov, N.A.; Carn, S.A.; Krueger, A.J.; Bhartia, P.K.; Yang, K. Band residual difference algorithm for retrieval of SO2 from the aura ozone monitoring instrument (OMI). IEEE Trans. Geosci. Remote Sens. 2006, 44, 1259–1266. [Google Scholar] [CrossRef] [Scilit]
- Ruyneau de Saint-George, P.; Boichu, M.; Bonnat, J.; Grandin, R.; Goloub, P.; Mathurin, T.; Pascal, N. Record growth of stratospheric aerosols from 2019 Raikoke eruption with sulfate-coating of submicronic ash. Sci. Rep. 2026, 16, 27697. [Google Scholar] [CrossRef] [Scilit]
- Romahn, F.; Pedergnana, M.; Loyola, D.; Apituley, A.; Sneep, M.; Veefkind, J.P. Sentinel-5 Precursor/TROPOMI Level 2 Product User Manual Sulphur Dioxide SO2. 2022. Available online: https://sentinels.copernicus.eu/documents/247904/2474726/Sentinel-5P-Level-2-Product-User-Manual-Nitrogen-Dioxide.pdf (accessed on 27 July 2026).
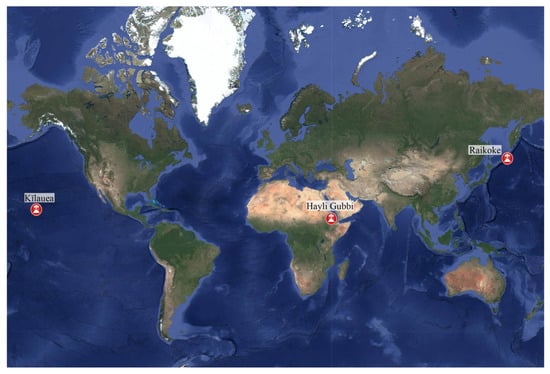
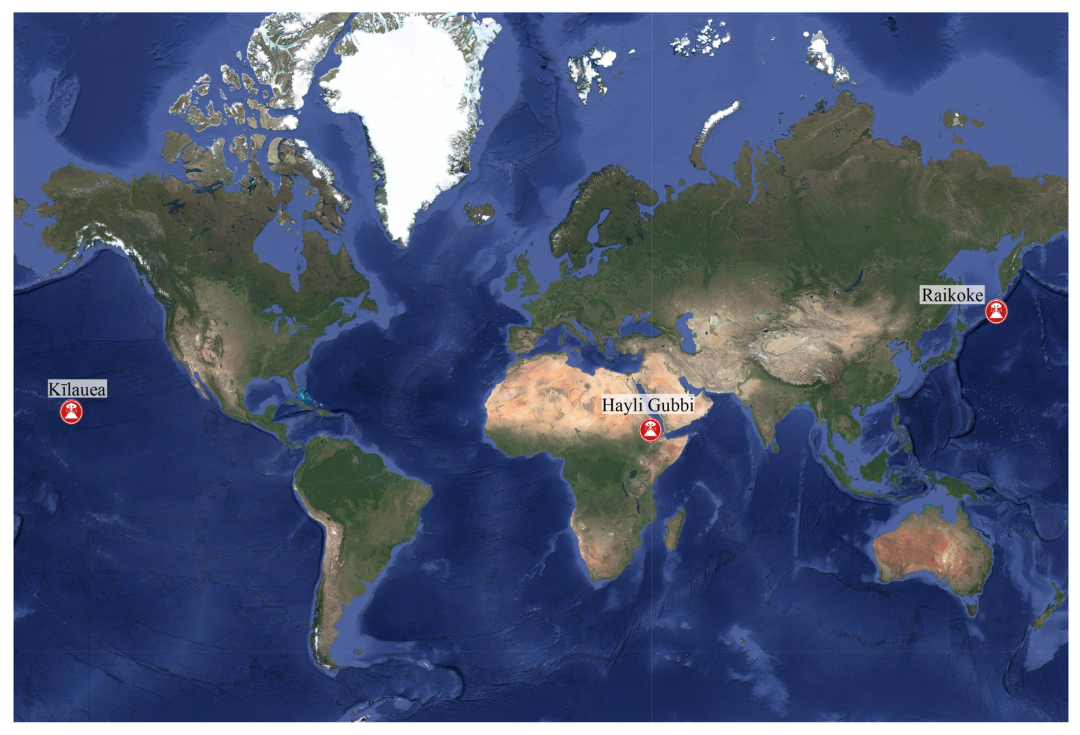
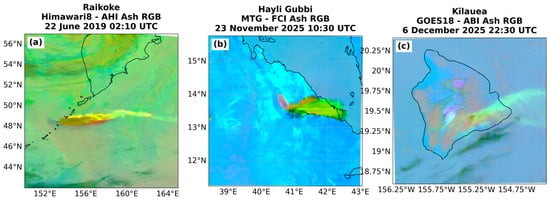
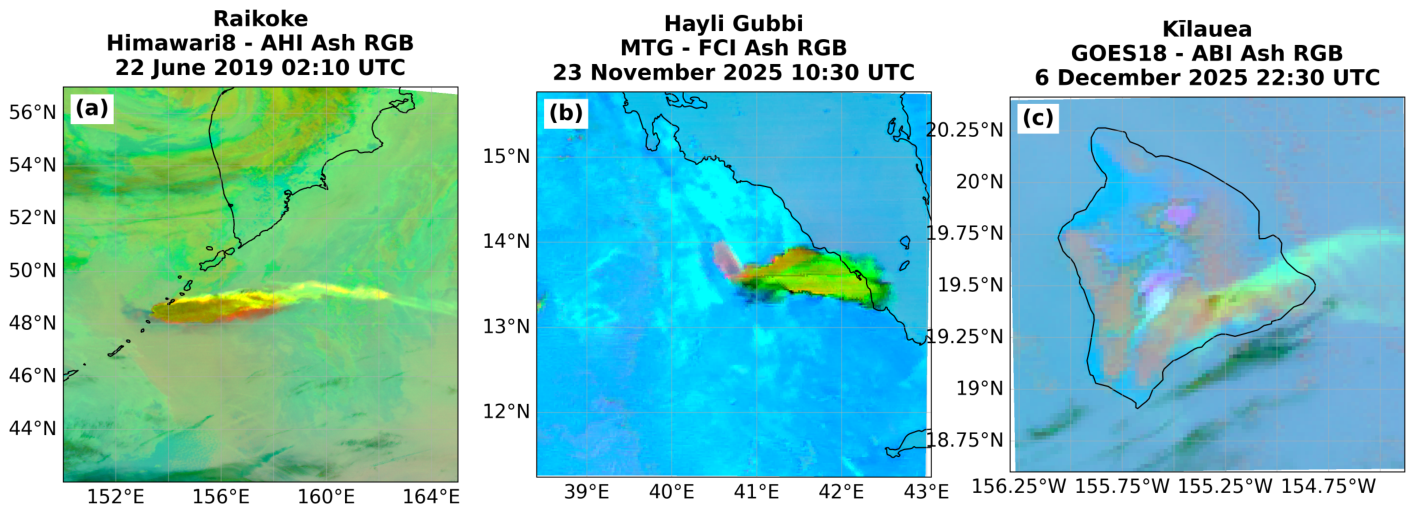
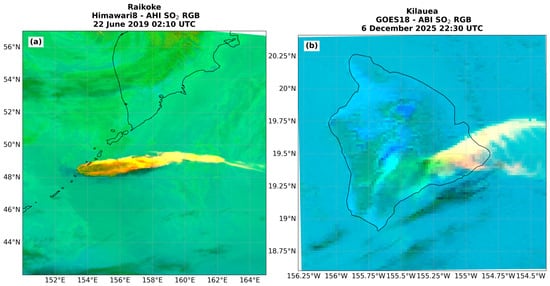
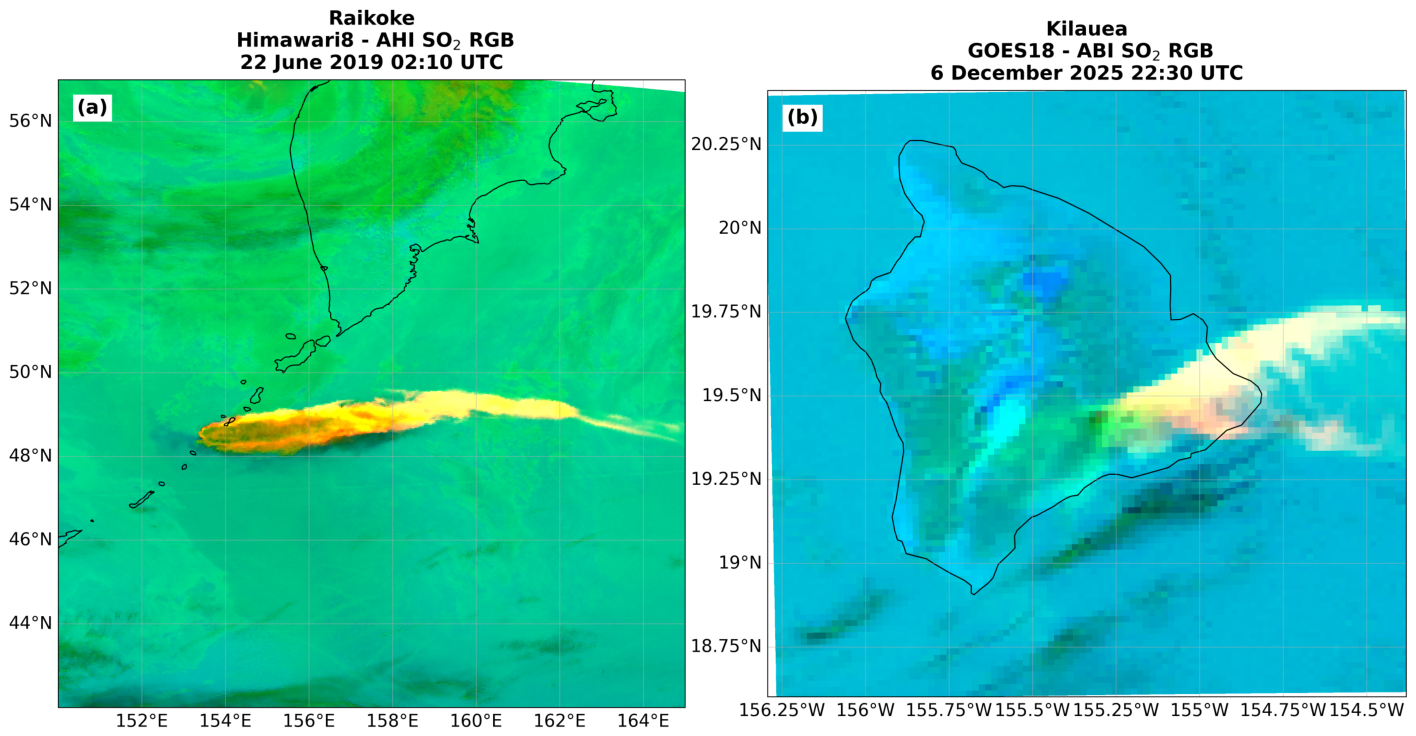
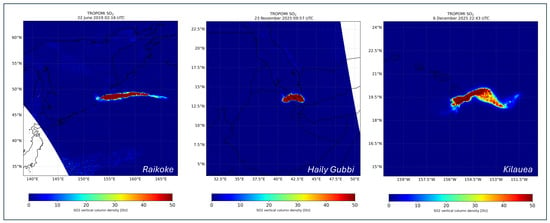
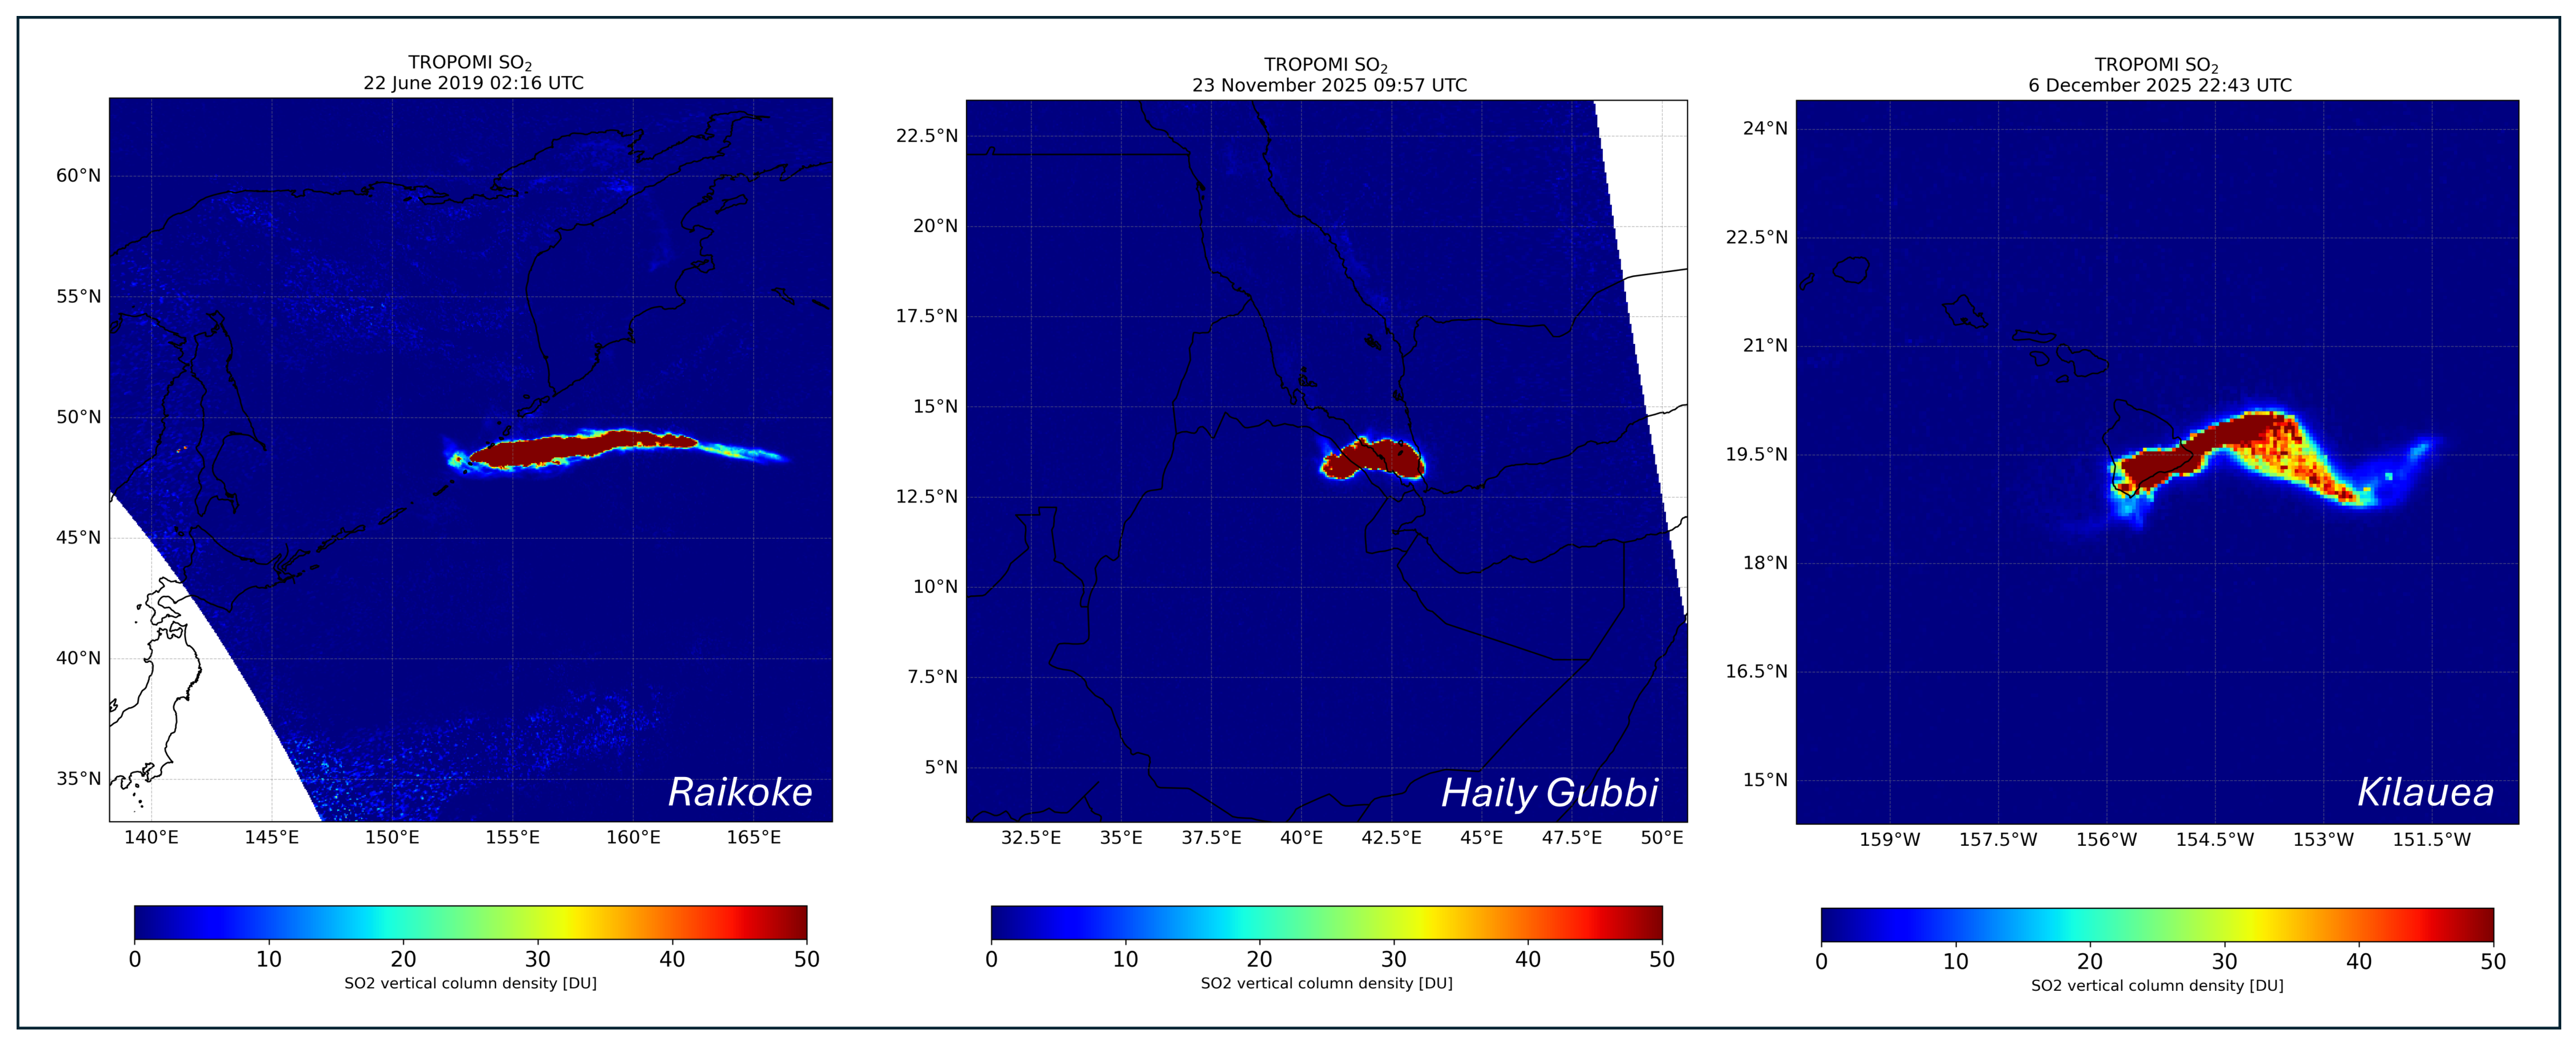
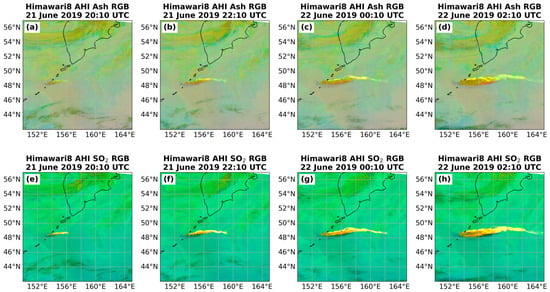
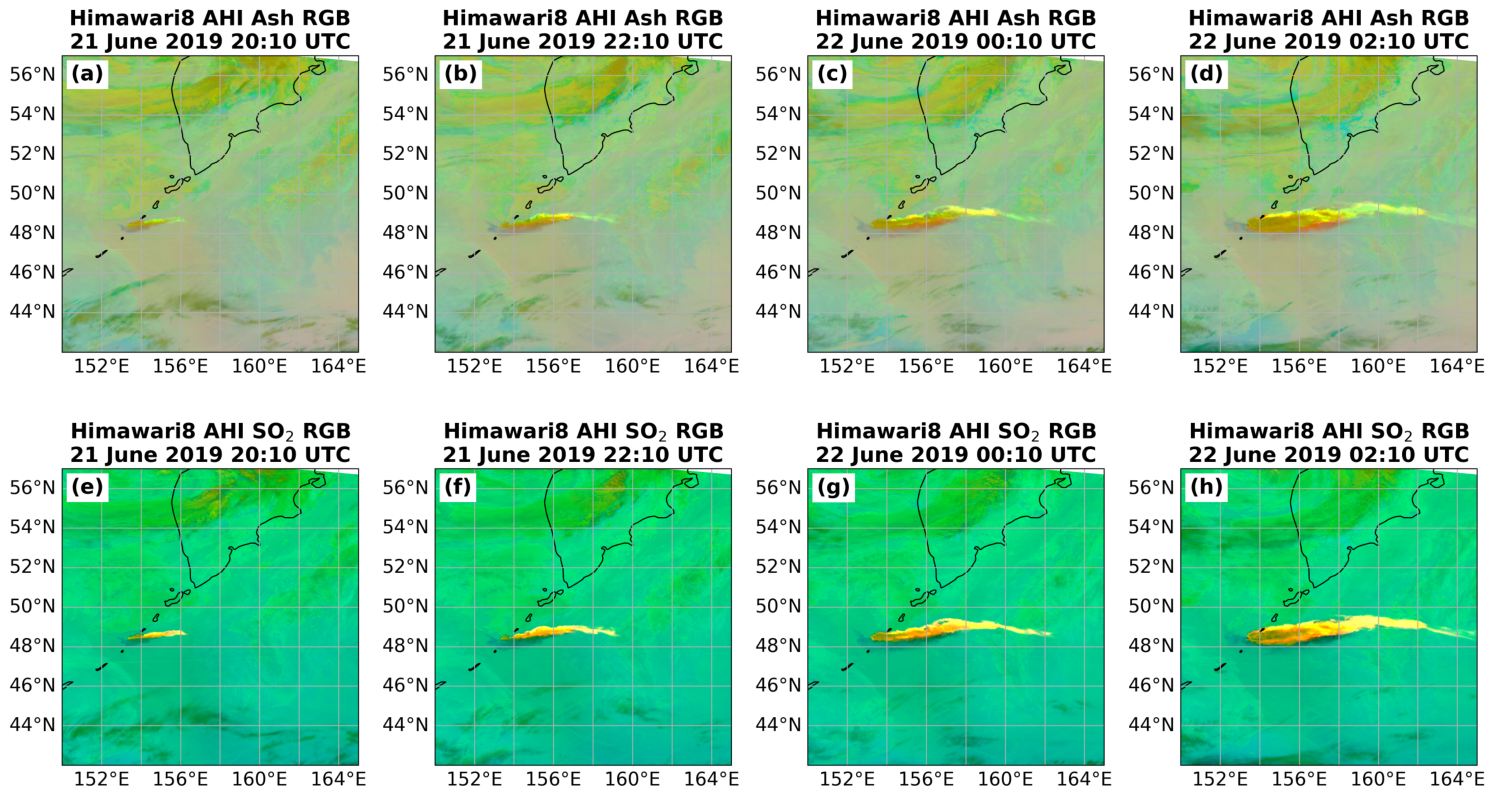
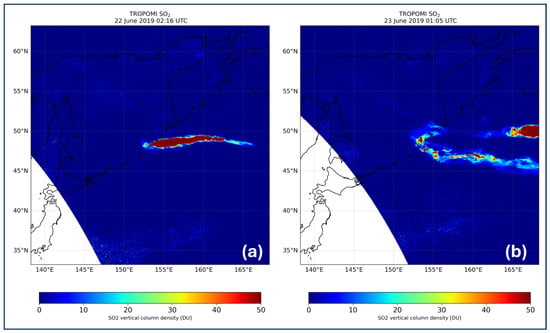
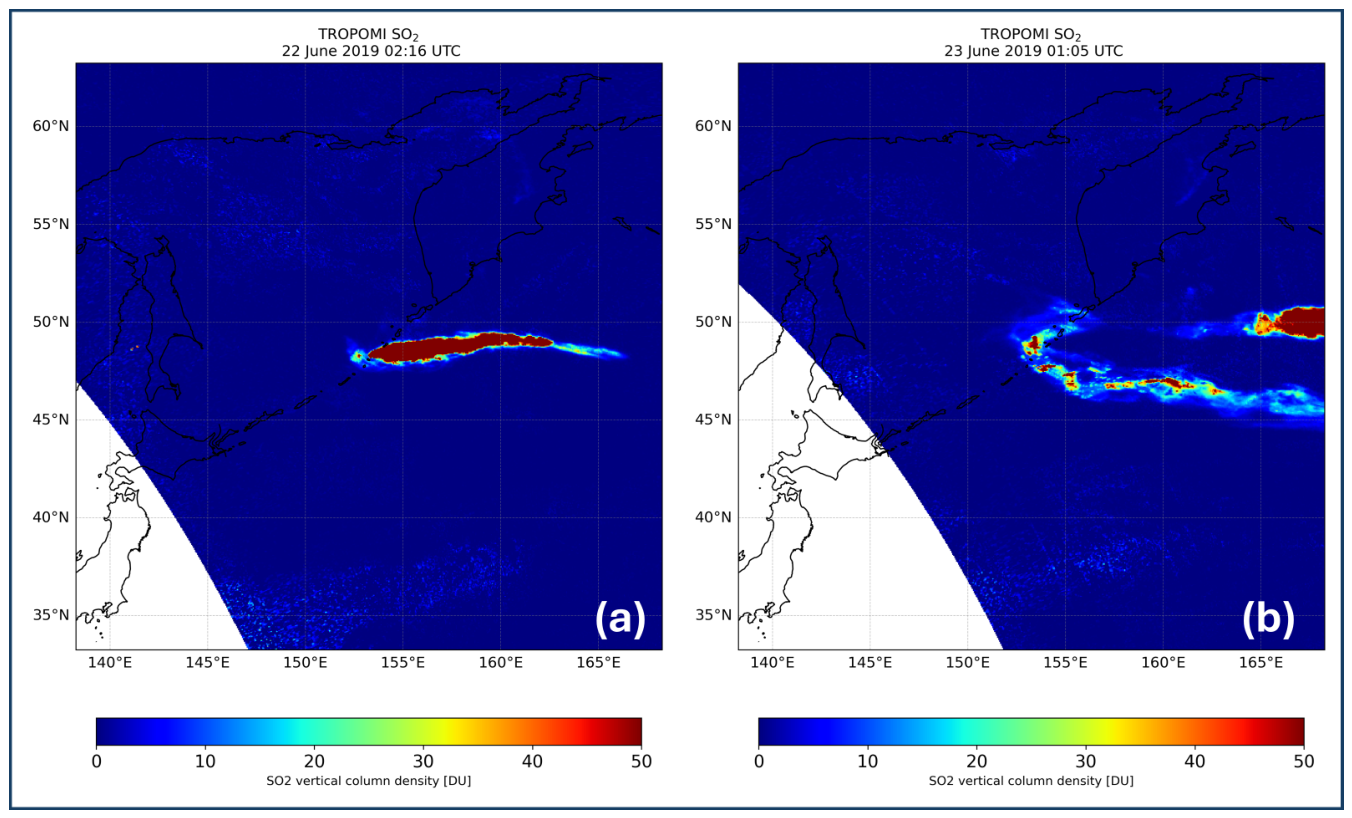
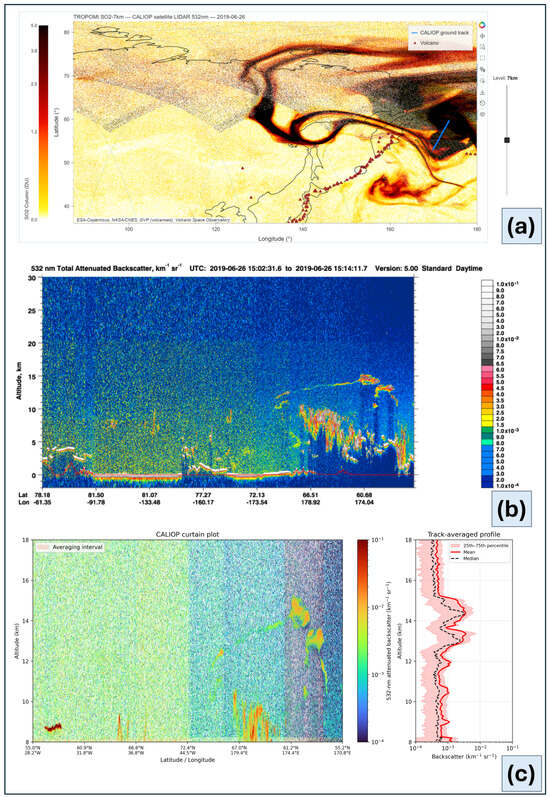
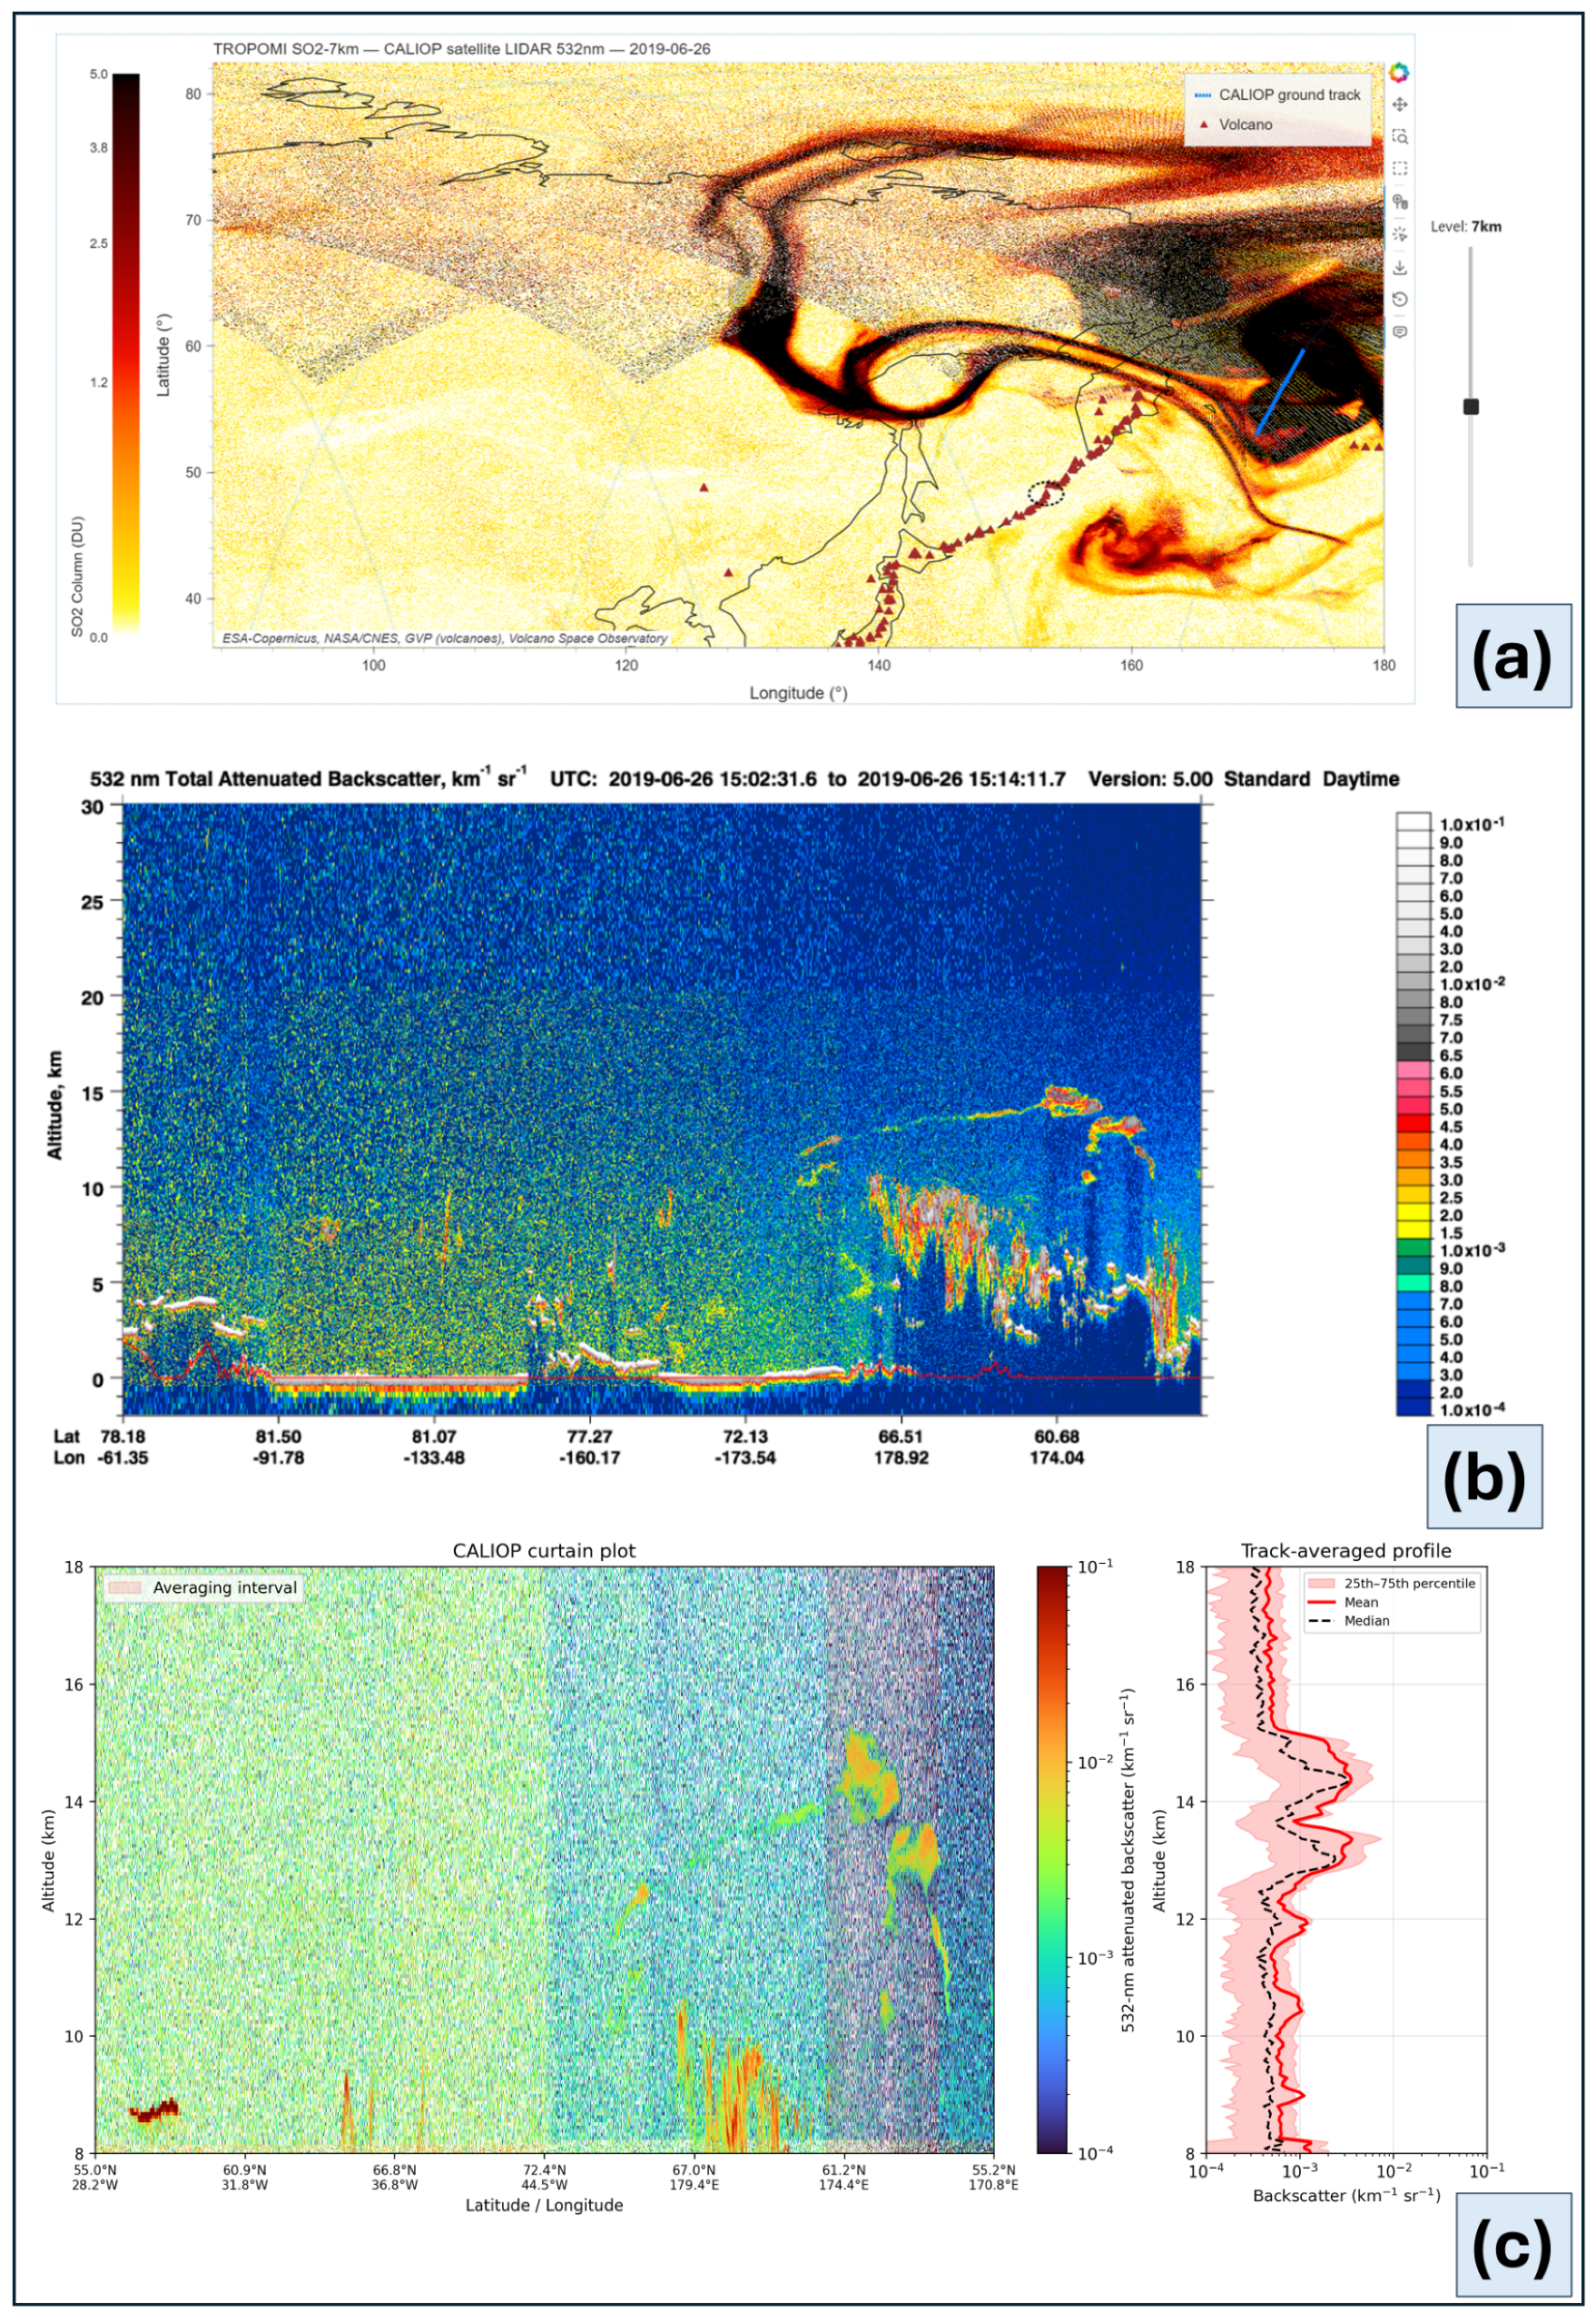
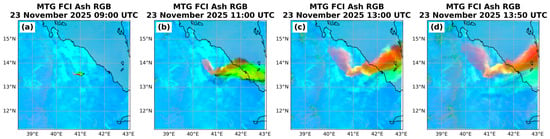
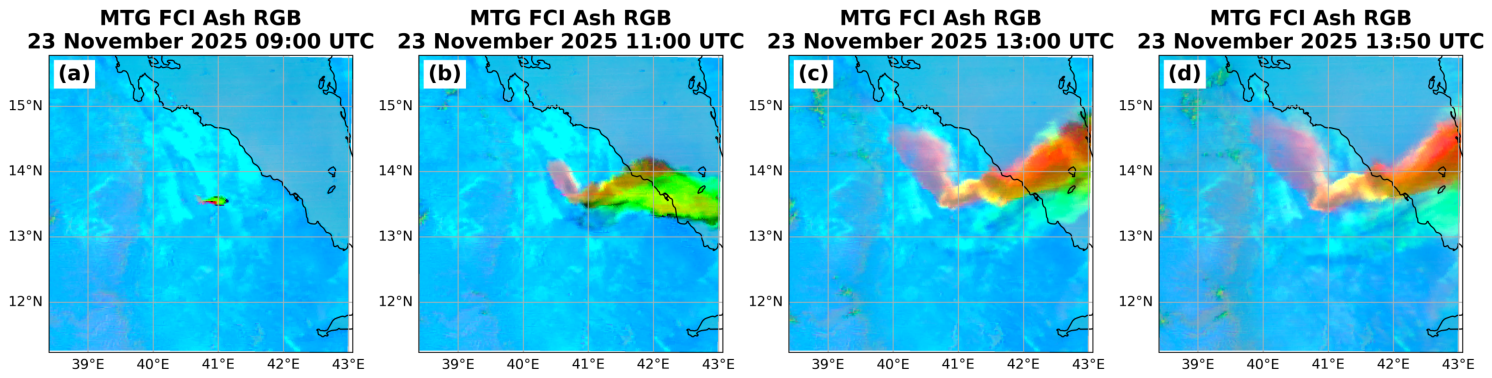
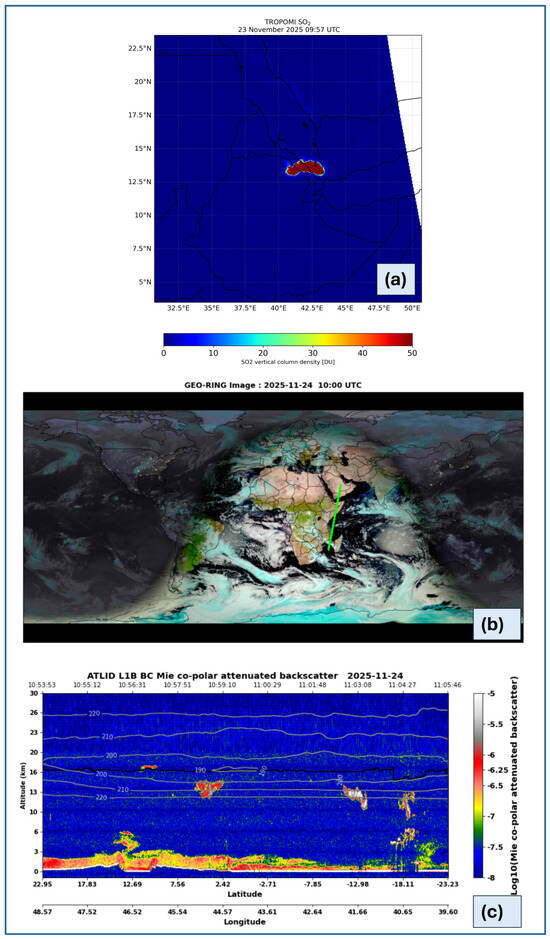
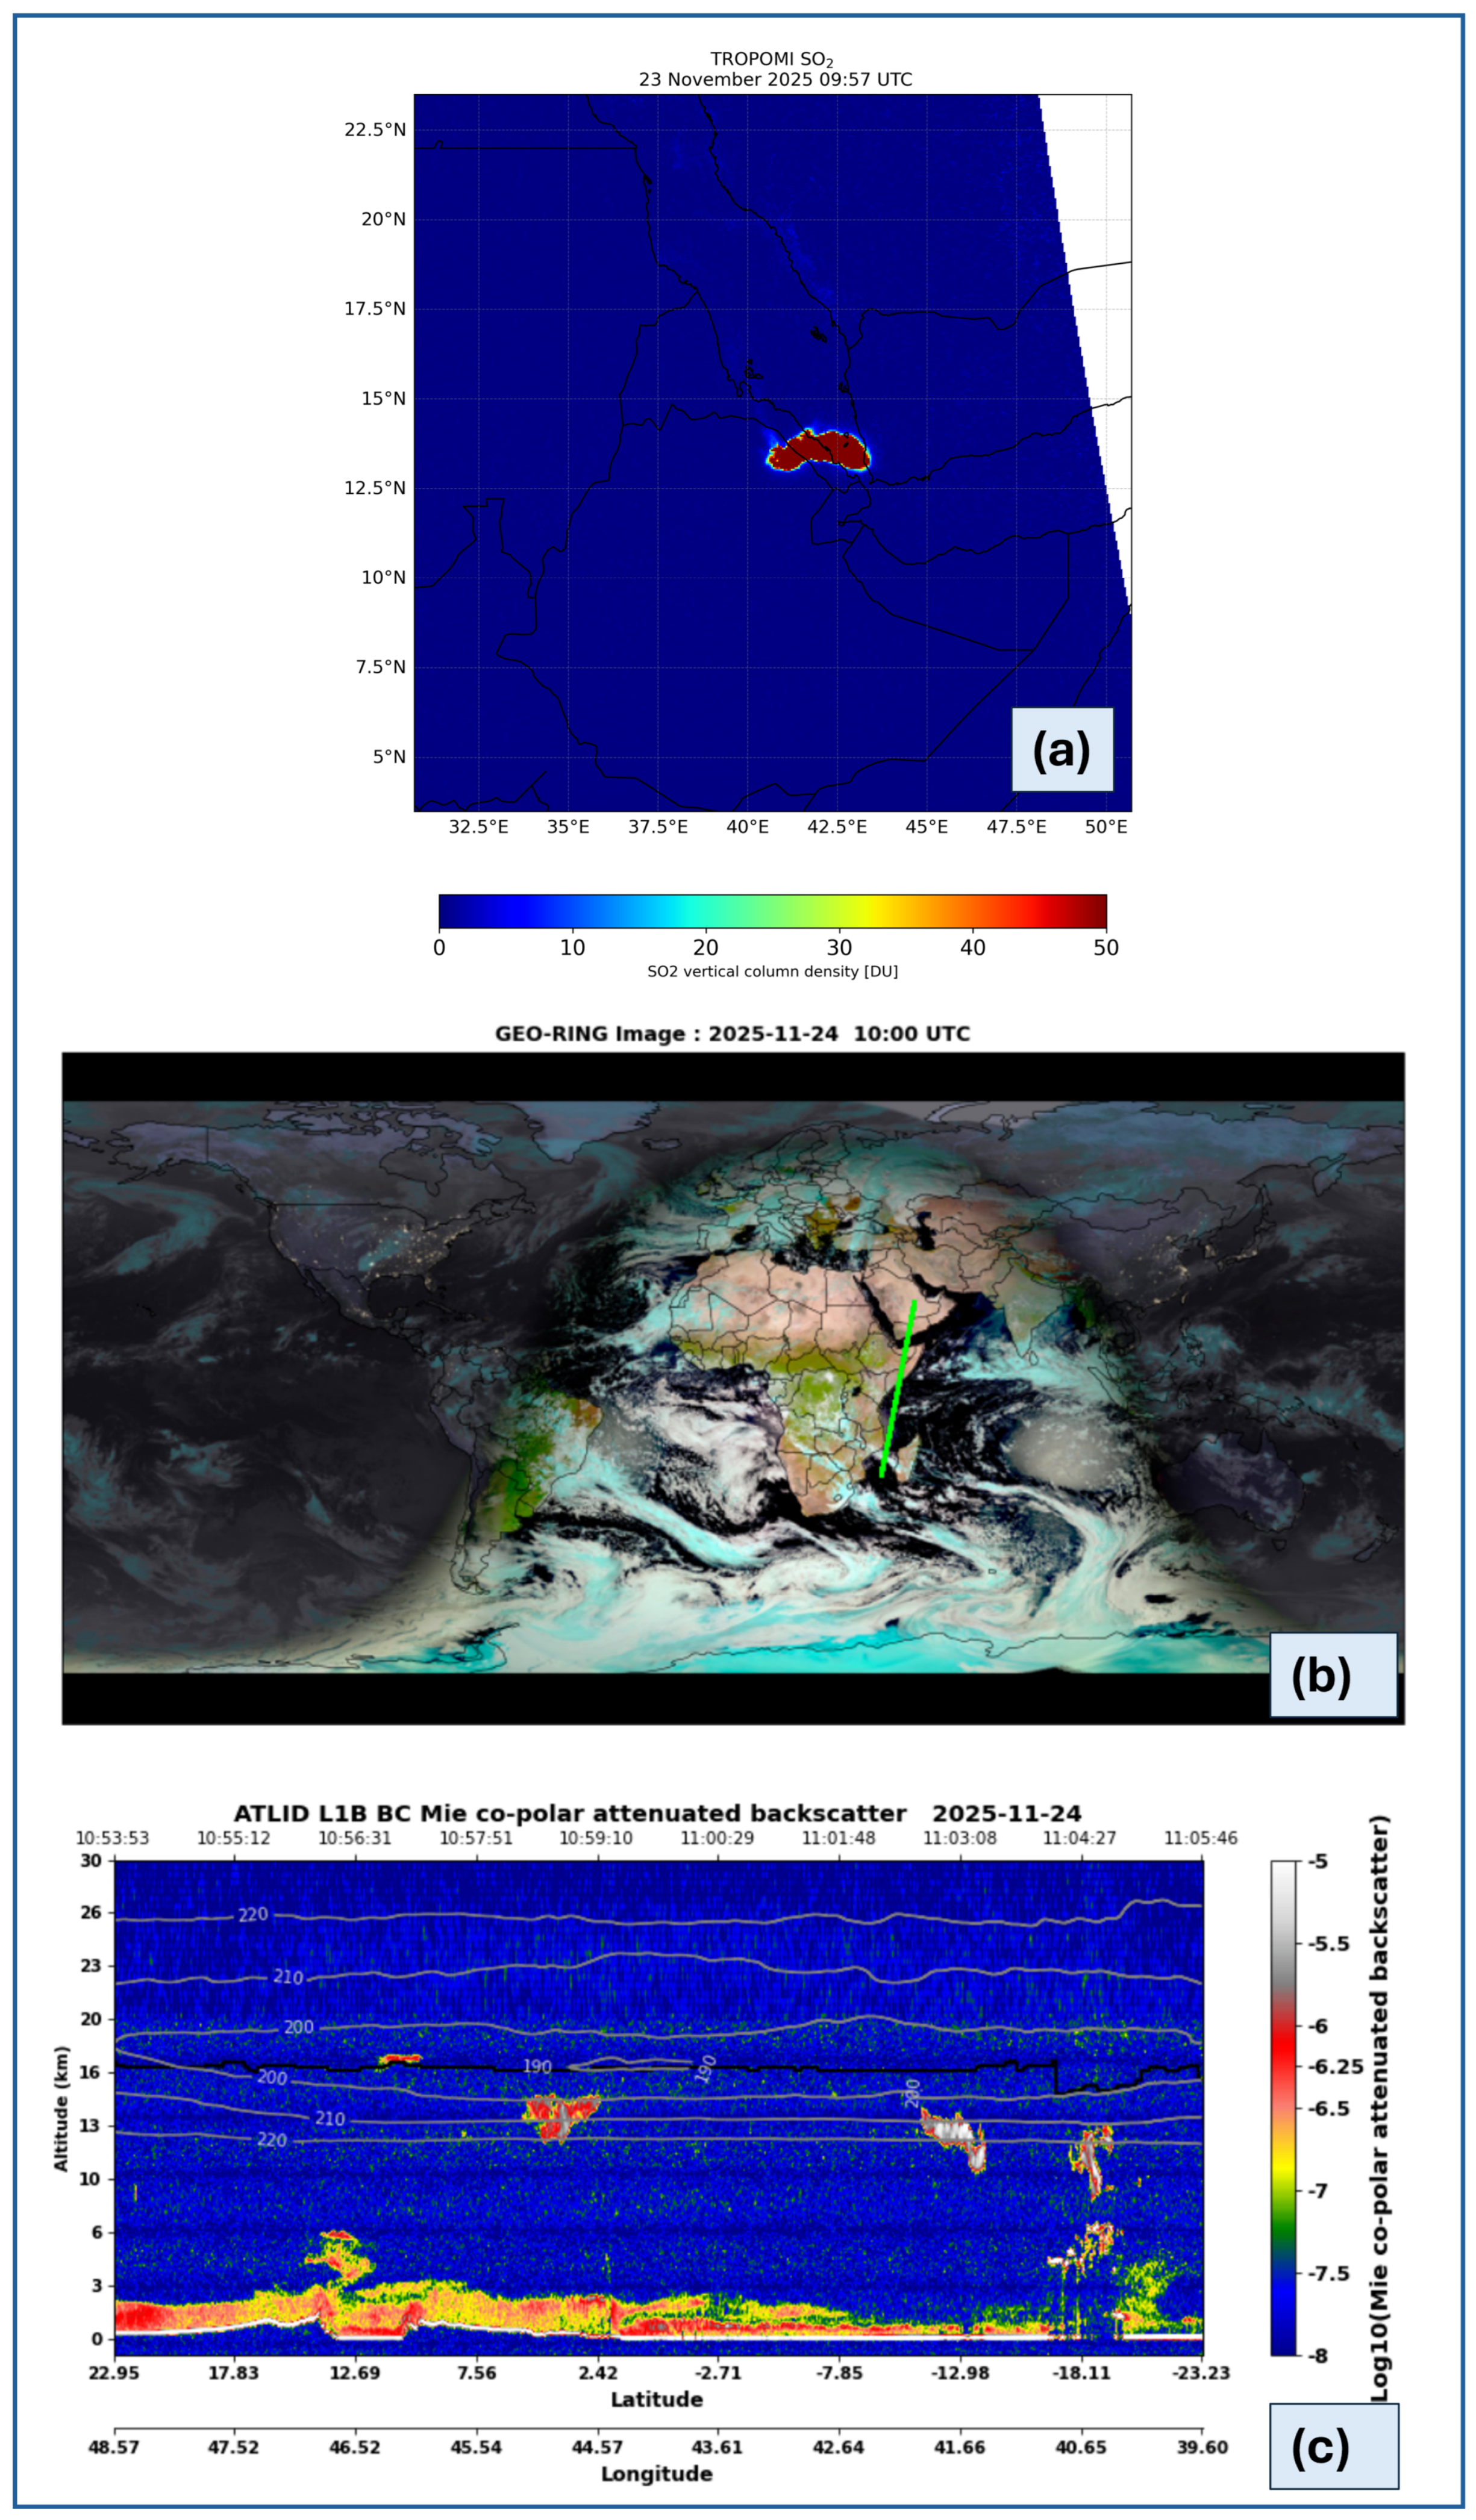
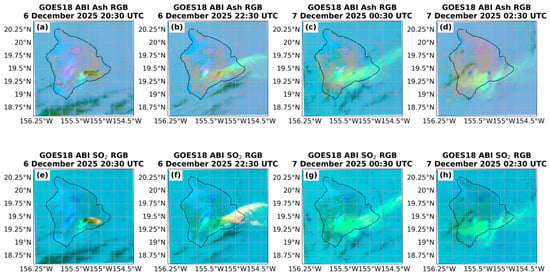
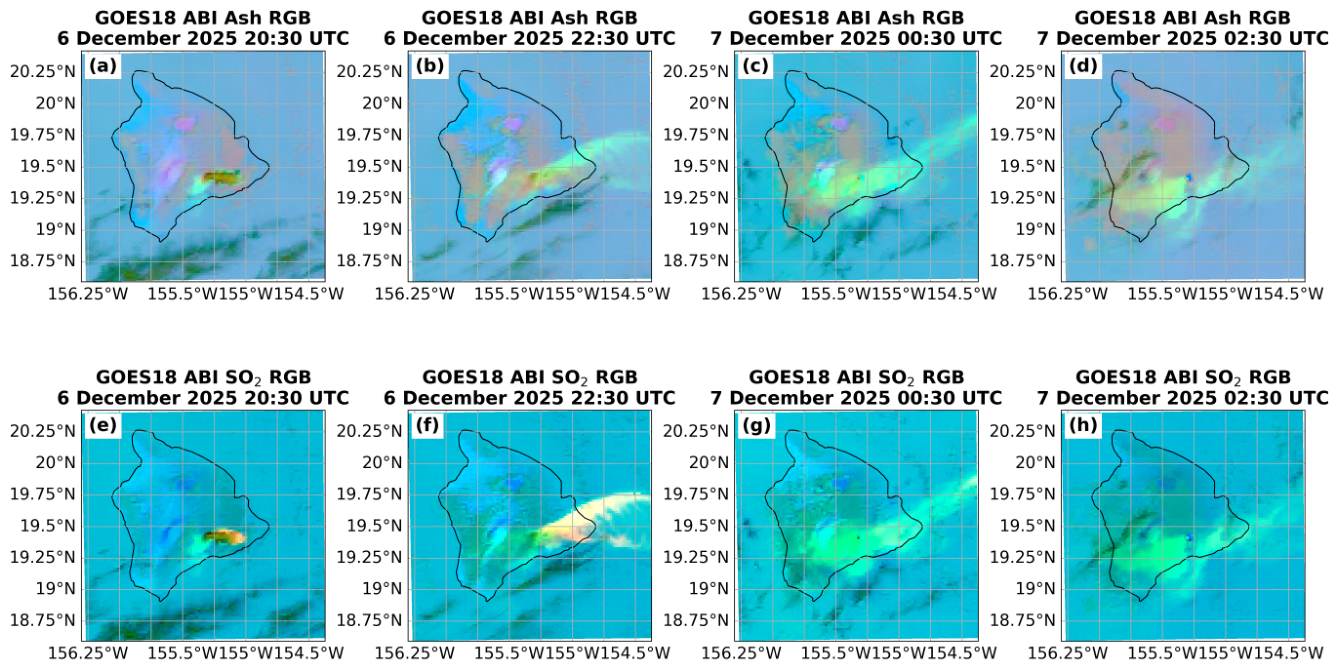
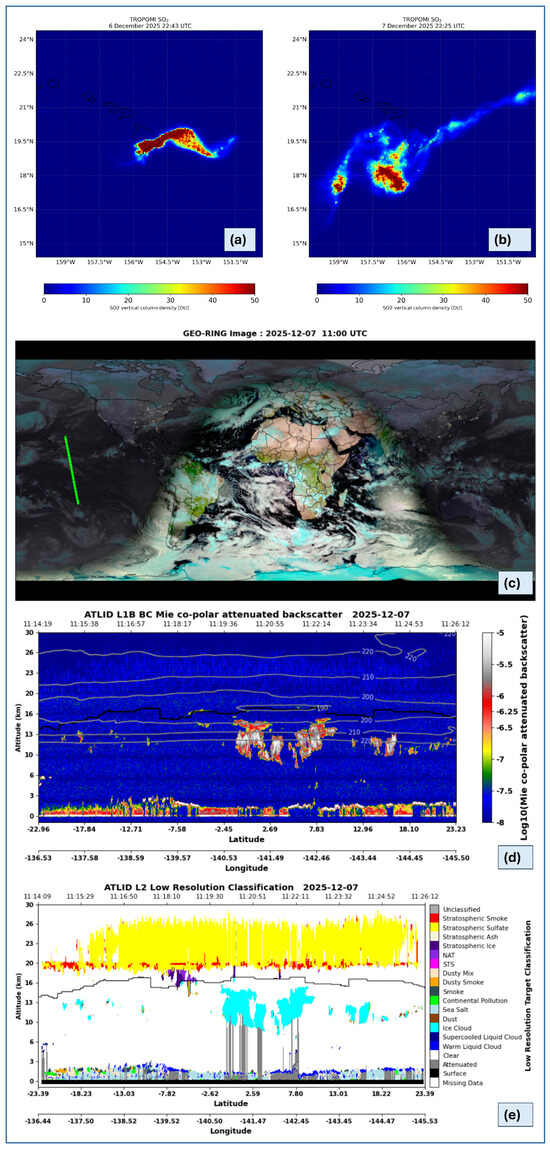
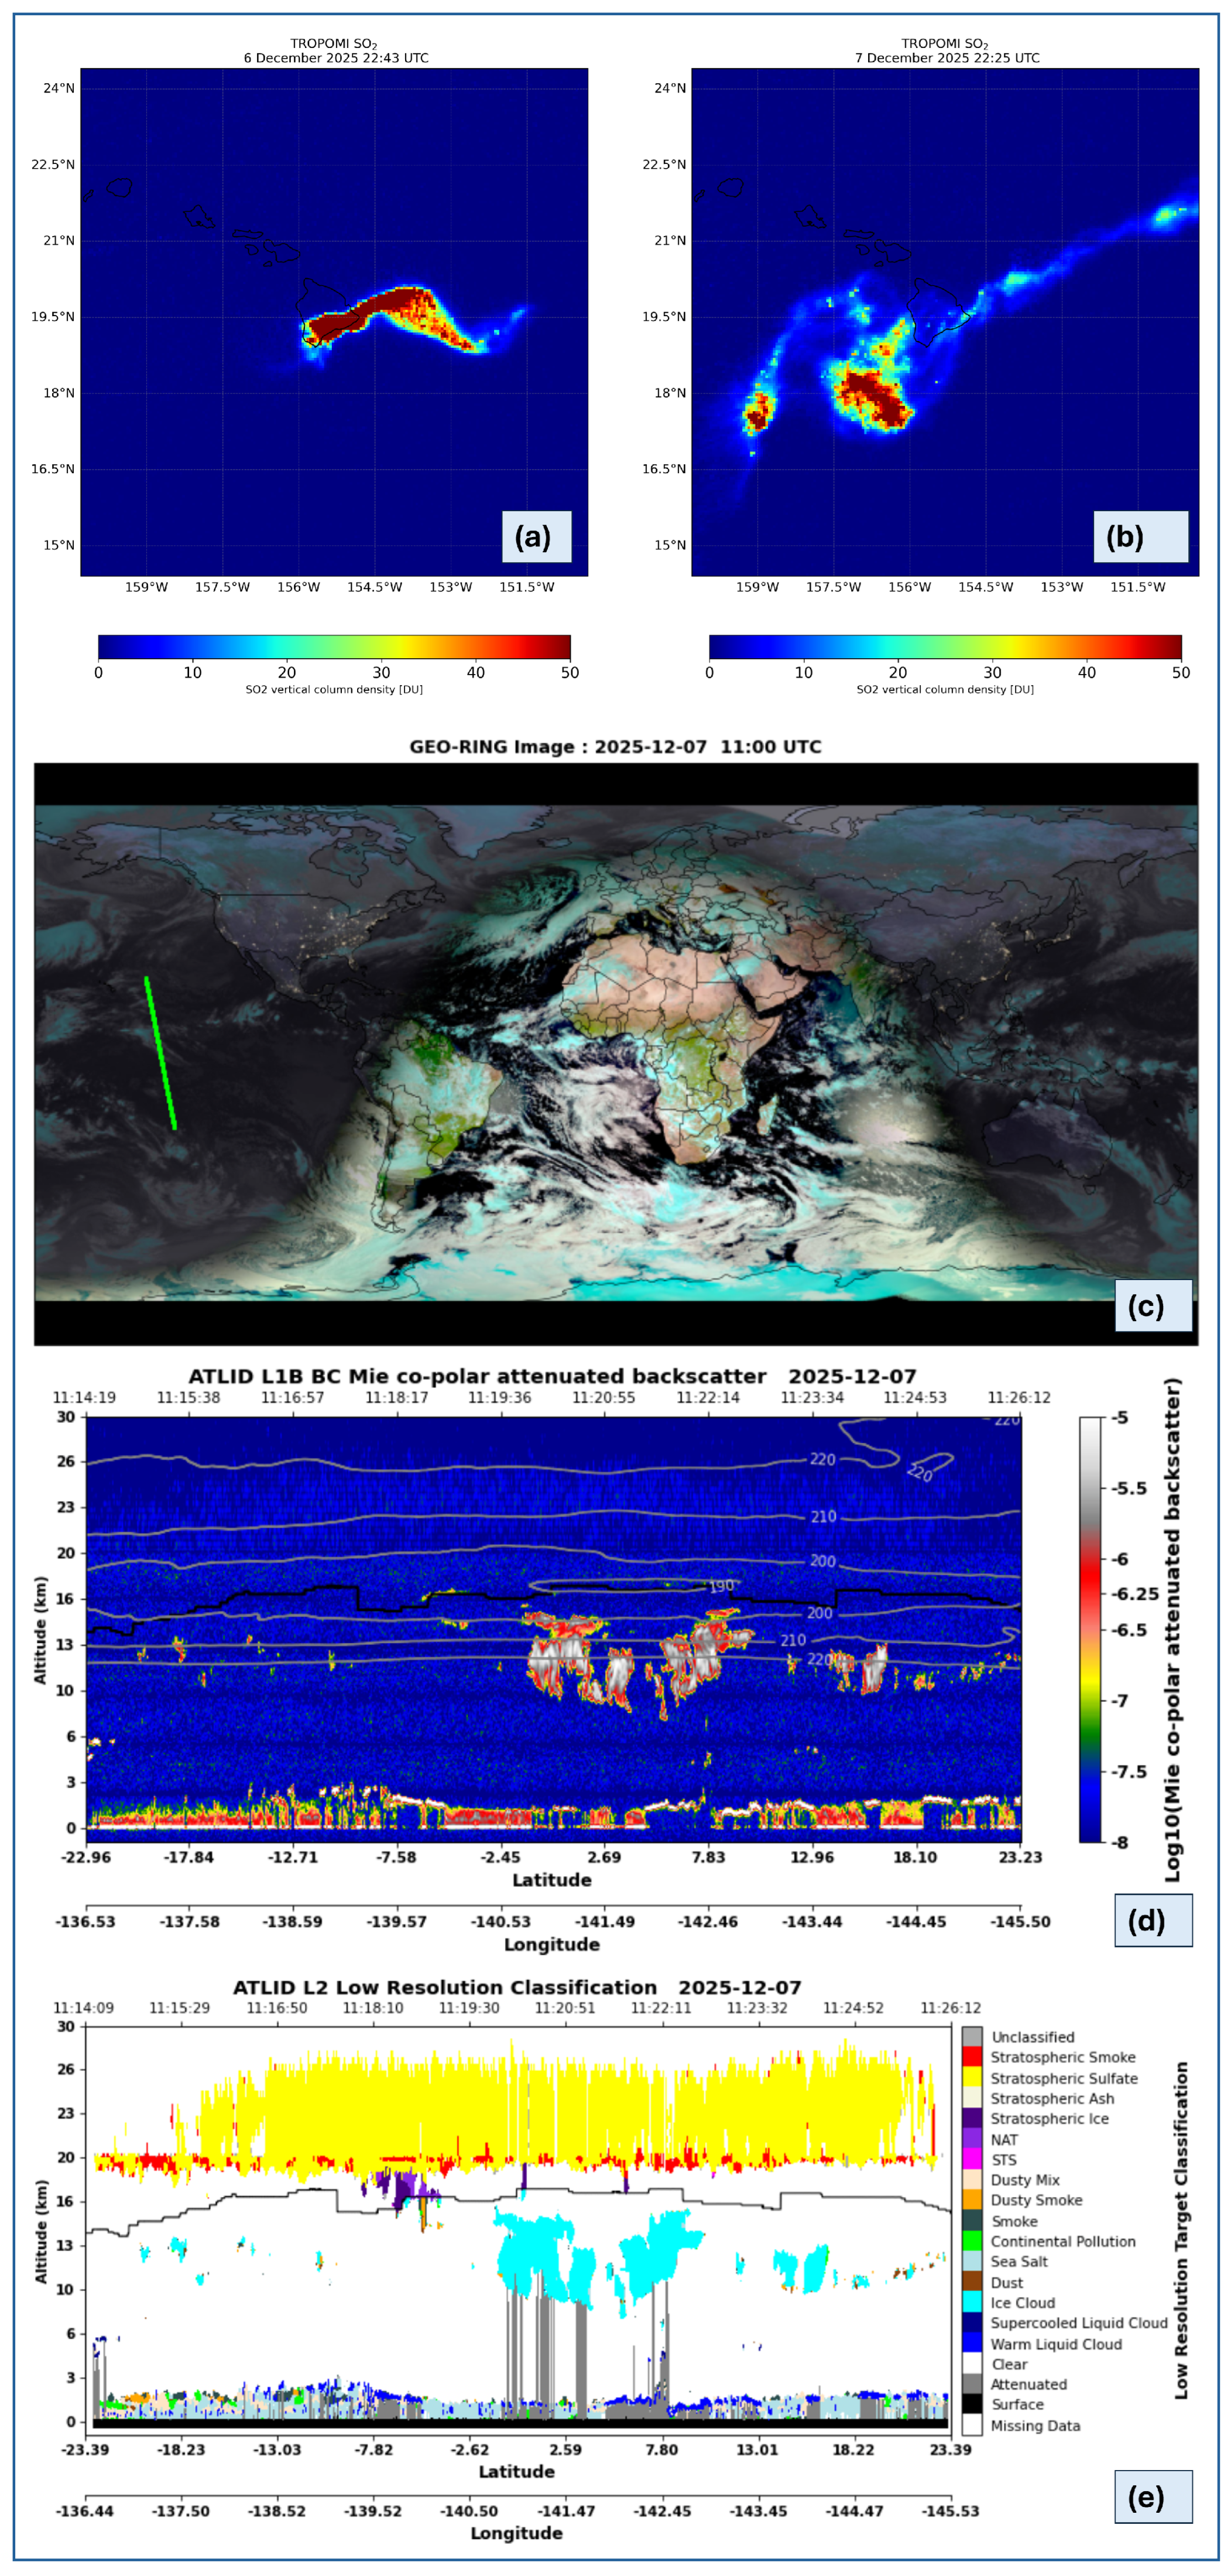

Disclaimer/Publisher’s Note: The statements, opinions and data contained in all publications are solely those of the individual author(s) and contributor(s) and not of MDPI and/or the editor(s). MDPI and/or the editor(s) disclaim responsibility for any injury to people or property resulting from any ideas, methods, instructions or products referred to in the content. |
© 2026 by the authors. Licensee MDPI, Basel, Switzerland. This article is an open access article distributed under the terms and conditions of the Creative Commons Attribution (CC BY) license.