


Highlights
What are the main findings?
- GNSS/GPS provides the highest accuracy relative to radiosonde measurements, used as the reference, for Precipitable Water Vapor (PWV) retrieval, outperforming six other remote sensing instruments with the lowest RMSE (1.5 mm).
- While all satellite and ground-based sensors analyzed maintain high correlation (R2 ≥ 0.904), our site’s Microwave Radiometer exhibits a pronounced systematic dry bias (−5.55 mm), highlighting the importance of site-specific calibration needs to improve retrieval performance.
What are the implications of the main findings?
- GPS measurements offer a highly robust, reliable benchmark to improve the calibration of satellite sensors and enhance the accuracy of Numerical Weather Prediction (NWP) models.
- It is essential to develop and apply instrument-specific calibration factors to successfully align diverse remote sensing datasets with in-situ radiosonde observations.
Abstract
Atmospheric water vapor is a major driver of Earth’s climate, yet despite its vital role in driving extreme weather and informing Numerical Weather Prediction (NWP) models, precise quantification of Precipitable Water Vapor (PWV) remains a challenge due to its high spatial and temporal variability. To provide an upgraded evaluation reflecting the most recent data and next-generation instrumentation, this study evaluates the accuracy, relative to radiosonde measurements, in calculating PWV values across six different instruments: Microwave Radiometer (MWR), NOAA-21, TROPOMI, Pandora spectrometer, AERONET sun-photometer, and GNSS/GPS against the bias-corrected Vaisala RS-92 and RS-41 radiosondes over Beltsville, Maryland, utilizing an updated 2024–2025 database. As a certified GRUAN site, HUBC adheres to strict international observation standards designed specifically to provide reference-quality data and comprehensive corrections for systematic errors. This rigorous framework justifies their application as the definitive ‘referent truth’ benchmark for remote sensing validation. RMSE and bias were the primary metrics used to assess relative accuracy. GPS measurements provided the highest level of relative accuracy, yielding the lowest RMSE (1.50 mm) and a near-unity linear fit (y = 0.98x). NOAA-21 and TROPOMI exhibit higher random noise when compared to ground-based instrumentation, yet both obtain high relative accuracy retrievals with negligible biases. AERONET and Pandora also showed strong performance with low RMSEs and R2 values of 0.986 and 0.988, respectively, while slightly underestimating PWV. In contrast, the Radiometer performed with the lowest relative accuracy, characterized by the highest RMSE (6.19 mm) and a significant negative bias (−5.55 mm). Although all instruments maintained high correlation coefficients (R2 ≥ 0.904), these results indicate that satellite and ground-based remote sensing provide reliable PWV retrievals, while GPS presents the most robust benchmark for high-accuracy PWV retrievals relative to radiosonde measurements. The findings also underscore the need for instrument-specific calibration constants to better align remote sensing retrievals with in situ observations.
1. Introduction
Measuring the distribution and variability of atmospheric water vapor represents one of the most important yet challenging aspects of atmospheric science. As the primary greenhouse gas, water vapor alone accounts for a substantial portion, about 50%, of Earth’s warming [1] and up to 77% of the total natural greenhouse effect (note that the natural greenhouse effect and increased warming are two separate phenomena) when combined with cloud effects [2]. Water vapor is highly dynamic in the atmosphere, reaching up to 4 to 5% by volume in the tropics while becoming extremely low in cold and dry regions such as the upper atmosphere and polar areas [3,4]. It also amplifies the warming initiated by other greenhouse gases [5]. Beyond its role in radiative forcing, the total precipitable water vapor column (PWV), that is, the amount of water that would accumulate on the ground if all the water vapor in the column were to precipitate, measured in mm of H2O, where 1 kg/m2 equates to 1 mm, serves as a reservoir of latent heat. The higher the PWV, the higher the energy contained in the atmosphere. This energy is released during condensation and drives storms, especially over land, and escalates the severity of extreme weather [5].
Its proper quantification is of extreme importance for two main reasons. First, the spatial and temporal variability of water vapor strongly influences the thermodynamic structure of the Planetary Boundary Layer (PBL) and the initiation of moist convection. Small-scale moisture heterogeneity within and above the convective boundary layer can determine whether air parcels reach convective instability [6]. Second, PWV provides valuable information for Numerical Weather Prediction (NWP) models by improving the representation of the total atmospheric moisture content, particularly when detailed humidity profile information is limited. Accurate PWV observations can contribute to improved Quantitative Precipitation Forecasts (QPF), especially during extreme weather events. Despite its importance, measuring atmospheric water vapor with high precision remains a challenge due to its extreme variability in space and time.
Historically, radiosondes have been treated as “the referent truth” for vertical profiling due to their in situ sampling of atmospheric properties. However, the launching of radiosondes has its limitations. To address these limitations, a variety of ground-based remote sensing instruments have been deployed, including microwave radiometers (MWR), sun photometers, spectrometers, Global Navigation Satellite Systems (GNSS), and orbiting satellites, among others. Several intercomparison studies between these instruments and radiosondes have been performed globally to evaluate their reliability across different climatic environments [7]. For instance, evaluations at global atmospheric monitoring sites have demonstrated that while ground-based tools like sun photometers and microwave radiometers capture seasonal trends well, their relative performance is highly sensitive to the total water vapor loading of the specific region [7]. Long-term assessments across diverse geographical regions have also shown that GNSS-derived PWV serves as a highly robust alternative to traditional sounding networks, although systematic biases often fluctuate depending on the specific processing algorithms employed [8]. While these historical intercomparison studies have established baseline instrument performance, recent years have seen major advancements in data processing and observation capabilities, such as GNSS architectures that exploit multi-constellation networks, alongside next-generation satellite platforms. Each of these instruments brings unique strengths and advantages when retrieving PWV values. However, they also introduce their own uncertainties and biases. To present a necessary upgrade to previous evaluations, the primary objective of this study is to evaluate the accuracy of multiple PWV measuring instruments by utilizing a newly updated 2024–2025 database against measurements obtained by bias-corrected Vaisala RS-92 (30% of launches) and RS-41 (70% of launches) radiosondes over the sky of Beltsville, Maryland, during the 2024 and 2025 study period. Through this analysis we aim to identify systematic biases inherent to each instrument and provide recommendations on their suitability for different research applications.
2. Materials and Methods
2.1. Study Site: Howard University Beltsville Campus
The primary observational site of this study is the atmospheric station located at Howard University’s Beltsville Campus (HUBC; 39.05°N, 76.88°W; 52 m) in the state of Maryland. HUBC is situated in a rural-suburban zone within the Washington D.C-Baltimore Corridor, which allows for the characterization of atmospheric properties influenced by both urban emissions and regional rural aspects [9].
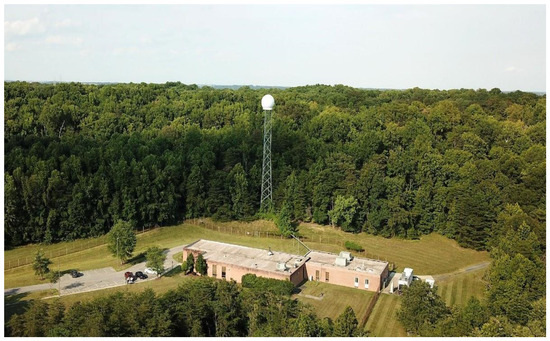
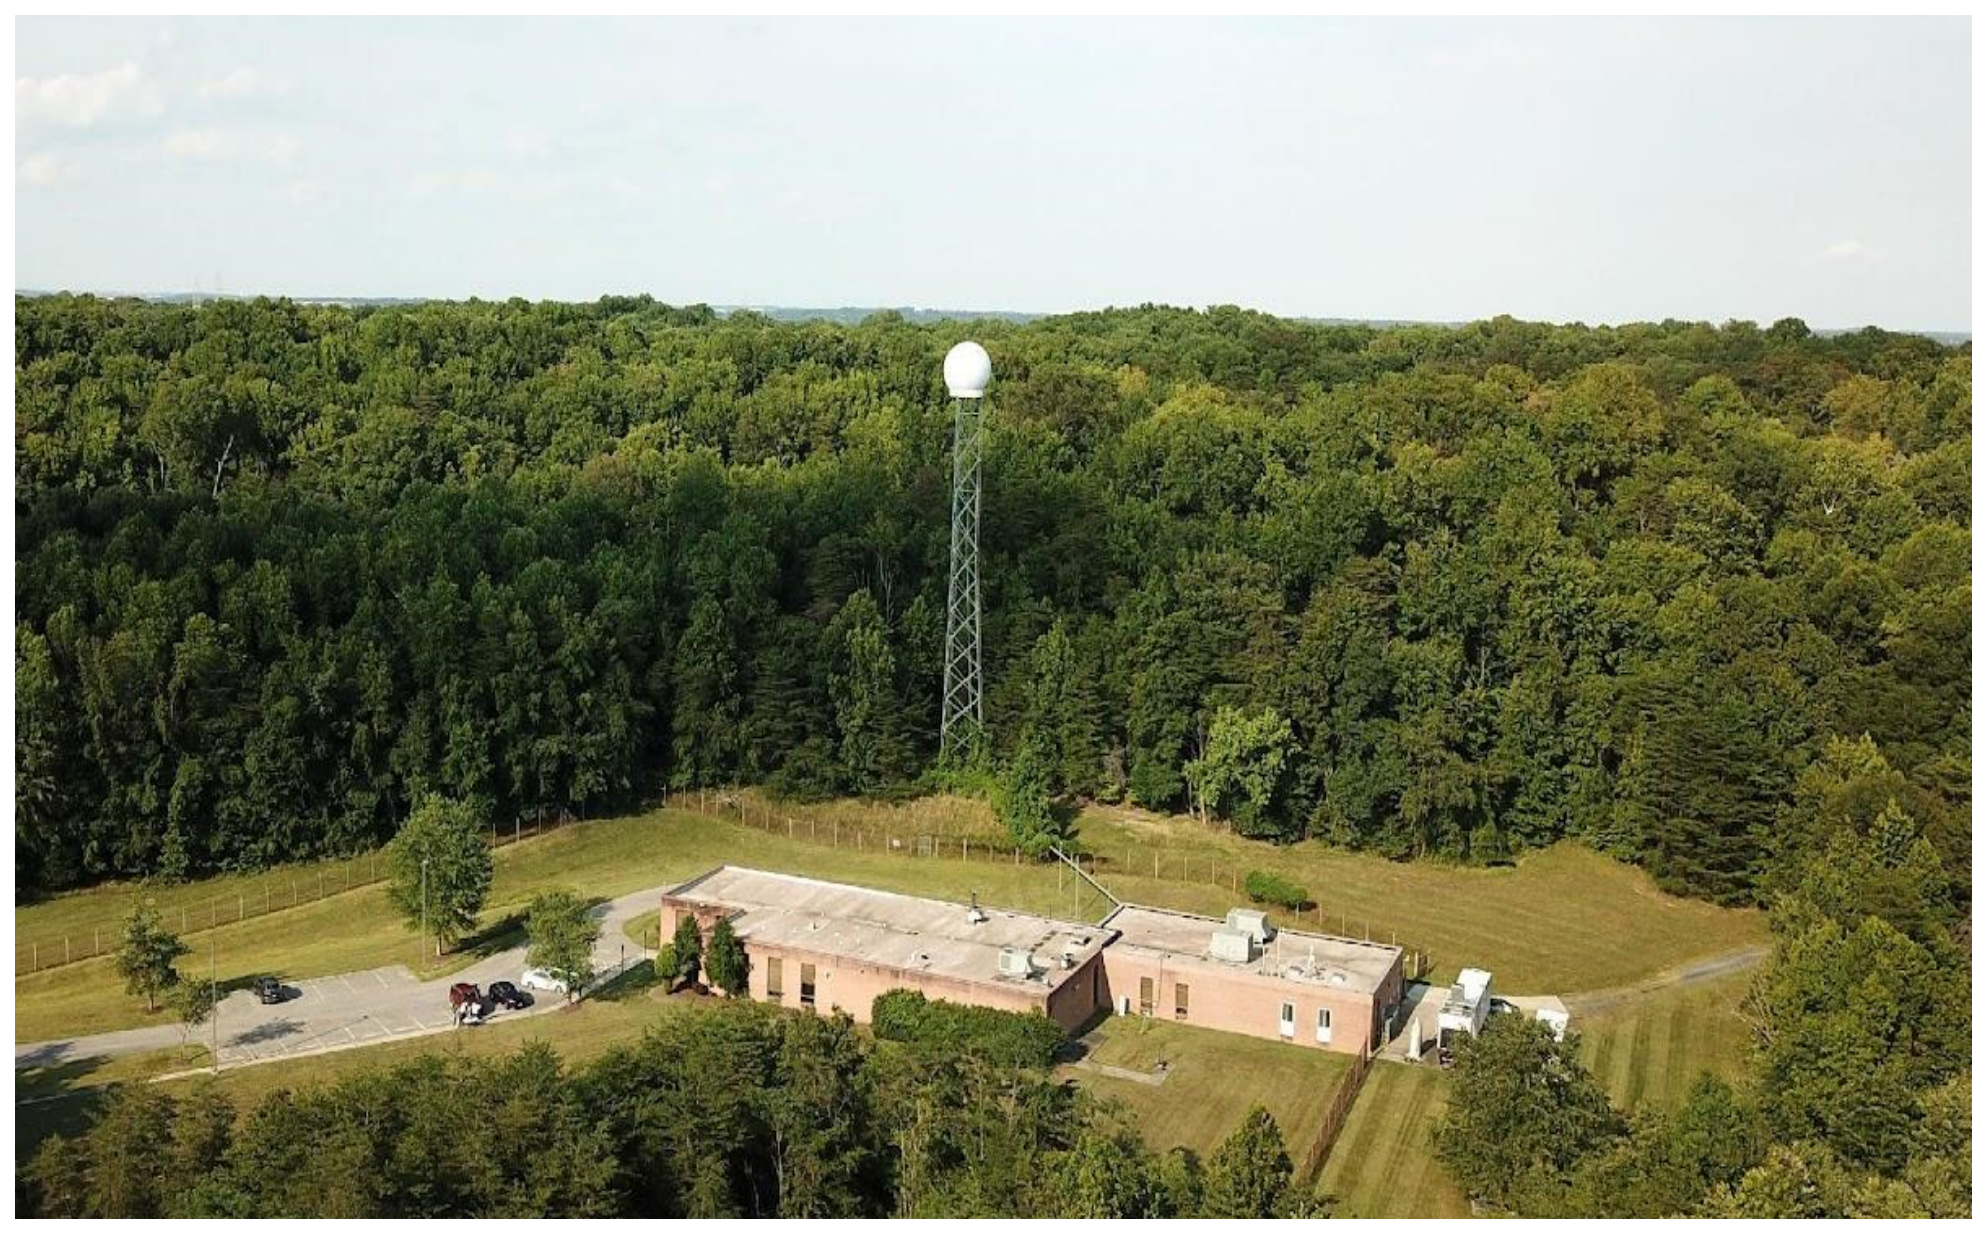
HUBC, shown in Figure 1, is a certified site of the Global Climate Observing System (GCOS) Reference Upper-Air Network (GRUAN). It launches weekly RS-41 radiosondes (Vaisala Oyj, Vantaa, Finland), making it one of the few university-based stations providing continuous tracking of meteorological profiles year-round. The site also hosts a collection of active and passive remote sensing instruments, including Raman lidars, Microwave Radiometers, and Ceilometers, which are constantly monitoring the thermodynamic structure of the Planetary Boundary Layer (PBL) and the atmospheric composition of the total water vapor column [10,11].
Figure 1.
Aerial View—Howard University, Beltsville Campus (HUBC), Maryland, USA.
While the Radiosonde data, along with the Microwave Radiometer (MWR) (Radiometrics Corporation, Boulder, CO, USA), Pandora (SciGlob Instruments and Services, LLC., Elkridge, MD, USA), and the GPS data (GFZ EPOS.P8 Software), come from direct measurements obtained from HUBC, this study also focuses on PWV values retrieved from other instruments situated nearby. The AERONET (AErosol RObotic NETwork) station at NASA, GSFC, located approximately 4 miles northeast of HUBC, provides PWV records derived from Cimel Sun photometry (Cimel Electronique, Paris, France) [12]. This study also focuses on PWV retrievals from two different satellite systems. The NOAA-21 satellite (JPSS-2) utilizes the Cross-Track Infrared Sounder (CrIS) and Advanced Technology Microwave Sounder (ATMS) [13] to retrieve moisture profiles during its daily overpasses over Beltsville, while the European Sentinel-5 Precursor (SP5) hosts TROPOMI, the Tropospheric Monitoring Instrument, which uses imaging spectrometry to derive PWV concentrations in the atmosphere [14].
2.2. Climate Characteristics and Seasonal Drivers
The Beltsville region is situated within a subtropical climate, characterized by hot, humid summers and dry, cold winters [15]. Its strong seasonal PWV variability is driven by the alternation of air masses. High PWV values in spring and summer are due to warm, moist air advected from the Atlantic Ocean and the Gulf of Mexico, and low PWV values are from colder, drier continental polar air masses during fall and winter [16].
Reported PWV maxima for the broader mid-Atlantic/Maryland region are commonly on the order of 45–50 mm during peak warm-season conditions in GNSS-derived climatologies. Typical PWV minima over the region are frequently on the order of 5–15 mm, with the lowest values occurring during colder, more stable periods in winter [17].
2.3. Radiosonde
Since radiosondes continuously touch the air mass being sampled, they will serve as the primary reference against which all PWV retrievals are validated. This allows for the capture of fine vertical profile variations, sharp temperature inversions [18], and PWV values with millimetric precision [19], which remote sensors often smooth out [20], yet despite their accuracy, radiosondes are not without limitations. For example, by the time a radiosonde reaches the upper troposphere, it might have drifted dozens of kilometers away from the launch site [21], creating a spatial mismatch due to the atmosphere’s inhomogeneity when compared to stationary instruments. Overall, its measurements can be constrained by low temporal and spatial resolution, restricted global coverage, and high operational costs [19].
The cumulative uncertainty of radiosonde-derived PWV is governed by two main factors: sensor accuracy and spatial-temporal mismatches caused by flight drift. According to manufacturer specifications [22] and validation campaigns for Vaisala RS92 (Vaisala Oyj, Vantaa, Finland), and RS41 sondes [23], the combined sounding measurement uncertainties (with a coverage factor of k = 2, representing an approximate 95% confidence level) are within ±0.15 °C to 0.3 °C for temperature and ±2% to 4% for relative humidity. These sensor uncertainties yield an integrated column PWV error of approximately 0.5 to 1.0 mm [24]. Additionally, while horizontal wind advection can cause a radiosonde to drift a pronounced distance by the time it reaches the stratosphere, more than 90% of total atmospheric water vapor resides within the planetary boundary layer (typically below 3–4 km) where the balloon drift remains small. Consequently, spatial and temporal mismatches do not introduce a systematic reference bias but rather a small random variance of 0.5 to 1.5 mm to the observed RMSE during station intercomparisons. Together these independent error sources yield an estimated reference uncertainty of approximately 1.0 to 1.8 mm [24], demonstrating that the radiosonde remains a robust baseline for remote sensing validation.
Radiosonde PWV Calculations
As a certified GRUAN site, HUBC adheres to strict international observation standards designed specifically to provide reference-quality data and comprehensive corrections for systematic errors. This rigorous framework justifies their application as the definitive ‘referent truth’ benchmark for remote sensing validation. HUBC primarily utilizes the Vaisala RS-41SGP radiosonde; however, during times of Intensive Observational Periods (IOPs), it supplements part of its operations with its predecessor, Vaisala RS-92. For this study, a total of 179 radiosonde flights were performed between Jan 2024 and Dec 2025, both during early afternoon and midnight hours; 72% (RS-41, selected launch times correspond to scheduled NOAA-21 overpasses) and 28% (RS-92 during IOPs).
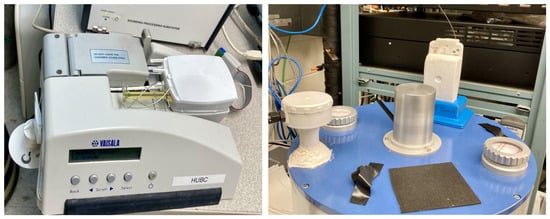
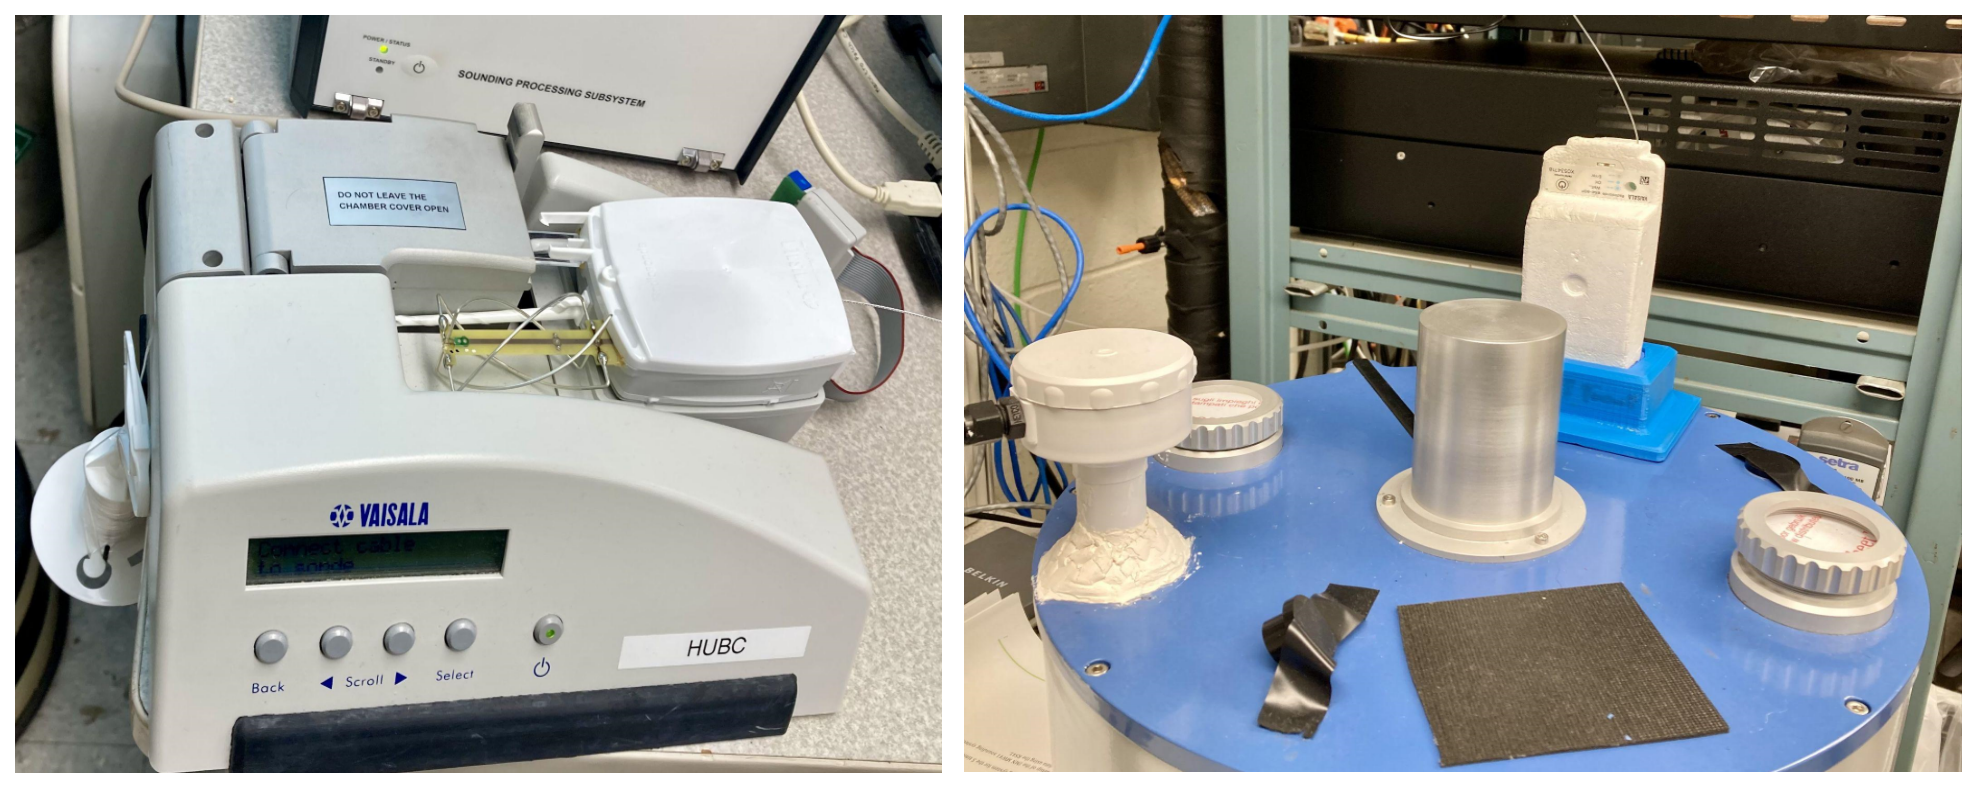
At HUBC, all radiosondes are reconditioned preflight using manufacturer-approved ground-check systems (Vaisala Oyj, Vantaa, Finland) observed in Figure 2, to ensure that all sensors are operating within a small error margin when measured against laboratory conditions. As per strict GRUAN standards, error measures are to be within 1.50 hPa and 1.0% RH for any sonde deemed worthy of being released, effectively eliminating sensor storage drift prior to launch. As Equation (1) shows, to calculate PWV, the relative humidity and temperature data points are converted into water vapor density (). This value is then integrated over the entire vertical column from the surface to the top of the flight. All launches for this study reached a minimum ceiling of 10 km.
Figure 2.
On the left, an RS-92 radiosonde is undergoing a dry-point calibration check to verify sensor response under 0% relative humidity (RH) conditions. On the right, the same calibration procedure is performed on an RS-41 radiosonde, with the sensor exposed to a fully saturated humidity chamber (100% RH).
To ensure that the use of two different radiosonde models (RS-92 and RS-41) did not introduce systematic bias into the reference dataset, a statistical comparison of their respective biases was conducted. An independent two-sample Welch’s t-test comparing the radiosonde-to-radiometer PWV bias for the RS-41 (μ = 5.616 mm) and the RS-92 (μ = 5.353 mm) yielded a p-value of 0.747 (t = 0.325). Since the p-value greatly exceeds the standard 0.05 significance level, no statistically significant difference in performance was found between the two models within this study. This result is consistent with the interpretation that pre-flight reconditioning harmonized the two models’ measurements, preventing the different models from introducing any significant instrumental bias.
The total PWV, representing the depth of liquid water if all atmospheric water vapor in the column were condensed, was then determined by integrating from the surface (z0) to the maximum sounding height (zmax):
where p1 is the density of liquid water, approximately 1000 . The integration was performed numerically using the cumulative trapezoidal rule. The final PWV values are reported in millimeters (mm).
2.4. Radiometer
This study made use of the microwave radiometer (MWR), MP-3000A from Radiometrics, which uses brightness temperatures from six microwave channels (K-band, sensitive to water vapor, and V-band, sensitive to oxygen) to retrieve temperature and water vapor profiles. There are some uncertainties associated with radiometer-derived PWV. Retrievals from the radiometer are sensitive to liquid water in clouds and can introduce a wet bias, especially during overcast or rainy conditions [25]. Most common uncertainties also arise from calibration issues, instrument noise, and the data involved in the retrieval algorithm. High cost, low spatial resolution, and sensitivity to precipitation and cloudiness are among the challenges associated with radiometer and PWV retrievals [19]. However, under clear-sky conditions, the radiometer PWV is reliable and, with careful quality control, can be an excellent dataset for intercomparison studies.
Radiometric PWV Calculations
PWV values were obtained directly from filtered Level 2.0 data from the Radiometer, MP-3000A.
The MWR is able to measure downwelling radiation, expressed as brightness temperature (Tβ), across 22 channels [26]; it particularly focuses on the k-band and the water vapor absorption line centered at 22.235 GHz and the surrounding frequencies between 22 and 30 GHz [27]. As the water vapor concentration in the atmosphere increases, the opacity and resulting (Tβ) of these frequencies rise [28]. These are converted into PWV (cm) using a neural network retrieval algorithm [29].
2.5. NOAA-21 and TROPOMI
The polar-orbiting satellite, NOAA-21, retrieves atmospheric water vapor through synergies between two instruments: the Cross-track Infrared Sounder (CrIS) and the Advanced Technology Microwave Sounder (ATMS). The CrIS is a high-resolution Fourier transform spectrometer, designed to detect water vapor absorption [13]. The ATMS is a cross-track scanning passive microwave radiometer. While CrIS provides a superior vertical resolution in clear skies, the ATMS is a nearly “all weather” instrument [30].
The primary advantage of NOAA-21 is its spatial coverage. NOAA-21 operates in a sun-synchronous polar orbit, circling the Earth 14 times per day, at an altitude of approximately 824 km [31]. However, it is limited in temporal resolution. Overpasses are time-sensitive. This may result in missed data during rapid moisture fluctuation events. Furthermore, while the microwave channels of the ATMS can penetrate most clouds, the infrared retrievals from CrIS are limited by thick cloud cover, leading to retrieval uncertainties during overcast and precipitation events [32,33].
Another instrument analyzed was the Tropospheric Monitoring Instrument (TROPOMI) (Airbus Defence and Space Netherlands, Leiden, South Holland, Netherlands) onboard the Copernicus Sentinel-5 Precursor satellite. TROPOMI is an imaging spectrometer that retrieves PWV by measuring solar backscatter radiation within the visible blue and shortwave infrared spectral bands. TROPOMI provides high spatial resolution observations, improving the detection of fine-scale spatial variability in PWV [34,35]. It operates using shorter wavelengths, therefore sharing CrIS’s vulnerability to cloud contamination. It is worth noting that since it relies on reflected sunlight to derive water vapor concentrations, the retrieval method is constrained to daylight hours.
Both TROPOMI (with pixels of 5.5 km × 3.5 km at nadir) [34]] and NOAA-21 (375 m/750 m) [30] rely on space calibrations alongside vicarious inter-calibration to ensure data quality and stability across their operational lifetime.
NOAA-21 and TROPOMI PWV Calculations
Atmospheric profiles were retrieved from the Advanced Technology Microwave Sounder (ATMS) (Northrop Grumman Electronic Systems, Azusa, California, United States) onboard the NOAA-21 satellite using the Microwave Integrated Retrieval System (MiRS) product.
Satellite overpasses were synchronized with radiosonde launches within a temporal window of 60 min, with a maximum allowed distance of 50 km. Furthermore, to minimize path length errors, the analysis was restricted to observations with an elevation angle ≥ 45°, though a lower threshold of 34° was permitted in specific cases to maintain a representative sample size.
The MiRS retrieval provides vertical profiles of temperature (T) and water vapor mixing ratio (q) at discrete pressure levels. PWV values were calculated by integrating the mixing ratio over the pressure layers. The integration follows the hydrostatic equilibrium principle:
The same spatial and temporal collocation criteria were applied to extract PWV data from TROPOMI. Because TROPOMI directly measures the total atmospheric column rather than discrete vertical layers, Equation (2) was not required; instead, the collocated TROPOMI pixels provided a direct total PWV value for horizontal validation against the integrated radiosonde profiles.
2.6. Pandora
The Pandora-2S spectrometer used was developedin collaboration with NASA Goddard Space Flight Center and deployed as part of the Pandora Global Network (PGN). Pandora is a UV-visible passive remote sensing instrument that retrieves total column trace gases and PWV through Direct-Sun Differential Optical Absorption Spectroscopy (DOAS).
A key advantage is its direct column measurement geometry, which yields high relative accuracy under clear-sky conditions [36]. It is also capable of performing retrievals using the full moon as a light source, extending data collection into nighttime under favorable lunar illumination. However, Pandora is limited by its dependence on an unobstructed line of sight to the Sun or Moon, restricting high-quality retrievals to clear-sky conditions and usually daylight hours. Additionally, observations at high solar zenith angles introduce greater uncertainty, as the longer atmospheric slant path amplifies sensitivity to multiple scattering and refraction effects [37].
Pandora Spectrometer PWV Processing
Just like the radiometer, the Pandora spectrometer system allows for a direct conversion of the measured values of precipitable water vapor. In this case, H2O (g), in the atmospheric column from moles/m2 to mm of water.
Data were filtered to include only measurements taken within a 120 min window of a radiosonde launch. This temporal threshold was selected to maximize the sample size of the intercomparison dataset while minimizing the impact of short-term water vapor variability.
2.7. AERONET
The AErosol RObotic NETwork (AERONET) is a globally standardized network of robotic sun photometers that retrieves aerosol optical properties and PWV through narrowband filter photometry [12]. The standard instrument is the CIMEL Electronique CE-318, a multichannel sun and sky scanning radiometer. This makes it fundamentally different from Pandora’s spectroscopic method, and the two instruments carry distinct error characteristics and spectral sensitivities that are important to account for in any inter-instrument PWV comparison.
A primary advantage of AERONET is its standardized global infrastructure, with uniform calibration protocols and centralized retrieval algorithms that ensure consistency across 1300 worldwide stations, making it a widely used reference for satellite validation [38]. Its automated sun-tracking design also enables high temporal resolution retrievals throughout daylight hours. However, like Pandora, AERONET retrievals are confined to clear-sky daytime conditions, with cloud cover and precipitation precluding valid measurements [38].
AERONET Sun Photometer Retrievals
PWV retrievals (Level 2.0 Quality-Assured) were obtained from the AErosol RObotic NETwork (AERONET) station located at the NASA Goddard Space Flight Center (GSFC) in Greenbelt, MD. This site was selected due to its proximity to HUBC, approximately 4 miles to the south. This ensures that both instruments sample nearly identical air masses within the lower troposphere. The retrieval algorithm utilized a temporal window of 60 min centered on the radiosonde launch time.
2.8. GPS
Global Navigation Satellite Systems (GNSS) receivers estimate PWV values from the atmospheric delay of signals transmitted by navigation satellites. GPS is one GNSS constellation; other operational constellations include GLONASS, Galileo, and BeiDou. In this study, the GPS observations were processed to estimate zenith total delay. From which zenith wet delay and PWV were derived. As radio signals travel from the satellite to the GPS ground-based receiver, they are delayed relative to their travel time in a vacuum by their interaction with the atmosphere’s composition. Part of this delay, called Zenith Wet Delay (ZWD), is produced by water vapor concentrations [39] which is later converted to PWV values using a dimensionless transformation constant dependent on atmospheric temperature [40].
The primary strength of GPS sensing is continuity; since it uses microwave signals, it can obtain data through thick clouds and heavy rains that would otherwise blind infrared sensors like CrIS onboard NOAA-21.
GPS PWV Retrievals
The German Research Centre for Geosciences (GFZ) operates and processes data from GNSS receivers installed at selected GRUAN stations. Beltsville station is one of twenty GRUAN stations worldwide equipped with a GFZ-operated GNSS receiver. All GNSS products used in this study are final processed precipitable water vapor (PWV) retrievals derived by GFZ from ZWD and can be found at https://doi.org/10.5880/GFZ.1.1.2024.003 [41]. The GFZ processing follows the operational GRUAN GNSS processing chain based on Precise Point Positioning (PPP), which employs a ≤10° satellite elevation cut-off angle to minimize errors associated with low-elevation observations [42].
For the intercomparison analysis, GNSS measurements were collocated with radiosonde launches using a ±30 min temporal window (note that the different temporal windows, i.e., 30, 60, and 120 min, were chosen to balance data density with the specific sampling frequency of each instrument).
3. Results and Discussion
3.1. The Radiosonde v. Radiometer
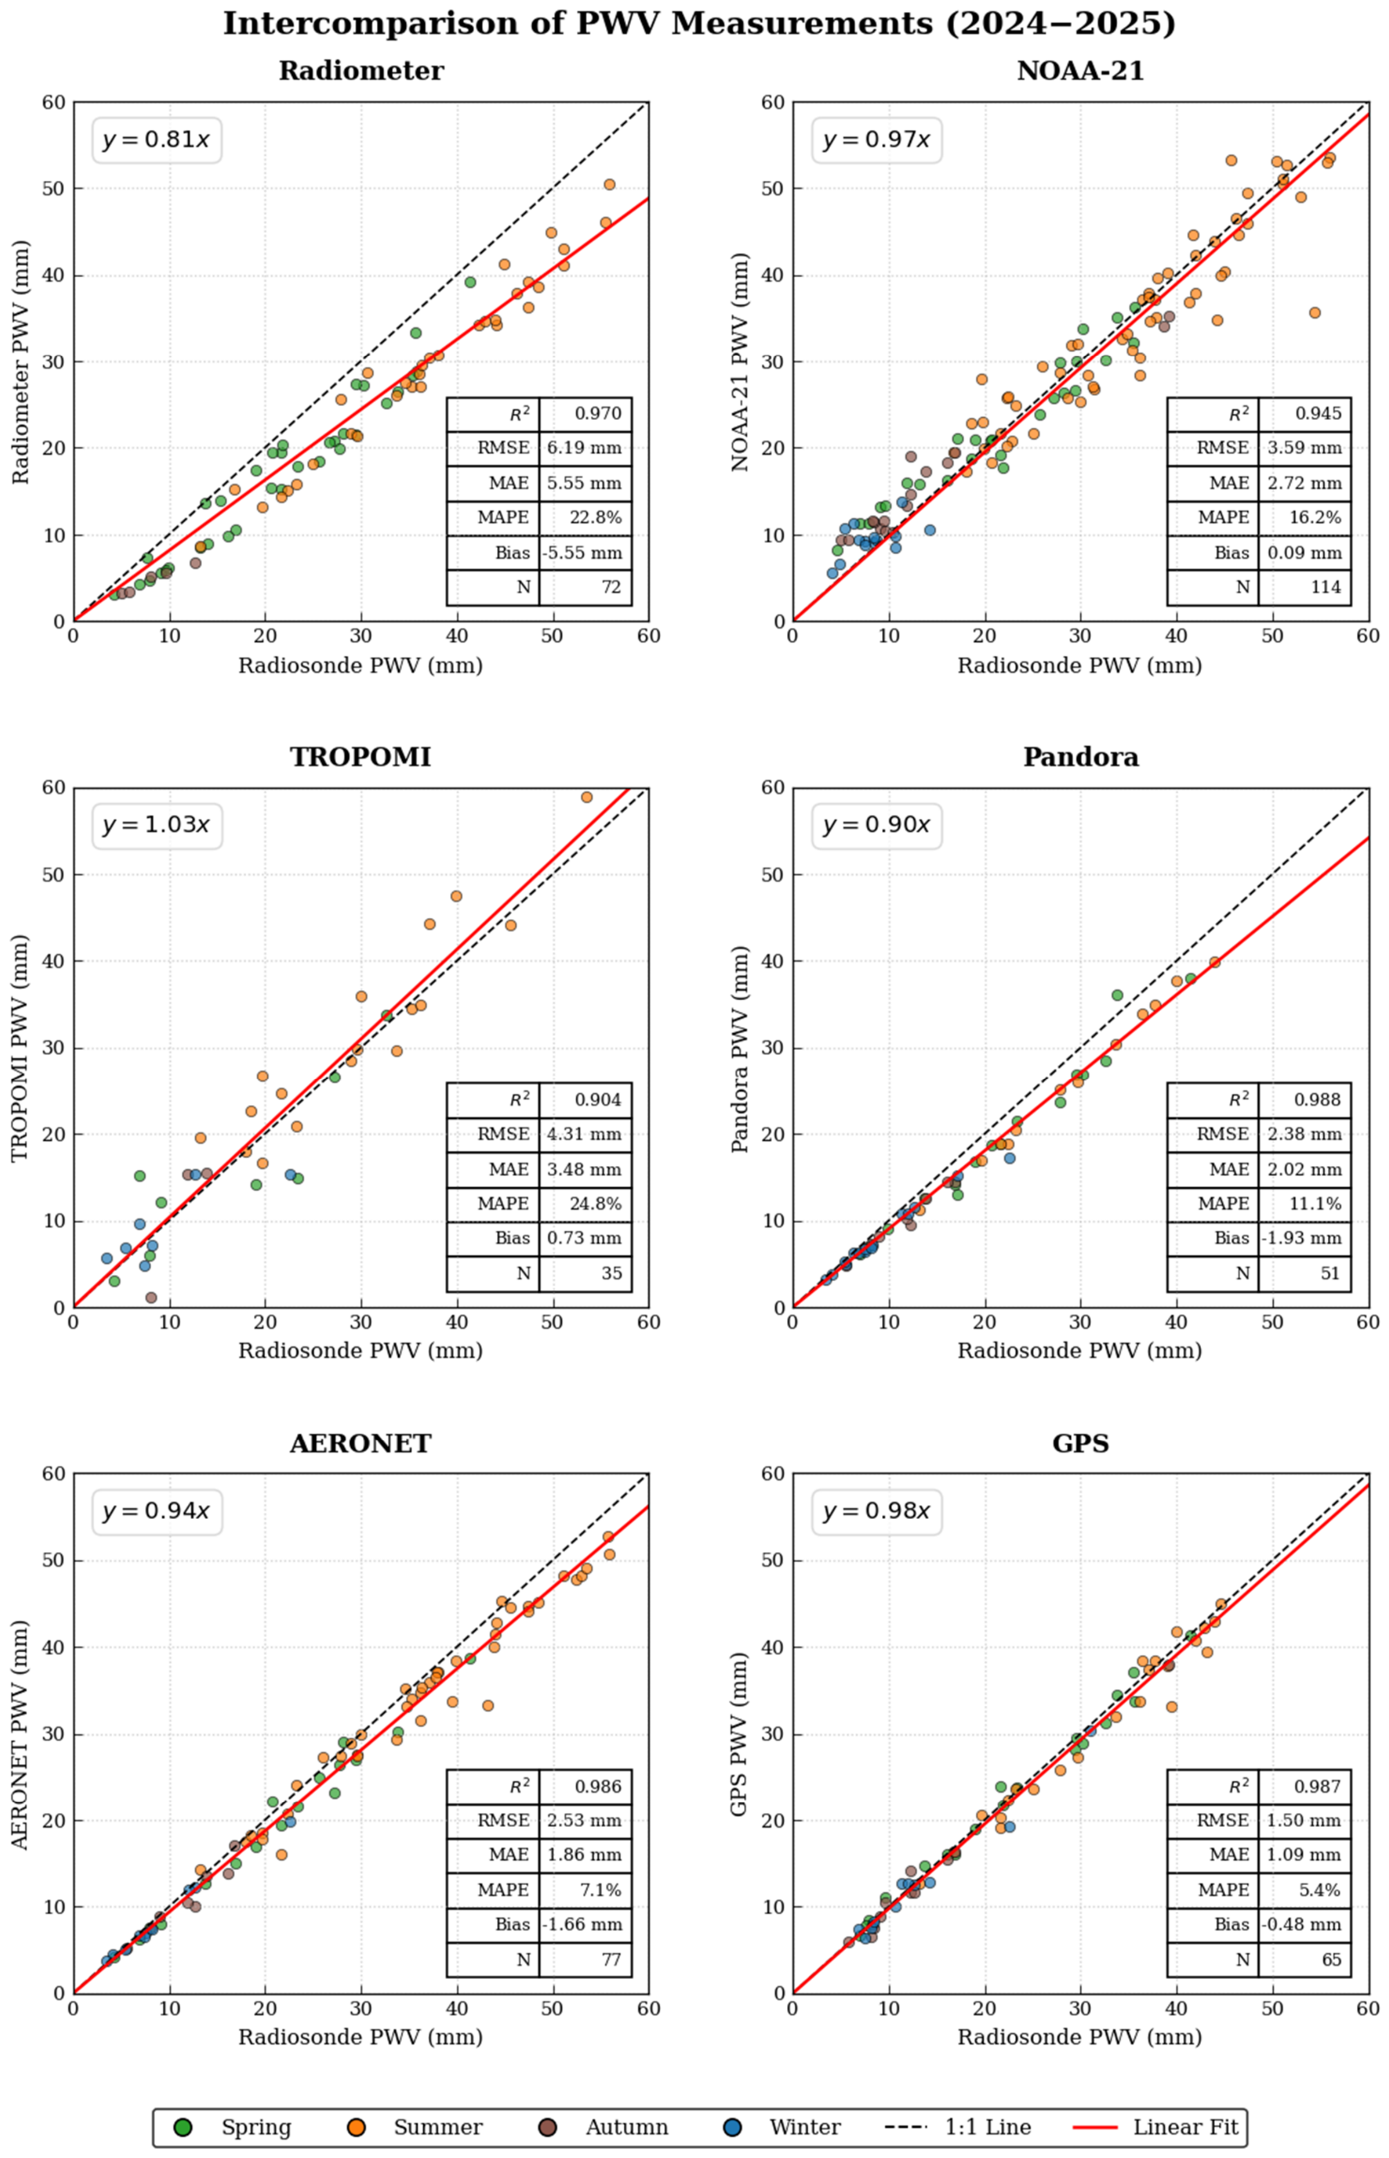
The relationship between the radiometer and the radiosonde shows a very strong linear correlation, but with a significant sensitivity gap. An R2 value of 0.970 indicates that 97% of the variance in the radiometer’s measurements is explained by those changes measured by the radiosonde. The linear regression was calculated with the intercept constrained to zero (forced through the origin). Now, in terms of linearity, looking at the slope of the linear fit, y = 0.81x, reveals a significant departure from the ideal 1:1 relationship. The radiometer captures only 81% of the precipitable water vapor measured by the radiosonde. This gap suggests a scaling issue, likely related to the instrument’s calibration constant or the retrieval algorithm’s sensitivity.
Turning to the error metrics, RMSE, MAE, and MAPE, which quantify the magnitude of the radiometer’s deviation from the referent truth, it can be shown that due to the proximity of the RMSE value of 6.19 mm and the MAE value of 5.55 mm the error is relatively uniform across the dataset. A mean absolute percentage error of nearly 23% is, however, relatively high for PWV measurements. This indicates that while the correlation with the radiosonde is high, the distance from the reference value is substantial enough to impact applications requiring high precision such as satellite validation or numerical weather prediction, where ranges of at least 10% are preferred [43]. The radiometer exhibits a pronounced negative systematic bias of −5.55 mm. This means that on average, the radiometer underestimates PWV values by 5.55 mm.
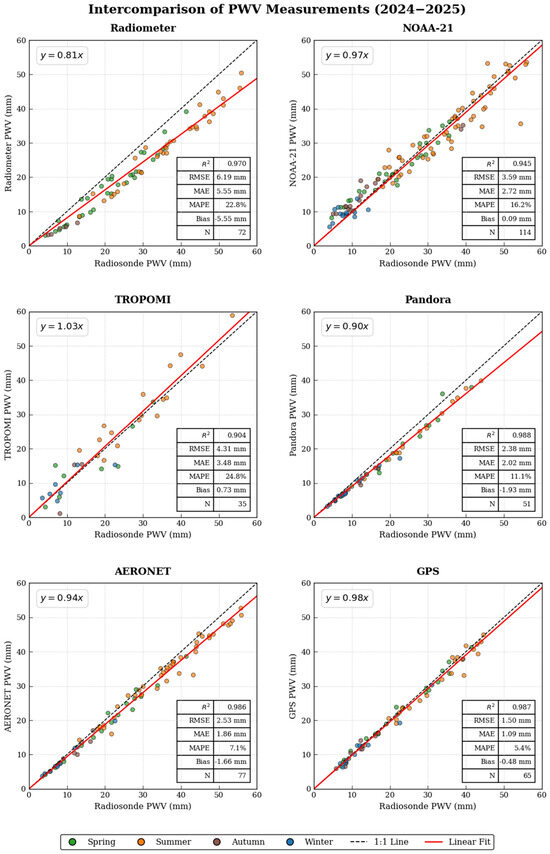
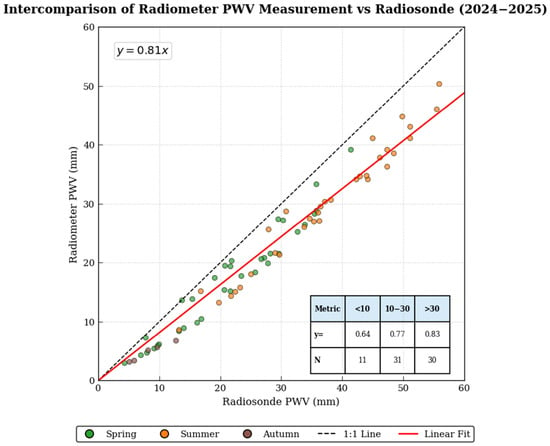
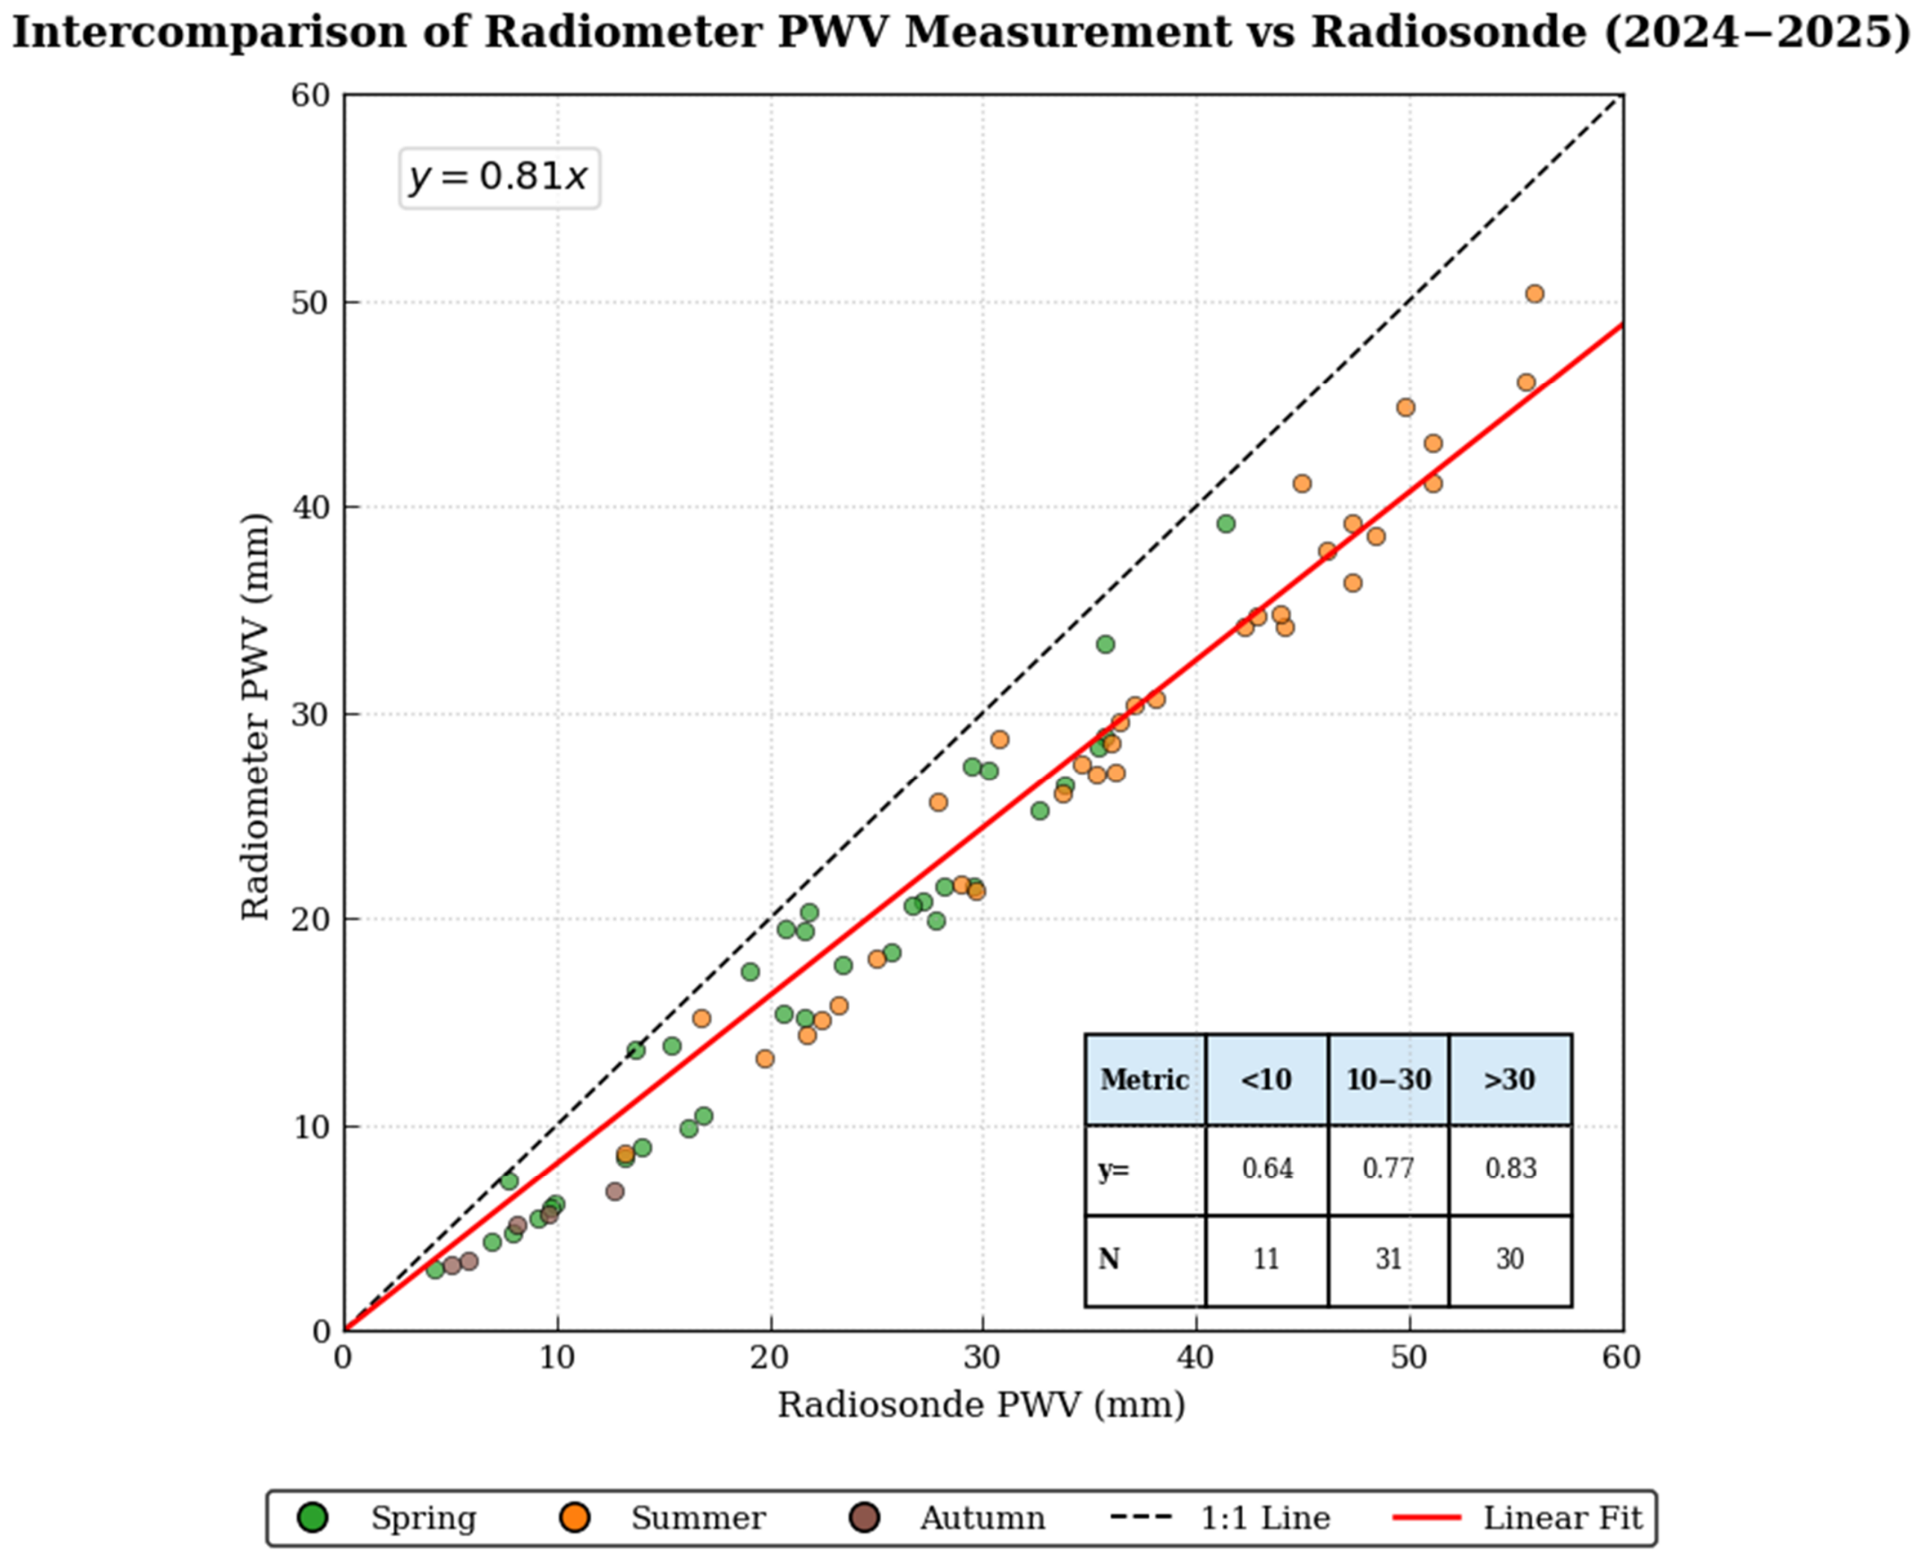
It can be shown in Figure 3 that the gap widens as PWV increases, making the underestimation most visible during the high-moisture summer months, June through August, suggesting possible saturation effects or attenuation issues in the radiometer’s sensing frequency. As measured values move toward 50–60 mm, the vertical spread increases. This means that the radiometer’s uncertainty is not constant, but it becomes significantly less reliable as the atmosphere becomes more humid. Noting that not a single point falls above the 1:1 line suggests that the issue is not just random noise, but a fundamental calibration offset. The application of calibration constants to bring values closer to the radiosondes’ relative truth is thus recommended. As detailed in Figure 4, separating the slopes across a range of low (<10 mm), medium (10 ≤ 30 mm), and high PWV (>30 mm), it can be observed that the application of a constant correction factor would not be adequate for proper calibration. It would be best advised to use seasonal corrections. For this particular radiometer those correction constants (1/y) would correspond to, i.e., 1.56, 1.30, and 1.20, respectively.
Figure 3.
Multi-panel plots and regression analyses illustrating the comparison of PWV measurements from all instruments against radiosonde observations for the 2024–2025 period. Data points are color-coded by season to emphasize seasonal variability.
Figure 4.
Comparison of radiometer PWV measurements across three different PWV ranges < 10 mm, 10 ≤ 30 mm, and >30 mm against radiosonde for the 2024–2025 period.
3.2. Radiosonde v. NOAA-21
NOAA-21 presents a different performance profile to that of the radiometer. While it is noisier, it is much more accurate on average.
NOAA-21 shows a strong linear relationship with the radiosonde. An R2 value of 0.945 indicates a correlation lower than the radiometer. This is indicative of more retrieval variance in the satellite data. The slope of the linear fit, y = 0.97x, is nearly ideal. NOAA-21 captures 97% of the moisture measured by the radiosonde, showing a vast improvement in scaling compared to the radiometer’s 81%.
The error metrics, RMSE, MAE, and MAPE are notably lower for NOAA-21. RMSE (3.59 mm) and MAE (2.72 mm) are nearly 50% lower than the errors for the radiometer. This suggests that while the individual points may jump around more, they stay much closer to the radiosonde’s reference values overall.
Unlike the radiometer, where every point was below the 1:1 line, NOAA-21 has points above and below. This is why the bias is negligible; the overestimations and underestimations cancel each other out. An overall bias (+0.09 mm) for NOAA-21 renders it almost an unbiased instrument. A value of less than 1 mm is statistically negligible in PWV measurements [44]. Unlike the radiometer, which had a massive dry bias, NOAA-21 sits nearly perfectly on the 1:1 line on average. The vertical scatter appears to increase during the wet summer months, typical for satellite infrared or microwave retrievals, which can be affected by high humidity and cloud contamination characteristic of the wet season [45].
It is worth noting that there are a few high-end outliers in the data set, particularly in summer (orange) data points around the 45–55 mm range. Some of these individual measurements deviate by nearly 10 mm from the 1:1 line. This suggests that while the instrument is accurate on average, individual overpasses can occasionally be quite far off during high moisture days. On the other hand, the satellite appears to be exceptionably reliable in very dry conditions.
3.3. Radiosonde v. TROPOMI
TROPOMI shows a strong, though more dispersed, linear relationship with the radiosonde data.
Its linear fit, y = 1.03, represents a mean moisture content overestimation of roughly 3%. Its R2 = 0.90 is the lowest correlation coefficient in the study, indicating significantly more random noise than other instruments.
While its RMSE of 4.31 mm and the MAE of 3.48 mm are slightly higher than those of NOAA-21, these error metrics reflect the variability inherent in TROPOMI’s PWV retrievals. Notably, the MAPE, 24.80%, is also the highest of the study, a result of the scatter seen at both low and high ends of the spectrum.
TROPOMI exhibits a slight wet bias of 0.73 mm. Unlike the ground-based sensors that were consistently dry, TROPOMI leans toward wet. Even with a smaller sample size, N = 35, seasonal trends are still evident. Winter months (Nov-Feb) are clustered well below 15 mm. Although it is worth noting that there is a significant outlier where TROPOMI showed almost 0 mm while the radiosonde measured nearly 10 mm. Summer months (Jun-Aug) dominate the high-end moisture levels > 30 mm. July points show high variance, with some points overshooting the 1:1 line significantly. In high-moisture conditions > 40 mm, TROPOMI can be quite erratic.
TROPOMI measures in the UV-VIS range, which is highly sensitive to cloud cover and surface reflectivity. This likely explains the increased noise R2 = 0.90, compared to microwave or GPS methods. However, despite the noise, it is the only instrument that does not show a dry scaling issue.
3.4. Radiosonde v. Pandora
Pandora demonstrates excellent tracking ability, R2 = 0.988. That is, when the radiosonde detects a change in moisture, pandora mirrors that change almost perfectly. There is a low level of noise associated with it. The regression equation y = 0.90x shows a consistent 10% underestimation. While it is more accurate than the radiometer in scaling y = 0.81x, it lacks the near-perfect centering of the NOAA-21 satellite, y = 0.97x.
The error metrics, RMSE (2.38 mm), and MAE (2.02 mm), are remarkably low for Pandora. For comparison, they are about 66% and 26% lower than the satellite’s. Its MAPE (11.1%) is also significantly lower, by around 69%, than that of NOAA-21’s. Pandora has a slight dry bias, about 2 mm lower than the PWV measured by the radiosonde. However, because the R2 = 0.988 is so high, the consistent bias is quite predictable and easily corrected with a simple multiplier. It is noteworthy to mention that while other instruments’, i.e., the radiometer, increased their error at high humidity, Pandora’s measurements stayed close to the linear fit, thus showing good stability regardless of how much water is in the air.
Pandora’s clear-skies constraint accounts for the relatively low number of launches compared during the two-year study period. Relative to the other instruments, it did not record any measurements above 45 mm, suggesting a lack of clear-sky opportunities during the most humid days of the year.
3.5. Radiosonde v. AERONET
An almost perfect R2 = 0.986 indicates that AERONET and the radiosonde are measuring nearly exact atmospheric water vapor values with minimal random error. Its regression equation, y = 0.94x, shows AERONET within 6% of the radiosonde’s scale, a noticeable improvement over Pandora’s y = 0.90x. The error metrics, RMSE (2.53 mm) and MAE (1.86 mm), are also on the low end. This indicates that on average the instrument’s PWV measurements are less than 2 mm away from the reference provided by the radiosonde. Its MAPE (7.10%) is exceptionally good for atmospheric PWV retrievals, which are notoriously difficult to measure.
Like the radiometer and Pandora, AERONET exhibits a dry bias. This consistent offset of −1.66 mm does not significantly fluctuate with changing moisture levels, and like with other instruments, it could be easily corrected with calibration adjustments.
One noteworthy observation is that there are two points during the summer months that drop significantly below the regression line. AERONET measures one point in August at 33 mm, while the radiosonde reports 43 m. These are likely cases where AERONET was looking through a slightly different pocket of the sky relative to the radiosonde, or perhaps thin cirrus clouds interfered with the retrieval. Secondly, there is a light superiority over Pandora since its MAPE (7.10%) is significantly lower than Pandora’s 11.10%. AERONET also shows great consistency in the dry regimes, between 0 and 15 mm, where the points are almost glued to the regression line. This makes AERONET a powerful tool for dry-climate research or high-altitude regions where moisture is scarce.
3.6. Radiosonde v. GPS
Statistically speaking, we have saved the best for last. The GPS provided the most accurate and precise match to the radiosonde’s reference of the entire study group.
The GPS near-perfect correlation to the radiosonde, R2 = 0.987, is on par with that of Pandora and AERONET. Its regression equation, y = 0.98, is the best in the study. This indicates that the GPS measurements are in 98% agreement with those of the radiosonde. The error metrics, RMSE (1.50 mm), MAE (1.09 mm), and MAPE (5.40%) are the best among all six instruments. A MAE of 1 mm is essentially within the margin of error for the radiosonde itself [46], meaning that the two instruments are effectively in total agreement. The GPS exhibits a minuscule dry bias of −0.48 mm, and for most meteorological applications, a bias under 0.50 mm is considered negligible [47].
There is no visible increase in error during the wet season with GPS retrievals. Points stay tightly wrapped around the 1:1 line, even as moisture increases. Furthermore, GPS has an all-weather advantage over the other instruments that showed high precision and relative accuracy since the GPS does not require a clear line of sight to the Sun. It uses microwave signals that penetrate clouds. This makes it more robust than the Pandora and AERONET sun photometers. Lastly, most instruments in this study saw their errors grow as the air got more humid, yet the GPS’s values stayed tightly clustered around the 1:1 line. This suggests the GPS retrieval algorithm is exceptionally well-compensated for high humidity conditions.
4. Conclusions
This study emphasizes the importance of intercomparison experiments and the need for periodical checks of instrument performance. It guides researchers to be aware of the advantages and constraints characteristic to different PWV measuring instruments and their respective accuracy profiles relative to radiosonde measurements. A detailed description of each instrument resolution and collocation characteristic can be found on Table 1. Throughout this study, RMSE, MAE, and bias served as the primary metrics for evaluating instrument performance, while correlation coefficients were used as supporting indicators of agreement. All our results are summarized in Table 2.
Table 1.
Instrumentation Resolution and Collocation Characteristics.
Table 2.
Statistical Comparison of Precipitable Water Vapor (PWV) Measurements.
The intercomparison between the radiometer and the radiosonde demonstrates the highest RMSE (6.19 mm) and a substantial dry bias, systematically underestimating PWV values by approximately 19% across all seasons. Although the correlation remains high (R2 = 0.970), the radiometer effectively captures atmospheric moisture variability and seasonal transitions but requires calibration corrections to improve absolute PWV retrievals. Our analysis shows that a single correction factor is insufficient across the full range of atmospheric moisture conditions. Instead, seasonal calibration constants are recommended. For this radiometer, representative correction constants (1/y) are approximately 1.56 for low PWV (<10 mm), 1.30 for moderate PWV (10–30 mm), and 1.20 for high PWV (>30 mm), providing a more accurate calibration than the application of a single calibration constant.
NOAA-21 PWV retrievals demonstrate high relative accuracy and a negligible systematic bias (+0.09 mm) when compared against radiosonde retrievals. Its relatively low RMSE (3.42 mm) and MAE (2.72 mm) make it a highly reliable tool for PWV measurements. Although its correlation (R2 = 0.945) is lower than that of some ground-based instruments due to greater random noise, it exhibits excellent linearity (y = 0.97x) and is well suited for regional climate studies without the need for calibration adjustments.
TROPOMI retrievals provide a near-unity relationship with the radiosonde, achieving a slope of y = 1.03x. Although it exhibits the largest RMSE (4.80 mm) and MAPE (24.80%) among the satellite products, it avoids a systematic dry bias, instead showing a slight wet bias of +0.73 mm. The lower correlation (R2 = 0.904) is due in part to the large atmospheric volumes sampled from space, which smooth the fine-scale moisture variability captured by radiosondes. Despite lower precision than ground-based sensors, TROPOMI remains a valuable tool for capturing the absolute magnitude of moisture columns over broad areas without the significant scaling corrections required by traditional ground-based instrumentation.
Pandora is a precise instrument. It exhibits low error statistics together with a consistent dry bias, making it highly reliable for long-term atmospheric monitoring. Although it displays the highest correlation (R2 = 0.988), its consistent underestimation means that a simple calibration adjustment is sufficient for its PWV measurements to become nearly indistinguishable from radiosonde observations. However, its data density is limited by its operational requirements under specific atmospheric conditions.
AERONET retrievals demonstrate remarkable performance. They achieve low RMSE and MAE values, together with a minor systematic dry bias of −1.66 mm. The slope of y = 0.940 and high correlation (R2 = 0.986) establish it as a primary reference for validating satellite retrievals in this region.
GPS-based retrievals serve as the most accurate ground-based methodology in this intercomparison study. They produce the lowest RMSE (1.50 mm), the lowest MAE (1.09 mm), and a minimal bias of −0.48 mm, with a regression slope of y = 0.98x. Although all instruments exhibit high correlations with radiosondes, GPS consistently provides the smallest absolute errors, making it the most robust benchmark in this intercomparison. It is highly reliable across all seasons and moisture regimes, and while AERONET is often considered exceptional for aerosol-water vapor relationships, this study shows that for pure PWV volume, GPS is slightly superior in terms of absolute error and bias.
Author Contributions
R.D.R. and A.F. conducted the radiosonde launches. R.D.R. acquired, filtered, and analyzed precipitable water vapor (PWV) data from all instruments and prepared the manuscript. J.R.V.M. developed the Python codes, (Python 3.12.13), used to extract PWV from the datasets for each instrument. R.D.R. and J.R.V.M. jointly designed the methodology for PWV data collection. N.N.K. contributed to the interpretation of radiometer measurements and related text. U.S. contributed to the description of the Pandora and AERONET systems, as well as to the acquisition, processing, and analysis of TROPOMI data. R.K.S. conceived the project and provided guidance on data analysis and interpretation. X.L.’s leadership secured fundings for the development of this research. All authors have read and agreed to the published version of the manuscript.
Funding
This research was funded by NASA through the MUREP/DEAP program (80NSSC23M0049) and the SaSa award (80NSSC22K1405) and the U.S. Department of Commerce, NOAA Educational Partnership Program (NA22SEC4810015) and NCAS-M.
Data Availability Statement
The datasets and visualization materials used in this study are available to be shared upon request. Please send correspondence to the main author.
Acknowledgments
The authors gratefully acknowledge support from NASA (MUREP/DEAP and SaSa programs, NOAA’s Educational Partnership Program, and NCAS-M. We also acknowledge the collaboration between NASA’s Goddard Space Flight Centre (GSFC) and Howard University (HU), facilitated by Space Act Agreement Number NASA-HU-34694. Lastly, we thank Howard University Beltsville Campus (HUBC) for providing facilities and support as a key atmospheric research site.
Conflicts of Interest
The authors declare no known competing financial interests or personal relationships that could have influenced the work reported in this paper.
References
- Schmidt, G.A.; Ruedy, R.; Miller, R.L.; Lacis, A.A. Attribution of the Present-Day Total Greenhouse Effect. J. Geophys. Res. 2010, 115, D20106. [Google Scholar] [CrossRef] [Scilit]
- Russel, G. Our Warming Planet: Topics in Climate Change; Imperial College Press: London, UK, 2016. [Google Scholar]
- Tan, Y.; Kochanov, R.V.; Rothman, L.S.; Gordon, I.E. Introduction of Water-Vapor Broadening Parameters and Their Temperature-Dependent Exponents into the HITRAN Database: Part I—CO2, N2O, CO, CH4, O2, NH3, and H2S. J. Geophys. Res. Atmos. 2019, 124, 11580–11594. [Google Scholar] [CrossRef] [Scilit] [PubMed]
- NASA Earth Observatory. Water Vapor. Available online: https://science.nasa.gov/earth/earth-observatory/global-maps/water-vapor (accessed on 19 May 2026).
- NASA. Steamy Relationships: How Atmospheric Water Vapor Amplifies Earth’s Greenhouse Effect. NASA Science. Available online: https://science.nasa.gov/earth/climate-change/steamy-relationships-how-atmospheric-water-vapor-amplifies-earths-greenhouse-effect/ (accessed on 1 May 2026).
- Weckwerth, T.M.; Wilson, J.W.; Wakimoto, R.M. Thermodynamic Variability within the Convective Boundary Layer Due to Horizontal Convective Rolls. Mon. Weather Rev. 1996, 124, 769–784. [Google Scholar] [CrossRef] [Scilit]
- Pérez-Ramírez, D.; Whiteman, D.N.; Smirnov, A.; Lyamani, H.; Holben, B.N.; Pinker, R.; Andrade, M.; Alados-Arboledas, L. Evaluation of AERONET Precipitable Water Vapor versus Microwave Radiometry, GPS, and Radiosondes at ARM Sites. J. Geophys. Res. Atmos. 2014, 119, 9596–9613. [Google Scholar] [CrossRef] [Scilit]
- Su, H.; Yang, T.; Wang, K.; Sun, B.; Yang, X. Evaluation of Precipitable Water Vapor Retrieval from Homogeneously Reprocessed Long-Term GNSS Tropospheric Zenith Wet Delay, and Multi-Technique. Remote Sens. 2021, 13, 4490. [Google Scholar] [CrossRef] [Scilit]
- Karle, N.N.; Sakai, R.K.; Rossi, R.D.; Flores, A.; Chiao, S. Vertical Profiling of Canadian Wildfire Smoke in the Baltimore-Washington Corridor—Interactions with the Planetary Boundary Layer and Impact on Surface Air Quality. Atmos. Meas. Tech. 2025, 18, 6727–6746. [Google Scholar] [CrossRef] [Scilit]
- Demoz, B.; Sakai, R.K.; Flores, A.; Rossi, R.D. The Howard University Beltsville Research Site HUBC: A Re-Introduction. In Proceedings of the ICM-16: GRUAN16, Tenerife, Spain, 21 November 2025; pp. 17–21. [Google Scholar]
- GRUAN Station Information: Beltsville (USA) GCOS Reference Upper-Air Network. Available online: https://www.gruan.org/network/sites/beltsville/ (accessed on 21 March 2026).
- Holben, B.N.; Eck, T.F.; Slutsker, I.; Tanré, D.; Buis, J.P.; Setzer, A.; Vermote, E.; Reagan, J.A.; Kaufman, Y.J.; Nakajima, T.; et al. AERONET—A Federated Instrument Network and Data Archive for Aerosol Characterization. Remote Sens. Environ. 1998, 66, 1–16. [Google Scholar] [CrossRef] [Scilit]
- National Environmental Satellite, Data, and Information Service (NESDIS) JPSS Satellite and Instruments. NOAA. Available online: https://www.nesdis.noaa.gov/ (accessed on 19 June 2026).
- TROPOMI TROPOMI Observing Our Future. Available online: https://www.tropomi.eu (accessed on 21 January 2026).
- Scott, A.A.; Zaitchik, B.; Waugh, D.W.; O’Meara, K. Intraurban Temperature Variability in Baltimore. J. Appl. Meteorol. Climatol. 2017, 56, 159–171. [Google Scholar] [CrossRef] [Scilit]
- NOAA NCICS. State Climate Summaries 2022: Maryland and the District of Columbia. Available online: https://statesummaries.ncics.org/chapter/md/ (accessed on 26 March 2026).
- Ryu, Y.-H.; Smith, J.A.; Bou-Zeid, E. On the Climatology of Precipitable Water and Water Vapor Flux in the Mid-Atlantic Region of the United States. J. Hydrometeorol. 2015, 16, 70–87. [Google Scholar] [CrossRef] [Scilit]
- Muñoz, L.E.; Campozano, L.V.; Guevara, D.C.; Parra, R.; Tonato, D.; Suntaxi, A.; Maisincho, L.; Páez, C.; Villacís, M.; Córdova, J.; et al. Comparison of Radiosonde Measurements of Meteorological Variables with Drone, Satellite Products, and WRF Simulations in the Tropical Andes: The Case of Quito, Ecuador. Atmosphere 2023, 14, 264. [Google Scholar] [CrossRef] [Scilit]
- Khaniani, A.S.; Motieyan, H.; Mohammadi, A. Rainfall Forecast Based on GPS PWV Together with Meteorological Parameters Using Neural Network Models. J. Atmos. Sol.-Terr. Phys. 2021, 214, 105533. [Google Scholar] [CrossRef] [Scilit]
- Sapucci, L.F.; Machado, L.A.T.; da Silveira, R.B.; Fisch, G.; Monico, J.F.G. Analysis of Relative Humidity Sensors at the WMO Radiosonde Intercomparison Experiment in Brazil. J. Atmos. Ocean. Technol. 2005, 22, 664–678. [Google Scholar] [CrossRef] [Scilit][Green Version]
- National Weather Service (NWS). Upper Air Observations: Factsheet. Available online: https://www.weather.gov/upperair/factsheet (accessed on 17 May 2026).
- Vaisala Oyj. Vaisala White Paper: Comparison of Vaisala Radiosondes RS41 and RS92; Vaisala Oyj: Helsinki, Finland, 2014. [Google Scholar]
- Jensen, M.P.; Holdridge, D.J.; Kyrouac, J.; Ritsche, M.T.; Coulter, R.L.; Zhang, Z. Comparison of Vaisala Radiosondes RS41 and RS92 at the ARM Southern Great Plains Site. Atmos. Meas. Tech. 2016, 9, 3115–3129. [Google Scholar] [CrossRef] [Scilit]
- Castro-Almazán, J.A.; Pérez-Jordán, G.; Muñoz-Tuñón, C. A Semiempirical Error Estimation Technique for PWV Derived from Atmospheric Radiosonde Data. Atmos. Meas. Tech. 2016, 9, 4759–4781. [Google Scholar] [CrossRef] [Scilit]
- Crewell, S.; Löhnert, U. Accuracy of Cloud Liquid Water Path from Ground-Based Microwave Radiometry 2. Sensor Accuracy and Synergy. Radio Sci. 2003, 38, 8042. [Google Scholar] [CrossRef] [Scilit]
- Sánchez, J.L.; Posada, R.; García-Ortega, E.; López, L.; Marcos, J.L. A Method to Improve the Accuracy of Continuous Measuring of Vertical Profiles of Temperature and Water Vapor Density by Means of a Ground-Based Microwave Radiometer. Atmos. Res. 2013, 122, 43–54. [Google Scholar] [CrossRef] [Scilit]
- Bartsevich, M.; Rahman, K.; Addasi, O.; Ramamurthy, P. On the Applicability of Ground-Based Microwave Radiometers for Urban Boundary Layer Research. Sensors 2024, 24, 2101. [Google Scholar] [CrossRef] [Scilit] [PubMed]
- Wei, J.; Shi, Y.; Ren, Y.; Li, Q.; Qiao, Z.; Cao, J.; Ayantobo, O.O.; Yin, J.; Wang, G. Application of Ground-Based Microwave Radiometer in Retrieving Meteorological Characteristics of Tibet Plateau. Remote Sens. 2021, 13, 2527. [Google Scholar] [CrossRef] [Scilit]
- Candlish, L.M.; Raddatz, R.L.; Asplin, M.G.; Barber, D.G. Atmospheric Temperature and Absolute Humidity Profiles over the Beaufort Sea and Amundsen Gulf from a Microwave Radiometer. J. Atmos. Ocean. Technol. 2012, 29, 1182–1201. [Google Scholar] [CrossRef] [Scilit]
- Center for Satellite Applications and Research Advanced Technology Microwave Sounder (ATMS). Available online: https://www.star.nesdis.noaa.gov/cris/ATMS_background.php (accessed on 21 March 2026).
- WMO OSCAR. Satellite: NOAA-21 Details. Available online: https://space.oscar.wmo.int/satellites/view/noaa_21 (accessed on 1 April 2026).
- NOAA NESDIS Cross-Track Infrared Sounder (CrIS). Available online: https://www.nesdis.noaa.gov/our-satellites/currently-flying/joint-polar-satellite-system/cross-track-infrared-sounder-cris (accessed on 29 April 2026).
- NASA Gridded NUCAPS—Quick Guide; NASA Marshall Space Flight Center. Available online: https://weather.ndc.nasa.gov/nucaps/qg/QuickGuide_GriddedNUCAPS_final.pdf (accessed on 30 May 2026).
- Borger, C.; Beirle, S.; Dörner, S.; Sihler, H.; Wagner, T. Total Column Water Vapour Retrieval from S-5P/TROPOMI in the Visible Blue Spectral Range. Atmos. Meas. Tech. 2020, 13, 2751–2783. [Google Scholar] [CrossRef] [Scilit]
- Schneider, A.; Borsdorff, T.; aan de Brugh, J.; Aemisegger, F.; Feist, D.G.; Kivi, R.; Hase, F.; Schneider, M.; Landgraf, J. First Data Set of H2O/HDO Columns from the Tropospheric Monitoring Instrument (TROPOMI). Atmos. Meas. Tech. 2020, 13, 85–100. [Google Scholar] [CrossRef] [Scilit]
- Tzortziou, M.; Herman, J.R.; Cede, A.; Abuhassan, N. High Precision, Absolute Total Column Ozone Measurements from the Pandora Spectrometer System: Comparisons with Data from a Brewer Double Monochromator and Aura OMI. J. Geophys. Res. Atmos. 2012, 117, D16303. [Google Scholar] [CrossRef] [Scilit]
- Herman, J.; Evans, R.; Cede, A.; Abuhassan, N.; Petropavlovskikh, I.; McConville, G. Comparison of Ozone Retrievals from the Pandora Spectrometer System and Dobson Spectrophotometer in Boulder, Colorado. Atmos. Meas. Tech. 2015, 8, 3407–3418. [Google Scholar] [CrossRef] [Scilit]
- Giles, D.M.; Sinyuk, A.; Sorokin, M.G.; Schafer, J.S.; Smirnov, A.; Slutsker, I.; Eck, T.F.; Holben, B.N.; Lewis, J.R.; Campbell, J.R.; et al. Advancements in the Aerosol Robotic Network (AERONET) Version 3 Database—Automated near-Real-Time Quality Control Algorithm with Improved Cloud Screening for Sun Photometer Aerosol Optical Depth Measurements. Atmos. Meas. Tech. 2019, 12, 169–209. [Google Scholar] [CrossRef] [Scilit]
- Li, Q.; Böhm, J.; Yuan, L.; Weber, R. Global Zenith Wet Delay Modeling with Surface Meteorological Data and Machine Learning. GPS Solut. 2024, 28, 57. [Google Scholar] [CrossRef] [Scilit]
- Bevis, M.; Businger, S.; Chiswell, S.; Herring, T.A.; Anthes, R.A.; Rocken, C.; Ware, R.H. GPS Meteorology: Mapping Zenith Wet Delays onto Precipitable Water. J. Appl. Meteorol. 1994, 33, 379–386. [Google Scholar] [CrossRef] [PubMed]
- Galina, D.; Jens, W.; Florian, Z.; Benjamin, M.; Markus, B.; Markus, R.; Andre, B. GFZ GNSS-Derived Precipitable Water Vapor for Climate Reference Network GRUAN. V. 1.0. GFZ Data Services. 2024. Available online: https://dataservices.gfz-potsdam.de/panmetaworks/showshort.php?id=14b5805c-dff3-11ef-914a-f12b0080820d (accessed on 25 January 2026).
- Wang, J.; Rannat, K.; Jones, J.; Sommer, M.; Dick, G.; Hanson, M. Global Navigation Satellite System (GNSS)–Precipitable Water (PW) Omnibus; GRUAN Lead Centre, Deutscher Wetterdienst (DWD): Lindenberg, Germany, 2019. [Google Scholar]
- World Meteorological Organization (WMO). Observing Systems Capability Analysis and Review Tool (OSCAR): Total Column Water Vapor (TCWV) Requirements. Available online: https://oscar.wmo.int (accessed on 25 January 2026).
- Roman, J.A.; Knuteson, R.O.; Ackerman, S.A. Time-to-Detect Trends in Precipitable Water Vapor with Varying Measurement Error. J. Clim. 2014, 27, 8259–8275. [Google Scholar] [CrossRef] [Scilit]
- Nalli, N.R.; Gambacorta, A.; Liu, Q.; Barnet, C.D.; Tan, C.; Iturbide-Sanchez, F.; Reale, T.; Sun, B.; Wilson, M.; Borg, L.; et al. Validation of Atmospheric Profile Retrievals from the SNPP NOAA Unique Combined Atmospheric Processing System (NUCAPS). Part I: Temperature and Water Vapor. IEEE Trans. Geosci. Remote Sens. 2018, 56, 180–190. [Google Scholar] [CrossRef] [Scilit]
- Dirksen, R.J.; Sommer, M.; Immler, F.J.; Hurst, D.F.; Kivi, R.; Vömel, H. Reference Quality Upper-Air Measurements: GRUAN Data Processing for the Vaisala RS92 Radiosonde. Atmos. Meas. Tech. 2014, 7, 4463–4490. [Google Scholar] [CrossRef] [Scilit]
- Van Malderen, R.; Brenot, H.; Pottiaux, E.; Beirle, S.; Hermans, M.; De Mazière, M.; Wagner, T.; De Backer, H.; Bruyninx, C. A Multi-Site Intercomparison of Integrated Water Vapour Observations for Climate Change Analysis. Atmos. Meas. Tech. 2014, 7, 2487–2512. [Google Scholar] [CrossRef] [Scilit]

Disclaimer/Publisher’s Note: The statements, opinions and data contained in all publications are solely those of the individual author(s) and contributor(s) and not of MDPI and/or the editor(s). MDPI and/or the editor(s) disclaim responsibility for any injury to people or property resulting from any ideas, methods, instructions or products referred to in the content. |
© 2026 by the authors. Licensee MDPI, Basel, Switzerland. This article is an open access article distributed under the terms and conditions of the Creative Commons Attribution (CC BY) license.