Article

DA-GDNet: A Data-Augmented Gather-and-Distribute Network for Robust SAR Target Detection
1
Tangshan Research Institute, Beijing Jiaotong University, Tangshan 063000, China
2
School of Electronic and Information Engineering, Beijing Jiaotong University, Beijing 100044, China
*
Author to whom correspondence should be addressed.
Remote Sens. 2026, 18(16), 2839; https://doi.org/10.3390/rs18162839
Submission received: 4 June 2026 / Revised: 6 July 2026 / Accepted: 14 July 2026 / Published: 21 August 2026
(This article belongs to the Section AI Remote Sensing)

Highlights

What are the main findings?
  • A physics-guided label–extract–screen–compose augmentation pipeline is proposed to generate contextually plausible and detection-oriented SAR training samples.
  • DA-GDNet integrates a Gather-and-Distribute mechanism with a Spatial Feature Enhancement Module to improve multi-scale feature fusion and target representation in cluttered SAR scenes.
What are the implications of the main findings?
  • The proposed framework improves the robustness of SAR target detection in complex backgrounds and under depression-angle variations in both the MSTAR and ATRNet-STAR datasets.
  • The combination of data augmentation and feature enhancement significantly improves detection accuracy and generalization when training data are limited.

Abstract

Synthetic Aperture Radar (SAR) possesses the capacity for all-weather imaging and is widely applied in target detection. However, robust SAR target detection remains challenging due to the limited availability of task-relevant labeled samples that jointly cover target categories, depression angles, and complex target–background contexts. In this paper, we propose a Data-Augmented Gather-and-Distribute Network (DA-GDNet) for SAR image target detection. By jointly optimizing at both the data and architectural levels, the proposed approach enhances the model’s capacity for target detection in complex backgrounds. Specifically, we design a SAR image data augmentation strategy that integrates three-dimensional modeling with deep learning. Meanwhile, we incorporate a Gather–Distribute (GD) mechanism and a Spatial Feature Enhancement Module (SFEM) to achieve efficient multi-scale feature fusion and enhance the saliency of target regions. Experimental results on the MSTAR dataset and ATRNet-STAR dataset demonstrate that DA-GDNet not only improves detection accuracy and robustness, but also significantly strengthens the model’s adaptability to variations in depression angles and complex backgrounds.

1. Introduction

Synthetic Aperture Radar (SAR) is a microwave-based remote sensing technology that offers the advantage of all-weather imaging. Unlike optical remote sensing, whose imaging performance is greatly constrained under adverse meteorological conditions, SAR can penetrate atmospheric disturbances, thereby ensuring stable image acquisition [1]. Due to the distinct scattering characteristics of incident microwaves across different surface objects, SAR exhibits unique strengths in applications such as geological exploration and target recognition. Furthermore, SAR systems are capable of acquiring polarization information through multiple polarization modes. This ability significantly improves object classification and recognition, enabling broad application in resource surveys and environmental monitoring [2].
Spatial resolution is a key factor affecting SAR target interpretation and detection. For small ground or maritime targets, higher spatial resolution can preserve more detailed scattering structures, target contours, and shadow characteristics, which are essential for distinguishing targets from cluttered backgrounds. To obtain high-resolution SAR images, advanced acquisition modes such as Spotlight, Sliding Spotlight, and Staring Spotlight have been widely investigated in spaceborne SAR systems. Compared with conventional stripmap imaging, Spotlight and Sliding Spotlight modes extend the synthetic aperture by steering the antenna beam toward the region of interest, thereby improving azimuth resolution and providing more detailed target observations [3,4,5,6]. These high-resolution imaging modes have promoted the development of SAR image interpretation tasks, including object detection, recognition, and fine-grained target analysis. Nevertheless, higher-resolution SAR images also reveal more complex scattering responses, speckle noise, shadows, and background details, which further increase the difficulty of robust target detection in cluttered scenes.
With the rapid development of deep learning [7,8,9], SAR target detection has achieved remarkable progress in recent years. However, robust detection in complex environments remains challenging. In high-resolution SAR images, small targets often exhibit detailed but unstable scattering responses, and their shadows and surrounding clutter may vary significantly with imaging geometry and depression angle. Therefore, existing methods still suffer from limited generalization under joint variations in target category, depression angle, and background clutter [10,11,12]. These limitations are closely related not only to detector design, but also to the characteristics of the training data.
It should be emphasized that the data bottleneck in SAR target detection is no longer simply the absolute number of publicly available images. Although recent datasets have considerably increased the scale of SAR data resources [13,14,15], the number of effective labeled samples available for a specific detection setting is still insufficient. Many datasets remain limited in terms of depression-angle coverage, target diversity, or complex target–background combinations. Consequently, models trained on such data are prone to overfitting to specific imaging geometries and background patterns, and their performances often degrade under unseen angles or cluttered scenes. Therefore, the core data bottleneck in SAR target detection is not the lack of raw SAR images, but the lack of task-relevant labeled samples that jointly cover target categories, depression angles, and physically plausible target–background configurations.
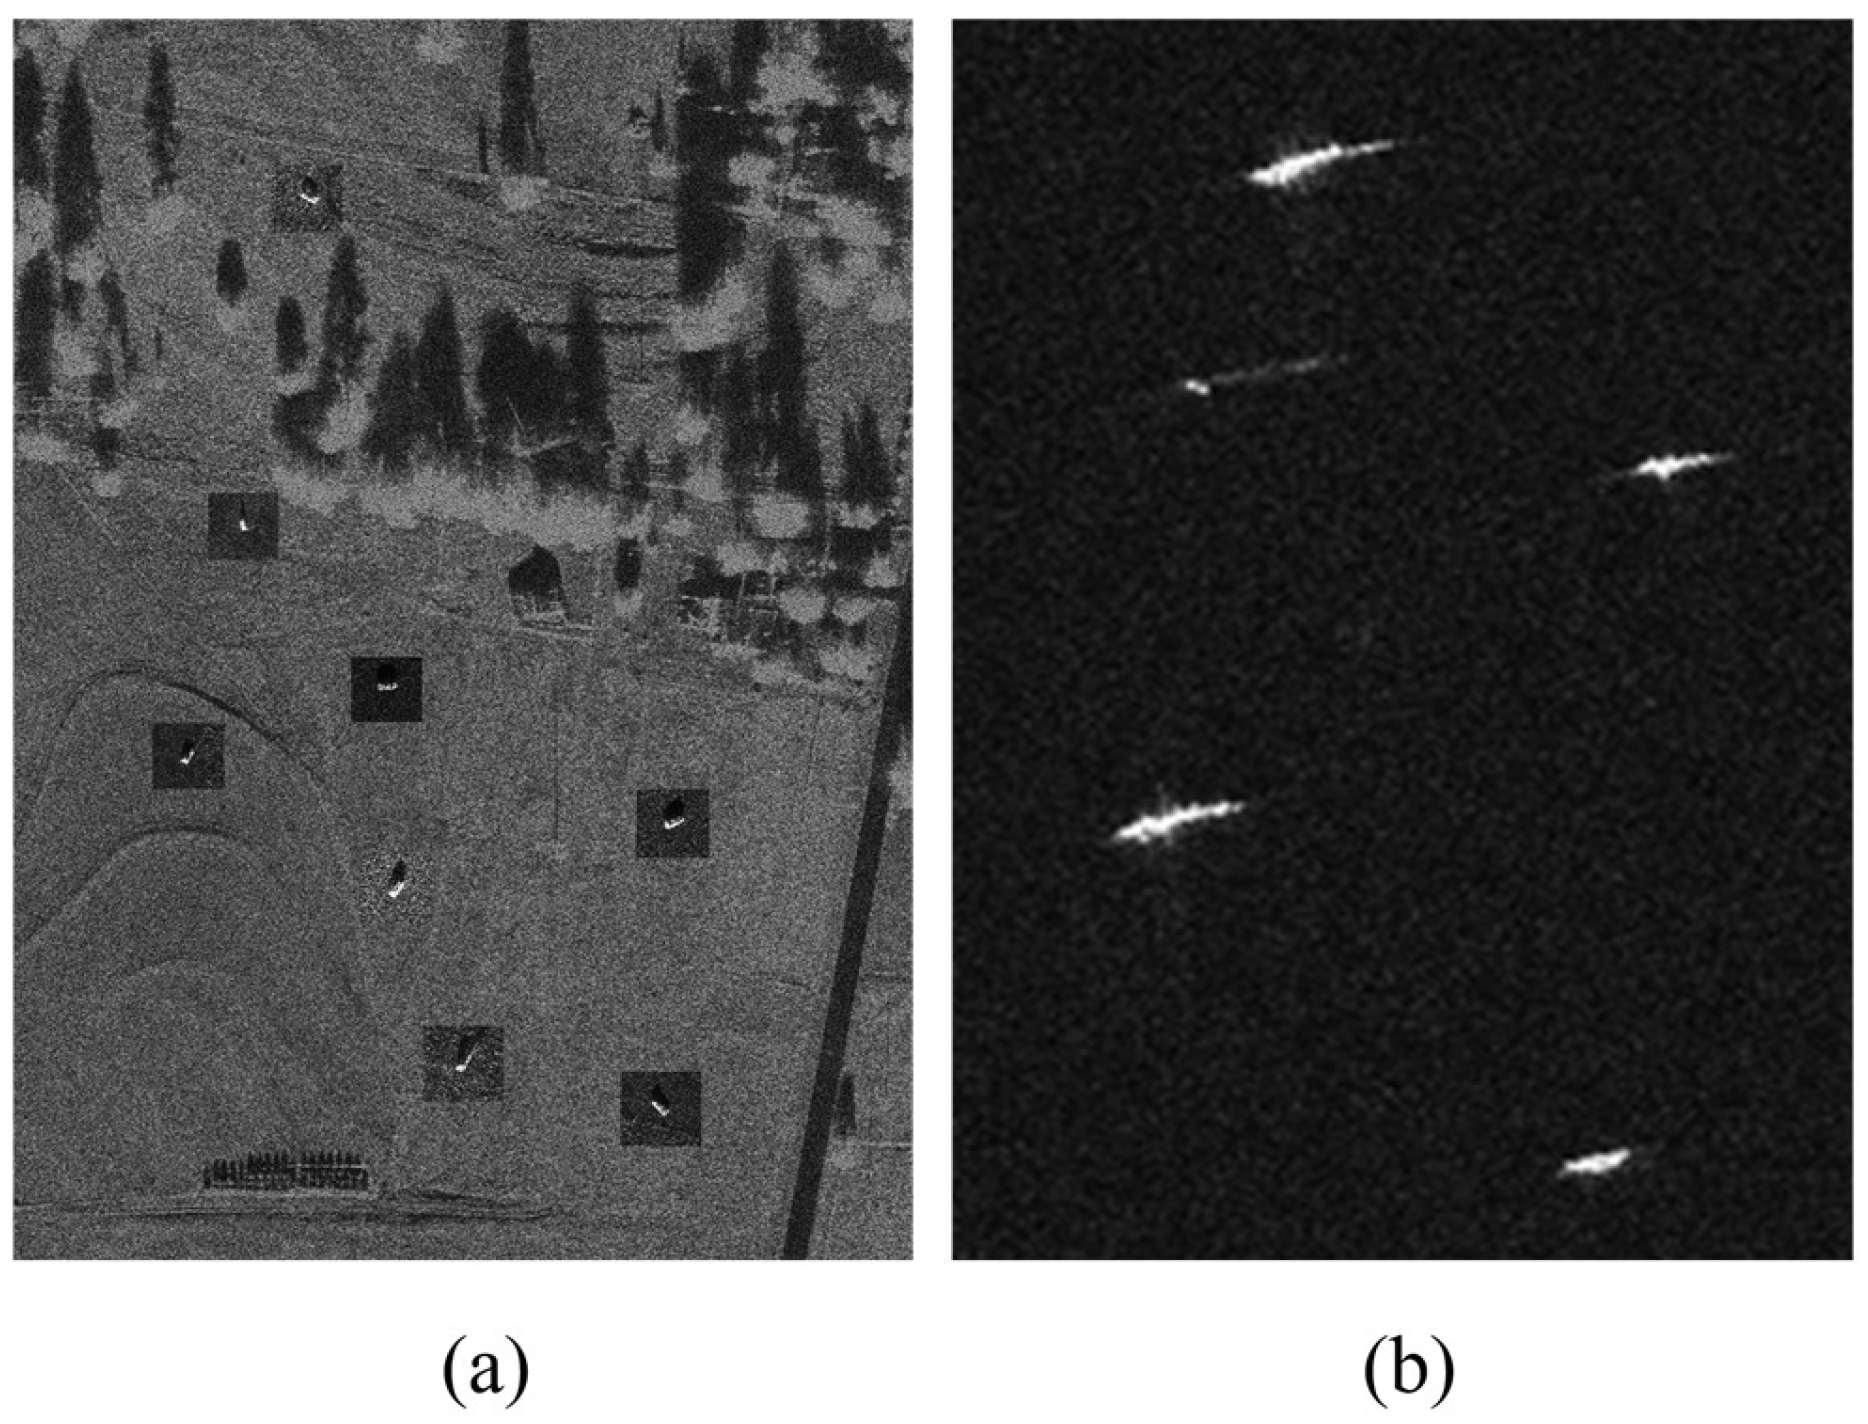
As illustrated in Figure 1, existing SAR datasets such as MSTAR and OpenSARShip may still contain unreasonable target–background configurations or insufficient depression-angle coverage, which motivates the need for more task-relevant and contextually plausible augmented samples [13,14,15,16].
To alleviate this problem, conventional data augmentation methods enlarge training sets through image-level perturbations such as translation, flipping, noise simulation, and pose variation [17,18]. More recent SAR-specific methods further explore angle- or pose-controllable generation [19,20,21], which improves target appearance diversity across viewing conditions. However, for SAR target detection, robustness depends not only on angle-related target appearance variation, but also on whether the synthesized samples preserve physically and semantically reasonable target–background relationships during training [22]. In particular, directly compositing whole target images onto new backgrounds is inadequate, because it cannot explicitly control target reuse, placement plausibility, or scene compatibility [23]. By contrast, target segmentation decouples the target signature from limited original scenes and makes the target region controllable [11] so that it can be recomposed into screened background regions to explicitly enlarge the target–background combinational space. This strategy is not intended for arbitrary copy-and-paste augmentation, but for constructing more detection-oriented training samples under complex SAR environments.
Motivated by these observations, we propose a Data-Augmented Gather–Distribute Network (DA-GDNet) for SAR target detection. The proposed augmentation pipeline is designed as a label–extract–screen–compose workflow. Specifically, physics-guided rendering provides target/shadow priors, segmentation extracts controllable target signatures from real SAR images, background screening identifies semantically suitable placement regions, and target–background fusion constructs detection-oriented samples with more plausible contextual relationships. At the architectural level, we further introduce a Gather–Distribute (GD) mechanism and a Spatial Feature Enhancement Module (SFEM) to enhance cross-scale feature fusion and suppress background interference. The main contributions of this paper are summarized as follows:
(1)
We propose a physics-guided SAR data augmentation module that integrates SARBake-based target/shadow labeling with U-Net-based segmentation, background suitability screening, and target–background fusion to generate more realistic and detection-oriented training samples.
(2)
We introduce a lightweight SAR target detection network with a GD mechanism and an SFEM module to improve multi-scale feature interaction and strengthen target representations in cluttered backgrounds.
(3)
Extensive experiments on the MSTAR and ATRNet-STAR datasets demonstrate that the proposed DA-GDNet achieves superior detection accuracy and robustness under varying depression angles and complex backgrounds.
The remainder of this paper is organized as follows. Section 2 reviews related studies on SAR target detection and SAR image data augmentation. Section 3 introduces the materials and methods, including the proposed data augmentation pipeline, the DA-GDNet architecture, datasets, experimental settings, and evaluation metrics. Section 4 presents experimental evaluations on both the MSTAR and ATRNet-STAR datasets, including ablation studies, quantitative comparisons, and qualitative and feature visualization analyses. Section 5 discusses the effectiveness of the proposed data augmentation strategy, the roles of SFEM and GD, and the robustness of DA-GDNet under depression-angle variations and complex clutter. Finally, Section 6 concludes this paper and outlines the limitations and future research directions.

2. Related Work

With the continuous advancement of deep learning technology, SAR image target detection has made remarkable progress. However, due to the intrinsic imaging characteristics of SAR images and the high cost of data acquisition, existing research still faces challenges such as the limited availability of sufficiently diverse and task-relevant labeled samples. In addition, insufficient target feature representation further limits detection performance in complex scenarios. To address these issues, researchers have been actively optimizing detection network architectures to improve model performance, while also extensively exploring data augmentation approaches to mitigate the generalization problems caused by limited data. This section reviews related work in SAR target detection and data augmentation to offer the technical background and theoretical foundation for the proposed approach.

2.1. SAR Target Detection Methods

Traditional SAR target detection methods mainly rely on handcrafted features, statistical modeling, or intensity- and texture-based descriptors. Although these methods are interpretable and effective under relatively simple backgrounds, their detection performance is often limited when target appearances change with imaging geometry, depression angle, and background clutter. With the rapid development of deep learning, SAR target detection has gradually shifted from handcrafted feature design to end-to-end feature representation learning [7,24]. However, compared with optical object detection, robust SAR target detection still faces two major challenges. First, labeled SAR samples that jointly cover target categories, depression angles, and complex target–background configurations are still insufficient. Second, SAR targets are usually small and easily affected by speckle noise, shadows, and cluttered backgrounds, which makes robust target feature extraction more difficult.

2.1.1. Low-Data Learning for SAR Target Detection

To reduce the dependence on large-scale target-level annotations, low-data learning methods, including semi-supervised learning, few-shot learning, and cross-domain transfer learning, have been widely investigated. Liao et al. [25] proposed an improved Faster R-CNN-based semi-supervised SAR target detection framework that combines a decoding module with domain adaptation, allowing unlabeled SAR images and labeled optical remote sensing images to improve detection performance when labeled SAR samples are limited. Shen et al. [26] introduced a threshold filtering semi-supervised learning method for SAR target recognition to alleviate the limited-label problem. Liao [27] further developed a semi-supervised SAR target detection framework based on YOLOv5 and cross-domain transfer learning, aiming to transfer useful knowledge from optical imagery to SAR data. Similarly, Luo et al. [28] proposed SAR-CDSS, a semi-supervised cross-domain object detection framework from optical to SAR domain, which reduces domain shifts at the image, instance, and feature levels. These methods effectively reduce annotation costs and improve model learning when labeled SAR samples are scarce. Nevertheless, they mainly optimize the learning strategy or transfer process, while the diversity of physically plausible target–background combinations is not explicitly expanded. As a result, their robustness may still degrade under unseen depression angles, complex clutter, or new target-scene configurations.

2.1.2. Few-Shot SAR Target Detection

Few-shot SAR target detection methods attempt to recognize novel categories using only a small number of annotated examples. Zhou et al. [29] proposed Gaussian meta-feature balanced aggregation for few-shot SAR target detection, which models feature distributions to reduce the bias toward base classes. Wang et al. [30] designed fine-grained prototype distillation to improve the representation of novel categories by distilling discriminative support features into detailed prototypes. These prototype- or meta-learning-based methods are effective for improving the adaptability of detectors under extremely limited samples. However, few-shot detectors mainly focus on feature transfer from base classes to novel classes, and their performance still depends strongly on whether the available samples can adequately represent target variations in depression angles, scattering characteristics, and background contexts. Therefore, few-shot learning alone is insufficient to solve the data diversity problem in complex SAR detection scenarios.

2.1.3. Attention Mechanisms and Lightweight Feature Enhancement

In addition to low-data learning, many studies improve SAR target detection by enhancing feature representation in network architectures. Since SAR targets are often small and easily confused with clutter, attention mechanisms and lightweight feature enhancement modules have been introduced to highlight target regions and suppress irrelevant background responses. SENet and ECA-Net enhance important feature responses through channel recalibration [31,32], whereas CBAM and Coordinate Attention further integrate spatial position and channel dependencies to improve the model’s focus on target regions [33,34]. In SAR detection, SAR-ShipNet combines bidirectional coordinate attention with multi-resolution feature fusion to enhance ship-target responses [35]. AMANet aggregates features from different levels through an adaptive multi-hierarchical attention module, thereby improving small-target detection in complex coastal backgrounds [36]. RSNet further explores lightweight architectural design to balance parameter efficiency and detection accuracy [37]. These attention-based or lightweight feature-enhancement methods can improve the discriminability of target features under cluttered backgrounds. However, most of them focus on enhancing features after they have already been extracted and may not fully address the joint influence of local scattering details, global spatial context, and depression-angle-induced target deformation.

2.1.4. Multi-Scale Feature Fusion

Multi-scale feature fusion is another important research line for SAR target detection, especially for small targets. FPN combines deep semantic information with shallow spatial details through a top-down pathway and lateral connections [38]. PANet further strengthens bottom-up path aggregation [39], while BiFPN introduces learnable weights to achieve more efficient multi-scale feature fusion [40]. In SAR detection, Swin-FEFPN improves SAR ship detection in complex backgrounds by combining Swin Transformer with a feature-enhancement pyramid structure [41]. CASS-Det enhances multi-scale dense target detection through center enhancement, neighbor attention, and a cross-connected FPN [42]. These multi-scale feature pyramid methods improve the ability to detect targets of different sizes by fusing features from different network stages. However, most FPN-like structures rely on layer-by-layer feature propagation. During repeated upsampling, downsampling, and convolution operations, fine-grained scattering textures and localization cues of small SAR targets may be gradually weakened. This information attenuation becomes more severe in cluttered scenes and under large depression-angle variations.
Overall, existing SAR target detection methods have improved detection robustness from different perspectives. Semi-supervised, few-shot, and transfer learning methods reduce the dependence on large-scale labeled SAR samples, but they do not explicitly increase the diversity of physically plausible target–background configurations. Attention-based and lightweight detectors enhance target saliency and suppress clutter responses to some extent, but they are usually insufficient to jointly model local target details, global contextual information, and depression-angle variations. Multi-scale feature fusion methods improve small-target representation, but conventional feature pyramid structures may still suffer from cross-layer information attenuation. Therefore, robust SAR target detection under limited labeled samples, complex clutter, and multi-angle variations still requires a unified framework that jointly improves data diversity and target feature representation. Motivated by this gap, the proposed DA-GDNet combines a physics-guided data augmentation strategy with the Spatial Feature Enhancement Module (SFEM) and Gather-and-Distribute (GD) mechanism, aiming to generate more detection-oriented SAR samples and enhance multi-scale target representations in cluttered scenes.

2.2. SAR Image Data Augmentation Methods

In SAR target detection tasks, data augmentation plays an important role in alleviating the shortage of task-relevant labeled samples and improving model generalization under complex imaging conditions. Existing SAR data augmentation methods can be broadly divided into three categories: image-level perturbation augmentation, generative augmentation, and composition-based augmentation.

2.2.1. Image-Level Perturbation Augmentation

Early SAR data augmentation studies mainly relied on image-level transformations to enlarge the training set. Typical operations include random cropping, translation, flipping, speckle noise simulation, and pose synthesis. Furukawa et al. [24] investigated random crop-based augmentation to improve the translation invariance of CNN-based SAR target classification models. Ding et al. [18] further combined translation perturbation, speckle noise simulation, and pose synthesis to improve the robustness of CNN models under limited SAR samples. In addition, Ding et al. [43] proposed a multilevel reconstruction strategy based on attributed scattering centers to generate augmented SAR target samples from a scattering-feature perspective. These methods are simple and effective for increasing local appearance diversity. However, they mainly operate on target chips or image-level perturbations and therefore have limited ability to construct new target–background combinations or simulate complex contextual variations in detection scenarios.

2.2.2. Generative Augmentation

To overcome the limited diversity of handcrafted perturbations, generative models have been widely explored for SAR image synthesis. Cui et al. [44] introduced a GAN-based SAR image augmentation method to expand SAR sensor image samples. Xie et al. [45] employed InfoGAN to control category and pose-related latent variables for SAR image generation. Wang et al. [20] proposed an azimuth-controllable GAN to synthesize SAR target images with controllable azimuth angles, while Zeng et al. [19] developed ATGAN to generate SAR target images for automatic target recognition with improved angle-related controllability. For detection-oriented generation, Ju et al. [46] proposed a GAN-based SAR image generation method for oriented ship detection, and Ju et al. [22] further developed SARGAN for SAR ship detection by incorporating task-related constraints. These methods effectively improve target appearance diversity and angle-related sample coverage. Nevertheless, most generative approaches focus primarily on synthesizing target appearance or complete image samples, while the physical and semantic compatibility among target scale, placement location, shadow distribution, and surrounding background is still not explicitly guaranteed.

2.2.3. Composition-Based Augmentation

Another line of research attempts to enrich training data by recomposing target and background information. In general computer vision, copy-paste augmentation has shown that instance-level recomposition can improve data efficiency, especially when annotated samples are limited [47]. Context-aware augmentation further demonstrates that object placement should consider whether the surrounding scene is suitable, because random pasting may introduce unrealistic samples and hurt detection performance [23]. In SAR imagery, Geng et al. [48] explored clutter transfer to synthesize SAR samples with diverse background clutter, showing the importance of background variation for SAR target recognition. Zhao et al. [49] incorporated target and shadow information and proposed a geometry-based augmentation strategy to compensate for shadow distortion under different depression angles. These studies indicate that target–background composition and shadow-related geometry are important for SAR data augmentation. However, existing composition-based methods still do not sufficiently address the joint control of target extraction, placement suitability, target–shadow consistency, and background compatibility in complex SAR detection scenes.
To address these limitations, our method introduces a structured label–extract–screen–compose augmentation workflow. Specifically, physics-guided target/shadow labeling provides prior information for target and shadow regions; segmentation-based target extraction decouples target signatures from limited original scenes; background suitability screening identifies semantically reasonable placement regions; and target–background fusion constructs detection-oriented training samples with more plausible contextual relationships. Compared with image-level perturbation and generative augmentation methods, the proposed strategy not only enriches depression-angle-related target appearance, but also explicitly expands the target–background combinational space for robust SAR target detection.

3. Materials and Methods

To enhance SAR target detection accuracy and generalization, we propose a unified framework integrating data-level augmentation with architecture-level optimization. At the data level, a dedicated module synthesizes physically plausible and detection-oriented SAR samples by incorporating target–shadow geometric priors and background suitability constraints. Architecturally, the improved network incorporates a Gather–Distribute mechanism for multi-scale feature fusion and a spatial feature enhancement strategy to highlight targets while suppressing background interference. This joint optimization effectively bridges the gap between limited data resources and robust detection in complex scenarios.

3.1. Data Augmentation

To achieve high-quality SAR image data augmentation, our augmentation module integrates three core components: target segmentation, background region classification, and target–background fusion. This design ensures both semantic plausibility and physical interpretability of the synthesized data, while simultaneously providing diverse and realistic samples to improve the generalization capability of the subsequent detection network.

3.1.1. Target Segmentation

The SARBake algorithm [50] is a synthetic label-generation method based on high- precision physical modeling that can achieve precise annotation of target and background regions in SAR images through the combined use of 3D modeling and geometric projection.
The role of SARBake in our framework is not to fully simulate the electromagnetic scattering process, but to provide geometry-based target and shadow priors derived from SAR imaging geometry. In SAR images, the target body and its radar shadow are closely related to the radar line-of-sight direction, target geometry, and depression angle. Compared with manually cropped target patches or purely image-level transformations, SARBake-derived labels provide explicit target/shadow separation and thus offer more reliable geometric supervision for subsequent target and shadow extraction.
This method approximates the geometric projection process of SAR imaging using a 3D CAD model as the basis. In the rendering stage, SARBake independently renders the target body and the ground region to construct a complete imaging scene. Subsequently, a geometric projection method is applied to analyze each radar line of sight. It calculates the distance between surface points on the target and their corresponding points on the ground to identify and determine regions with potential occlusion relationships. Based on this analysis, the shadow regions cast by the target are automatically generated and distinguished from both the target and the background, resulting in precise pixel-level label maps comprising target, shadow, and background. The detailed procedure of this algorithm is shown in Algorithm 1.
Although SARBake provides geometry-based target/shadow labels from 3D CAD models, pure geometric projection cannot fully account for speckle noise, complex background clutter, and scattering variations in real SAR images. To bridge the gap between geometry-based priors and real SAR pixel distributions, we employ U-Net [51] as a supervised segmentation network trained with SARBake-derived labels. Specifically, SARBake first generates pixel-level label maps that distinguish the object, its radar shadow, and the background according to the imaging geometry. These label maps are then used to supervise U-Net training on real SAR images. After training, U-Net predicts the object and shadow masks, which are used to extract the corresponding regions for subsequent data augmentation. This integration improves target-extraction accuracy and supports better generalization across depression angles, providing more reliable training samples for subsequent target detection.
Algorithm 1 SARBake Algorithm
Input: Target model M, ground plane G p , viewpoint set Rdir = {r1, r2, …, rn}, rendering resolution W × H, camera parameters (radius Rc, viewport size Sc, near and far clipping planes Zn, Zf), and viewpoint file Fv.
Output: Depth map set D = {D1, D2, …, DN} and pixel label map Lmap.
Step 1: Scene and Parameter Initialization.
 Initialize the rendering environment and parse the input parameters. Load the target model M and perform unit normalization. Construct the ground plane G p as a reference geometry. Extract the predefined viewpoint set Rdir from the viewpoint file Fv, where each viewpoint is defined by an elevation angle θi and an azimuth angle φi.
Step 2: Separate Rendering of Target and Ground.
 Use an orthographic projection camera to render the target model M and the ground plane Gp separately.
Step 3: Far-Field Viewpoint Setup and Depth Map Generation.
 For each viewpoint riRdir:
 1. Compute the camera position: ci = (Rc·sinθi·cosφi, Rc·sinθi·sinφi, Rc·cosθi).
 2. Set the camera orientation toward the origin o = (0, 0, 0), with the viewport range defined as [−Sc/2, Sc/2] × [−Sc/2, Sc/2].
 3. Render the depth buffer to generate the depth map Di.
Step 4: Definition of Radar Line-of-Sight Directions.
 Define the viewpoint set Rdir as the collection of radar line-of-sight directions, where each line-of-sight ri corresponds to a depth map Di.
Step 5: Depth Map Processing and Occlusion Analysis.
 For each line-of-sight ri and its corresponding depth map Di:
 1. Extract the set of depth values Pi = {p1, p2,…, pN} and sort them in ascending order by distance, where pj denotes the depth value of a pixel.
 2. Initialize the occlusion reference point as p0 = p1.
 3. For each pixel point pj (j = 2, …, N), compute the theoretical height hjt at position pj along the occlusion line extended from p0.
 4. If pj < hjt, mark pj as a shadow pixel; otherwise, mark pj as a target pixel or ground pixel depending on the rendered object, and update p0.
Step 6: Coordinate System Mapping.
 Map each point in the rendered image to the radar coordinate system (x, r), where x denotes the horizontal coordinate on the image plane and r represents the depth value pj from the camera to the point.
Step 7: Depth Map Resampling and Label Map Generation.
 For each depth map Di, perform column-wise resampling to obtain the corresponding pixel label map Lmap,i.
 Combine all Lmap,i to construct the global label map Lmap.
Step 8: Output Results.
 Return the set of depth maps D and the label map Lmap.

3.1.2. Background Region Classification

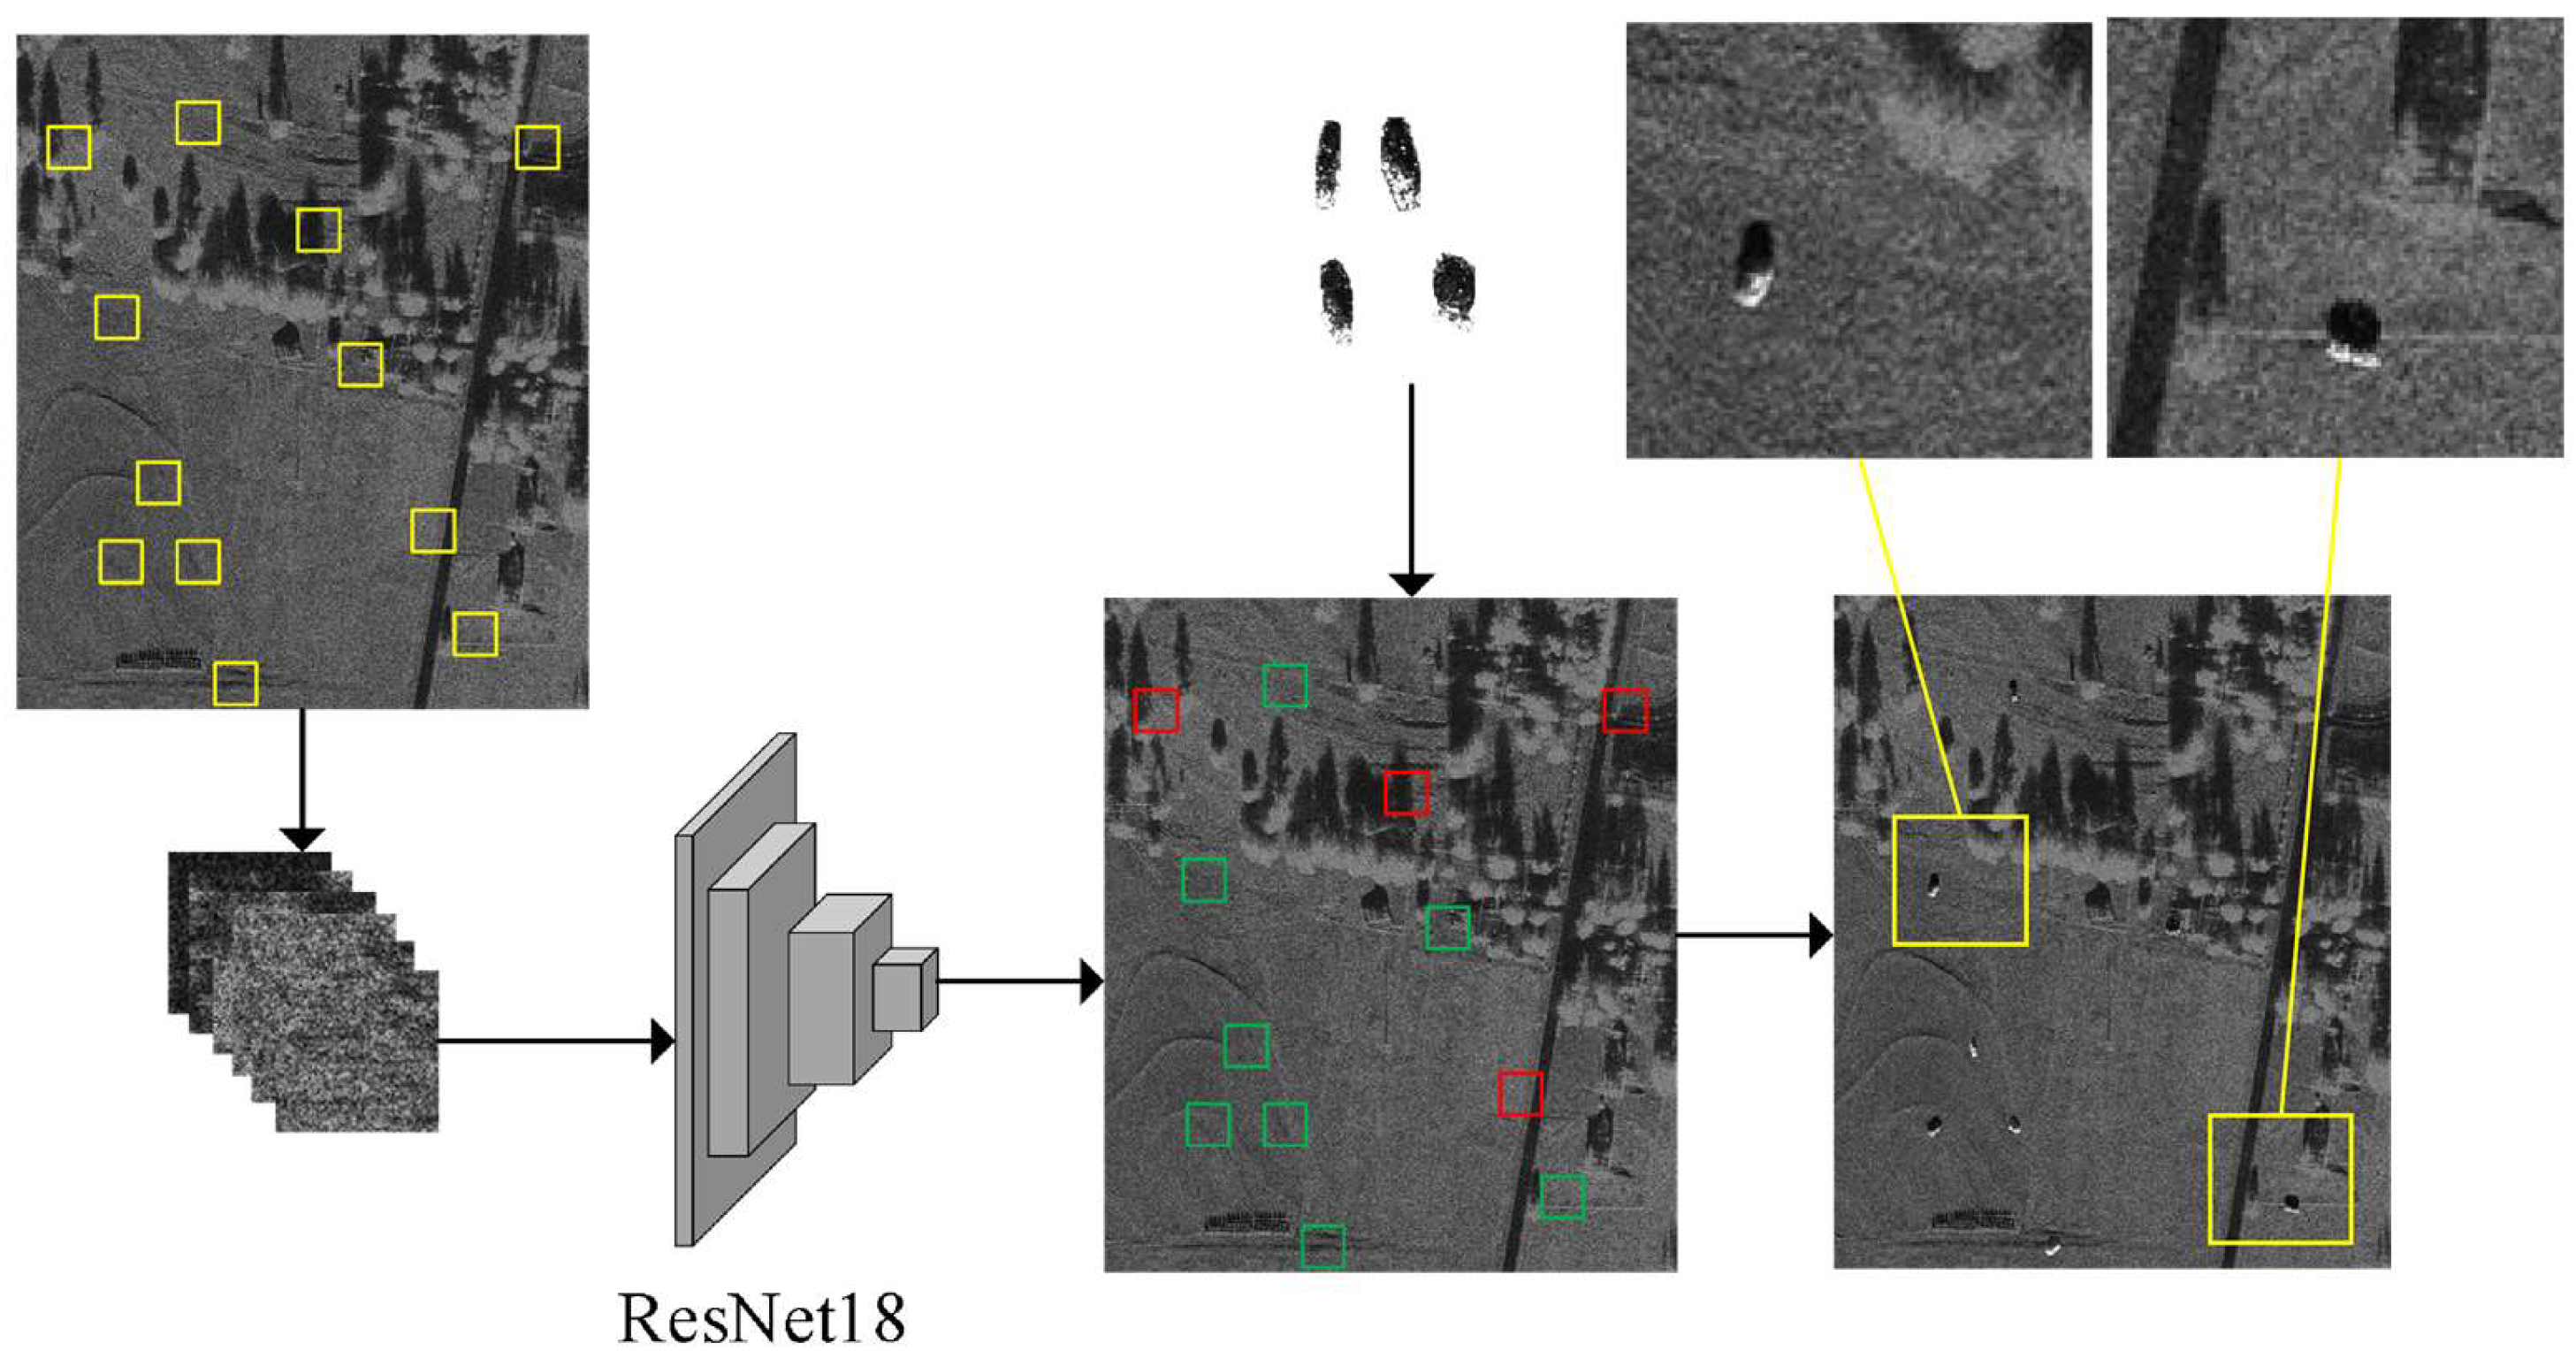
In synthetic data generation, arbitrarily placing target patches on background images may introduce semantic inconsistencies and physically implausible samples, such as vehicles appearing in lakes, dense forests, or overlapping with existing structures. Such unrealistic composites can confuse the detector and degrade its generalization. To avoid this problem, we formulate background suitability estimation as a patch-level binary classification task and employ ResNet18 [52] to distinguish placeable from non-placeable SAR background regions. ResNet18 is adopted because it provides sufficient representation capability with a lightweight structure, reducing the risk of overfitting under limited manually annotated background patches.
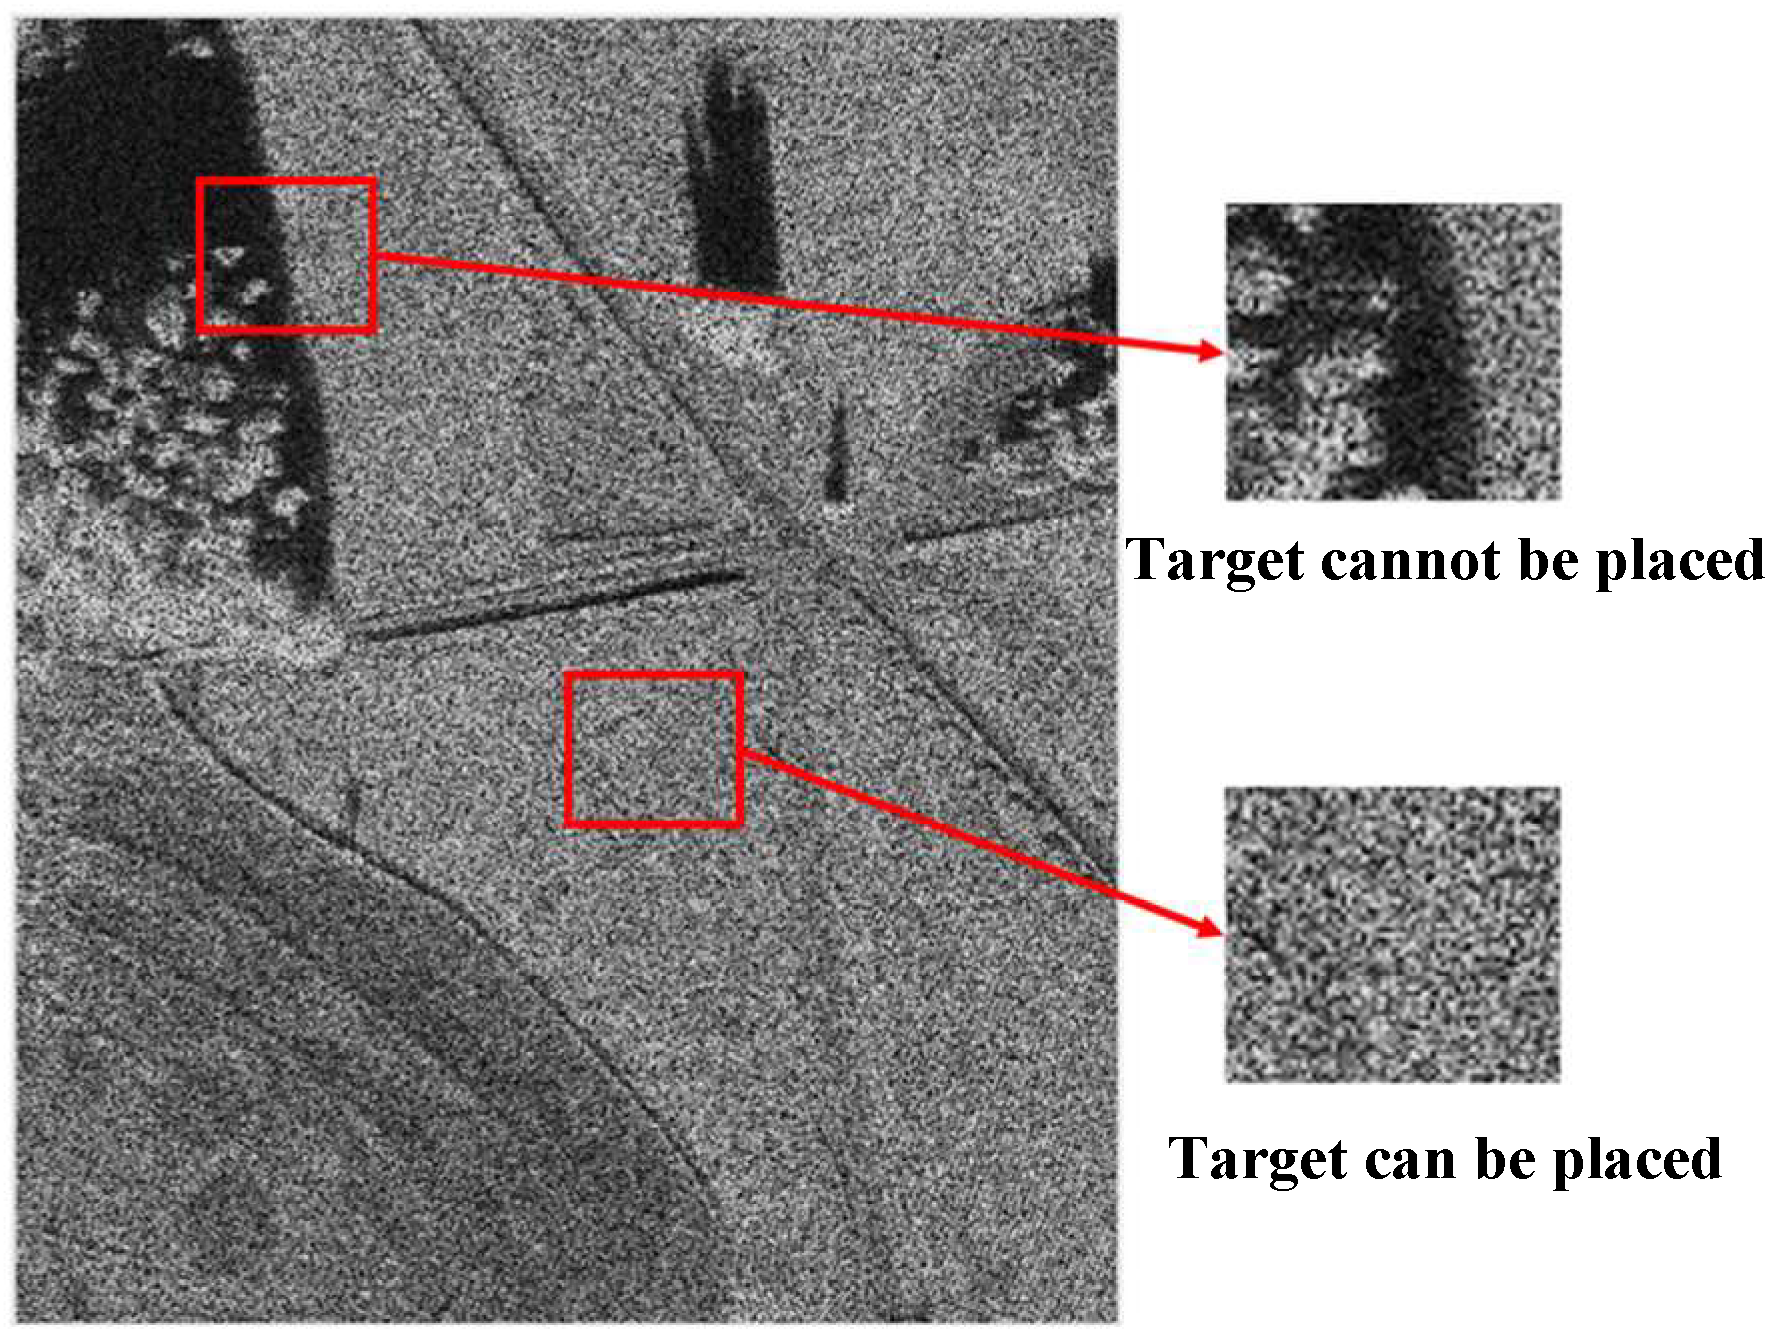
Specifically, to train the model, ten background images with size of a 1400 × 1700 pixels are randomly selected. Using a non-overlapping sliding window strategy, each image is divided into multiple non-overlapping regions of size 100 × 100. These candidate regions are then manually annotated as either placeable or non-placeable. The non-placeable regions primarily correspond to areas where targets are already present or where background features (such as forests or man-made structures) make target placement unsuitable, as illustrated in Figure 2.
After annotation, these patches and corresponding labels are used as supervised data for training the ResNet18 network. During training, the network employs the cross-entropy loss to quantify the error between the predicted classes and the ground truth labels. During the testing phase, the SAR images in the test set are similarly divided into 100 non-overlapping candidate regions of size 100 × 100 using the sliding window approach, and the trained ResNet18 model is then used to perform classification predictions on these regions.
Finally, a binary mask with the same dimensions as the original SAR image is generated. Through the above background region classification method, the accuracy and rationality of subsequent target detection and placement are ensured.
It should be noted that the background classifier serves solely as a data-quality control component in the offline academic augmentation pipeline. Its function is limited to reducing visually implausible synthetic composites and does not involve the evaluation of tactical suitability, geographic importance, accessibility, or operational deployment conditions.

3.1.3. Target–Background Fusion

If we directly put the target patch on the background image, noticeable artificial boundaries may appear. To ensure natural and coherent integration between the target object and the background image, the target object is first preprocessed through operations such as rotation, flipping, and normalization. These steps increase data diversity while maintaining consistency. Subsequently, 50 candidate regions of size 100 × 100 pixels are randomly selected using a non-overlapping sliding window strategy. The trained background classification network is then employed to evaluate these candidate regions, from which 5 to 15 regions are randomly chosen from the top 20 with the highest confidence scores for target placement. This strategy balances placement reliability and sample diversity: selecting from top-ranked regions avoids physically or semantically unreasonable placement, while random sampling prevents repeated placement in visually similar backgrounds. The number of selected regions is limited to 5–15 to avoid excessive target density in a single SAR scene. The overall process is illustrated in Figure 3.
Afterwards, the Alpha blending technique is used to integrate the target object with the background image. Alpha blending can effectively control the transparency between the target object and the background, thereby achieving a smooth transition. Specifically, the process of the Alpha blending technique can be expressed as:
I f u s e ( x , y ) = α I f g ( x , y ) + ( 1 α ) I b g ( x , y ) ,
where Ifg(x,y), Ibg(x,y) and Ifuse(x,y) denote the pixel value of the target object, the background image and the fused image. α is the transparency (Alpha value) of the target image.
Through the background region classification and target–background fusion, the rationality of target placement is effectively improved, providing solid data support and methodological foundation for subsequent target detection.

3.2. Target Detection Model

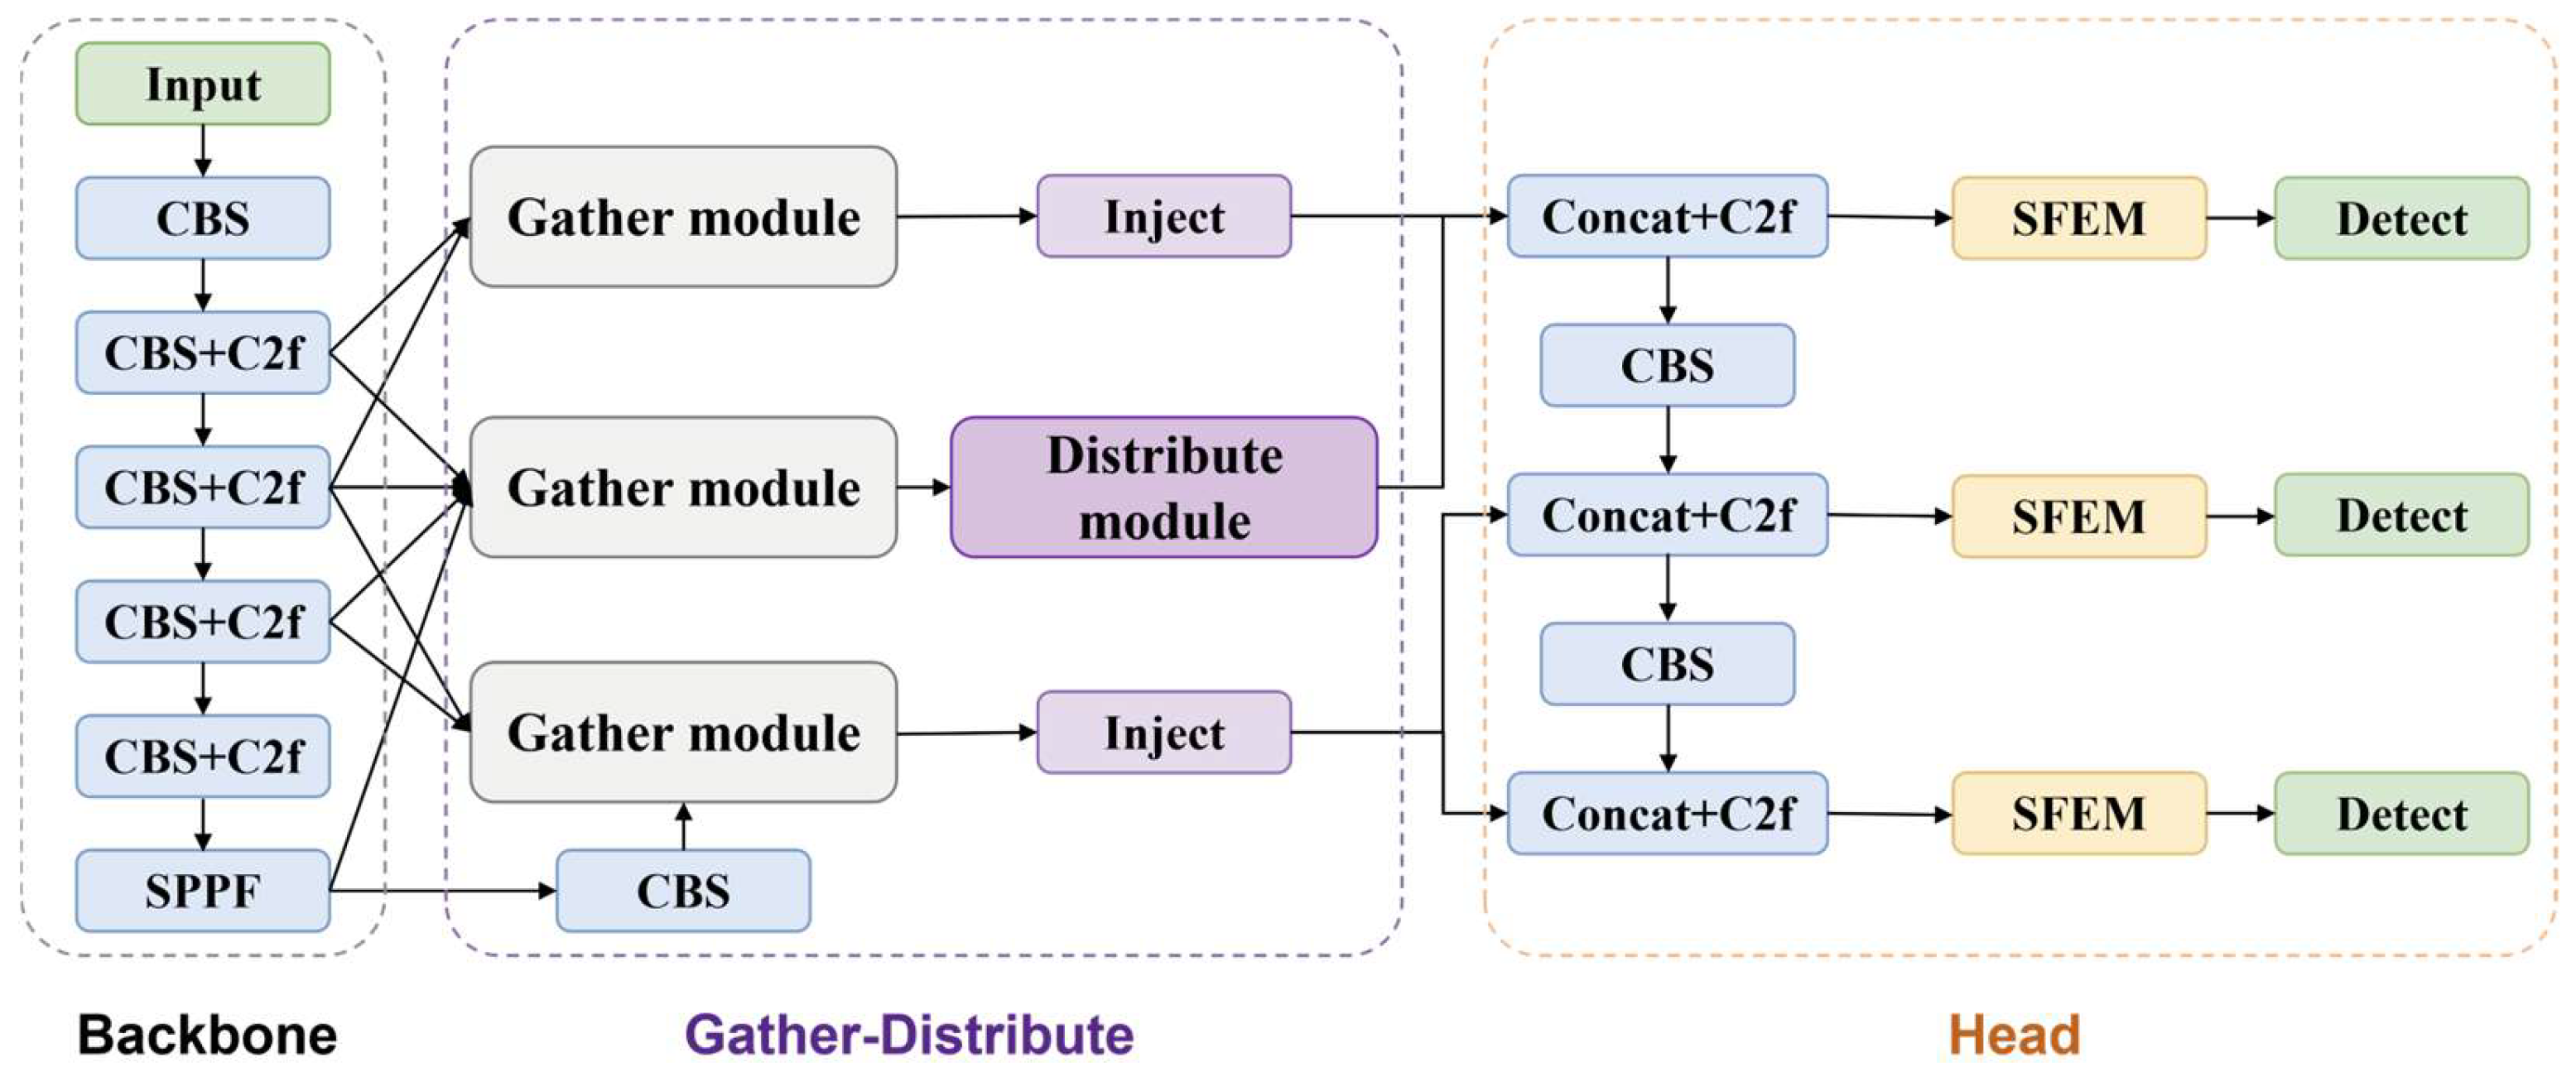
To enhance the feature modeling capability and detection accuracy of the target detection network for complex SAR scenes while maintaining the network lightweight and detection speed, we improve YOLOv8-s [7] target detector. Specifically, a Spatial Feature Enhancement Module (SFEM) and a Gather and Distribute (GD) mechanism are developed.

3.2.1. Spatial Feature Enhancement Module

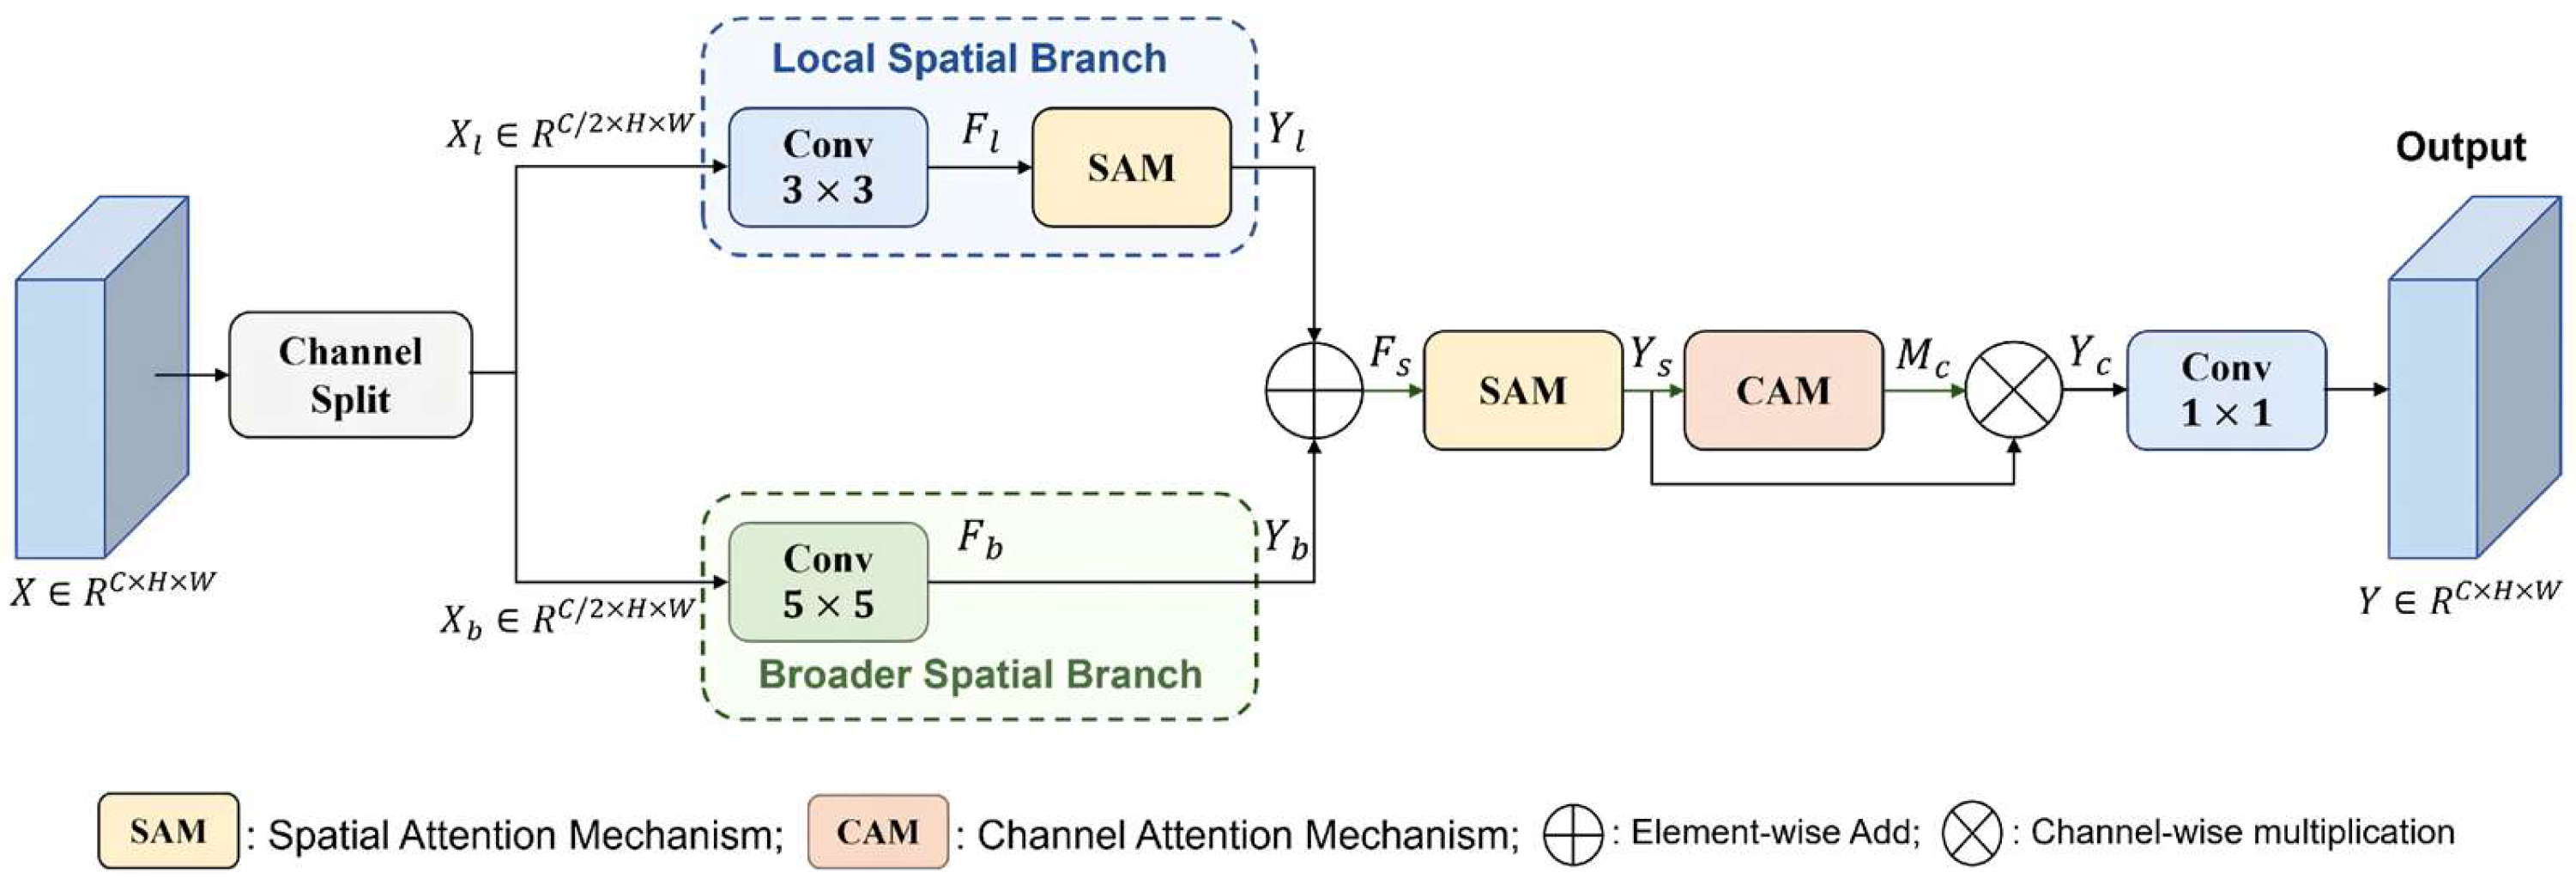
To achieve effective dynamic recalibration of features, inspired by classical attention mechanisms such as SE [31] and CBAM [33], we design the Spatial Feature Enhancement Module (SFEM), which is illustrated in Figure 4. The main idea of SFEM is to dynamically strengthen the discriminative power of feature maps by parallel modeling of local and global spatial contextual information. Structurally, SFEM adopts a channel-wise split-processing strategy combined with parallel convolution operations of multiple receptive fields, effectively improving the network ability to perceive spatial details and model contextual information. This design is particularly suitable for detecting small targets in SAR images.
Given an input feature map X R C × H × W , it is first split along the channel dimension into two sub-feature maps, X l , X b R C / 2 × H × W . These two sub-features are then processed in parallel to capture multi-scale spatial contexts.
Local Context Branch (Top): X l passes through a convolution layer ( 3 × 3 ) to extract intermediate local features F l . A Spatial Attention Mechanism (SAM) is then applied to emphasize salient spatial details:
F l = C o n v 3 × 3 ( X l ) ,
Y l = F l σ ( C o n v ( [ A v g P o o l ( F l ) ; M a x P o o l ( F l ) ] ) ) ,
where C o n v 3 × 3 ( ) represents a 3 × 3 convolution operation. A v g P o o l ( ) and M a x P o o l ( ) denote channel-wise average pooling and max pooling, respectively. σ ( ) is the sigmoid activation function, and denotes element-wise multiplication. Y l is the local-context output after spatial attention refinement.
Broader Context Branch (Bottom): X b passes through a parallel convolution layer ( 5 × 5 ) to capture broader contextual information:
Y b = C o n v 5 × 5 ( X b ) ,
where C o n v 5 × 5 ( ) represents a 5 × 5 convolution operation, and Y b is the output feature of the broader-context branch.
Feature Fusion and Refinement: The outputs from the two branches are fused via element-wise addition. To recalibrate the spatial importance across the aggregated multi-scale features, the summed feature map F s undergoes a second Spatial Attention Mechanism (SAM), yielding the refined feature Y s :
F s = Y l + Y b ,
Y s = F s σ ( C o n v ( [ A v g P o o l ( F s ) ; M a x P o o l ( F s ) ] ) ) ,
where the second SAM further estimates the spatial attention map from F s , and Y s represents the spatially refined multi-scale feature.
Channel Attention Mechanism (CAM): Finally, Y s is fed into a Channel Attention Mechanism (CAM) to recalibrate the importance of different feature channels. The channel attention weight M c is generated by applying average pooling and max pooling followed by shared fully connected layers:
M c = σ ( F C ( A v g P o o l ( Y s ) ) + F C ( M a x P o o l ( Y s ) ) ) ,
where F C ( ) represents the shared fully connected layers used to generate channel descriptor.
The attention weight M c is then multiplied with Y s along the channel dimension to obtain the channel-recalibrated feature:
Y c = Y s M c ,
where denotes channel-wise multiplication.
Since the preceding channel split and element-wise fusion reduce the channel dimension to C / 2 , a 1 × 1 convolution ( C o n v 1 × 1 ) is further applied to restore the channel dimension and produce the final output feature:
Y = C o n v 1 × 1 ( Y c ) ,
In SAR images, targets exhibit significant variations under different depression angles. In particular, at larger depression angles, target distortion and background noise make target detection more challenging. Through its local and global scale spatial attention mechanism, our SFEM effectively adapts to changes in target size and spatial relationships across different depression angles in SAR imagery. The subsequent channel attention fusion further enables precise recalibration of the importance of each feature channel, enhancing informative features while suppressing distracting ones.

3.2.2. Gather-And-Distribute Mechanism

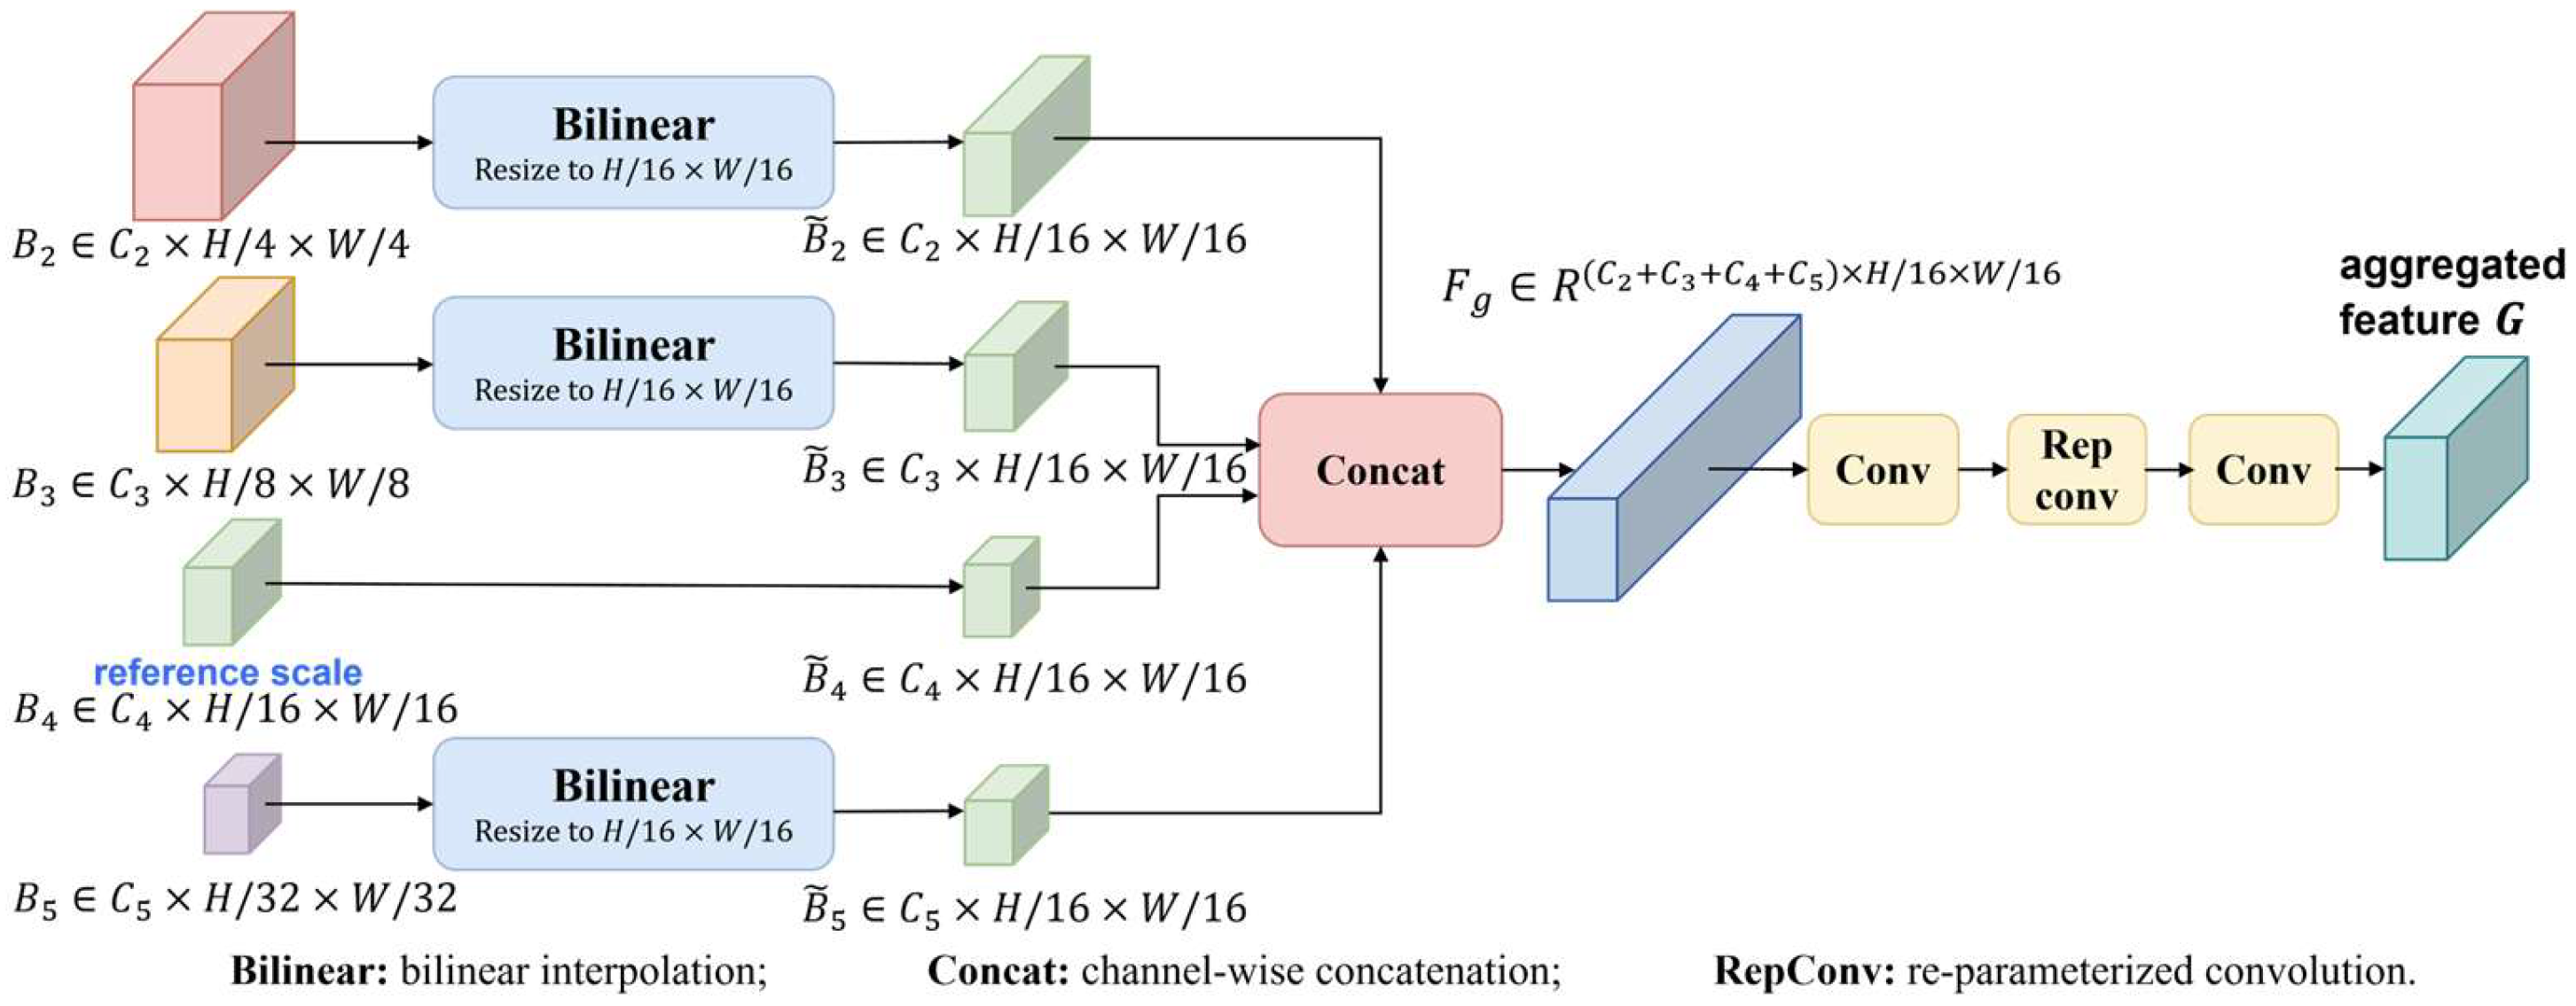
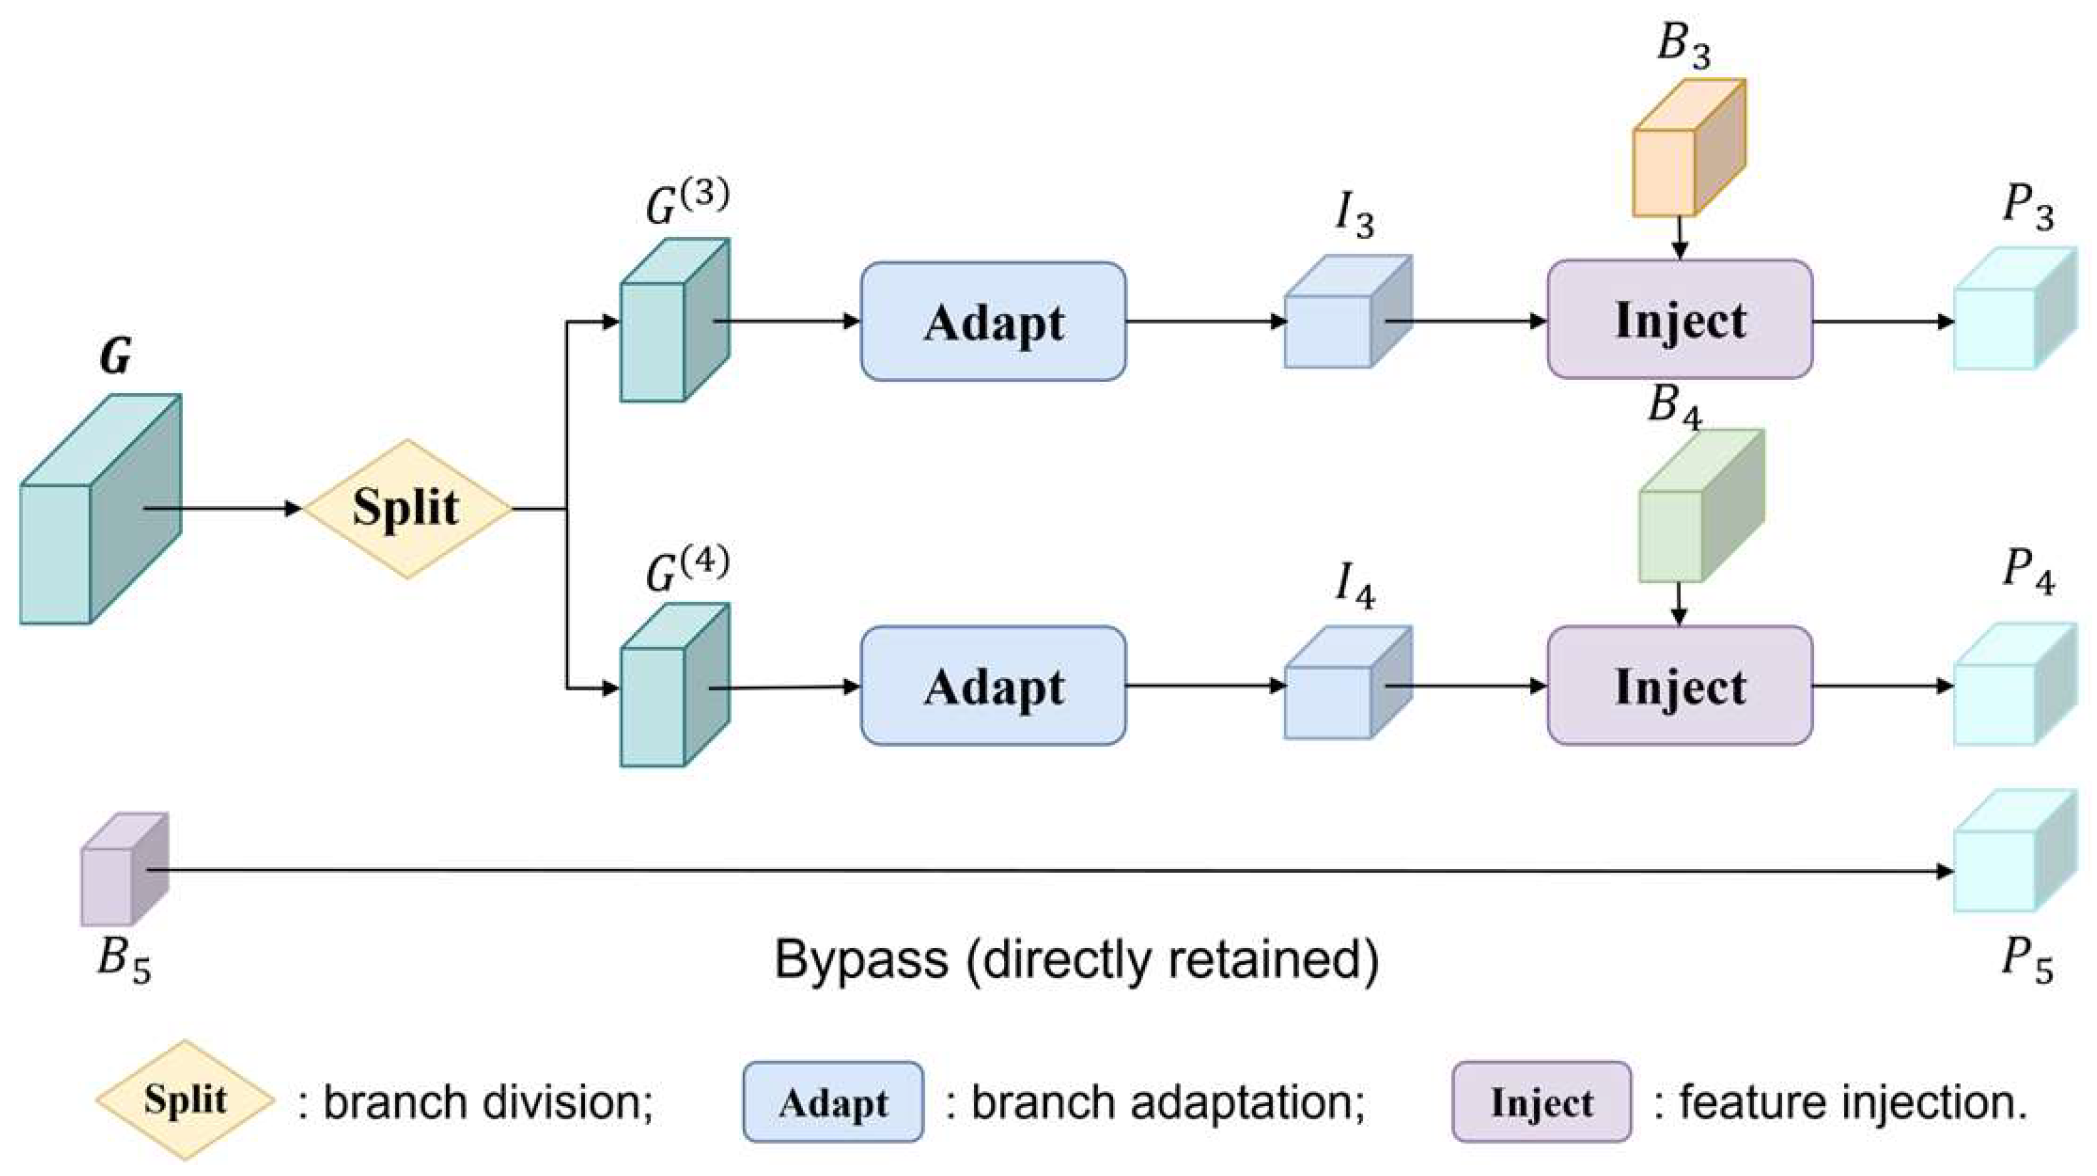
For information fusion in the detection network, information loss may still occur during cross-layer feature interactions. To alleviate this problem, we introduce a Gather-and-Distribute (GD) mechanism, which aggregates multi-level features and redistributes the fused representation to different detection layers. The GD mechanism consists of two stages, the Gather stage and the Distribute stage, as illustrated in Figure 5 and Figure 6, respectively.
Let { B i } i = 2 5 denote the input feature maps from different network stages, which are defined as
B i R C i × H i × W i ,
As shown in Figure 5, B 2 , B 3 , B 4 , and B 5 have spatial resolutions of 1 / 4 , 1 / 8 , 1 / 16 , and 1 / 32 of the input image, respectively. To effectively fuse multi-scale features, B 4 is selected as the reference scale. The feature maps from the other stages are resized to the same spatial resolution as B 4 using bilinear interpolation:
B ~ i = R i 4 ( B i ) , i { 2,3 , 5 } ,
where R i 4 ( ) denotes the bilinear interpolation operation that resizes the feature map from the i -th stage to the spatial resolution of B 4 . After this operation, B 2 , B 3 , and B 5 are spatially aligned with B 4 for subsequent feature concatenation.
For the reference feature map, no resizing is applied:
B ~ 4 = B 4 ,
Then, the aligned multi-level features are concatenated along the channel dimension:
F g = Concat ( B ~ 2 , B ~ 3 , B ~ 4 , B ~ 5 ) ,
where C o n c a t ( ) denotes channel-wise concatenation, and F g represents the concatenated multi-level feature that integrates information from different network depths.
The concatenated feature F g contains both low-level spatial details and high-level semantic information. However, direct concatenation may introduce channel redundancy and mixed scale-level responses. Therefore, a convolutional fusion block consisting of Conv–RepConv–Conv is adopted to compress redundant channels and enhance feature representation:
G = ϕ 3 ( R e p C o n v ( ϕ 2 ( F g ) ) ) ,
where ϕ 2 ( ) and ϕ 3 ( ) denote standard convolution operations, R e p C o n v ( ) denotes the re-parameterized convolution module, and G is the aggregated feature produced by the Gather stage.
Through this process, the Gather module integrates features from different network depths at a unified spatial scale. Low-level features provide fine-grained edge, texture, and localization cues, while high-level features contribute stronger semantic representations. After Conv–RepConv–Conv fusion, the aggregated feature G can simultaneously preserve spatial details for target localization and semantic context for background suppression, thereby providing a more informative global representation for the subsequent Distribute stage.
As shown in Figure 6, after obtaining the aggregated feature G , the Distribute module first splits it into two branches:
[ G ( 3 ) , G ( 4 ) ] = Split ( G ) ,
where S p l i t ( ) denotes the channel-wise split operation.
The two branches G 3 and G 4 are then adapted to the corresponding feature levels, producing I 3 and I 4 , which are injected into B 3 and B 4 , respectively:
I l = A l ( G ( l ) ) , l { 3,4 } ,
P l = J l ( B l , I l ) , l { 3,4 } ,
where A l ( ) denotes the branch adaptation operation that adjusts G l to the spatial size and channel dimension of the corresponding feature level. I l is the adapted feature for the l -th detection layer. J l ( ) denotes the Inject operation that fuses the original feature B l with the adapted contextual feature I l , and P l is the enhanced output feature after injection.
The highest-level feature is directly retained as:
P 5 = B 5 ,
Therefore, the output multi-scale features of the Distribute stage are expressed as:
{ P 3 , P 4 , P 5 } = { J 3 ( B 3 , I 3 ) , J 4 ( B 4 , I 4 ) , B 5 } ,
where P 3 , P 4 , and P 5 denote the final output features of the Distribute stage at different scales. These features are used by the subsequent detection head for multi-scale SAR target detection.
Through this design, the Distribute module injects the global representation obtained from multi-level feature aggregation back into the key detection layers. Since B 3 retains more spatial details and localization cues, the enhanced feature P 3 is beneficial for small SAR target localization. Meanwhile, B 4 provides a better balance between spatial resolution and semantic abstraction, allowing P 4 to incorporate both contextual and discriminative information. By injecting the adapted contextual features into B 3 and B 4 , the network can preserve local details while incorporating global semantic information, thereby improving the discriminability between target regions and background clutter.
Compared with the layer-by-layer propagation in conventional FPN/PAN structures, the Distribute module redistributes the global aggregated feature G , obtained from B 2 , B 3 , B 4 , and B 5 , to the key detection layers through split, adaptation, and injection operations. This design shortens the cross-scale information propagation path and reduces information attenuation caused by long cross-scale interactions. For SAR target detection, where targets are usually small and easily affected by speckle noise, shadow variations, and background clutter, the Distribute module enhances the responses of true target regions while suppressing irrelevant background activations, leading to improved robustness under complex scenes and varying depression angles.
The information gathering stage ensures that features of different scales are thoroughly fused, while the information distribution stage allocates these features appropriately so that each layer gains access to global contextual information. This innovative feature fusion strategy enables YOLOv8 to more precisely capture information across scales from coarse to fine, thereby enhancing its ability to detect targets, particularly small ones. Finally, the overall network architecture is shown in Figure 7.

3.2.3. Loss Function of DA-GDNet Detector

To train the proposed DA-GDNet detector, we adopt the same multi-task detection loss as the YOLOv8-based detector. It consists of three components: bounding-box localization loss, classification loss, and distribution focal loss. The overall detection loss is formulated as:
L d e t = λ b o x L b o x + λ c l s L c l s + λ d f l L d f l ,
where L b o x , L c l s , and L d f l denote the bounding-box localization loss, classification loss, and distribution focal loss, respectively. The coefficients λ b o x , λ c l s , and λ d f l are used to balance the contributions of different loss terms.
For bounding-box localization, Complete IoU (CIoU) loss is adopted to measure the mismatch between the predicted bounding box and the ground-truth bounding box:
L b o x = i = 1 N p o s ( 1 C I o U ( b i , b i g t ) ) ,
where N p o s is the number of positive samples, and b i and b i g t denote the predicted bounding box and the corresponding ground-truth box, respectively.
The classification loss is implemented using BCEWithLogitsLoss, which combines sigmoid activation with binary cross-entropy. It is defined as follows:
L c l s = i = 1 N c = 1 C [ y i c l o g ( σ ( s i c ) ) + ( 1 y i c ) l o g ( 1 σ ( s i c ) ) ] ,
where N is the number of prediction samples, C is the number of target categories, s i c is the classification logit of the i -th prediction for class c , σ ( ) denotes the sigmoid function, and y i c is the corresponding ground-truth class label.
In addition, Distribution Focal Loss (DFL) is used to refine bounding-box regression by modeling the bounding-box offsets as discrete probability distributions. It can be expressed as:
L d f l = i = 1 N p o s [ w l log P i ( l ) + w r log P i ( r ) ] ,
where P i ( l ) and P i ( r ) denote the predicted probabilities of the two adjacent discrete bins around the target regression value, and w l and w r are the corresponding interpolation weights. By modeling the bounding-box offsets in a distributional form, DFL improves localization precision, especially for small SAR targets with weak contours and cluttered surroundings.

3.3. Datasets

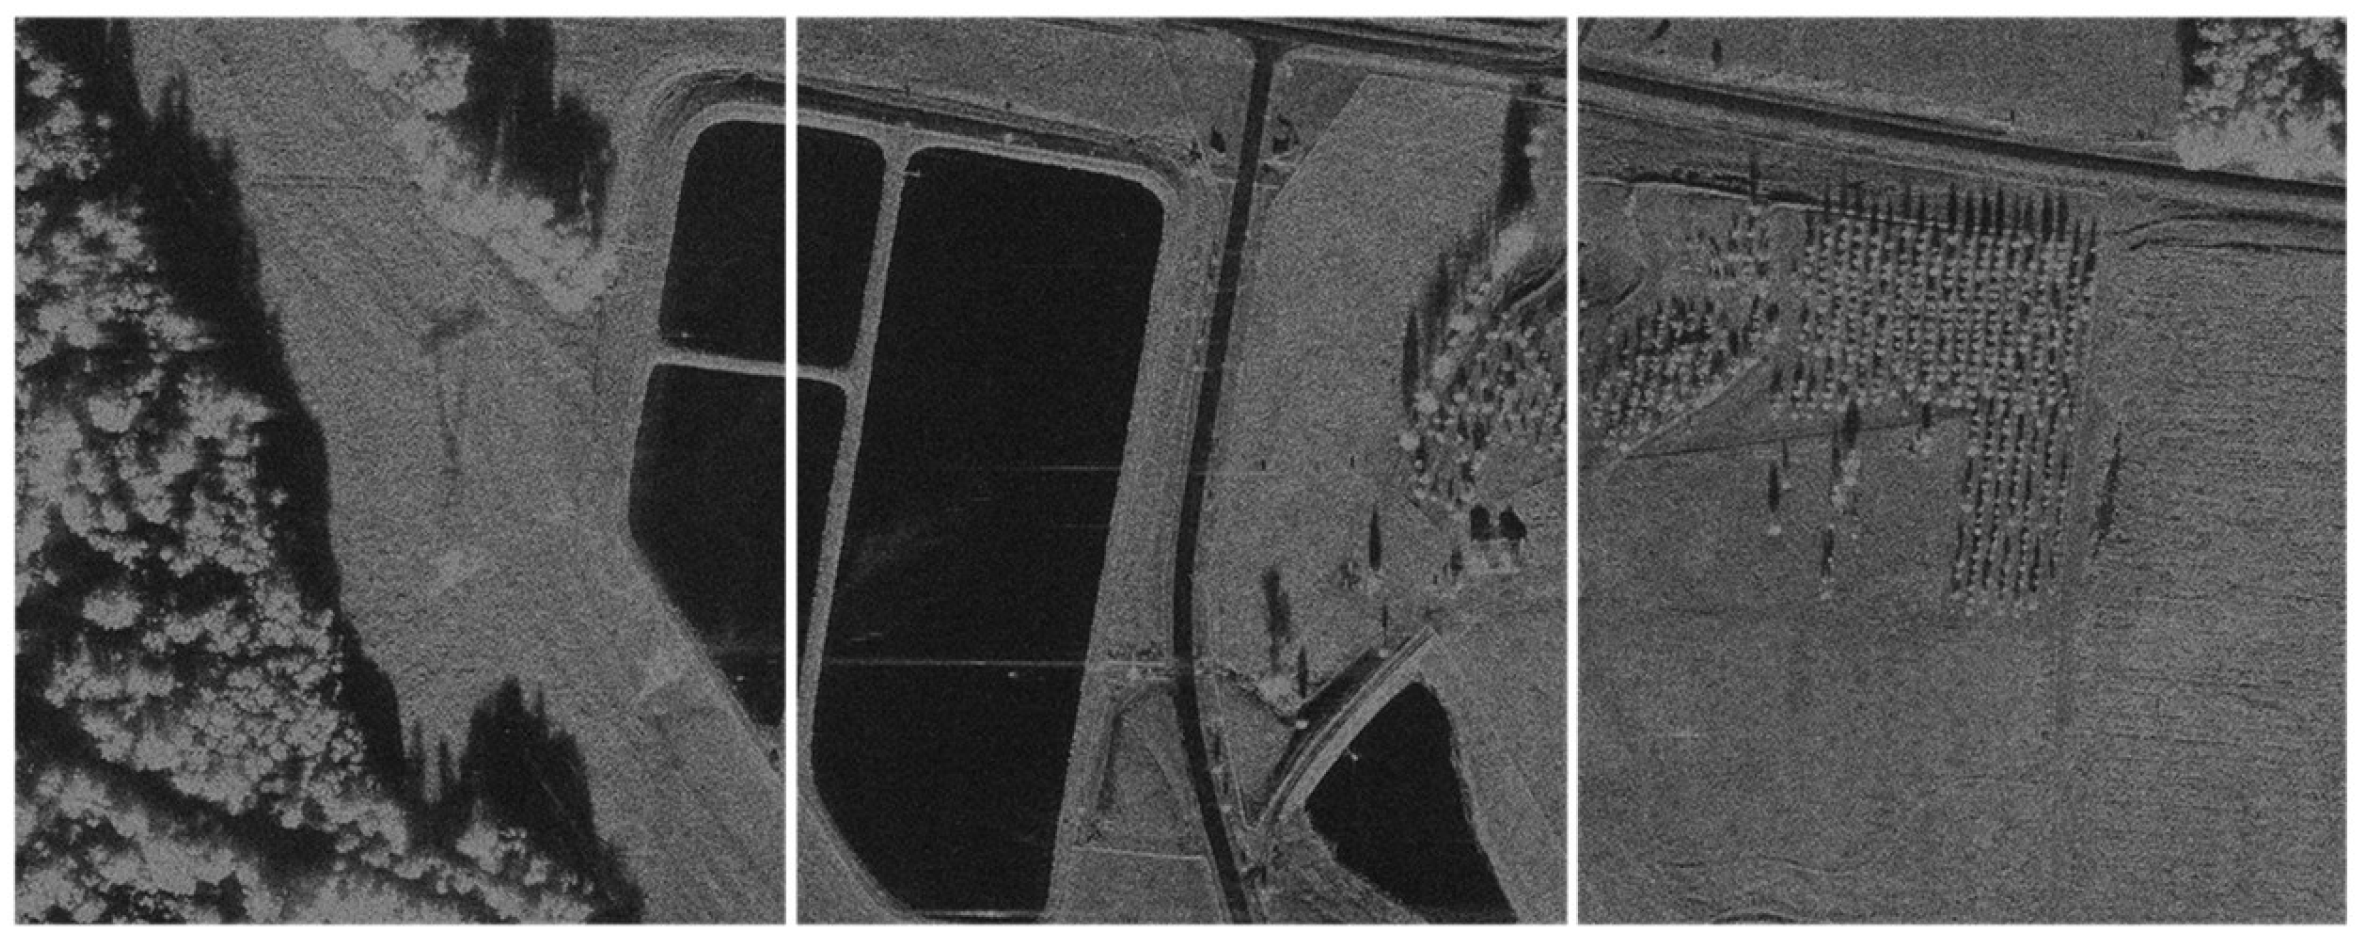
We conduct experiments on target and background images from the MSTAR dataset [13] under SOC, EOC-30 and EOC-45. The MSTAR dataset includes SAR images of various military ground vehicles and accounts for complex extended operating conditions such as target occlusion and configuration variations. In addition, it includes a series of scene images (Figure 8), each covering an area of approximately 0.1 km2. For each depression angle, there are 50 images, consisting of 45 village scenes and 5 urban scenes. The village scenes primarily contain natural landscapes such as lakes, forests, grasslands, and farmland, whereas the urban scenes are dominated by man-made structures. The specific dataset configuration is summarized in Table 1.
Target detection experiments are conducted under both Standard Operating Condition (SOC) and Extended Operating Condition (EOC). The composition of training and testing data for SOC and EOC is detailed in Table 2 and Table 3.
Under the SOC experimental setting, the training and testing sets share highly consistent imaging conditions, such as identical depression angles and similar target configurations. This controlled environment allows us to isolate external interference and independently evaluate the effectiveness of the network architecture in feature extraction and classification.
The purpose of the EOC setting is to simulate the challenge when significant variations in radar depression angles occur. In this configuration, the training images are collected at a 17° depression angle, while the testing images are acquired at two larger depression angles, namely 30° and 45°, corresponding to EOC-30 and EOC-45.
To further evaluate the robustness and generalization ability of the proposed detector, we introduce an 8-class subset of the ATRNet-STAR dataset as an additional benchmark [15]. Compared with the MSTAR dataset, ATRNet-STAR contains a broader range of civilian and engineering vehicle targets with more diverse structural characteristics. Therefore, it provides a useful supplement for evaluating whether the proposed network can maintain stable detection performance across more target categories and under different imaging conditions. The selected classes include sedans, SUVs, vans, trucks, buses, and engineering vehicles, which increases the diversity of target size, shape, and scattering characteristics. The sample distribution of the selected ATRNet-STAR subset under different depression angles is summarized in Table 4.
In this study, the selected 8-class ATRNet-STAR subset was evaluated under the standard operating condition (SOC) and the extended operating condition at 30° (EOC-30). In the SOC setting, both the training and testing sets contain samples acquired at multiple depression angles, including 15°, 30°, 45°, and 60°. Therefore, this setting was used to evaluate the in-distribution detection performance of the model when the training and testing data share the same angle range and target categories. The per-class sample distribution of the SOC training and testing sets is reported in Table 5.
The EOC-30 setting was used to evaluate the robustness of the detector under depression-angle variation. In this setting, the model was trained using samples acquired at a 15° depression angle and tested on samples acquired at a 30° depression angle. Compared with SOC, EOC-30 introduces an explicit angular domain shift between the training and testing data, making it suitable for assessing the generalization ability of the detector under changed imaging geometry. The per-class sample distribution of the EOC-30 training and testing sets is shown in Table 6.

3.4. Experimental Settings

All experiments are implemented with the PyTorch 2.1.2 deep learning framework and conducted on RTX 2080Ti GPU with 12 GB memory. The input image size is set to 1024 × 1024, the batch size is 16, and the initial learning rate is 0.01, with cosine annealing learning rate scheduler. We adopt SGD as the optimizer with a momentum of 0.937 and weight decay of 5 × 10⁻⁴, and the total number of training epochs is set to 200.

3.5. Evaluation Metrics

To quantitatively evaluate the detection performance of different methods, precision, recall, F1-score, average precision (AP), and mean average precision (mAP) are used as the main evaluation metrics. A predicted bounding box is considered a true positive ( T P ) when its intersection over union ( I o U ) with the corresponding ground-truth box is greater than a predefined threshold. Otherwise, it is regarded as a false positive ( F P ). A ground-truth target that is not correctly detected is counted as a false negative (FN). The IoU between the predicted box B p and the ground-truth box B g is defined as
I o U = B p B g B p B g .
Precision measures the proportion of correctly detected targets among all predicted targets, while recall measures the proportion of correctly detected targets among all ground-truth targets. They are calculated as
P r e c i s i o n = T P T P + F P .
The F 1 -score provides a balanced measurement of precision and recall, and is defined as
F 1 = 2 × P r e c i s i o n × R e c a l l P r e c i s i o n + R e c a l l .
The precision-recall curve was obtained by varying the confidence threshold. The average precision ( A P ) of each category was calculated as the area under the precision-recall curve:
A P = 0 1 P ( R ) d R ,
where P and R denote precision and recall, respectively. For multi-class target detection, m A P was calculated by averaging A P values over all target categories:
m A P = 1 C i = 1 C A P i ,
where C is the number of target categories and A P i represents the A P of the i -th category. In this study, m A P @ 0.5 is used to evaluate detection accuracy when the I o U threshold was set to 0.5. In addition, m A P @ 0.5 : 0.95 is reported when necessary to provide a stricter evaluation under multiple I o U thresholds from 0.5 to 0.95 with a step size of 0.05.
To further evaluate model efficiency, the number of parameters, giga floating-point operations (GFLOPs), and inference speed are also reported. The number of parameters reflects the model size, GFLOPs measure the computational complexity, and frames per second (FPS) indicates the inference efficiency. These metrics allow a more comprehensive comparison between detection accuracy and computational cost, which is important for practical SAR target detection applications.

4. Results

This section presents the experimental results of the proposed DA-GDNet. First, ablation studies are conducted to analyze the individual contributions of the data augmentation strategy, SFEM, and GD mechanism. Then, the overall detection performance on the MSTAR and ATRNet-STAR datasets is compared with several representative detection methods. Finally, qualitative visualization and feature visualization results are provided to further evaluate the effectiveness and interpretability of the proposed method.

4.1. Ablation Study

In this section, we conduct two groups of ablation studies. First, we analyze the effectiveness of different augmentation components to verify the contribution of the proposed augmentation strategy. Then, we evaluate the individual contributions of Data Augmentation (DA), the Spatial Feature Enhancement Module (SFEM), and the Gather-and-Distribute (GD) mechanism to the overall DA-GDNet framework.

4.1.1. Ablation Study on Augmentation Components

To analyze the contribution of each augmentation component, we conduct an ablation study on the MSTAR dataset under the SOC-15 setting. The compared settings include no augmentation, standard image-level augmentation, random copy-paste, SARBake-guided U-Net extraction, SARBake + U-Net with background classification only, SARBake + U-Net with fusion only, and the complete proposed DA strategy. This experiment is designed to verify whether the performance improvement came from physically guided target/shadow extraction, target–background suitability assessment, and target–background fusion, rather than simply increasing the number of training samples. The results are shown in Table 7.
As shown in Table 7, all augmentation strategies improve the detection performance compared with the baseline. Standard augmentation increases mAP@50 from 86.6% to 90.4%, indicating that basic image-level transformations can enhance appearance diversity. Random copy-paste further improves mAP@50 to 92.6% by enriching target–background combinations. SARBake + U-Net achieves 95.6% mAP@50 and 84.9% mAP@50:95, showing that target/shadow-guided extraction is more effective than simple rectangular copy-paste. After introducing background classification alone, the mAP@50 and mAP@50:95 further increase to 96.2% and 86.6%, respectively, indicating that background suitability screening help generate more reasonable composite samples. The fusion-only variant achieves 97.5% mAP@50, suggesting that target–background fusion enhance target visibility and detection confidence. The complete proposed DA strategy achieves the best overall performance, with 91.5% precision, 91.8% recall, 97.8% mAP@50, and 87.3% mAP@50:95. These results demonstrate that the proposed DA strategy benefits from the joint use of physically guided target/shadow extraction, background-aware sample selection, and realistic fusion, rather than from data quantity expansion alone.

4.1.2. Ablation Study on Network Components

To further evaluate the effectiveness of the proposed DA-GDNet framework, we conduct a component-wise ablation study by gradually adding DA, SFEM, and the GD mechanism to the baseline detector. Unlike the previous augmentation component analysis, this experiment verifies the contribution of each major module to the complete detection framework. Experiments on both MSTAR and ATRNet-STAR under SOC and EOC settings are used to examine whether the proposed data-level and architecture-level modules consistently improve detection accuracy and robustness. The results are reported in Table 8 and Table 9, respectively.
For the MSTAR dataset, DA is the main source of improvement under SOC, increasing mAP@50 and mAP@50:95 from 86.6% and 72.9% to 97.8% and 87.3%, respectively. When SFEM or GD is further combined with DA, the localization accuracy is improved, and the complete DA-GDNet achieves the best mAP@50 of 98.9% and mAP@50:95 of 90.3%. Although the precision of the complete model is slightly lower than that of DA + SFEM, it obtains the highest recall of 96.2%, indicating stronger target coverage. Under the more challenging EOC-30 and EOC-45 settings, DA alone provides limited or unstable gains, whereas combining DA with SFEM and GD produces more consistent improvements. In particular, the complete model increases mAP@50 from 81.3% to 90.1% under EOC-30 and from 47.4% to 62.1% under EOC-45, demonstrating better robustness to depression-angle variations.
The ablation results on the ATRNet-STAR dataset further verify the generalization ability of the proposed framework in large-scale cluttered scenes. Under SOC, the baseline already achieves high performance, and the complete DA-GDNet slightly improves mAP@50 from 97.3% to 97.6% and mAP@50:95 from 62.7% to 63.0%. In contrast, the advantages became more evident under EOC-30, where the baseline mAP@50 and mAP@50:95 are 77.3% and 42.6%, respectively. DA, SFEM, and GD each improves the results to different extents, while their combination achieves the best performance, with 79.6% precision, 74.5% recall, 81.1% mAP@50, and 44.1% mAP@50:95. These results are consistent with those on MSTAR, indicating that the proposed DA strategy, SFEM, and GD mechanism jointly improve detection robustness under complex backgrounds and angular domain shifts.

4.2. Comparison Experiments

In this section, we compare the proposed DA-GDNet with representative detection networks to evaluate its effectiveness for SAR target detection under different operating conditions. To provide a more comprehensive comparison, the selected baselines include mainstream general detectors, such as YOLOv8-s [7], YOLOv11-s [53], and RT-DETR-l [54], as well as SAR-oriented detection models, including DenoDet [55], SFS-Conv [56], Deformer-FPN [57], and DiffDet4SAR [58]. Experiments are conducted on the MSTAR dataset under SOC, EOC-30, and EOC-45 settings, and on the ATRNet-STAR dataset under SOC and EOC-30 settings. In addition to precision, recall, mAP@50, and mAP@50:95, the number of parameters, GFLOPs, and inference speed are also reported to quantify model complexity and real-time detection capability. The comparison results are reported in Table 10 and Table 11, respectively.
For the MSTAR dataset, DA-GDNet achieves the best overall detection performance under all operating conditions. Under SOC, it obtains the highest mAP@50 and mAP@50:95, reaching 98.9% and 90.3%, respectively. Compared with the lightweight YOLOv8-s baseline, DA-GDNet increases the parameter size only from 11.1 M to 12.1 M and the computational cost from 28.5 to 32.1 GFLOPs, while improving mAP@50 by 12.3 percentage points and mAP@50:95 by 17.4 percentage points. When the depression angle changes to 30° and 45°, most detectors show clear performance degradation. By contrast, DA-GDNet consistently achieves the highest mAP@50 and mAP@50:95 under both EOC settings. It also maintains 1250 FPS, which is much faster than DenoDet, DiffDet4SAR, RT-DETR-l, and Deformer-FPN, demonstrating a favorable balance between accuracy, complexity, and inference efficiency.
For the ATRNet-STAR dataset, DA-GDNet also shows stable performance in large-scale cluttered scenes. Under SOC, although RT-DETR-l achieves slightly higher precision and recall, DA-GDNet obtains the best mAP@50 and mAP@50:95, with values of 97.6% and 63.0%, respectively. Compared with YOLOv8-s, DA-GDNet introduces only limited additional computation, while further improving localization accuracy. Under the more challenging EOC-30 setting, several baselines degrade noticeably, especially SFS-Conv and DiffDet4SAR. DA-GDNet achieves the highest mAP@50 of 81.1% and a competitive mAP@50:95 of 44.1%, only 0.2 percentage points lower than RT-DETR-l. Meanwhile, it uses 12.1 M parameters, 32.1 GFLOPs, and reaches 1250 FPS. These results indicate that the proposed SFEM and GD mechanism improve SAR target representation and robustness without introducing excessive model complexity.
Overall, DA-GDNet achieves a better balance among detection accuracy, model complexity, and inference speed than both mainstream general detectors and SAR-specific models. The results on MSTAR and ATRNet-STAR demonstrate that the proposed method maintains strong robustness and generalization under both SOC and EOC settings, while preserving lightweight and real-time detection capability.

4.3. Qualitative and Feature Visualization Analysis

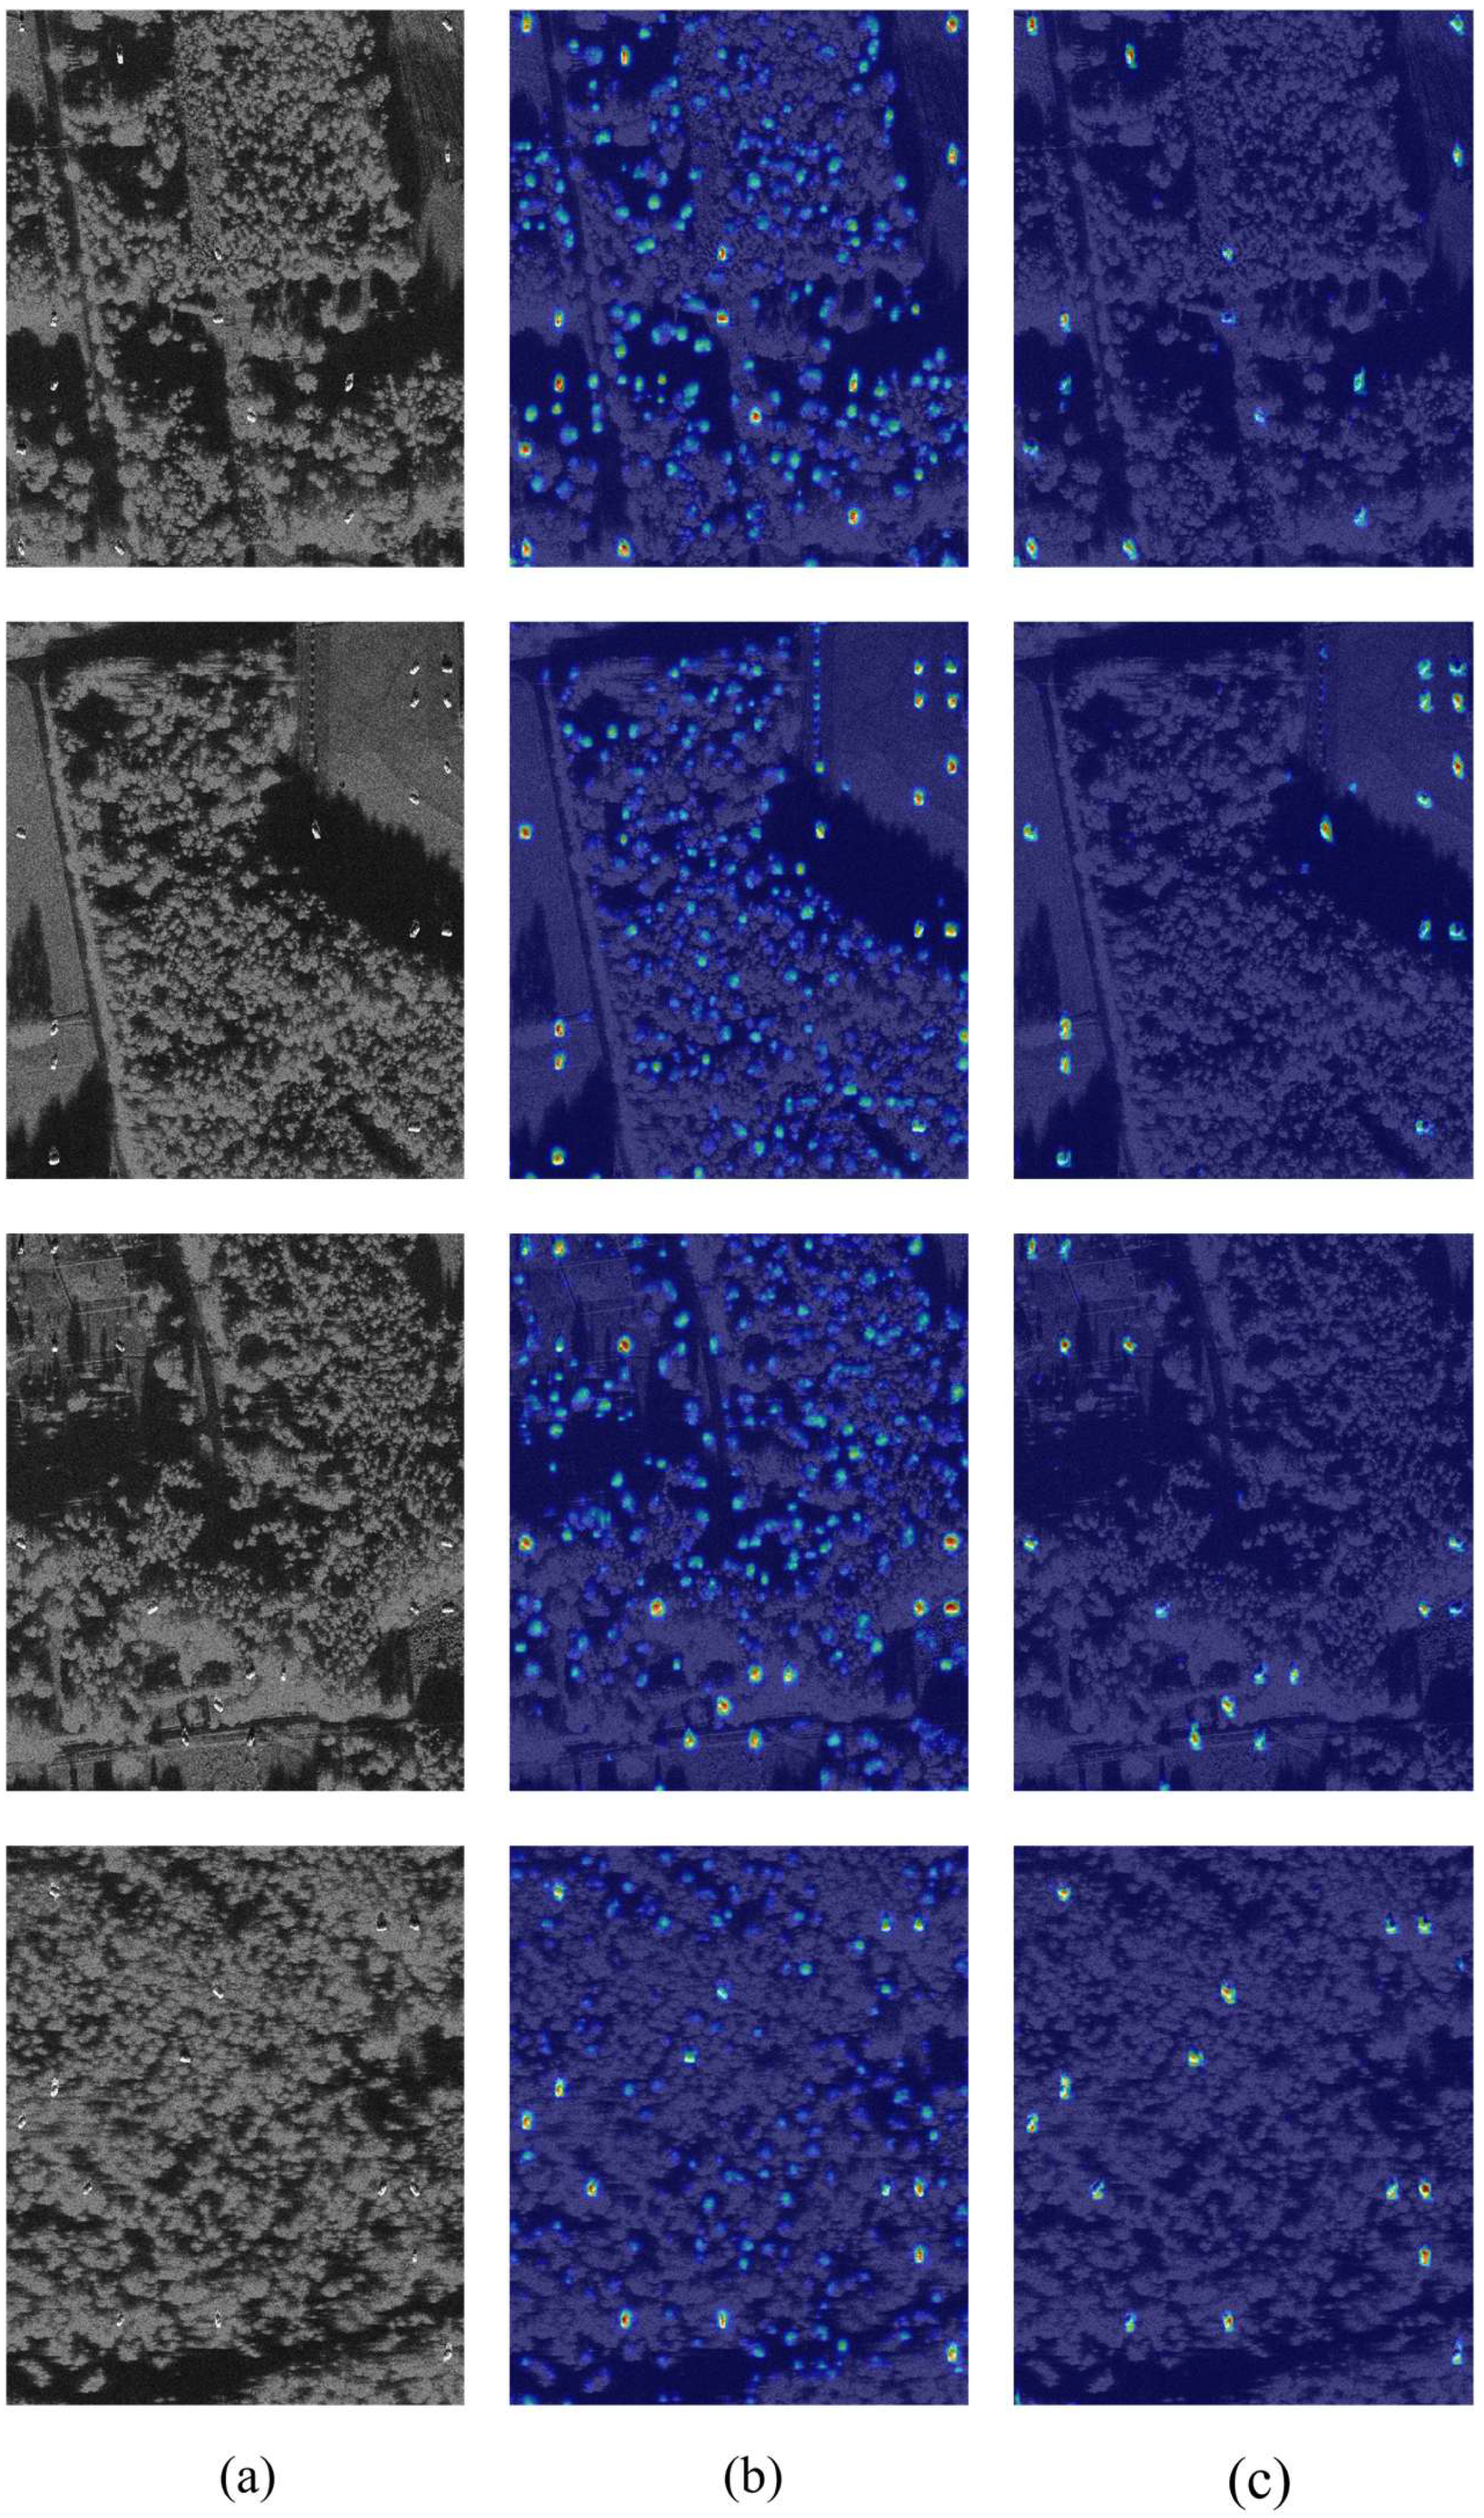
To further analyze the effectiveness of SFEM, Grad-CAM-based [59] feature activation maps are compared between the networks with and without SFEM on representative cluttered SAR samples from the MSTAR-derived test set. Four images containing typical background interference, including vegetation textures, shadowed regions, and strong clutter around target scattering areas, were selected for visualization. The visualization results are shown in Figure 9.
As shown in Figure 9, the network without SFEM tends to produce scattered responses over background textures, especially in vegetation and shadowed clutter regions. After introducing SFEM, the activation responses become more concentrated around target-related scattering regions, and the responses to irrelevant clutter are visibly reduced. This visualization provides intuitive evidence that SFEM helps suppress background interference and enhances discriminative target features in complex SAR scenes.
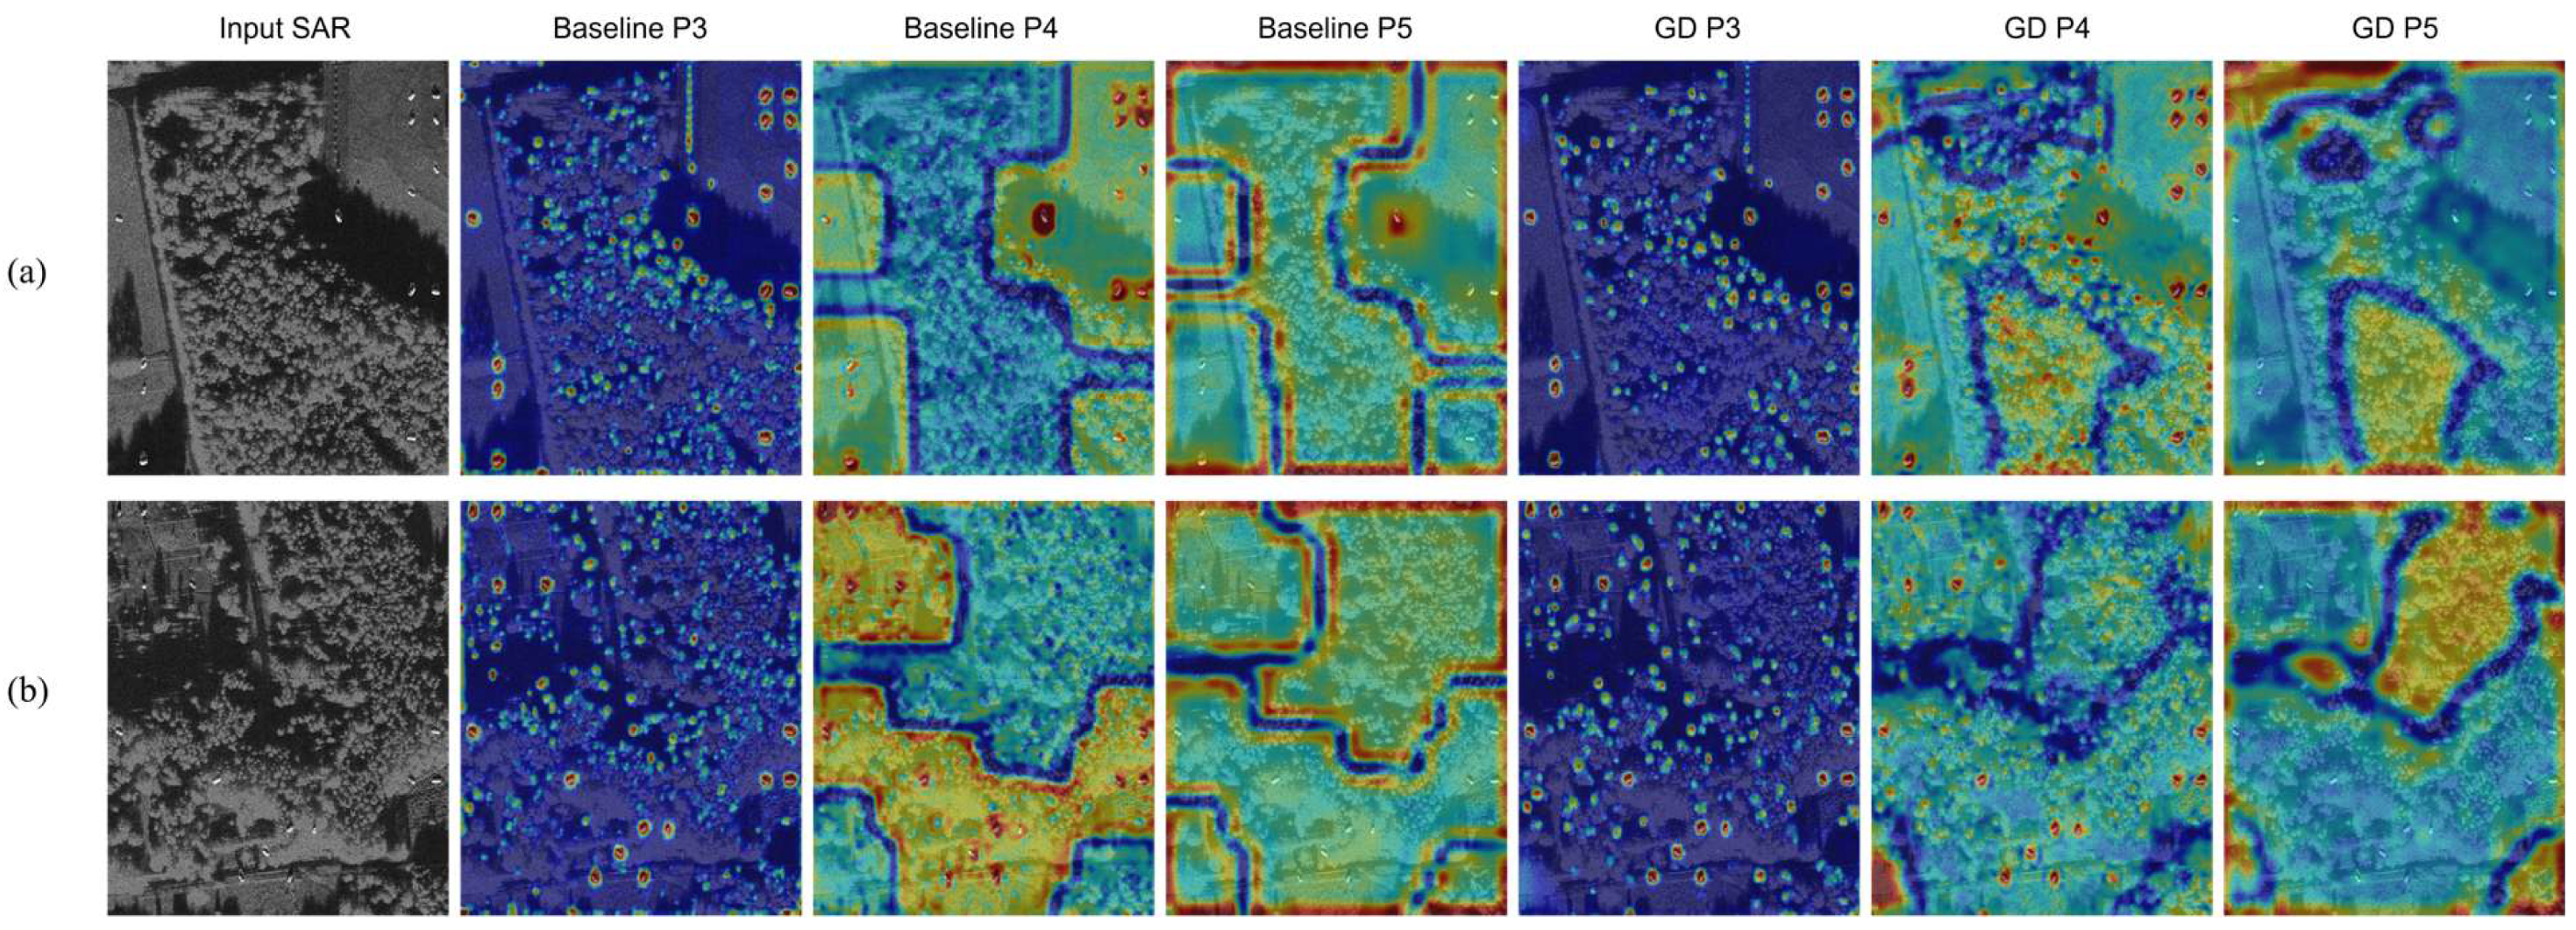
In addition, multi-scale feature activation maps are visualized to further examine the role of the GD mechanism in feature transmission. The activation maps are generated from the P3, P4, and P5 layers by averaging the absolute feature responses across channels and normalizing them for visualization. The visualization results are shown in Figure 10.
As shown in Figure 10, the baseline neck produces relatively fragmented responses at the P3 level, while the responses at deeper P4 and P5 levels become more spatially coarse and are increasingly dominated by large background structures. In contrast, the GD-based neck maintains stronger target-related responses across multiple scales, especially at the P3 and P4 levels. These results indicate that the GD mechanism can alleviate information attenuation during cross-layer feature propagation and enhance multi-scale feature representation for small SAR targets in cluttered backgrounds.

5. Discussion

5.1. Effectiveness of Proposed Data Augmentation Strategy

At the data level, DA-GDNet introduces a structured data augmentation strategy to improve the realism and detection relevance of SAR training samples. Unlike standard image-level augmentation or random copy-paste, the proposed strategy follows a label-extract-screen-compose pipeline. SARBake-derived target and shadow priors provide geometric guidance for target extraction, U-Net segmentation refines real SAR target signatures, background classification avoids unreasonable target–background combinations, and target–background fusion reduces artificial boundaries in synthesized images. This design is intended to generate augmented samples that are not only more diverse, but also more consistent with SAR imaging characteristics.
The ablation results in Table 7 support this interpretation. Standard augmentation and random copy-paste improve detection performance to some extent, indicating that increasing sample diversity is useful. However, the larger improvement obtained by SARBake-guided extraction, background classification, fusion, and the complete DA strategy shows that sample quality is equally important. In particular, the progressive performance gains suggest that physically guided target extraction, contextual background screening, and smoother target–background integration jointly contribute to more effective SAR data augmentation.

5.2. Effectiveness of SFEM and GD

At the network level, SFEM and GD are designed to address two key difficulties in SAR target detection: weak small-target responses and information loss during multi-scale feature fusion. SFEM enhances target-related spatial responses by combining local spatial details with broader contextual information and then recalibrates features through spatial and channel attention. GD further gathers features from different network stages and redistributes the fused information to key detection layers, which helps preserve both semantic information and fine-grained localization cues.
The ablation results in Table 8 and Table 9 show that SFEM and GD consistently improve detection performance under different experimental settings. These numerical improvements are also supported by the visualization results. Figure 9 shows that SFEM makes activation responses more concentrated around target regions and reduces interference from cluttered backgrounds. Figure 10 further indicates that GD produces clearer and more continuous target-related feature activations across detection layers. Therefore, the two modules improve the detector not only by increasing evaluation metrics, but also by producing more discriminative and stable feature representations.

5.3. Robustness Under Depression-Angle Variations and Complex Clutter

As a complete framework, DA-GDNet improves SAR target detection through the joint effect of data-level augmentation and feature-level enhancement. The proposed DA strategy expands plausible target–background distributions, while SFEM and GD strengthen target saliency, multi-scale feature interaction, and localization stability. This combination is particularly useful under depression-angle variations, because changes in imaging angle can alter target scattering patterns, shadow shapes, and apparent geometric structures, making SAR targets more difficult to distinguish from complex clutter.
The comparison results in Table 10 and Table 11 demonstrate the robustness of DA-GDNet on both MSTAR and ATRNet-STAR. Under SOC settings, the proposed method maintains strong detection accuracy, showing its effectiveness under relatively standard test conditions. Under EOC settings, it also shows better adaptability to depression-angle changes and complex background interference than most compared detectors. These results indicate that DA-GDNet does not rely on a single dataset or a single experimental condition.

5.4. Ethical and Dual-Use Considerations

The present study is limited to academic research on synthetic aperture radar image analysis, data augmentation, and computer vision. MSTAR was used as an existing benchmark dataset to evaluate the proposed method under controlled experimental conditions. No new military data were collected, and the study did not involve real-time surveillance, geographic target localization, operational decision-making, weapons development or control, or deployment in an operational system. The additional experiments on the civilian and engineering vehicle classes of ATRNet-STAR were included to evaluate the method beyond the military-vehicle benchmark and to demonstrate its relevance to general vehicle detection in remote-sensing imagery.
The authors nevertheless acknowledge that research involving the detection and augmentation of military-vehicle imagery may have potential dual-use implications. Potential misuse could include adapting the method to support unauthorized surveillance or military target analysis. To mitigate these risks, the manuscript transparently identifies the military-vehicle content of MSTAR, restricts its claims to offline academic benchmark evaluation, does not claim readiness for operational deployment, and avoids providing operational targeting, geographic, or weapons-related information. The broader potential benefits of the underlying methodology include reducing annotation requirements and improving image-analysis robustness in civilian applications such as transportation monitoring, infrastructure inspection, disaster assessment, and environmental observation. Any future use in sensitive or operational settings should be subject to separate institutional review, legal assessment, human oversight, and applicable national and international regulations.

6. Conclusions

In this paper, we propose DA-GDNet, a data-augmented SAR image target detection network, to address the limitations of unnatural target background integration and low adaptability to variations in depression angles. By combining SARBake-derived target/shadow priors with U-Net-based segmentation, the proposed method achieves fine-grained extraction of target and shadow regions. Then, background region classification and target–background fusion are designed to improve the target–background compatibility and contextual plausibility of the synthesized SAR images, thereby effectively enhancing data diversity and authenticity. For the detection network, the Gather-and-Distribute (GD) mechanism is introduced to achieve efficient multi-scale feature fusion, substantially enhancing the network’s capability to detect multi-scale targets. In addition, the Spatial Feature Enhancement Module (SFEM) is designed to capture both local and global spatial contextual information, thereby improving the detection accuracy and stability under complex backgrounds and varying depression angles. The experimental results demonstrate that the proposed data augmentation method effectively increases the contextual plausibility and detection relevance of the augmented samples, while the improved detection model exhibits excellent generalization performance in complex scenarios and multi-view conditions.
Although DA-GDNet has achieved promising detection performance under different depression angles and complex backgrounds, several limitations still need to be further investigated. First, the proposed network introduces additional feature enhancement and multi-scale fusion modules, which may increase computational cost compared with the original lightweight detector. Therefore, future work will focus on further optimizing the network structure through model pruning, knowledge distillation, and lightweight attention design to improve its computational efficiency in offline academic benchmark evaluations. Second, the current physics-guided data augmentation pipeline mainly focuses on limited vehicle categories and target–background compositions. In the future, we will further evaluate the generalizability of the proposed augmentation strategy using additional civilian and engineering vehicle datasets and broader imaging conditions. Third, SAR target detection under extremely low signal-to-noise ratios, severe speckle noise, and strong background clutter remains challenging. Future research will explore joint denoising–detection models and uncertainty-aware feature learning to improve the robustness of DA-GDNet under degraded SAR imaging conditions. In addition, its applicability to civilian remote-sensing tasks, such as transportation monitoring, infrastructure inspection, disaster assessment, and environmental observation, will be further investigated. These future studies will remain subject to applicable ethical, legal, and institutional requirements.

Author Contributions

Conceptualization, F.Z. and Y.L.; methodology, F.Z.; software, F.Z.; validation, F.Z. and W.W.; formal analysis, F.Z.; investigation, F.Z.; resources, Y.L. and H.C.; data curation, F.Z. and W.W.; writing—original draft preparation, F.Z.; writing—review and editing, F.Z. and Y.S.; visualization, F.Z.; supervision, Y.L.; project administration, Y.L.; funding acquisition, Y.L. and H.C. All authors have read and agreed to the published version of the manuscript.

Funding

The research was funded in part by the Hebei Natural Science Foundation (No. F2026105031).

Data Availability Statement

This study used the existing MSTAR and ATRNet-STAR benchmark datasets cited in the manuscript. Access to and reuse of these datasets are subject to the conditions specified by their respective providers. No new military imagery, operational geographic information, or weapons-related data were collected or released in this study. The source code developed in this study is available from the corresponding author upon reasonable request.

Conflicts of Interest

The authors declare no conflicts of interest.

References

  1. Zhang, Y.; Zhu, D.; Mao, X.; Yu, X.; Zhang, J.; Li, Y. Multirotors video synthetic aperture radar: System development and signal processing. IEEE Aerosp. Electron. Syst. Mag. 2020, 35, 32–43. [Google Scholar] [CrossRef] [Scilit]
  2. Wang, C.; Luo, S.; Pei, J.; Huang, Y.; Zhang, Y.; Yang, J. Crucial feature capture and discrimination for limited training data SAR ATR. ISPRS J. Photogramm. Remote Sens. 2023, 204, 291–305. [Google Scholar] [CrossRef] [Scilit]
  3. Wu, B.; Liu, C.; Chen, J. A Review of Spaceborne High-Resolution Spotlight/Sliding Spotlight Mode SAR Imaging. Remote Sens. 2025, 17, 38. [Google Scholar] [CrossRef] [Scilit]
  4. Zhang, Q.; Xiao, F.; Ding, Z.; Ke, M.; Zeng, T. Sliding spotlight mode imaging with GF-3 spaceborne SAR sensor. Sensors 2018, 18, 43. [Google Scholar] [CrossRef] [Scilit] [PubMed]
  5. Mittermayer, J.; Wollstadt, S.; Prats-Iraola, P.; Scheiber, R. The TerraSAR-X staring spotlight mode concept. IEEE Trans. Geosci. Remote Sens. 2014, 52, 3695–3706. [Google Scholar] [CrossRef]
  6. Schwerdt, M.; Tous-Ramon, N.; Döring, B.; Zink, M.; Bachmann, M.; Schrank, D.; Gonzalez, J.H. Radiometric Performance of the TerraSAR-X Mission over More Than Ten Years of Operation. Remote Sens. 2018, 10, 754. [Google Scholar] [CrossRef] [Scilit]
  7. Redmon, J.; Divvala, S.; Girshick, R.; Farhadi, A. You only look once: Unified, real-time object detection. In Proceedings of the IEEE Conference on Computer Vision and Pattern Recognition (CVPR), Las Vegas, NV, USA, 27–30 June 2016; pp. 779–788. [Google Scholar] [CrossRef] [Scilit]
  8. Zhang, S.; Wen, L.; Bian, X.; Lei, Z.; Li, S.Z. Single-shot refinement neural network for object detection. In Proceedings of the IEEE Conference on Computer Vision and Pattern Recognition (CVPR), Salt Lake City, UT, USA, 18–22 June 2018; pp. 4203–4212. [Google Scholar] [CrossRef] [Scilit]
  9. Ren, S.; He, K.; Girshick, R.; Sun, J. Faster R-CNN: Towards real-time object detection with region proposal networks. IEEE Trans. Pattern Anal. Mach. Intell. 2017, 39, 1137–1149. [Google Scholar] [CrossRef] [Scilit] [PubMed]
  10. Shi, Y.; Du, L.; Guo, Y. Unsupervised domain adaptation for SAR target detection. IEEE J. Sel. Top. Appl. Earth Obs. Remote Sens. 2021, 14, 6372–6385. [Google Scholar] [CrossRef] [Scilit]
  11. Wang, C.; Pei, J.; Wang, Z.; Huang, Y.; Wu, J.; Yang, H.; Yang, J. When deep learning meets multi-task learning in SAR ATR: Simultaneous target recognition and segmentation. Remote Sens. 2020, 12, 3863. [Google Scholar] [CrossRef] [Scilit]
  12. Li, W.; Yang, W.; Liu, L.; Zhang, W.; Liu, Y. Discovering and explaining the noncausality of deep learning in SAR ATR. IEEE Geosci. Remote Sens. Lett. 2023, 20, 1–5. [Google Scholar] [CrossRef] [Scilit]
  13. Keydel, E.R.; Lee, S.W.; Moore, J.T. MSTAR extended operating conditions: A tutorial. In Proceedings of the Aerospace/Defense Sensing and Controls, Orlando, FL, USA, June 1996; Zelnio, E.G., Douglass, R.J., Eds.; SPIE: Bellingham, WA, USA; pp. 228–242. [CrossRef] [Scilit]
  14. Huang, L.; Liu, B.; Li, B.; Guo, W.; Yu, W.; Zhang, Z.; Yu, W. OpenSARShip: A dataset dedicated to Sentinel-1 ship interpretation. IEEE J. Sel. Top. Appl. Earth Obs. Remote Sens. 2018, 11, 195–208. [Google Scholar] [CrossRef] [Scilit]
  15. Liu, Y.; Li, W.; Liu, L.; Zhou, J.; Peng, B.; Song, Y.; Xiong, X.; Yang, W.; Liu, T.; Liu, Z.; et al. ATRNet-STAR: A large dataset and benchmark toward remote sensing object recognition in the wild. IEEE Trans. Pattern Anal. Mach. Intell. 2026, 48, 6735–6753. [Google Scholar] [CrossRef] [Scilit] [PubMed]
  16. Li, Y.; Li, X.; Li, W.; Hou, Q.; Liu, L.; Cheng, M.-M.; Yang, J. SARDet-100K: Towards open-source benchmark and toolkit for large-scale SAR object detection. In Proceedings of the 38th Conference on Neural Information Processing Systems (NeurIPS 2024), Vancouver, BC, Canada, 10–15 December 2024; Advances in Neural Information Processing Systems. 37, pp. 128430–128461. [Google Scholar] [CrossRef] [Scilit]
  17. Belli, M.I.; Xu, X. Affine and magnitude transforms based data augmentation comparison for SAR automatic target recognition. In Proceedings of the IEEE 4th International Conference on Computer and Communications (ICCC), Chengdu, China, 7–10 December 2018; pp. 1649–1653. [Google Scholar] [CrossRef] [Scilit]
  18. Ding, J.; Chen, B.; Liu, H.; Huang, M. Convolutional neural network with data augmentation for SAR target recognition. IEEE Geosci. Remote Sens. Lett. 2016, 13, 364–368. [Google Scholar] [CrossRef] [Scilit]
  19. Zeng, Z.; Tan, X.; Zhang, X.; Huang, Y.; Wan, J.; Chen, Z. ATGAN: A SAR target image generation method for automatic target recognition. IEEE J. Sel. Top. Appl. Earth Obs. Remote Sens. 2024, 17, 6290–6307. [Google Scholar] [CrossRef] [Scilit]
  20. Wang, C.; Pei, J.; Liu, X.; Huang, Y.; Mao, D.; Zhang, Y.; Yang, J. SAR target image generation method using azimuth-controllable generative adversarial network. IEEE J. Sel. Top. Appl. Earth Obs. Remote Sens. 2022, 15, 9381–9397. [Google Scholar] [CrossRef] [Scilit]
  21. Oh, J.; Kim, M. PeaceGAN: A GAN-based multi-task learning method for SAR target image generation with a pose estimator and an auxiliary classifier. Remote Sens. 2021, 13, 3939. [Google Scholar] [CrossRef] [Scilit]
  22. Ju, M.; Niu, B.; Hu, Q. SARGAN: A novel SAR image generation method for SAR ship detection task. IEEE Sens. J. 2023, 23, 28500–28512. [Google Scholar] [CrossRef] [Scilit]
  23. Dvornik, N.; Mairal, J.; Schmid, C. On the importance of visual context for data augmentation in scene understanding. IEEE Trans. Pattern Anal. Mach. Intell. 2021, 43, 2014–2028. [Google Scholar] [CrossRef] [Scilit] [PubMed]
  24. Furukawa, H. Deep learning for target classification from SAR imagery: Data augmentation and translation invariance. arXiv 2017, arXiv:1708.07920. [Google Scholar] [CrossRef] [Scilit]
  25. Liao, L.; Du, L.; Guo, Y. Semi-Supervised SAR Target Detection Based on an Improved Faster R-CNN. Remote Sens. 2022, 14, 143. [Google Scholar] [CrossRef] [Scilit]
  26. Shen, L.; Tian, Y.; Zhang, L.; Yin, G.; Shuai, T.; Liang, S.; Wu, Z. Threshold Filtering Semi-Supervised Learning Method for SAR Target Recognition. Comput. Mater. Contin. 2022, 73, 465–476. [Google Scholar] [CrossRef] [Scilit]
  27. Liao, L. Semi-Supervised SAR Target Detection with Cross-Domain Transfer Learning Based on YOLOv5. In Proceedings of the IEEE International Geoscience and Remote Sensing Symposium (IGARSS), Athens, Greece, 7–12 July 2024; pp. 7401–7404. [Google Scholar] [CrossRef] [Scilit]
  28. Luo, C.; Zhang, Y.; Guo, J.; Pan, X.; Chen, X.; Gong, H. SAR-CDSS: A Semi-Supervised Cross-Domain Object Detection from Optical to SAR Domain. Remote Sens. 2024, 16, 940. [Google Scholar] [CrossRef] [Scilit]
  29. Zhou, Z.; Cui, Z.; Tang, K.; Tian, Y.; Pi, Y.; Cao, Z. Gaussian Meta-Feature Balanced Aggregation for Few-Shot Synthetic Aperture Radar Target Detection. ISPRS J. Photogramm. Remote Sens. 2024, 208, 89–106. [Google Scholar] [CrossRef] [Scilit]
  30. Wang, Z.; Yang, B.; Yue, H.; Ma, Z. Fine-Grained Prototypes Distillation for Few-Shot Object Detection. arXiv 2024, arXiv:2401.07629. [Google Scholar] [CrossRef] [Scilit]
  31. Hu, J.; Shen, L.; Sun, G. Squeeze-and-excitation networks. In Proceedings of the IEEE/CVF Conference on Computer Vision and Pattern Recognition (CVPR), Salt Lake City, UT, USA, 18–22 June 2018; pp. 7132–7141. [Google Scholar] [CrossRef] [Scilit]
  32. Wang, Q.; Wu, B.; Zhu, P.; Li, P.; Zuo, W.; Hu, Q. ECA-Net: Efficient Channel Attention for Deep Convolutional Neural Networks. In Proceedings of the IEEE/CVF Conference on Computer Vision and Pattern Recognition (CVPR), Seattle, WA, USA, 13–19 June 2020; pp. 11531–11539. [Google Scholar] [CrossRef] [Scilit]
  33. Woo, S.; Park, J.; Lee, J.-Y.; Kweon, I.S. CBAM: Convolutional block attention module. In Computer Vision—ECCV 2018; Springer: Cham, Switzerland, 2018; pp. 3–19. [Google Scholar] [CrossRef] [Scilit]
  34. Hou, Q.; Zhou, D.; Feng, J. Coordinate Attention for Efficient Mobile Network Design. In Proceedings of the IEEE/CVF Conference on Computer Vision and Pattern Recognition (CVPR), Nashville, TN, USA, 20–25 June 2021; pp. 13708–13717. [Google Scholar] [CrossRef] [Scilit]
  35. Deng, Y.; Guan, D.; Chen, Y.; Yuan, W.; Ji, J.; Wei, M. SAR-ShipNet: SAR-Ship Detection Neural Network via Bidirectional Coordinate Attention and Multi-Resolution Feature Fusion. arXiv 2022, arXiv:2203.15480. [Google Scholar] [CrossRef] [Scilit]
  36. Ma, X.; Cheng, J.; Li, A.; Zhang, Y.; Lin, Z. AMANet: Advancing SAR Ship Detection with Adaptive Multi-Hierarchical Attention Network. arXiv 2024, arXiv:2401.13214. [Google Scholar] [CrossRef] [Scilit]
  37. Chen, H.; Chen, C.; Wang, F.; Shi, Y.; Zeng, W. RSNet: A Light Framework for the Detection of Multi-Scale Remote Sensing Targets. arXiv 2024, arXiv:2410.23073. [Google Scholar] [CrossRef] [Scilit]
  38. Lin, T.-Y.; Dollár, P.; Girshick, R.; He, K.; Hariharan, B.; Belongie, S. Feature Pyramid Networks for Object Detection. In Proceedings of the IEEE Conference on Computer Vision and Pattern Recognition (CVPR), Honolulu, HI, USA, 21–26 July 2017; pp. 936–944. [Google Scholar] [CrossRef] [Scilit]
  39. Liu, S.; Qi, L.; Qin, H.; Shi, J.; Jia, J. Path Aggregation Network for Instance Segmentation. In Proceedings of the IEEE Conference on Computer Vision and Pattern Recognition (CVPR), Salt Lake City, UT, USA, 18–22 June 2018; pp. 8759–8768. [Google Scholar] [CrossRef] [Scilit]
  40. Tan, M.; Pang, R.; Le, Q.V. EfficientDet: Scalable and Efficient Object Detection. In Proceedings of the IEEE/CVF Conference on Computer Vision and Pattern Recognition (CVPR), Seattle, WA, USA, 13–19 June 2020; pp. 10778–10787. [Google Scholar] [CrossRef] [Scilit]
  41. Ke, X.; Zhang, X.; Zhang, T.; Shi, J.; Wei, S. SAR Ship Detection Based on Swin Transformer and Feature Enhancement Feature Pyramid Network. arXiv 2022, arXiv:2209.10421. [Google Scholar] [CrossRef] [Scilit]
  42. Zhao, C.; Fu, X.; Dong, J.; Cao, S.; Zhang, C. Enhancing, Refining, and Fusing: Towards Robust Multi-Scale and Dense Ship Detection. arXiv 2025, arXiv:2501.06053. [Google Scholar] [CrossRef] [Scilit]
  43. Ding, B.; Wen, G.; Huang, X.; Ma, C.; Yang, X. Data augmentation by multilevel reconstruction using attributed scattering center for SAR target recognition. IEEE Geosci. Remote Sens. Lett. 2017, 14, 979–983. [Google Scholar] [CrossRef] [Scilit]
  44. Cui, Z.; Zhang, M.; Cao, Z.; Cao, C. Image data augmentation for SAR sensor via generative adversarial nets. IEEE Access 2019, 7, 42255–42268. [Google Scholar] [CrossRef] [Scilit]
  45. Xie, D.; Ma, J.; Li, Y.; Liu, X. Data augmentation of SAR sensor image via information maximizing generative adversarial net. In Proceedings of the IEEE 4th International Conference on Electronic Information and Communication Technology (ICEICT), Xi’an, China, 18–20 August 2021; pp. 454–458. [Google Scholar] [CrossRef] [Scilit]
  46. Ju, M.; Niu, B.; Zhang, J. SAR image generation method for oriented ship detection via generative adversarial networks. Signal Image Video Process. 2024, 18, 589–596. [Google Scholar] [CrossRef] [Scilit]
  47. Ghiasi, G.; Cui, Y.; Srinivas, A.; Qian, R.; Lin, T.-Y.; Cubuk, E.D.; Le, Q.V.; Zoph, B. Simple copy-paste is a strong data augmentation method for instance segmentation. In Proceedings of the IEEE/CVF Conference on Computer Vision and Pattern Recognition (CVPR), Nashville, TN, USA, 20–25 June 2021; pp. 2917–2927. [Google Scholar] [CrossRef] [Scilit]
  48. Geng, Z.; Xu, Y.; Wang, B.-N.; Yu, X.; Zhu, D.-Y.; Zhang, G. Target recognition in SAR images by deep learning with training data augmentation. Sensors 2023, 23, 941. [Google Scholar] [CrossRef] [Scilit] [PubMed]
  49. Zhao, Z.; Xue, X.; Mariam, I.; Zhou, X. Integrating target and shadow features for SAR target recognition. Sensors 2023, 23, 8031. [Google Scholar] [CrossRef] [Scilit] [PubMed]
  50. Malmgren-Hansen, D.; Nobel-Jorgensen, M. Convolutional neural networks for SAR image segmentation. In Proceedings of the IEEE International Symposium on Signal Processing and Information Technology (ISSPIT), Abu Dhabi, United Arab Emirates, 7–10 December 2015; pp. 231–236. [Google Scholar] [CrossRef] [Scilit]
  51. Ronneberger, O.; Fischer, P.; Brox, T. U-Net: Convolutional networks for biomedical image segmentation. In Medical Image Computing and Computer-Assisted Intervention—MICCAI 2015; Navab, N., Hornegger, J., Wells, W.M., Frangi, A.F., Eds.; Lecture Notes in Computer Science; Springer: Cham, Switzerland, 2015; Volume 9351, pp. 234–241. [Google Scholar] [CrossRef] [Scilit]
  52. He, K.; Zhang, X.; Ren, S.; Sun, J. Deep residual learning for image recognition. In Proceedings of the IEEE Conference on Computer Vision and Pattern Recognition (CVPR), Las Vegas, NV, USA, 27–30 June 2016; pp. 770–778. [Google Scholar] [CrossRef] [Scilit]
  53. Khanam, R.; Hussain, M. YOLOv11: An overview of the key architectural enhancements. arXiv 2024, arXiv:2410.17725. [Google Scholar] [CrossRef] [Scilit]
  54. Zhao, Y.; Lv, W.; Xu, S.; Wei, J.; Wang, G.; Dang, Q.; Liu, Y.; Chen, J. DETRs beat YOLOs on real-time object detection. In Proceedings of the IEEE/CVF Conference on Computer Vision and Pattern Recognition (CVPR), Seattle, WA, USA, 17–21 June 2024; pp. 16965–16974. [Google Scholar] [CrossRef] [Scilit]
  55. Dai, Y.; Zou, M.; Li, Y.; Li, X.; Ni, K.; Yang, J. DenoDet: Attention as deformable multisubspace feature denoising for target detection in SAR images. IEEE Trans. Aerosp. Electron. Syst. 2025, 61, 4729–4743. [Google Scholar] [CrossRef] [Scilit]
  56. Li, K.; Wang, D.; Hu, Z.; Zhu, W.; Li, S.; Wang, Q. Unleashing channel potential: Space-frequency selection convolution for SAR object detection. In Proceedings of the IEEE/CVF Conference on Computer Vision and Pattern Recognition (CVPR), Seattle, WA, USA, 17–21 June 2024; pp. 17323–17332. [Google Scholar] [CrossRef] [Scilit]
  57. Yang, F.; Ouyang, T.; Liu, C. Deformer-FPN: FPN network based on deformable convolution and lightweight upsampling operator for ship detection in SAR image. In Proceedings of the IEEE International Conference on Signal, Information and Data Processing (ICSIDP), Zhuhai, China, 22–24 November 2024; pp. 1–5. [Google Scholar] [CrossRef] [Scilit]
  58. Zhou, J.; Xiao, C.; Peng, B.; Liu, Z.; Liu, L.; Liu, Y.; Li, X. DiffDet4SAR: Diffusion-based Aircraft Target Detection Network for SAR Images. arXiv 2024, arXiv:2404.03595. [Google Scholar] [CrossRef] [Scilit]
  59. Selvaraju, R.R.; Cogswell, M.; Das, A.; Vedantam, R.; Parikh, D.; Batra, D. Grad-CAM: Visual Explanations from Deep Networks via Gradient-Based Localization. In Proceedings of the IEEE International Conference on Computer Vision (ICCV), Venice, Italy, 22–29 October 2017; pp. 618–626. [Google Scholar] [CrossRef] [Scilit]
Figure 1. Examples of images from some of the representative SAR datasets. (a) Unreasonable data set. (b) Single-depression-angle samples.
Remotesensing 18 02839 g001
Figure 2. Schematic diagram of background region classification method.
Remotesensing 18 02839 g002
Figure 3. Schematic diagram of target subject placement methods. The yellow rectangles in the left upper image are the region input for background region classification. The green and red rectangles in the middle image are the placeable and non-placeable background regions, respectively. The right image is the final synthetic SAR image.
Remotesensing 18 02839 g003
Figure 4. Architecture of the Spatial Feature Enhancement Module (SFEM). The input feature X is first split into two sub-features X l and X b , which are processed by local and broader context branches, respectively. The two branch outputs are fused by element-wise addition, refined by spatial attention and channel attention, and finally projected by a 1 × 1 convolution to generate the output feature Y with the same dimension as X .
Remotesensing 18 02839 g004
Figure 5. Architecture of the Gather module. The input features B 2 , B 3 , B 4 , and B 5 are downsampled by factors of 4, 8, 16, and 32 with respect to the input image, respectively. B 4 is used as the reference scale, and the other features are resized to H 4 × W 4 by bilinear interpolation. The aligned features B ~ 2 B ~ 5 are concatenated along the channel dimension to form F g , and a Conv–RepConv–Conv block further fuses F g into the aggregated feature G .
Remotesensing 18 02839 g005
Figure 6. Architecture of the Distribute module. The aggregated feature G is split into two branches G ( 3 ) and G ( 4 ) . Each branch is adapted to the spatial size and channel dimension of the corresponding feature level, producing I 3 and I 4 . The adapted features are then injected into B 3 and B 4 through feature fusion operations to generate P 3 and P 4 , respectively. The high-level feature B 5 is directly preserved through a bypass connection as P 5 .
Remotesensing 18 02839 g006
Figure 7. Overall structure of the proposed network.
Remotesensing 18 02839 g007
Figure 8. Scene images of MSTAR dataset.
Remotesensing 18 02839 g008
Figure 9. Grad-CAM visualization comparison between the baseline model without SFEM and with SFEM under strong-clutter SAR scenes. Columns (ac) represent the original SAR images, Grad-CAM results of the baseline model without SFEM, and Grad-CAM results of the model with SFEM, respectively. Warmer colors indicate stronger feature responses, whereas cooler colors indicate weaker responses.
Remotesensing 18 02839 g009
Figure 10. Multi-scale feature activation visualization of the baseline neck and the GD-based neck under cluttered SAR scenes. Subpanel (a) presents the first representative SAR test sample, whereas subpanel (b) presents the second representative SAR test sample. In each subpanel, the first column shows the input SAR image, the next three columns show the baseline feature activations at P3, P4, and P5, and the final three columns show the corresponding GD-based feature activations at P3, P4, and P5. The activation maps are obtained by averaging the absolute feature responses across channels and normalizing them for visualization. Warmer colors indicate stronger feature responses, whereas cooler colors indicate weaker feature responses.
Remotesensing 18 02839 g010
Table 1. Data distribution of MSTAR dataset.
Class15°17°30°45°
2S1274299288303
BRDM_2274298402423
BTR_60195256
D7274299
SN_132232196
SN_9563233195
SN_C71233196
T62273299
ZIL131274299
ZSU_23_4274299406422
Table 2. Detailed information of training and testing sets under SOC.
ClassSerial NumberTrainingTesting
2S1B01299274
BRDM_2E71298274
BTR_607532256195
D713,015299274
T72SN_132232196
BMP_2SN_9563233195
BTR_70SN_C71233196
T62A51299273
ZIL131E12299274
ZSU_23_4D08299274
Table 3. Detailed information of training and testing sets under EOC-30 and EOC-45.
ClassSerial NumberTrainingEOC-30°EOC-45°
2S1B01299288303
BRDM_2E71298287303
ZSU_23_4D08299288303
Table 4. Data distribution of the 8-class ATRNet-STAR dataset.
Class15°30°45°60°
Buick_Excelle_GT401536576576
Chery_qq3528624661648
Jeep_Patriot384576568576
Buick_GL8596618640660
Dongfeng_Duolika480520480480
FAW_J6P540576543576
Yutong_ZK6120HY1660572576576
Hyundai_HLF25_II536556564576
Table 5. SOC setting of the 8-class ATRNet-STAR dataset.
ClassTrainingTesting
Buick_Excelle_GT1436653
Chery_qq31689772
Jeep_Patriot1441663
Buick_GL81724790
Dongfeng_Duolika1392568
FAW_J6P1550685
Yutong_ZK6120HY11646738
Hyundai_HLF25_II1577655
Table 6. EOC setting of the 8-class ATRNet-STAR dataset.
ClassTrainingTesting
Buick_Excelle_GT401536
Chery_qq3528624
Jeep_Patriot384576
Buick_GL8596618
Dongfeng_Duolika480520
FAW_J6P540576
Yutong_ZK6120HY1660572
Hyundai_HLF25_II536556
Table 7. Ablation study on augmentation components on the MSTAR dataset. ↑ indicates that higher values denote better performance.
MethodPrecision ↑Recall ↑mAP@50 ↑mAP@50:95 ↑
Baseline71.479.586.672.9
Standard Augmention78.683.290.477.5
Random Copy-Paste83.486.592.680.9
SARBake + U-Net88.289.795.684.9
SARBake + U-Net + background classification only89.191.796.286.6
SARBake + U-Net + fusion only90.690.397.585.6
Proposed DA91.591.897.887.3
Table 8. Ablation experiments under different conditions on MSTAR dataset. ↑ indicates that higher values denote better performance.
MethodPrecision ↑Recall ↑mAP@50 ↑mAP@50:95 ↑
BaseDASFEMGD
SOC 71.479.586.672.9
91.591.897.887.3
78.585.085.878.8
77.886.286.579.6
95.495.398.890.3
93.296.198.690.0
93.496.298.990.3
EOC-30 69.283.781.353
79.382.784.959.3
72.884.281.054.1
73.583.882.555.0
75.985.686.265.6
77.485.285.566.5
81.785.890.167.4
EOC-45 48.167.547.419.7
51.85944.919.3
49.268.147.519.5
50.868.846.520.0
53.769.756.838.2
52.070.656.037.6
58.171.462.138.6
Table 9. Ablation experiments under different conditions on ATRNet-STAR dataset. ↑ indicates that higher values denote better performance.
MethodPrecision ↑Recall ↑mAP@50 ↑mAP@50:95 ↑
BaseDASFEMGD
SOC 95.894.897.362.7
95.995.097.562.8
95.094.997.362.6
95.794.897.462.7
95.895.297.562.9
96.194.997.662.8
96.095.097.663.0
EOC-30 75.471.077.342.6
77.272.879.343.6
76.872.078.843.2
76.572.278.543.0
78.874.280.843.7
78.773.980.543.8
79.674.581.144.1
Table 10. Comparison of different target detection networks on the MSTAR dataset. ↑ indicates that higher values denote better performance.
DatasetMethodPrecision ↑Recall ↑mAP@50 ↑mAP@50:95 ↑Params(M)GFLOPsFPS
SOCYOLOv8-s71.479.586.672.911.128.51666.7
DenoDet90.291.395.483.134.212.9215.0
DiffDet4SAR82.386.189.470.548.036.243.5
YOLOv11-s87.484.994.282.79.421.31666.7
RT-DETR-l95.195.195.984.832.0103.5588.2
SFS-Conv42.261.751.440.89.723.61250.0
Deformer-FPN94.99498.384.59.131.0172.6
DA-GDNet(ours)93.496.298.990.312.132.11250.0
EOC-30YOLOv8-s69.283.781.353.011.228.51250.0
DenoDet78.682.186.262.334.212.9215.0
DiffDet4SAR72.578.481.454.748.036.243.5
YOLOv11-s78.185.484.259.49.421.31666.7
RT-DETR-l79.47474.351.232.0103.5588.2
SFS-Conv74.177.384.862.79.723.61250.0
Deformer-FPN80.780.483.458.69.131.0176.0
DA-GDNet(ours)81.785.890.167.412.132.11250.0
EOC-45YOLOv8-s48.167.547.419.711.128.51666.7
DenoDet53.467.054.628.934.212.9215.0
DiffDet4SAR49.764.949.823.048.036.243.5
YOLOv11-s57.266.951.023.09.421.31666.7
RT-DETR-l51.946.237.119.932.0103.5588.2
SFS-Conv37.271.839.717.49.723.61250.0
Deformer-FPN51.765.75226.69.131.0172.6
DA-GDNet(ours)58.171.462.138.612.132.11250.0
Table 11. Comparison of different target detection networks on the ATRNet-STAR dataset. ↑ indicates that higher values denote better performance.
DatasetMethodPrecision ↑Recall ↑mAP@50 ↑mAP@50:95 ↑Params(M)GFLOPsFPS
SOCYOLOv8-s95.894.897.362.711.128.51666.7
DenoDet95.194.096.960.834.212.9215.0
DiffDet4SAR89.588.890.652.048.036.243.5
YOLOv11-s94.293.296.660.59.421.31666.7
RT-DETR-l96.495.396.861.532.0103.5588.2
SFS-Conv80.577.183.346.69.723.61250.0
Deformer-FPN96.094.796.756.39.131.0172.6
DA-GDNet(ours)96.09597.66312.132.11250.0
EOC-30YOLOv8-s75.47177.342.611.228.51250.0
DenoDet77.473.579.043.534.212.9215.0
DiffDet4SAR69.364.571.436.148.036.243.5
YOLOv11-s75.772.778.243.09.421.31666.7
RT-DETR-l76.274.878.044.332.0103.5588.2
SFS-Conv41.446.840.419.79.723.61250.0
Deformer-FPN80.172.878.741.99.131.0176.0
DA-GDNet(ours)79.674.581.144.112.132.11250.0
Disclaimer/Publisher’s Note: The statements, opinions and data contained in all publications are solely those of the individual author(s) and contributor(s) and not of MDPI and/or the editor(s). MDPI and/or the editor(s) disclaim responsibility for any injury to people or property resulting from any ideas, methods, instructions or products referred to in the content.