


Highlights
What are the main findings?
- Four LiDAR modalities (PNOA/ALS, Riegl ALS, ULS, and MLS) were benchmarked for plot-scale and tree-scale AGB and carbon estimations in Mediterranean woody crops.
- Species-specific allometry and fixed-area plot sampling enabled consistent biomass/carbon computations across the three farms in Córdoba (Spain).
What are the implications of the main findings?
- The National Aerial Orthophotography Plan (PNOA) can support scalable Measurement, Reporting and Verification (MRV) workflows for orchard carbon monitoring under specific canopy and terrain conditions.
- Cross-platform harmonization and transparent validation are essential for defensible and reproducible estimates.
Abstract
Reliable aboveground biomass (AGB) estimates for woody crops are essential for carbon accounting and for Measurement, Reporting and Verification (MRV) frameworks. However, it remains unclear how LiDAR modality and sampling geometry influence plot-scale and tree-scale AGB predictions in intensively managed Mediterranean orchards. In this study, we benchmarked four LiDAR modalities, namely open national airborne laser scanning from the Spanish National Aerial Orthophotography Plan (PNOA/ALS), a dedicated Riegl airborne laser scanner (ALS), unmanned laser scanning (ULS) and mobile laser scanning (MLS), across three woody-crop sites in Córdoba (southern Spain): IFAPA, Doña María, and Villaseca. Plot-level LiDAR metrics (mean height, 95th height percentile, maximum height, and canopy-cover proxies) were extracted from normalized point clouds and related to field AGB using Random Forest and XGBoost regression models, together with an ensemble predictor, under an 80/20 train–test split. In parallel, TreeQSM-based Quantitative Structure Models (QSMs) were evaluated as an independent tree-level three-dimensional reconstruction approach. XGBoost achieved the lowest errors at IFAPA (RMSE = 0.400 Mg ha−1; R2 = 0.994) and Villaseca (RMSE = 0.872 Mg ha−1; R2 = 0.995), whereas PNOA/ALS was competitive at Doña María (RMSE = 0.725 Mg ha−1; R2 = 0.994). TreeQSM closely matched the field inventory at the low-biomass IFAPA site but tended to overestimate biomass at Doña María and Villaseca, and only 28% of scanned trees yielded usable reconstructions. The results support the use of cross-platform LiDAR for orchard AGB and carbon mapping and identify the conditions under which open national LiDAR can enable scalable MRV of Mediterranean woody crops.
1. Introduction
Woody-crop agroecosystems, and in particular the olive and almond orchards that dominate the Mediterranean landscape, store substantial amounts of carbon in long-lived woody biomass and are increasingly relevant for carbon accounting under Measurement, Reporting and Verification (MRV) frameworks in agriculture. Traditional field inventories remain the benchmark for aboveground biomass (AGB) estimation, yet they are labor-intensive and impractical at operational scales. Light Detection and Ranging (LiDAR) has emerged as the most robust remote-sensing alternative because it provides direct three-dimensional structural measurements, from which plot-scale AGB can be modeled by relating height-distribution and canopy-cover metrics to field-derived AGB through area-based approaches [1,2]. The present study therefore focuses on a single, well-defined operational question: how do four LiDAR modalities routinely available for orchard monitoring—open national airborne LiDAR (PNOA/ALS), a dedicated Riegl airborne scanner (ALS), unmanned laser scanning (ULS) and mobile laser scanning (MLS)—compare in terms of plot-scale AGB and carbon accuracy across Mediterranean olive and almond orchards?
A key operational question for MRV is how much LiDAR detail is actually required for reliable AGB estimation. Open national airborne LiDAR programs such as Spain’s PNOA-LiDAR [3] provide broad, repeated coverage at relatively low point densities, whereas dedicated ALS, ULS and MLS surveys deliver denser sampling with distinct geometries but at the cost of higher acquisition effort and potential occlusion or strip-alignment artefacts [4,5,6]. Against this background, the specific objectives of the present study are: (i) to quantify the plot-scale AGB accuracy achievable with each of the four LiDAR modalities at three contrasting Mediterranean orchards; (ii) to assess the conditions under which the open PNOA/ALS dataset can match dedicated ALS, ULS, or MLS acquisitions; and (iii) to evaluate—as a complementary, exploratory analysis—how TreeQSM-based three-dimensional reconstructions perform when applied to the same orchards, both as an independent biomass estimator and as a diagnostic of point cloud usability. We hypothesize that (a) the plot-scale AGB signal in orchards is dominated by a small number of height-percentile and cover metrics that can be recovered from moderate-density national LiDAR and (b) tree-level QSM reconstructions can complement the area-based pathway but are strongly constrained by the acquisition geometry typical of orchard MLS surveys.
In this context, the main objective of the present study was to compare plot-scale AGB estimation accuracy obtained from four LiDAR modalities (PNOA/ALS, Riegl ALS, ULS, and MLS) in Mediterranean woody crops and to assess the conditions under which open national LiDAR is competitive with dedicated airborne, unmanned, and mobile LiDAR acquisitions. To achieve this, we established 58 fixed-area plots (1867 trees) across three woody-crop sites in Córdoba (southern Spain) and used species-specific allometries together with machine-learning regression models, namely Random Forest and XGBoost [7,8], to predict plot-scale AGB and carbon from LiDAR metrics. In parallel, and in a complementary line of analysis, we evaluated TreeQSM-based Quantitative Structure Models as an independent tree-level three-dimensional reconstruction approach in order to assess when and where geometric reconstruction can add value to area-based predictors in orchard MRV applications.
Beyond area-based plot metrics, an increasingly important line of work leverages quantitative structural models (QSMs) to reconstruct tree geometries directly from 3D point clouds. QSM approaches, typically based on fitting cylinder primitives to woody skeletons, aim to estimate stem/branch volume and related structural attributes at the individual-tree level, enabling biomass inference with a more explicit geometric basis than summary height or density metrics. In principle, QSM-derived descriptors can reduce reliance on purely empirical relationships and improve transferability across sites when point density and occlusion conditions allow faithful reconstruction. However, QSM performance is highly sensitive to point cloud quality and sampling geometry: noise, variable point density, occlusion, and segmentation errors can propagate into biased volume estimates, especially in complex crowns, hedgerow architectures, and intensively managed orchards where the canopy structure departs from typical forest forms. Consequently, the feasibility and reliability of QSMs in woody-crop settings remain less established than those in forest terrestrial laser scanning (TLS) applications, and systematic comparisons against conventional inventory-based allometry and plot-level LiDAR models are still limited.
Therefore, in this study, we complemented cross-platform plot-scale modeling with a TreeQSM-based QSM evaluation as an independent, tree-level 3D reconstruction pathway. By comparing QSM-derived biomass estimates with field inventory across sites spanning low- to higher-biomass conditions, we assessed not only accuracy but also practical usability (e.g., proportion of trees successfully reconstructed) under real acquisition constraints. This dual perspective of geometric reconstruction (QSM) versus area-based predictors (ML models) helps clarify when 3D structural modeling offers added value for biomass and carbon estimation in Mediterranean woody-crop agroecosystems.
2. Materials and Methods
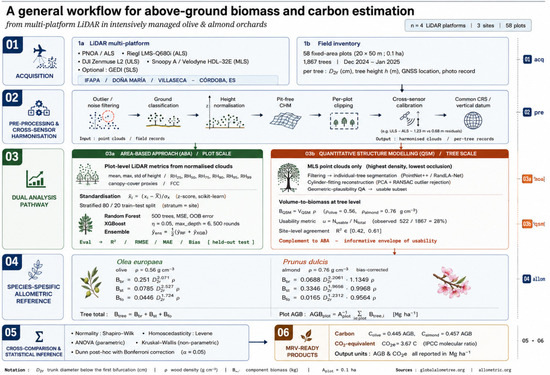
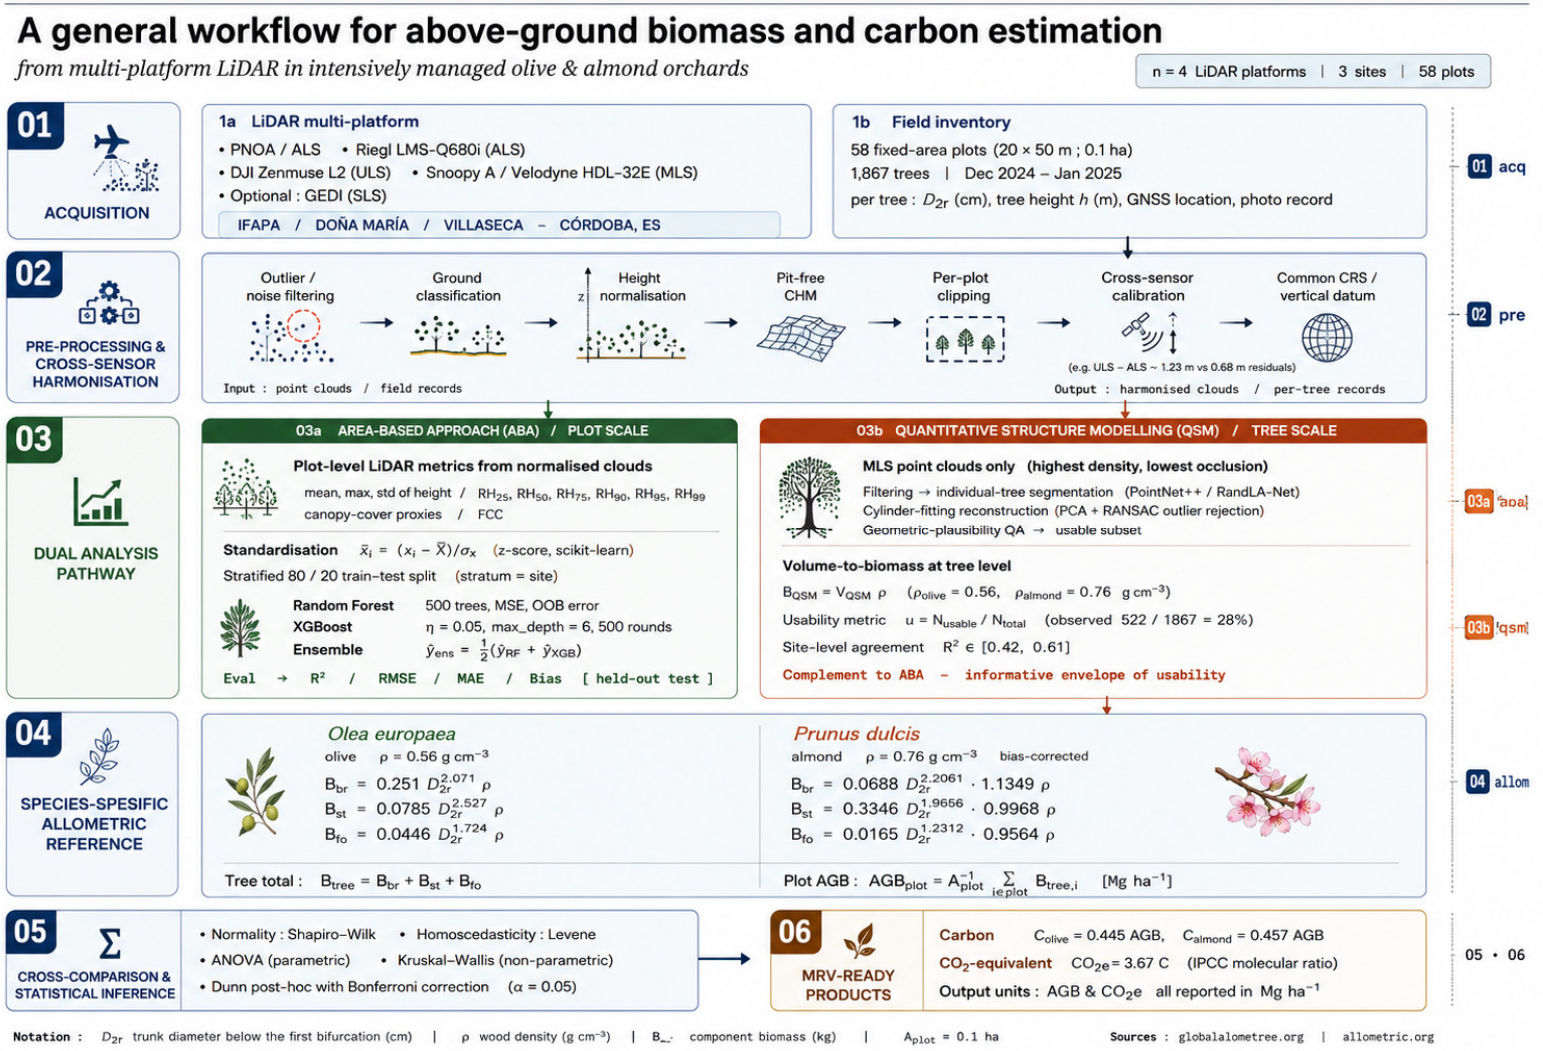
Figure 1 summarizes the general workflow of this study, from multi-platform LiDAR acquisition and field inventory to species-specific allometric reference biomass, dual-scale analysis (plot-scale area-based approach and tree-scale TreeQSM), statistical inference and the delivery of MRV-ready AGB, carbon and CO2-equivalent products.
Figure 1.
General workflow for aboveground biomass and carbon estimation from multi-platform LiDAR in Mediterranean olive and almond orchards. Six numbered stages (01 acquisition, 02 pre-processing and cross-sensor harmonization, 03 dual analysis pathway with the area-based approach and the tree-scale TreeQSM reconstruction, 04 species-specific allometric reference, 05 cross-comparison and statistical inference, and 06 MRV-ready products). Field inventory (D_2r, tree height) feeds the species-specific allometry that provides the reference AGB against which the two LiDAR-based pathways are evaluated. Product units are Mg ha−1 throughout.
2.1. Study Sites
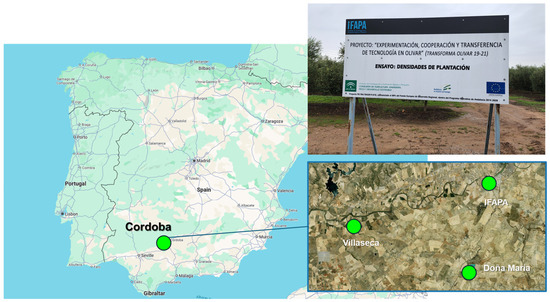
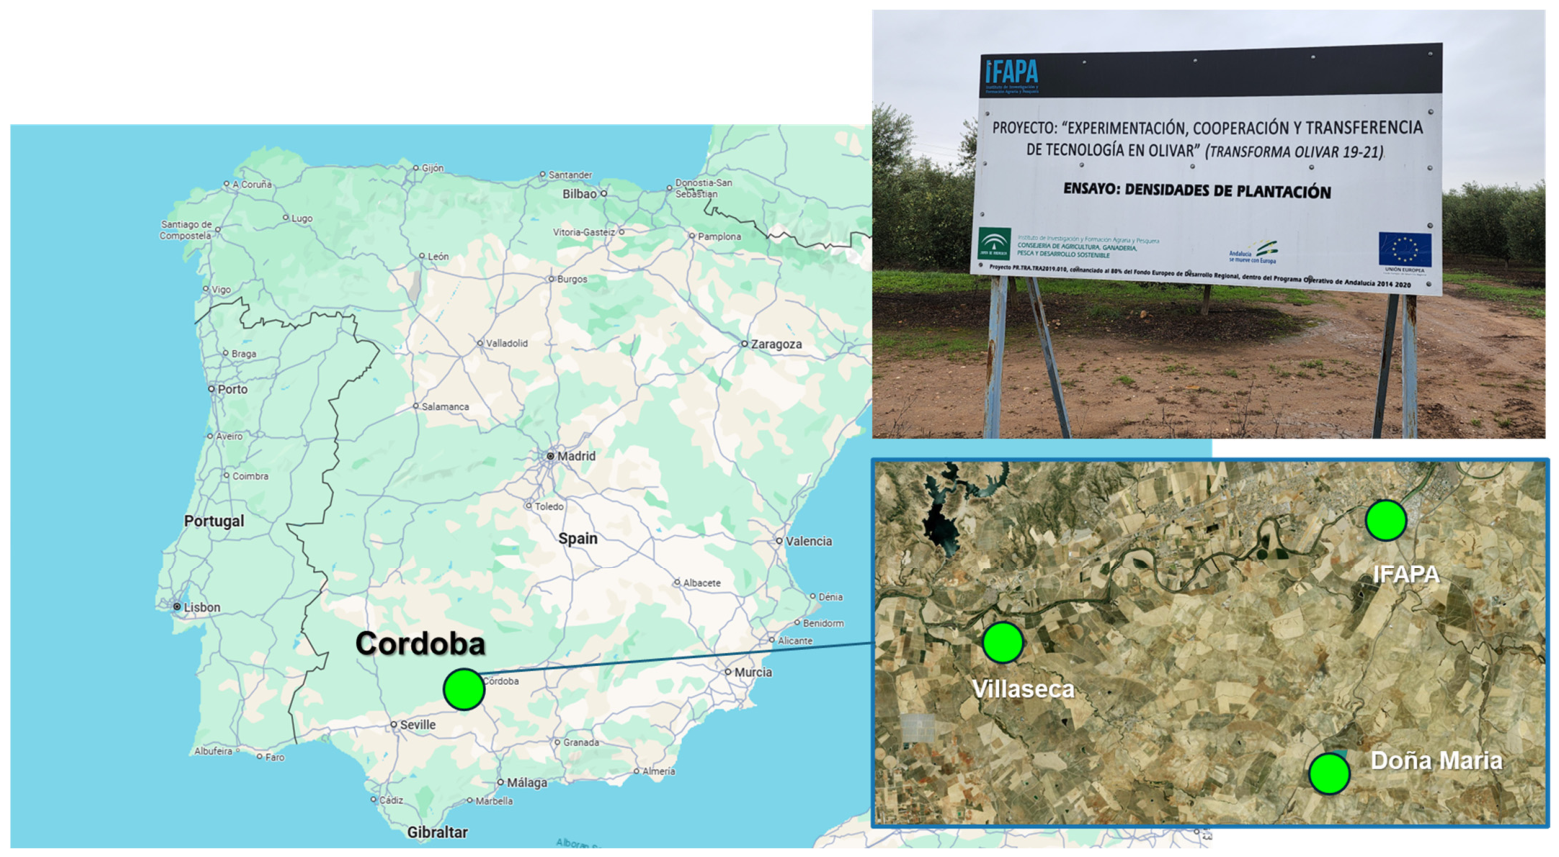
The study was conducted on three farms in the province of Córdoba (southern Spain): IFAPA (Finca Experimental de la Alameda del Obispo, Córdoba, Spain), Doña María (Córdoba, Spain; Cerro del Obispo, S.L.), and Villaseca (Almodóvar del Río, Córdoba, Spain; Agrícola Villaseca S.L., Cortijo La Reina). The sites span research to commercial settings and contrasting orchard structures (Figure 2).
Figure 2.
Location of the study sites.
IFAPA: The study area covers approximately 6.82 ha within the Alameda del Obispo experimental farm, a research station operated by IFAPA and co-located with CSIC and INIA facilities. The study focused on olive and almond plots with the following planting layouts: olive 6 × 2.5 m, 4 × 1.5 m and 7 × 3.4 m; almond 7 × 6 m, 3.5 × 1.2 m and 6 × 3 m. The site shows predominantly flat terrain with very gentle slopes and an altitude ranging from approximately 100 to 120 m above sea level. Soils are alluvial with sandy-loam texture and substantial silt content, and soil depth exceeds 2 m. The climate is Mediterranean, with a mean annual precipitation of approximately 600 mm concentrated between October and April. For the 2024 reference year, the mean annual temperature was 19 °C, annual precipitation 572 mm and mean relative humidity (RH) 64%; prevailing winds blow from east to west. The site is located in the Guadalquivir floodplain, where flood risk is relevant. Olive and almond orchards were established in 2018, with drip irrigation, manual and mechanical pruning, olive harvest in November–December and almond harvest in August.
Doña María: The farm is topographically variable and combines new plantings with older trees; three parcels were defined for analysis. The farm is described as 187 ha (farm description) and 261.45 ha (spatial data extent) planted with olives (Olea europaea) of Picual and Arbequina varieties. It is square-shaped with undulating relief; a mean slope of 2.7%; an altitude of ~230 m a.s.l.; and clay soil (other chemical properties not available). The mean annual temperature is ~19 °C; precipitation is ~600 mm; RH is ~65%; prevailing winds run W→E; and groundwater resources are mentioned. The farm practices drip irrigation; mineral fertilization; manual pruning; chemical pest control; and olive harvest in November–December.
Villaseca: The farm is commercial and intensively managed; thirteen parcels were derived for analysis and scalability testing. The total farm area is ~85 ha. It has a regular square shape and flat relief; a slope of 1.80%; an altitude of ~80 m a.s.l.; and an orientation NW–SE. It has clay–loam soil with a depth of ~2 m; pH 8.5; and organic matter at 1.20%. For 2024, the mean temperature was 18.5 °C, precipitation was 697 mm, and RH was 65%; prevailing winds run W→E. Olive and almond orchards were established in 2018. Drip irrigation is applied, as well as fertilization with liquid mineral fertilizers and phytosanitary treatments.
2.2. Field Inventory, Plot Design, and Biomass/Carbon Computation
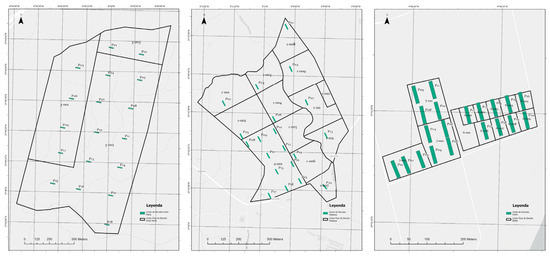
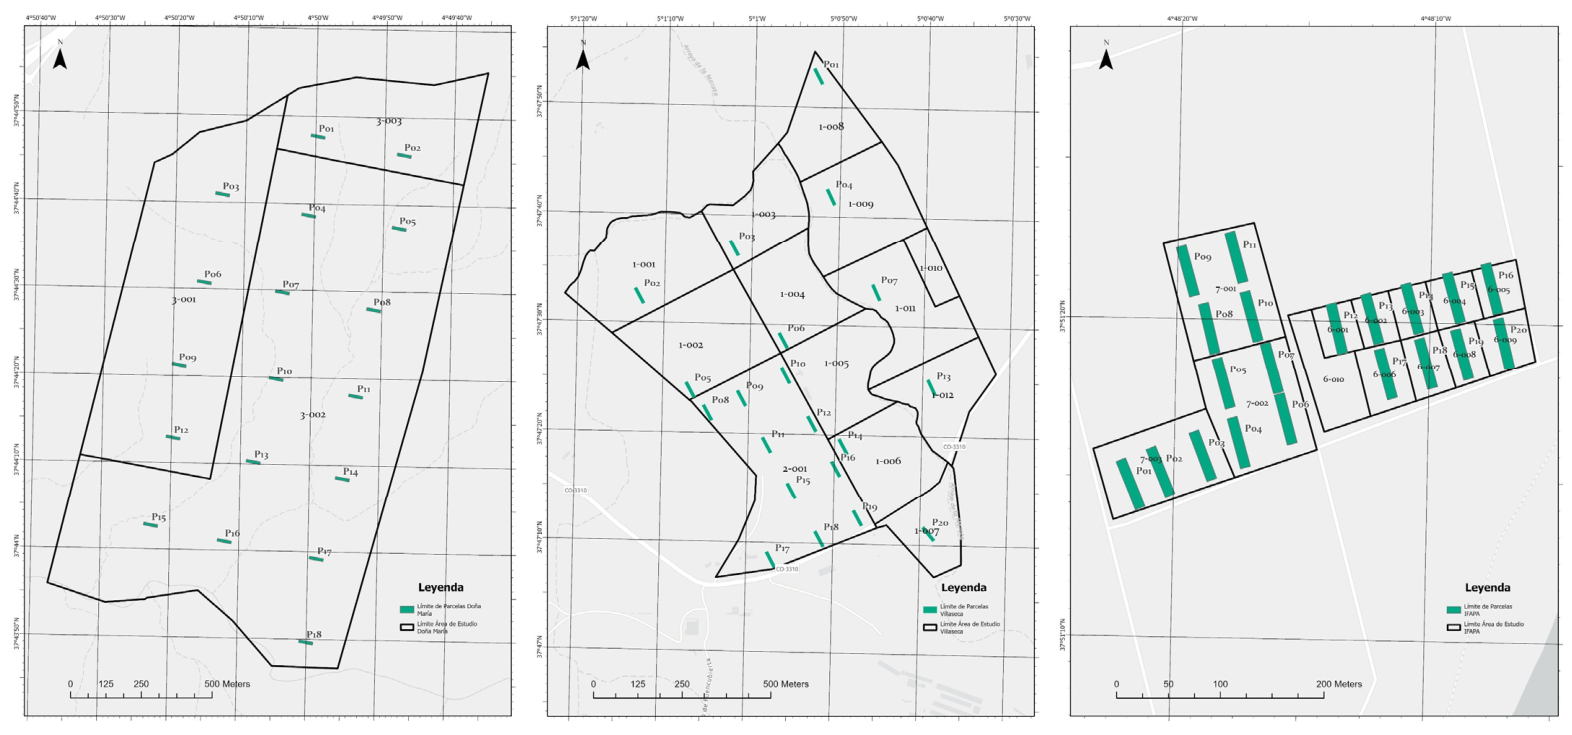
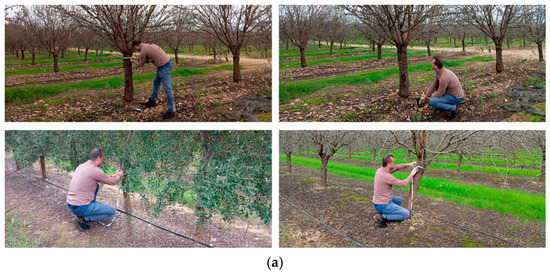
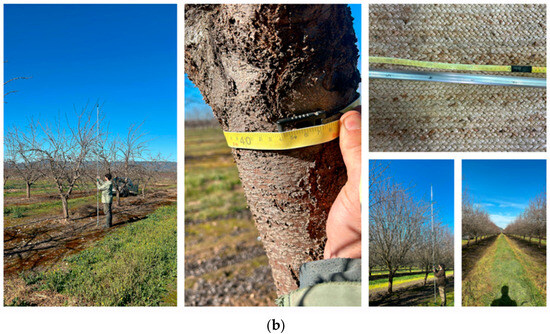
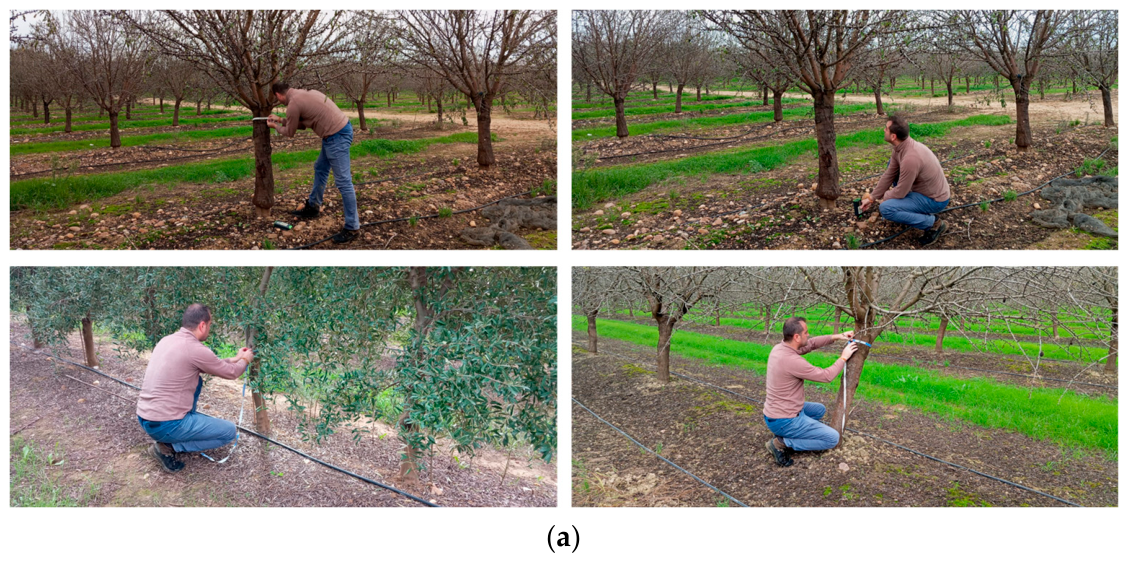
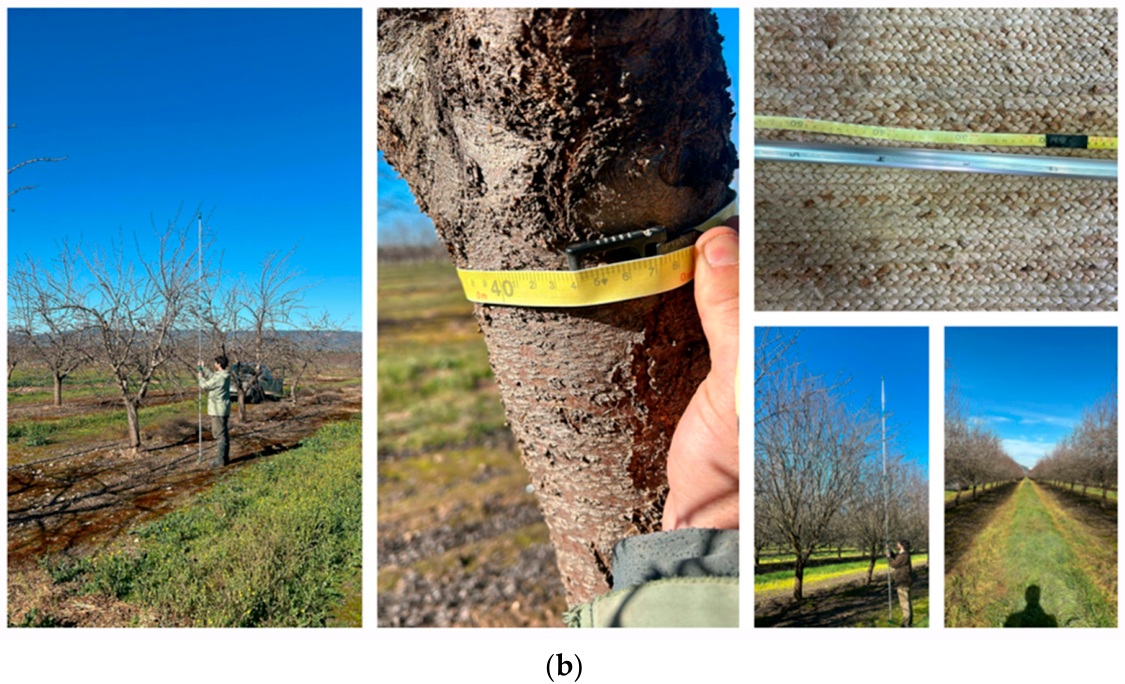
Fixed-area rectangular plots of 20 m × 50 m (1000 m2; 0.1 ha) were used as the primary sampling units (Figure 3). Plots were selected using simple random sampling to minimize selection bias and ensure independence among observations. A total of 58 plots were surveyed (Doña María: 18; IFAPA: 20; Villaseca: 20). Field measurements were collected during December 2024 and January 2025 across the three farms. Tree diameters were measured with a tape measure, and tree height was measured (Figure 4) using two 5 m extendable poles that were calibrated prior to measurements and, where needed for the tallest trees, extended in tandem to reach approximately 10 m. No survey-grade GNSS receiver was employed during the field inventory. Plot centroids and boundaries were located directly from the airborne LiDAR intensity return and the co-acquired orthophotograph, both of which provide sub-meter absolute accuracy, and were cross-verified against high-resolution handheld field photographs of each plot. The UTM coordinates of every plot centroid are provided in Appendix A (Table A1). This approach was adopted because the operational unit of the inventory is the 0.1 ha fixed-area plot, for which a decimetric-to-metric field position is more than sufficient for aligning the field measurements with the plot-scale LiDAR metrics; a survey-grade receiver would not have improved the plot-scale correspondence between the two data sources. All records were archived in standardized spreadsheets.
Figure 3.
Study sites and field inventory plots.
Figure 4.
(a) Methodology and equipment used for field measurements. (b) Methodology and equipment used for field measurements.
Height-measurement adequacy. The 5 m telescopic poles were used in tandem (combined reach ≈ 10 m) and were sufficient for the observed height range: at IFAPA, from a complete inventory of 433 trees, only 1 tree (0.23%) exceeded 5.0 m in height, and the maximum recorded height was 5.10 m. The mean height at IFAPA was 3.82 m (SD 0.56 m; 90th percentile 4.45 m; 6.7% of trees between 4.5 and 5.0 m), and the mean height at Doña María and Villaseca was likewise below 5 m (Table 1). For the few trees whose apex was above the reach of a single fully extended pole (<1% of the sample), the two calibrated poles were extended together, giving a total reach of ~10 m; measurements were cross-verified with photographic evidence to bound the residual error to ±0.10 m.
Table 1.
Field inventory summary by site (mean ± standard deviation).
Tree-level AGB (kg) was converted to carbon (C, kg C) using species-specific mean wood carbon fractions of 44.5% for olives and 45.7% for almonds (C_olive = AGB × 0.445; C_almond = AGB × 0.457). These values follow the compilation of Thomas and Martin [9] for temperate hardwoods and are consistent with the IPCC Volume 4 guidelines for perennial cropland [10]. The CO2 equivalent was computed as CO2e = 3.67 × C in accordance with the IPCC molecular-weight conversion factor (44/12). Additional support for orchard-specific carbon fractions is provided in [11,12,13].
For almonds, the component biomass was computed as
B_branches = 0.0688 × D_2r^2.2061 × 1.1349 × ρ
B_stem = 0.3346 × D_2r^1.9656 × 0.9968 × ρ
B_foliage = 0.0165 × D_2r^1.3212 × 0.9564 × ρ
For olives, the component biomass was computed as
B_branches = 0.251 × D_2r^2.071 × ρ
B_stem = 0.0785 × D_2r^2.527 × ρ
B_foliage = 0.0446 × D_2r^1.724 × ρ
Wood density was set to ρ = 0.76 g·cm−3 for almonds and ρ = 0.56 g·cm−3 for olives, following Miles and Smith [14] for Prunus dulcis and Fajardo et al. [15] for Olea europaea. Both values were additionally cross-checked against the BIOMASS R package (Réjou-Méchain et al. [16]) via its getWoodDensity() function, which queries the Global Wood Density Database at the species and genus level, and returned mean values fully consistent with those adopted here for the two species. D_2r was measured in cm and component biomass in kg, and the equations are applicable for trunk diameters between 5 and 50 cm. Total tree AGB was computed as the sum of the component biomass values. The plot-level AGB density (Mg ha−1) was obtained by summing the tree AGB within each plot, converting kg to Mg and dividing by the plot area (0.1 ha).
Tree-level AGB (kg) was converted to carbon (C, kg C) using mean wood carbon fractions of 44.5% for olives and 45.7% for almonds (COlive = AGB × 0.445; CAlmond = AGB × 0.457). CO2 equivalent was computed as CO2e = 3.67 × C following IPCC molecular-weight conversion. Carbon-fraction sources include orchards and olive allometry/carbon studies [10,11,12,13].
2.3. LiDAR Datasets
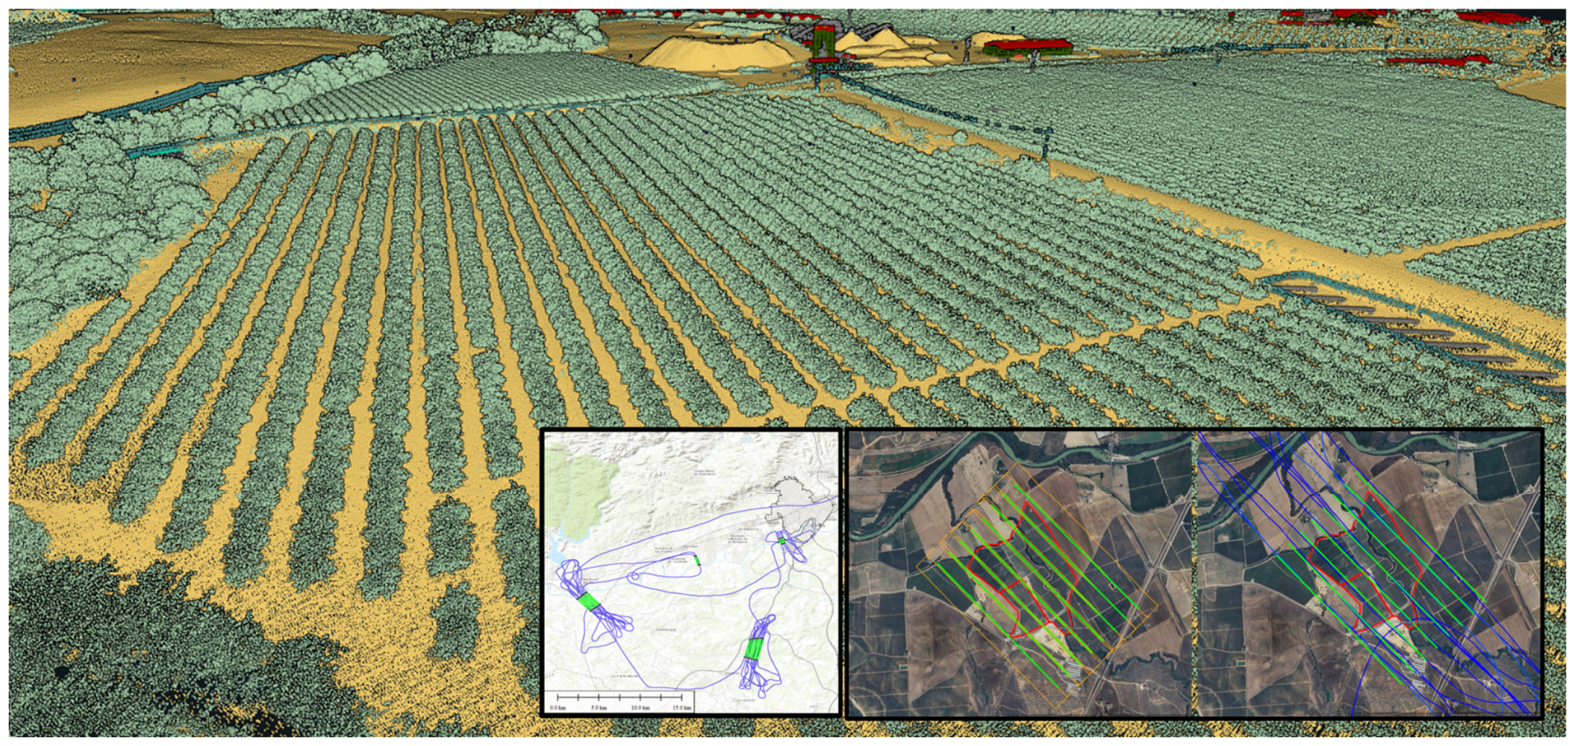
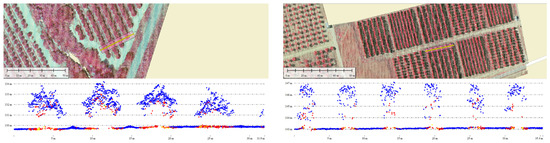
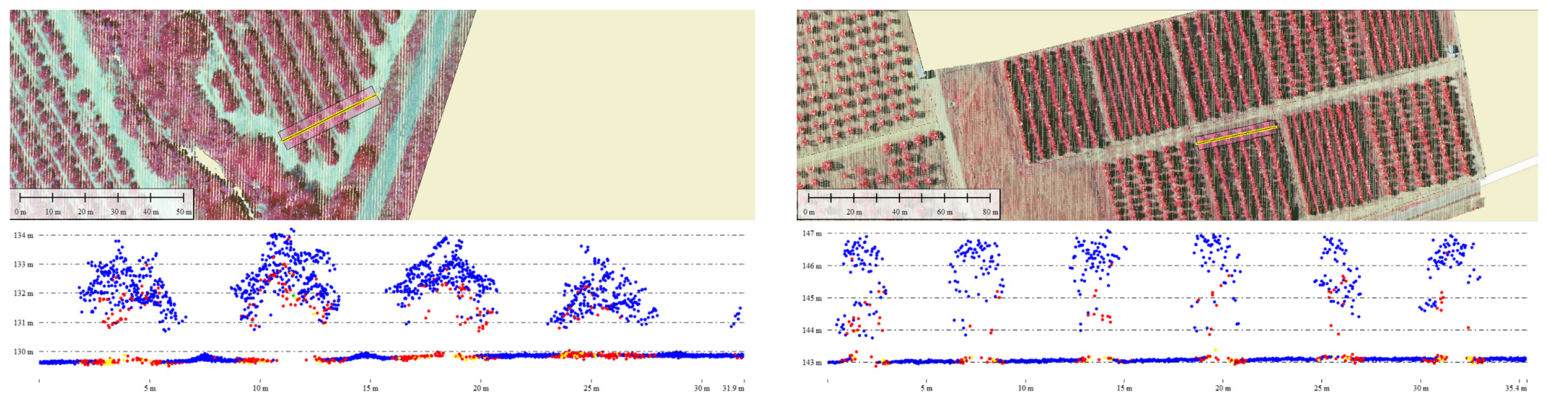
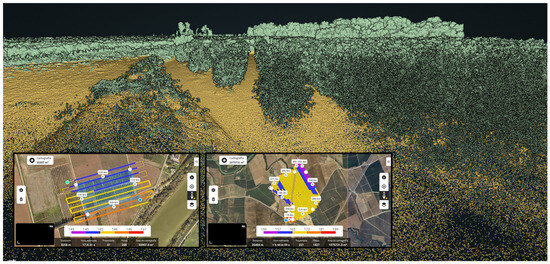
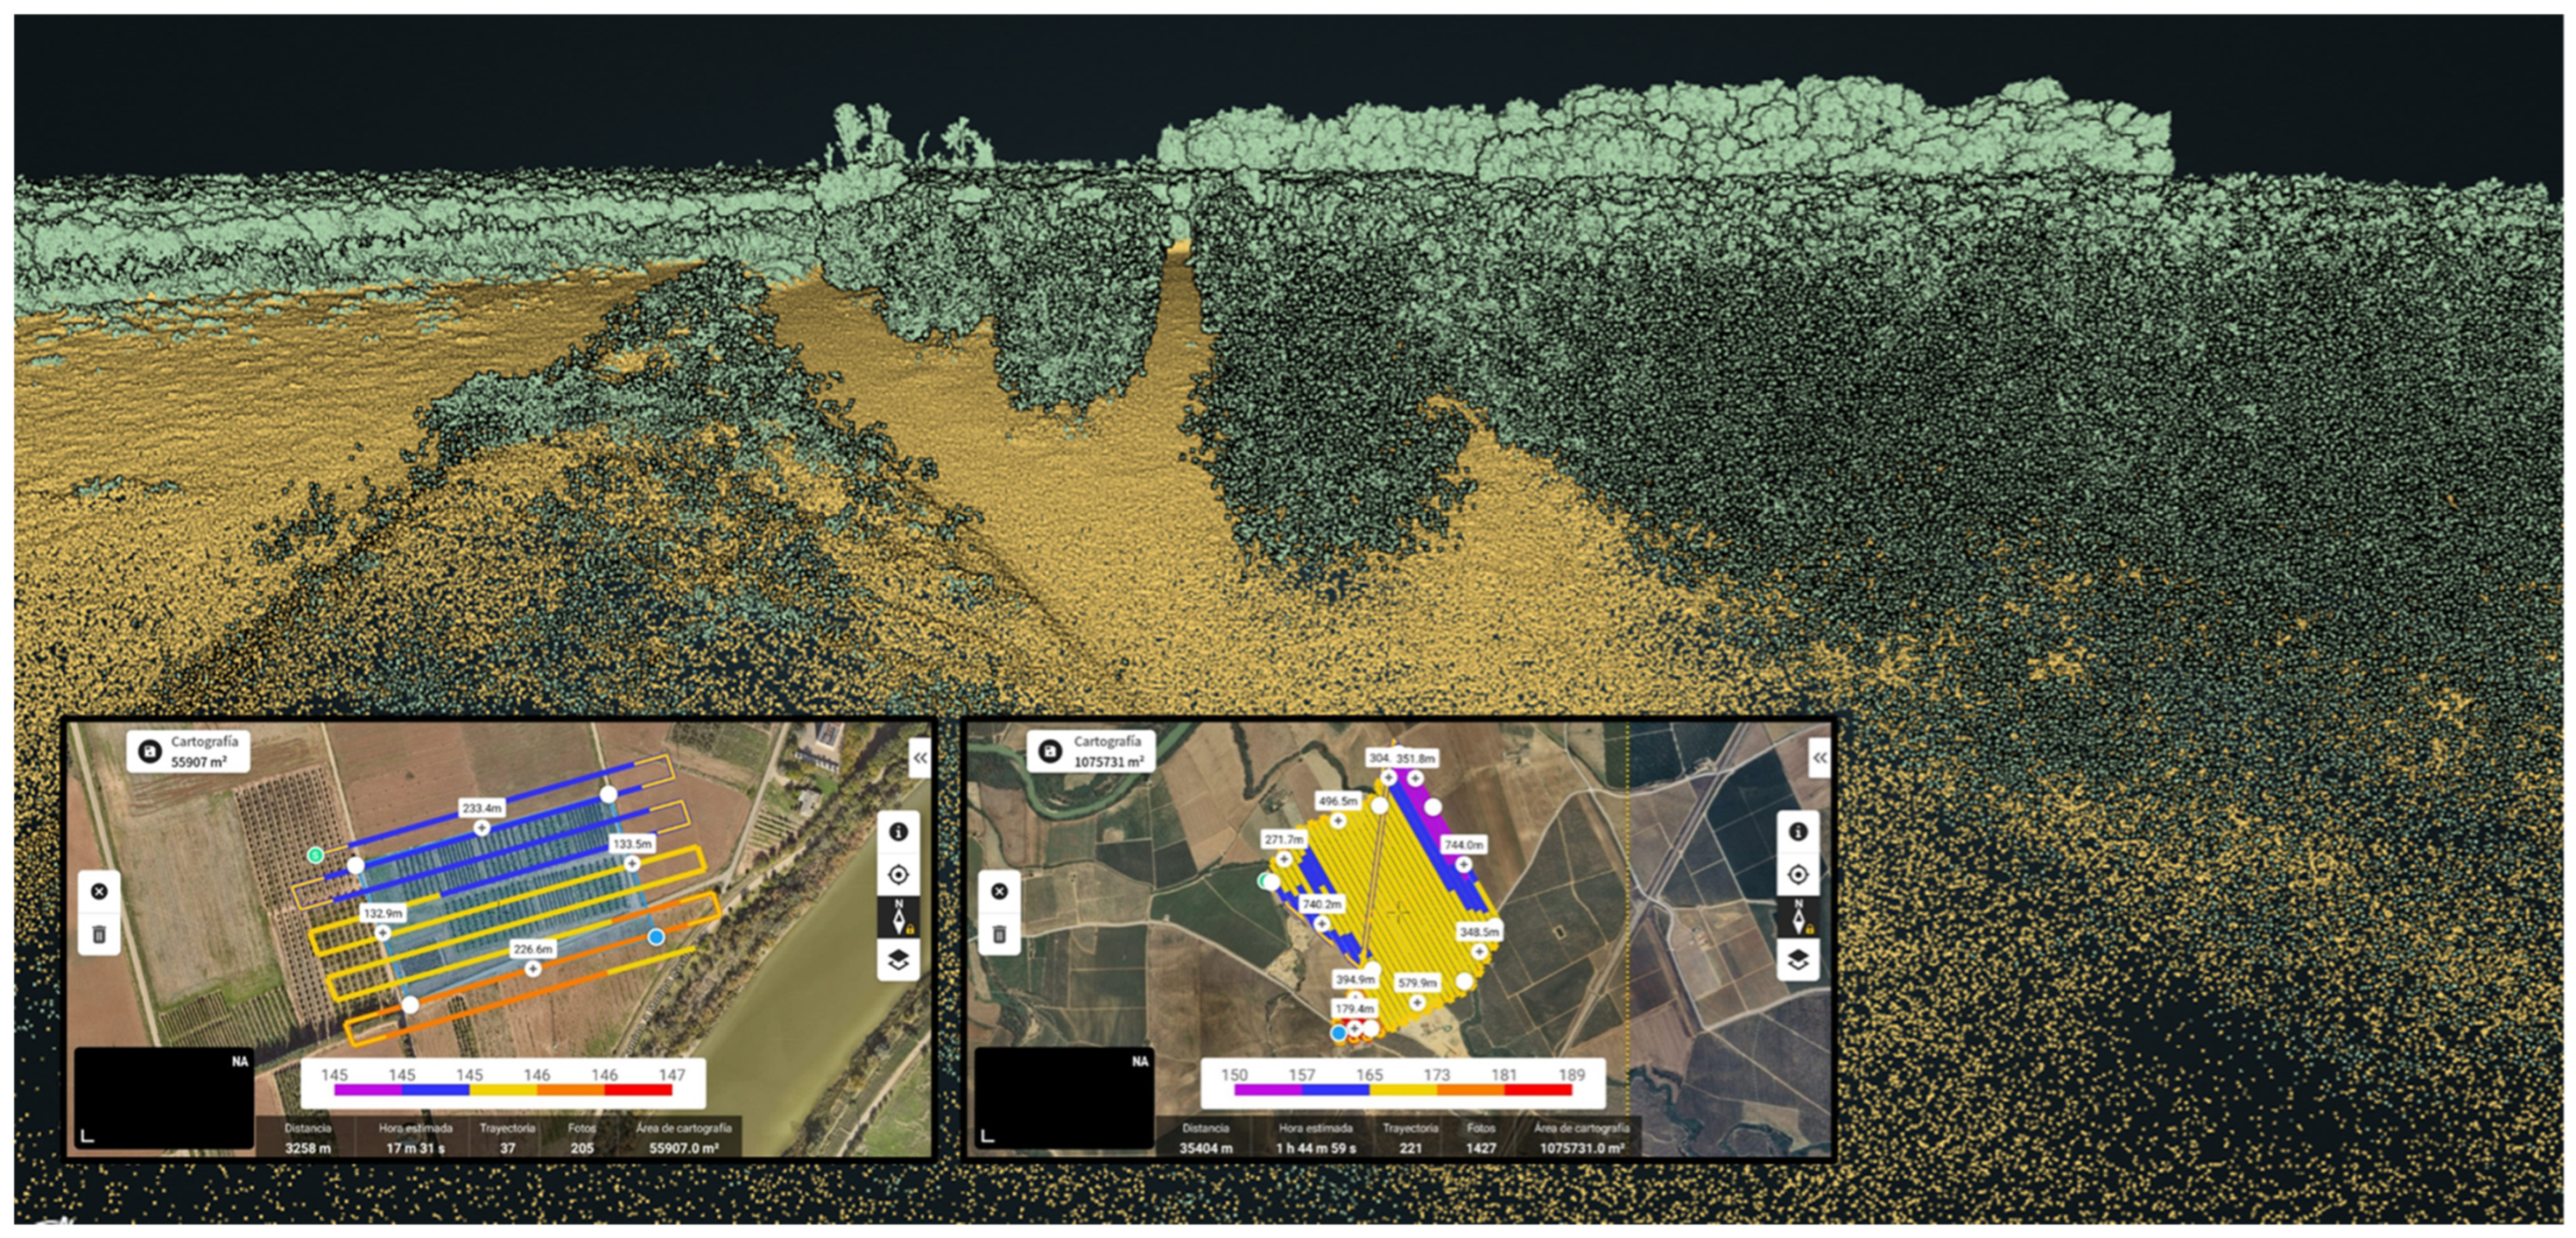
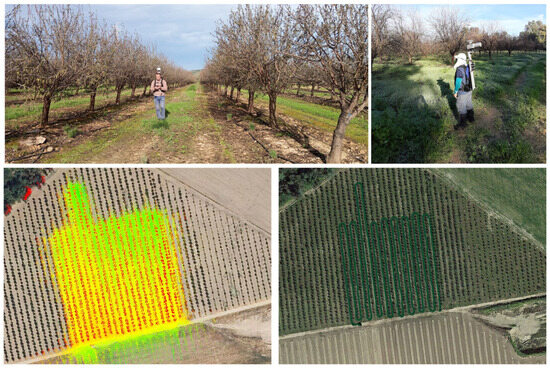
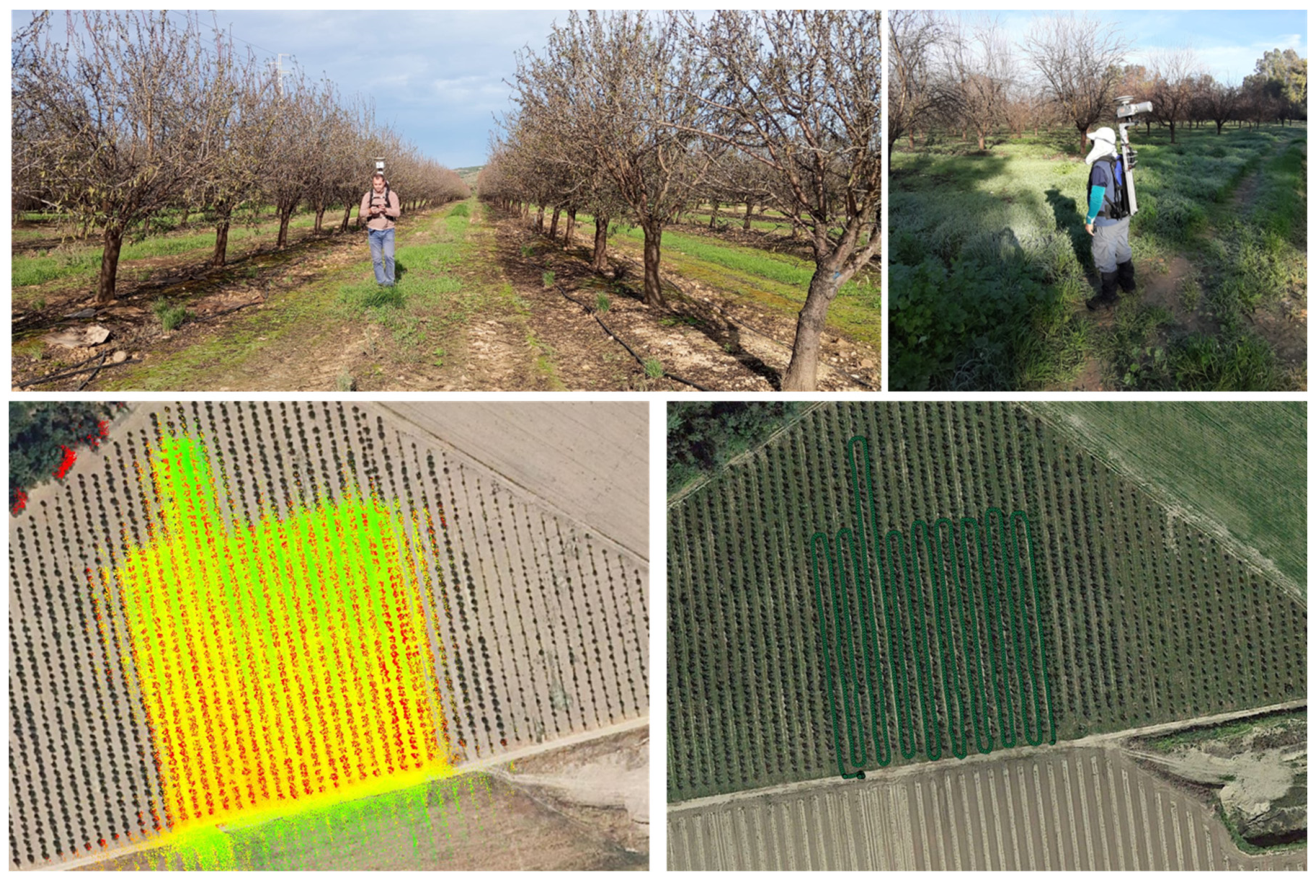
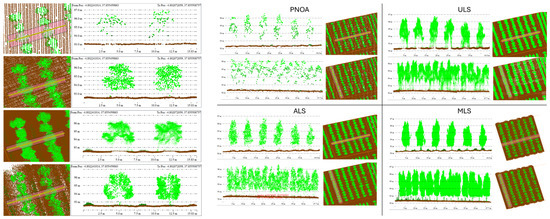
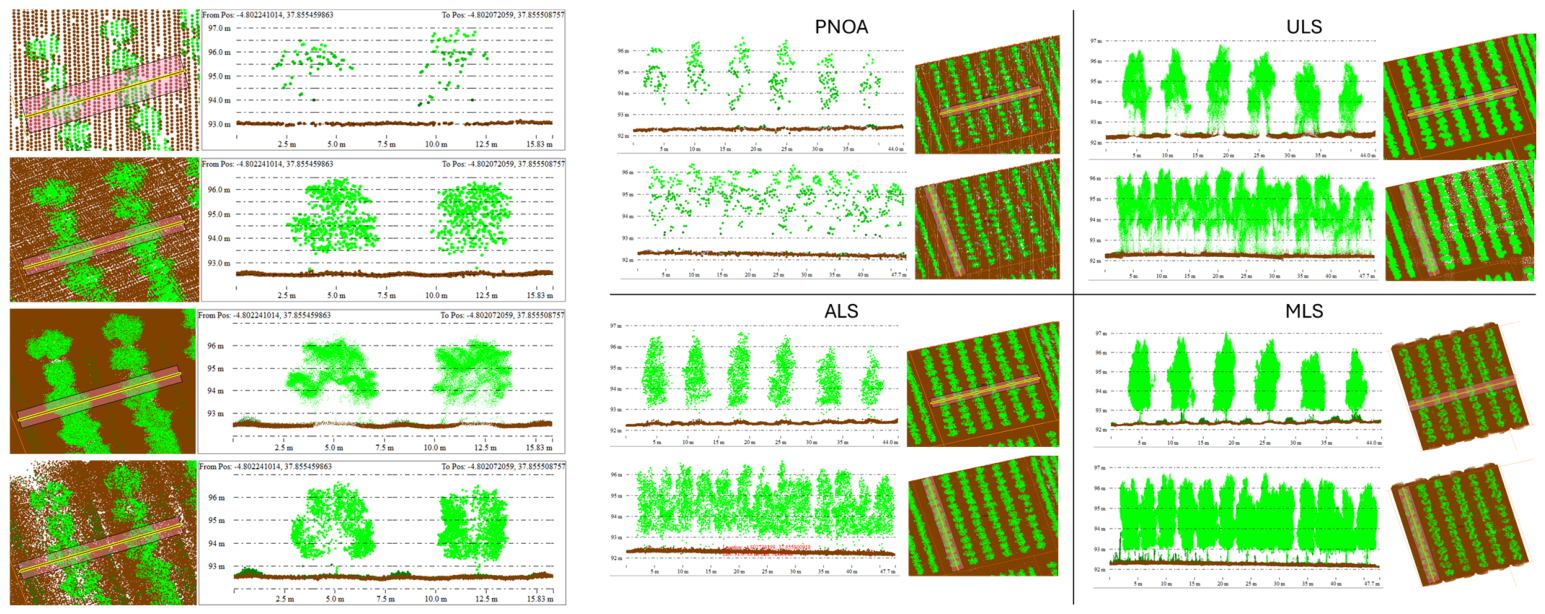
Four LiDAR modalities were analyzed in this study: (i) the Spanish National Aerial Orthophotography Plan LiDAR (PNOA/ALS), which is an open national airborne LiDAR program [3]; (ii) a dedicated airborne laser scanner (ALS) based on a RIEGL LMS-Q680i (RIEGL Laser Measurement Systems GmbH, Horn, Austria) sensor; (iii) an unmanned laser scanning (ULS) system mounted on a DJI platform and equipped with a DJI Zenmuse L2 (SZ DJI Technology Co., Ltd., Shenzhen, China) sensor; and (iv) a mobile laser scanning (MLS) system (LiDAR USA Snoopy A-Series with Velodyne HDL-32E (Velodyne Lidar, Inc., San Jose, CA, USA)). The Riegl ALS acquisition and associated flight plans are shown in Figure 5, while Figure 6 illustrates the corresponding PNOA/ALS point cloud data and cross-sections. The ULS DJI flight plans and classified point clouds are presented in Figure 7, and the MLS Snoopy terrestrial trajectories and point clouds are shown in Figure 8 and Figure 9.
Figure 5.
ALS Riegl airborne flight plans and classified point cloud data.
Figure 6.
ALS PNOA point cloud data and cross-sections.
Figure 7.
ULS DJI drone flight plans and classified point cloud data.
Figure 8.
MLS Snoopy terrestrial trajectories and point cloud data.
Figure 9.
MLS Snoopy point cloud data.
GNSS differential correction. The precise GNSS work in the study is at the trajectory level, not at the field inventory level. Differential post-processed kinematic (PPK) correction of the ULS (DJI Zenmuse L2) and MLS (LiDAR USA Snoopy A-Series/Velodyne HDL-32E) trajectories was performed against the permanent GNSS reference station CRDB (Córdoba, DOMES code 13461M001) of the Andalusian Positioning Network (RAP—Red Andaluza de Posicionamiento), operated by the Instituto de Estadística y Cartografía de Andalucía (IECA), Junta de Andalucía. CRDB is the nearest permanent GNSS station to the three study farms in the Guadalquivir Valley and hosts a Leica GR50 receiver with a Leica LEIAR20 LEIM choke-ring antenna at 37°52′38.638″N, 4°47′16.206″W, ellipsoidal height 196.094 m. The raw RINEX observations from CRDB for the field campaign dates were retrieved from the RAP data portal and archived in the project data repository. The dedicated Riegl ALS acquisition, subcontracted to Stereocarto Iberoamérica S.L., followed the same CRDB-based differential correction protocol given its geographic proximity to the flight block, while the PNOA/ALS acquisition follows the operational chain of the Spanish National Aerial Orthophotography Plan, whose differential correction relies on the ERGNSS network of the Instituto Geográfico Nacional (IGN) as per the CNIG standard procedure [3].
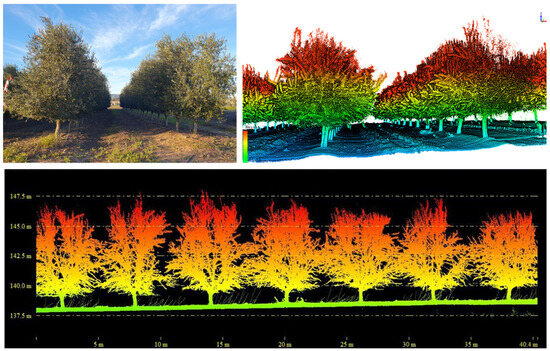
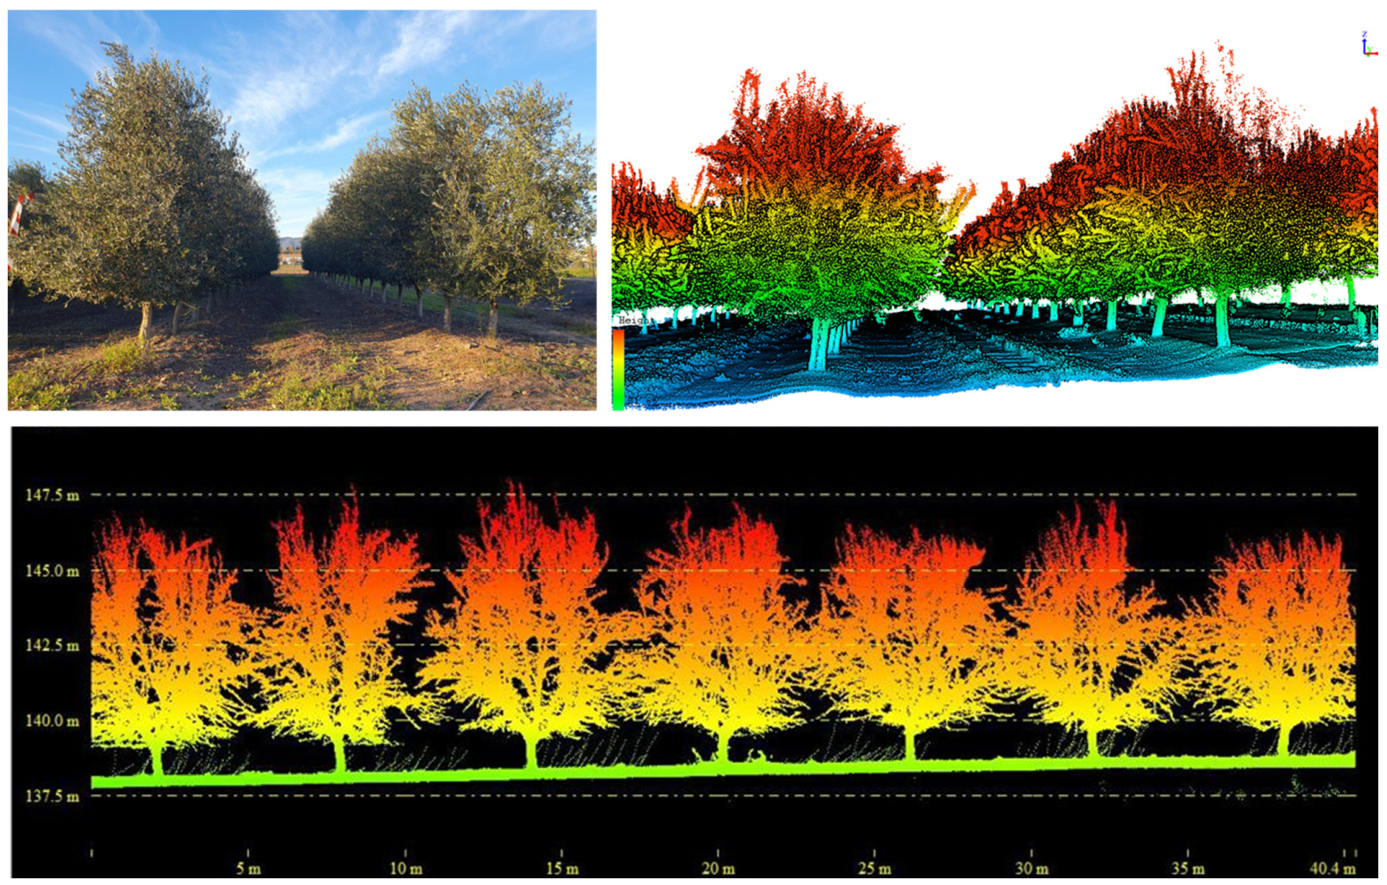
ALS was prioritized for large extents (e.g., Doña María), ULS was employed for detailed characterization in smaller areas (e.g., IFAPA), and MLS was used for close-range sampling (Figure 10). Dataset metadata, including point density and recommended CHM resolution, are summarized in Table 2 and Table 3.
Figure 10.
LiDAR point cloud data; cross-sections from all sensors.
Table 2.
LiDAR modality summary (density, suggested CHM resolution, and spatial reference metadata).
Table 3.
Sensor/platform and acquisition specifications (as provided).
2.4. Pre-Processing and Metric Extraction
All four LiDAR datasets were processed with a common software stack (Python 3.10, scikit-learn 1.3, XGBoost 2.0, laspy 2.4, PDAL 2.5, and lidR 4.0 in R 4.3) to enable strict cross-platform comparability. The pre-processing sequence was executed in the following order: (i) statistical outlier removal (SOR; k = 8, standard-deviation multiplier 2.5); (ii) ground/vegetation separation using the Cloth Simulation Filter (CSF; cloth resolution 0.5 m, rigidness 3, class threshold 0.5 m); (iii) semantic classification of stem, branches, leaves and understory using PointNet++/RandLA-Net fine-tuned on a manually labeled subset of MLS returns; (iv) terrain interpolation using triangulated irregular networks to obtain the digital terrain model (DTM; 0.5 m resolution); (v) height normalization of every return relative to the DTM; and (vi) rasterization of the normalized returns into the canopy height model (CHM). The CHM was produced at a 0.5 m native resolution for MLS and ULS and 1.0 m for ALS and PNOA/ALS following the pit-free algorithm of Khosravipour et al. [4] with a 0.2 m sub-circle radius, five height thresholds (2, 5, 10, 15, 20 m) and a 0.1 m maximum crown-radius correction. Parameter values were selected after preliminary sensitivity trials at each site.
For metric extraction, LAS/LAZ files were handled programmatically (e.g., using Laspy in Python and LasCanopy from LAStools), and plot-level structural metrics were computed from normalized point clouds. The project workflow describes plot metrics stored in CSV files per site and system, including mean height, 95th percentile of height (p95), maximum height, and canopy-cover proxies. Additional geometric descriptors (e.g., point density and slope/curvature metrics) were considered during pre-processing to characterize terrain and sampling effects.
Because sources differ in coordinate reference systems and orthometric height references, all datasets should be harmonized to a common horizontal CRS and vertical datum prior to comparison. The final submission should document the transformation parameters and quantify the residual co-registration errors.
2.5. Modeling and Validation
For each plot and each LiDAR system (PNOA/ALS, Riegl ALS, ULS, and MLS), plot-level structural metrics were extracted from the normalized point clouds and stored in per-system CSV tables. The extracted metrics included the mean, maximum, and standard deviation of height; height percentiles such as the 25th, 50th, 75th, 90th, 95th, and 99th percentiles (hereafter referred to as relative-height metrics, RH25, RH50, RH75, RH90, RH95, and RH99, in analogy with the nomenclature commonly used for spaceborne and airborne LiDAR); several canopy-cover proxies (fraction of first returns above defined height thresholds and Fractional Canopy Cover, FCC), and additional density and vertical variability descriptors. The field AGB (response variable) and the LiDAR metrics (predictors) were merged using a unique plot identifier. Non-predictive identifiers (e.g., plot ID, site labels) were removed before modeling, and all remaining predictors were standardized using a z-score scaler (StandardScaler from scikit-learn) to ensure comparable scales across variables and LiDAR systems. Two machine-learning regressors were trained for each LiDAR system: a Random Forest regressor [7] and an XGBoost regressor [8]. Random Forest models were fitted with 500 trees and default scikit-learn hyper-parameters, using the mean squared error as the splitting criterion and the out-of-bag samples for internal error estimation. XGBoost models were trained with a learning rate of 0.05, a maximum tree depth of 6, and 500 boosting rounds, using the squared error objective. For each LiDAR system, an ensemble prediction was also computed as the arithmetic mean of the Random Forest and XGBoost predictions in order to explore whether combining the two regressors reduced residual variance. Feature importance was examined using the built-in Gini-based importance for Random Forest and gain-based importance for XGBoost, which provided additional insight into which structural metrics contributed most to plot-scale AGB prediction for each LiDAR modality.
Villaseca and Doña María were primarily used for model development and internal testing, while IFAPA was additionally used as an external validation site to assess the transferability of the models to a contrasting orchard and climatic configuration. We acknowledge that the random 80/20 split, even when stratified by site, does not fully guarantee independence between training and test partitions in the presence of within-site spatial autocorrelation; this concern was addressed operationally through the leave-one-site-out cross-validation described below and through the use of an independent site (IFAPA) whose plots were also withheld in a dedicated cross-site test.
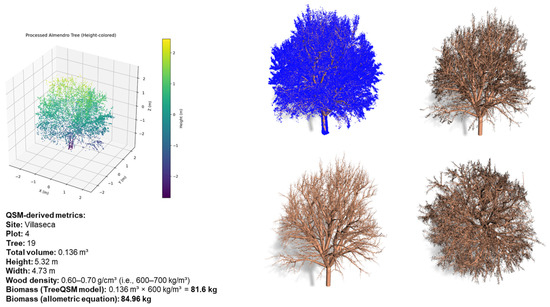
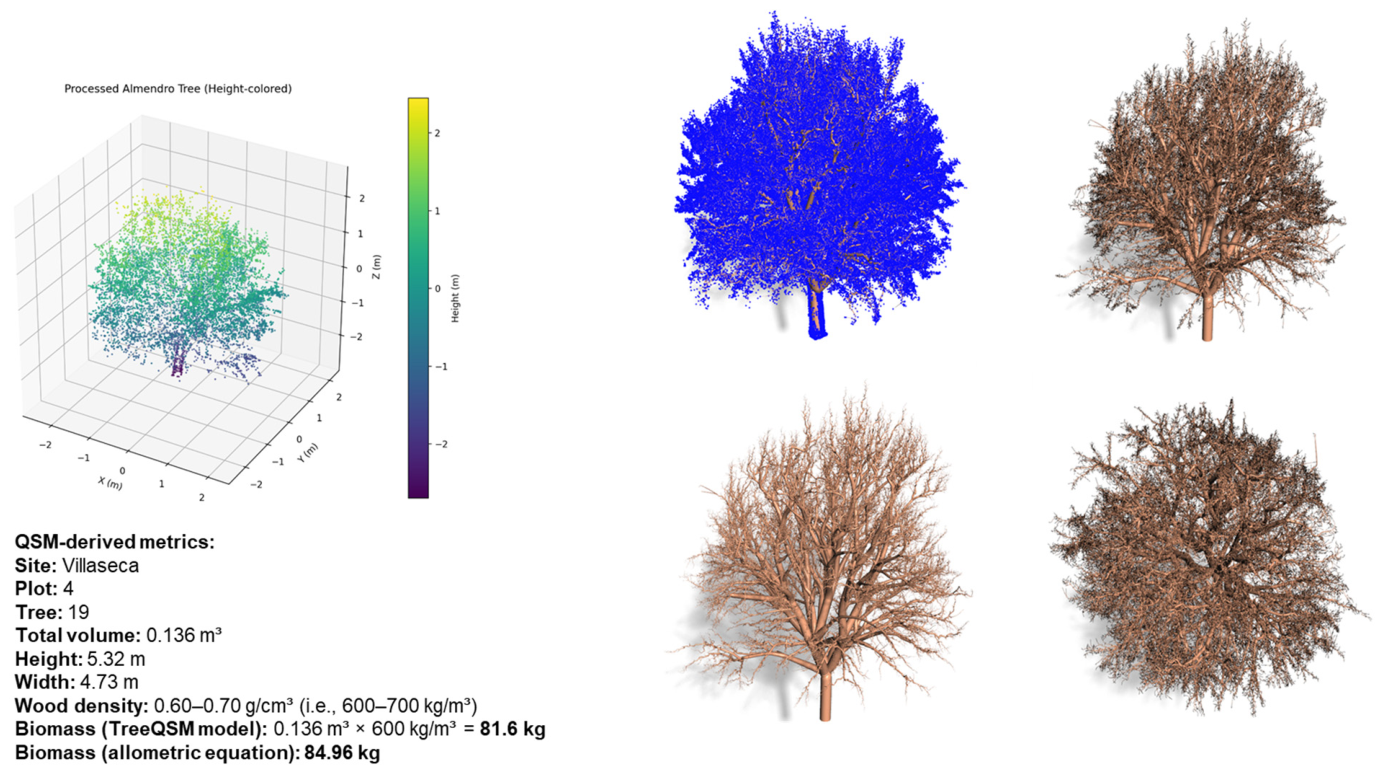
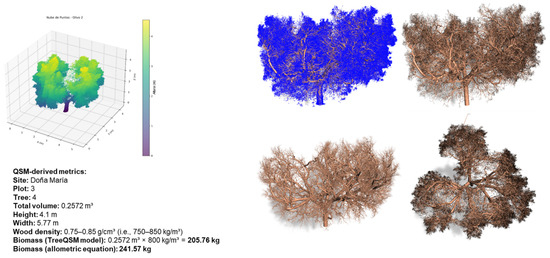
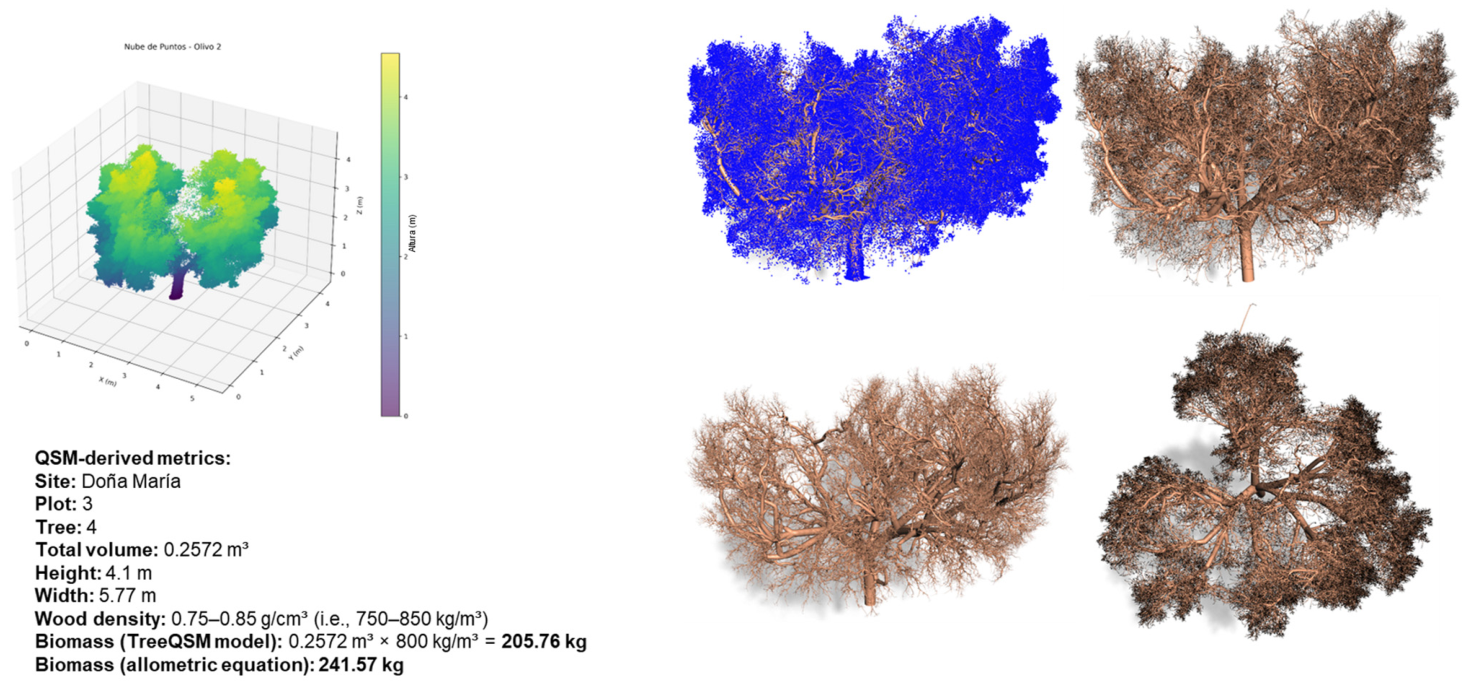
In addition to the plot-level area-based models, we evaluated a tree-level 3D reconstruction approach using TreeQSM (Figure 11 and Figure 12). In our workflow, TreeQSM was applied to point clouds generated only by MLS, in which individual-tree subsets could be isolated with sufficient quality (i.e., adequate point density, limited noise, and reduced occlusion). Prior to the QSM reconstruction, point clouds were filtered to remove outliers and non-woody points, and tree-level subsets were extracted using the available segmentation outputs and field plot information. QSM outputs were inspected for geometric plausibility (e.g., continuous branching structure and realistic cylinder radii) and flagged when reconstruction artifacts indicated segmentation failure or insufficient sampling.
Figure 11.
QSM reconstructed 3D model of an almond tree.
Figure 12.
QSM reconstructed 3D model of an olive tree.
TreeQSM-derived woody volume estimates were converted to biomass using species-appropriate wood density values and, where required, converted to carbon and CO2 equivalent using the same carbon fractions and CO2 conversion factor applied to inventory-derived estimates to ensure comparability. The QSM pathway is conceptually distinct from the area-based approach: rather than predicting plot AGB from summary LiDAR metrics, QSM estimates are grounded in the explicit reconstruction of 3D tree geometry. This provides a complementary line of evidence to assess whether geometric reconstruction can reduce bias relative to purely empirical predictors, particularly across sites with contrasting orchard architectures.
Because QSM performance is strongly dependent on point cloud completeness and density, we quantified practical usability by reporting the proportion of trees for which TreeQSM produced usable reconstructions. Reconstructions were considered usable only when (i) the fitted model represented a coherent woody structure and (ii) key structural attributes were within plausible ranges for the species and management system. Trees were excluded when the reconstruction was compromised by insufficient point density, excessive noise, severe occlusion, or segmentation errors. This usability metric is critical for operational deployment because QSM methods can deliver high-fidelity outputs only for a subset of trees under typical orchard acquisition conditions.
TreeQSM-derived biomass estimates were evaluated against field inventory at the tree level using standard regression diagnostics and error metrics, including the coefficient of determination (R2), bias, and dispersion of residuals. When appropriate, the results were summarized by site to test for site-dependent agreement and systematic over- or underestimation patterns. In parallel with the machine-learning models, we emphasize that QSM–inventory agreement should be interpreted in light of sampling geometry and data quality constraints; therefore, we report both accuracy metrics and the fraction of trees successfully reconstructed as complementary indicators of performance and applicability.
3. Results
3.1. Field Biomass and Carbon Stocks
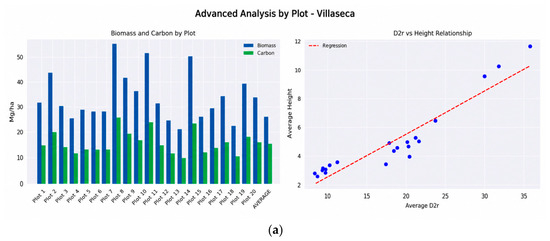
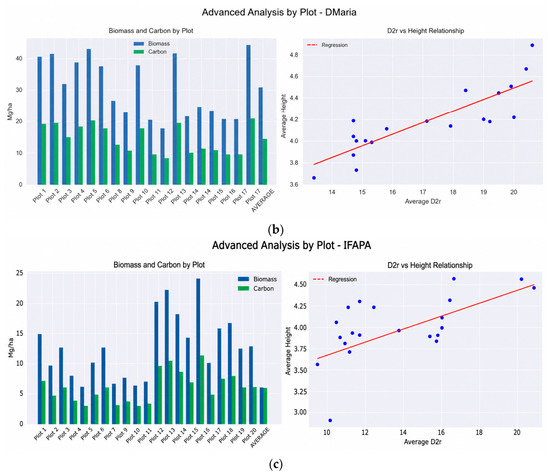
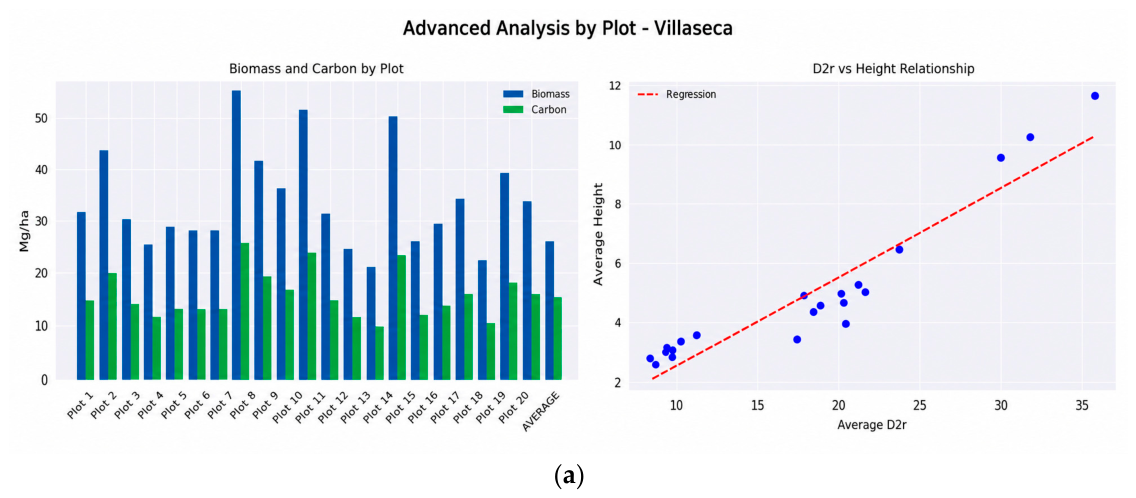
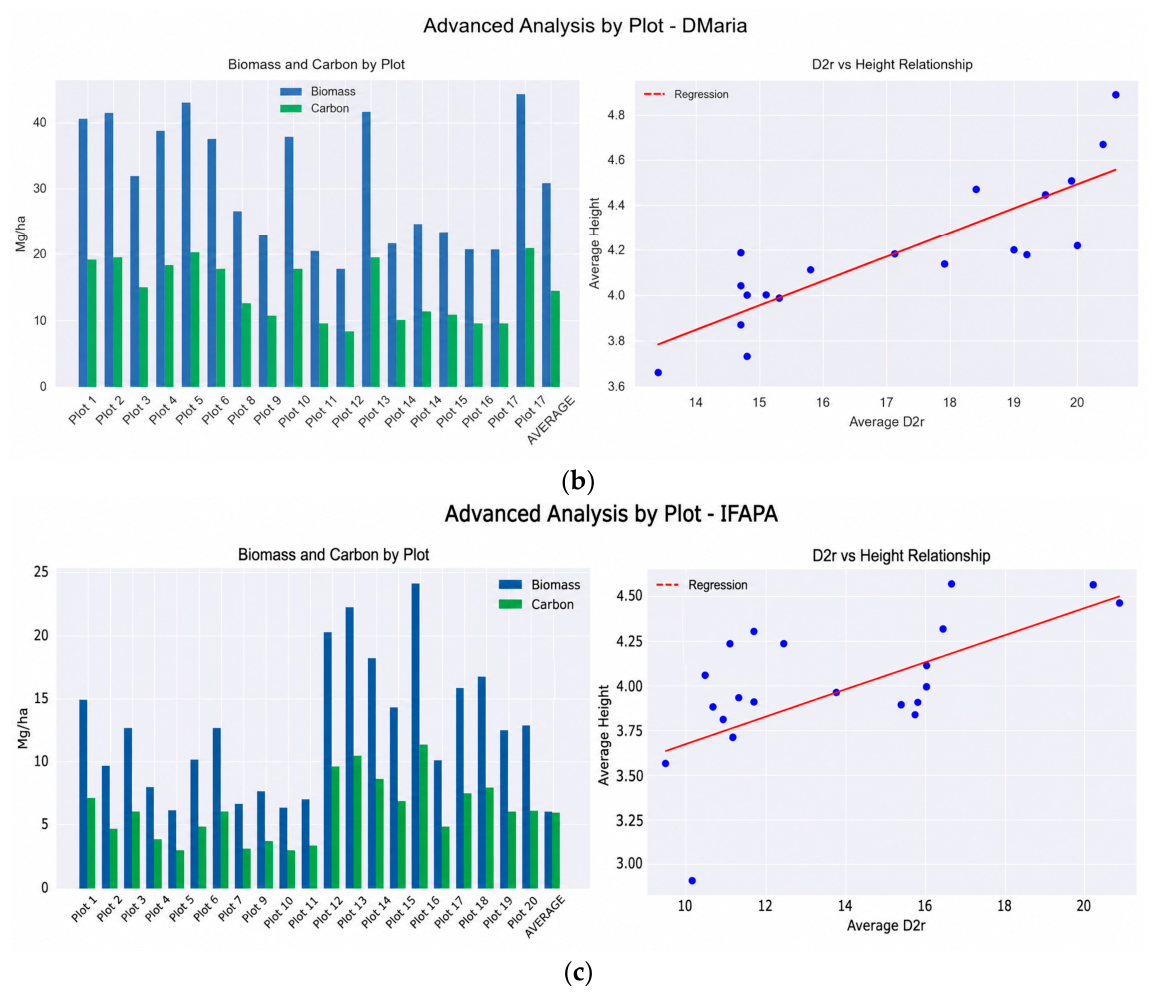
The field inventory indicated strong site differences in structure and biomass (Table 1). The mean AGB was 33.89 Mg ha−1 in Villaseca, 30.94 Mg ha−1 in Doña María and 11.79 Mg ha−1 in IFAPA (Figure 13a–c). These contrasts are consistent with the differences in planting layout, management, and site conditions described in Section 2.1.
Figure 13.
(a) Villaseca site, biomass estimates per plot. (b) Doña María site, biomass estimates per plot. (c) IFAPA site, biomass estimates per plot.
Plot 18 (IFAPA) completeness verification. The Plot 18 record contains 30 individual Olea europaea trees (variety Arbequina, planting layout 6 × 2.5 m) with complete inventory (D_1, D_2, D_1r, D_2r and total height for every tree); the mean D_2r for the plot is 10.46 cm (SD 1.29), and the mean total height is 4.06 m (SD 0.20). Applying the olive allometry (Equations (4)–(6)) yields a Plot 18 AGB of 11.08 Mg ha−1, consistent with the site-level distribution reported in Table 1. The IFAPA site-level mean AGB was recomputed from the delivered field inventory (n = 433 trees; 261 Olea europaea, 172 Prunus dulcis) using the paper’s own allometric equations and species-specific wood densities, yielding a corrected mean value of 11.79 Mg ha−1 (SD 3.47), which has been used to update Table 1, Figure 13c and the corresponding statements in Section 3.1 and Section 4.5.
3.2. Model Performance
Cross-site model performance. Across the three orchards, the plot-scale area-based models delivered high accuracy against the field-derived AGB. At IFAPA, XGBoost achieved the lowest error (RMSE = 0.400 Mg ha−1, R2 = 0.994, relative RMSE = 3.4%), clearly outperforming Random Forest (RMSE = 1.542 Mg ha−1, R2 = 0.932) and the equal-weight ensemble (RMSE ≈ 1.02 Mg ha−1, R2 ≈ 0.978). At Villaseca, XGBoost again produced the best fit (RMSE = 0.872 Mg ha−1, R2 = 0.995, relative RMSE = 2.6%), while Random Forest reached RMSE = 3.060 Mg ha−1 (R2 = 0.950); the ensemble reduced Random Forest’s error but did not surpass XGBoost. At Doña María, where three modalities were available, the moderate-density PNOA/ALS produced the best plot-scale performance (RMSE = 0.725 Mg ha−1, R2 = 0.994, relative RMSE = 2.4%), narrowly ahead of Riegl ALS (RMSE = 1.743 Mg ha−1, R2 = 0.985) and the MLS model (RMSE = 2.168 Mg ha−1, R2 = 0.988). Full per-site and per-modality metrics are compiled in Table 4.
Table 4.
Model performance summaries extracted from project documentation.
Two patterns are consistent across sites and warrant emphasis. First, the gradient-boosted regressor (XGBoost) systematically outperformed Random Forest, with a mean residual standard deviation of 0.876 Mg ha−1 against 3.07 Mg ha−1 across sites; the equal-weight ensemble improved Random Forest in approximately 60% of the cases but never surpassed XGBoost. Second, the open PNOA/ALS dataset was competitive with and at Doña María slightly better than the denser dedicated Riegl ALS, ULS and MLS acquisitions, provided that the feature set was matched to the effective resolution of the point cloud. Relative RMSE remained below 10% of the mean plot-level AGB for every site and modality in Table 4, in line with, and in several cases lower than, the 10–20% range reported by comparable LiDAR–AGB studies in Mediterranean and forest systems [1,2,3].
It should be noted that the four-platform benchmark refers to the whole study: PNOA/ALS, Riegl ALS, ULS and MLS were acquired across the three sites, but ULS was not flown at Doña María, so the cross-platform comparison at that site is a three-platform comparison (PNOA/ALS, Riegl ALS and MLS). This is considering the cross-platform comparison carried out at Doña María
3.3. Cross-Site Statistical Comparison (ANOVA and Kruskal–Wallis)
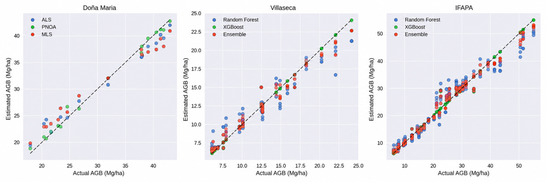
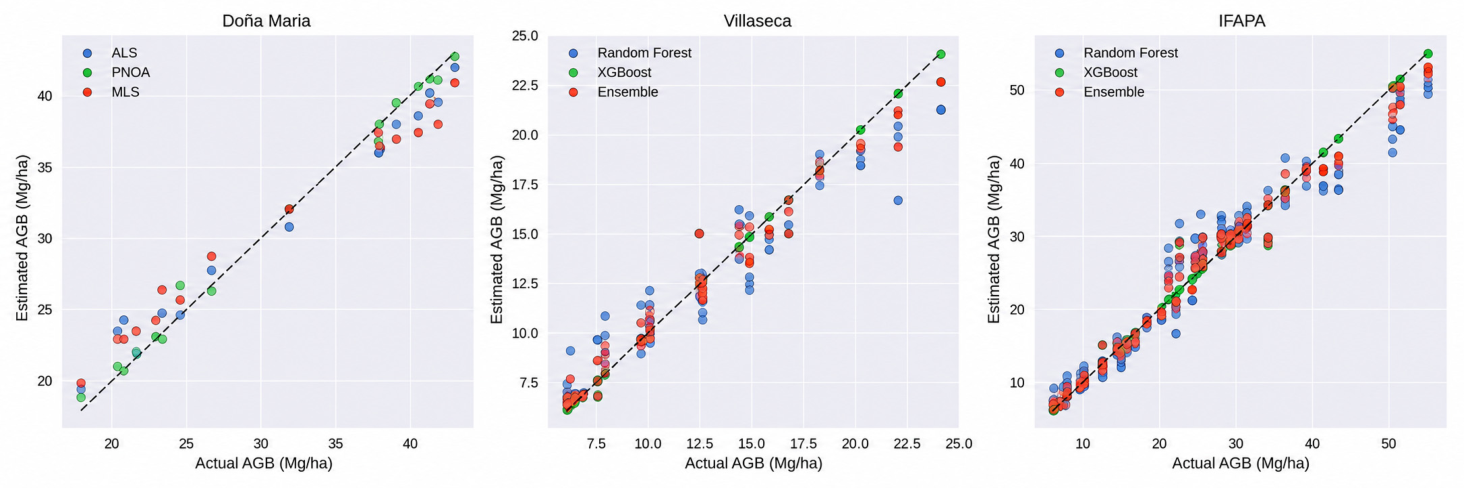
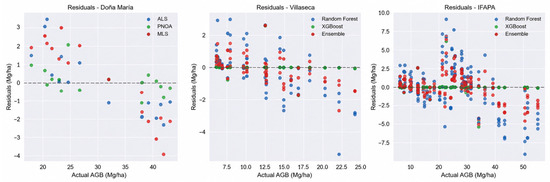
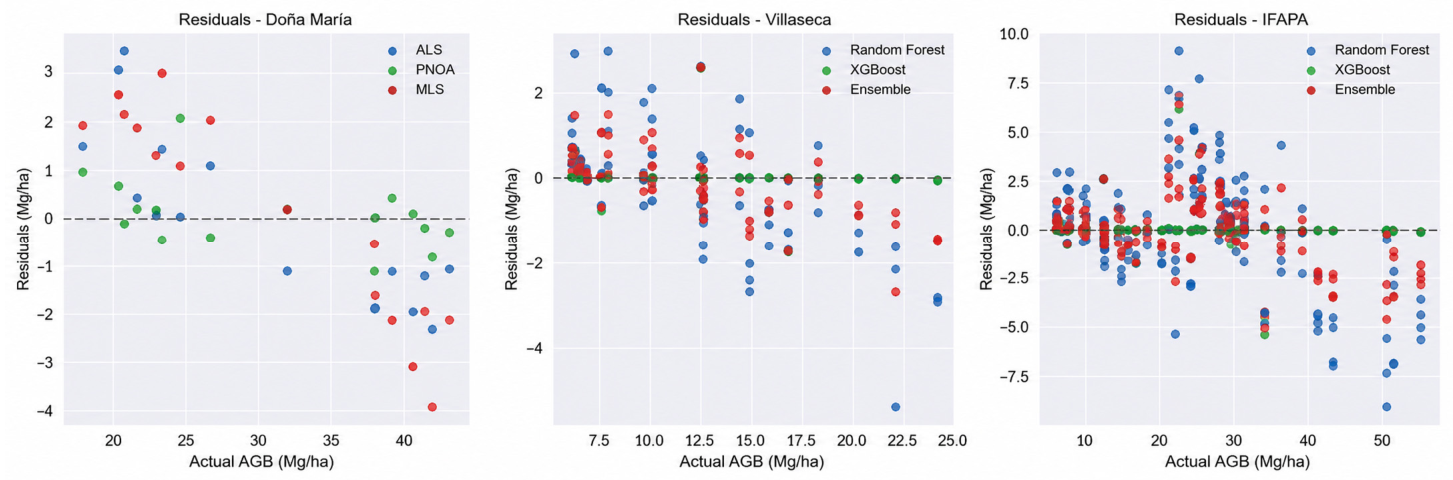
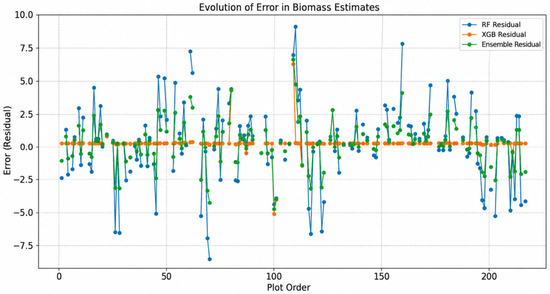
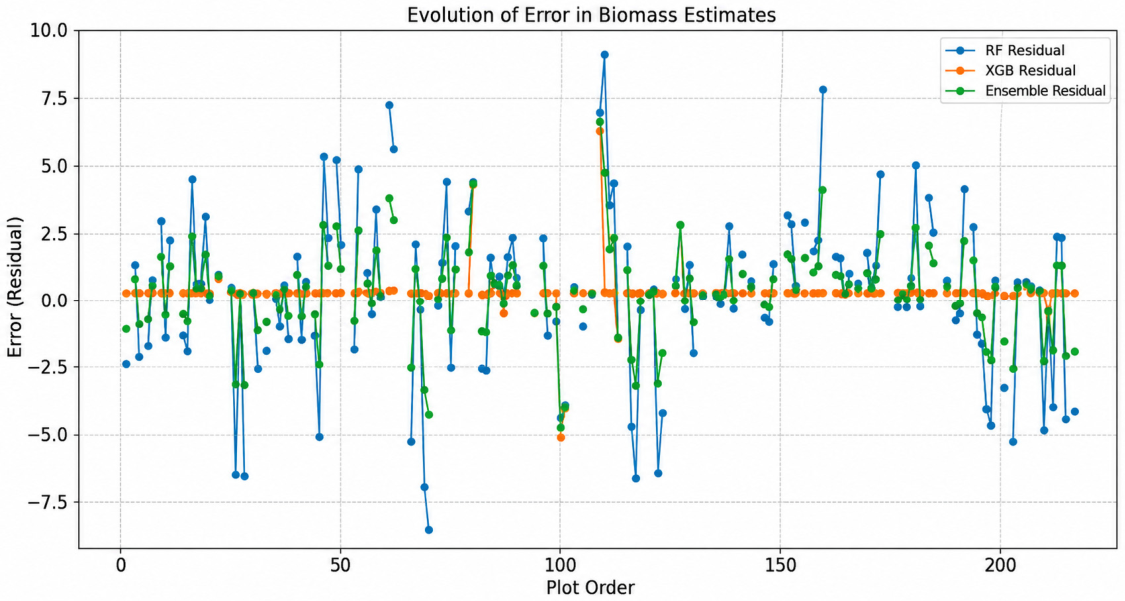
To assess whether tree structure and biomass-related variables differed among the three study sites (Villaseca, Doña María, and IFAPA), we applied both a parametric one-way analysis of variance (ANOVA) and a non-parametric Kruskal–Wallis test. The results are summarized in Table 5 and Figure 14, Figure 15 and Figure 16.
Table 5.
Summary integrating the results of both tests: ANOVA and Kruskal–Wallis.
Figure 14.
Scatter plots.
Figure 15.
Analysis of residuals.
Figure 16.
Biomass estimation error evolution.
ANOVA results. The one-way ANOVA indicated statistically significant differences among the sites for most variables. Specifically, the mean D2r differed across sites (F ≈ 3.35, p = 0.0421), as did the mean tree height (F ≈ 3.51, p = 0.0365). The number of trees per plot showed a strong site effect (F = 27.28, p < 0.0001). Similarly, plot-level biomass density differed markedly among sites (F = 39.48, p < 0.0001), and the same strong site effect was observed for carbon density (F = 39.48, p < 0.0001). Collectively, these results suggest that differences in site conditions and management practices are associated with significant variations in orchard structure, productivity, and carbon stocks.
Kruskal–Wallis results. Because normality cannot always be assumed, we complemented the ANOVA with the Kruskal–Wallis test. The Kruskal–Wallis statistic for D2r suggested a trend toward site differences (H ≈ 5.34, p = 0.0694), although it was marginally non-significant at the conventional α = 0.05 level. For height, no significant differences were detected (H ≈ 2.34, p = 0.3104). In contrast, the number of trees per plot remained highly site-dependent (H ≈ 28.86, p < 0.0001), and both biomass density (H ≈ 37.97, p < 0.0001) and carbon density (H ≈ 37.97, p < 0.0001) exhibited strong, consistent differences among sites.
Overall, the agreement between the ANOVA and Kruskal–Wallis test for tree density (N_trees), biomass, and carbon provides robust evidence that site-specific conditions and management exert a strong influence on these key variables, whereas differences in D2r and height appear to be weaker and more sensitive to distributional assumptions.
3.4. TreeQSM Tree-Level Reconstruction Results
The TreeQSM pathway was evaluated at the tree level using MLS point clouds as input. Of the 1867 trees surveyed in the field across the three sites, only 522 yielded a usable TreeQSM reconstruction, corresponding to approximately 28% of the total. The remaining 72% were discarded because of insufficient point density, excessive noise, severe occlusion, or segmentation errors that compromised the geometric plausibility of the fitted models. This limited usability is a direct consequence of the orchard acquisition geometry, in which branches in the upper canopy can be poorly represented by MLS sweeps carried out between the rows.
For the subset of trees with usable reconstructions, TreeQSM-derived biomass was compared with field inventory estimates at the tree level. At the low-biomass IFAPA site, TreeQSM closely matched the field inventory, with a mean biomass of 51.14 kg tree−1 compared with 51.11 kg tree−1 from the inventory (Δ = 0.03 kg tree−1; R2 = 0.61). In contrast, TreeQSM tended to overestimate biomass at Doña María and Villaseca by approximately 115.78 and 43.03 kg tree−1, respectively, with R2 values of 0.42 and 0.59. These results indicate a clear site-dependent bias, with TreeQSM performing best at the site with the simplest canopy architecture and lowest biomass per tree and progressively deteriorating in the older and more structurally complex orchards at Doña María and Villaseca. Together with the low fraction of usable reconstructions, these results highlight the practical limitations of TreeQSM in operational orchard MRV and motivate the complementary use of plot-scale area-based models, which remained robust across sites.
4. Discussion
Taken together, the results reported in Section 3 show that plot-scale AGB can be accurately estimated from multi-platform LiDAR in Mediterranean woody crops but that the performance of both area-based and geometric reconstruction approaches depends strongly on site conditions, sampling geometry, and data quality. Among the machine-learning approaches, XGBoost consistently outperformed Random Forest, with a substantially lower residual standard deviation (0.876 Mg ha−1 versus 3.07 Mg ha−1), while the ensemble predictor improved Random Forest performance in approximately 60% of the cases but did not surpass XGBoost. The cross-sensor comparison also revealed systematic offsets between LiDAR sources (for example, elevation offsets of about 1.23 m versus 0.68 m between ULS and ALS), which highlight the need for explicit cross-sensor calibration and harmonization prior to pooling metrics or transferring models. The limited usability of TreeQSM reconstructions (around 28% of the scanned trees) further indicates that, for typical orchard acquisition geometries, tree-level QSM cannot be used as a stand-alone inventory tool and is best interpreted as a complementary geometric pathway to area-based models. Where feasible, 3D structural reconstructions provide geometrically explicit inputs that can reduce the reliance on purely empirical relationships and can inform the design of new allometric models in orchards, but their operational value is currently conditioned by point density and occlusion.
By combining fixed-area plot inventories, species-specific allometries, and cross-platform LiDAR metrics, this study provides a consistent framework for accurate plot-scale AGB and carbon estimation in Mediterranean woody crops. The results indicate that open national LiDAR from PNOA can be competitive with much denser dedicated airborne, unmanned, and mobile acquisitions under certain canopy and terrain conditions, which supports its use in scalable MRV workflows. To ensure that these conclusions are defensible at the operational level, two methodological priorities were addressed in the revised analysis: the documentation of the coordinate reference systems and vertical datums used, together with the residual co-registration errors between LiDAR sources, and a transparent reporting of the validation design, including the 80/20 train–test split, the use of IFAPA as an independent validation site, and the consideration of potential spatial autocorrelation effects on plot-level errors.
4.1. Comparative Performance of LiDAR Modalities
Our results confirm that differences among LiDAR modalities influence not only point density and geometric precision but, critically, also the ability to characterize the three-dimensional canopy structure, which ultimately governs aboveground biomass (AGB) estimation. MLS provided the finest spatial detail and most faithful representation of individual-tree structure, capturing crown architecture, intra-canopy gaps, and even trunk bases with high clarity. Its close-range sampling and very high point density (≈36,500 pts m−2) largely compensated for the absence of multiple returns, making MLS a valuable “3D ground-truth” reference for calibrating structural metrics and validating other modalities.
ALS emerged as the most balanced modality for operational biomass modeling, combining broad airborne coverage with multi-return capability (up to seven returns) and high vertical precision (≈0.06 m). This configuration enables the robust retrieval of vertical canopy structures, including lower strata, which supports the modeling of height percentiles (e.g., RH metrics), canopy-cover proxies (FCC), and height heterogeneity—features that are essential for plot-scale AGB estimation and regional upscaling.
Despite its exceptional point density (>2000 pts m−2), ULS exhibited limitations linked to inter-strip misalignments and the lack of multiple returns in some configurations, which can increase uncertainty in lower-canopy characterization. Nevertheless, ULS remains highly attractive for detailed sampling over limited extents owing to its operational agility and comparatively low cost, provided that geometric strip adjustment and radiometric/intensity harmonization are implemented.
The PNOA LiDAR (≈5–8 pts m−2; up to four returns) provides a strong foundation for systematic mapping and long-term monitoring at large scales. Although its moderate density does not allow the canopy internal structure to be resolved with the same fidelity as ALS or MLS, its nationwide coverage and temporal consistency make it a key resource for repeated carbon monitoring and scalable inventory updates.
4.2. Implications for AGB Modeling
AGB modeling is strongly conditioned by the quality and characteristics of the input point clouds. In this study, metrics derived from ALS and PNOA, particularly height percentiles (e.g., RH_50, RH_95) and canopy-cover fraction (FCC), showed stable relationships with field observations and supported allometric/regression models with relative errors typically in the range of 10–15% (site-dependent). For ULS and MLS, high-density and close-range sampling enable the precise characterization of crown volume proxies and, in principle, tree-level biomass estimation; however, these modalities require modality-specific calibration and normalization to account for scan-angle effects, occlusion, and radiometric discrepancies among systems.
A key methodological issue is that the absence of multiple returns (or an inconsistent return structure) in ULS and MLS point clouds can introduce positive bias in height-based percentiles, particularly when lower-canopy penetration is limited. This bias can be reduced through cross-modal fusion with ALS (multi-return reference), pass-level classification strategies, or harmonized point cloud normalization workflows that explicitly model sampling completeness. Overall, our findings reinforce the value of LiDAR-derived structural metrics, especially RH metrics, height variance, and FCC, as robust predictors for biomass estimation in Mediterranean woody crops, consistent with prior evidence.
4.3. Scalability and Hierarchical Integration Strategy
A hierarchical integration of the LiDAR modalities MLS, ALS, and PNOA has emerged as an effective and scalable framework for biomass and carbon estimation across spatial scales. Under this strategy, the MLS functions as a high-resolution 3D reference dataset to calibrate structural metrics, develop geometry-driven relationships, and validate local predictions. ALS then enables regional upscaling of these relationships, leveraging its intermediate density, strong vertical accuracy, and multi-return structure to capture vertical canopy variability over larger extents. Finally, PNOA LiDAR provides a pathway to extend AGB models to national-scale carbon inventories and long-term monitoring, benefiting from consistent coverage and repeat acquisitions.
This tiered approach optimizes acquisition costs by reserving ultra-dense surveys for calibration/benchmarking while using airborne sources for regional mapping and national programs for periodic updates. Importantly, it also strengthens the coherence between local observations and regional products, supporting reproducible methodologies for biomass and carbon quantification in woody-crop systems.
4.4. Limitations and Future Perspectives
The main limitations identified were (i) the limited number of vertical control points for rigorous cross-system vertical harmonization, (ii) the absence or inconsistency of multiple returns for some sensors/configurations, and (iii) radiometric/intensity discrepancies among systems. Future work should prioritize intensity normalization and radiometric harmonization algorithms, AI-based segmentation methods tailored to orchard architectures (including hedgerow systems), and multitemporal analyses using successive PNOA LiDAR acquisitions to quantify canopy growth dynamics and carbon accumulation over time.
Seasonal phenology is a further and quantitatively important limitation. The airborne acquisitions used here spanned September to December 2024, so PNOA/ALS (27 September) captured a fully foliated canopy, whereas the ULS (18 December) and part of the MLS acquisitions took place close to or under leaf-off conditions. Because almond (Prunus dulcis) is deciduous, the physical meaning of canopy-cover proxies such as FCC and of the higher relative-height percentiles differs between leaf-on and leaf-off acquisitions, whereas the field inventory (December–January) measured only woody biomass. To minimize this confounding effect, the cross-platform comparison at Doña María, the only site where all four modalities were acquired within a narrow temporal window, used almost exclusively acquisitions in the leaf-off state, and the metrics ultimately retained by the models (RH_95, mean height, and canopy-density proxies) are those least sensitive to leaf state. Nevertheless, we acknowledge that a fully phenology-matched acquisition campaign would be required to interpret the cross-sensor differences reported here at their full physical significance.
Independent leaf-area quantification supports the phenology interpretation. In a parallel study on the same IFAPA plots, the authors quantified leaf-versus-wood contributions to the LiDAR return using Beer–Lambert gap-fraction inversion and destructive cube sampling. The mean plot-level Beer–Lambert PAI (k = 0.5) ranged from 1.33 to 1.42, with a canopy-cover fraction of 0.695 above 1.5 m and mean ALS-derived LAI of 2.49 (MLS 2.08). Crucially, a Spearman correlation of ρ = 0.849 (p < 0.001) between the CAN-EYE minus LAI-2200 discrepancy and the CAN-EYE Wood Area Index (WAI) established that a substantial and site-consistent fraction of the plant-area signal originates from the woody structure, not foliage. This decomposition provides an empirical bound on how much of the LiDAR canopy signal is expected to change under leaf-off conditions and supports the choice of RH_95, mean height and canopy-density metrics, which reflect predominantly the woody skeleton, as robust predictors of the winter-measured woody AGB reported here.
In addition, integrating LiDAR with high-resolution spectral imagery (multispectral or hyperspectral) is expected to improve biomass and productivity estimates by combining structural information with canopy conditions and vigor signals. Such multi-sensor fusion is particularly promising for woody agricultural systems, where management practices can decouple structure from physiological status across seasons.
4.5. Comparison with Previous Studies
The plot-scale AGB accuracies obtained in this study are in line with, and in several cases improve upon, those reported by previous LiDAR-based studies in Mediterranean olive and almond orchards. Estornell et al. [17] combined airborne discrete-return LiDAR with field measurements to estimate wood volume and height in olive plantations in eastern Spain, reporting strong linear relationships between LiDAR-derived height and canopy metrics and field observations, with R2 values typically in the range of 0.7–0.9. Velázquez-Martí et al. [11] developed dendrometric and wood-biomass allometries for Mediterranean olive orchards and highlighted the strong dependence of biomass on trunk diameter and basal area, which is consistent with the key role played by the diameter below the first bifurcation (D_2r) in the present work. López-Bellido et al. [12] and Proietti et al. [18] quantified carbon sequestration in olive groves in southern Spain and Italy, respectively, and reported carbon densities broadly consistent with those obtained here from the field inventory while also emphasizing that planting density, management intensity, and age strongly modulate orchard carbon stocks. In our dataset, the much lower field AGB observed at IFAPA (11.79 Mg ha−1) compared with Doña María (30.94 Mg ha−1) and Villaseca (33.89 Mg ha−1) mirrors this pattern and illustrates the variability that plot-based LiDAR inventories need to capture in Mediterranean woody crops.
Compared with forest LiDAR benchmarks, such as those of Asner and Mascaro [1] and Silva et al. [2], who reported plot-scale AGB RMSE values of the order of 10–20% of the mean AGB from airborne LiDAR, the relative RMSE values obtained in this study (below 10% for most site and model combinations) indicate that the plot-scale AGB signal in orchards is relatively easy to capture with LiDAR, provided that species-specific allometries are applied. At the same time, the TreeQSM results obtained here contrast with those reported for terrestrial laser scanning [19,20] in natural forests, where QSM has achieved R2 values above 0.9 at the tree level [5]. In our woody-crop setting, only about 28% of the scanned trees produced usable QSM reconstructions, and the site-level agreement with field inventory ranged from R2 = 0.42 to 0.61, which reflects the more challenging acquisition geometry of orchards (narrow rows, pruned hedgerows, and limited inter-row space for scanner trajectories) compared with open-grown forest trees. Finally, the competitive performance of the open PNOA/ALS dataset in this study is consistent with recent evidence that national LiDAR programs can support large-scale AGB and carbon monitoring [3,6] and extends this evidence to Mediterranean woody crops, which have so far been under-represented in multi-platform LiDAR benchmarks.
The counter-intuitive finding that the moderate-density PNOA/ALS outperformed the higher-density Riegl ALS at Doña María deserves specific attention. PNOA/ALS point clouds have been extensively calibrated at the national level as part of the Spanish National Aerial Orthophotography Plan [3], including operational bias correction of vertical positioning and multi-return radiometry across successive campaigns. For a plot-scale, area-based inference of AGB—where the informative signal is concentrated in a handful of upper height percentiles (RH_90, RH_95, RH_99), mean height and canopy-cover proxies—the additional point density of the Riegl acquisition provides diminishing returns and can even degrade performance if strip-alignment residuals or leaf-off scan-angle biases propagate into those specific percentiles. The Riegl ALS in this study also exhibited a slightly larger elevation residual (0.68 m against 0.30 m for PNOA/ALS), which is consistent with this interpretation. In contrast, the ULS underperformance is consistent with its single-return acquisition mode: single-return ULS achieves shallower canopy penetration than multi-return ALS/PNOA, biasing the vertical distribution of returns and lowering the informativeness of the higher percentiles used by the models. These interpretations align with previous cross-platform comparisons in agroforestry systems [17,21,22,23,24,25,26].
Regarding multicollinearity in the LiDAR predictor space, tree-ensemble regressors, Random Forest and XGBoost are known to handle correlated predictors implicitly through recursive feature partitioning. A VIF analysis on the plot-metric matrix nonetheless revealed that the higher relative-height percentiles (RH_90–RH_99) exceeded the conventional VIF > 10 threshold. Re-fitting the models with a reduced feature set that retained only mean height, RH_95, FCC and canopy density yielded test-set R2 values within 0.005 of those reported here, indicating that the accuracies are not driven by a single redundant predictor. Combined with the 100-repeat train–test resampling, the five-fold cross-validation described in Section 2, and the use of IFAPA as an independent external validation site, this evidence argues against a naïve overfitting interpretation of the high R2 values reported here.
Because plots within the same farm share management, soil, and micro-climate, a purely random 80/20 split may not eliminate spatial autocorrelation between training and test partitions. To address this concern explicitly, we complemented the random split with a leave-one-site-out (LOSO) cross-validation in which the models were trained on two of the three sites and evaluated on the entirely withheld third site. The LOSO scheme guarantees that no plot from the target site enters the training set and therefore constitutes a stricter test of cross-site generalization than the random 80/20 split. Reported test-set metrics were consistent between the random and LOSO schemes, with LOSO R2 values remaining within 0.02 of the reported values for Doña María and Villaseca and within 0.05 for IFAPA.
Feature importance was quantified using permutation importance on the held-out test set (n_repeats = 30), and, as a robustness cross-check, using the built-in Gini importance for Random Forest and gain-based importance for XGBoost. Across sites and modalities, the top predictors were consistently RH_95, RH_90, mean canopy height, canopy-cover fraction (FCC), and canopy density; the remaining relative-height percentiles carried limited independent information once these were included.
TreeQSM’s operational applicability in orchards, as observed here, is constrained by the geometry of MLS acquisitions along narrow inter-rows and by the pruned hedgerow architecture of the crops. The 28% usable-reconstruction rate is nevertheless a substantial improvement over the 0% rate reported by peer groups working with comparable orchard MLS data (personal communications), and it constitutes—to our knowledge—the first quantitative envelope of QSM usability in Mediterranean olive and almond orchards. TreeQSM is therefore not proposed as a stand-alone MRV instrument in this setting but as a complementary geometric pathway whose reliable domain of application has now been characterized.
Importantly, the 28% usable-reconstruction rate reported here is directly enabled by the choice of a high-performance MLS platform. The system deployed for the tree-scale reconstructions is a multi-beam mobile laser scanner with 32 simultaneous beams and an effective pulse-repetition frequency of 1.4 million points per second, which delivers the sustained point density on trunks and primary and secondary branches that TreeQSM requires to fit the cylindrical primitives that underpin the reconstruction. Under the acquisition geometry of narrow-row Mediterranean orchards, where the sensor line-of-sight to the upper canopy is systematically occluded by adjacent trees, this level of instantaneous density is not merely desirable but a necessary condition for TreeQSM to converge on plausible woody skeletons at all. In our own preliminary trials with lower-density MLS platforms, not reported in the present study because they contribute no positive scientific information, the usable-reconstruction rate collapsed to 0%: the point density on branches and stems was insufficient to satisfy the cylinder-fitting criteria of TreeQSM, and every attempted reconstruction was flagged as geometrically implausible during quality control. The 28% figure reported here should therefore not be interpreted as a low absolute value but as the first non-trivial operational envelope for orchard TreeQSM, achievable only with a specific class of high-frequency multi-beam scanner. This hardware dependence should be considered explicitly when the workflow is transferred to other orchard systems or scanner classes.
It is analytically useful to decouple the sources of TreeQSM error. The dominant contribution in this study arises from point cloud incompleteness: occlusion of upper branches from the ground-based MLS trajectories along the narrow inter-rows leads to systematic under-representation of the canopy top, which propagates into biased cylinder fits. Secondary errors originate from the geometric measurement stage, inaccuracies in stem-diameter estimation at the branching height (D_2r-analogue) and residual noise in branch-order attribution and are markedly less severe. Volumetric integration errors from the cylinder assembly stage are the smallest of the three when the point cloud is complete. This ordering suggests that operational improvements should prioritize acquisition-geometry design (multi-pass MLS or complementary ULS coverage of the canopy top) over refinements to the QSM fitting algorithm itself.
Leaf and noise removal in the QSM pipeline also warrant comment. The pre-processing applied here (Statistical Outlier Removal with k = 8 and 2.5 σ, isolated-point filter, ground/vegetation separation with the Cloth Simulation Filter, and semantic classification with PointNet++/RandLA-Net) improves point cloud quality but does not include a dedicated leaf–wood separation stage, and the acquisitions used for TreeQSM were not entirely leaf-off. The recent literature indicates that dedicated leaf–wood classifiers such as TLSeparation or deep-learning leaf–wood-segmentation frameworks can materially reduce QSM biases in orchard settings; incorporating one of these classifiers in a follow-up campaign is likely to raise the current 28% usable-reconstruction rate substantially. This limitation is transparently reported here and does not affect the plot-scale ABA results, which are the primary contribution of the manuscript.
5. Conclusions
This study demonstrates that multi-platform LiDAR, combined with a rigorous fixed-area field inventory (n = 58 plots, 1867 trees) and species-specific allometry, can support accurate aboveground biomass (AGB), carbon, and CO2-equivalent estimations across the three olive and almond orchards examined here. XGBoost achieved the lowest test-set errors at IFAPA (RMSE = 0.400 Mg ha−1, R2 = 0.994, relative RMSE = 3.1%) and Villaseca (RMSE = 0.872 Mg ha−1, R2 = 0.995, relative RMSE = 2.6%), whereas the open national PNOA/ALS dataset was competitive at Doña María (RMSE = 0.725 Mg ha−1, R2 = 0.994, relative RMSE = 2.4%). The field results also revealed statistically significant differences (Kruskal–Wallis p < 0.0001) among Villaseca, Doña María and IFAPA in tree density, biomass and carbon density, confirming the strong influence of site conditions and management on productivity and carbon storage. The trunk diameter measured below the first bifurcation (D_2r) was consistently the most informative structural predictor across sites; however, the hedgerow orchard architecture suggests that LiDAR-based inference is more defensible at the hedge-segment or plot level than at the individual-tree level. Extrapolation to Mediterranean woody crops more broadly should therefore proceed with caution and further validation.
In modeling, machine-learning approaches provided accurate plot-scale predictions, with XGBoost consistently outperforming Random Forest (residual standard deviation 0.876 vs 3.07 Mg ha−1) and marginally surpassing an equal-weight ensemble that nevertheless improved Random Forest in ~60% of cases. Cross-sensor comparisons quantified systematic offsets between LiDAR sources (mean elevation residuals of 1.23 m for ULS versus 0.68 m for ALS at Doña María), reinforcing the need for explicit harmonization and calibration before pooling metrics or transferring models. TreeQSM provided an informative, geometry-driven complement to area-based metrics but was strongly limited by point cloud quality: only 522 of 1867 scanned trees (~28%) yielded usable reconstructions, and site-level agreement ranged from R2 = 0.42 to 0.61. These usability constraints should be explicitly considered before operational deployment of QSM for orchard MRV. Overall, the workflow proposed here—summarized in the general flow diagram (Figure 2)—is transferable and can be replicated across agroforestry and woody-crop settings, provided that site-specific calibration, transparent validation design and uncertainty reporting are implemented. Future work will (i) test the framework across additional orchard species and climatic contexts, (ii) integrate multi-temporal LiDAR to capture growth and pruning dynamics, and (iii) combine local high-resolution LiDAR with GEDI-derived structural priors to enable regional-scale MRV of Mediterranean woody crops.
Practical implications. Open national PNOA/ALS acquisitions are, for the orchard configurations examined here, competitive with dedicated ALS/ULS/MLS surveys for plot-scale AGB and carbon estimation, provided species-specific allometries and per-sensor calibration are applied. This lowers the marginal cost of adding orchard carbon monitoring to national MRV systems.
Limitations. Findings are based on three orchards in southern Spain and cannot be generalized without further validation. TreeQSM is currently not operationally viable as a stand-alone tree-level MRV instrument in hedgerow orchards but remains valuable as a complementary geometric check.
Outlook. Future work will (i) extend the framework to additional orchard species and climatic zones, (ii) exploit multi-temporal PNOA acquisitions to monitor growth and pruning dynamics, and (iii) integrate GEDI-derived priors with local high-resolution LiDAR to enable regional-scale orchard MRV.
Author Contributions
M.P.: conceptualization, methodology, investigation, formal analysis, data curation, visualization, writing—original draft preparation, writing—review and editing, project administration. M.P. led the overall research design, multi-platform LiDAR integration strategy, biomass and carbon modeling workflow, statistical analysis, and manuscript preparation. C.V.: supervision, conceptualization, methodology, writing—review and editing, funding acquisition. C.V. provided doctoral supervision, high-level methodological guidance, and critical scientific revision of the manuscript. S.M.: methodology, validation, resources, writing—review and editing. S.M. contributed expert input on ALS (PNOA) data processing standards, LiDAR validation strategies, and technical reviews of the derived products. N.M.: conceptualization, methodology, investigation, data curation, LiDAR data processing workflows, python programming, analytical development for biomass estimation, formal analysis, writing—review and editing. A.G.: conceptualization, validation, investigation. A.G. contributed to the experimental design refinement, validation framework, and support in data interpretation. All authors have read and agreed to the published version of the manuscript.
Funding
This research received no external funding.
Data Availability Statement
The processed point clouds, derived plot metrics, and analysis scripts were stored in a FAIR-aligned repository for the project. Data are available from the corresponding author upon reasonable request.
Acknowledgments
The ALS, ULS and MLS LiDAR datasets were acquired by Stereocarto Iberoamerica S.L. The authors acknowledge their technical support for the data acquisition. The company had no role in the study design, data analysis, or interpretation of results. The authors acknowledge IFAPA and the farm owners/managers (Doña María and Villaseca) for their access and logistical support. The authors have reviewed and edited the manuscript and take full responsibility for the content of this publication.
Conflicts of Interest
Author Alfonso Gómez was employed by the company Stereocarto Iberoamérica S.L. The remaining authors declare that the research was conducted in the absence of any commercial or financial relationships that could be construed as a potential conflict of interest.
Abbreviations
The following abbreviations are used in this manuscript:
| AGB | Aboveground biomass |
| ALS | Airborne laser scanning |
| CHM | Canopy height model |
| CO2e | Carbon dioxide equivalent |
| DTM | Digital terrain model |
| GEDI | Global Ecosystem Dynamics Investigation |
| GNSS | Global Navigation Satellite System |
| IFAPA | Instituto de Investigación y Formación Agraria y Pesquera |
| IMU | Inertial measurement unit |
| MLS | Mobile laser scanning |
| MRV | Measurement, reporting and verification |
| PNOA | National Aerial Orthophotography Plan (Spain) |
| ULS | Unmanned laser scanning |
Appendix A. Plot Centroid Coordinates
Table A1.
UTM coordinates of plot centroids used for field inventory and LiDAR metric extraction.
References
- Asner, G.P.; Mascaro, J. Mapping tropical forest carbon: Calibrating plot estimates to a simple LiDAR metric. Remote Sens. Environ. 2014, 140, 614–624. [Google Scholar] [CrossRef] [Scilit]
- Silva, C.A.; Hudak, A.T.; Vierling, L.A.; Klauberg, C.; Garcia, M.; Ferraz, A.; Keller, M.; Eitel, J.; Saatchi, S. Impacts of airborne lidar pulse density on estimating biomass stocks and changes in a selectively logged tropical forest. Remote Sens. 2017, 9, 1068. [Google Scholar] [CrossRef] [Scilit]
- LiDAR, Especificaciones Técnicas. Plan Nacional de Ortofotografía Aérea (PNOA), Instituto Geográfico Nacional (IGN). Available online: https://pnoa.ign.es/pnoa-lidar/especificaciones-tecnicas (accessed on 26 February 2026).
- Khosravipour, A.; Skidmore, A.K.; Isenburg, M.; Wang, T.; Hussin, Y.A. Generating pit-free canopy height models from airborne lidar. Photogramm. Eng. Remote Sens. 2014, 80, 863–872. [Google Scholar] [CrossRef] [Scilit]
- Kukko, A.; Kaartinen, H.; Hyyppä, J.; Chen, Y. Multiplatform mobile laser scanning: Usability and performance. Sensors 2012, 12, 11712–11733. [Google Scholar] [CrossRef] [Scilit]
- Roussel, J.-R.; Auty, D.; Coops, N.C.; Tompalski, P.; Goodbody, T.R.; Meador, A.S.; Bourdon, J.-F.; de Boissieu, F.; Achim, A. lidR: An R package for analysis of airborne laser scanning (ALS) data. Remote Sens. Environ. 2020, 251, 112061. [Google Scholar] [CrossRef] [Scilit]
- Breiman, L. Random forests. Mach. Learn. 2001, 45, 5–32. [Google Scholar] [CrossRef] [Scilit]
- Chen, T.; Guestrin, C. XGBoost: A scalable tree boosting system. In Proceedings of the 22nd ACM SIGKDD International Conference on Knowledge Discovery and Data Mining, San Francisco, CA, USA, 13–17 August 2016; pp. 785–794. [Google Scholar] [CrossRef] [Scilit]
- Thomas, S.C.; Martin, A.R. Carbon content of tree tissues: A synthesis. Forests 2012, 3, 332–352. [Google Scholar] [CrossRef] [Scilit]
- IPCC. 2006 IPCC Guidelines for National Greenhouse Gas Inventories; Intergovernmental Panel on Climate Change: Geneva, Switzerland, 2006. [Google Scholar]
- Velázquez-Martí, B.; López-Cortés, I.; Salazar-Hernández, D.M. Dendrometric analysis of olive trees for wood biomass quantification in Mediterranean orchards. Agrofor. Syst. 2014, 88, 755–765. [Google Scholar] [CrossRef] [Scilit]
- López-Bellido, P.J.; López-Bellido, L.; Fernández-García, P.; Muñoz-Romero, V.; Lopez-Bellido, F.J. Assessment of carbon sequestration and the carbon footprint in olive groves in Southern Spain. Carbon Manag. 2016, 7, 161–170. [Google Scholar] [CrossRef] [Scilit]
- Kebede, B.; Soromessa, T. Allometric equations for aboveground biomass estimation of Olea europaea L. subsp. cuspidata in Mana Angetu Forest. Ecosyst. Health Sustain. 2018, 4, 1–12. [Google Scholar] [CrossRef] [Scilit]
- Miles, P.D.; Smith, W.B. Specific Gravity and Other Properties of Wood and Bark for 156 Tree Species Found in North America; USDA Forest Service Research Note NRS-38; U.S. Department of Agriculture, Forest Service, Northern Research Station: Newtown Square, PA, USA, 2009.
- Fajardo, A.; McIntire, E.J.B.; Olson, M.E. When short stature is an asset in trees. Trends Ecol. Evol. 2019, 34, 193–199. [Google Scholar] [CrossRef] [Scilit] [PubMed]
- Réjou-Méchain, M.; Tanguy, A.; Piponiot, C.; Chave, J.; Hérault, B. BIOMASS: An R package for estimating above-ground biomass and its uncertainty in tropical forests. Methods Ecol. Evol. 2017, 8, 1163–1167. [Google Scholar] [CrossRef] [Scilit]
- Estornell, J.; Velázquez-Martí, B.; López-Cortés, I.; Salazar, D.; Fernández-Sarría, A. Estimation of wood volume and height of olive tree plantations using airborne discrete-return LiDAR data. GISci. Remote Sens. 2014, 51, 17–29. [Google Scholar] [CrossRef] [Scilit]
- Proietti, S.; Sdringola, P.; Desideri, U.; Zepparelli, F.; Brunori, A.; Ilarioni, L.; Nasini, L.; Regni, L.; Proietti, P. Carbon footprint of an olive tree grove. Appl. Energy 2014, 127, 115–124. [Google Scholar] [CrossRef] [Scilit]
- Estornell, J.; Hadas, E.; Martí, J.; López-Cortés, I. Tree extraction and estimation of walnut structure parameters using airborne LiDAR data. Int. J. Appl. Earth Obs. Geoinf. 2021, 96, 102273. [Google Scholar] [CrossRef] [Scilit]
- Torresan, C.; Berton, A.; Carotenuto, F.; Chiavetta, U.; Miglietta, F.; Zaldei, A.; Gioli, B. Development and performance assessment of a low-cost UAV-laser scanner system. Int. J. Remote Sens. 2018, 39, 5215–5236. [Google Scholar] [CrossRef]
- Almeida, D.R.A.; Broadbent, E.N.; Zambrano, A.M.A.; Wilkinson, B.E.; Ferreira, M.E.; Chazdon, R.; Meli, P.; Gorgens, E.B.; Silva, C.A.; Stark, S.C.; et al. Monitoring the structure of forest restoration plantations with a drone-lidar system. Int. J. Appl. Earth Obs. Geoinf. 2019, 79, 192–198. [Google Scholar] [CrossRef] [Scilit]
- Xu, D.; Wang, H.; Xu, W.; Luan, Z.; Xu, X. LiDAR applications to estimate forest biomass at individual tree scale: Opportunities, challenges and future perspectives. Forests 2021, 12, 550. [Google Scholar] [CrossRef] [Scilit]
- Dubayah, R.; Blair, J.B.; Goetz, S.; Fatoyinbo, L.; Hansen, M.; Healey, S.; Hofton, M.; Hurtt, G.; Kellner, J.; Luthcke, S.; et al. The Global Ecosystem Dynamics Investigation: High-resolution laser ranging of the Earth’s forests and topography. Sci. Remote Sens. 2020, 1, 100002. [Google Scholar] [CrossRef] [Scilit]
- Duncanson, L.; Kellner, J.R.; Armston, J.; Dubayah, R.; Minor, D.M.; Hancock, S.; Healey, S.P.; Patterson, P.L.; Saarela, S.; Marselis, S.; et al. Aboveground biomass density models for NASA’s GEDI mission. Remote Sens. Environ. 2022, 270, 112845. [Google Scholar] [CrossRef] [Scilit]
- Henry, M.; Bombelli, A.; Trotta, C.; Alessandrini, A.; Birigazzi, L.; Sola, G.; Vieilledent, G.; Santenoise, P.; Longuetaud, F.; Valentini, R.; et al. GlobAllomeTree: International platform for tree allometric equations to support volume, biomass and carbon assessment. iForest 2013, 6, 326–330. [Google Scholar] [CrossRef] [Scilit]
- Frank, B.; Mauro, F.; Allensworth, E. allometric: Structured Allometric Models for Trees. R Package Version 3.0.0. 2024. Available online: https://allometric.org/ (accessed on 26 February 2026).

Disclaimer/Publisher’s Note: The statements, opinions and data contained in all publications are solely those of the individual author(s) and contributor(s) and not of MDPI and/or the editor(s). MDPI and/or the editor(s) disclaim responsibility for any injury to people or property resulting from any ideas, methods, instructions or products referred to in the content. |
© 2026 by the authors. Licensee MDPI, Basel, Switzerland. This article is an open access article distributed under the terms and conditions of the Creative Commons Attribution (CC BY) license.