


Highlights
What are the main findings?
- DBKNet was proposed for the joint extraction of photovoltaic power stations and impervious surfaces in arid regions.
- The dual-encoder structure and feature enhancement modules improved the recognition of regular photovoltaic arrays and fragmented impervious surfaces.
What are the implications of the main findings?
- The proposed method supports regional-scale monitoring of photovoltaic expansion and artificial surface changes using Landsat imagery.
- Joint extraction helps distinguish renewable-energy infrastructure from general impervious surfaces in arid regions.
Abstract
Photovoltaic power stations and impervious surfaces are difficult to distinguish from spectrally similar arid-region backgrounds, and their large differences in scale and spatial form further complicate joint extraction. This study proposes DBKNet, a dual-encoder semantic segmentation network for six-band Landsat imagery. ResNetV1c and BiFormer Tiny are used to capture local details and long-range context, respectively. ConvSwinMerge integrates the two feature streams, while a KAN-based decoder and D2T TransformerBlock improve multi-scale representation and contextual recovery. A three-class dataset containing background, impervious surfaces, and photovoltaic power stations was constructed from the 2025 Landsat composite of Ordos. DBKNet achieved an mIoU of 83.40%, an mDice of 90.26%, an overall pixel accuracy of 98.96%, and a Target-mIoU of 75.64% on the test set, outperforming six comparison models. Fixed-site evaluation on 64 independently interpreted image–label pairs from 2014, 2018, 2021, and 2025 produced a pooled mIoU of 76.82% and a Target-mIoU of 70.06% without retraining or threshold adjustment. The ablation results confirmed the contributions of the dual encoder, cross-branch fusion, decoder-side contextual enhancement, and KAN nonlinear mapping. The results demonstrate the potential of DBKNet for regional multi-year mapping, while the reduced accuracy for earlier imagery indicates remaining temporal-transfer limitations.
1. Introduction
In recent years, driven by the global energy transition and the continued implementation of China’s carbon peaking and carbon neutrality goals, solar photovoltaic power, as an important form of clean energy, has developed rapidly in arid and semi-arid regions of China [1,2]. Northwest arid regions such as Ordos have abundant solar radiation resources and relatively open land resources, making them important areas for the deployment of large-scale centralized photovoltaic power stations [3,4]. While photovoltaic power stations improve renewable energy supply capacity, they also change regional land-use patterns and affect land cover, the ecological environment, and landscape patterns [5]. As typical renewable energy infrastructure, photovoltaic power station development is usually accompanied by the construction of site roads, substations, operation and maintenance areas, and other supporting facilities. Changes in impervious surfaces can reflect the construction of transportation networks, urban expansion, mining–industrial development, and the intensity of human disturbance [6,7]. Therefore, the joint extraction of photovoltaic power stations and impervious surfaces can help characterize both the deployment of renewable energy facilities and the change process of construction land. It can provide spatial information support for renewable energy development monitoring, land-use change analysis, and ecological environmental impact assessment.
From the perspective of land-cover attributes and remote sensing recognition, photovoltaic power stations differ clearly from typical impervious surfaces. Although photovoltaic power stations are artificial land-cover objects, they are not equivalent to traditional impervious surfaces such as roads, buildings, hardened industrial areas, and mining–industrial sites. In remote sensing images, they usually appear as regular arrays, blocks, or patches with strong spatial continuity, mainly reflecting the spatial expansion of renewable energy infrastructure [8,9]. In contrast, impervious surfaces are more complex in type, including roads, settlements, industrial areas, and mining–industrial construction land [10]. They usually show fragmented shapes, large scale variations, and scattered distributions. In arid regions, they are also easily confused with bare soil, sandy land, and mining–industrial disturbed surfaces. If photovoltaic power stations are merged into the general impervious surface category, their independent spatial representation as renewable energy facilities may be weakened. If only photovoltaic power stations are extracted, it is difficult to capture the associated changes in roads, stations, and other construction land during their development. Treating photovoltaic power stations and impervious surfaces as two independent targets for joint extraction can distinguish different types of artificial land cover and help reveal the spatial relationship between renewable energy development and construction land expansion [11].
Remote sensing imagery has the advantages of wide spatial coverage, long temporal records, and objective and continuous data acquisition [12]. It is an important data source for spatial monitoring of photovoltaic power stations and impervious surfaces. Landsat imagery provides a long time span, broad coverage, and open access, which can support multi-year change analysis at the regional scale [13,14]. However, in arid regions, bare soil, sandy land, gravel surfaces, saline–alkali land, and mining–industrial disturbed surfaces often have spectral characteristics similar to those of impervious surfaces, leading to classification confusion [15]. The boundaries of photovoltaic power stations are also easily affected by bare soil, shadows, and disturbed backgrounds [16]. Meanwhile, impervious surfaces usually account for a small proportion of the landscape. Targets such as roads, village edges, and scattered mining–industrial land are small in scale and fragmented in shape, which can lead to omission errors and incomplete boundaries [17]. Therefore, the joint extraction of photovoltaic power stations and low-proportion impervious surfaces in complex arid environments remains challenging.
Existing studies on the extraction of photovoltaic power stations and impervious surfaces mainly include spectral index-based methods, threshold segmentation, traditional machine learning, and deep learning methods [18]. Spectral index-based and threshold segmentation methods are simple to implement and computationally efficient. They can be used for the preliminary identification of surface types such as photovoltaic arrays, built-up land, and bare land. However, in complex arid environments, their threshold stability is poor, and the results are easily affected by bare soil, shadows, saline–alkali land, and mining–industrial disturbed surfaces. Traditional machine-learning methods, such as random forests [19] and support vector machines [20], can integrate spectral, textural, and index-based features to improve classification performance. They have been widely used in impervious surface extraction and land-cover classification. However, their performance still depends on handcrafted feature design, and their generalization ability is limited across different regions, years, and complex background conditions [21]. Traditional methods are applicable to scenes with relatively simple backgrounds or distinct target features. However, they still struggle to meet the accuracy and automation requirements for the joint extraction of photovoltaic power stations and impervious surfaces in arid regions, where target morphology varies greatly, background interference is strong, and class proportions are highly imbalanced.
With the development of deep learning, semantic segmentation models have gradually become important tools for the fine-scale extraction of land-cover objects from remote sensing imagery [22,23]. The FCN proposed by Long et al. achieved end-to-end pixel-level classification and laid the foundation for semantic segmentation tasks [24]. U-Net, proposed by Ronneberger et al., improved the recovery of spatial details through an encoder–decoder architecture and skip connections [25]. Recent remote sensing semantic segmentation studies have further improved multi-scale representation and position-aware feature learning for complex land-cover objects. PSPNet, proposed by Zhao et al., used a pyramid pooling module to aggregate multi-scale contextual information and improved the recognition of targets at different scales [26]. The DeepLab series proposed by Chen et al. expanded the receptive field through atrous convolution and the ASPP module [27], and DeepLabV3+ further improved boundary recovery by incorporating a decoder structure [28]. In recent years, Transformer architectures have been introduced into visual tasks. The Vision Transformer proposed by Dosovitskiy et al. demonstrated the effectiveness of the self-attention mechanism in visual representation learning [29]. Window-based hierarchical Transformer designs further improved the efficiency of visual representation learning [30]. SegFormer, proposed by Xie et al., adopts a hierarchical Transformer encoder and a lightweight MLP decoder, showing strong performance in global context modeling and multi-scale feature representation [31]. Real-time semantic segmentation networks have also been developed to improve the balance between segmentation accuracy and computational efficiency [32]. These methods have promoted the transition of remote sensing semantic segmentation from traditional feature-based classification to end-to-end deep feature learning, and have provided an important technical basis for the automatic extraction of photovoltaic power stations and impervious surfaces [33,34].
Recent studies published in 2025–2026 have further explored frequency-domain enhancement, feature decoupling, and interactive feature fusion for remote sensing semantic segmentation. Li et al. proposed a frequency decoupling network that separately refines high- and low-frequency components to enhance structural details and semantic consistency [35]. Zhang et al. introduced a frequency-domain-guided Swin Transformer and a global–local feature integration strategy to jointly model frequency-domain, spatial-domain, local, and global information [36]. Zhong et al. developed a wavelet-based frequency attention network that explicitly decomposes feature maps into different frequency components and enhances spectral–spatial representation [37]. Zheng et al. designed a feature-decoupled pseudo-Siamese architecture for multispectral imagery, in which visible and infrared bands are processed separately before feature fusion [38]. In addition, Zhai et al. employed heterogeneous CNN–Transformer streams and cross-branch interactive fusion to improve global–local complementarity and reduce feature attenuation for small objects [39]. These studies indicate that frequency-aware representation, multispectral feature decoupling, and cross-branch fusion have become important directions for improving semantic segmentation under complex remote sensing backgrounds.
Although deep learning methods have greatly improved the accuracy of remote sensing object extraction, several challenges remain in the joint extraction of photovoltaic power stations and impervious surfaces in arid regions. CNN-based models are effective in capturing local textures and edge details, which is useful for identifying fragmented impervious surfaces such as roads, villages, and mining–industrial sites. However, they are less capable of modeling the global structure and long-range spatial dependencies of large, regular photovoltaic arrays. Transformer-based models provide stronger global context modeling, but they often fail to preserve fine boundary details for small-scale, linear, and fragmented targets. To address these limitations, this study proposes DBKNet, a dual-encoder BiFormer-KAN segmentation network for the joint extraction of photovoltaic power stations and impervious surfaces in arid regions. A three-class remote sensing semantic segmentation dataset is constructed using Landsat imagery from the Ordos region. Comparative experiments, ablation studies, and cross-year mapping are conducted to evaluate the effectiveness and robustness of the proposed method under complex arid-region backgrounds.
The main innovations of this study are as follows:
- DBKNet is proposed for the joint extraction of photovoltaic power stations and impervious surfaces in arid regions. The model adopts a ResNet-BiFormer dual-encoder structure, combining the local texture extraction ability of CNNs with the global contextual modeling ability of Transformers. This design addresses remote-sensing scenes in which regular photovoltaic arrays coexist with fragmented impervious surfaces.
- A network structure for dual-branch feature fusion and decoder-side contextual enhancement is designed. ConvSwinMerge is used to achieve cross-branch feature fusion between the ResNetV1c branch and the BiFormer Tiny branch. A KAN-based multi-scale decoding structure and a D2T TransformerBlock contextual enhancement module are further combined to improve the representation and discrimination of regular photovoltaic arrays, fragmented impervious surfaces, and complex arid backgrounds.
- Based on 30 m Landsat Collection 2 Level-2 imagery and manually interpreted data from Ordos, a three-class semantic segmentation dataset was constructed, including background, impervious surfaces, and photovoltaic power stations. Comparative experiments, ablation studies, fixed-site cross-temporal validation, and multi-year mapping were conducted to evaluate segmentation accuracy, module effectiveness, temporal transferability, and regional mapping performance.
2. Study Area and Dataset
2.1. Study Area
Ordos City, Inner Mongolia Autonomous Region, China, was selected as the study area. As shown in Figure 1, Ordos is located in the southwestern part of Inner Mongolia, with a geographical extent of approximately 107°E–112°E and 37°N–40°N. It includes Dongsheng District, Kangbashi District, Dalad Banner, Jungar Banner, Ejin Horo Banner, Uxin Banner, Hanggin Banner, Otog Banner, and Otog Front Banner. The study area lies in the arid and semi-arid transition zone of northern China. It has abundant solar energy resources and relatively open land resources, making it an important region for the construction of centralized photovoltaic power stations.
Figure 1.
Location and topographic setting of the study area. (a) Location of Ordos City in Inner Mongolia Autonomous Region; (b) administrative divisions and elevation distribution of Ordos City.
Ordos is also an important energy, mining, and industrial base in China, with intensive coal mining, mining–industrial development, road transportation, and urban construction activities. The terrain of Ordos is highly undulating, with elevations ranging from approximately 852 to 1938 m. Affected by arid and semi-arid climatic conditions and energy development activities, various land-cover types are interspersed across the region, including bare soil, sandy land, grassland, mining–industrial disturbed surfaces, urban construction land, and photovoltaic power stations. Photovoltaic power stations are mostly distributed in regular blocks or arrays, whereas impervious surfaces are mainly composed of roads, villages, buildings, and mining–industrial sites, showing more fragmented spatial patterns. As impervious surfaces account for a relatively small proportion of Ordos, background pixels dominate the imagery. This leads to obvious sample insufficiency and class imbalance for impervious surfaces, further increasing the difficulty of jointly extracting photovoltaic power stations and impervious surfaces.
2.2. Dataset Construction
In this study, Landsat Collection 2 Level-2 imagery of the Ordos region was obtained and processed through Google Earth Engine (GEE; Google LLC, Mountain View, CA, USA), available at https://developers.google.com/earth-engine (accessed on 5 January 2026). The Landsat satellite series provides long-term continuous observations, long temporal coverage, broad spatial coverage, and open access, offering a stable data source for regional-scale land-cover extraction and multi-year change analysis. The research objectives of this study include not only the spatial extraction of photovoltaic power stations and impervious surfaces, but also multi-year mapping and spatiotemporal change analysis for 2014, 2018, 2021, and 2025. Therefore, remote sensing data with good temporal continuity and regional coverage are required. Compared with some high-resolution imagery, Landsat imagery has a spatial resolution of 30 m, but it offers stable data availability, a complete historical archive, and relatively low computational cost. It is therefore suitable for the joint extraction of photovoltaic power stations and impervious surfaces at the city scale in Ordos.
The Landsat Collection 2 Level-2 surface-reflectance images were processed in GEE using a consistent workflow for 2014, 2018, 2021, and 2025. Cloud and cloud-shadow pixels were first removed using the quality-assurance information provided with the Landsat products [40]. The remaining valid observations within each target year were combined on a pixel-by-pixel basis using temporal median compositing to generate one annual image. Each annual composite was subsequently clipped to the Ordos administrative boundary. Six surface-reflectance bands, including blue, green, red, near-infrared, shortwave infrared 1, and shortwave infrared 2, were selected as model inputs. The visible bands describe basic spectral differences among land-cover types, whereas the near-infrared and shortwave infrared bands provide information related to vegetation, moisture, bare soil, building materials, and mining–industrial disturbed surfaces.
The main training, validation, and test samples were constructed from the 2025 six-band Landsat composite and its corresponding full-scene reference label. The original image had a size of 18,481 × 12,069 pixels. The reference label was produced through manual interpretation using ENVI 5.6 (NV5 Geospatial Solutions, Inc., Superior, CO, USA), based on Landsat true-color and false-color composites and supplemented by available higher-resolution imagery where necessary. Four pixel values were used: 0 for background, 1 for impervious surfaces, 2 for photovoltaic power stations, and 255 for invalid or uncertain pixels. Pixels assigned a value of 255 during interpretation were excluded from patch generation and accuracy assessment, and no 255-valued pixels were retained in the finalized samples.
The imagery for 2014, 2018, 2021, and 2025 was processed using the same six input bands and a consistent preprocessing workflow. This procedure improved the comparability of the annual images, although differences in sensor response, atmospheric conditions, surface conditions, and annual compositing may still affect spectral consistency among years.
Photovoltaic power stations were delineated according to the spatial footprint of connected and regularly arranged photovoltaic panel arrays. Roads, substations, operation and maintenance buildings, hardened yards, and other supporting facilities within or adjacent to photovoltaic sites were labeled as impervious surfaces rather than photovoltaic power stations. Roads, village buildings, compact settlements, hardened industrial land, and clearly artificial mining–industrial surfaces were assigned to the impervious-surface class. Exposed soil, spoil piles, excavation faces, unpaved construction areas, vegetation, water, sandy land, and other natural surfaces were treated as background. Mixed pixels were assigned to the visually dominant land-cover class; pixels for which a reliable class could not be determined were assigned a value of 255. The detailed annotation criteria are summarized in Table 1.
Table 1.
Annotation criteria for the reference labels.
Label quality control included a second-pass review of photovoltaic boundaries, linear roads, settlement edges, and mining–industrial areas. Uncertain regions were re-examined using multiple spectral composites and available higher-resolution reference imagery. The final raster labels were also checked for spatial alignment with the six-band Landsat imagery, topological continuity at target boundaries, and valid pixel values limited to 0, 1, 2, and 255.
Before target-constrained cropping, the 2025 full-scene reference map contained 221,929,328 background pixels, 743,570 impervious-surface pixels, and 374,291 photovoltaic pixels, accounting for 99.50%, 0.33%, and 0.17% of all labeled pixels, respectively. These proportions describe the original full-scene reference distribution before patch generation. Because pure-background patches were excluded, the generated patch subsets contained higher target-class proportions than the complete scene. However, the same sampling criteria were applied to the training, validation, and test sets, ensuring consistent sampling and class-definition criteria across the three subsets.
During dataset construction, the 2025 six-band Landsat image was spatially aligned with the corresponding manually interpreted reference map. Image–label pairs were generated using target-constrained random-window cropping, with a patch size of 256 × 256 pixels. The upper-left coordinates of the windows were randomly sampled rather than generated using a regular sliding grid; therefore, no fixed cropping stride was defined. Patches containing only background pixels were excluded, whereas patches containing at least one impervious-surface or photovoltaic pixel were retained.
The retained samples were allocated to mutually exclusive training and test sets containing 9000 and 1000 image–label pairs, respectively. An additional validation set containing 500 image–label pairs was constructed from separate spatial locations outside the original training and test sample pool. Spatial-overlap checking was performed to exclude patches sharing spatial coverage with another subset. The same patch size, annotation criteria, and target-screening rules were applied to all three subsets.
In addition to the 2025 training and test dataset, a fixed-site cross-temporal reference dataset was constructed for 2014, 2018, 2021, and 2025. Sixteen identical spatial locations were selected for each year, producing 64 image–label pairs with a size of 256 × 256 pixels. The reference labels were interpreted and reviewed separately for each year according to the corresponding imagery. This dataset was used only for final cross-temporal evaluation and was not involved in training, fine-tuning, checkpoint selection, or threshold adjustment.
The final dataset was constructed as a three-class remote sensing semantic segmentation dataset, including background, impervious surfaces, and photovoltaic power stations. Representative samples from the constructed dataset are presented in Figure 2. The samples were selected from the 2025 Landsat imagery and cover sparse impervious surfaces, dense impervious surfaces, mixed photovoltaic–impervious regions, and photovoltaic power stations. Each scene type contains three 256 × 256 pixel samples. The first row presents true-color images, the second row presents the manually interpreted reference labels, and the third row presents the labels overlaid on the images. Background, impervious surfaces, and photovoltaic power stations are shown in black, orange, and purple, respectively.
Figure 2.
Representative samples of the constructed dataset: (a) sparse impervious surfaces; (b) dense impervious surfaces; (c) mixed targets; and (d) photovoltaic power stations. Note: Background, impervious surfaces, and photovoltaic power stations are shown in black, orange, and purple, respectively.
The three subsets were constructed using the same preprocessing, annotation, and target-screening rules, ensuring consistent input definitions and class criteria. The test set was used for final quantitative evaluation, whereas the additional validation set and the fixed-site cross-temporal reference dataset provided complementary assessments under separate spatial and temporal conditions. The dataset-construction workflow is shown in Figure 3.
Figure 3.
Workflow for constructing the photovoltaic power station and impervious surface dataset in Ordos City. Note: The ellipsis in the semantic segmentation model icon denotes the omitted intermediate feature-processing layers. The complete architecture of the proposed model is presented in Figure 4.
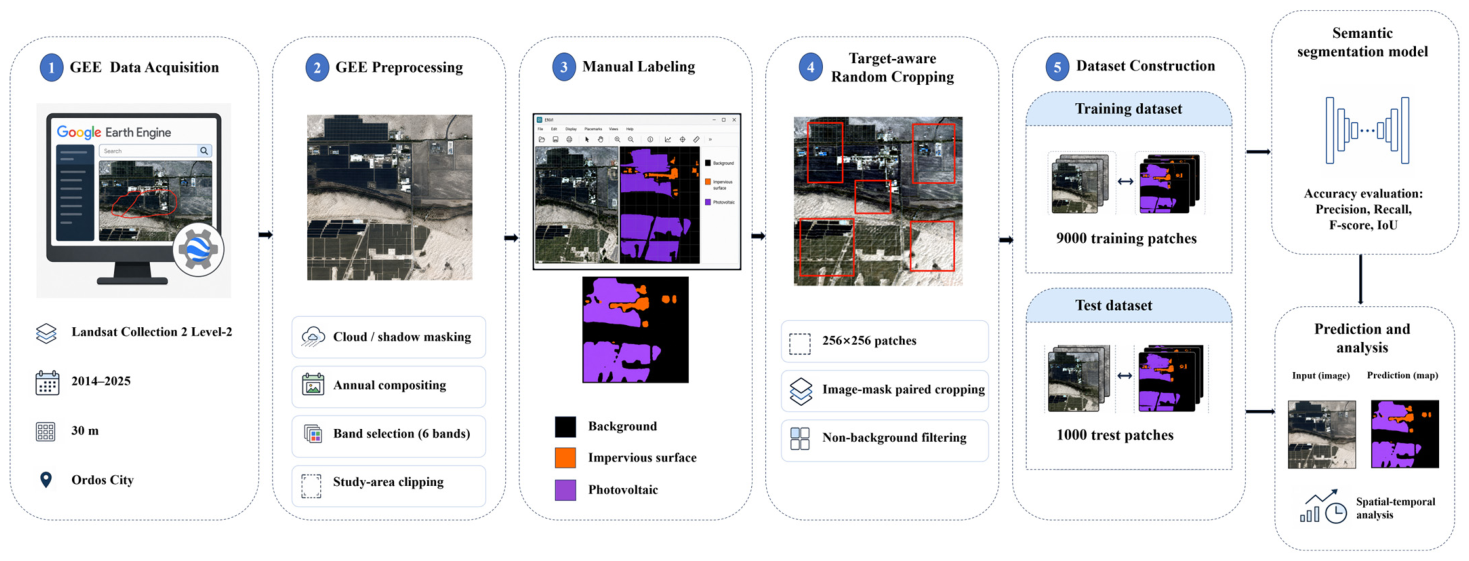
Figure 4.
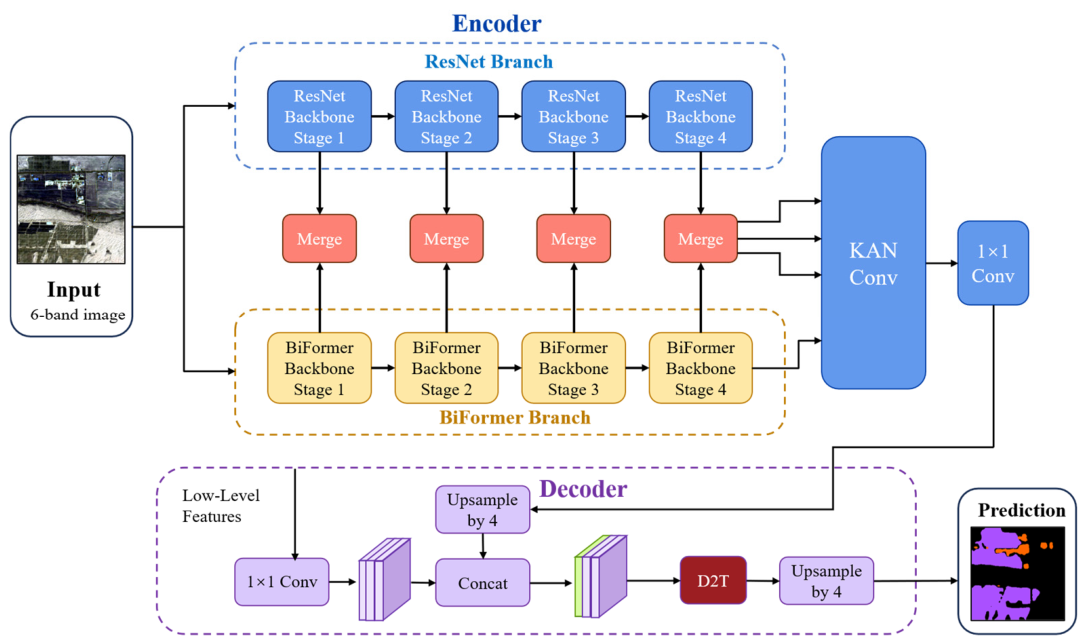
Overall architecture of DBKNet.
3. Method
3.1. Network Overview
To address the differences in spatial scale, morphological structure, and class distribution between photovoltaic power stations and impervious surfaces in arid and semi-arid regions, this study proposes DBKNet, a semantic segmentation network based on dual-branch encoding, cross-branch feature fusion, and decoder-side contextual enhancement. The overall model adopts an encoder–decoder architecture, as shown in Figure 4. The input data are six-band Landsat remote sensing images, and the output is a pixel-level classification map with three classes: background, impervious surfaces, and photovoltaic power stations.
The encoder of DBKNet consists of a ResNetV1c branch and a BiFormer Tiny branch. The ResNetV1c branch is mainly used to extract local textures and boundary details, such as roads, villages, mining–industrial construction land, and the edges of photovoltaic arrays. The BiFormer Tiny branch is mainly used to capture long-range spatial dependencies and global contextual information, which enhances the model’s ability to understand large regular photovoltaic arrays and spatial relationships in complex backgrounds. The two encoder branches output features at four scales, which are concatenated and fused at the same scale.
The decoder adopts a KANModuleDual structure. First, the concatenated dual-branch features are fused across branches using the ConvSwinMerge module. Then, high-level semantic features are aggregated and nonlinearly enhanced through image-level pooling, multi-scale convolution branches, and shared KAN mapping. Finally, the decoder integrates low-level spatial detail features and introduces the D2T TransformerBlock to enhance the contextual representation of the fused features. The three-class prediction result is then generated through a classification convolution. From the perspective of remote-sensing interpretation, the components of DBKNet correspond to the different spatial characteristics of the two target classes. The ResNetV1c branch retains local spectral, texture, and boundary information, which is important for roads, settlement edges, and fragmented mining–industrial surfaces. The BiFormer Tiny branch captures long-range spatial relationships and is suited to the regular and continuous layout of photovoltaic arrays. ConvSwinMerge combines the local and global features produced by the two branches and adjusts their channel responses. The KAN-based decoder improves nonlinear discrimination between artificial surfaces and spectrally similar arid backgrounds, while D2T supplements boundary details and spatial contextual information during decoding.
3.2. ResNet-BiFormer Dual-Branch Encoder
Photovoltaic power stations and impervious surfaces show distinct spatial characteristics in Landsat imagery. Photovoltaic power stations usually have regular arrangements, continuous block-like patterns, and relatively clear boundaries. Their identification requires strong regional structure modeling. Impervious surfaces mainly include roads, buildings, villages, and mining–industrial land. They are more scattered in spatial distribution and more fragmented in shape, and are more sensitive to local textures and edge details. A single convolutional encoder can effectively extract local textures and edge information, but it has limited ability to model long-range dependencies among large-scale targets. A single Transformer encoder can capture global context, but it may still be insufficient in representing fine boundaries and small-scale targets. Therefore, this study constructs a ResNetV1c-BiFormer Tiny dual-branch encoder to improve the joint representation of heterogeneous targets.
The ResNetV1c branch is based on a residual convolutional structure and extracts multi-scale local features through layered convolutions and residual connections [41]. This branch has strong responses to local information such as road edges, building outlines, village textures, and photovoltaic array boundaries. It helps reduce omission errors caused by the low proportion and fragmented morphology of impervious surfaces. The BiFormer Tiny branch introduces attention-based global feature interaction to capture long-range spatial dependencies [42]. For large-scale photovoltaic power stations, this branch compensates for the limited local receptive field of convolutional networks and enhances the model’s understanding of the overall structure and regional semantic relationships of photovoltaic arrays.
The global modeling ability of the BiFormer Tiny branch is derived from its attention mechanism. The core idea is to select candidate regions related to the current query at the regional level and then perform fine-grained token interaction within these candidate regions [42]. This process can be summarized as follows:
As shown in Equations (1) and (2), BiFormer Tiny achieves efficient global modeling through region selection and token interaction within candidate regions. In these equations, and denote the region-level query and key features, respectively; denotes the selected set of relevant regions; , , and denote the query, keys, and values within the relevant regions, respectively; and is the feature dimension. This mechanism can reduce interference from irrelevant regions while preserving the ability to model long-range dependencies. It helps improve the representation of large-scale photovoltaic arrays and their relationships with complex surface backgrounds.
3.3. ConvSwinMerge Module
The dual-branch encoder uses ResNetV1c and BiFormer Tiny to extract local texture features and global semantic features, respectively. The ResNetV1c branch shows strong responses to detailed information such as road edges, building outlines, and photovoltaic array boundaries, while the BiFormer Tiny branch can model spatial dependencies over a larger range. However, direct concatenation or simple channel compression using a conventional 1 × 1 convolution cannot fully promote information interaction between these two types of features. Therefore, this study designs a ConvSwinMerge cross-branch feature fusion module to perform directional attention enhancement, local convolutional fusion, and channel recalibration on dual-branch features at the same scale. Its structure is shown in Figure 5.
Figure 5.
ConvSwinMerge cross-branch feature fusion module.
Let and denote the output features of the ResNetV1c branch and the BiFormer Tiny branch at the scale, respectively. First, the two types of features are concatenated along the channel dimension to obtain the initial fused feature:
To enhance the directional structural representation of targets such as roads, building boundaries, and photovoltaic arrays, the module introduces a coordinate attention mechanism to strengthen the positional information of the concatenated features [43]. This process can be expressed as:
In Equations (3)–(5), denotes the channel concatenation operation, denotes the dual-branch fused input at the scale, denotes the coordinate attention mapping process, denotes the generated directional attention response, and denotes element-wise multiplication. Through the residual enhancement in Equation (5), the module can preserve the original dual-branch features while highlighting target-related directional positional information.
After obtaining the directional attention-enhanced features, a 3 × 3 convolution is used for local fusion and channel transformation:
In Equation (6), denotes the 3 × 3 convolution operation, and denotes batch normalization and ReLU activation. This step is used to further fuse the local texture features from the CNN branch and the global semantic features from the Transformer branch, thereby enhancing spatial interaction between cross-branch features.
To improve the channel discrimination ability of the fused features, SaELayer is introduced at the end of the module for channel recalibration of the convolutional features [44]. Specifically, a channel descriptor is first obtained through global average pooling, and then a channel mapping function is used to generate the weights:
Finally, the output of ConvSwinMerge is expressed as:
In Equations (7)–(9), denotes global average pooling, is the channel descriptor, denotes the channel weight generation process in SaELayer, denotes the channel weight, denotes channel-wise weighting, and is the cross-branch fused feature at the scale. Through this process, ConvSwinMerge performs local convolutional fusion and channel selection while preserving directional positional information. This enhances the representation of structured targets such as roads, village boundaries, and photovoltaic arrays, and suppresses responses from easily confused backgrounds such as bare soil, sandy land, and mining–industrial disturbed surfaces. As a result, more discriminative multi-scale fused features are provided for the decoder.
3.4. D2T TransformerBlock Context Enhancement Module
In the decoding stage, after low-level spatial detail features are fused with high-level semantic features, contextual representation still needs to be further enhanced. For the joint extraction of photovoltaic power stations and impervious surfaces, photovoltaic power stations are usually distributed as regular blocks or patches, whereas impervious surfaces are often represented by fragmented targets such as roads, village buildings, and mining–industrial land. Relying only on local convolution operations makes it difficult to fully model long-range spatial relationships, which may lead to discontinuous photovoltaic boundaries or omission of fragmented impervious surfaces. Therefore, inspired by the idea of a dual-domain Transformer, this study constructs a D2T TransformerBlock in the decoder to enhance the contextual representation of fused features. Its structure is shown in Figure 6.
Figure 6.
D2T TransformerBlock for decoder-side contextual enhancement. Note: The ellipses in the token-sequence icons indicate omitted intermediate tokens or feature elements.
The D2T TransformerBlock consists of wavelet-enhanced cross attention (WCA), prototype-guided cross attention (PCA), self-attention (SA), and a feed-forward network (FFN) [45]. WCA enhances edge and texture details from the frequency domain, while PCA aggregates representative semantic prototypes from the spatial domain. SA and FFN are used to update query features and enhance nonlinear representation. This design improves the decoder’s ability to distinguish photovoltaic arrays, linear impervious structures, and complex background features.
Let the decoder input feature be , and let the input query tokens be . Here, C, H, and W denote the number of channels, height, and width, respectively; N is the number of queries, and D is the token dimension. The D2T TransformerBlock enhances the query features in two domains through the WCA and PCA branches [45].
(1) The WCA branch is used to enhance frequency-domain detail information. After discrete wavelet transform, the input feature is decomposed into a low-frequency structural component and a high-frequency detail component:
The low-frequency component mainly describes the overall structure of the target, while the high-frequency component contains edge, texture, and local variation information. To reduce the interference of high-frequency noise in feature representation, a multi-scale channel modulation module is used to recalibrate the high-frequency component. The recalibrated high-frequency component and the low-frequency component are then combined to form the frequency-domain enhanced feature:
Based on the frequency-domain enhanced feature (), the WCA branch uses it as the key and value to perform cross-attention with the input query:
In Equations (10)–(12), denotes the discrete wavelet transform, denotes multi-scale channel modulation, denotes element-wise multiplication, denotes the cross-attention operation, and denotes normalization. Through frequency-domain decomposition and high-frequency recalibration, this branch strengthens the representation of detailed features such as photovoltaic boundaries, road edges, and building contours.
(2) The PCA branch is used to aggregate spatial semantic prototypes. The input feature is mapped by convolution and normalized by Softmax to obtain prototype assignment weights, which are then used to aggregate spatial tokens:
The semantic prototype feature P and the input query are jointly used to generate modulation weights, which enhance the response of the query to target-relevant regions:
In Equations (13) and (14), A denotes the prototype assignment weights, denotes the feature flattening operation, and denotes the semantic representation composed of K prototypes. Through prototype aggregation, the PCA branch compresses redundant background information, highlights discriminative regions related to photovoltaic power stations and impervious surfaces, and reduces the influence of similar backgrounds such as bare soil, sandy land, and mining–industrial disturbed surfaces.
(3) The query features after dual-domain enhancement are jointly formed by the WCA and PCA branches:
On this basis, self-attention and a feed-forward network are introduced to update the query features with contextual information:
In Equations (15)–(17), denotes the self-attention operation, and denotes the feed-forward network. This process enhances contextual interaction and nonlinear representation within the query features.
The updated query tokens are restored to a spatial feature map and then fused with the input feature through a residual connection:
In Equation (18), denotes the operation that restores the token sequence to a spatial feature map, and denotes the context-enhanced output feature. Through frequency-domain detail enhancement and spatial prototype guidance, D2T TransformerBlock enables the decoder features to capture both boundary details and global semantic aggregation. This helps alleviate problems such as incomplete photovoltaic power station boundaries, discontinuous road-like impervious surfaces, and misclassification under complex background conditions.
3.5. Decoder Structure and Loss Function
3.5.1. Decoder Structure
After dual-branch encoding, cross-branch fusion, and decoder-side contextual enhancement, the model generates the final semantic segmentation result through the decoder. The decoder takes four-level dual-branch features as input and performs cross-branch fusion, multi-scale context aggregation, and shallow detail supplementation at different scales. For the dual-branch feature at the scale, ConvSwinMerge is used for channel adjustment and attention enhancement. Its output can be expressed as:
In Equation (19), denotes the concatenated dual-branch feature at the scale, denotes the ConvSwinMerge fusion operation, and is the fused feature at the corresponding scale. Through cross-branch fusion, the decoder can simultaneously use the local texture details from the ResNetV1c branch and the global semantic information from the BiFormer Tiny branch.
To further aggregate high-level semantic information and enhance nonlinear representation ability, KANModule is introduced into the main decoding branch in this study [46]. Its structure is shown in Figure 7.
Figure 7.
Multi-scale context aggregation structure of KANModule.
KANModule takes the highest-level fused feature as input and extracts global semantic information and multi-scale contextual information through image-level pooling and convolution branches with different dilation rates. This process can be expressed as:
In Equation (20), G denotes the global semantic feature obtained by image-level pooling, denotes the contextual feature extracted by convolution branches with different dilation rates, and is the dilation rate. The multi-scale branches enhance the decoder’s representation ability for targets at different scales, making them suitable for handling the differences in spatial morphology and scale between photovoltaic power stations and impervious surfaces.
After concatenation, the features from different branches are fused by a 3 × 3 convolution. KAN mapping and depthwise convolution are then used to enhance nonlinear representation:
In Equations (21) and (22), denotes the channel concatenation operation, denotes the 3 × 3 convolution, denotes the shared nonlinear mapping, and denotes depthwise convolution. The residual connection preserves the original high-level semantic information while enhancing the nonlinear representation ability of the features.
Based on the enhanced high-level semantic features, the decoder introduces the shallow fused feature to supplement spatial details. After channel compression by a 1 × 1 convolution, the shallow feature is fused with the upsampled high-level feature to enhance detailed information such as road-like impervious surfaces, building edges, and photovoltaic array boundaries. When the D2T TransformerBlock is enabled, the fused feature is further enhanced with contextual information, enabling the decoder to capture both local boundary details and global semantic aggregation. The above process can be summarized as:
In Equation (23), is used to adjust the number of channels of the shallow feature, denotes the upsampling operation, denotes the decoder-side contextual enhancement module, and denotes the enhanced decoder feature. This process integrates shallow spatial details, high-level semantic information, and D2T-based contextual enhancement into the generation of decoder features. It avoids boundary discontinuity and omission of small targets caused by relying only on local convolution.
The classification head uses a 1 × 1 convolution to generate the three-class prediction result:
In Equation (24), P denotes the pixel-level prediction output of the model, 3 corresponds to the three classes of background, impervious surfaces, and photovoltaic power stations, B denotes the batch size, and H and W denote the height and width of the output prediction map, respectively. KANModule provides multi-scale context aggregation and nonlinear feature transformation within the decoder. Together with the ResNet–BiFormer dual encoder, ConvSwinMerge, and D2T TransformerBlock, it constitutes the complete DBKNet architecture.
3.5.2. Loss Function
Model training uses a combined loss function consisting of cross-entropy loss, Lovasz loss [47], and Dice loss [48]:
In Equation (25), is used to constrain the pixel-level classification results, is used to optimize the region overlap performance related to IoU, and is used to alleviate class imbalance and enhance the learning ability for small target regions. Class imbalance is a common issue in dense prediction tasks, and the combined loss function helps improve the learning of small and difficult target regions. The same combined objective and loss weights were used for all comparative and ablation experiments, allowing the effects of architectural differences to be evaluated under a consistent optimization setting.
4. Experiments and Results
4.1. Experimental Setup
4.1.1. Implementation Details
The experiments were conducted on a Dell Precision 7920 Tower workstation (Dell Technologies Inc., Round Rock, TX, USA) equipped with an NVIDIA GeForce RTX 3090 GPU (NVIDIA Corporation, Santa Clara, CA, USA). The software environment comprised Python 3.8.20, PyTorch 1.10.0+cu113, TorchVision 0.11.1+cu113, CUDA Runtime 11.3, CUDA Toolkit 11.7, cuDNN 8.2, OpenCV 4.10.0, MMCV 1.7.0, and MMSegmentation 0.29.1+. All models used six-band inputs of 256 × 256 pixels and produced three-class segmentation results.
AdamW was used as the optimizer, with an initial learning rate of 5 × 10⁻⁴ and a weight decay of 0.01. The learning rate followed the Poly schedule with a linear warm-up of 1500 iterations. Random horizontal flipping, vertical flipping, and 90° rotation were used for data augmentation. All models were trained for a predetermined 10,000 iterations. The fixed checkpoints obtained at 10,000 iterations were used for the quantitative results reported in Table 2, Table 3, Table 4 and Table 5. Test-set metrics recorded at 2000-iteration intervals were retained only to characterize training dynamics and were not used for checkpoint selection.
Table 2.
Class-wise evaluation results of DBKNet.
Table 3.
Comparison of DBKNet and mainstream semantic segmentation models.
Table 4.
Main-module ablation results of DBKNet.
Table 5.
Internal-component ablation results of DBKNet.
The additional validation set was used only to assess the convergence behavior of DBKNet. Figure 8 presents the training loss and the validation loss evaluated at 2000-iteration intervals using the combined objective defined in Equation (25). The training loss decreased rapidly during the early stage and then declined more gradually. The validation loss followed the same overall trend as the training loss and remained close to the smoothed training curve at the recorded evaluation points. No pronounced divergence was observed during the 10,000-iteration training schedule, indicating stable convergence on the additional validation set.
Figure 8.
Training and validation loss curves of DBKNet.
4.1.2. Comparative Methods
Six representative segmentation models were used for comparison. FCN-ResNet18 served as a conventional convolutional baseline [24], while U-Net represented skip-connected encoder–decoder architectures [25]. PSPNet and DeepLabV3+ represented multi-scale context aggregation based on pyramid pooling and atrous spatial pyramid pooling, respectively [26,28]. SegFormer provided a hierarchical Transformer-based baseline [31], and PIDNet represented a real-time architecture that jointly models contextual semantics and boundary information [32]. All models were evaluated using the same data split, input configuration, training schedule, and loss function.
4.1.3. Evaluation Metrics
Overall pixel accuracy (aAcc), mean intersection over union (mIoU), mean Dice coefficient (mDice), mean F-score, precision, and recall were used to evaluate segmentation performance. Among these metrics, aAcc measures the overall classification accuracy of all pixels, while IoU and Dice evaluate the degree of overlap between the predicted regions and the ground-truth regions. Precision and Recall reflect the accuracy of the prediction results and the ability to detect target regions, respectively. For the c-th class, Precision, Recall, IoU, and Dice can be expressed as:
In Equations (26)–(29), , , and denote the numbers of true positive, false positive, and false negative pixels for the class, respectively. For the multi-class semantic segmentation task, this study uses the arithmetic mean of the metrics across all classes as the overall evaluation result. The general form is:
In Equation (30), can represent Precision, Recall, IoU, Dice, or F-score for the class, corresponding to mPrecision, mRecall, mIoU, mDice, and mean F-score, respectively. C denotes the number of classes. For the three-class classification task in this study, including background, impervious surfaces, and photovoltaic power stations, C = 3.
Overall pixel accuracy, aAcc, represents the proportion of correctly classified pixels among all pixels across all classes. It is calculated as:
In addition to the overall evaluation metrics, this study also reports the IoU and Dice values for impervious surfaces and photovoltaic power stations to further analyze the model’s extraction ability for low-proportion impervious surfaces and regular photovoltaic arrays.
To reduce the influence of the dominant background class, Target-mIoU was defined as the mean IoU of the impervious-surface and photovoltaic classes. This metric was reported for the test-set evaluation, comparative experiments, ablation experiments, and cross-temporal validation. For the annual cross-temporal evaluation, the metrics were calculated from the pooled confusion matrix of the 16 samples in each year, whereas the Overall metrics were calculated from all 64 samples.
4.2. Experimental Results
4.2.1. Test Set Results of DBKNet
To evaluate the segmentation performance of the proposed model in the joint extraction of photovoltaic power stations and impervious surfaces, DBKNet was quantitatively assessed on the test set. After 10,000 training iterations, the model was evaluated, and the class-wise and overall evaluation results are shown in Table 2.
In terms of class-wise results, the IoU and F-score of the photovoltaic power station class reached 86.87% and 92.98%, respectively. This indicates that the model has a strong ability to extract regular and spatially continuous photovoltaic arrays. In contrast, the IoU of the impervious surface class was 64.40%, which was lower than that of the photovoltaic power station class. This suggests that roads, village buildings, and mining–industrial land remain the main challenges in this task due to their fragmented spatial patterns, small scales, and spectral confusion with bare soil backgrounds.
DBKNet maintained high recognition accuracy for photovoltaic power stations while improving the extraction of low-proportion and fragmented impervious surfaces. As shown in Table 2, DBKNet achieved aAcc, mIoU, and mDice values of 98.96%, 83.40%, and 90.26%, respectively. Because mIoU averages the background and the two target classes, the high background IoU of 98.93% does not directly characterize extraction performance for photovoltaic power stations and impervious surfaces. Target-mIoU was therefore reported separately and reached 75.64%, based on IS IoU and PV IoU values of 64.40% and 86.87%, respectively.
4.2.2. Comparative Experiments with Mainstream Semantic Segmentation Models
To verify the effectiveness of DBKNet, this study selected FCN-ResNet18, U-Net, PSPNet, DeepLabV3+, SegFormer, and PIDNet as comparative models. These models represent classic fully convolutional networks, encoder–decoder architectures, multi-scale context modeling methods, Transformer-based segmentation models, and lightweight real-time segmentation networks, respectively. All models used the same data split, input size, class setting, number of training iterations, and evaluation protocol. Table 3 reports the test-set performance of the fixed final checkpoint obtained at 10,000 iterations for every model.
Using the fixed checkpoints obtained at 10,000 iterations, DBKNet achieved a Target-mIoU of 75.64%, exceeding SegFormer, the strongest comparison model for this metric, by 14.70 percentage points. DBKNet also achieved the highest aAcc, mIoU, and mDice values of 98.96%, 83.40%, and 90.26%, respectively. These results show that the performance advantage of DBKNet remains evident under the fixed 10,000-iteration evaluation protocol. The improvement was not solely attributable to the dominant background class but was also evident for the two target classes. Compared with conventional convolutional networks and Transformer-based models, DBKNet better balances local-detail preservation and global-context modeling for joint target extraction under complex arid-region backgrounds. The overall performance and target-class IoU values are further compared in Figure 9.
Figure 9.
Comparison of overall performance and target-class IoU among different models. (a) Comparison of mIoU among different models; (b) Comparison of target-class IoU among different models.
Figure 9 compares the overall mIoU and target-class IoU of the evaluated models. Traditional convolutional models, such as FCN-ResNet18, U-Net, and PSPNet, achieved relatively low overall accuracy. DeepLabV3+, SegFormer, and PIDNet obtained certain improvements through multi-scale context modeling or global feature representation, but their performance was still lower than that of DBKNet. From the class-wise results, impervious surface is the key class that distinguishes the performance of different models. Except for DBKNet, the IS IoU values of all other models were lower than 40%, indicating that low-proportion and fragmented targets, such as roads, villages, and mining–industrial construction land, are difficult to identify stably in 30 m Landsat imagery. DBKNet achieved IS IoU and PV IoU values of 64.40% and 86.87%, respectively, indicating that it improves the extraction ability for fragmented impervious surfaces while maintaining high recognition accuracy for regular photovoltaic arrays. The test-set mIoU trajectories recorded during training are shown in Figure 10.
Figure 10.
Recorded test-set mIoU curves of the comparative models.
Figure 10 presents the test-set mIoU trajectories recorded during the comparative experiments. The curves describe the performance changes observed during training, whereas the intermediate records were not used to determine the checkpoints reported in Table 3. All results in Table 3 correspond to the fixed checkpoints obtained at 10,000 iterations. DBKNet maintained the highest recorded mIoU during the later training stage and achieved an mIoU of 83.40% at the final evaluation point.
The impervious-surface class remained more difficult to identify than the photovoltaic class. Although DBKNet outperformed the comparative models, its impervious-surface IoU remained lower than its photovoltaic IoU. This difference is associated with the low proportion, fragmented morphology, and spectral similarity of roads, settlement edges, and mining–industrial surfaces in 30 m Landsat imagery. Further evaluation using independent regional samples and higher-spatial-resolution imagery is still needed.
4.3. Ablation and Component Analysis
4.3.1. Main-Module Ablation
To examine the contributions of the main structural designs in DBKNet, a single-encoder configuration was used as the Base model. The Base model consists of a ResNetV1c encoder and the KAN-based decoder described in Section 3.5. It does not include the BiFormer Tiny branch, ConvSwinMerge, or the D2T TransformerBlock. Three additional configurations were constructed by introducing the dual-encoder structure, ConvSwinMerge, and D2T TransformerBlock separately. These configurations were evaluated independently rather than as a cumulative sequence. The same data split, training strategy, and fixed 10,000-iteration checkpoint were used in all experiments. The quantitative results are presented in Table 4.
As shown in Table 4, the Base model achieved an mIoU of 77.20% and a Target-mIoU of 66.59%. Introducing the dual-encoder structure increased these values to 81.37% and 72.66%, respectively. The configurations containing ConvSwinMerge and D2T TransformerBlock achieved mIoU values of 81.90% and 82.14%. The complete DBKNet obtained the highest mIoU of 83.40% and Target-mIoU of 75.64%.
The improvement was more evident for impervious surfaces. The IS IoU increased from 50.40% in the Base model to 64.40% in DBKNet, whereas the PV IoU increased from 82.77% to 86.87%. The results indicate that the main structural designs primarily improve the representation of fragmented impervious surfaces while retaining stable recognition of photovoltaic arrays. The recorded test-set mIoU trajectories of the main-module configurations are shown in Figure 11.
Figure 11.
Recorded test-set mIoU curves of the main-module ablation experiments.
Figure 11 shows the test-set mIoU trajectories of the main-module configurations. The Base model reached a lower final performance level, whereas the dual-encoder, ConvSwinMerge, and D2T configurations improved the final mIoU. The complete DBKNet achieved the highest value of 83.40% at 10,000 iterations. The corresponding target-class IoU values are compared in Figure 12.
Figure 12.
Comparison of target-class IoU under different module configurations.
Figure 12 compares the IoU values of impervious surfaces and photovoltaic power stations under different module configurations. The results show that the improved modules provide particularly clear gains for the impervious surface class. The IS IoU of the Base model was 50.40%. After introducing the dual-branch encoder, ConvSwinMerge, and D2T TransformerBlock, the IS IoU increased to 59.56%, 60.43%, and 61.46%, respectively. The complete DBKNet further improved the IS IoU to 64.40%. For the photovoltaic power station class, the PV IoU of the Base model reached 82.77%, and the complete DBKNet improved it to 86.87%. These results show that the complete architecture improves both target classes, with a substantially larger gain for impervious surfaces.
4.3.2. Internal-Component Ablation
The main-module experiments evaluate the overall network structure, whereas the following experiments focus on the internal components of ConvSwinMerge and the KAN-based decoder. The KAN nonlinear mapping, coordinate-attention mechanism, and SaELayer were disabled individually while the remaining architecture and training settings were kept unchanged. All variants were evaluated using the fixed checkpoints obtained at 10,000 iterations. The results are listed in Table 5.
The complete configuration achieved the highest values for all reported metrics. Disabling the KAN nonlinear mapping reduced the mIoU from 83.40% to 82.57% and the Target-mIoU from 75.64% to 74.45%. The IS IoU decreased by 1.55 percentage points, which was the largest impervious-surface reduction among the three variants. This result suggests that the nonlinear mapping contributes to the discrimination of fragmented artificial surfaces.
Removing coordinate attention produced an mIoU of 82.78% and a Target-mIoU of 74.76%. The reduction indicates that directional positional information is useful for representing road-like impervious surfaces and regularly arranged photovoltaic arrays. Without SaELayer, the mIoU and Target-mIoU decreased to 82.73% and 74.68%, respectively, and the PV IoU declined to 85.79%. Channel recalibration therefore contributes to retaining discriminative responses for photovoltaic regions. Although the individual differences were moderate, the complete configuration consistently produced the best results.
4.4. Model Complexity Analysis
Model complexity was measured using the number of parameters and GFLOPs. All configurations were evaluated with a six-band input of 256 × 256 pixels. Table 6 reports the complexity of the configurations used in the ablation experiments, while Table 7 compares DBKNet with the semantic segmentation models evaluated in Section 4.2.2.
Table 6.
Complexity of different DBKNet configurations.
Table 7.
Complexity comparison with comparative models.
The dual-encoder configuration accounts for most of the increase in model size, whereas the independently evaluated D2T configuration adds little computational cost. The complete DBKNet contains 42.18 M parameters and requires 32.60 GFLOPs.
Disabling the KAN mapping reduces the parameter count by 1.98 M, while GFLOPs decrease by only 0.02. Removing coordinate attention and SaELayer reduces the parameter count by 2.10 M and 1.40 M, respectively, with changes in GFLOPs not exceeding 0.10. The internal components therefore introduce relatively limited computation compared with the dual-encoder and full feature-fusion structure.
DBKNet has a higher computational cost than the comparative models, but it also achieves the highest mIoU and Target-mIoU. Compared with SegFormer, which obtained the strongest accuracy among the external comparison models, DBKNet requires an additional 21.90 GFLOPs and 28.48 M parameters. Its mIoU and Target-mIoU are higher by 10.11 and 14.70 percentage points, respectively. The result reflects an accuracy–complexity trade-off rather than a lightweight network design. The additional computation is mainly associated with the dual-encoder structure and multi-stage feature fusion used to improve the recognition of fragmented impervious surfaces.
4.5. Qualitative Visualization Analysis
To further analyze the segmentation performance of different models under complex surface backgrounds, representative samples from the test set were selected for qualitative visual comparison. The sample types include road-like impervious surfaces, dense impervious surfaces, sparse impervious surfaces, concentrated photovoltaic power stations, and mixed areas of photovoltaic power stations and impervious surfaces. Figure 13 shows the original images, reference labels, and prediction results of different models, where orange represents impervious surfaces and purple represents photovoltaic power stations.
Figure 13.
Qualitative comparison of segmentation results. Note: Background, impervious surfaces, and photovoltaic power stations are shown in black, orange, and purple, respectively.
Figure 13 reveals clear differences among the evaluated models. FCN-ResNet18, U-Net, and PSPNet identify large contiguous targets but exhibit omissions and broken boundaries in roads, village margins, and scattered mining–industrial areas. DeepLabV3+, SegFormer, and PIDNet produce more complete target regions in several samples, although confusion remains between impervious surfaces and spectrally similar bare soil or disturbed land.
DBKNet preserves the connectivity of linear impervious surfaces and produces more complete photovoltaic arrays with clearer boundaries. In mixed scenes, it also reduces confusion between the two target classes. These observations are consistent with the quantitative improvements in IS IoU and PV IoU reported in Table 3.
4.6. Cross-Temporal Validation and Multi-Year Mapping
DBKNet was trained using the 2025 dataset and subsequently applied to the fixed-site reference samples from 2014, 2018, 2021, and 2025. The reference dataset contained 16 identical spatial locations for each year, resulting in 64 image–label pairs. The same trained checkpoint and inference settings were used for all four years, without retraining, fine-tuning, checkpoint reselection, or threshold adjustment. The annual and pooled evaluation results are reported in Table 8.
Table 8.
Cross-temporal validation results of DBKNet.
As shown in Table 8, the pooled mIoU, mDice, aAcc, and Target-mIoU values for the 64 samples were 76.82%, 86.32%, 91.79%, and 70.06%, respectively. The highest annual performance was obtained for the 2025 samples, with a Target-mIoU of 79.30%. The corresponding values for 2018 and 2021 were 45.82% and 57.95%, respectively. These differences indicate that model performance varied over the years, with lower target-class accuracy for the earlier imagery. The decrease may be associated with differences in spectral response, surface conditions, image quality, and target distribution between the earlier images and the 2025 training data.
In the selected 2014 reference samples, no photovoltaic pixels were identified during manual interpretation, which was consistent with the very limited presence of photovoltaic power stations observed at these locations in the 2014 imagery. Consequently, any photovoltaic predictions were counted as false positives, resulting in a PV IoU of 0.00% and reducing the corresponding Target-mIoU. This value therefore does not indicate the omission of existing reference photovoltaic targets. Moreover, when a target class is absent or occupies only a very small proportion of the reference samples, a limited number of false-positive pixels can have a relatively large influence on the class-wise metric. Representative image, reference-label, and prediction results are shown in Figure 14.
Figure 14.
Representative fixed-site validation results for 2014, 2018, 2021, and 2025. Note: Background, impervious surfaces, and photovoltaic power stations are shown in black, orange, and purple, respectively.
Figure 14 presents representative fixed-site validation results. Impervious surfaces, photovoltaic power stations, and background are shown in orange, purple, and black, respectively. The results illustrate that the model maintained relatively complete target structures in 2025, whereas increased omission and false-positive errors occurred in some earlier-year samples.
After the fixed-site evaluation, DBKNet was applied to the full-scene Landsat images of Ordos for 2014, 2018, 2021, and 2025. Each six-band image had a size of 18,481 × 12,069 pixels, which was substantially larger than the 256 × 256 network input. The images were therefore divided into overlapping 256 × 256 windows with a stride of 128 pixels. Each window was processed independently, and the class-score maps were accumulated and averaged for pixels covered by multiple windows. The final class was assigned using pixel-wise argmax classification. The window-level predictions were then mosaicked according to their original georeferenced coordinates and clipped using the administrative boundary of Ordos. The same trained checkpoint and inference settings were used for all four years without retraining, fine-tuning, checkpoint reselection, or threshold adjustment. The resulting multi-year prediction maps are presented in Figure 15.
Figure 15.
Cross-year prediction results of DBKNet for 2014, 2018, 2021, and 2025.
Figure 15 shows the model-derived spatial distributions of the two target classes. Impervious surfaces were mainly concentrated in urban areas, transportation corridors, and mining–industrial zones. Photovoltaic power stations showed relatively limited mapped distributions in the earlier years and more extensive and contiguous patterns after 2021. Because the fixed-site validation indicated lower target-class accuracy for earlier imagery, these maps are interpreted as model-derived spatial patterns rather than fully validated regional land-cover inventories.
The mapped areas were estimated by counting the predicted pixels of each target class. At the Landsat spatial resolution of 30 m, each pixel corresponds to 0.0009 km2. The resulting statistics are presented in Table 9.
Table 9.
Estimated target areas.
The mapped impervious-surface area increased from 156.20 km2 in 2014 to 343.78 km2 in 2025, whereas the mapped photovoltaic area increased from 12.29 km2 to 340.00 km2. The most pronounced increase in photovoltaic area occurred after 2021. These results indicate increasing artificial-surface and renewable-energy development represented by the model outputs, although more spatially distributed reference samples are required for precise city-wide area estimation. The corresponding mapped-area trends are shown in Figure 16.
Figure 16.
Changes in model-derived mapped areas from 2014 to 2025.
Figure 16 summarizes the temporal changes represented by the DBKNet outputs. Joint mapping of photovoltaic power stations and impervious surfaces provides complementary information on renewable-energy infrastructure and general artificial-surface development. Nevertheless, the mapped area statistics should be interpreted together with the annual validation results, particularly for the earlier years.
5. Discussion
The comparative and ablation results indicate that the performance gains of DBKNet are mainly associated with the complementary representation of local details and global structures. ResNetV1c provides texture and boundary information for fragmented impervious surfaces, whereas BiFormer Tiny captures long-range spatial relationships within large photovoltaic arrays. ConvSwinMerge and D2T further enhance cross-branch interaction and decoder-side contextual representation. The larger improvement in impervious-surface IoU suggests that these designs are particularly beneficial for low-proportion, fragmented, and spectrally confusing targets.
The cross-temporal evaluation indicates that transfer across years remains sensitive to differences in spectral response, surface conditions, image quality, and target distribution. The absence of reference photovoltaic pixels at the selected 2014 locations also makes the class-wise metric sensitive to false-positive predictions. Because the sites were selected to represent target-rich and mixed scenes rather than by probability sampling, the pooled metrics characterize performance at the evaluated locations rather than unbiased city-wide accuracy. The regional area statistics should therefore be interpreted as model-derived trends.
Cross-dataset evaluation remains a limitation of the present study. A directly compatible public benchmark was not identified for the six-band, 30 m joint-segmentation task considered here. Available land-cover segmentation studies use different sensors, spatial resolutions, and category systems [49,50,51], whereas photovoltaic extraction studies often rely on high-resolution optical imagery and task-specific prior knowledge [52]. Direct application to these datasets would therefore require changes to the input channels or output classes, resulting in a different segmentation task rather than a controlled cross-dataset comparison.
The additional validation set was constructed from separate spatial locations and followed the same preprocessing, annotation, and target-screening criteria as the original dataset. It therefore provided a supplementary assessment under consistent preprocessing, annotation, and sampling criteria. Nevertheless, the primary samples were derived from the Ordos region, and further evaluation using geographically independent regional datasets remains necessary.
From an application perspective, treating photovoltaic power stations and impervious surfaces as separate target classes enables renewable-energy infrastructure to be distinguished from general artificial surfaces. Future work will focus on constructing independent cross-region datasets with consistent spectral bands and class definitions and incorporating higher-spatial-resolution imagery to further assess model robustness and regional transferability.
6. Conclusions
This study developed DBKNet for the joint extraction of photovoltaic power stations and impervious surfaces from six-band Landsat imagery in arid regions. The dual-encoder structure combines local detail extraction with long-range contextual representation, while cross-branch feature fusion and decoder-side enhancement improve the separation of artificial surfaces from spectrally similar arid backgrounds. DBKNet achieved an mIoU of 83.40%, an mDice of 90.26%, and a Target-mIoU of 75.64% on the test set. The comparative and ablation results showed that the proposed structure was particularly effective for fragmented and low-proportion impervious surfaces.
The fixed-site evaluation across 2014, 2018, 2021, and 2025 produced a pooled mIoU of 76.82% and a Target-mIoU of 70.06% without retraining or fine-tuning. The lower accuracy for the earlier imagery indicates that temporal differences in image characteristics, surface conditions, and target distribution still affect model performance. The present study was conducted in a single region, and no directly compatible public benchmark was available for cross-dataset evaluation. Future work will use geographically independent samples and higher-resolution imagery to assess transferability and improve the extraction of small or fragmented targets.
Author Contributions
Conceptualization, P.L. and F.L.; methodology, J.C., F.L. and Y.W.; software, J.X.; validation, F.L.; formal analysis, J.X. and Y.M.; investigation, H.X., Q.G., J.X., Y.W. and Y.M.; resources, P.L.; data curation, J.C. and Q.G.; writing—original draft preparation, J.C.; writing—review and editing, J.C., P.L. and H.X.; visualization, Y.W. and Y.M.; supervision, P.L.; project administration, P.L.; funding acquisition, P.L. All authors have read and agreed to the published version of the manuscript.
Funding
This research was funded by the National Natural Science Foundation of China, grant number 52274169.
Data Availability Statement
The source code, model configurations, preprocessing, dataset-generation, random train–test splitting, training, inference, and evaluation scripts are publicly available in the DBKNet repository: https://github.com/chen1617525726/DBKNet (accessed on 29 July 2026). All trained model checkpoints and original training logs are provided in release v1.0.0: https://github.com/chen1617525726/DBKNet/releases/tag/v1.0.0 (accessed on 29 July 2026). A fixed random seed of 0 was used for model training. The complete manually interpreted reference labels, exact sample files, and corresponding dataset-split records are available from the corresponding author upon reasonable request. Landsat Collection 2 Level-2 imagery is publicly available through Google Earth Engine and the United States Geological Survey Landsat archive.
Acknowledgments
The authors would like to thank the members of the research group for their valuable discussions and helpful suggestions during data processing, experimental analysis, and manuscript revision.
Conflicts of Interest
The authors declare no conflicts of interest.
References
- Kruitwagen, L.; Story, K.T.; Friedrich, J.; Byers, L.; Skillman, S.; Hepburn, C. A Global Inventory of Photovoltaic Solar Energy Generating Units. Nature 2021, 598, 604–610. [Google Scholar] [CrossRef] [Scilit] [PubMed]
- Dunnett, S.; Sorichetta, A.; Taylor, G.; Eigenbrod, F. Harmonised Global Datasets of Wind and Solar Farm Locations and Power. Sci. Data 2020, 7, 130. [Google Scholar] [CrossRef] [Scilit] [PubMed]
- Zhang, X.; Xu, M.; Wang, S.; Huang, Y.; Xie, Z. Mapping Photovoltaic Power Plants in China Using Landsat, Random Forest, and Google Earth Engine. Earth Syst. Sci. Data 2022, 14, 3743–3755. [Google Scholar] [CrossRef] [Scilit]
- Feng, Q.; Niu, B.; Ren, Y.; Su, S.; Wang, J.; Shi, H.; Yang, J.; Han, M. A 10-m National-Scale Map of Ground-Mounted Photovoltaic Power Stations in China of 2020. Sci. Data 2024, 11, 198. [Google Scholar] [CrossRef] [Scilit] [PubMed]
- Hernandez, R.R.; Hoffacker, M.K.; Field, C.B. Land-Use Efficiency of Big Solar. Environ. Sci. Technol. 2014, 48, 1315–1323. [Google Scholar] [CrossRef] [Scilit] [PubMed]
- Weng, Q. Remote Sensing of Impervious Surfaces in the Urban Areas: Requirements, Methods, and Trends. Remote Sens. Environ. 2012, 117, 34–49. [Google Scholar] [CrossRef] [Scilit]
- Gong, P.; Li, X.; Wang, J.; Bai, Y.; Chen, B.; Hu, T.; Liu, X.; Xu, B.; Yang, J.; Zhang, W.; et al. Annual Maps of Global Artificial Impervious Area (GAIA) between 1985 and 2018. Remote Sens. Environ. 2020, 236, 111510. [Google Scholar] [CrossRef] [Scilit]
- Yu, J.; Wang, Z.; Majumdar, A.; Rajagopal, R. DeepSolar: A Machine Learning Framework to Efficiently Construct a Solar Deployment Database in the United States. Joule 2018, 2, 2605–2617. [Google Scholar] [CrossRef] [Scilit]
- Malof, J.M.; Bradbury, K.; Collins, L.M.; Newell, R.G. Automatic Detection of Solar Photovoltaic Arrays in High Resolution Aerial Imagery. Appl. Energy 2016, 183, 229–240. [Google Scholar] [CrossRef] [Scilit]
- Zhang, X.; Liu, L.; Wu, C.; Chen, X.; Gao, Y.; Xie, S.; Zhang, B. Development of a Global 30 m Impervious Surface Map Using Multisource and Multitemporal Remote Sensing Datasets with the Google Earth Engine Platform. Earth Syst. Sci. Data 2020, 12, 1625–1648. [Google Scholar] [CrossRef] [Scilit]
- Huang, X.; Li, J.; Yang, J.; Zhang, Z.; Li, D.; Liu, X. 30 m Global Impervious Surface Area Dynamics and Urban Expansion Pattern Observed by Landsat Satellites: From 1972 to 2019. Sci. China Earth Sci. 2021, 64, 1922–1933. [Google Scholar] [CrossRef] [Scilit]
- Gorelick, N.; Hancher, M.; Dixon, M.; Ilyushchenko, S.; Thau, D.; Moore, R. Google Earth Engine: Planetary-Scale Geospatial Analysis for Everyone. Remote Sens. Environ. 2017, 202, 18–27. [Google Scholar] [CrossRef] [Scilit]
- Wulder, M.A.; Masek, J.G.; Cohen, W.B.; Loveland, T.R.; Woodcock, C.E. Opening the Archive: How Free Data Has Enabled the Science and Monitoring Promise of Landsat. Remote Sens. Environ. 2012, 122, 2–10. [Google Scholar] [CrossRef] [Scilit]
- Shen, J.; Shuai, Y.; Li, P.; Cao, Y.; Ma, X. Extraction and Spatio-Temporal Analysis of Impervious Surfaces over Dongying Based on Landsat Data. Remote Sens. 2021, 13, 3666. [Google Scholar] [CrossRef] [Scilit]
- Su, S.; Tian, J.; Dong, X.; Tian, Q.; Wang, N.; Xi, Y. An Impervious Surface Spectral Index on Multispectral Imagery Using Visible and Near-Infrared Bands. Remote Sens. 2022, 14, 3391. [Google Scholar] [CrossRef] [Scilit]
- Kleebauer, M.; Marz, C.; Reudenbach, C.; Braun, M. Multi-Resolution Segmentation of Solar Photovoltaic Systems Using Deep Learning. Remote Sens. 2023, 15, 5687. [Google Scholar] [CrossRef] [Scilit]
- Shao, Z.; Cheng, T.; Fu, H.; Li, D.; Huang, X. Emerging Issues in Mapping Urban Impervious Surfaces Using High-Resolution Remote Sensing Images. Remote Sens. 2023, 15, 2562. [Google Scholar] [CrossRef] [Scilit]
- Parekh, J.R.; Poortinga, A.; Bhandari, B.; Mayer, T.; Saah, D.; Chishtie, F. Automatic Detection of Impervious Surfaces from Remotely Sensed Data Using Deep Learning. Remote Sens. 2021, 13, 3166. [Google Scholar] [CrossRef] [Scilit]
- Breiman, L. Random Forests. Mach. Learn. 2001, 45, 5–32. [Google Scholar] [CrossRef] [Scilit]
- Cortes, C.; Vapnik, V. Support-Vector Networks. Mach. Learn. 1995, 20, 273–297. [Google Scholar] [CrossRef] [Scilit]
- Richards, J.A.; Jia, X. Remote Sensing Digital Image Analysis: An Introduction; Springer: Berlin/Heidelberg, Germany, 2006. [Google Scholar] [CrossRef] [Scilit]
- Zhu, X.X.; Tuia, D.; Mou, L.; Xia, G.-S.; Zhang, L.; Xu, F.; Fraundorfer, F. Deep Learning in Remote Sensing: A Comprehensive Review and List of Resources. IEEE Geosci. Remote Sens. Mag. 2017, 5, 8–36. [Google Scholar] [CrossRef] [Scilit]
- Ma, L.; Liu, Y.; Zhang, X.; Ye, Y.; Yin, G.; Johnson, B.A. Deep Learning in Remote Sensing Applications: A Meta-Analysis and Review. ISPRS J. Photogramm. Remote Sens. 2019, 152, 166–177. [Google Scholar] [CrossRef] [Scilit]
- Long, J.; Shelhamer, E.; Darrell, T. Fully Convolutional Networks for Semantic Segmentation. In Proceedings of the IEEE Conference on Computer Vision and Pattern Recognition (CVPR), Boston, MA, USA, 7–12 June 2015; pp. 3431–3440. [Google Scholar] [CrossRef] [Scilit]
- Ronneberger, O.; Fischer, P.; Brox, T. U-Net: Convolutional Networks for Biomedical Image Segmentation. In Medical Image Computing and Computer-Assisted Intervention (MICCAI); Navab, N., Hornegger, J., Wells, W.M., Frangi, A.F., Eds.; Lecture Notes in Computer Science; Springer International Publishing: Cham, Switzerland, 2015; Volume 9351, pp. 234–241. [Google Scholar] [CrossRef] [Scilit]
- Zhao, H.; Shi, J.; Qi, X.; Wang, X.; Jia, J. Pyramid Scene Parsing Network. In Proceedings of the IEEE Conference on Computer Vision and Pattern Recognition (CVPR), Honolulu, HI, USA, 21–26 July 2017; pp. 6230–6239. [Google Scholar] [CrossRef] [Scilit]
- Chen, L.-C.; Papandreou, G.; Kokkinos, I.; Murphy, K.; Yuille, A.L. DeepLab: Semantic Image Segmentation with Deep Convolutional Nets, Atrous Convolution, and Fully Connected CRFs. IEEE Trans. Pattern Anal. Mach. Intell. 2018, 40, 834–848. [Google Scholar] [CrossRef] [Scilit] [PubMed]
- Chen, L.-C.; Zhu, Y.; Papandreou, G.; Schroff, F.; Adam, H. Encoder-Decoder with Atrous Separable Convolution for Semantic Image Segmentation. In European Conference on Computer Vision; Ferrari, V., Hebert, M., Sminchisescu, C., Weiss, Y., Eds.; Lecture Notes in Computer Science; Springer International Publishing: Cham, Switzerland, 2018; Volume 11211, pp. 833–851. [Google Scholar] [CrossRef] [Scilit]
- Dosovitskiy, A.; Beyer, L.; Kolesnikov, A.; Weissenborn, D.; Zhai, X.; Unterthiner, T.; Dehghani, M.; Minderer, M.; Heigold, G.; Gelly, S.; et al. An Image is Worth 16x16 Words: Transformers for Image Recognition at Scale. arXiv 2020, arXiv:2010.11929. [Google Scholar]
- Liu, Z.; Lin, Y.; Cao, Y.; Hu, H.; Wei, Y.; Zhang, Z.; Lin, S.; Guo, B. Swin Transformer: Hierarchical Vision Transformer Using Shifted Windows. In Proceedings of the 2021 IEEE/CVF International Conference on Computer Vision (ICCV), Montreal, QC, Canada, 10–17 October 2021; pp. 9992–10002. [Google Scholar] [CrossRef] [Scilit]
- Xie, E.; Wang, W.; Yu, Z.; Anandkumar, A.; Alvarez, J.M.; Luo, P. SegFormer: Simple and Efficient Design for Semantic Segmentation with Transformers. Adv. Neural Inf. Process. Syst. 2021, 34, 12077–12090. [Google Scholar]
- Xu, J.; Xiong, Z.; Bhattacharyya, S.P. PIDNet: A Real-Time Semantic Segmentation Network Inspired by PID Controllers. In Proceedings of the 2023 IEEE/CVF Conference on Computer Vision and Pattern Recognition (CVPR), Vancouver, BC, Canada, 17–24 June 2023; pp. 19529–19539. [Google Scholar] [CrossRef] [Scilit]
- Hoeser, T.; Bachofer, F.; Kuenzer, C. Object Detection and Image Segmentation with Deep Learning on Earth Observation Data: A Review—Part II: Applications. Remote Sens. 2020, 12, 3053. [Google Scholar] [CrossRef] [Scilit]
- Hoeser, T.; Kuenzer, C. Object Detection and Image Segmentation with Deep Learning on Earth Observation Data: A Review-Part I: Evolution and Recent Trends. Remote Sens. 2020, 12, 1667. [Google Scholar] [CrossRef] [Scilit]
- Li, X.; Xu, F.; Yu, A.; Lyu, X.; Gao, H.; Zhou, J. A Frequency Decoupling Network for Semantic Segmentation of Remote Sensing Images. IEEE Trans. Geosci. Remote Sens. 2025, 63, 5607921. [Google Scholar] [CrossRef] [Scilit]
- Zhang, H.; Xie, G.; Li, L.; Xie, X.; Ren, J. Frequency-Domain Guided Swin Transformer and Global–Local Feature Integration for Remote Sensing Images Semantic Segmentation. IEEE Trans. Geosci. Remote Sens. 2025, 63, 5612611. [Google Scholar] [CrossRef] [Scilit]
- Zhong, J.; Zeng, T.; Xu, Z.; Wu, C.; Qian, S.; Xu, N.; Chen, Z.; Lyu, X.; Li, X. A Frequency Attention-Enhanced Network for Semantic Segmentation of High-Resolution Remote Sensing Images. Remote Sens. 2025, 17, 402. [Google Scholar] [CrossRef] [Scilit]
- Zheng, Y.; Chen, Z.; Zheng, T.; Tian, C.; Dong, W. PSNet: A Universal Algorithm for Multispectral Remote Sensing Image Segmentation. Remote Sens. 2025, 17, 563. [Google Scholar] [CrossRef] [Scilit]
- Zhai, M.; Chen, D.; Duan, Y.; Zhen, Q.; Zheng, J.; Pei, M.; Guo, X. STRNet: Dual-Branch Synergistic Network with Interactive Fusion for Remote Sensing Semantic Segmentation. Complex Intell. Syst. 2026, 12, 57. [Google Scholar] [CrossRef] [Scilit]
- Zhu, Z.; Woodcock, C.E. Object-Based Cloud and Cloud Shadow Detection in Landsat Imagery. Remote Sens. Environ. 2012, 118, 83–94. [Google Scholar] [CrossRef] [Scilit]
- He, K.; Zhang, X.; Ren, S.; Sun, J. Deep Residual Learning for Image Recognition. In Proceedings of the IEEE Conference on Computer Vision and Pattern Recognition (CVPR), Las Vegas, NV, USA, 26 June–1 July 2016; pp. 770–778. [Google Scholar] [CrossRef] [Scilit]
- Zhu, L.; Wang, X.; Ke, Z.; Zhang, W.; Lau, R. BiFormer: Vision Transformer with Bi-Level Routing Attention. In Proceedings of the IEEE/CVF Conference on Computer Vision and Pattern Recognition, Vancouver, BC, Canada, 18–22 June 2023; pp. 10323–10333. [Google Scholar] [CrossRef] [Scilit]
- Hou, Q.; Zhou, D.; Feng, J. Coordinate Attention for Efficient Mobile Network Design. In Proceedings of the 2021 IEEE/CVF Conference on Computer Vision and Pattern Recognition (CVPR), Nashville, TN, USA, 19–25 June 2021; pp. 13708–13717. [Google Scholar] [CrossRef] [Scilit]
- Hu, J.; Shen, L.; Sun, G. Squeeze-and-Excitation Networks. In Proceedings of the IEEE Conference on Computer Vision and Pattern Recognition, Salt Lake City, UT, USA, 18–22 June 2018; pp. 7132–7141. [Google Scholar] [CrossRef] [Scilit]
- Yan, F.; Jiang, X.; Lu, Y.; Cao, J.; Chen, D.; Xu, M. Wavelet and Prototype Augmented Query-Based Transformer for Pixel-Level Surface Defect Detection. In Proceedings of the 2025 IEEE/CVF Conference on Computer Vision and Pattern Recognition (CVPR), Nashville, TN, USA, 11–15 June 2025; pp. 23860–23869. [Google Scholar] [CrossRef] [Scilit]
- Liu, Z.; Wang, Y.; Vaidya, S.; Ruehle, F.; Halverson, J.; Soljačić, M.; Hou, T.Y.; Tegmark, M. KAN: Kolmogorov-Arnold Networks. In Proceedings of the International Conference on Learning Representations 2025 (ICLR 2025), Singapore, 24–28 April 2025. [Google Scholar]
- Berman, M.; Triki, A.R.; Blaschko, M.B. The Lovász-Softmax Loss: A Tractable Surrogate for the Optimization of the Intersection-over-Union Measure in Neural Networks. In Proceedings of the 2018 IEEE/CVF Conference on Computer Vision and Pattern Recognition, Salt Lake City, UT, USA, 18–23 June 2018; pp. 4413–4421. [Google Scholar] [CrossRef] [Scilit]
- Milletari, F.; Navab, N.; Ahmadi, S.-A. V-Net: Fully Convolutional Neural Networks for Volumetric Medical Image Segmentation. In Proceedings of the 2016 Fourth International Conference on 3D Vision (3DV), Stanford, CA, USA, 25–28 October 2016; pp. 565–571. [Google Scholar] [CrossRef] [Scilit]
- Zheng, W.; Feng, J.; Gu, Z.; Zeng, M. A Stage-Adaptive Selective Network with Position Awareness for Semantic Segmentation of LULC Remote Sensing Images. Remote Sens. 2023, 15, 2811. [Google Scholar] [CrossRef] [Scilit]
- Tzepkenlis, A.; Marthoglou, K.; Grammalidis, N. Efficient Deep Semantic Segmentation for Land Cover Classification Using Sentinel Imagery. Remote Sens. 2023, 15, 2027. [Google Scholar] [CrossRef] [Scilit]
- Panboonyuen, T.; Charoenphon, C.; Satirapod, C. MeViT: A Medium-Resolution Vision Transformer for Semantic Segmentation on Landsat Satellite Imagery for Agriculture in Thailand. Remote Sens. 2023, 15, 5124. [Google Scholar] [CrossRef] [Scilit]
- Liu, W.; Huo, H.; Ji, L.; Zhao, Y.; Liu, X.; Li, J. A Method for Extracting Photovoltaic Panels from High-Resolution Optical Remote Sensing Images Guided by Prior Knowledge. Remote Sens. 2024, 16, 9. [Google Scholar] [CrossRef] [Scilit]
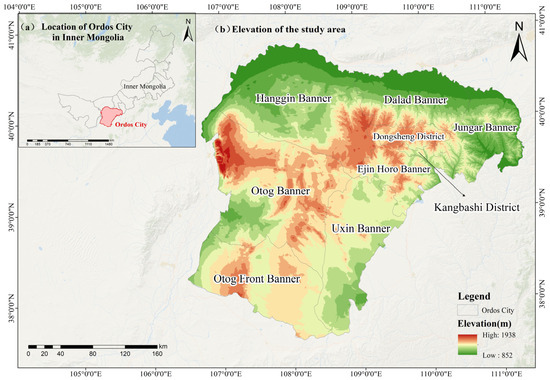
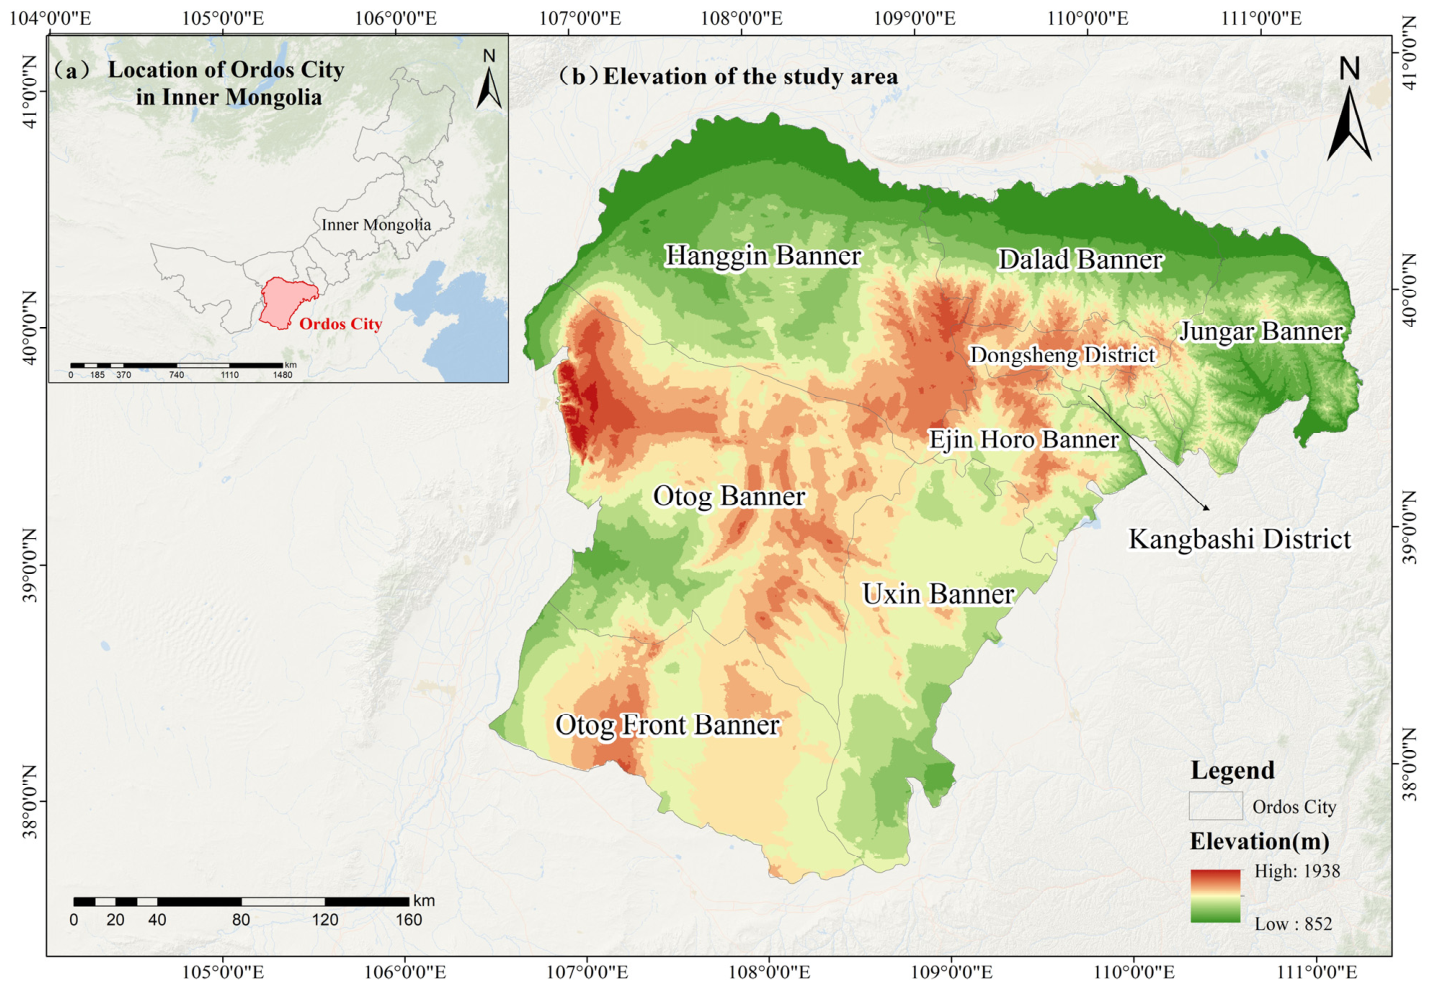
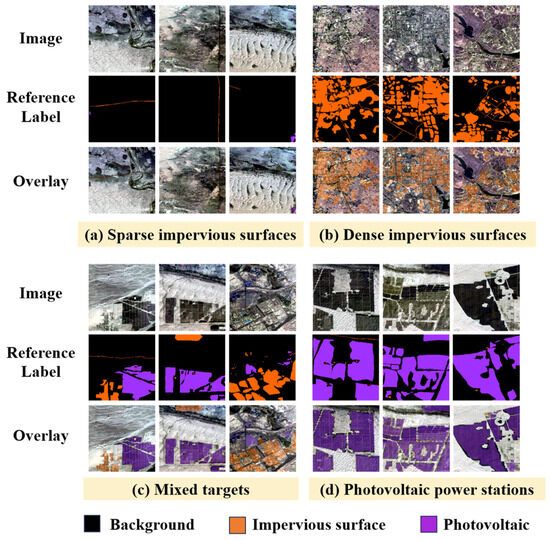
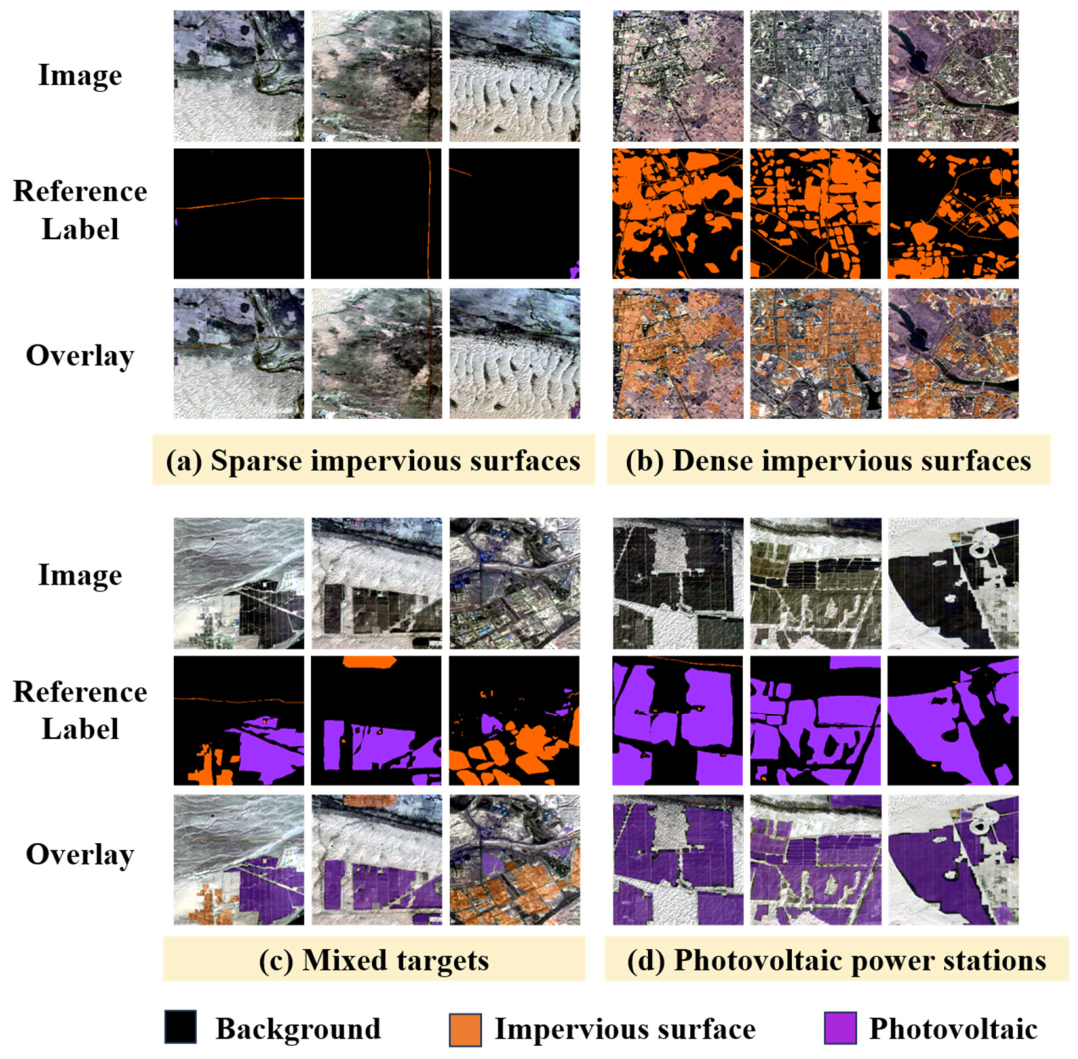
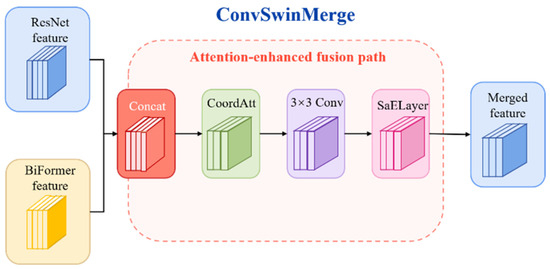
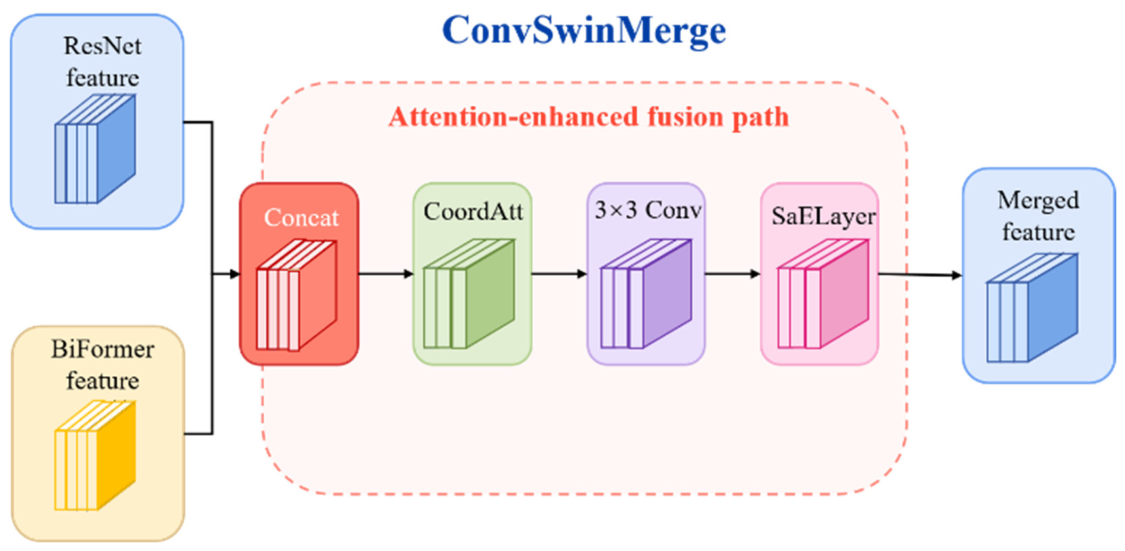
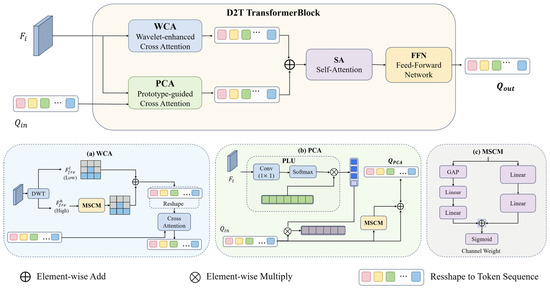
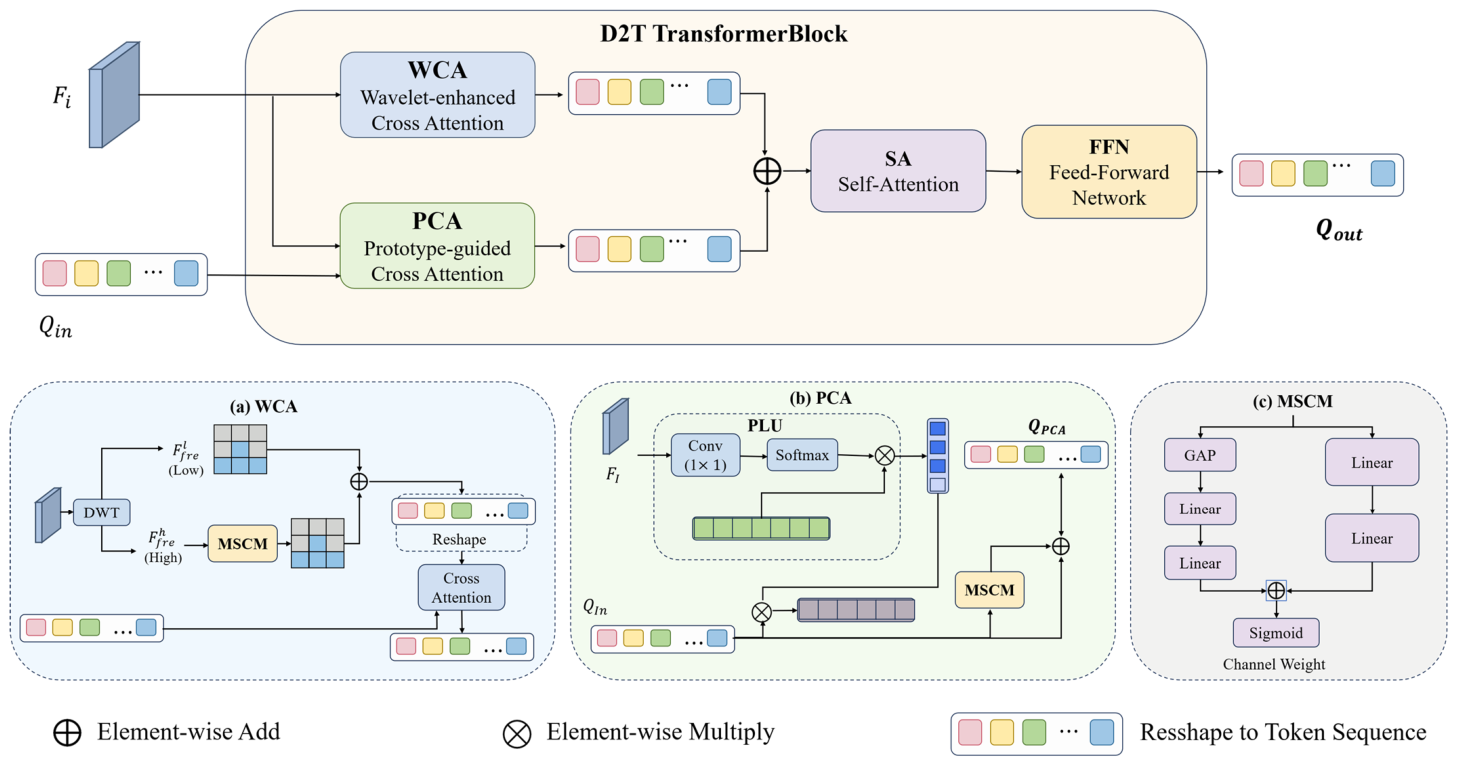
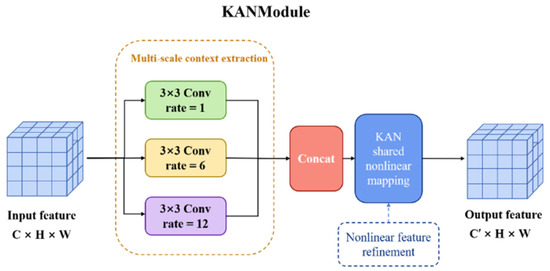
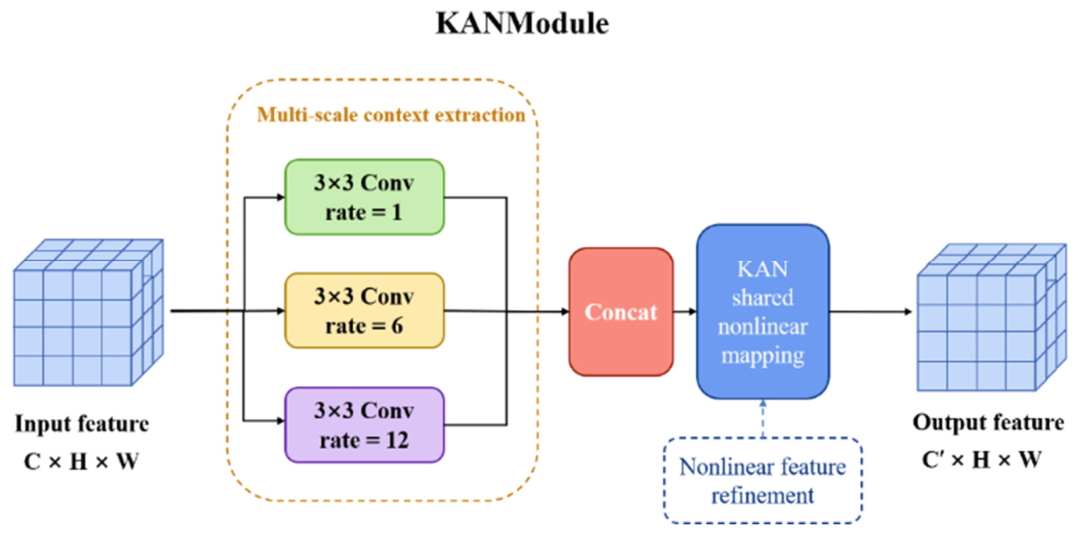
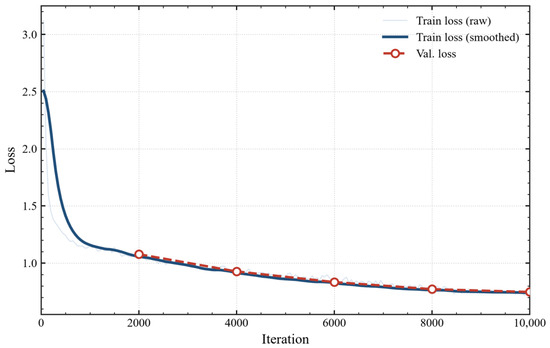
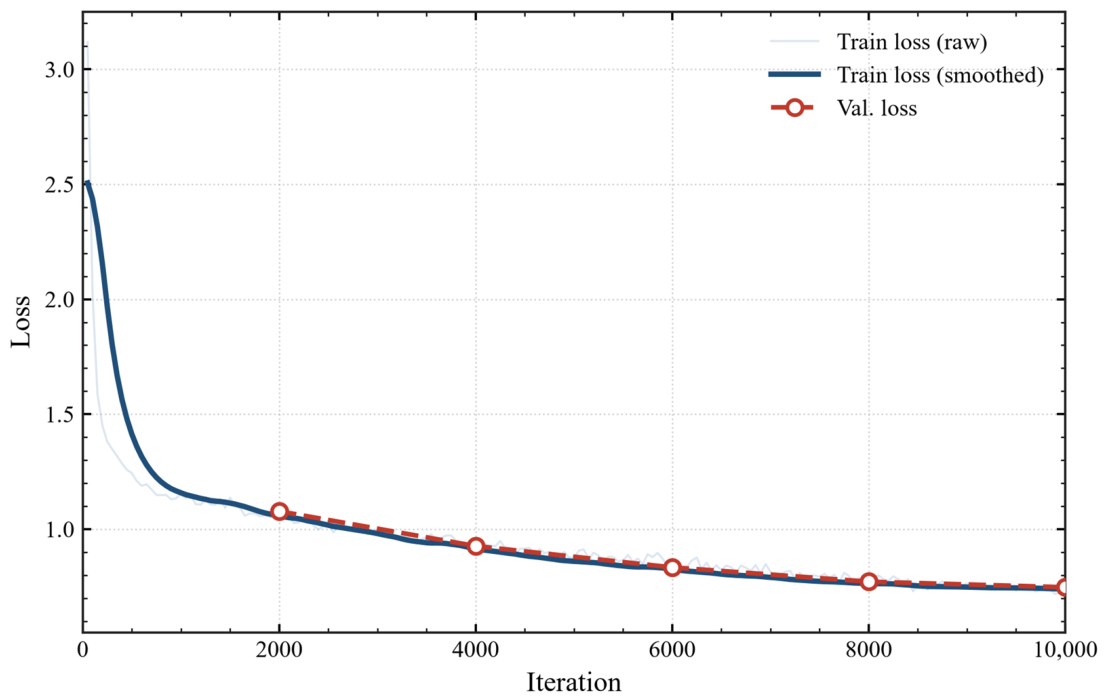
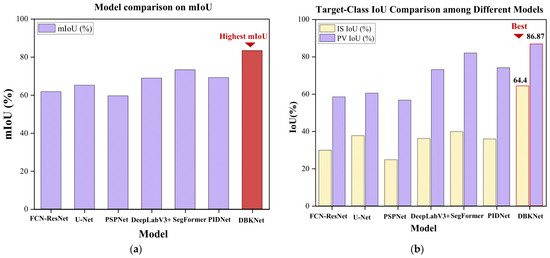
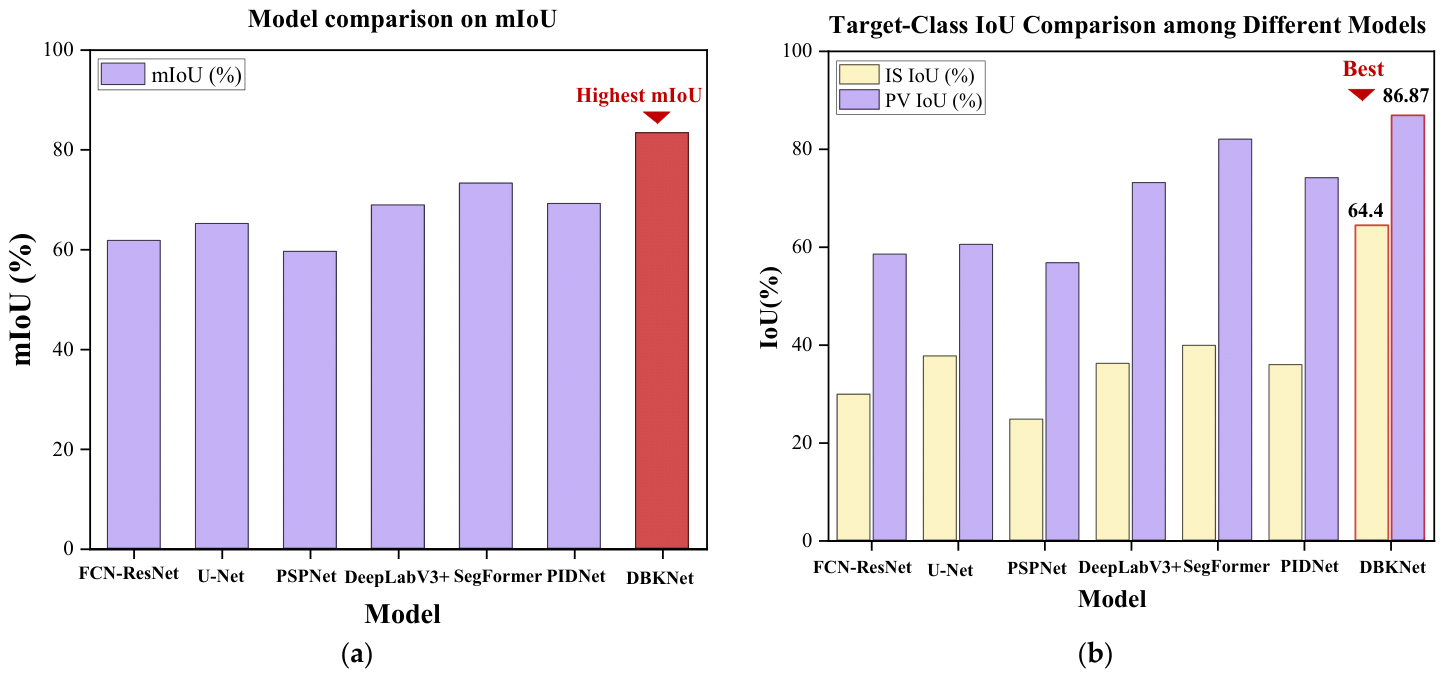
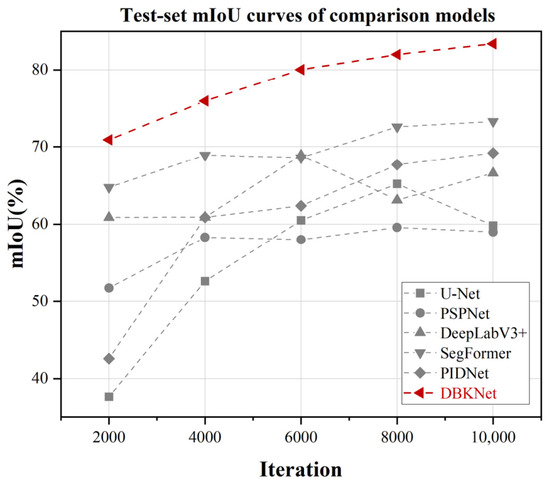
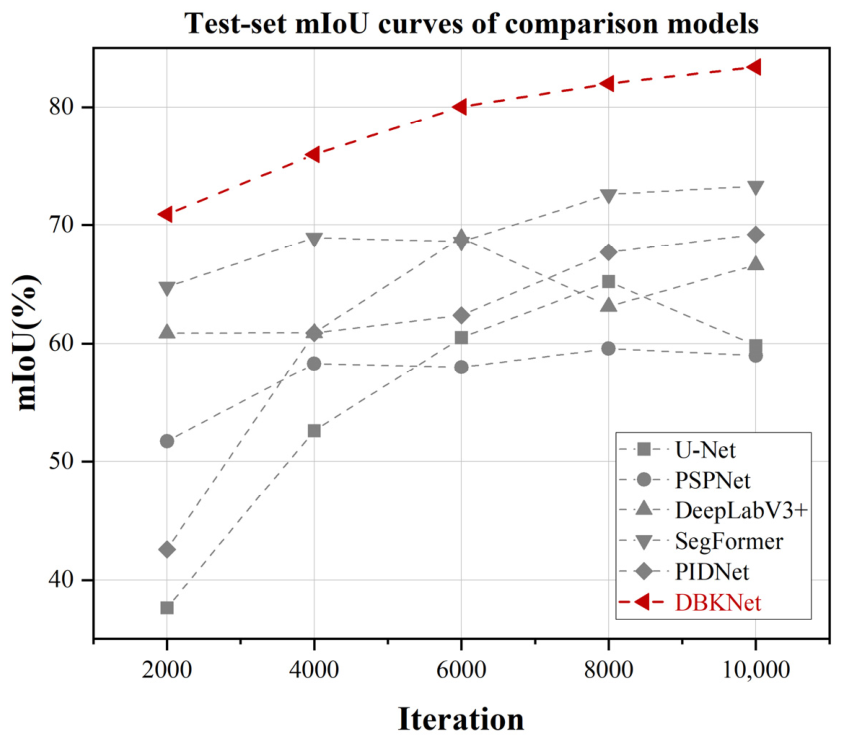
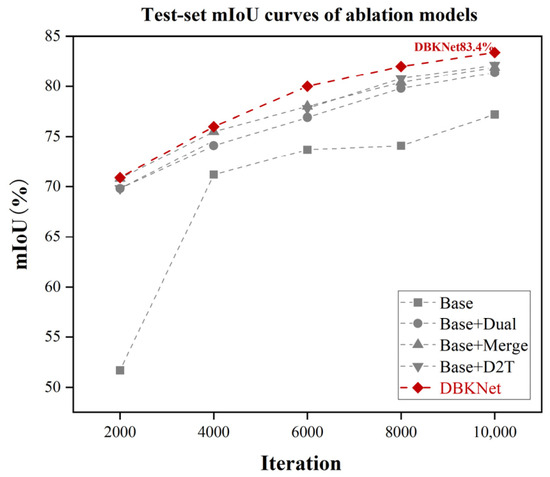
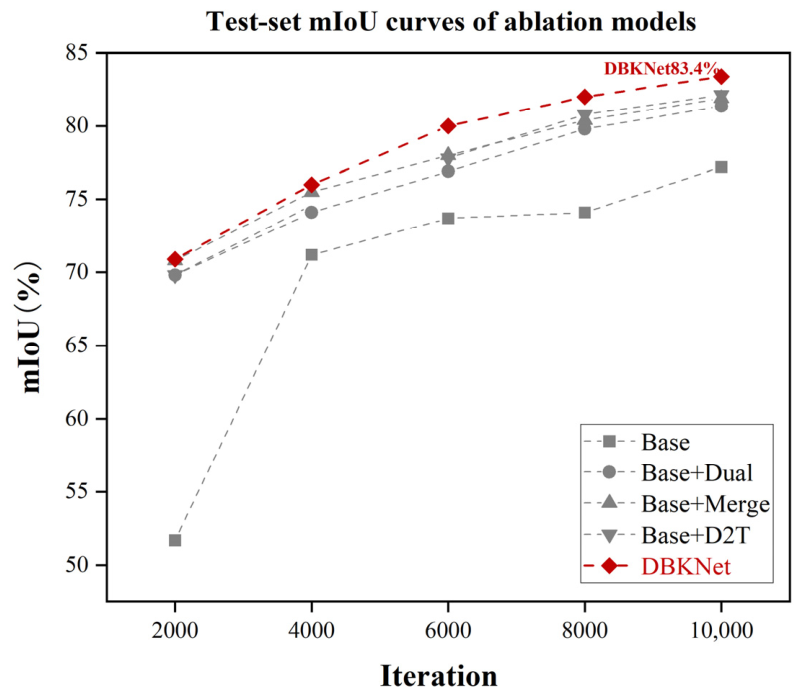
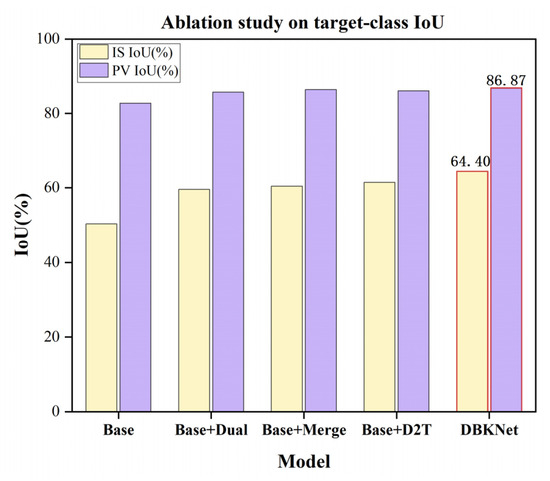
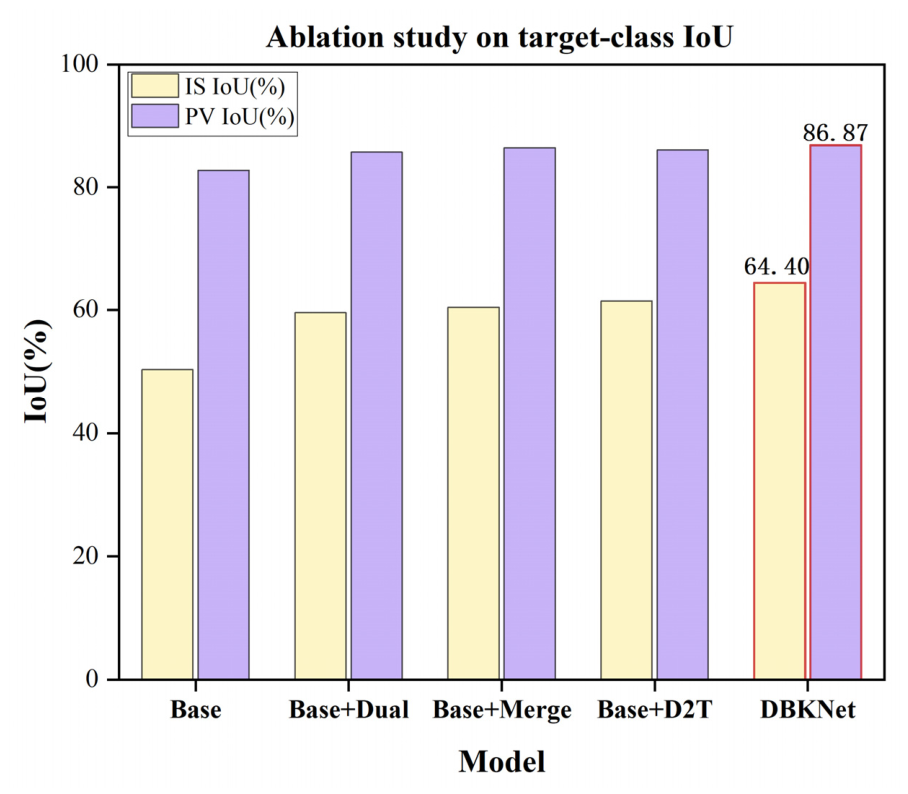
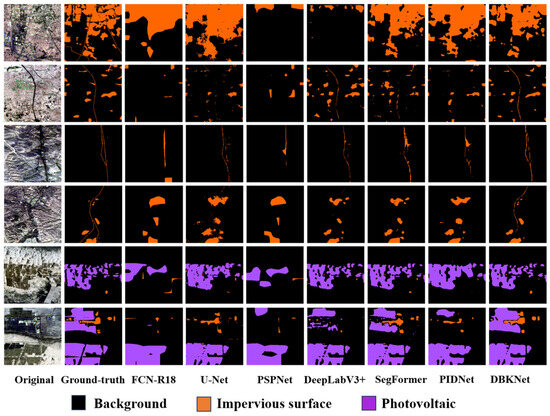
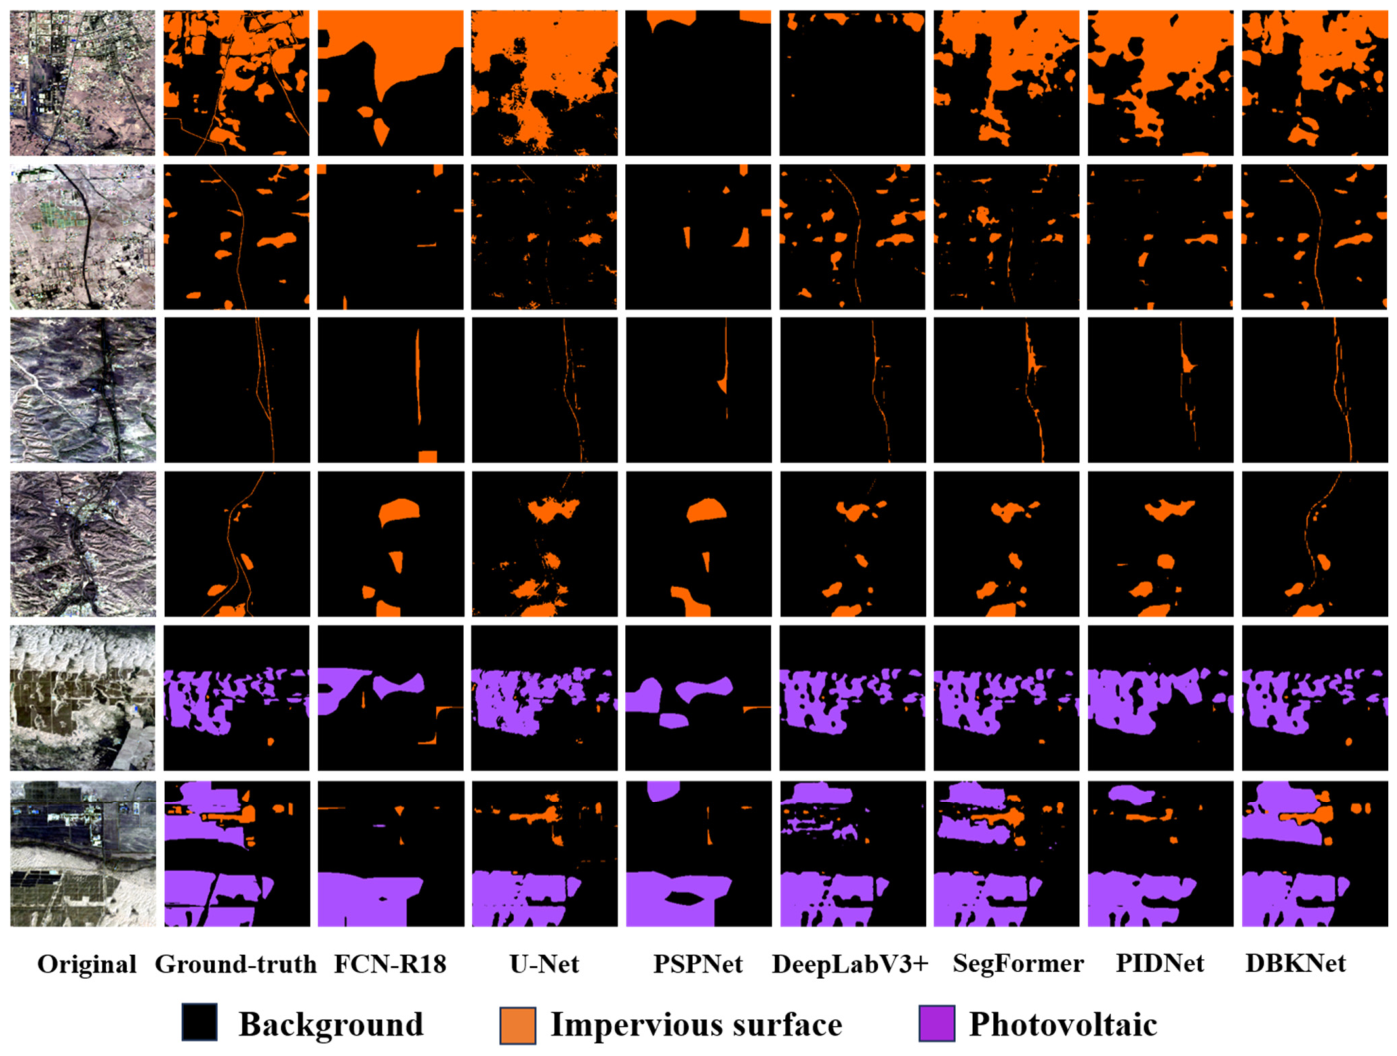
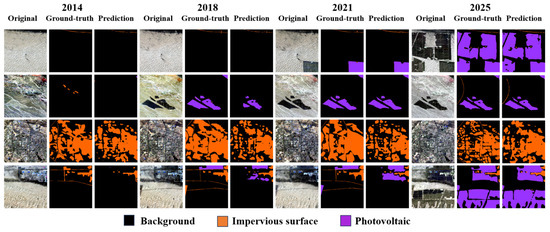
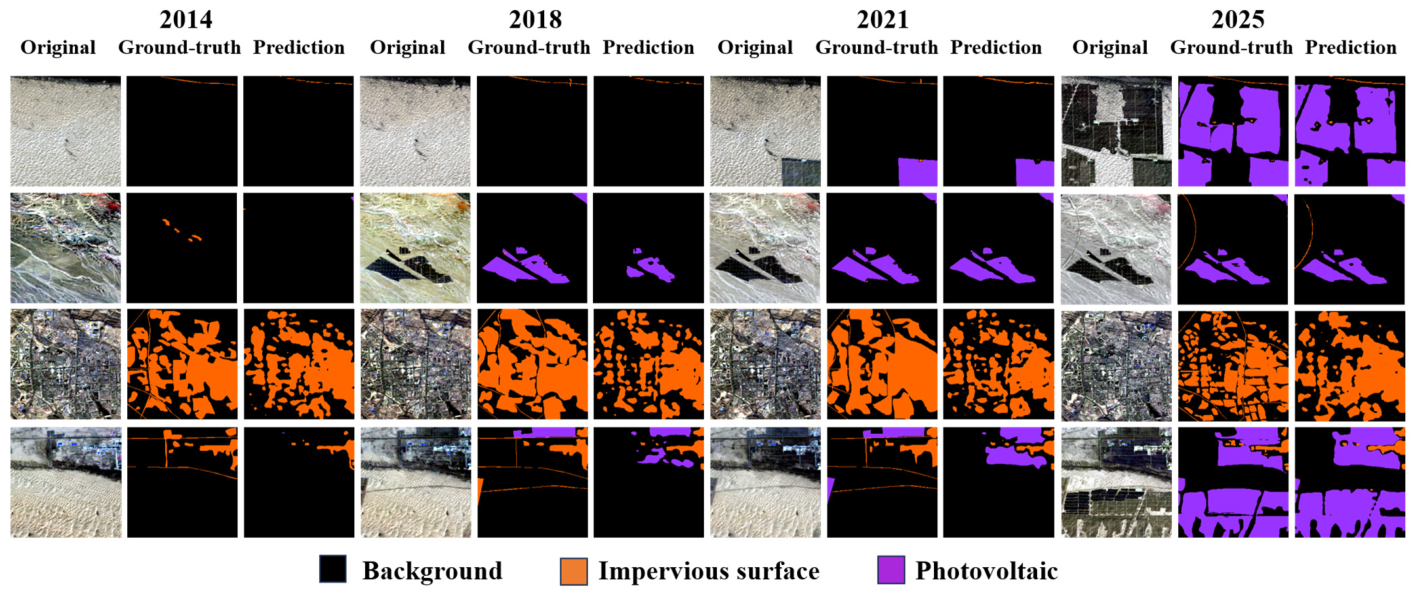
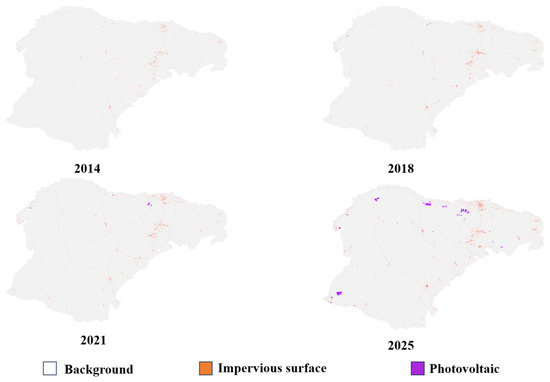
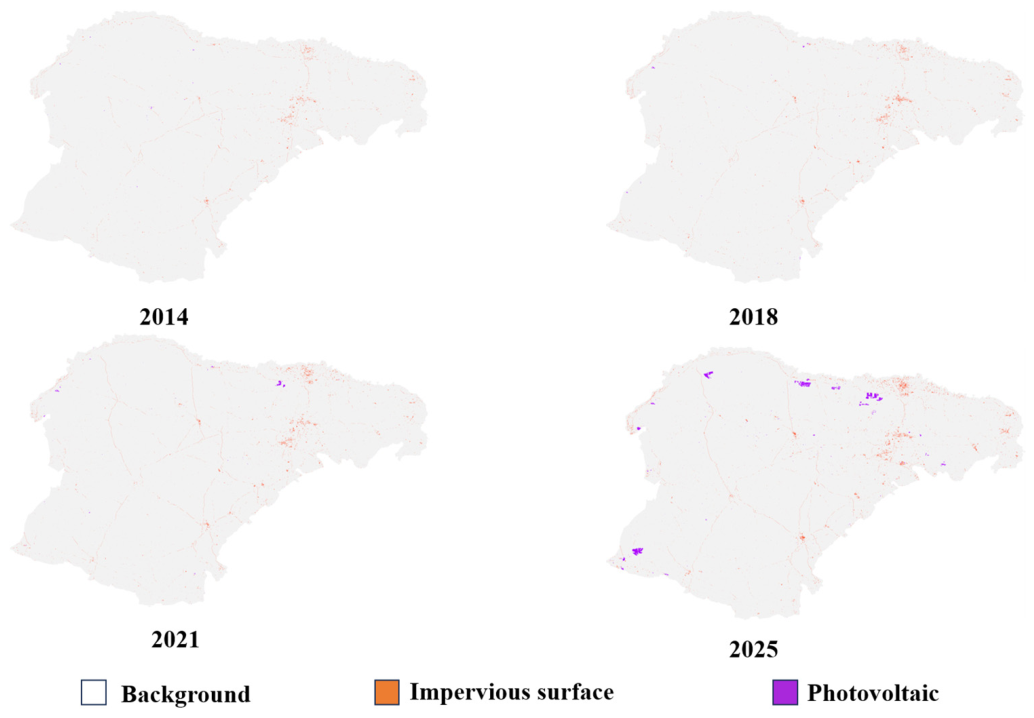
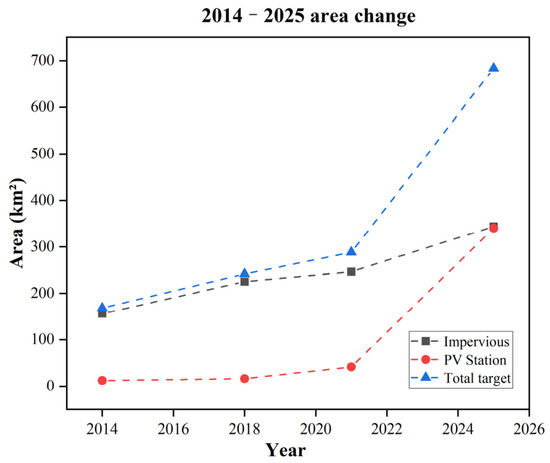
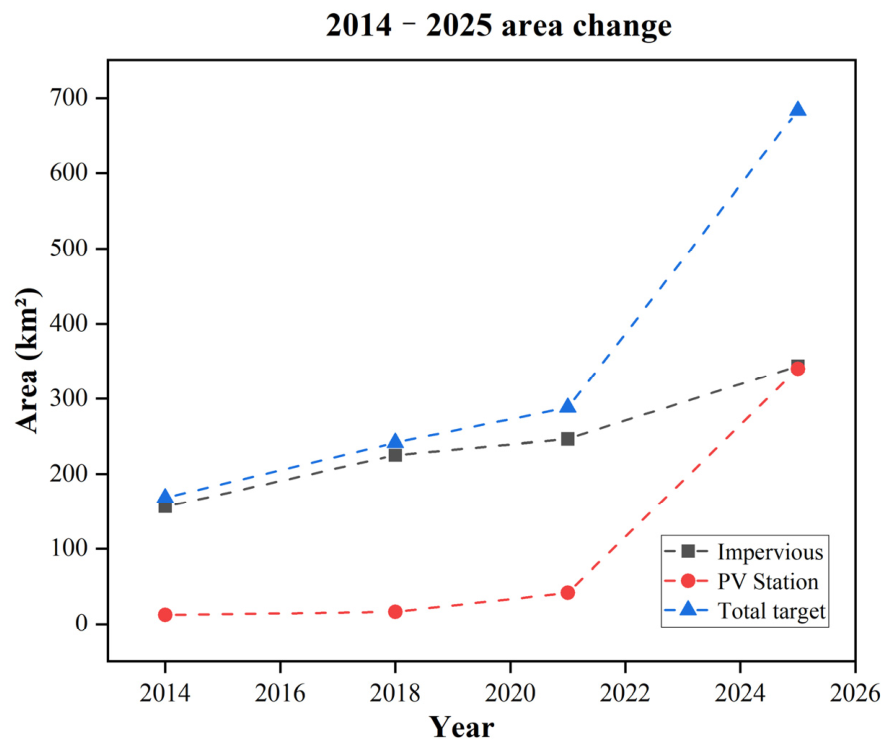

Disclaimer/Publisher’s Note: The statements, opinions and data contained in all publications are solely those of the individual author(s) and contributor(s) and not of MDPI and/or the editor(s). MDPI and/or the editor(s) disclaim responsibility for any injury to people or property resulting from any ideas, methods, instructions or products referred to in the content. |
© 2026 by the authors. Licensee MDPI, Basel, Switzerland. This article is an open access article distributed under the terms and conditions of the Creative Commons Attribution (CC BY) license.