1. Introduction
Hyperspectral and multispectral imaging have become essential tools in remote sensing applications such as environmental monitoring, precision agriculture, land cover mapping, mineral exploration, disaster assessment, and UAV-based sensing systems [
1,
2]. Unlike conventional RGB imaging, hyperspectral imaging captures hundreds of narrow and contiguous spectral bands, while multispectral imaging captures fewer but strategically selected spectral bands, enabling detailed spectral characterization of materials and objects. This spectral richness enables discrimination of land cover classes and environmental changes that are undetectable in conventional imagery, but often this is at the cost of high data dimensionality that strains pipelines [
3].
With the rapid development of lightweight sensors and UAV platforms, hyperspectral and multispectral systems are increasingly being deployed for real-time environmental monitoring tasks [
4,
5]. UAV-based spectral sensing offers high spatial resolution, flexible deployment, reduced operational costs, and improved accessibility in challenging environments such as forests, coastal zones [
6], and agricultural fields [
1]. These advantages are particularly valuable in ecologically sensitive habitats, such as the saltmarsh environments studied in this work, where timely and accurate decision-making is critical.
However, accurate classification of hyperspectral image (HSI) and multispectral image (MSI) data remains a challenging task due to high spectral dimensionality, strong inter-band correlation, limited labeled samples, and significant computational complexity. Traditional machine learning methods often suffer from the curse of dimensionality and limited generalization capability when dealing with high-dimensional spectral data [
7]. Deep learning methods, particularly convolutional neural networks (CNNs), have significantly improved classification performance by learning spatial-spectral representations automatically. Methods such as 2D-CNN, 3D-CNN, and HybridSN have demonstrated strong results in hyperspectral image classification tasks [
3,
8], but their parameter counts make them impractical for onboard UAV processors and TinyML platforms.
More recently, Vision Transformers (ViTs) have attracted considerable attention due to their ability to model long-range dependencies through self-attention mechanisms. Transformer-based methods such as SpectralFormer and lightweight ViTs have shown promising improvements over CNN-based methods by capturing global contextual information more effectively [
9,
10]. However, these models often require large parameter counts, high computational cost, and substantial memory resources, which make them difficult to deploy on edge devices and onboard UAV platforms. Capsule networks have also been explored for remote sensing classification due to their ability to preserve hierarchical relationships between features and improve representation learning. Nevertheless, traditional capsule architectures often introduce expensive routing mechanisms and increased computational burden, limiting their practicality for real-time deployment [
11].
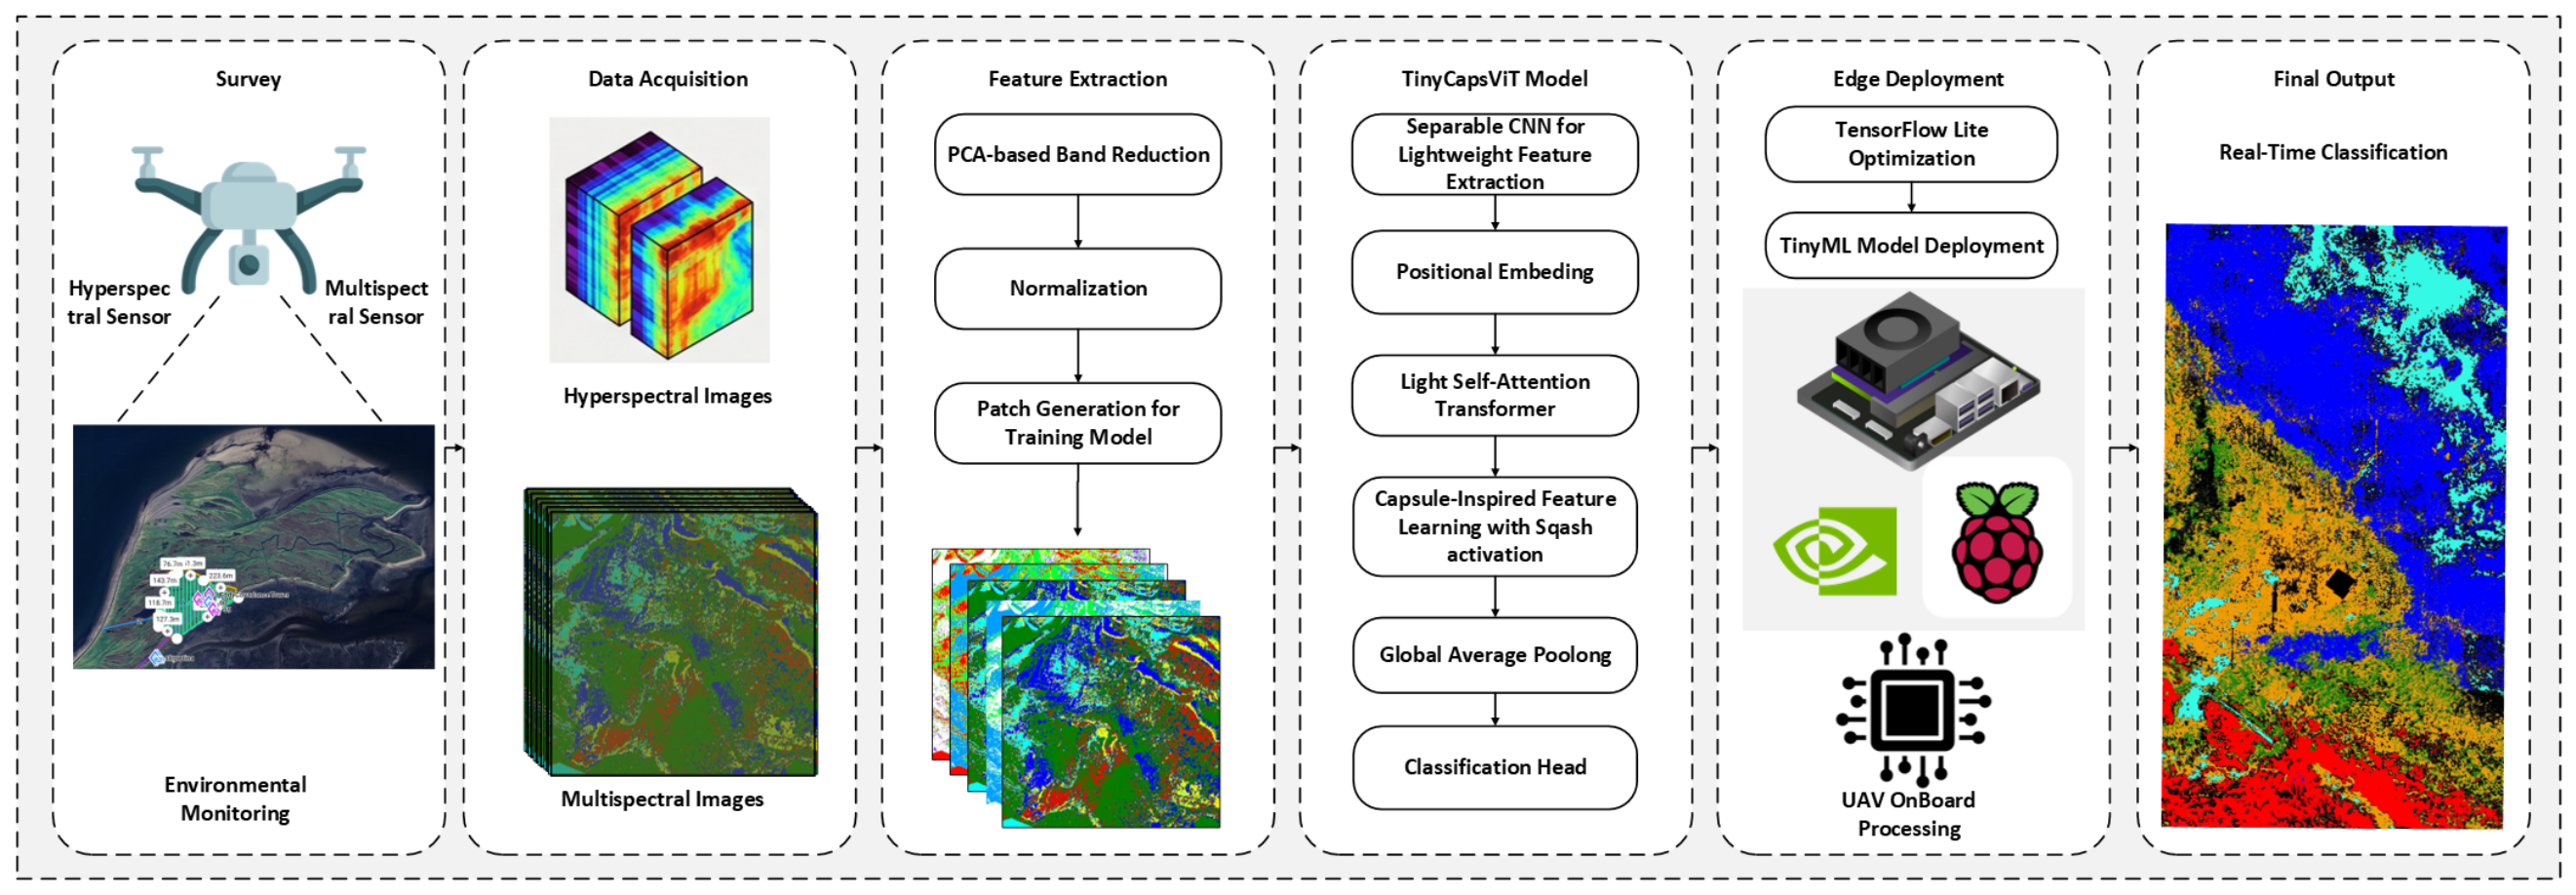
Inspired by the effectiveness of the previously proposed CrossCapsViT framework [
4], this work investigates how transformer-capsule architectures can be redesigned for ultra-low-resource TinyML deployment without sacrificing classification performance. This paper proposes TinyCapsViT, a lightweight Capsule Vision Transformer for hyperspectral and multispectral image classification under TinyML constraints. The proposed framework combines depthwise separable convolutions for efficient spatial–spectral feature extraction, learnable positional embeddings for spatial awareness, multi-head self-attention for global dependency modeling, and a capsule-inspired feature representation module with squash activation for enhanced discriminative learning. Global average pooling and a lightweight classification head further reduce model complexity and improve deployment feasibility. The complete overview of the proposed TinyCapsViT framework for efficient hyperspectral and multispectral classification in resource constrained edge devices for UAV based environmental monitoring has been depicted in the
Figure 1.
The main contributions of this paper are summarized as follows:
We propose TinyCapsViT, an ultra-lightweight vision transformer architecture that integrates efficient convolutional feature extraction, Lite Self-Attention, and a capsule-inspired refinement block for hyperspectral and multispectral image classification.
The proposed model achieves competitive classification performance using only 2781 trainable parameters, substantially reducing memory and computational requirements for TinyML deployment.
Extensive experiments on multiple public and custom benchmark datasets demonstrate the effectiveness of TinyCapsViT, including robustness evaluation under spectral corruption.
Real-world deployment and benchmarking on Raspberry Pi 3 and Jetson Xavier NX validate the practical suitability of the proposed model for resource-constrained edge computing applications.
The remainder of this paper is organized as follows.
Section 2 reviews existing studies on HSI/MSI classification, lightweight transformer architectures, and capsule-based learning approaches.
Section 3 describes the proposed TinyCapsViT framework in detail.
Section 4 presents the experimental setup, benchmark datasets, and comparative performance analysis.
Section 5 discusses the effectiveness, computational efficiency, and deployment suitability of the proposed model. Finally,
Section 6 concludes the paper and outlines future research directions.
3. Proposed Methodology
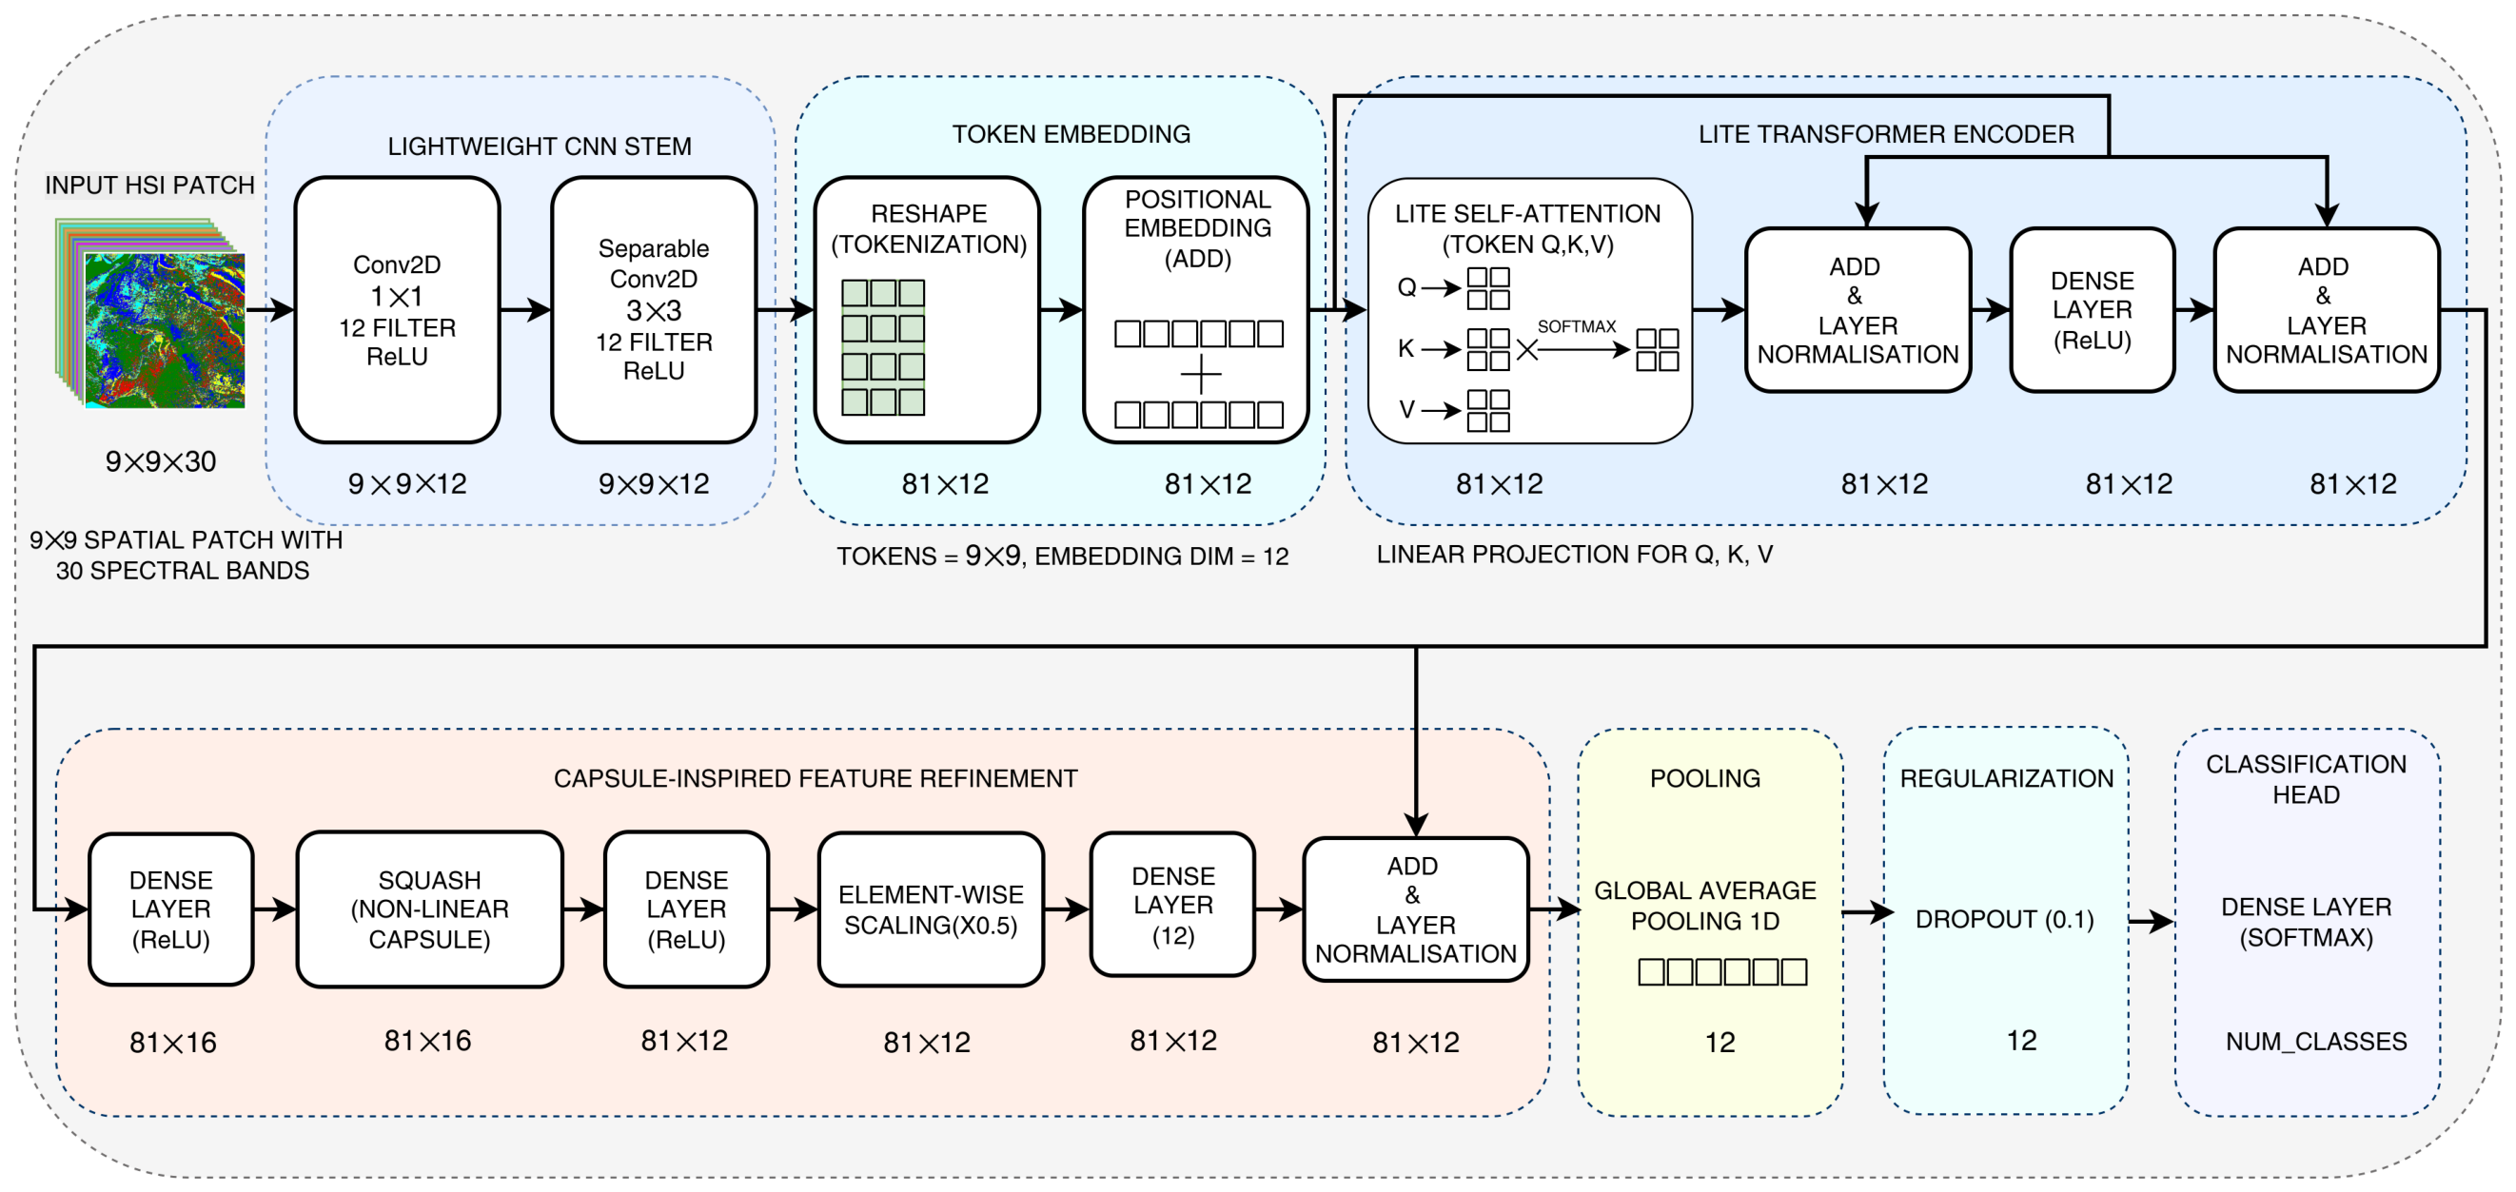
In this section, we present TinyCapsViT, an ultra-lightweight hybrid architecture designed for efficient hyperspectral image (HSI) or multispectral image classification. The proposed framework combines convolutional feature extraction, lightweight self-attention, and capsule-inspired representation learning to effectively model both local spectral–spatial patterns and global contextual dependencies. The architecture is specifically designed to minimize computational complexity while maintaining high classification accuracy, making it suitable for TinyML and edge deployment scenarios.
The overall pipeline consists of five major stages: spatial–spectral patch extraction, dimensionality reduction using Principal Component Analysis (PCA), data normalization, lightweight feature learning using the proposed TinyCapsViT architecture, and TensorFlow Lite (TFLite) deployment for real-time inference.
Figure 2 illustrates the complete framework of the proposed method.
3.1. Data Preprocessing
Hyperspectral and multispectral images contain rich spectral information distributed across multiple bands. To effectively utilize both spatial and spectral context, a patch-based learning strategy combined with dimensionality reduction is adopted.
Let the input data cube be represented as:
where
H and
W denote the spatial dimensions, and
B represents the number of spectral bands.
For each labeled pixel location
, a fixed-size spatial-spectral patch centered at the target pixel is extracted:
where
S denotes the patch size. In this work, a patch size of
is used, which provides a good balance between capturing local contextual information and maintaining computational efficiency.
Due to the high dimensionality and strong inter-band correlation in hyperspectral data, Principal Component Analysis (PCA) was employed as a dimensionality reduction technique to reduce the computational burden associated with high-dimensional hyperspectral data. Rather than selecting individual spectral bands, PCA projects the original spectral information into a lower-dimensional subspace while preserving the majority of data variance. This preprocessing step has been widely adopted in hyperspectral image classification because it significantly reduces memory requirements and inference cost, making it particularly suitable for resource-constrained TinyML deployments. Although dedicated band-selection methods preserve physically interpretable spectral bands, they typically require additional optimization procedures and are often dataset-specific. Since the primary objective of this work is the development of an efficient deployment-oriented classification architecture rather than optimal band selection, PCA provides a computationally efficient and widely accepted preprocessing strategy. The original spectral space is projected into a lower-dimensional subspace as:
where
W represents the projection matrix formed by the principal eigenvectors.
This transformation preserves the most informative spectral variance while significantly reducing computational complexity, memory usage, and model training time, making it suitable for resource-constrained TinyML deployment.
3.2. Data Normalization
After PCA, feature normalization is performed using standardization to stabilize training and improve convergence.
Each feature is normalized as:
where
and
represent the mean and standard deviation of each spectral feature, respectively.
This step ensures that all spectral features contribute equally during optimization.
3.3. TinyCapsViT Architecture
The proposed TinyCapsViT model combines lightweight convolutional feature extraction, efficient transformer-based global context modeling, and capsule-inspired discriminative representation learning within a compact architecture optimized for TinyML and edge deployment.
3.3.1. Lightweight CNN Stem
Let the input hyperspectral patch as
. Due to the high spectral redundancy in HSI data, directly processing all bands is computationally expensive. To address this, we first apply a pointwise convolution:
which performs channel-wise projection and reduces spectral redundancy while preserving essential information. Next, a depthwise separable convolution is employed:
to efficiently capture local spatial context with significantly fewer parameters compared to standard convolutions. This lightweight CNN stem forms an efficient spectral–spatial feature extractor.
3.3.2. Tokenization and Positional Encoding
The feature map
is reshaped into a sequence of tokens:
where each token corresponds to a spatial location with embedded spectral features.
To preserve spatial relationships, a learnable positional embedding
is added:
Unlike fixed sinusoidal encodings, learnable embeddings adapt to dataset-specific spatial structures.
3.3.3. Lite Self-Attention Module
To efficiently capture global contextual dependencies in hyperspectral data, a lightweight self-attention mechanism is employed. Unlike conventional multi-head attention, which introduces significant computational overhead, the proposed module adopts a simplified single-attention design to reduce parameter complexity while preserving global feature interaction.
Given the token representation
, where
N denotes the number of tokens and
d represents the embedding dimension, linear projections are first applied to generate the query, key, and value matrices:
where
,
, and
are trainable projection matrices.
The attention map is computed using scaled dot-product attention:
where the scaling factor
stabilizes gradient propagation and prevents excessively large attention scores.
The refined feature representation is obtained by:
To improve optimization stability and feature preservation, a residual connection followed by layer normalization is applied:
The proposed Lite Self-Attention module enables effective modeling of long-range spectral–spatial relationships while maintaining low computational and memory requirements. This makes the architecture particularly suitable for TinyML and resource-constrained edge deployment scenarios.
3.3.4. Lightweight Feed-Forward Network
A compact feed-forward network (FFN) is used for feature transformation:
This single-layer FFN reduces parameter count while maintaining sufficient representational capacity.
3.3.5. Capsule-Inspired Feature Refinement
To improve discriminative representation learning, a capsule-inspired refinement block is introduced after the lightweight feed-forward stage. Unlike conventional dense transformations, the proposed module preserves feature orientation information while suppressing insignificant activations, enabling improved class separability with minimal computational overhead.
Given the intermediate feature representation
, the features are first projected into a higher-dimensional latent space
.
where
denotes the trainable projection matrix, and
represents the ReLU activation function.
To normalize feature vectors while preserving directional information, a squash nonlinearity is applied.
The squash function constrains vector magnitudes to the range
, allowing strongly activated features to retain higher importance while suppressing weaker responses. This improves representation robustness and enhances inter-class discrimination. The refined capsule representation is then projected back to the embedding dimension
.
where
denotes the reconstruction projection matrix.
Finally, residual scaling and layer normalization are applied to stabilize feature learning and improve optimization. The residual scaling factor
is empirically set to
to regulate feature propagation and prevent over-amplification of capsule responses.
Compared to traditional capsule networks that rely on computationally expensive dynamic routing, the proposed capsule-inspired refinement block provides lightweight discriminative feature enhancement with significantly lower parameter and computational complexity, making it suitable for TinyML and edge-oriented hyperspectral image classification.
3.3.6. Classification Head
After feature refinement, global feature aggregation is performed using Global Average Pooling (GAP) to obtain a compact representation of the input hyperspectral patch:
where
represents the aggregated feature vector, and
d denotes the embedding dimension.
The pooled representation is then passed through a dropout layer to reduce overfitting and improve generalization capability during training. Finally, a fully connected classification layer followed by the Softmax activation function produces the class probability distribution:
where
denotes the trainable classification weight matrix, and
represents the predicted probability vector over all classes.
The use of global average pooling significantly reduces the number of trainable parameters compared to conventional fully connected feature flattening, thereby improving computational efficiency and making the proposed architecture more suitable for TinyML and edge deployment scenarios.
3.4. Computational Efficiency
The proposed TinyCapsViT model contains approximately 2.8K parameters, making it significantly more efficient than conventional CNN and transformer-based models. The use of depthwise separable convolutions, lightweight attention, and compact capsule refinement ensures minimal memory footprint and computational cost, enabling deployment on edge devices and TinyML platforms without sacrificing performance.
4. Experimental Results
This section explores the experimental results of the proposed TinyCapsViT model for hyperspectral image classification. The model is evaluated in terms of classification performance, computational efficiency, and deployment feasibility under TinyML constraints. Comparative analysis is conducted against widely used baseline models including CNN, 3D-CNN, ResNet, and Vision Transformer (ViT) using identical preprocessing, training, and testing settings.
4.1. Experimental Setup
Experiments were conducted on five publicly available hyperspectral benchmark datasets
Table 1, namely Pavia University (PaviaU), Salinas Valley, Houston University 2013 (Houston), Kennedy Space Center (KSC), and Indian Pines, together with a custom UAV-acquired hyperspectral dataset collected at the Derrymore Saltmarsh site. The custom dataset was acquired using a Resonon Pika-L hyperspectral sensor [
30] mounted on a DJI Matrice 300 (M300) UAV platform [
31]. Further details regarding the hardware configuration, data acquisition, preprocessing, and ground-truth generation of the Derrymore dataset are provided in our previous work [
4].
A patch-based learning strategy with a spatial patch size of was adopted consistently across all evaluated models. Principal Component Analysis (PCA) was employed for spectral dimensionality reduction, followed by feature standardization.
To ensure a fair comparison, all models were evaluated using the same experimental protocol. A total of 100 training samples per class were randomly selected for model training, while identical train–validation–test splits, preprocessing procedures, batch size, optimizer settings, and evaluation metrics were used across all models. The models were trained using the Adam optimizer with categorical cross-entropy loss, with early stopping employed to mitigate overfitting. For deployment evaluation, the trained models were converted to TensorFlow Lite (TFLite), and post-training quantization was applied prior to benchmarking on the target edge platforms.
4.2. Derrymore Saltmarsh Dataset
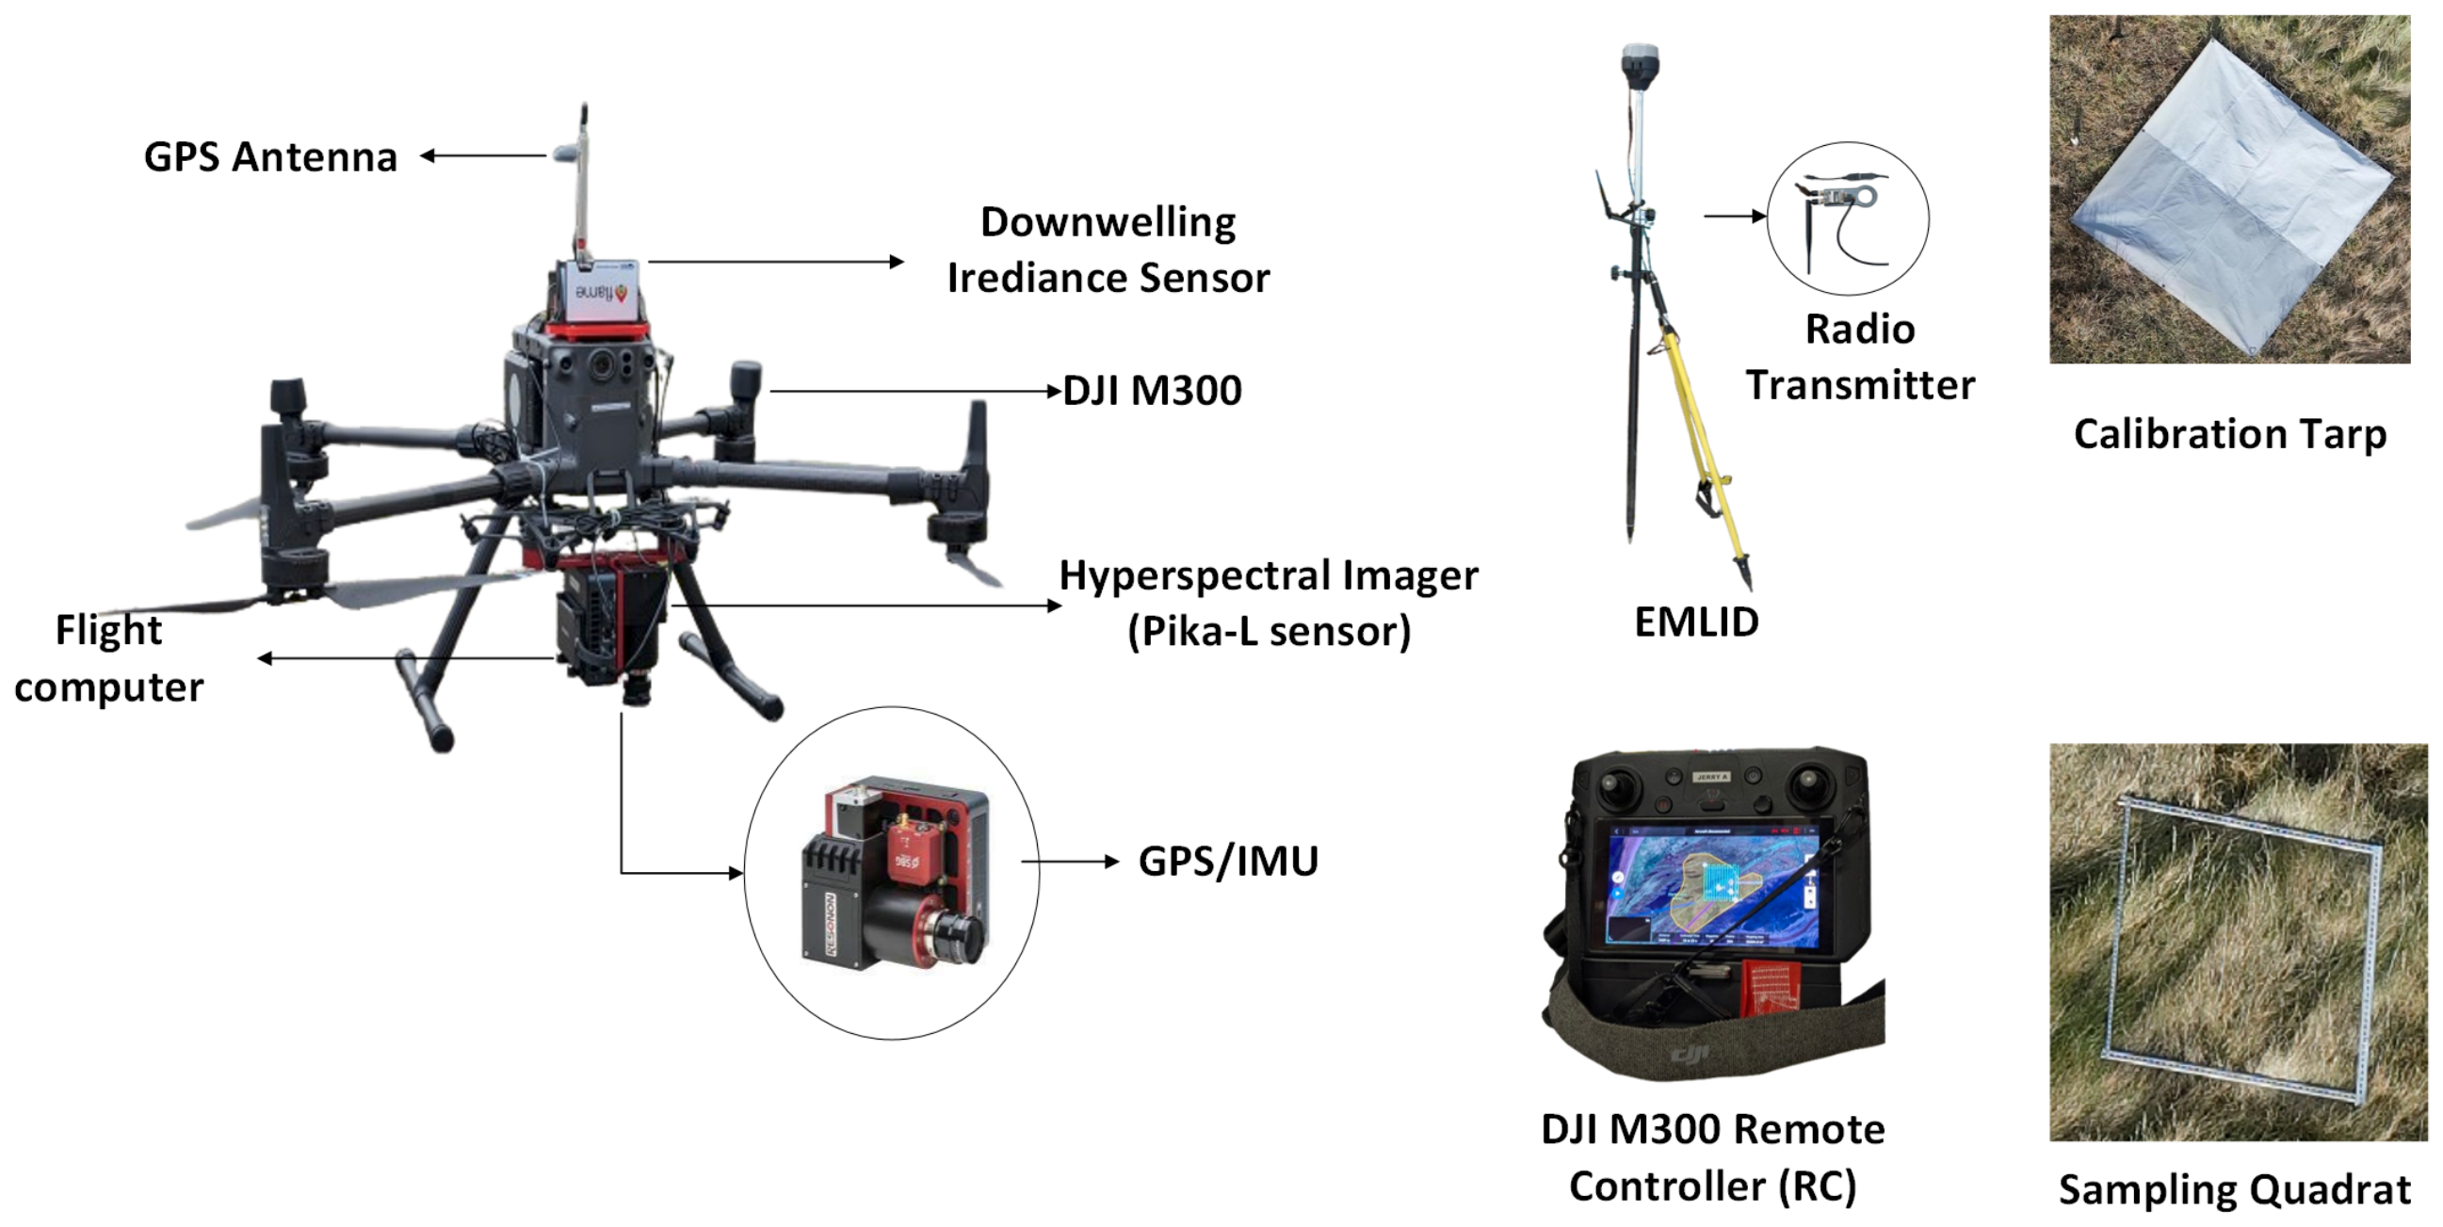
The Derrymore Saltmarsh dataset was acquired using a UAV-based hyperspectral imaging platform comprising a DJI Matrice 300 UAV and a Pika L hyperspectral sensor as in
Figure 3. The dataset contains four annotated land-cover classes and was collected over the Derrymore Saltmarsh site in County Kerry, Ireland. Comprehensive details of the hardware configuration, flight campaign, data preprocessing, and ground-truth generation can be found in our previous CrossCapsViT study [
4]. The same dataset is used in this work to assess the classification performance and deployment efficiency of TinyCapsViT.
4.3. Evaluation Metrics
The performance of all models was evaluated using standard classification metrics including Overall Accuracy (OA), Cohen’s Kappa coefficient, model parameter count, model size, and inference latency.
Overall Accuracy is computed as:
where
represents the number of correctly classified samples, and
denotes the total number of test samples.
The Kappa coefficient is used to measure classification agreement beyond random chance and is defined as:
where
is the observed agreement, and
is the expected agreement.
To evaluate the computational efficiency of the proposed model for TinyML and edge deployment, inference latency (Latency) is measured as the average time required to process a single input sample.
where
denotes the total inference time for processing
N samples. The latency is reported in milliseconds (ms/sample) and measured under identical hardware and software conditions to ensure fair comparison across models.
In addition to latency, model complexity is evaluated using the total number of trainable parameters
.
where
represents the number of parameters in the
l-th layer, and
L denotes the total number of layers.
These metrics collectively provide a comprehensive evaluation of classification performance, computational efficiency, and deployment suitability of the proposed TinyCapsViT framework.
4.4. Training Convergence Analysis
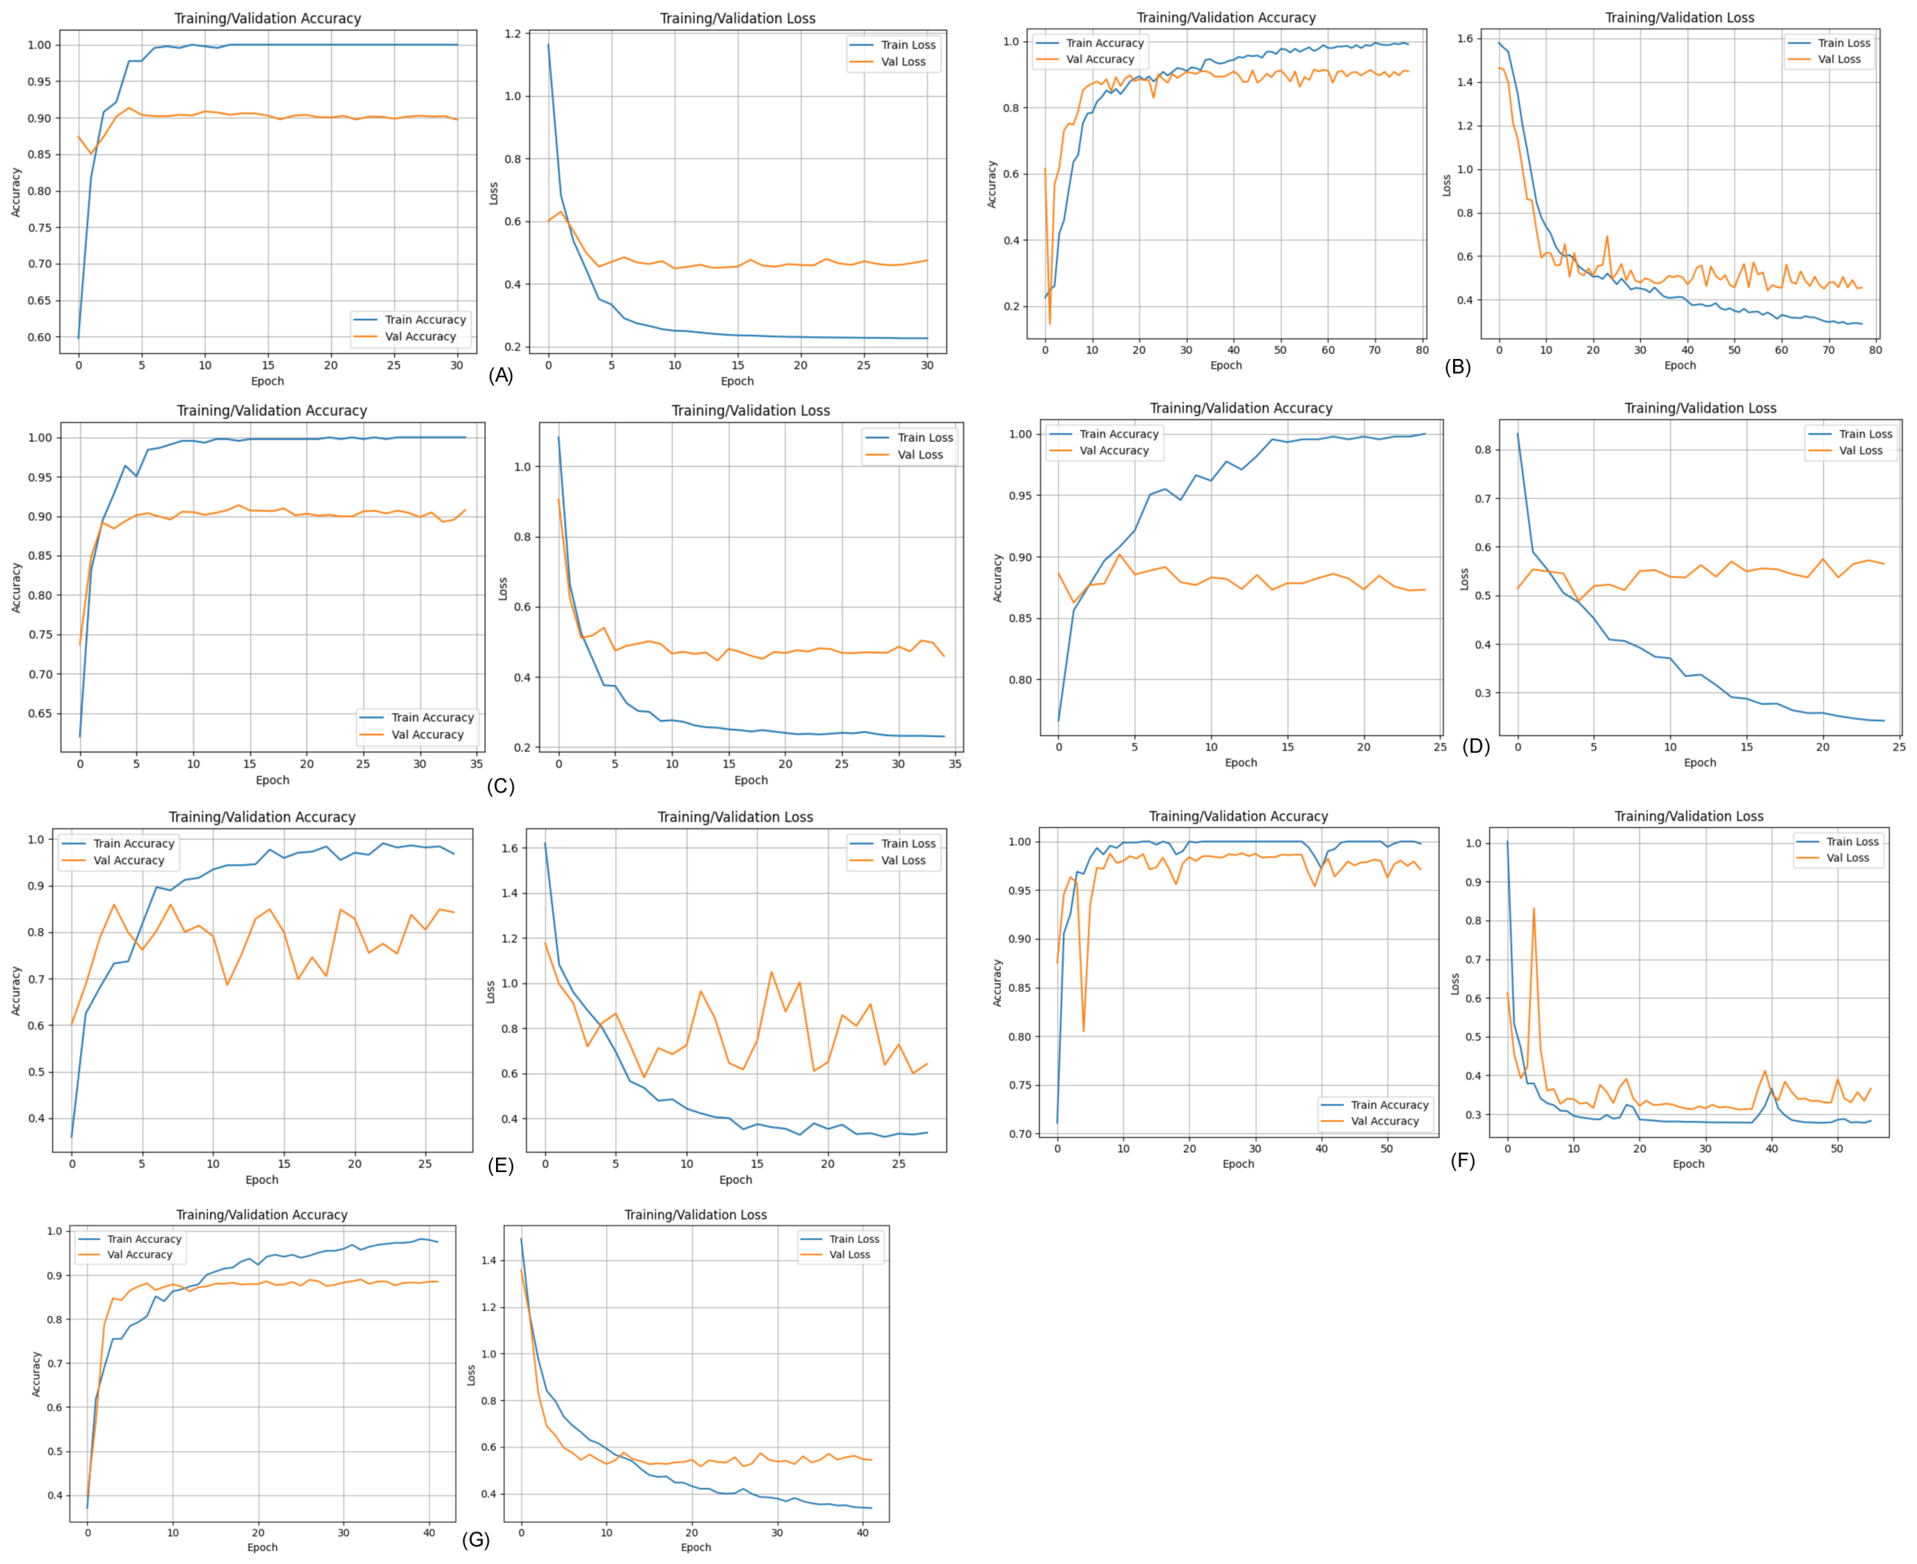
Figure 4 presents the training and validation convergence behavior of CNN, 3D-CNN, ResNet, ViT, SSFTTNet, BioLiteNet, and the proposed TinyCapsViT on the Pavia University dataset. The corresponding accuracy and loss curves provide insight into the optimization stability and generalization behavior of the different architectures. Overall, all models show successful optimization, although noticeable differences can be observed in the gap between training and validation performance.
The CNN model in
Figure 4A exhibits rapid convergence, reaching nearly 100% training accuracy within the early training epochs. The validation accuracy stabilizes at approximately 90–91%, while the training and validation losses converge to approximately 0.24 and 0.45, respectively. The persistent gap between training and validation performance indicates moderate overfitting, although the validation behavior remains relatively stable.
The 3D-CNN model shown in
Figure 4B demonstrates a more gradual convergence pattern. Its training accuracy progressively approaches 98–99%, whereas the validation accuracy remains around 90%. Similarly, the training loss continuously decreases while the validation loss stabilizes at a higher level with moderate fluctuations. This behavior indicates a degree of overfitting despite relatively stable classification performance.
As illustrated in
Figure 4C, ResNet converges rapidly and achieves nearly 100% training accuracy, with validation accuracy stabilizing at approximately 90–91%. The training and validation losses converge to approximately 0.24 and 0.48, respectively. Compared with the other conventional CNN-based architectures, ResNet exhibits relatively smooth and consistent convergence.
The ViT model in
Figure 4D also reaches nearly 100% training accuracy; however, its validation accuracy remains around 88–89%. A progressively increasing separation between the training and validation losses is observed during training, with final values of approximately 0.24 and 0.55, respectively. This indicates a stronger tendency toward overfitting, suggesting that the transformer architecture is more sensitive to the available training samples.
BioLiteNet [
36], presented in
Figure 4E, achieves approximately 98–99% training accuracy, while its validation accuracy fluctuates between approximately 83% and 85% toward the later training epochs. The corresponding training loss decreases to approximately 0.34, whereas the validation loss remains considerably higher and exhibits noticeable fluctuations. These results indicate a larger training–validation gap and reduced generalization stability.
In contrast, SSFTTNet in
Figure 4F demonstrates strong convergence behavior. The model reaches nearly 100% training accuracy while maintaining validation accuracy of approximately 97–98%. Its training and validation losses stabilize at approximately 0.28 and 0.34, respectively, with only occasional fluctuations in the validation curves. This indicates strong optimization behavior and a comparatively small training–validation gap.
The proposed TinyCapsViT model, shown in
Figure 4G, progressively converges to approximately 99% training accuracy while maintaining validation accuracy of approximately 89–90%. The training and validation losses stabilize at approximately 0.35 and 0.52, respectively. Although its validation performance does not exceed the higher-capacity models, TinyCapsViT achieves stable convergence using a substantially smaller architecture. This behavior reflects the intended accuracy–efficiency trade-off of the proposed model, where a modest reduction in classification performance is accepted in exchange for significantly lower model complexity and improved suitability for resource-constrained deployment.
The convergence characteristics are summarized in
Table 2. The results demonstrate that larger and more complex architectures generally achieve high training accuracy but may exhibit varying degrees of overfitting. In comparison, TinyCapsViT maintains competitive validation performance while operating with substantially fewer trainable parameters. Therefore, the primary advantage of TinyCapsViT lies not in achieving the highest classification accuracy, but in providing a practical balance among classification performance, model complexity, and deployment efficiency for TinyML-based hyperspectral image classification.
4.5. Classification Performance Evaluation
The classification performance of the evaluated models across five public benchmark datasets and the custom Derrymore dataset is summarized in
Table 3. Overall, all architectures achieve strong classification performance on most datasets, although differences are observed across datasets and model complexities. ResNet provides the strongest overall performance, achieving the highest OA on PaviaU (99.29%), Salinas (99.38%), Indian Pines (98.18%), and Derrymore (90.50%). On the Houston dataset, CNN, 3D-CNN, and ResNet achieve an OA of 100%, while SSFTTNet achieves 100% OA on KSC.
The conventional CNN-based architectures remain highly competitive. CNN achieves OA values above 97% on all public datasets, while 3D-CNN performs strongly on PaviaU, Houston, and Salinas but shows a comparatively lower OA of 93.91% on Indian Pines. ViT also demonstrates competitive performance, particularly on Houston, KSC, and Salinas, although its accuracy decreases to 95.75% on Indian Pines and 89.33% on Derrymore.
The additional lightweight HSI-specific baselines further demonstrate the effectiveness of compact architectures for spectral–spatial classification. SSFTTNet achieves strong performance across the public benchmarks, including 100% OA on KSC, 99.76% on Houston, and 98.66% on Salinas. It also obtains 97.23% on Indian Pines and 89.46% on Derrymore. BioLiteNet achieves 99.92% OA on KSC and 99.53% on Houston, but its performance decreases on Salinas (96.17%) and Derrymore (86.08%), indicating greater variation in classification performance across datasets.
The proposed TinyCapsViT achieves 98.50% OA on PaviaU, 99.61% on Houston, 99.19% on KSC, and 98.44% on Salinas. Its performance decreases to 92.03% on Indian Pines and 89.00% on the Derrymore dataset. Therefore, TinyCapsViT does not consistently match or exceed the classification accuracy of higher-capacity architectures or all lightweight baselines. Instead, the proposed model is designed to achieve a practical trade-off between classification performance and computational efficiency. With only 2781 trainable parameters, TinyCapsViT maintains competitive performance on several benchmark datasets while substantially reducing model complexity and memory requirements.
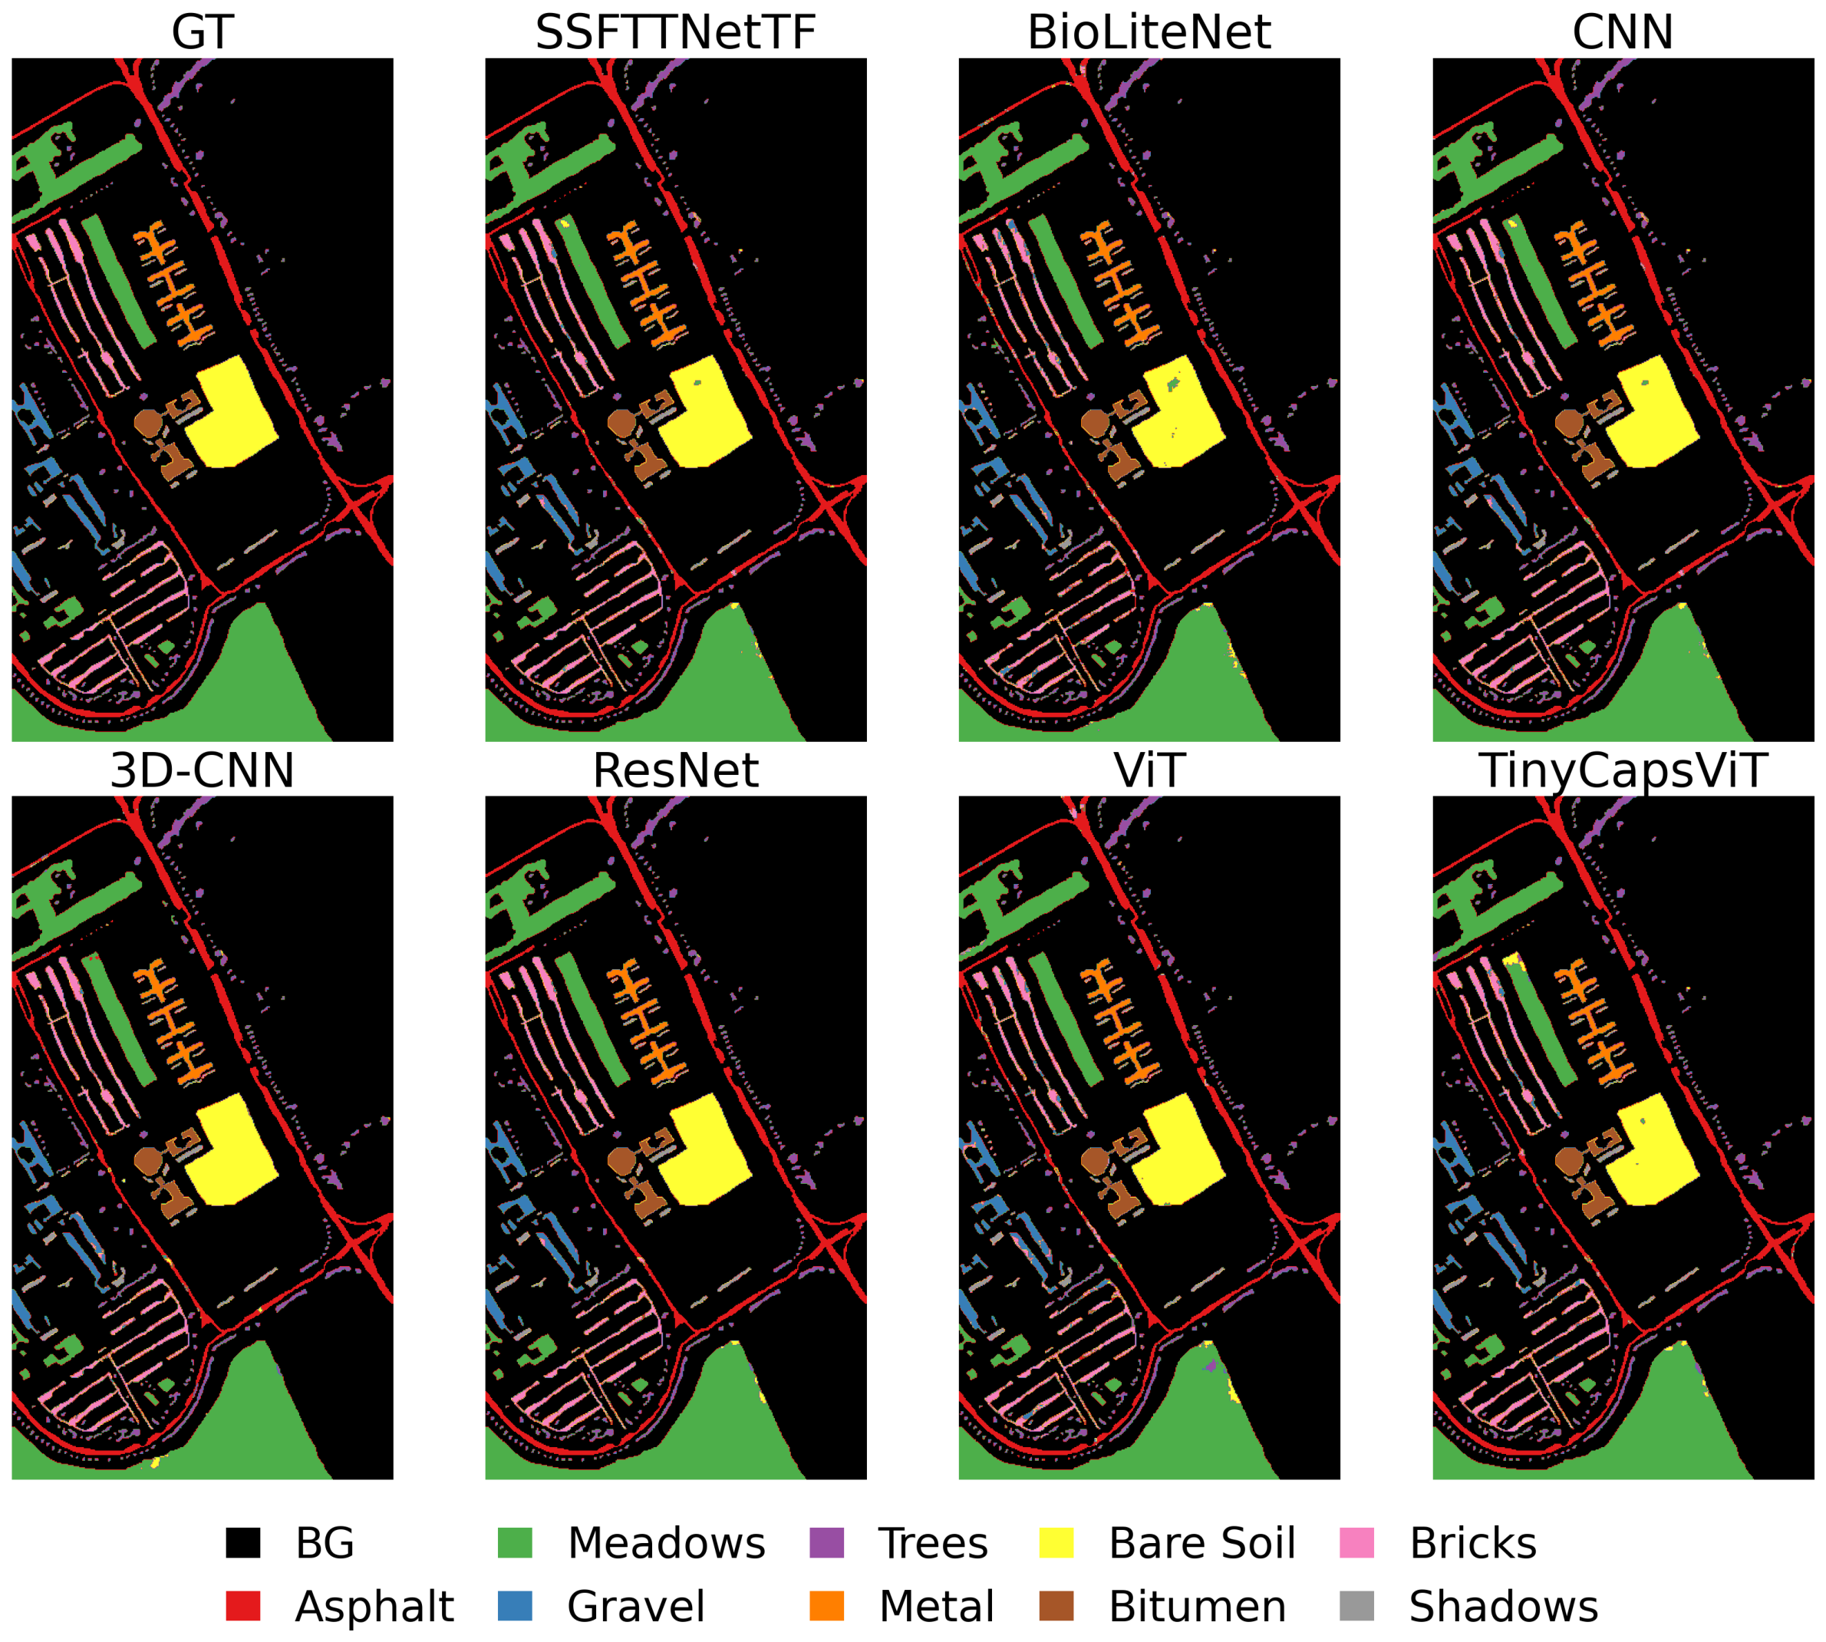
The qualitative classification maps in
Figure 5 further illustrate the spatial classification behavior of the evaluated models on the Pavia University dataset. The models generally preserve the major spatial structures and land-cover regions present in the ground truth, while differences are observed primarily around class boundaries and heterogeneous regions. TinyCapsViT retains the principal spatial structures despite its substantially reduced architecture. Together with the quantitative results, these observations demonstrate that TinyCapsViT intentionally trades a modest amount of classification accuracy for substantial reductions in model complexity, supporting its intended use in resource-constrained TinyML and edge-based hyperspectral image classification applications.
4.6. Feature Representation Analysis
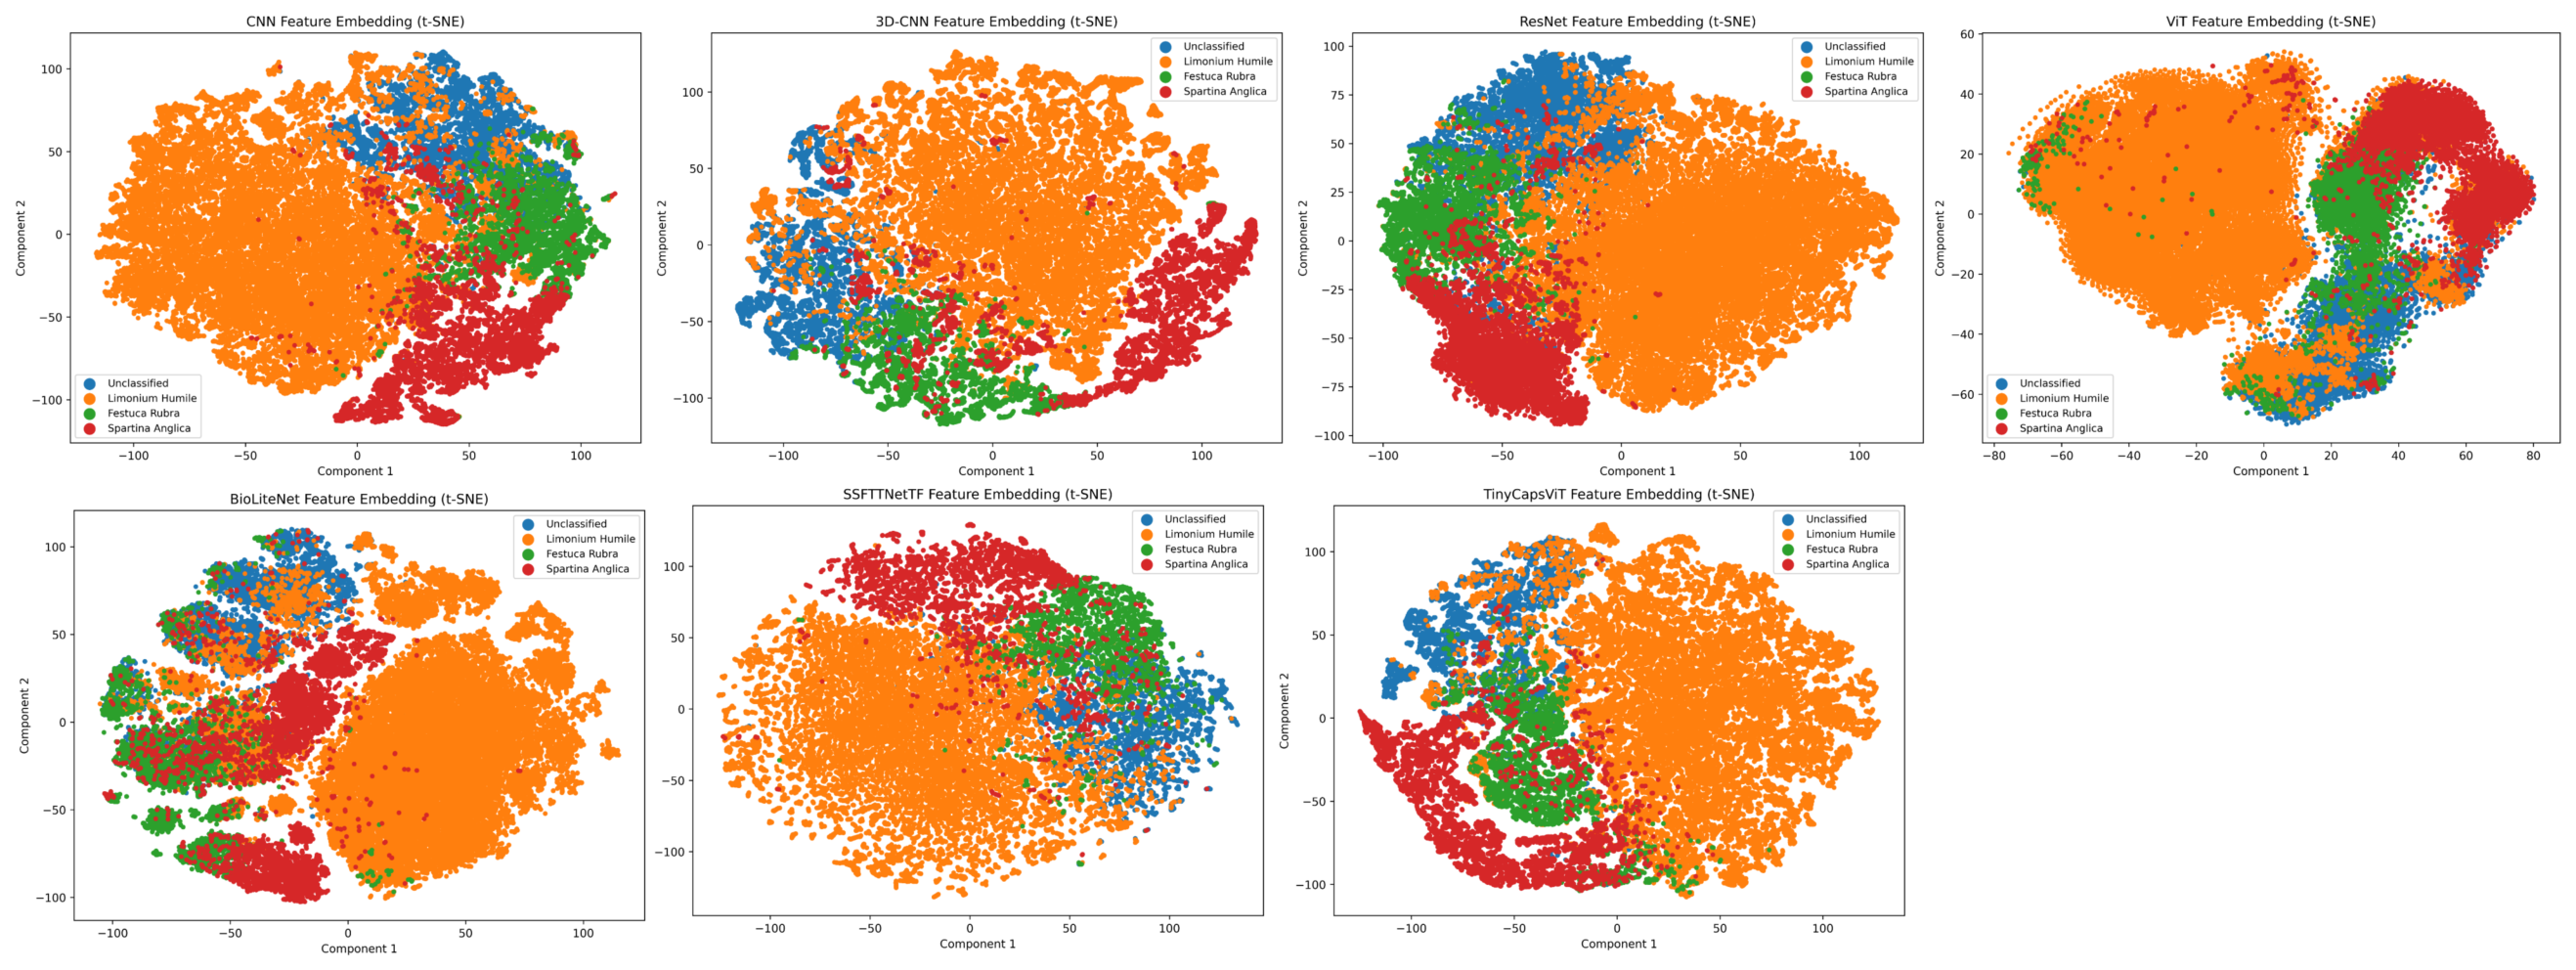
The quality of the learned feature representations is evaluated using t-SNE visualization, as shown in
Figure 6. To complement the qualitative analysis,
Table 4 reports the Silhouette score, Davies–Bouldin Index (DBI), Calinski–Harabasz Index (CHI), intra-class distance, inter-class distance, and k-nearest neighbour (kNN) classification accuracy. Collectively, these metrics provide insight into the compactness, separability, and discriminative capability of the feature embeddings produced by each architecture.
Among the evaluated models, ResNet exhibits the strongest overall cluster structure, achieving the highest Silhouette score (0.2278), the lowest DBI (0.9175), and the highest CHI (24,909.40). These results indicate relatively compact and well-separated feature distributions and are consistent with its strong classification performance. CNN also produces well-structured embeddings, with a Silhouette score of 0.1887, DBI of 0.9490, and kNN accuracy of 0.9362. In contrast, 3D-CNN achieves the highest inter-class distance (103.32) and the highest kNN accuracy (0.9464), demonstrating strong class discrimination, although its higher intra-class distance (47.13) and DBI (1.1810) indicate comparatively less compact clusters.
ViT produces highly compact feature representations, achieving the lowest intra-class distance of 22.98 and a relatively high Silhouette score of 0.2177. However, its inter-class distance is the lowest among the evaluated models at 52.54, resulting in a comparatively lower kNN accuracy of 0.9052. This indicates that although the individual class distributions are compact, the separation between different class clusters is comparatively limited.
The lightweight HSI-specific architectures exhibit different feature-space characteristics. SSFTTNet achieves a Silhouette score of 0.1683, an inter-class distance of 90.38, and a high kNN accuracy of 0.9437. These results indicate effective class discrimination, although its DBI of 1.2102 suggests lower cluster compactness than ResNet and CNN. BioLiteNet exhibits comparatively weaker cluster separation, with the lowest Silhouette score of 0.1144 and the highest DBI of 1.7645. Its inter-class distance of 75.95 and kNN accuracy of 0.9109 further indicate reduced feature-space separability compared with SSFTTNet.
The proposed TinyCapsViT achieves a Silhouette score of 0.1442, DBI of 1.5992, intra-class distance of 43.30, and inter-class distance of 86.37, resulting in a competitive kNN accuracy of 0.9249. Although these feature-space metrics do not exceed those of the higher-capacity ResNet or SSFTTNet, TinyCapsViT maintains meaningful class separability and structured feature representations with a substantially smaller architecture. This reflects the intended accuracy–efficiency trade-off of the proposed model, where competitive discriminative capability is retained while substantially reducing model complexity for resource-constrained deployment.
The quantitative results in
Table 4 and the visual distributions in
Figure 6 demonstrate distinct feature-learning characteristics among the evaluated architectures. ResNet provides the strongest overall cluster quality, while 3D-CNN achieves the highest inter-class separation and kNN accuracy. SSFTTNet also demonstrates strong discriminative feature learning among the lightweight comparison models. Although TinyCapsViT does not achieve the best individual feature-space metric, it preserves competitive class discrimination while operating with substantially reduced computational and memory requirements. These findings further support the suitability of TinyCapsViT for resource-constrained hyperspectral image classification, where the balance between feature discrimination and computational efficiency is an important design consideration.
4.7. Complexity Analysis and Deployment Evaluation
The computational complexity of the evaluated models is compared in
Table 5 in terms of trainable parameters, model size, MFLOPs, and inference latency. The results demonstrate substantial differences in computational requirements among the evaluated architectures. SSFTTNet has the highest parameter count with 177,213 parameters, followed by ViT and ResNet with 85,509 and 85,029 parameters, respectively. BioLiteNet contains 38,885 parameters, while CNN and 3D-CNN require 31,653 and 26,533 parameters, respectively.
In comparison, the proposed TinyCapsViT requires only 2781 trainable parameters, representing approximately 11.4× and 9.5× fewer parameters than CNN and 3D-CNN, respectively, and more than 30× fewer parameters than ResNet and ViT. TinyCapsViT also achieves the smallest model size of 0.1431 MB and the lowest computational complexity of 0.633 MFLOPs. This substantial reduction in model complexity is particularly important for resource-constrained edge devices, where memory availability and computational capacity are limited. Although the measured inference latency of 65.64 ms is comparable to CNN, 3D-CNN, and ResNet, the considerably smaller parameter count and computational requirement demonstrate the lightweight characteristics of the proposed architecture.
To further investigate practical deployment performance, all models were converted to TensorFlow Lite (TFLite) and evaluated on the PaviaU dataset. The results are reported in
Table 6. The TFLite evaluation considers classification accuracy, Kappa coefficient, compressed model size, and inference latency, providing a practical assessment of the suitability of each architecture for resource-constrained deployment.
As shown in
Table 6, BioLiteNet achieves the highest TFLite classification accuracy of 97.06% and the highest Kappa coefficient of 0.9608, while SSFTTNet achieves 90.36% accuracy with a Kappa coefficient of 0.8720. However, these models require larger TFLite model sizes of 0.0648 MB and 0.2057 MB and exhibit inference latencies of 25.34 ms and 34.84 ms, respectively. ResNet achieves 88.75% accuracy with a Kappa coefficient of 0.8519 and a model size of 0.0945 MB.
TinyCapsViT achieves 88.85% classification accuracy and a Kappa coefficient of 0.8519 with a compact TFLite model size of only 0.0388 MB. Although CNN and 3D-CNN provide smaller inference latencies of 0.05 ms and 0.09 ms, respectively, their classification accuracies are lower at 84.20% and 84.87%. TinyCapsViT also achieves a lower deployment latency than the transformer-based ViT, BioLiteNet, and SSFTTNet models. In particular, its 0.312 ms inference latency is lower than ViT (10.88 ms), BioLiteNet (25.34 ms), and SSFTTNet (34.84 ms).
The results demonstrate that no single architecture provides the best performance across all deployment metrics. BioLiteNet achieves the highest TFLite classification accuracy, whereas CNN and 3D-CNN provide the lowest inference latencies. In contrast, TinyCapsViT combines competitive classification accuracy with a small memory footprint, low computational complexity, and practical inference latency. These characteristics demonstrate the intended accuracy–efficiency trade-off of TinyCapsViT and support its suitability for resource-constrained TinyML and edge-based hyperspectral image classification applications.
4.8. Robustness Analysis
To evaluate the reliability of the models under degraded input conditions, robustness experiments were conducted using Gaussian noise perturbation and spectral corruption. The analysis includes CNN, 3D-CNN, ResNet, ViT, BioLiteNet, SSFTTNet, and the proposed TinyCapsViT across the six evaluated datasets. Gaussian noise was introduced at four levels (
and
), while spectral corruption was evaluated at levels of 0.05, 0.1, 0.2, and 0.3. The average classification accuracies across these perturbation levels are reported in
Table 7 and
Table 8, respectively.
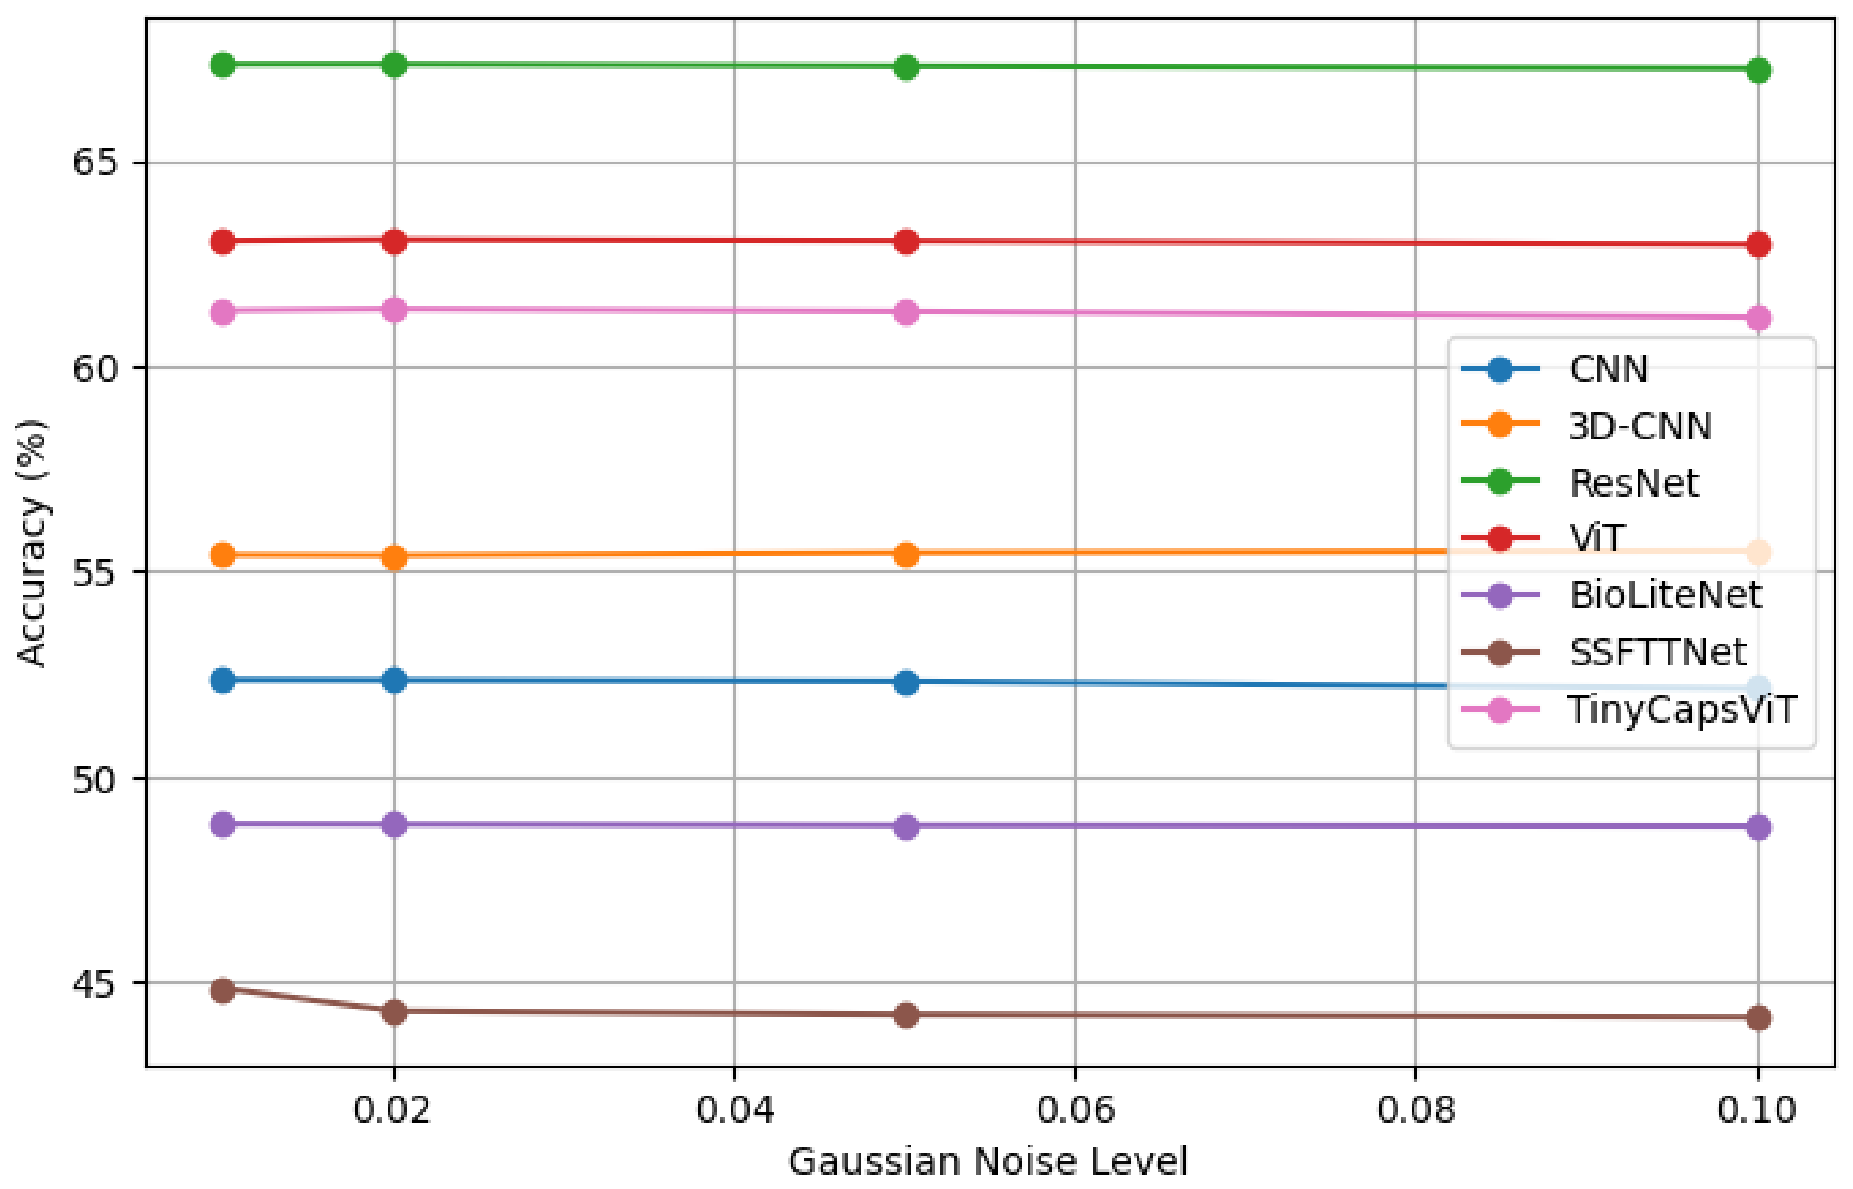
Under Gaussian noise perturbation, no single architecture consistently achieves the highest robustness across all datasets. ResNet obtains the highest average accuracy on PaviaU (67.31%) and Indian Pines (38.39%), while ViT performs best on KSC (15.24%). CNN achieves the highest average robustness on Salinas (81.55%), although BioLiteNet provides a closely comparable result of 81.32%. TinyCapsViT achieves the highest average accuracy on Houston (55.52%) and Derrymore (82.96%), demonstrating that the lightweight architecture can retain competitive robustness under Gaussian perturbations for some datasets. However, its robustness is dataset-dependent, as evidenced by the lower average accuracy of 41.32% on Salinas.
Figure 7 provides a detailed view of the variation in classification accuracy with increasing Gaussian noise on PaviaU. The results further demonstrate that robustness to additive noise varies considerably across architectures and is not determined solely by model complexity. In particular, the performance of TinyCapsViT remains competitive with several comparison models, although ResNet provides stronger overall robustness on this dataset.
The spectral corruption results in
Table 8 show that ResNet provides the strongest overall robustness, achieving the highest average accuracy on PaviaU (93.20%), KSC (78.43%), and Indian Pines (90.37%). CNN achieves the highest performance on Houston (94.33%), although ViT produces a nearly identical result of 94.32%. BioLiteNet performs best on Salinas with an average accuracy of 95.32%, while 3D-CNN achieves the highest result on Derrymore at 85.40%.
TinyCapsViT maintains average accuracies of 87.54%, 86.63%, 59.99%, 84.75%, 87.87%, and 73.70% on PaviaU, Houston, KSC, Derrymore, Salinas, and Indian Pines, respectively. Although these results demonstrate that the proposed model retains useful classification capability under spectral degradation, its performance decreases more rapidly than that of higher-capacity architectures under severe corruption, particularly on KSC and Indian Pines.
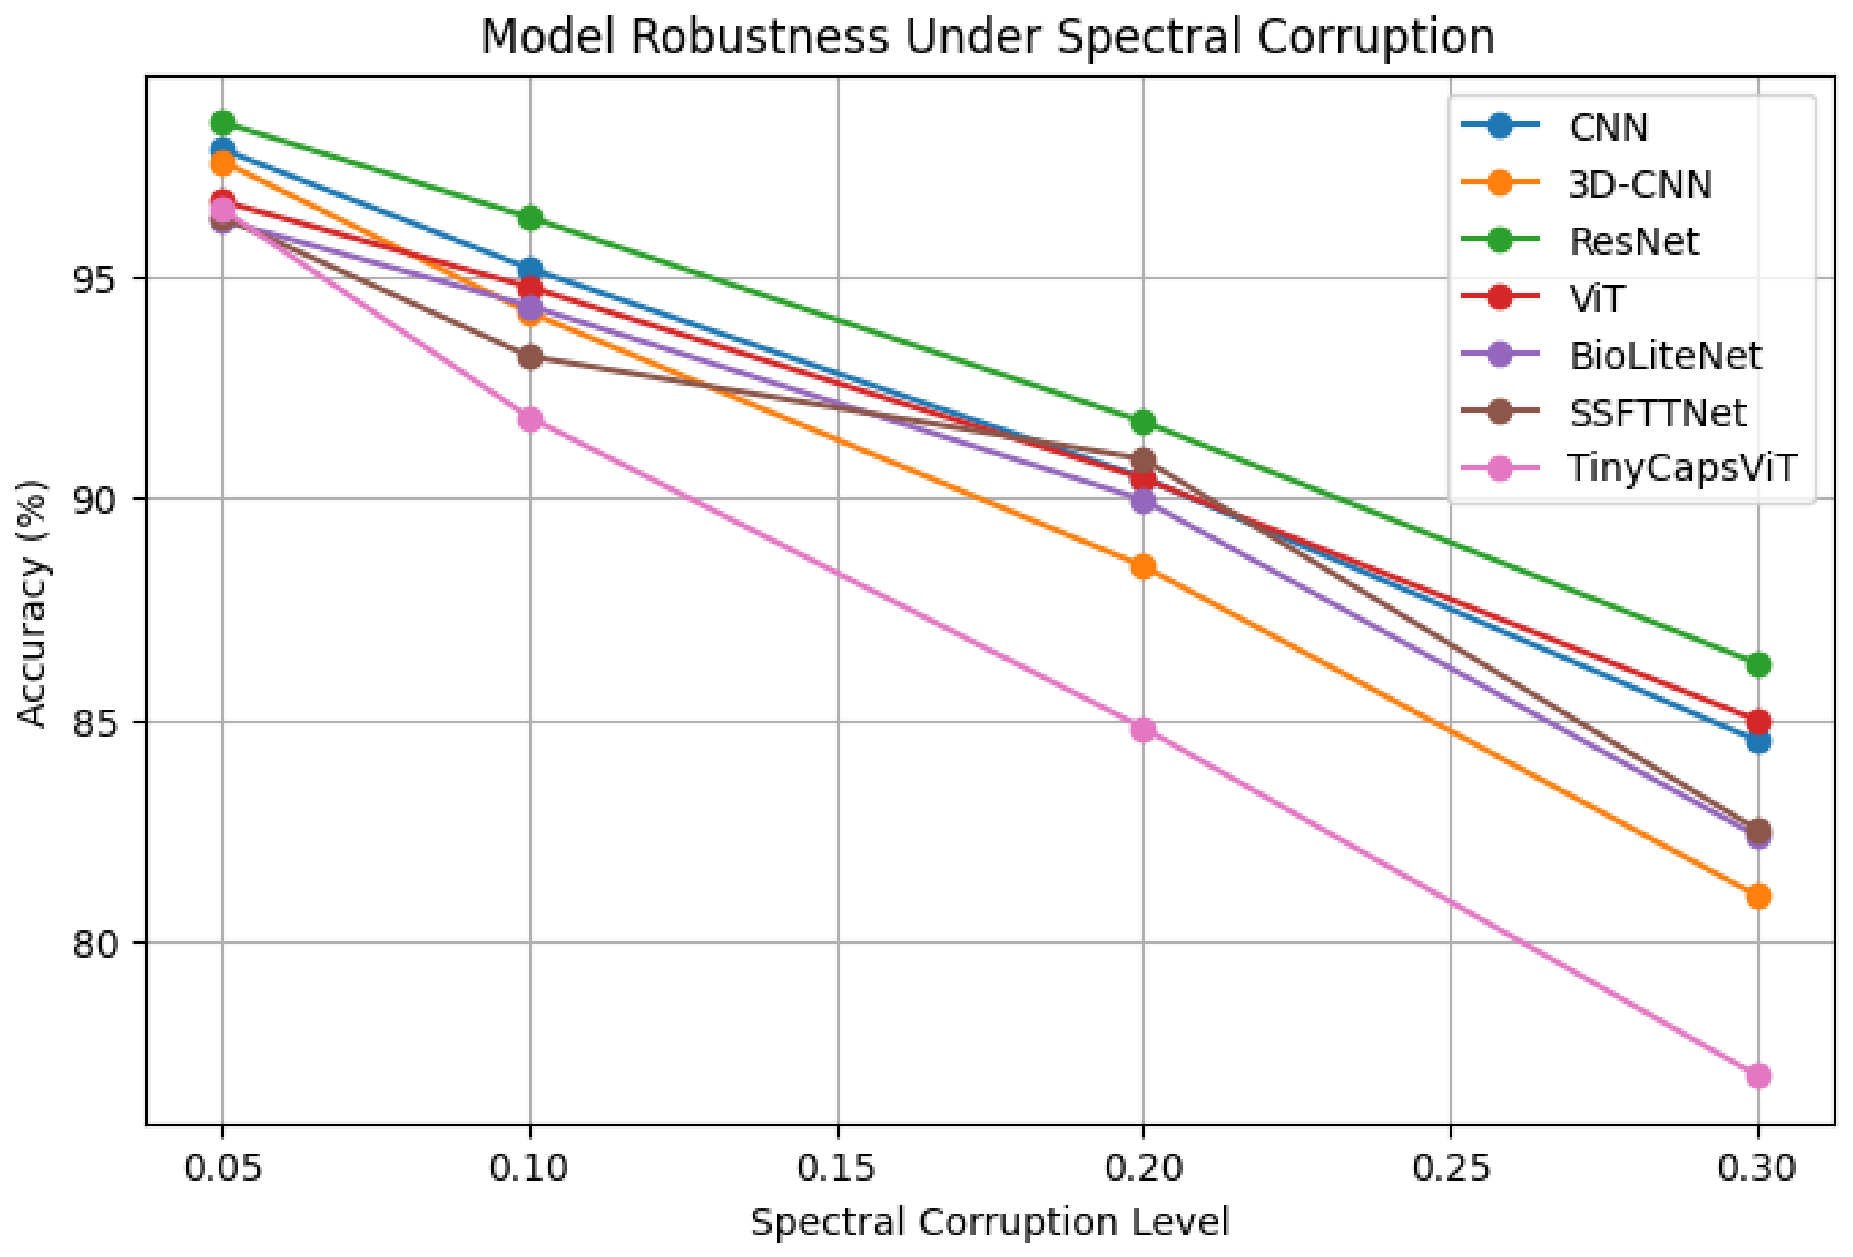
As illustrated in
Figure 8, increasing spectral corruption progressively reduces classification performance. ResNet maintains the most stable performance on PaviaU, whereas TinyCapsViT exhibits a larger degradation as the corruption severity increases. This behavior can be attributed to the design trade-off introduced by the ultra-lightweight architecture. TinyCapsViT contains only 2781 trainable parameters and therefore has substantially lower representational capacity and redundancy than higher-capacity models such as ResNet. Under severe spectral corruption, the reduced feature capacity limits the ability of the model to compensate for heavily degraded spectral information.
The capsule-inspired refinement block is intended to improve feature discrimination and preserve informative relationships within the compact representation; however, it does not provide explicit invariance to severe spectral perturbations. Consequently, its benefits should be interpreted in the context of efficient feature refinement rather than guaranteed robustness against substantial spectral degradation. Incorporating noise-aware training, spectral augmentation, or corruption-specific regularization may further improve the robustness of TinyCapsViT and represents a potential direction for future work.
Overall, the robustness experiments demonstrate that higher-capacity models, particularly ResNet, generally provide stronger resilience to severe spectral corruption. TinyCapsViT does not consistently outperform these architectures in robustness; instead, it provides a trade-off between robustness, classification performance, and substantially reduced computational complexity. This trade-off is consistent with the primary objective of TinyCapsViT: enabling practical hyperspectral image classification on resource-constrained TinyML and edge platforms.
5. Discussion
The experimental results demonstrate that the evaluated deep learning architectures exhibit distinct trade-offs among classification performance, feature representation, robustness, computational complexity, and deployment efficiency. Among the higher-capacity models, ResNet provides the strongest overall classification performance across the evaluated datasets. It achieves the highest accuracy on PaviaU, Salinas, Indian Pines, and Derrymore, while also demonstrating strong robustness under Gaussian noise and spectral corruption. The feature representation analysis further shows that ResNet produces well-structured embeddings, achieving the highest Silhouette score and Calinski–Harabasz Index and the lowest Davies–Bouldin Index. However, these advantages are accompanied by a considerably larger parameter count and memory footprint, which are important considerations for resource-constrained deployment.
CNN and 3D-CNN also demonstrate strong classification capability by effectively extracting local spectral–spatial information. CNN provides consistently high classification accuracy while maintaining relatively low computational complexity and inference latency. The 3D-CNN architecture achieves particularly strong inter-class separation in the feature representation analysis; however, its three-dimensional convolution operations result in substantially higher computational complexity. ViT performs competitively on several datasets and produces compact feature representations, but its validation behavior and robustness vary across datasets, indicating greater sensitivity to the available training data and input perturbations.
The lightweight HSI-specific models, BioLiteNet and SSFTTNet, provide additional insight into the relationship between model design and efficiency. SSFTTNet achieves strong classification performance on several public datasets and demonstrates high feature discrimination, including a kNN feature-space accuracy of 0.9437. BioLiteNet also performs strongly on selected datasets and achieves the highest TFLite classification accuracy of 97.06% on PaviaU. However, these models do not necessarily translate their lightweight design into the lowest computational or deployment cost in the present implementation. BioLiteNet requires 38,885 parameters and 15.648 MFLOPs, while SSFTTNet requires 177,213 parameters and 11.403 MFLOPs. Their TFLite inference latencies are also higher than that of TinyCapsViT, demonstrating that parameter count alone does not fully determine practical deployment efficiency.
The proposed TinyCapsViT is designed specifically to balance classification capability with stringent computational constraints. With only 2781 trainable parameters and 0.633 MFLOPs, it has the lowest parameter count and computational complexity among the evaluated architectures. This corresponds to approximately 11.4× fewer parameters than CNN, 9.5× fewer than 3D-CNN, and more than 30× fewer than ResNet and ViT. Despite this substantial reduction, TinyCapsViT maintains competitive classification performance, achieving 98.50%, 99.61%, 99.19%, and 98.44% OA on PaviaU, Houston, KSC, and Salinas, respectively. Its performance is lower on Indian Pines and Derrymore, indicating that the proposed architecture intentionally trades a modest amount of classification accuracy for substantial reductions in model complexity and memory requirements.
The feature representation analysis supports this interpretation. TinyCapsViT achieves a kNN accuracy of 0.9249 with an inter-class distance of 86.37, indicating that meaningful discriminative representations are retained despite the substantial reduction in model capacity. Although its clustering metrics do not exceed those of ResNet or SSFTTNet, the results demonstrate that the combination of lightweight attention and capsule-inspired refinement can preserve useful spectral–spatial information within a highly compact representation. Therefore, the primary advantage of TinyCapsViT is not superior feature separability over higher-capacity models, but its ability to retain competitive discriminative capability under a substantially reduced computational budget.
The robustness experiments further highlight this accuracy–efficiency trade-off. ResNet generally provides the strongest resilience to spectral degradation, while the performance of TinyCapsViT varies across datasets. Under Gaussian noise, TinyCapsViT achieves the highest average accuracy on Houston and Derrymore, but lower robustness is observed on datasets such as Salinas. Similarly, under spectral corruption, TinyCapsViT experiences greater degradation than higher-capacity architectures, particularly on KSC and Indian Pines. This behavior can be attributed partly to its limited representational capacity and redundancy. The capsule-inspired refinement mechanism improves feature discrimination within the compact architecture but does not explicitly provide invariance to severe spectral corruption. Consequently, robustness under substantial spectral degradation remains an important area for further improvement.
The hardware evaluation in
Table 9 further demonstrates that computational complexity does not translate directly into identical latency rankings across hardware platforms
Table 10. CNN achieves the lowest latency on the workstation, Intel NUC, and Jetson Xavier NX, whereas TinyCapsViT achieves the lowest measured latency on the Raspberry Pi 3 at 0.36 ms. TinyCapsViT also maintains low latency on the Intel NUC and Jetson Xavier NX, substantially outperforming ViT, BioLiteNet, and SSFTTNet in inference time. These results indicate that the compact architecture is particularly advantageous on highly resource-constrained hardware, where reduced computational and memory requirements become increasingly important.
Taken together, the experimental results show that no single architecture dominates across all evaluation criteria. ResNet provides the strongest overall classification and robustness performance, 3D-CNN and SSFTTNet demonstrate strong feature discrimination, BioLiteNet achieves strong TFLite classification accuracy, and CNN provides highly efficient inference on several hardware platforms. In contrast, TinyCapsViT targets a different operating point by combining competitive classification performance with only 2781 parameters, low computational complexity, a small memory footprint, and practical edge inference. This balance makes the proposed architecture particularly relevant for embedded hyperspectral and multispectral sensing applications where computational resources, memory, and power consumption are constrained.
To further demonstrate the evolution of our research,
Table 11 compares the proposed TinyCapsViT with our previously published CrossCapsViT architecture. CrossCapsViT was designed to maximize classification performance, achieving an overall accuracy of 99.89%, but at the expense of high computational complexity, with 6.626 million trainable parameters, 0.1209 GFLOPs, and a model size of 26.5 MB.
In contrast, TinyCapsViT was specifically developed for TinyML deployment by emphasizing computational efficiency while maintaining competitive classification performance. Compared with CrossCapsViT, TinyCapsViT reduces the number of trainable parameters by approximately 99.96%, decreases the model size by nearly 185×, and lowers the computational complexity by about 93×. Moreover, the TensorFlow Lite implementation achieves an inference time of only 0.312 ms per sample, making it well suited for real-time deployment on resource-constrained edge devices.
Although TinyCapsViT exhibits a modest reduction in classification accuracy (98.50% versus 99.89%), the significant gains in efficiency, memory footprint, and deployment capability demonstrate that it provides a more practical solution for TinyML-based hyperspectral image classification. This comparison highlights the progression of our research from a performance-oriented architecture to a lightweight, deployment-oriented framework for embedded environmental monitoring applications.
Despite these advantages, several limitations remain. TinyCapsViT exhibits reduced robustness under severe spectral corruption and does not consistently match the classification accuracy of higher-capacity architectures or all lightweight baselines. Furthermore, deployment latency depends strongly on hardware characteristics, software frameworks, and operator-level optimization; therefore, a low parameter count does not necessarily guarantee the lowest latency on every platform. Future work will investigate quantization-aware training, hardware-aware architecture optimization, spectral augmentation, and noise-aware training to improve robustness and deployment efficiency without substantially increasing model complexity. Additional evaluation on embedded sensing platforms and real-time UAV-based environmental monitoring scenarios will further assess the practical scalability of the proposed approach.
6. Conclusions and Future Work
This work presented TinyCapsViT, an ultra-lightweight capsule-inspired vision transformer for resource-constrained hyperspectral image classification, and evaluated its performance against CNN, 3D-CNN, ResNet, ViT, BioLiteNet, and SSFTTNet across multiple benchmark datasets and a custom UAV-acquired hyperspectral dataset. The experimental results demonstrated that higher-capacity architectures, particularly ResNet, generally provide stronger overall classification performance and robustness. Feature representation analysis further showed that ResNet produces compact and well-separated embeddings, whereas TinyCapsViT retains meaningful class separability using a substantially smaller architecture.
The proposed TinyCapsViT achieved competitive classification performance while substantially reducing model complexity. With only 2781 trainable parameters and low computational requirements, the model provides a compact alternative to conventional CNN and transformer-based architectures. TensorFlow Lite evaluation and hardware deployment experiments further demonstrated the feasibility of executing TinyCapsViT on resource-constrained edge platforms. Although TinyCapsViT does not consistently achieve the highest classification accuracy among the evaluated models, it provides a practical trade-off between classification performance, computational complexity, memory requirements, and deployment efficiency, supporting its use in TinyML-based hyperspectral image classification applications.
The robustness experiments demonstrated that TinyCapsViT retains useful classification capability under input perturbations, with competitive performance under Gaussian noise on selected datasets. However, its robustness is dataset-dependent, and its performance degrades more rapidly than that of higher-capacity architectures under severe spectral corruption. This behavior reflects the inherent trade-off introduced by the ultra-lightweight design, where reduced representational capacity is accepted in exchange for substantial reductions in computational and memory requirements. Deployment experiments on the Intel NUC, Jetson Xavier NX, and Raspberry Pi 3 further confirmed the practical feasibility of the proposed architecture for edge-AI applications.
Future work will focus on improving robustness under severe spectral degradation and limited training conditions. Additional research will investigate quantization-aware training, pruning, adaptive spectral attention mechanisms, spectral augmentation, noise-aware training, and hardware-aware optimization strategies to further improve deployment efficiency and robustness without substantially increasing model complexity. Future extensions will also explore real-time onboard hyperspectral image processing, multispectral classification, multimodal sensor fusion, and autonomous edge-based environmental monitoring applications.