


Highlights
What are the main findings?
- All four study sites exhibited an increase in vegetation extent over the observation period. Directional changes towards longer growing seasons and shifts in the timing of peak greenness were observed, although the magnitude and statistical significance varied among cities.
- Smaller, open green spaces showed greater interannual NDVI variability than larger, tree-dominated green spaces.
What are the implications of the main findings?
- Changes in vegetation dynamics may alter the timing and magnitude of irrigation demand, highlighting the need to adapt urban green-space management under changing climatic conditions.
- Remote sensing technology can support long-term monitoring of urban green spaces for sustainable urban planning and water management.
Abstract
Urban greening is a cornerstone of climate adaptation strategies, yet its long-term sustainability under changing vegetation dynamics remains poorly understood. This study analyzes 40 years of Landsat data (1984–2024) using normalized difference vegetation index (NDVI) time series to quantify changes in vegetation extent, phenology and interannual stability across four European cities (Paris, Graz, Barcelona and Birmingham). The study investigates long-term phenological trends in heterogeneous urban green spaces. Results showed similar developments in greening measures at all four study sites: In Birmingham, Paris and Barcelona, vegetation extent increased by 12 to 23 absolute percentage points, while Graz showed a moderate increase of 4 percentage points. A general tendency towards a longer growing season was observed across the study sites, driven by directional changes towards an earlier Start of Season (SOS) and a delayed End of Season (EOS), although the magnitude and statistical significance varied between cities. Barcelona exhibited pronounced summer NDVI declines, whereas peak vegetation activity occurred earlier in Paris and slightly later in Birmingham. Interannual variation showed greater differences in smaller, fragmented open green spaces (Coefficient of Variation ≈ 0.3) compared to larger tree-dominated parks (Coefficient of Variation ≈ 0.1). These findings provide a harmonized long-term assessment of urban vegetation dynamics. European cities are becoming greener while simultaneously experiencing shifts in vegetation activity and, depending on location, strong declines during summer months. These long-term changes highlight the importance of considering vegetation dynamics when planning resilient urban green spaces under a changing climate.
1. Introduction
Urban greening initiatives have emerged as a primary strategy for climate adaptation, providing multiple benefits to the public and environment, which are often described as ecosystem services. Benefits include a reduction in the urban heat island effect, better stormwater management, improved air quality, greater biodiversity, and increased urban sustainability [1,2,3,4]. As a result, many cities across Europe are aiming to expand their green infrastructure, including parks, street trees, urban forests and other urban green spaces.
However, changes in climate create challenges for urban green spaces everywhere, and as global temperatures rise, studies confirm the timing of plant life cycles is shifting [5,6,7,8]. A growing demand for urban green infrastructure combined with changes in temperature and precipitation patterns raises the question of how these green spaces are maintained in times when water availability is low and high temperatures and droughts cause pressure on vegetation. While scientists are now researching the water demand of urban green spaces more closely [9,10,11], an increase in water demand is rarely linked to changes in plant phenology. However, understanding these phenological changes is essential as the health of the vegetation affects the performance of green infrastructures [12]. The choice of plants influences both the effectiveness of the green infrastructure as well as its resilience to environmental stressors. Bruner et al. mention the positive impacts on performance when green infrastructure is well designed and offers a variety of plants with different physical attributes [13]. Consequently, planning and design should consider the local environment, climate, and topography. However, with growing concerns regarding water availability, the maintenance of urban green spaces should not come at the expense of using drinking water in times of low water availability, which suggests that the upkeep of said vegetation might be an interesting focus point when studying urban water demand.
Anthropogenic global warming has been repeatedly linked to an increase in the frequency and intensity of extreme weather events [14,15]. These include higher intensities of rainfall and storm events, as well as an increased likelihood of maximum temperatures exceeding long-term trends and more frequent heatwaves [15]. Recent observational and modeling studies find that extreme precipitation and heat events have already increased significantly across many regions of the world [16]. Meanwhile, prolonged periods of water stress and temperature variation (e.g., drought, heat) have been shown to accelerate or otherwise alter leaf senescence, affecting photosynthetic capacity, nutrient resorption, and leaf-area duration [17,18,19,20] which all compromise the ecosystem services provided by urban green infrastructure.
The identification of trends and shifts in plant phenology related to climate change is an established research field, and numerous studies have investigated which trends can be identified worldwide and which factors can be utilized as indicators for these changes [5,6,8,21,22,23]. The increasing availability of satellite images further enables the long-term study of vegetation dynamics at an increasingly high spatial and temporal resolution across the globe [5,21,24,25].
Vegetation indices, derived from satellite data, are widely used for monitoring vegetation condition and possible shifts in plant phenology. One of the most widely known and studied vegetation indices is the normalized difference vegetation index (NDVI).
It is arguably the most frequently applied vegetation index, calculated on the basis of satellite imagery [26,27]. It is calculated as the normalized difference between the spectral reflectance in the near-infrared (NIR) and the red (RED) wavelength bands, resulting in values ranging from −1 to 1:
The index can be used to identify areas covered by vegetation on the Earth’s surface and their composition. Healthy vegetation reflects relatively little radiation in the visible spectral range (wavelength 400 to 700 nm), but relatively high radiation in the infrared range (wavelength 700 to 1300 nm). The utilization of sensors aboard satellites to measure these spectral ranges enables the distinction between areas that are covered with vegetation and those that are not. These sensors make it possible to draw conclusions regarding photosynthetic activity, vitality, and the density of the vegetation cover [28] since the reflection in the near-infrared range is directly proportional to the health status of the plant [29]. Conversely, soil, rocks, or dead vegetation exhibit only minor variation in the reflectance of these two ranges.
Although many studies focus on phenological responses driven by climate change affecting plant production in agricultural fields or stress responses in natural environments and forests [7,30,31,32,33], the variations in urban environments, which are often defined by managed irrigation by both public and private water consumers and therefore affect urban water demand, are rarely investigated.
Recent advances in remote sensing have considerably improved the monitoring of urban vegetation. However, while individual aspects of urban vegetation dynamics, such as vegetation extent, phenological timing, or evapotranspiration modeling, have increasingly been used to improve the assessment of vegetation dynamics and support sustainable urban irrigation [34,35,36,37,38,39], combined long-term comparative assessments of phenological changes and vegetation extent across multiple European climate zones using a harmonized methodology remain scarce.
This study addresses this gap by investigating trends in vegetation phenology of urban green spaces in four major European cities and provides a long-term analysis of urban vegetation dynamics. We analyze which changes can be detected from 40 years of urban green space development, providing a consistent baseline for future assessments of urban vegetation and its implications for sustainable water management in regard to water-sensitive urban design, future irrigation demand, and evapotranspiration potentials of urban green spaces. Specifically, we address the following research questions. (i) Are there statistically significant changes in NDVI over time and in which months do they occur? (ii) What are the long-term trends and seasonal variability of NDVI in these four cities? (iii) How have peak growing season and greenness of urban vegetation changed over the past four decades, and (iv) do cities exhibit contrasting NDVI trajectories that reflect differences in climate conditions and local urban management?
2. Materials and Methods
2.1. Study Areas
The study covers urban areas of four European cities: Birmingham (UK), Paris (France), Graz (Austria) and Barcelona (Spain). The four cities were selected to represent diverse climates and hydrological conditions across Europe with varying urban development, population densities and plant phenology as well as a known focus on urban greening initiatives [40,41,42,43]. The differences influence precipitation regimes, growing season characteristics, vegetation composition and potential irrigation strategies. For each city, the Area of Interest (AOI) was delineated using district boundaries from OpenStreetMap (OSM).
Rather than choosing the complete city or municipal boundary, the AOIs focus on urban and peri-urban areas and historical city centers to minimize the influence of non-urban landscapes as well as bordering forests or agricultural land that would bias the urban vegetation analysis. The selected AOI boundaries are provided as Supplementary Material File S1.
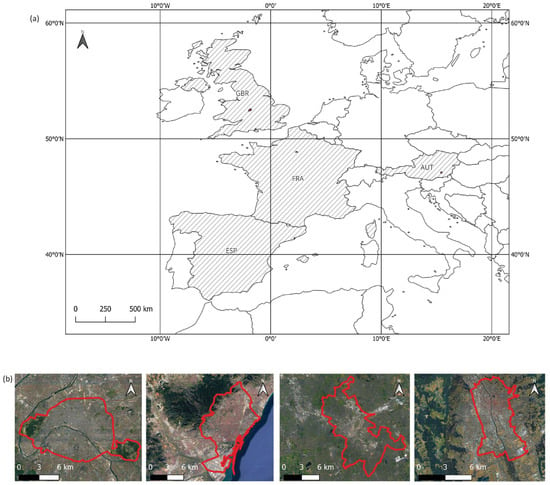
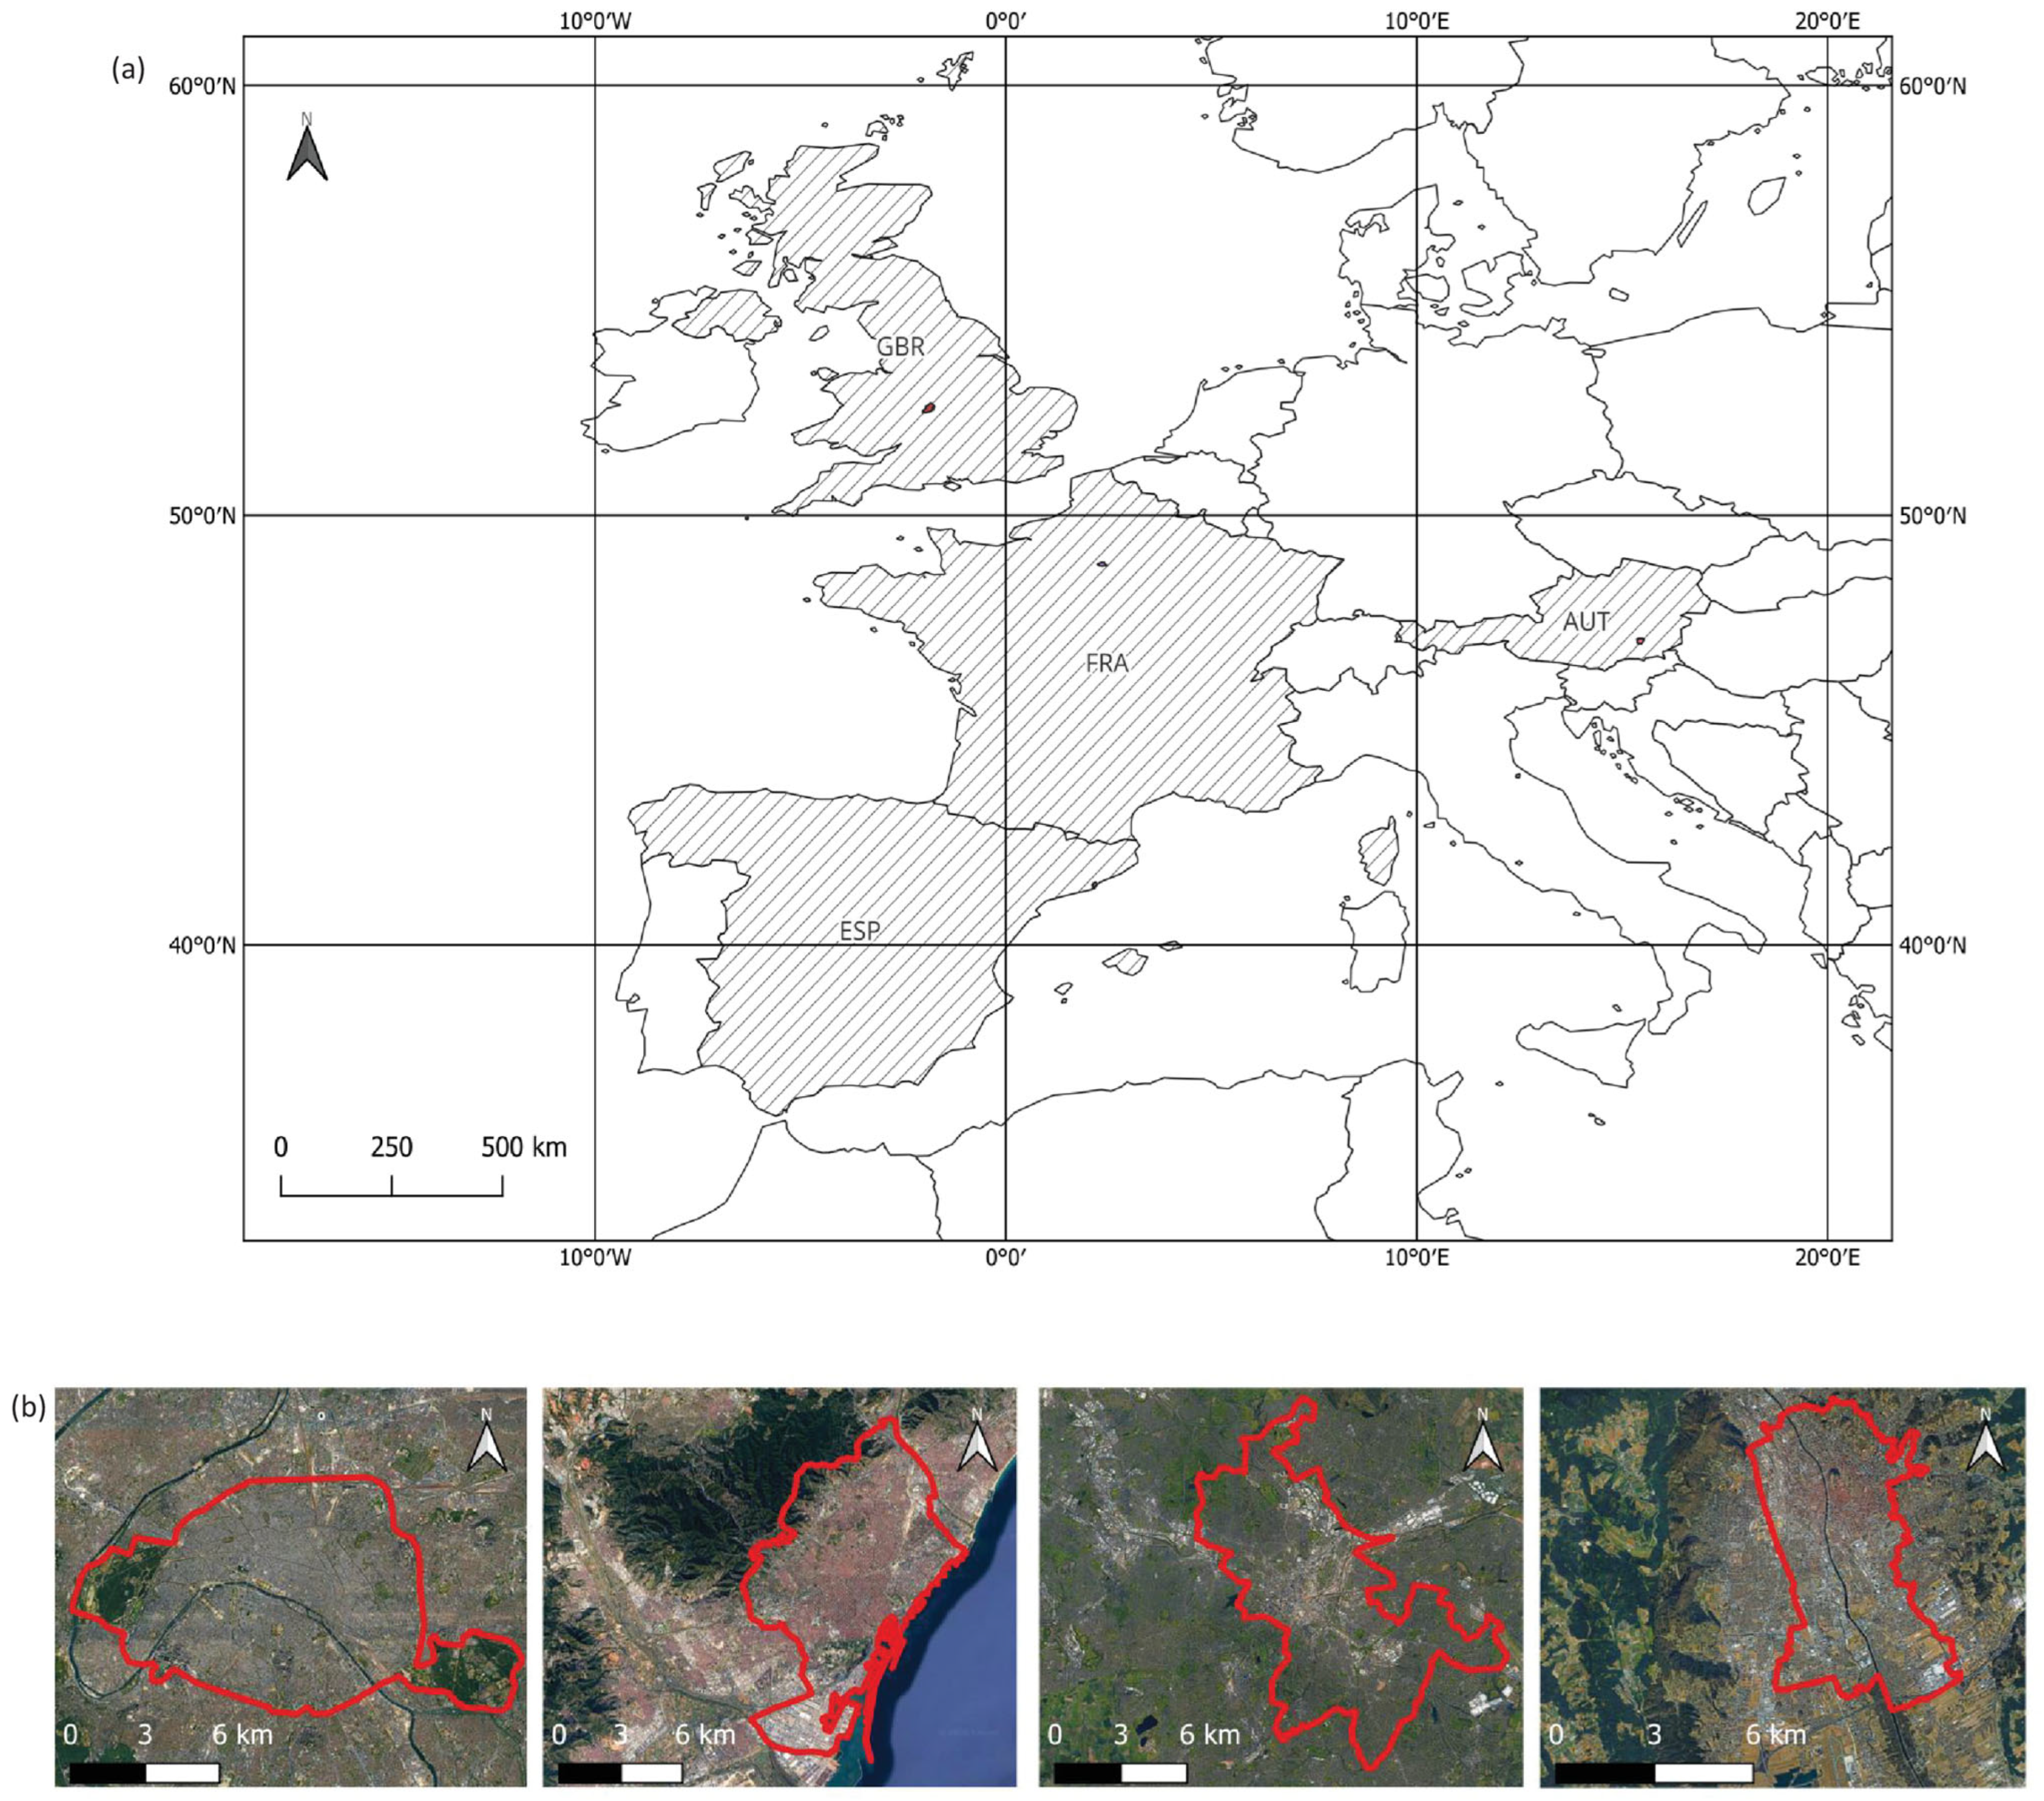
Figure 1 shows the spatial extent and outline of all four cities, and Table 1 explains the climate characteristics and AOI size. The four cities can be briefly summarized by the following characteristics, which made them interesting for this study:
Figure 1.
(a) Location of the four study sites with country of origin shaded and (b) zoom into study sites showing, from left to right: Paris, Barcelona, Birmingham and Graz. Analysis was restricted to the highlighted AOI to focus on urban cores.
Table 1.
Climate characteristics of study sites.
- Graz
Due to the location southeast of the Alps, Graz is less influenced by weather fronts from eastern Europe and more influenced by the Mediterranean, resulting in hot summers, cold winters, high humidity, large amounts of rain in late summer and fall, and, in general, a climate that would be expected much further south. The AOI covers the municipal area excluding outer districts that are dominated by forests and more rural areas.
- Birmingham
Birmingham is often described as one of the greenest cities in Europe, with a high proportion of parks, gardens and tree cover. Its Oceanic climate is characterized by moderate temperatures and consistent precipitation throughout the year, lacking the distinct dry season found, for example, in Mediterranean regions. The AOI covers the municipal area excluding selected outer districts with substantial non-urban land cover.
- Paris
Paris, due to its oceanic climate, does not experience a pronounced dry season, which allows for more sustained natural vegetation growth. However, urban vegetation is still influenced by management practices, including irrigation in parks and green spaces. The AOI covers the entire municipal area.
- Barcelona
The climatic conditions strongly influence the urban vegetation dynamics, particularly through water limitation during the summer months. As a result, vegetation in Barcelona often depends on irrigation to maintain greenness during dry periods. The AOI covers the municipal area excluding the district dominated by the Collserola mountain range.
2.2. Data Acquisition and Original Coverage
The time series analyzed in this paper covers the period from April 1984 to December 2024. The data originates from the Landsat “TM 5”, “ETM 7”, and “OLI-TIRS 8-9” missions. We analyzed data availability beforehand, which varies in particular in the 1980s and early 1990s when only Landsat TM data was available and increases from 1999 onwards with the start of the Landsat ETM 7+ mission and therefore more than one satellite orbiting the Earth. Landsat mission data is freely available from the USGS servers but was obtained and modified via Sentinel Hub [44].
For all missions, Level-2 data was used, which is already atmospherically corrected, and all images were filtered for cloud cover before downloading. If available, cloudless images are preferred in order to not over- or underestimate vegetation cover and greenness. This instance makes some areas difficult to assess with the remaining satellite products due to intensive cloud cover in the respective AOI. However, the spatial resolution of 30 m, the temporal resolution of approximately 16 days, and the availability of 40 years of satellite images [45,46] made the Landsat data particularly suitable for the long-term vegetation monitoring for this study. The datasets and NDVI data were downloaded as raster image files as well as csv. files with mean, maximum, minimum NDVI values, and standard deviation for each available day for the entire AOI as a first basis for investigating the data.
2.3. Time Series Construction and Gap Filling
Despite the high quality of the satellite images, there are known factors that cause inaccurate or incomplete data. One prominent example is the failure of the Landsat 7 Scan Line Corrector (SCL) in May 2003, leading to individual scenes containing systematic data gaps [47]. Therefore, to get a continuous and reliable time series, the datasets need to be pre-processed. Cloud cover, data loss, or missing pixels due to problems with the satellite itself can lead to errors such as unexpectedly low (<0.15) or negative NDVI values in the AOIs. An NDVI value can be considered “unexpectedly low” if it is lower than the expected value at the geographical location, time of year, and season.
Values equal to or below 0.15 can generally be identified as water bodies, barren soil, concrete, or dead vegetation [21,27]. For vegetation, the literature typically defines the values for the NDVI between 0.2 and 0.3 (depending on vegetation type, season, and environmental conditions) [27] in the beginning of the growing season when plants leave dormancy, which can later reach a maximum NDVI of 1 at the peak of the growing season before the values lower again towards the end of the growing season and vegetation goes into senescence.
To create a consistent dataset and minimize the influence of the gaps and incomplete data mentioned at the beginning of this section, the workflow was implemented as follows. First, NDVI was calculated from the Landsat red and NIR reflectance bands for each available acquisition using Sentinel Hub. The resulting NDVI rasters were aggregated into monthly median composites, producing one NDVI value per pixel per month to reduce the influence of outliers within each month. Subsequently, missing monthly NDVI values were filled using temporal interpolation for each pixel following the approach of Eisfelder et al. [5]. Gaps of up to two months were filled using intra-annual interpolation, whereas longer gaps were filled using interannual interpolation. Finally, the resulting gap-filled monthly NDVI time series was smoothed using a three-month rolling median filter. The rolling median filter effectively reduced short-term noise while preserving the overall seasonal dynamics. The resulting smoothed monthly NDVI time series formed the basis for the subsequent phenological and trend analyses.
For the time series analysis, the NDVI values relevant to signal the start, peak, and end of the growing season were derived for the urban vegetation. Previous studies have demonstrated that an NDVI value above approximately 0.2 indicates vegetated surfaces [29,48,49,50]. Based on this, a vegetation mask was generated which permanently excluded pixels that never exceeded an NDVI value of 0.2 during observation. This filtering step ensures that only vegetation is included while also accounting for temporal masking due to snow or cloud cover.
For the trend analysis, only pixels that were classified as vegetation (NDVI > 0.2) and with sufficient valid observations within one year (>50% monthly valid observations available) were included. This aligns with other research and operational standards for excluding pixels with insufficient data quality [48,51,52] and was used in this study to minimize the influence of interpolation on trend estimates. Although optimal NDVI thresholds may vary with vegetation type, soil background, and climate, thresholds between 0.2 and 0.3 are widely reported for identifying vegetation [53].
2.4. Long-Term Analysis of Vegetation Dynamics
In this study, urban vegetation dynamics were analyzed based on a pixel-count approach with vegetation trends derived from pixels classified as vegetation within the defined AOIs.
As described in Section 2.3, pixels that never exceeded an NDVI value of 0.2 throughout the observation period were excluded from the analysis to remove permanently non-vegetated surfaces.
The following analyses of vegetation extent were then performed using an NDVI threshold of 0.3 to represent actively growing vegetation. For the vegetation analysis, the following four metrics were derived in this study:
- Changes in Active Vegetation Extent (pixel count, percentage points and %); Changes in the spatial extent of vegetation throughout the observation period were quantified by calculating the proportion of pixels with NDVI values exceeding a threshold of 0.3, representing actively growing vegetation. Monthly pixel counts (PCmonth) were derived from the pre-processed, gap-filled and temporally interpolated NDVI time series. For each year, the monthly pixel counts (PCmonth) were then averaged to derive the mean annual extent of active vegetation ( (year)). These annual mean values were then used to calculate five-year means for the first five years (1984–1988) () and for the last 5 years (2020–2024) ( of the time series, allowing for robust comparison while reducing the influence of interannual variability, as demonstrated by Forkel et al. [54]. The absolute change ( and relative change in active vegetation extent was then calculated as the difference between these two periods divided by the total pixels in the AOI (PCtotal). The results for are expressed in percentage points (pp) and for in percent (%):Long-term trends were then evaluated using linear regression applied to the annual time series. Because AOI sizes differ between cities, absolute pixel counts are used to illustrate within-city changes over time. Cross-city comparisons are based on vegetation extent expressed relative to the AOI and percentage-point changes relative to the total AOI area.
- Peak NDVI; Monthly maximum NDVI values were extracted for each pixel to identify changes in maximum greenness during the growing season over time. In addition, the timing of annual peak NDVI was assessed to derive potential shifts in the occurrence of peak vegetation activity. The extracted values were then grouped and analyzed in the form of decadal breakdowns. Since data availability is lower in the early years, strong influences by single years are evened out while trends can still be compared.To remove differences in absolute NDVI magnitude between years and to better focus on seasonal timing and relative amplitude of the vegetation greenness, a min-max normalized NDVI (NDVInorm) was used:where pixel counts for each year (y) and month (m) were divided by the yearly maximum (maxNDVIy). For each year, NDVImin,y and NDVImax,y represent the minimum and maximum monthly NDVI pixel counts within a year.
- Growing Season Length; Changes in growing season length were assessed with a threshold-based approach applied to the monthly vegetated pixel counts where the Start of Season (SOS) and End of Season (EOS) were characterized as the first month where the normalized vegetation extent exceeds 30% of the annual maximum, while the EOS was defined as the last month above this 30% threshold for all active vegetation. This way, the growing season is not defined by a single value but by the signal where vegetation leaves its dormant state independent of a plant type and NDVI baseline. The 30% threshold was based on a previous study [53] which demonstrated that mixed vegetation benefits from choosing a higher threshold when defining the SOS and EOS to experience less influence from evergreen vegetation. To evaluate the robustness of the selected threshold, a sensitivity analysis was conducted using thresholds of 0.2, 0.3 and 0.5. Statistical significance of SOS and EOS trends was evaluated using the Mann–Kendall test.
- Interannual variability of peak NDVI; To see how stable the green vegetation is and how much peak NDVI values vary from year to year, the interannual stability of peak NDVI (NDVImax) among different types of green spaces (larger parks, grassland, maintained green spaces like private gardens and sports fields) and among study sites is investigated. This is done by calculating the Coefficient of Variation (CV) of the NDVImax for each pixel, where the standard deviation () of the annual peak NDVI is divided by the mean () of all annual peak NDVI values of the observation period:
2.5. Statistical Tests and Trend Analysis
Following the trend analysis approach of previous studies [5,6,21], annual and seasonal NDVI trends were assessed using linear regression and the non-parametric Mann–Kendall trend test to identify upward or downward trends in the time series, as well as the Theil–Sen slope estimator to measure trend magnitude. For the analysis, only trends with p-values < 0.05 were considered statistically significant. The Mann–Kendall trend test is a non-parametric test suitable for non-normally distributed data and small sample sizes, and it is less sensitive to outliers and uneven distribution than parametric tests [55,56]. The Theil–Sen slope estimator was subsequently applied to determine the magnitude and direction of the detected trends. It is a statistical method that calculates the strength of a monotonous trend as the median of the slopes of the lines through all point pair combinations. The Theil–Sen slope estimator is more robust compared to simple linear regression and is resistant to the impact of outliers [57,58]. The usage of the Mann–Kendall trend test in combination with the Theil–Sen slope estimator has been efficiently used for climate-relevant trend analyses in multiple other studies [5,6,21,59,60].
3. Results
3.1. Constructed Time Series and Interpolation Extent
As explained in Section 2.2, data availability and quality vary largely due to the different satellites, data gaps, or inaccuracies in the data sets, particularly due to cloud coverage. Missing observations were filled independently for each pixel using the interpolation procedure described in Section 2.3.
Barcelona, characterized by generally low cloud cover, resulted in the highest number of valid observations. In contrast, Birmingham, because of frequent cloud contamination, resulted in the lowest image count among the four cities. Since only pixels classified as vegetation were included in subsequent analyses, the corresponding interpolation fraction within the vegetation mask ranged from 9 to 34; interpolation rates varied but showed no systematic increase over the observation period, but generally a variation, indicating that interpolation was not concentrated in a particular period of the time series. Interpolation fractions are provided in Supplementary Material File S2.
3.2. Results of the Long-Term Analysis of Vegetation Dynamics
3.2.1. Change in Vegetation Cover
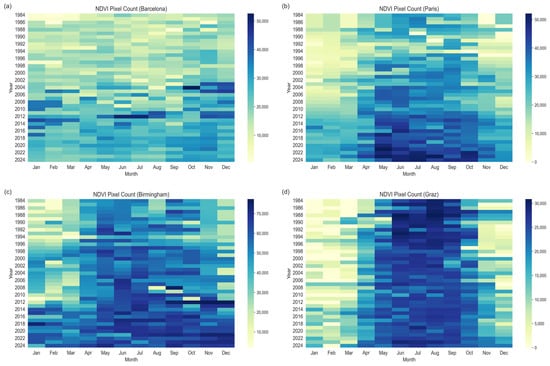
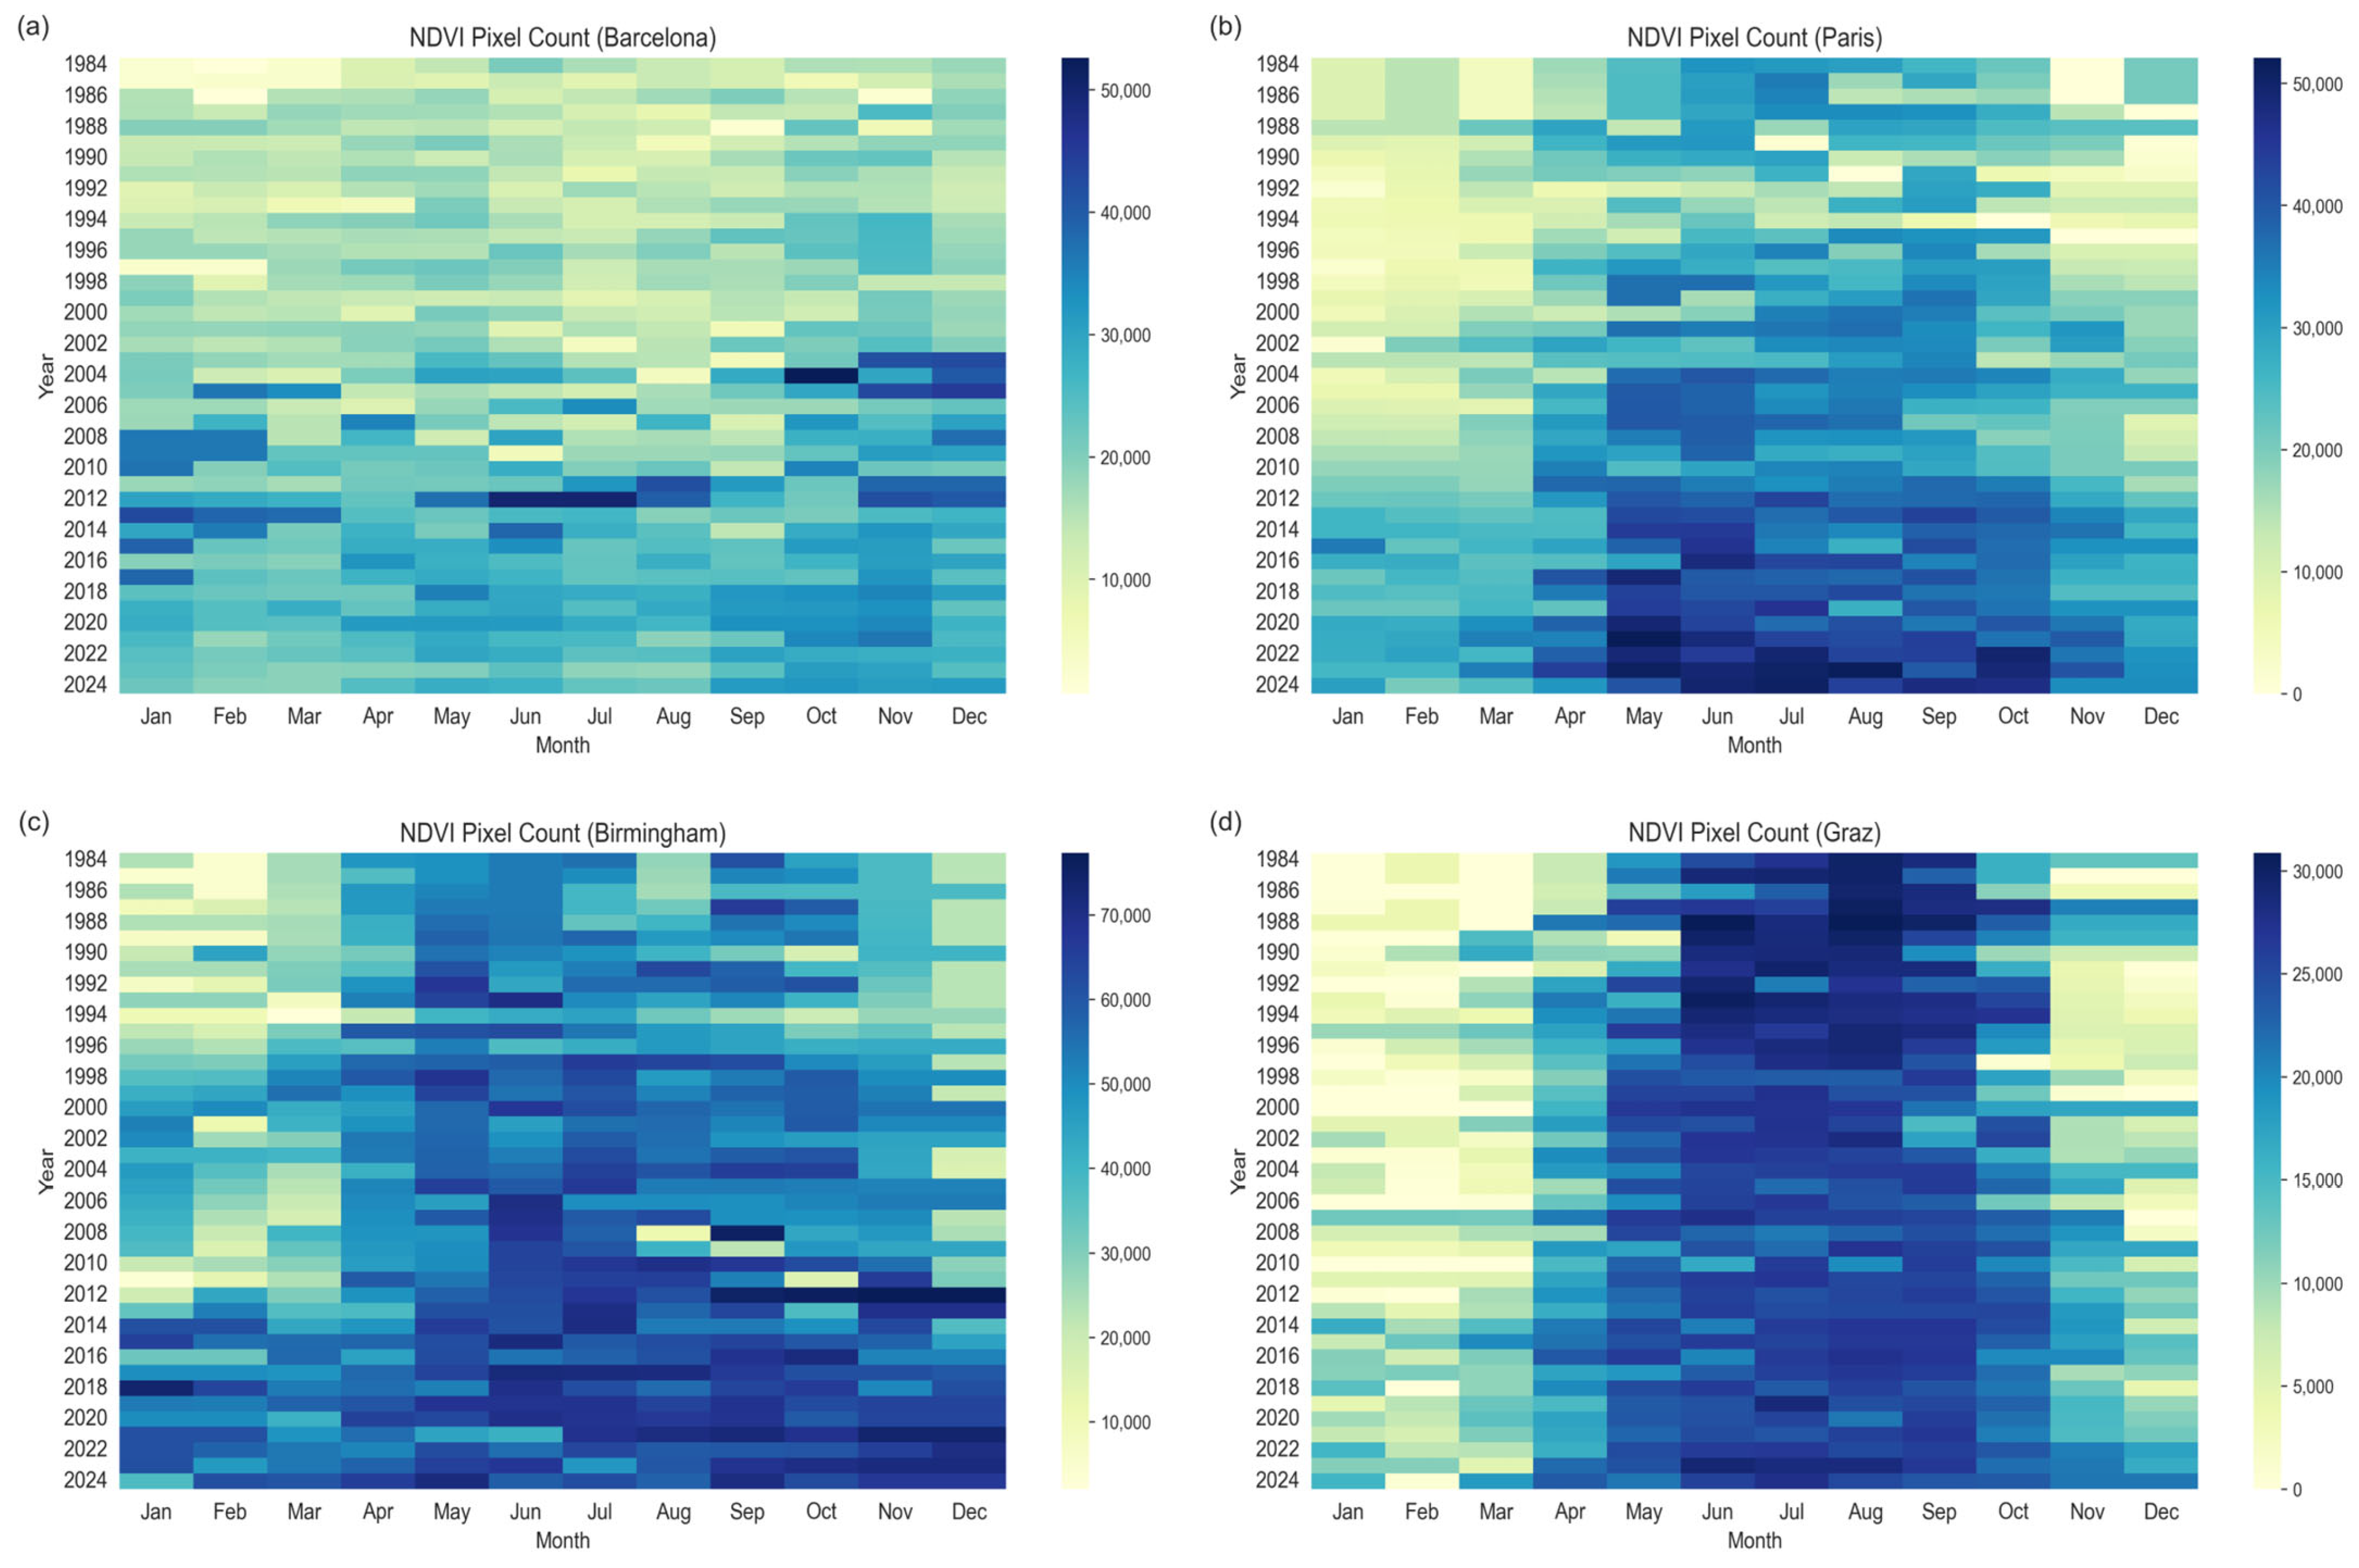
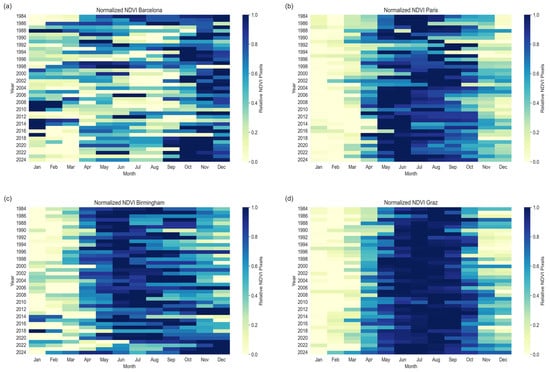
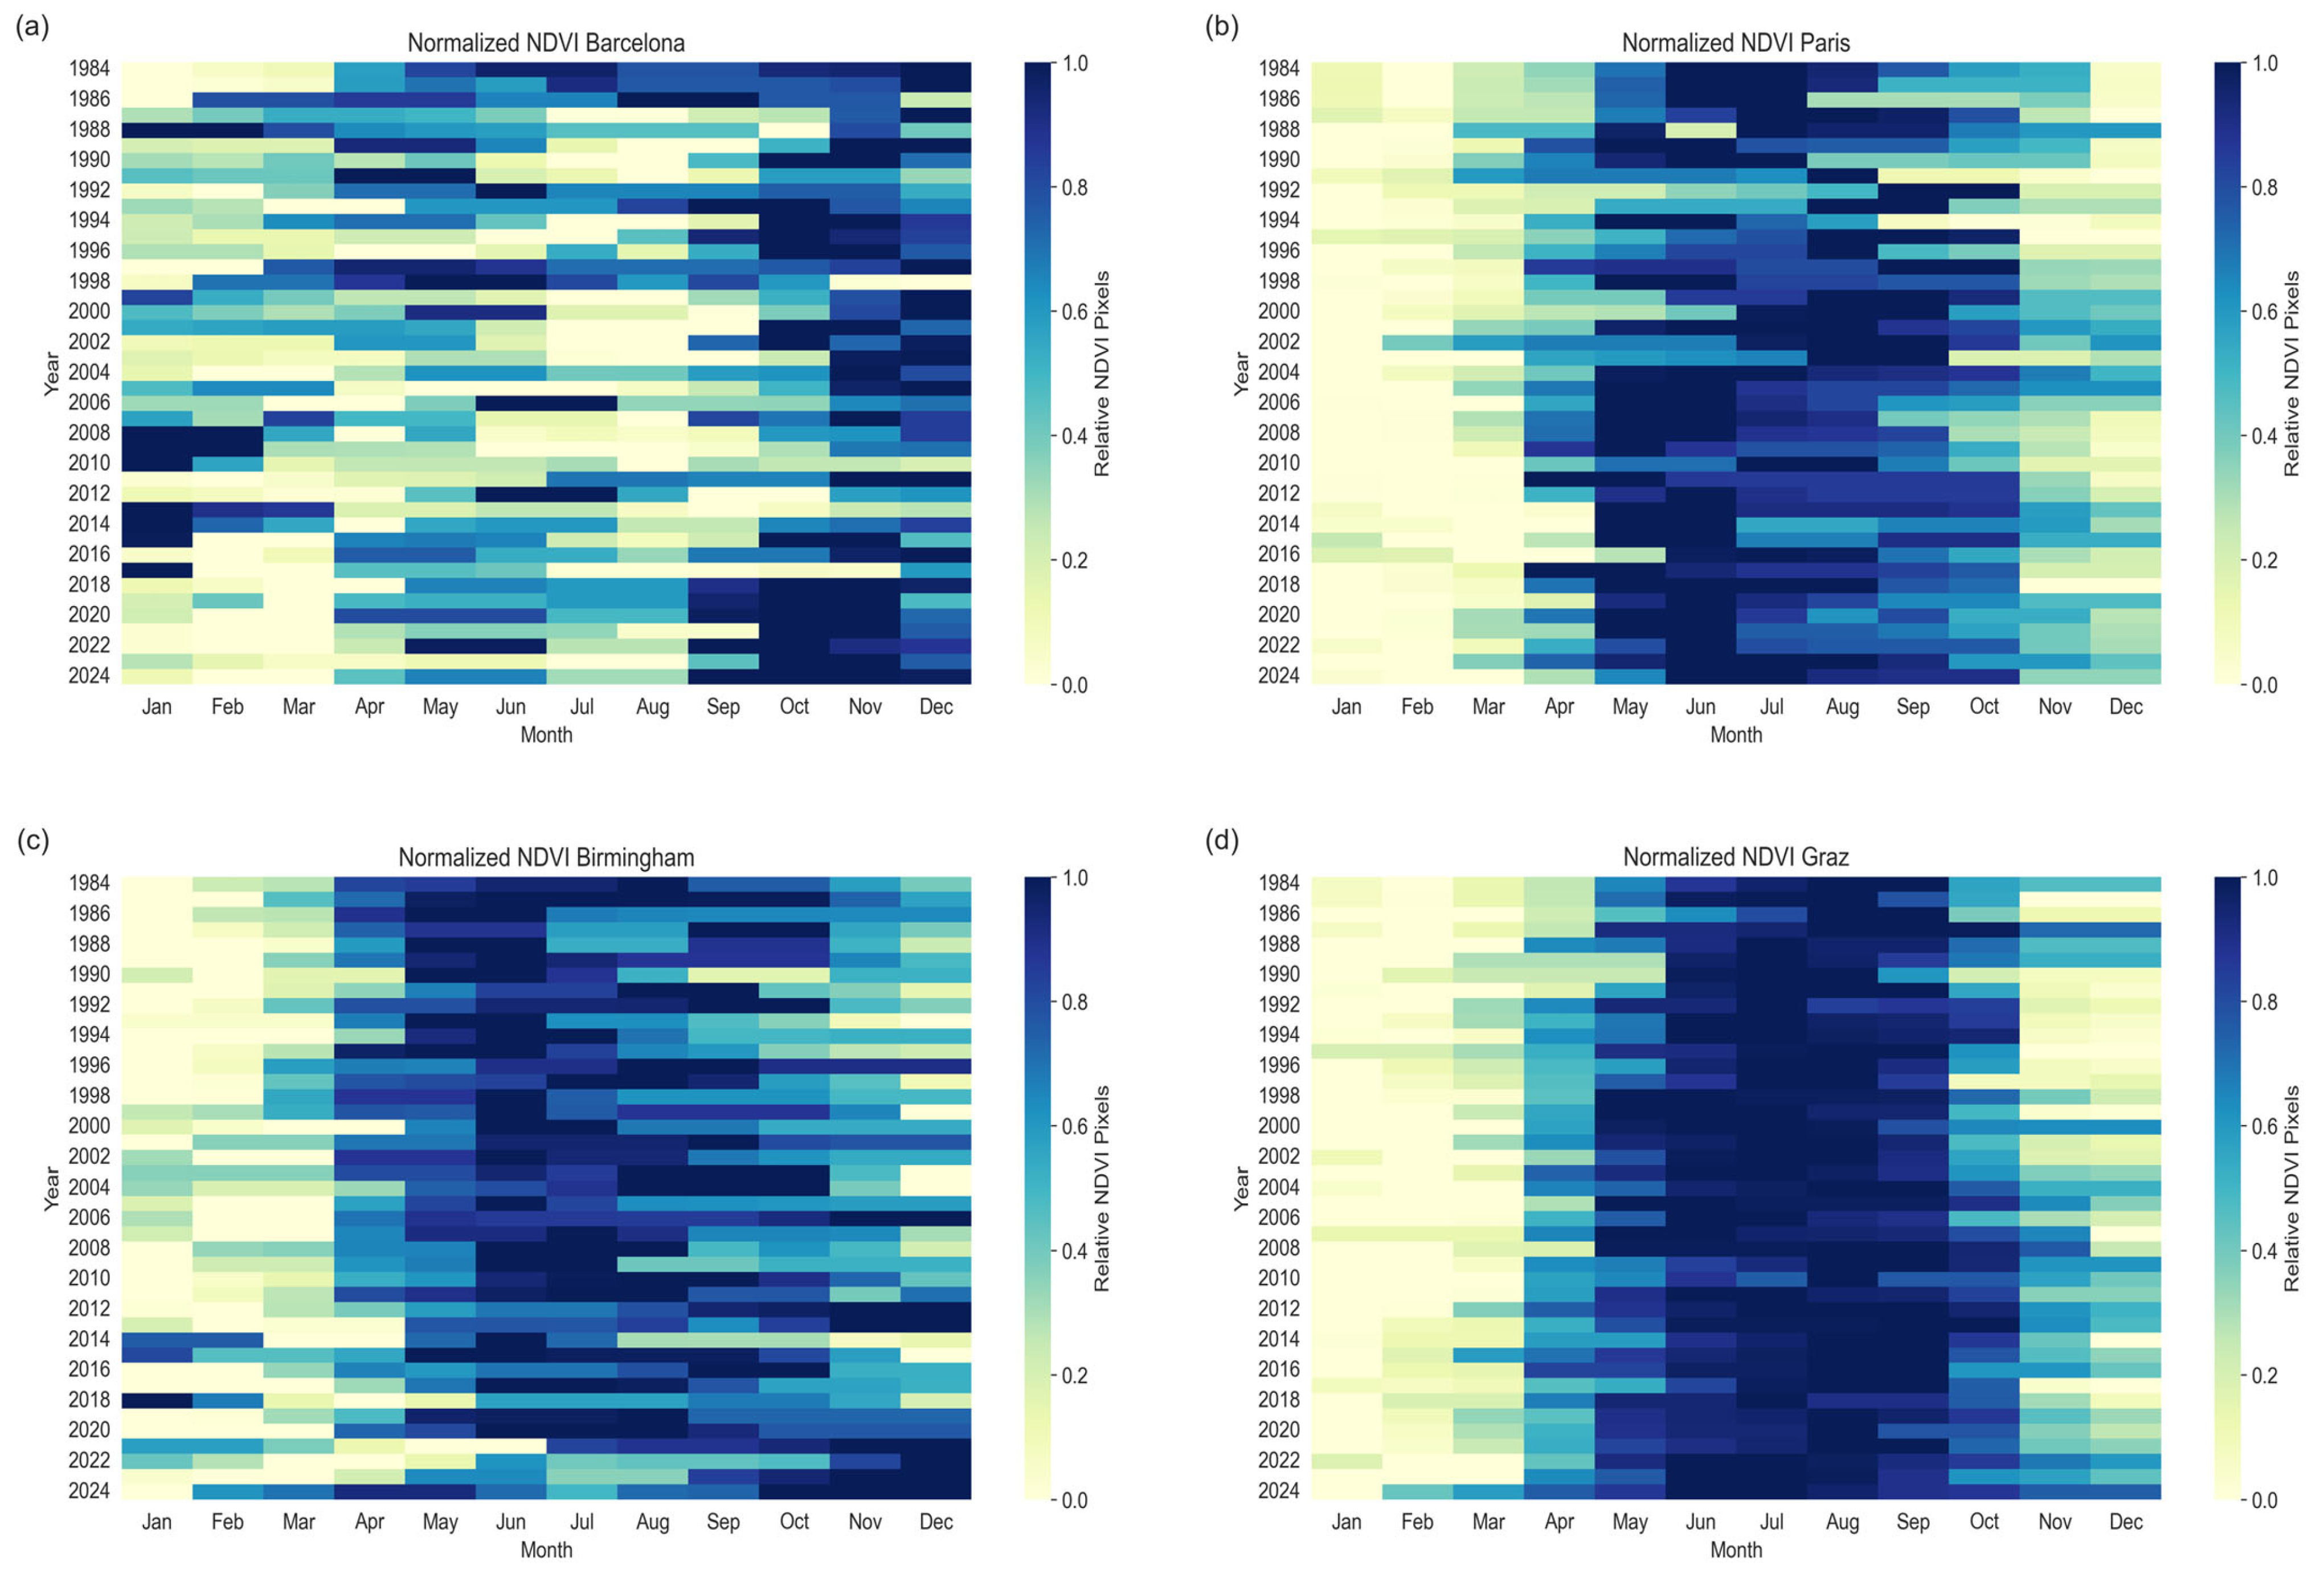
Following the methods described in Section 2.4, the analysis revealed a consistent increase in the extent of active vegetation (NDVI > 0.3) across all study sites. To account for differences in AOI size, vegetation extent was expressed as the proportion of pixels exceeding the NDVI threshold relative to the total number of valid pixels within each AOI. Figure 2 shows the temporal distribution of active vegetation (NDVI > 0.3), where darker colors represent a higher number of pixels above the threshold, representing the change and predominantly increase in active green vegetation.
Figure 2.
Number of pixels above an NDVI value > 0.3 for each month in all study sites: (a) Barcelona (b) Paris (c) Birmingham (d) Graz. Darker colors indicate a greater number of pixels with NDVI > 0.3.
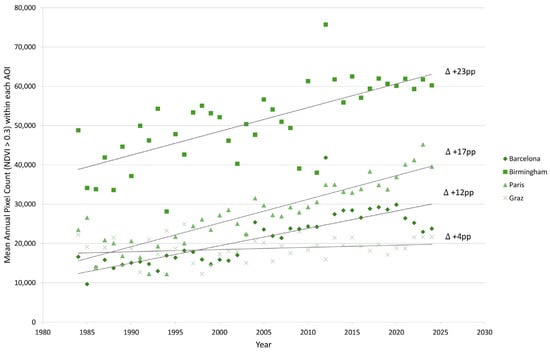
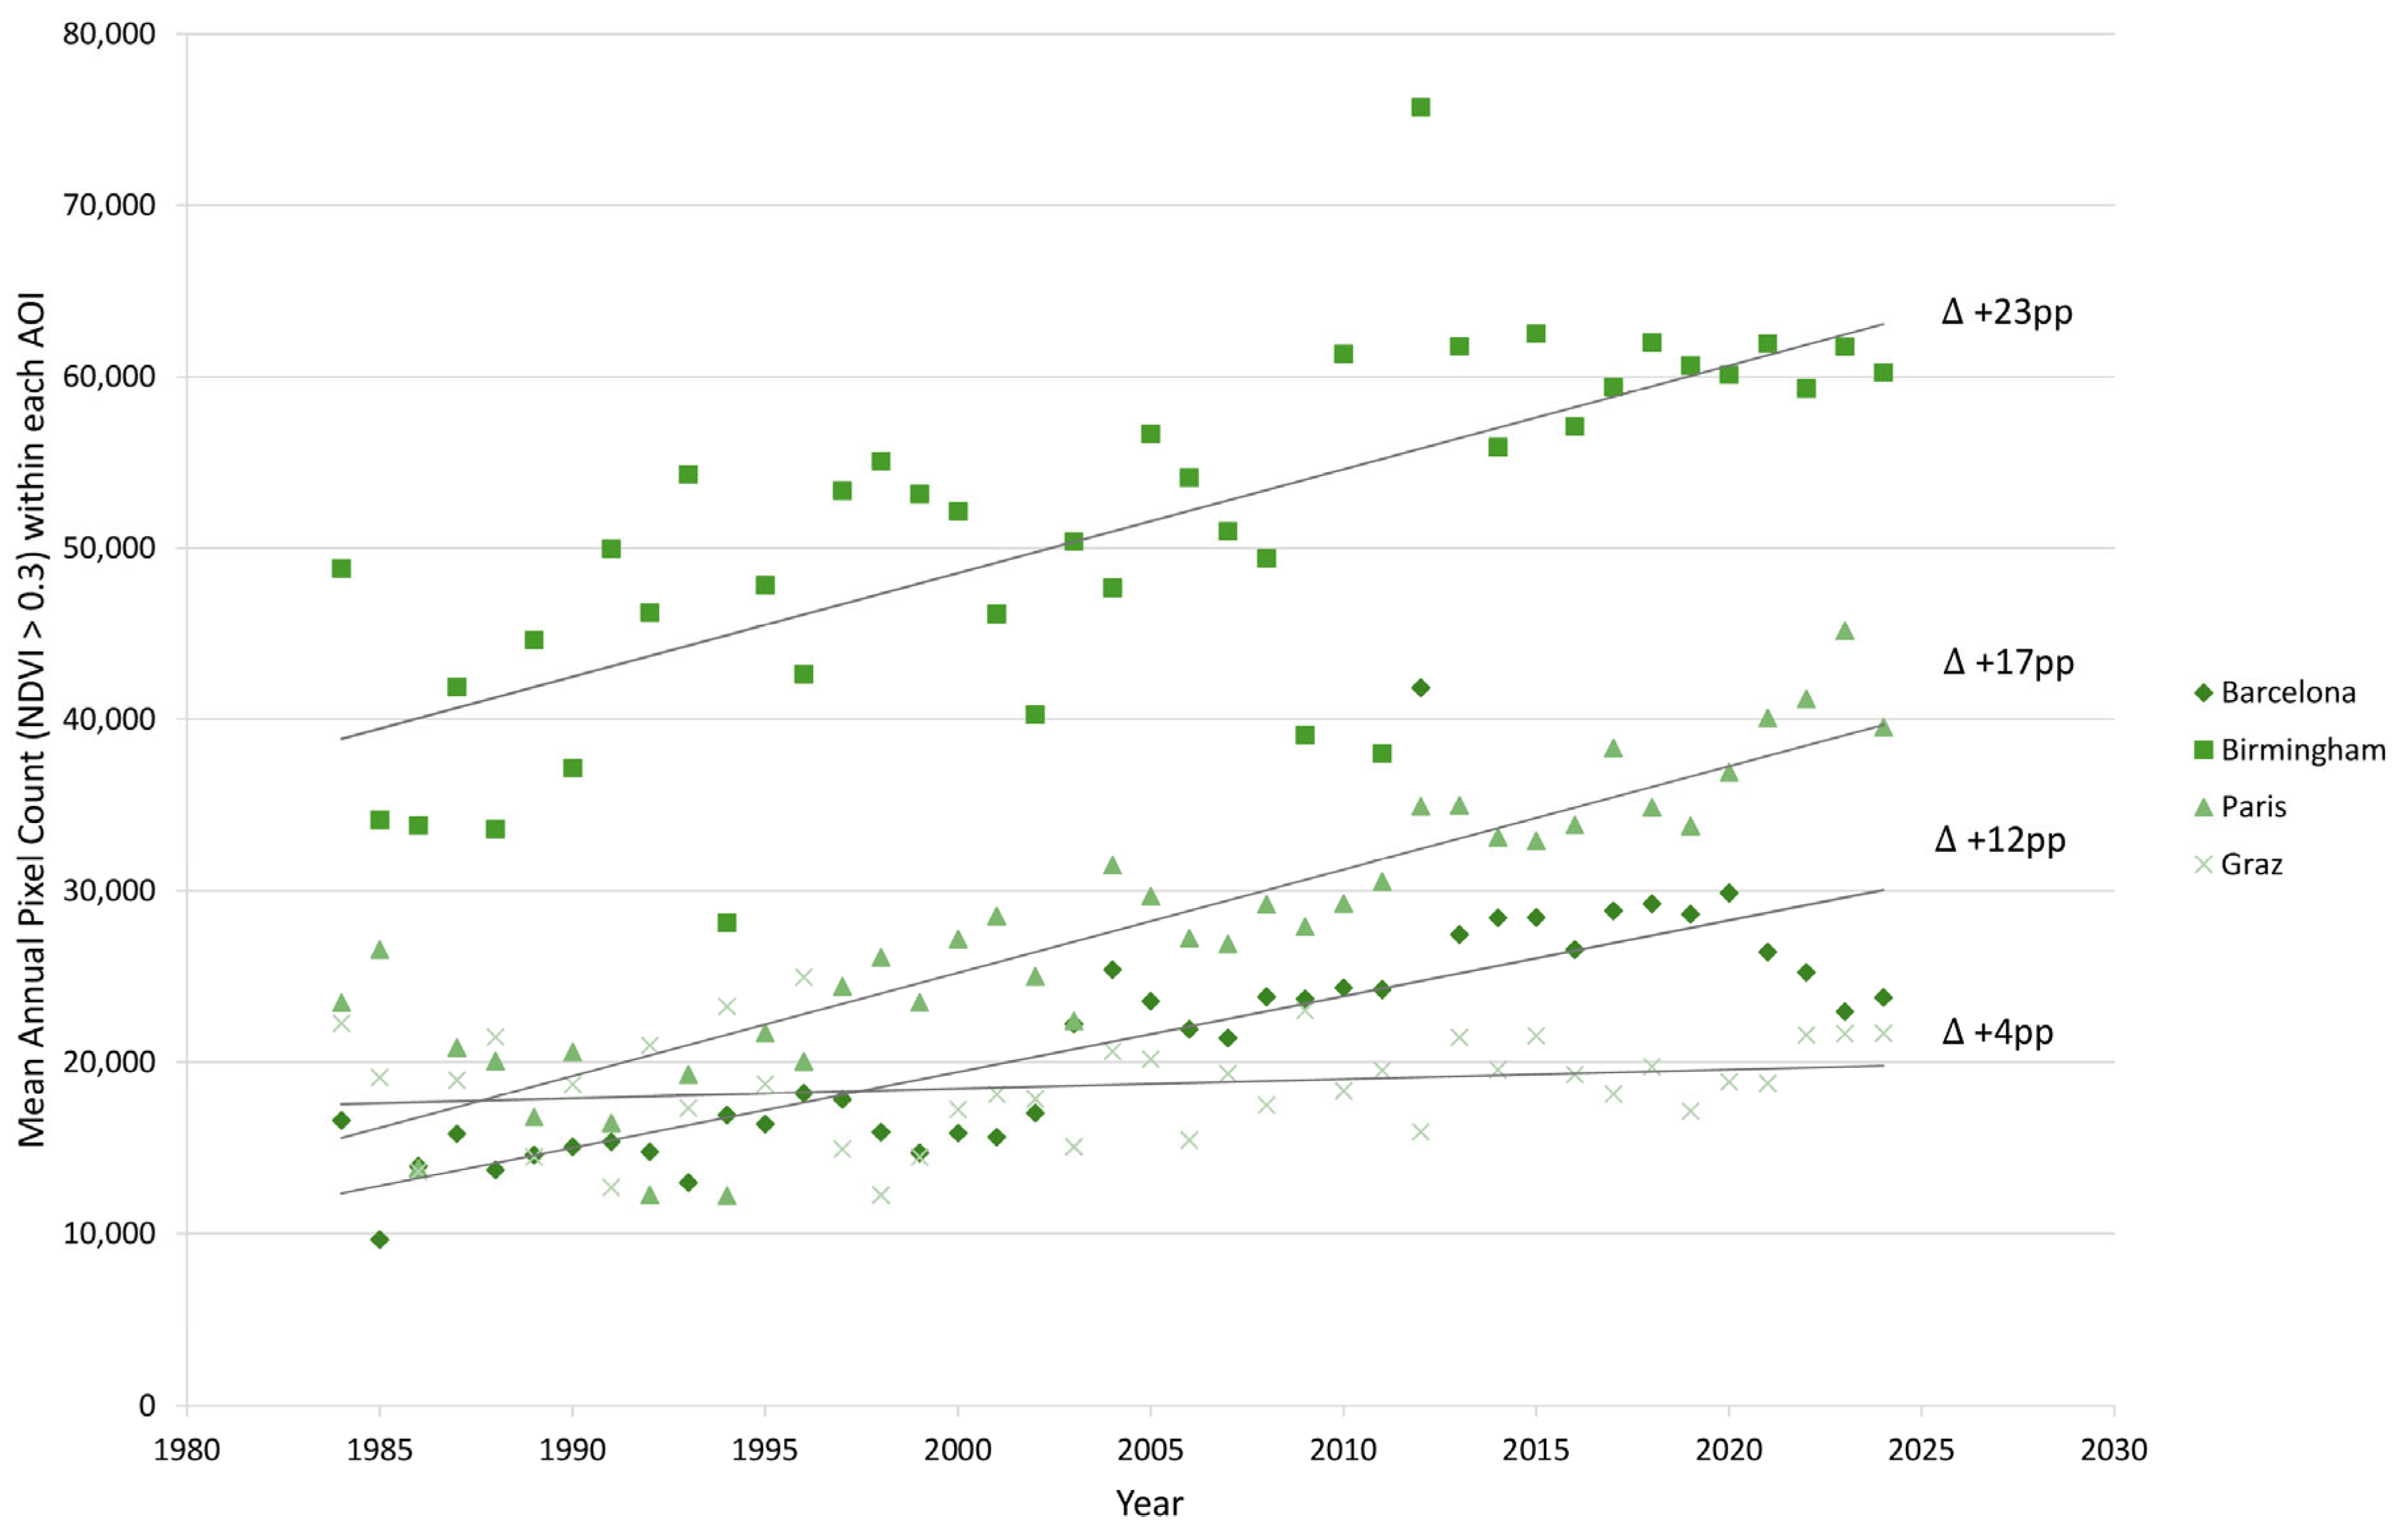
The annual mean number of pixels ( year), classified as active vegetation, increased in all four study sites (Figure 3). As explained in Section 2.4, cross-city comparisons are based on the change in the proportion of active vegetation pixels relative to the total number of pixels within each AOI.
Figure 3.
Annual mean number of pixels with NDVI > 0.3, representing active vegetation, from 1984 to 2024 across the four study sites. The lines provide the fitted linear regression trends. Absolute pixel counts illustrate within-city changes over time, whereas cross-city comparisons are based on percentage-point (pp) changes () relative to the total AOI area.
Overall, Barcelona exhibited an absolute change () of +12 percentage points (pp) and a relative increase () of +84%, while Paris showed a comparable increase of +17 pp but the largest relative increase (+ 94%), reflecting its lower initial proportion of active vegetation. Birmingham displayed the largest absolute change, with an increase of +23 pp (+58% relative increase) over the same period. Graz remained largely stable, showing an increase of +4 pp (+8% relative increase).
3.2.2. Peak NDVI and Long-Term Shifts
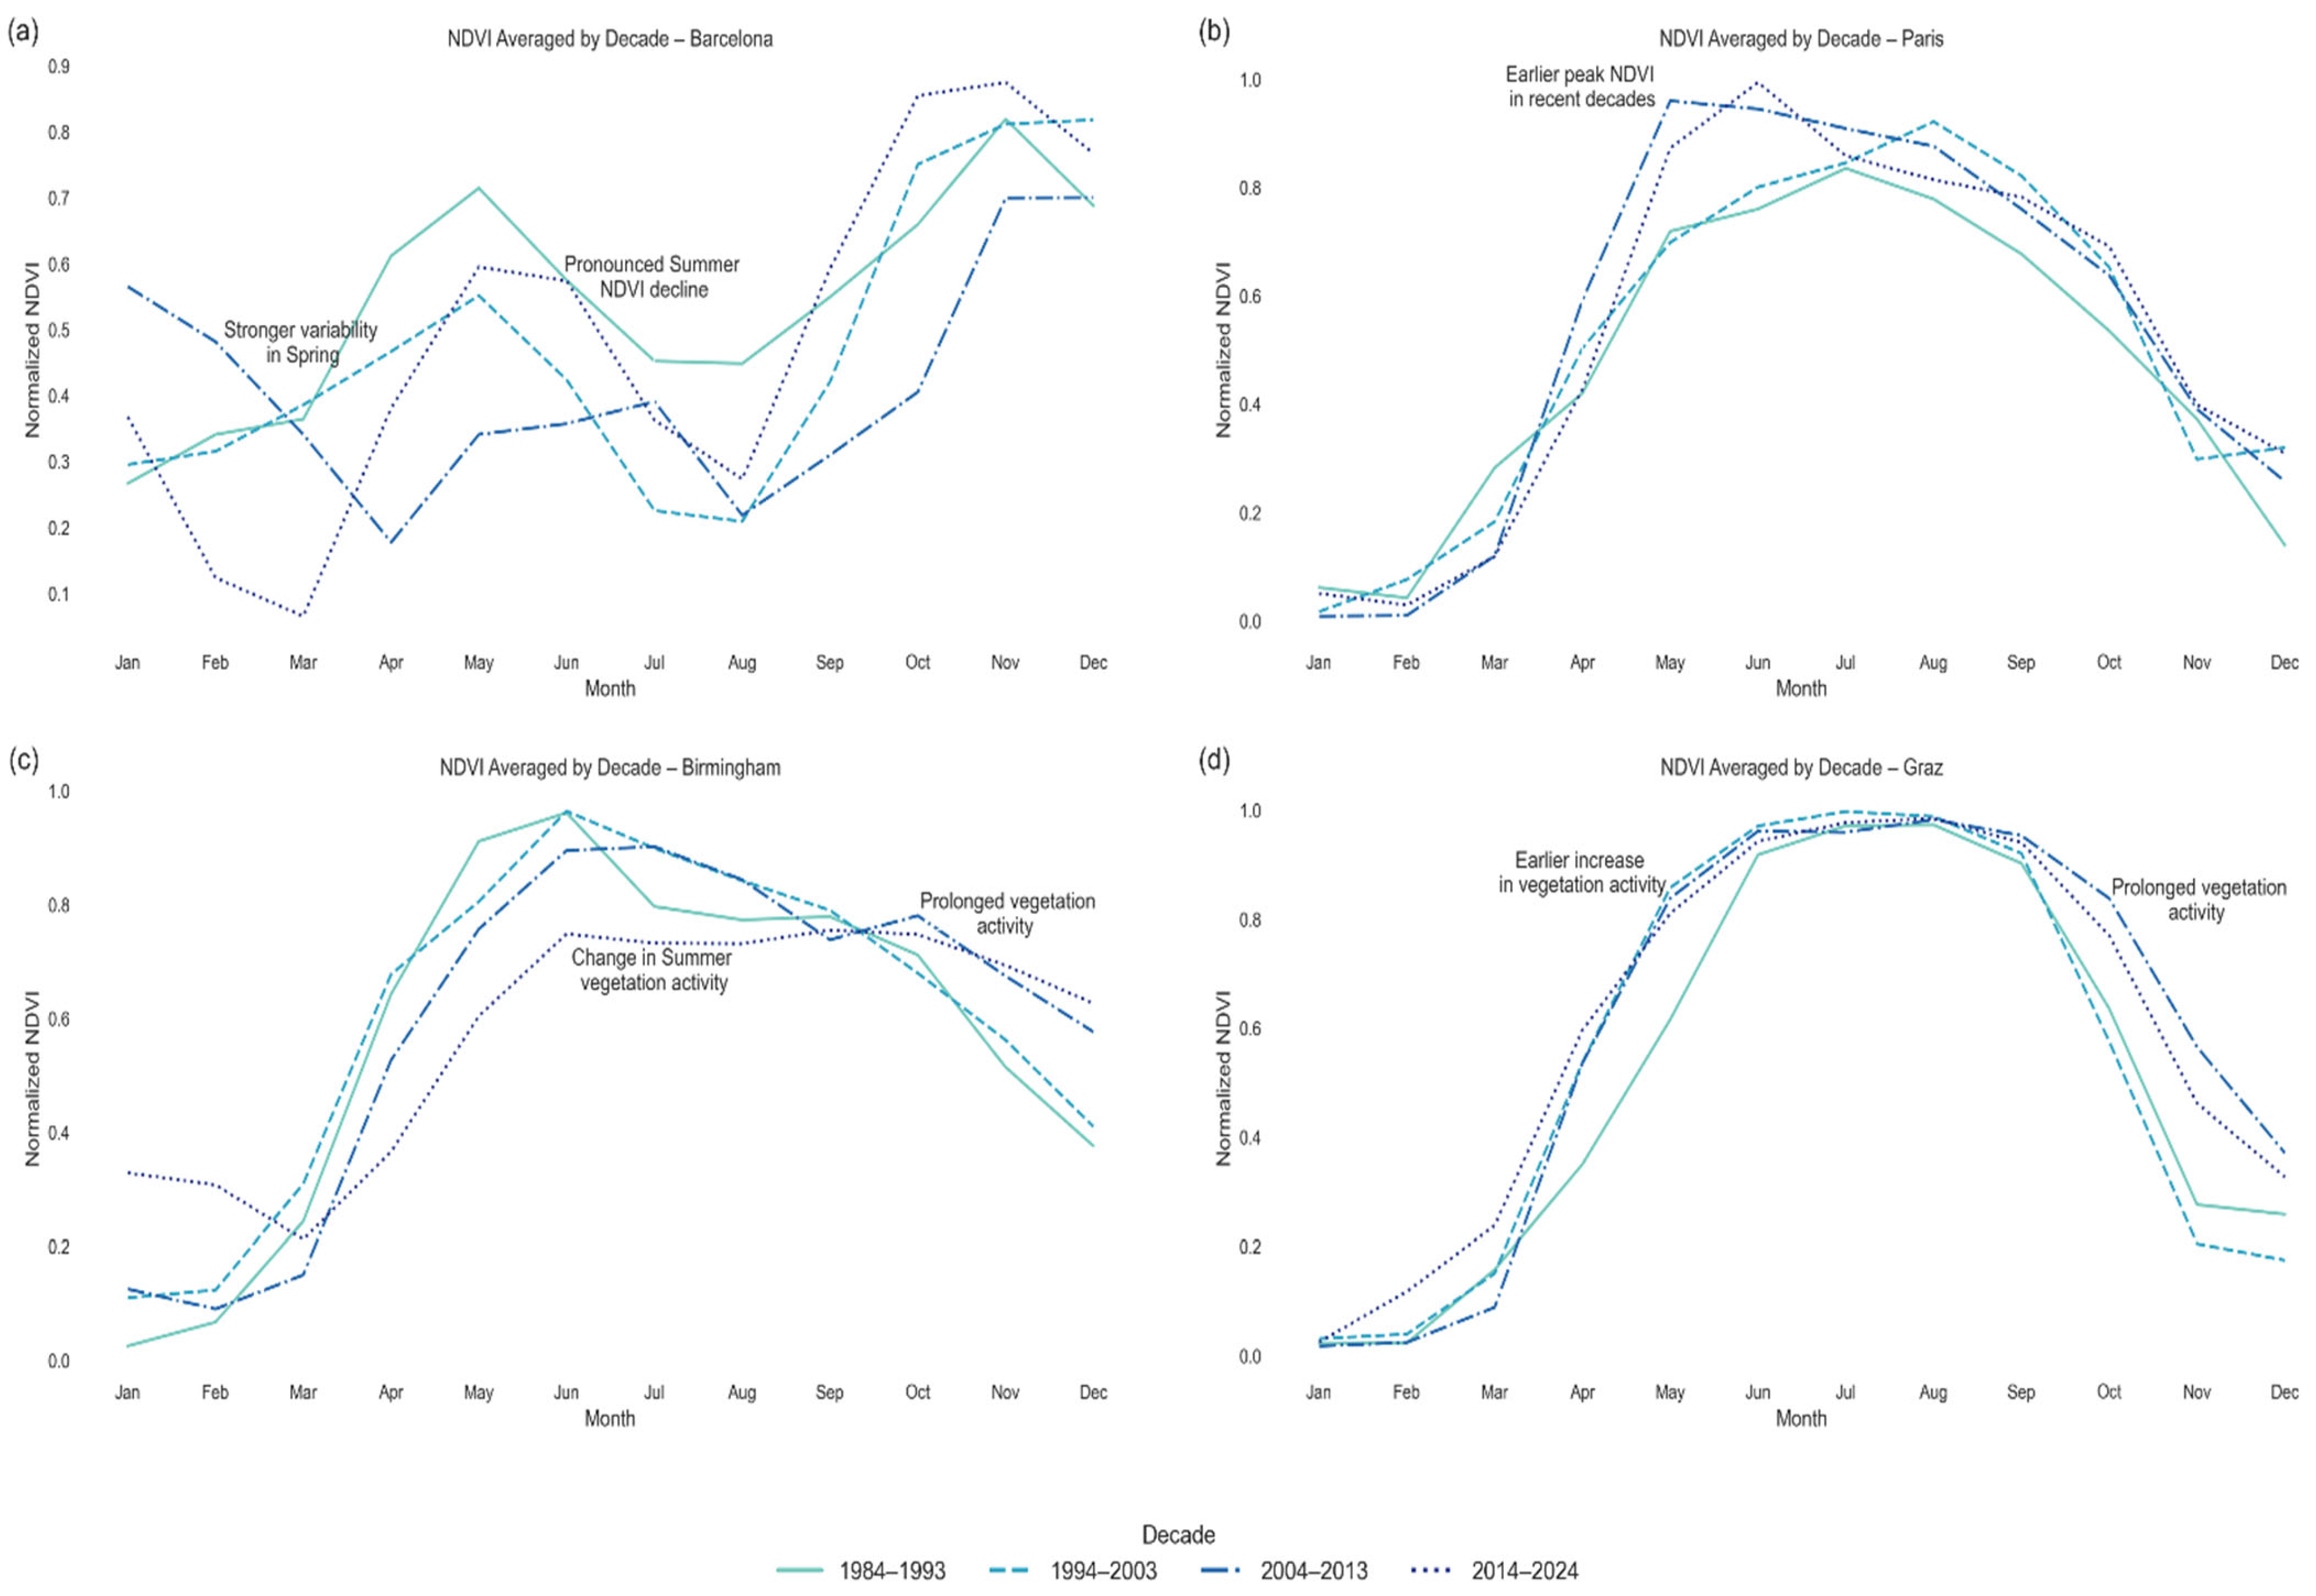
While the trend analysis for the change in peak NDVI values resulted in a moderate increase in mean peak values (consistently, values range between 0.8 and 1), the primary change is the shift in peak vegetation activity and its temporal distribution illustrated both in Figure 4 and Figure 5, indicating distinct changes in vegetation dynamics.
Figure 4.
Min-max normalized NDVI heatmaps (0–1 scale) showing seasonal shifts from 1984 to 2024 for (a) Barcelona, (b) Paris, (c) Birmingham, and (d) Graz. X-axis represents months (January–December), and the Y-axis represents years. Darker colors indicate higher NDVInorm, with the max value for each year closer to 1. Earlier spring onset is indicated by the progressive shift in high normalized values toward earlier months, whereas prolonged autumn activity is reflected by the persistence of elevated values into later months.
Figure 5.
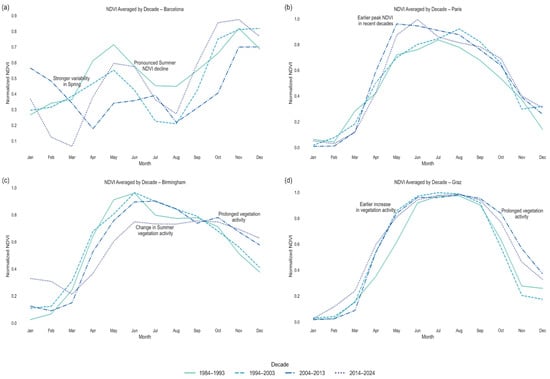
Decadal breakdown of the normalized NDVI values highlighting seasonal shifts for (a) Barcelona, (b) Paris, (c) Birmingham, and (d) Graz. Annotations highlight main temporal changes in seasonal vegetation dynamics, including shifts in the timing of vegetation activity, changes in peak seasonal NDVI, and city-specific seasonal patterns.
Figure 4 shows heatmaps of the normalized NDVI values (from 0 = lowest (lightest color), to 1 = highest (darkest color)) in a year. Shifts in the NDVI distribution can be seen as peak activity in Paris shifting from July/August to June more frequently; higher NDVI values appear in the fall/early winter months (November/December) in Birmingham, and also sharper drops in NDVI during the summer months both in Barcelona over time and during the last five years in Birmingham (July/August).
The decadal breakdown shown in Figure 5 further highlights how vegetation phenology changed. Strong influences from single years are evened out, while making sudden changes, acceleration, or slowed-down developments within the 40-year time series more visible. Barcelona shows more pronounced drops in vegetation activity during the summer months followed by an increase in vegetation activity during the fall and winter months. In Birmingham, vegetation activity shows a trend in the last 20 years (2004–2024) of staying active for longer during the winter months. In Paris, peak vegetation activity is reached earlier within the last 20 years (2004–2024). Graz experiences earlier SOS as well as a later EOS activity, with peak values remaining stable during the summer months. Late fall months also show higher vegetation activity within the last two periods (2004–2024) compared to the first two (1984–2003).
3.2.3. Changes in Growing Season Length
The results from Section 3.2.2 show that shifts in vegetation phenology were observed across all study sites, but significance varied depending on amplitude thresholds. A sensitivity analysis using 20%, 30%, and 50% amplitude thresholds showed that the significance of SOS and EOS trends varied between cities. When using the 30% amplitude threshold, a statistically significant trend in vegetation phenology was detected only for Graz. The remaining cities showed directional changes in SOS and EOS but did not reach statistical significance.
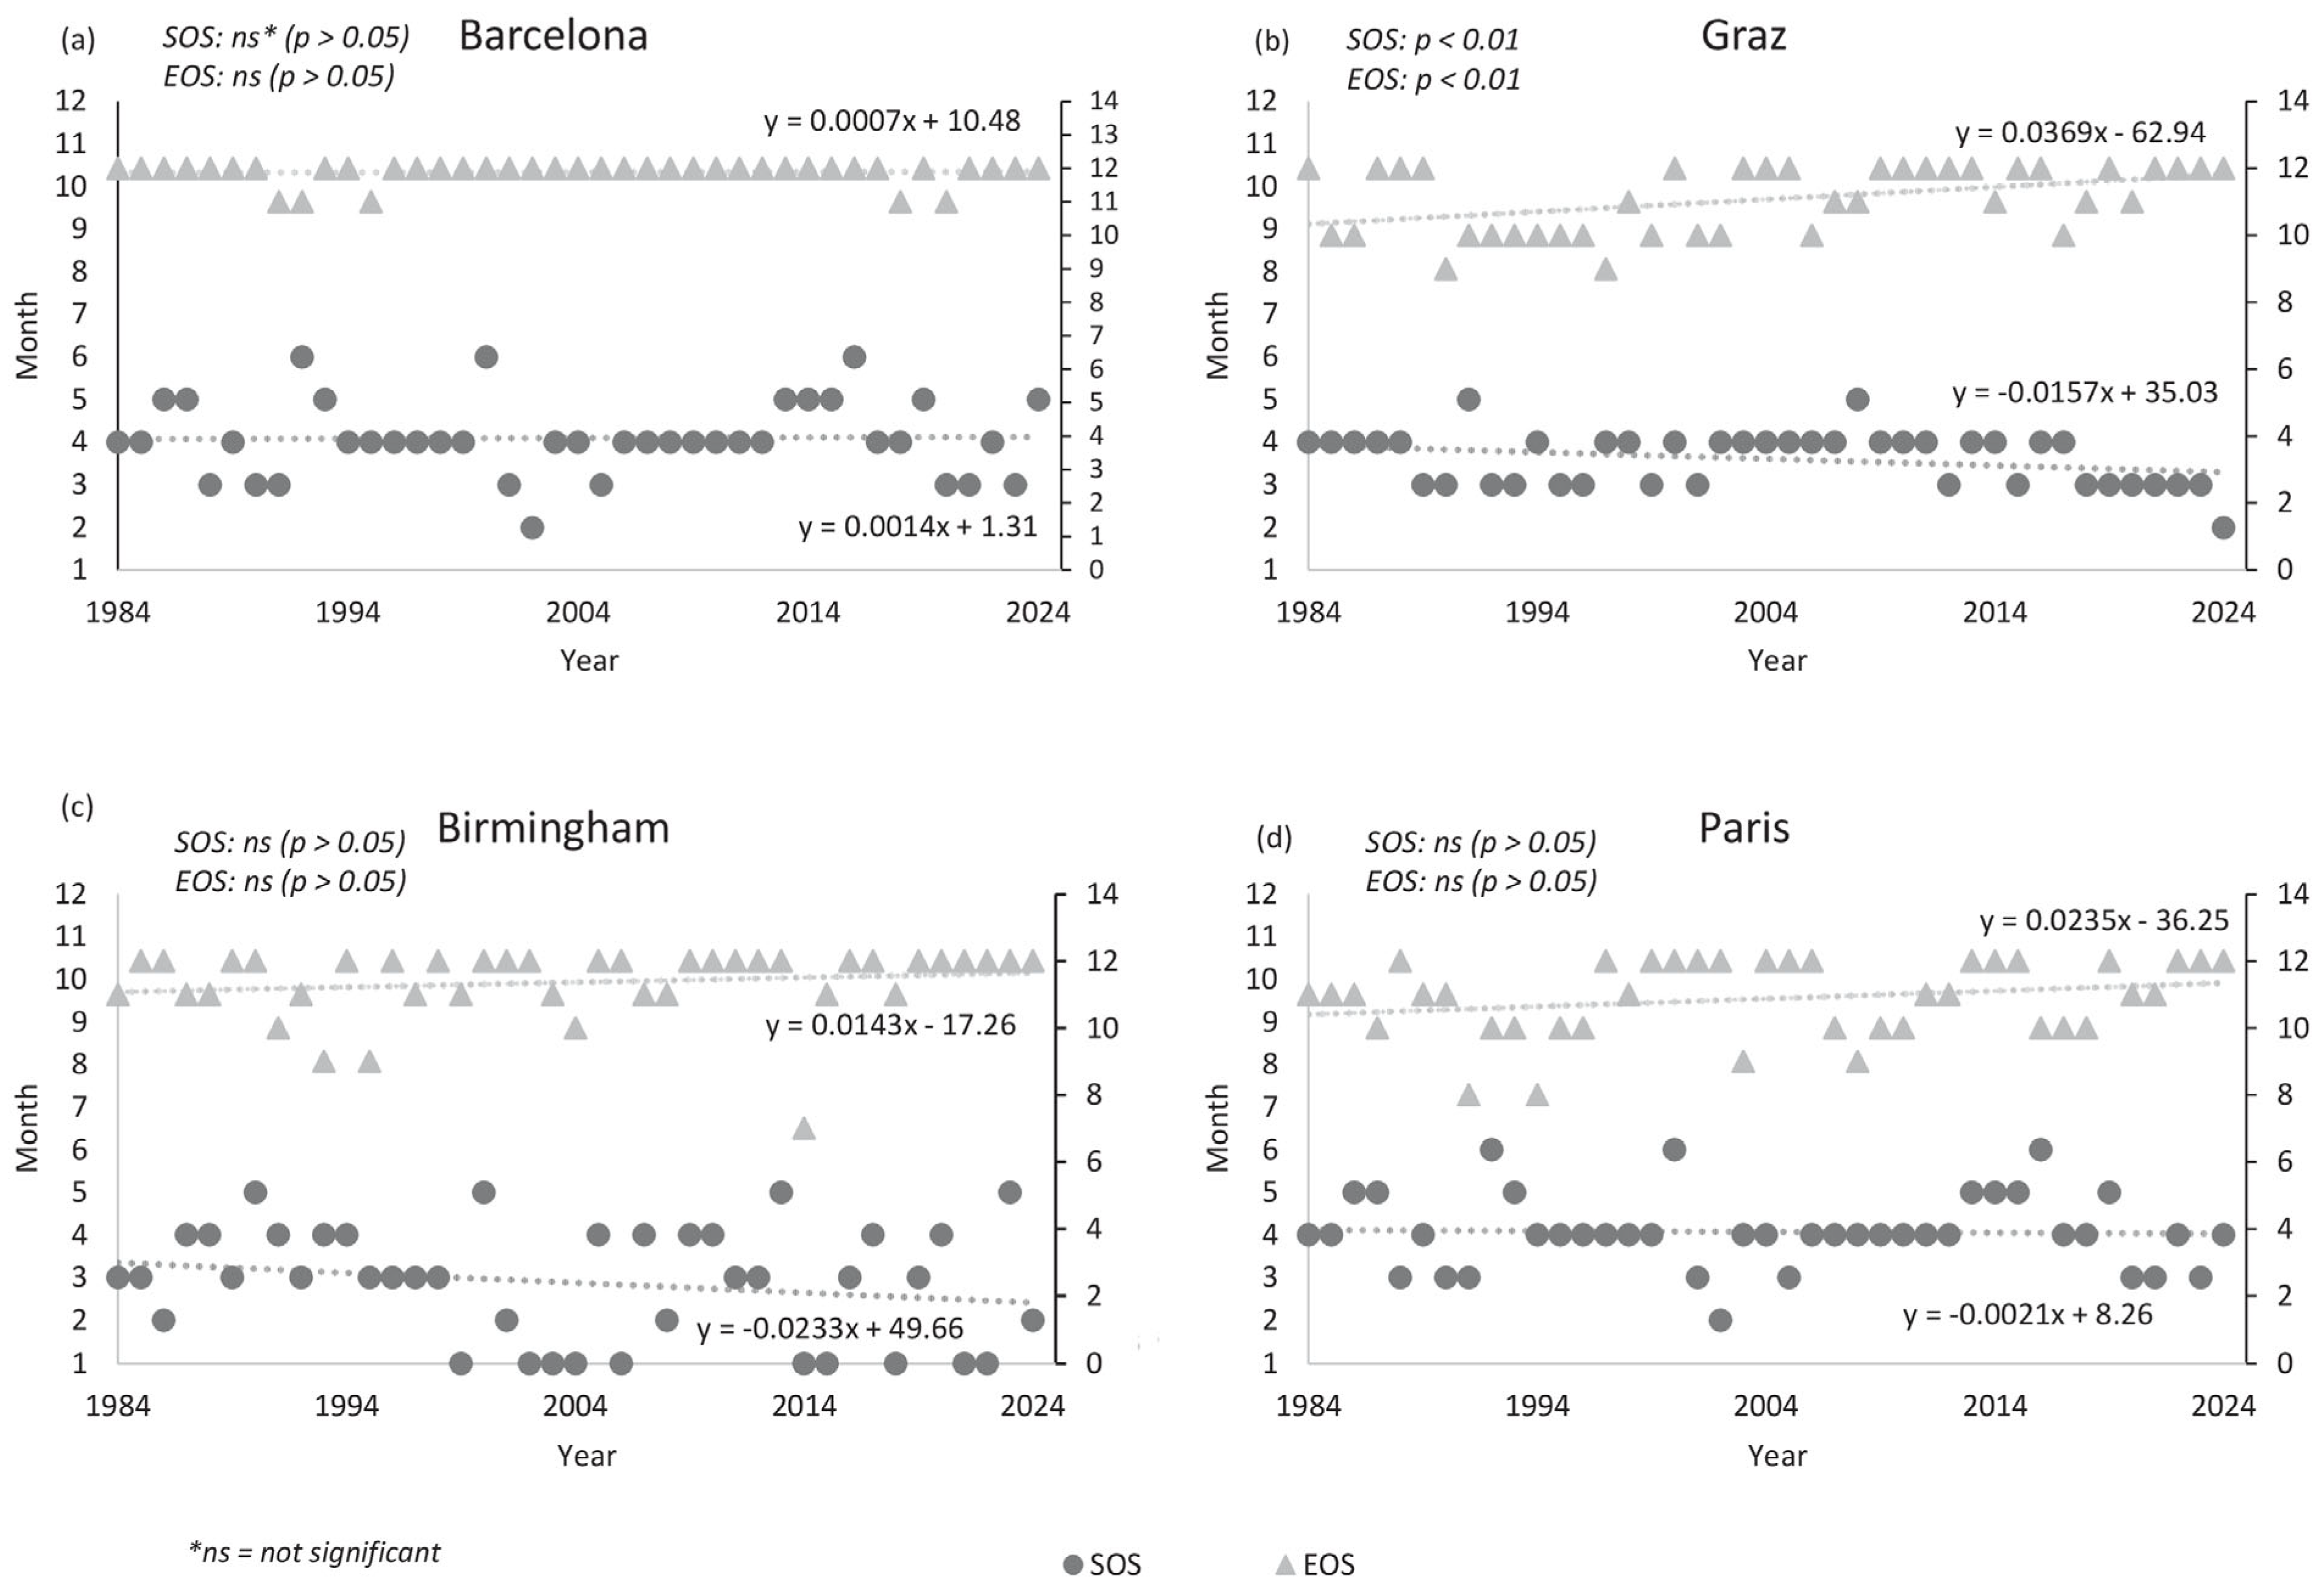
Graz exhibited significant SOS and EOS trends (p < 0.01) at both the 20% and 30% thresholds, indicating an earlier onset of vegetation activity and prolonged vegetation activity. In contrast, significant trends in Paris (p < 0.01) and Birmingham (p < 0.05) were limited to individual thresholds (20%, 50%), while no significant phenological trends were detected for Barcelona.
Figure 6 shows the timing of threshold crossing in which the 30% threshold was reached and the fitted linear regression trends. Changes towards an earlier SOS were observed for Birmingham, Graz and Paris, while Barcelona showed weak trends towards a later SOS. Conversely, EOS trends indicating a later offset were positive for all study sites, although trends were mostly not significant for the threshold chosen.
Figure 6.
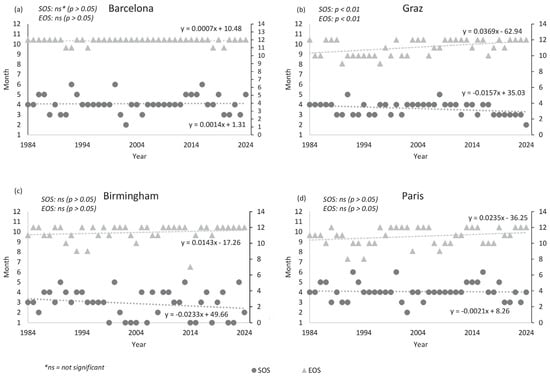
Annual Start of Season (SOS) and End of Season (EOS) trends for (a) Graz (b) Barcelona (c) Birmingham and (d) Paris. SOS (circles/dark grey) and EOS (triangle/light grey) values were derived from normalized NDVI time series using a 30% amplitude threshold. Points represent the month in which the 30% threshold was reached for each year between 1984 and 2024; significance was assessed using the Mann–Kendall test, while dotted lines indicate linear regression trends.
3.2.4. Interannual Stability and Variability
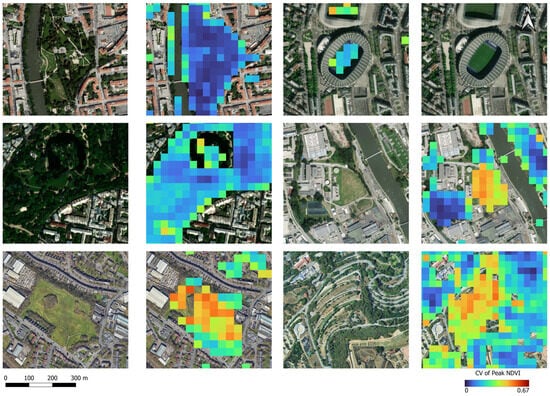
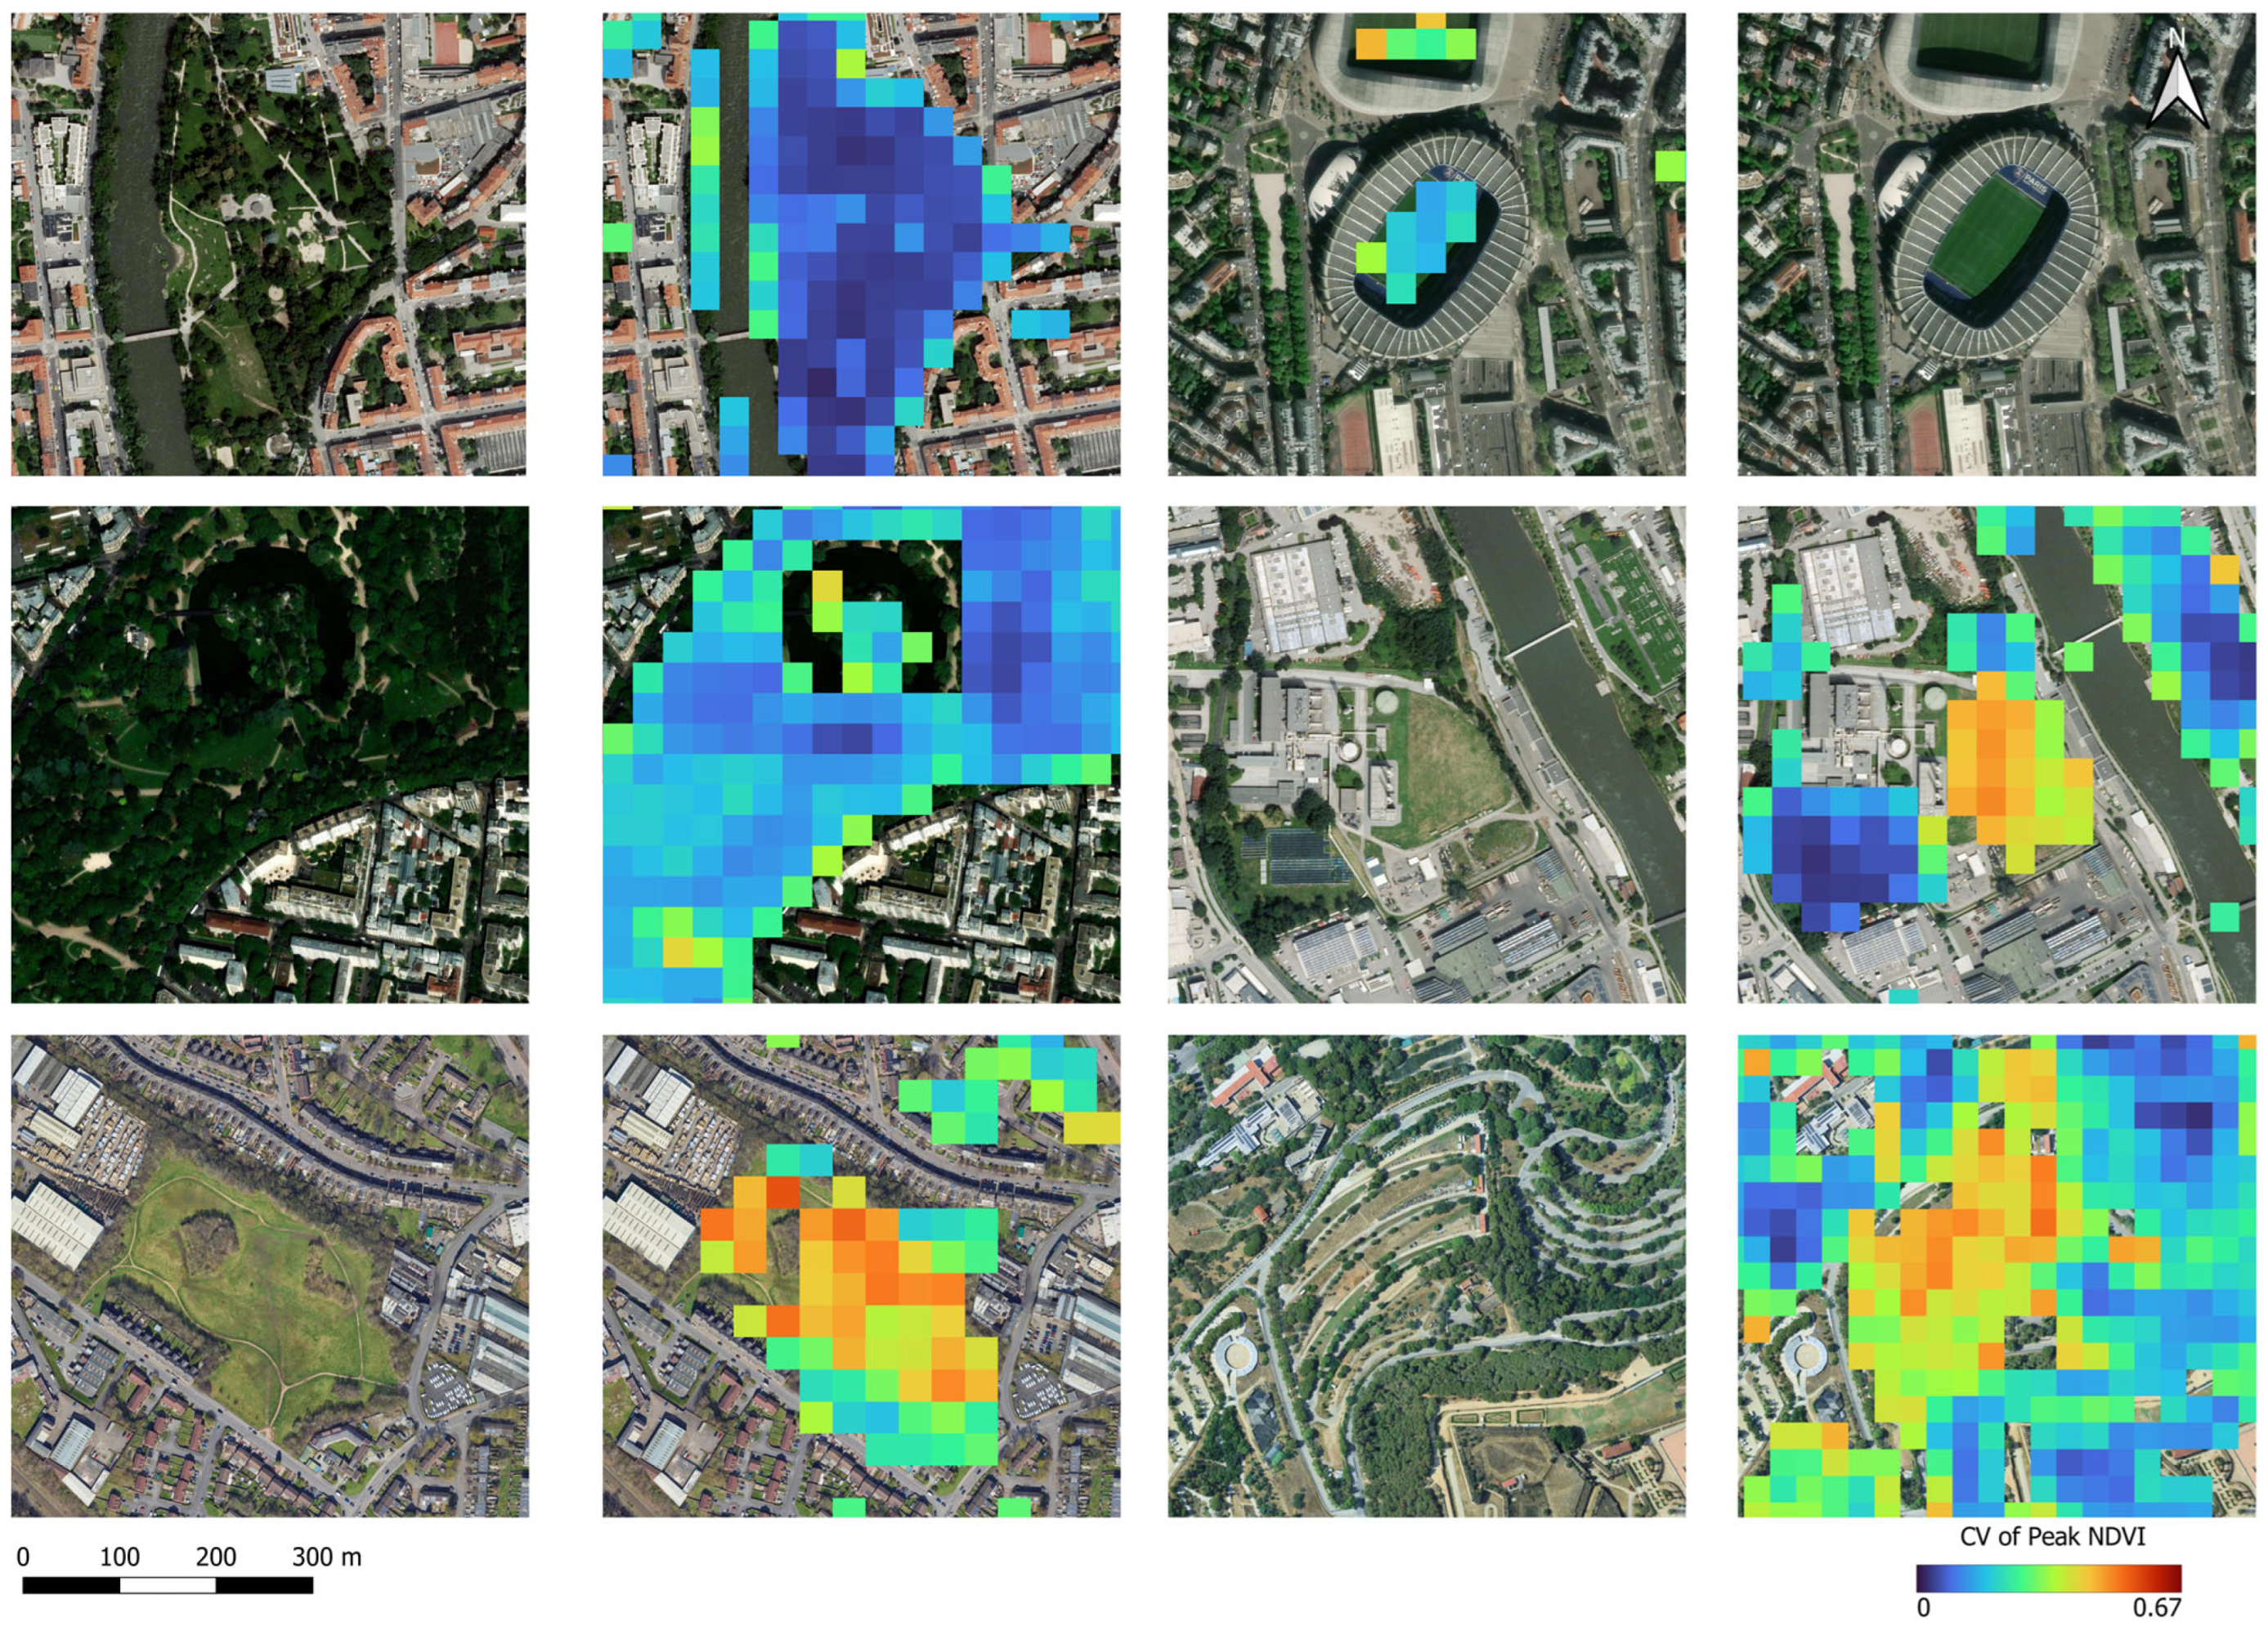
The Coefficients of Variation (CV) were calculated as described in Section 2.4. A visual inspection of the spatial distribution of CV values showed the following patterns among the urban green spaces in each city: large, contiguous, tree-dominated green spaces exhibited mostly low interannual variability (CV ≈ 0.1); the same was the case for stadiums and many sports fields. In contrast, small-scale, more open green spaces (private gardens, street-side vegetation, large grass areas) showed higher volatility (CV ≈ 0.3). Figure 7 shows representative examples in every city of varying degrees of variability.
Figure 7.
Visual representation of interannual variability (CV) of vegetation greenness in various urban green spaces across the study sites. CV values are calculated per pixel of the observation period 1984–2024.
3.3. Statistical Trend Analysis
Applying the Mann–Kendall trend tests with Sen’s slope estimators to the normalized NDVI values for each calendar month individually allowed us to quantify the magnitude and significance of the NDVI changes for every month across the 40-year period (1984–2024). Significant trends were observed primarily in spring (March–May) and autumn (October–November). Barcelona and Birmingham showed decreasing trends of NDVI in spring (March–April) and summer months (June–August). Paris and Graz exhibited predominantly positive trends throughout the year. Table 2 provides an example of months with significant trends (p < 0.01).
Table 2.
Excerpt of significant NDVI trends (p < 0.01) and Sen’s Slope.
Table 3 groups the monthly trends to show seasonal trend characteristics of each study site. Values with a p-value greater than 0.05 were not provided due to their low significance.
Table 3.
Seasonal trends calculated as seasonal Theil–Sen’s Slope for each study site [NDVI units/year].
4. Discussion
4.1. Long-Term Vegetation Dynamics Trends
The results showed significant changes in urban vegetation dynamics and extent over the study period (1984–2024), with trends becoming especially noticeable in the last 20 years. Although the magnitude and timing of the vegetation changes differ among the investigated cities due to climatic and geographic differences, all cities showed an increase in vegetation extent, while changes in growing season length, interannual variability, and annual peak timing varied between study sites. While vegetation cover has expanded, urban vegetation is increasingly influenced by shifts in seasonal vegetation dynamics, characterized by changes in the timing and distribution of vegetation activity and declines in NDVI during the late spring and summer months, particularly in Mediterranean and Oceanic cities. The higher Coefficient of Variation (CV ≈ 0.3) observed in smaller, more fragmented urban green spaces suggests a higher vulnerability to interannual climate variability compared to larger areas with more mature trees (CV ≈ 0.1). Comparably, the low CV values observed in many stadiums and sports fields may reflect regular maintenance and irrigation practices that stabilize vegetation conditions. However, while the higher interannual variability observed in fragmented urban green spaces may partly reflect ecological differences, it may also result from mixed-pixel effects associated with the 30 m spatial resolution of Landsat. Small vegetation patches, street trees, and narrow green corridors in dense urban environments such as in Barcelona are more likely to occupy only a fraction of a pixel and are frequently mixed with impervious surfaces, consequently increasing temporal variability and uncertainty in NDVI measurements. Therefore, CV patterns likely reflect a combination of vegetation characteristics, urban landscape structure, management practices, and sensor-resolution effects. The influence of these factors should be tested using higher temporal and spatial resolution datasets [61].
Sensitivity analyses testing 20%, 30%, and 50% amplitude thresholds demonstrated that the significance of phenological trends depended on the selected threshold. While the earlier SOS and later EOS trend in Graz remained significant across multiple thresholds, significant trends in Paris and Birmingham were only observed for individual threshold definitions, and no significant trends were detected for Barcelona. This indicates that phenological metrics derived from monthly NDVI composites are sensitive to threshold selection when long-term shifts are relatively small.
Barcelona did not exhibit significant SOS or EOS trends using the applied threshold-based phenology approach, which may partly reflect the Mediterranean seasonal cycle, where vegetation activity is less characterized by a single spring onset and autumn senescence phase. Instead, vegetation dynamics are strongly influenced by summer drought and autumn/winter precipitation, which may not be fully captured by conventional SOS/EOS metrics and were not analyzed as part of this study design.
The observed decline in NDVI values and the significant monthly and seasonal trends in the spring and summer months in Barcelona and Birmingham are, however, consistent with seasonal water stress reported in Mediterranean and Oceanic urban environments [62], although other factors such as vegetation management and land-use change may also contribute.
4.2. Relevance of Long-Term Vegetation Dynamics for Urban Water Management
The core idea of this study was to analyze the changing urban vegetation over a forty-year time period in different European climates to create a comparative baseline for future research linking long-term vegetation dynamics with urban water management and irrigation demand under climate change. Previous studies show that variations in NDVI, evapotranspiration rates, and vegetation condition can be associated with temperature and water availability [38,63]. With the increase in urban green and changes in precipitation and temperature patterns, maintenance of urban green spaces might become a relevant driver for urban water demand if irrigation requirements increase under future climate conditions.
Our findings indicate that vegetation activity has changed across all study sites with earlier seasonal onsets, delayed offsets, and seasonal variations eventually contributing to changing periods of vegetation activity. These changes may extend or alter the period during which vegetation contributes to evapotranspiration and might affect future irrigation requirements [35,64]. However, it is important to note that NDVI is a value for vegetation greenness and does not directly quantify irrigation requirements or evapotranspiration rates; the observed changes should therefore be interpreted as indicators rather than direct measurements of increased water consumption.
Urban vegetation dynamics are influenced by multiple interacting factors. In addition to long-term climatic changes, local land-use change, urban redevelopment, vegetation management practices, irrigation and species composition may all contribute to the observed NDVI trends. Because this study was designed to quantify long-term vegetation dynamics rather than attribute their individual drivers, the observed changes should be interpreted as integrated responses to these interacting processes.
Taken together, if vegetation remains active for longer throughout the growing season, the period during which water availability influences vegetation conditions may increase. These factors may increase water stress in urban vegetation, reduce vegetation vitality, and lead to a greater reliance on irrigation, increasing the water requirements of urban green infrastructure. The potential implications are that changing phenological patterns should be considered when adapting irrigation schedules and monitoring vegetation stress. However, the magnitude of future irrigation water demand will depend on additional factors, including precipitation patterns, temperature development, soil water availability, vegetation composition, and management practices.
The present study is subject to some limitations. First, all vegetation was analyzed without distinguishing between vegetation types, comprising the distinct phenological responses, and instead treats urban green space as a homogeneous category. Future research should differentiate vegetation-type-specific trends as well as differentiate between publicly managed (e.g., parks) and privately managed green spaces (e.g., residential gardens), as these are likely to differ in plant composition as well as irrigation and management practices. Integrating additional information about water use (e.g., irrigation records, water supply data) for private and public green space irrigation would further improve the understanding of the drivers of the observed vegetation dynamics. Moreover, this study focused solely on NDVI derived from Landsat imagery and hence is subject to limitations resulting from the mixed-pixel problem and the limitations of the spatial and temporal resolution. Higher resolution remote sensing data would better capture spatial heterogeneity of urban green spaces but does not allow for the same time series length. Although annual interpolation rates showed no systematic temporal trend, interpolation may still introduce uncertainty into the derived phenological metrics, particularly in cities with persistent cloud cover such as Birmingham. Future studies should evaluate the sensitivity of the results using cross-validation approaches as well as integrate meteorological variables, irrigation records, and evapotranspiration estimates to quantify actual urban water demand and impact on NDVI variations.
5. Conclusions
Remote sensing has proven to be valuable for monitoring urban vegetation change, and recent advances demonstrate the increasing potential of satellite-based observations for assessing vegetation dynamics and urban environmental processes [65,66,67,68]. Using remote sensing technologies for this study allowed monitoring across administrative boundaries, land-use types, climatic differences, and time periods, revealing the shifts in interannual variability and vegetation phenology over the last 40 years as well as the similar long-term trends in vegetation dynamics across the study sites. The study provides a consistent application of a harmonized long-term methodology across four different European cities over four decades. The resulting dataset provides a long-term, 40-year comparative assessment of urban vegetation dynamics and establishes a baseline for integrating remotely sensed vegetation changes with future evapotranspiration and urban water demand modeling.
Overall, the increase in vegetation extent observed in this study may not necessarily indicate long-term resilience, and newly established vegetation may require additional irrigation to maintain vitality during months with high temperatures and low precipitation.
The findings highlight that urban greening strategies should aim not only to increase vegetation cover but also to enhance the long-term resilience and functionality of urban ecosystems and focus on integrating water management strategies into urban greening initiatives to ensure that urban green infrastructure remains functional and resilient under increasing climate stress.
Supplementary Materials
The following supporting information can be downloaded at: https://www.mdpi.com/article/10.3390/rs18162652/s1, File S1: AOIs outline Files provided as shapefiles, File S2: Yearly fraction interpolated NDVI values.
Author Contributions
Conceptualization, F.S.K., A.W.K. and D.F.-H.; methodology, F.S.K.; validation, F.S.K.; formal analysis, F.S.K.; investigation, F.S.K.; resources, D.F.-H.; data curation, F.S.K.; writing—original draft preparation, F.S.K.; writing—review and editing, F.S.K., A.W.K. and D.F.-H.; visualization, F.S.K.; supervision, D.F.-H.; project administration, D.F.-H.; funding acquisition, F.S.K. and D.F.-H. All authors have read and agreed to the published version of the manuscript.
Funding
Data processing services used for this research were funded by the ESA Network of Resources under the request ID 4a14QG (https://nor-discover.org/, accessed on 29 June 2026) and accessed via SentinelHub (https://www.sentinel-hub.com/, accessed on 29 June 2026).
Data Availability Statement
The data presented in this study are available on request from the corresponding author due to ongoing research. Landsat Spectral Indices products courtesy of the U.S. Geological Survey Earth Resources Observation and Science Center and processed by Sentinel Hub. Landsat data is publicly available at https://earthexplorer.usgs.gov/, accessed on 29 June 2026.
Acknowledgments
During the preparation of this manuscript, the authors used ChatGPT (4.5 and higher) to help with code development and code adaptation. DeepL (Version 25.8.2) was used to improve text and readability. The authors have reviewed and edited the output and take full responsibility for the content of this publication. Open Access Funding by the Graz University of Technology.
Conflicts of Interest
The authors declare no conflicts of interest.
Abbreviations
The following abbreviations are used in this manuscript:
| NDVI | Normalized Difference Vegetation Index |
| AOI | Area of Interest |
| SOS | Start of Season |
| EOS | End of Season |
| CV | Coefficient of Variation |
| TM | Thematic Mapper |
| ETM | Enhanced Thematic Mapper |
| OLI-TIRS | Optical Land Imager–Thermal Infrared Sensor |
| NIR | Near-Infrared |
References
- Korkou, M.; Tarigan, A.K.M.; Hanslin, H.M. The Multifunctionality Concept in Urban Green Infrastructure Planning: A Systematic Literature Review. Urban For. Urban Green. 2023, 85, 127975. [Google Scholar] [CrossRef] [Scilit]
- Li, L.; Carter, J. Exploring the Relationship between Urban Green Infrastructure Connectivity, Size and Multifunctionality: A Systematic Review. Landsc. Ecol. 2025, 40, 61. [Google Scholar] [CrossRef] [Scilit] [PubMed]
- Jones, L.; Anderson, S.; Læssøe, J.; Banzhaf, E.; Jensen, A.; Bird, D.N.; Miller, J.; Hutchins, M.G.; Yang, J.; Garrett, J.; et al. A Typology for Urban Green Infrastructure to Guide Multifunctional Planning of Nature-Based Solutions. Nat.-Based Solut. 2022, 2, 100041. [Google Scholar] [CrossRef] [Scilit]
- Wang, D.; Xu, P.-Y.; An, B.-W.; Guo, Q.-P. Urban Green Infrastructure: Bridging Biodiversity Conservation and Sustainable Urban Development through Adaptive Management Approach. Front. Ecol. Evol. 2024, 12, 1440477. [Google Scholar] [CrossRef] [Scilit]
- Eisfelder, C.; Asam, S.; Hirner, A.; Reiners, P.; Holzwarth, S.; Bachmann, M.; Gessner, U.; Dietz, A.; Huth, J.; Bachofer, F.; et al. Seasonal Vegetation Trends for Europe over 30 Years from a Novel Normalised Difference Vegetation Index (NDVI) Time-Series—The TIMELINE NDVI Product. Remote Sens. 2023, 15, 3616. [Google Scholar] [CrossRef] [Scilit]
- Gutiérrez-Hernández, O.; García, L.V. Trends in Vegetation Seasonality in the Iberian Peninsula: Spatiotemporal Analysis Using AVHRR-NDVI Data (1982–2023). Sustainability 2024, 16, 9389. [Google Scholar] [CrossRef] [Scilit]
- Abbas, S.; Nichol, J.E.; Wong, M.S. Trends in Vegetation Productivity Related to Climate Change in China’s Pearl River Delta. PLoS ONE 2021, 16, e0245467. [Google Scholar] [CrossRef] [Scilit] [PubMed]
- Klimavičius, L.; Rimkus, E.; Stonevičius, E.; Mačiulytė, V. Seasonality and Long-Term Trends of NDVI Values in Different Land Use Types in the Eastern Part of the Baltic Sea Basin. Oceanologia 2023, 65, 171–181. [Google Scholar] [CrossRef] [Scilit]
- Andrusenko, E.; Van Der Werf, J.A.; Van Der Hoek, J.P.; Langeveld, J.G. Estimating the Impact of Blue-Green Infrastructure on Household Water Demand. Water Sci. Technol. 2025, 92, 96–111. [Google Scholar] [CrossRef] [Scilit] [PubMed]
- Blount, K.; Wolfand, J.M.; Bell, C.D.; Ajami, N.K.; Hogue, T.S. Satellites to Sprinklers: Assessing the Role of Climate and Land Cover Change on Patterns of Urban Outdoor Water Use. Water Resour. Res. 2021, 57, e2020WR027587. [Google Scholar] [CrossRef] [Scilit]
- Wang, Z.; Vivoni, E.R. Individualized and Combined Effects of Future Urban Growth and Climate Change on Irrigation Water Use in Central Arizona. J. Am. Water Resour. Assoc. 2022, 58, 370–387. [Google Scholar] [CrossRef] [Scilit]
- Tzoulas, K.; Korpela, K.; Venn, S.; Yli-Pelkonen, V.; Kaźmierczak, A.; Niemela, J.; James, P. Promoting Ecosystem and Human Health in Urban Areas Using Green Infrastructure: A Literature Review. Landsc. Urban Plan. 2007, 81, 167–178. [Google Scholar] [CrossRef] [Scilit]
- Bruner, S.G.; Palmer, M.I.; Griffin, K.L.; Naeem, S. Planting Design Influences Green Infrastructure Performance: Plant Species Identity and Complementarity in Rain Gardens. Ecol. Appl. 2023, 33, e2902. [Google Scholar] [CrossRef] [Scilit] [PubMed]
- AghaKouchak, A.; Chiang, F.; Huning, L.S.; Love, C.A.; Mallakpour, I.; Mazdiyasni, O.; Moftakhari, H.; Papalexiou, S.M.; Ragno, E.; Sadegh, M. Climate Extremes and Compound Hazards in a Warming World. Annu. Rev. Earth Planet. Sci. 2020, 48, 519–548. [Google Scholar] [CrossRef] [Scilit]
- Calvin, K.; Dasgupta, D.; Krinner, G.; Mukherji, A.; Thorne, P.W.; Trisos, C.; Romero, J.; Aldunce, P.; Barrett, K.; Blanco, G.; et al. IPCC, 2023: Climate Change 2023: Synthesis Report. Contribution of Working Groups I, II and III to the Sixth Assessment Report of the Intergovernmental Panel on Climate Change; Core Writing Team, Lee, H., Romero, J., Eds.; Intergovernmental Panel on Climate Change (IPCC): Geneva, Switzerland, 2023. [Google Scholar]
- Haslinger, K.; Breinl, K.; Pavlin, L.; Pistotnik, G.; Bertola, M.; Olefs, M.; Greilinger, M.; Schöner, W.; Blöschl, G. Increasing Hourly Heavy Rainfall in Austria Reflected in Flood Changes. Nature 2025, 639, 667–672. [Google Scholar] [CrossRef] [Scilit] [PubMed]
- Wu, C.; Peng, J.; Ciais, P.; Peñuelas, J.; Wang, H.; Beguería, S.; Andrew Black, T.; Jassal, R.S.; Zhang, X.; Yuan, W.; et al. Increased Drought Effects on the Phenology of Autumn Leaf Senescence. Nat. Clim. Change 2022, 12, 943–949. [Google Scholar] [CrossRef] [Scilit]
- Garonna, I.; De Jong, R.; De Wit, A.J.W.; Mücher, C.A.; Schmid, B.; Schaepman, M.E. Strong Contribution of Autumn Phenology to Changes in Satellite-derived Growing Season Length Estimates across Europe (1982–2011). Glob. Change Biol. 2014, 20, 3457–3470. [Google Scholar] [CrossRef] [Scilit] [PubMed]
- Zani, D.; Crowther, T.W.; Mo, L.; Renner, S.S.; Zohner, C.M. Increased Growing-Season Productivity Drives Earlier Autumn Leaf Senescence in Temperate Trees. Science 2020, 370, 1066–1071. [Google Scholar] [CrossRef] [Scilit] [PubMed]
- Piao, S.; Tan, J.; Chen, A.; Fu, Y.H.; Ciais, P.; Liu, Q.; Janssens, I.A.; Vicca, S.; Zeng, Z.; Jeong, S.-J.; et al. Leaf Onset in the Northern Hemisphere Triggered by Daytime Temperature. Nat. Commun. 2015, 6, 6911. [Google Scholar] [CrossRef] [Scilit] [PubMed]
- Eastman, J.; Sangermano, F.; Machado, E.; Rogan, J.; Anyamba, A. Global Trends in Seasonality of Normalized Difference Vegetation Index (NDVI), 1982–2011. Remote Sens. 2013, 5, 4799–4818. [Google Scholar] [CrossRef] [Scilit]
- Matas-Granados, L.; Pizarro, M.; Cayuela, L.; Domingo, D.; Gómez, D.; García, M.B. Long-Term Monitoring of NDVI Changes by Remote Sensing to Assess the Vulnerability of Threatened Plants. Biol. Conserv. 2022, 265, 109428. [Google Scholar] [CrossRef] [Scilit]
- Yan, K.; Gao, S.; Yan, G.; Ma, X.; Chen, X.; Zhu, P.; Li, J.; Gao, S.; Gastellu-Etchegorry, J.-P.; Myneni, R.B.; et al. A Global Systematic Review of the Remote Sensing Vegetation Indices. Int. J. Appl. Earth Obs. Geoinf. 2025, 139, 104560. [Google Scholar] [CrossRef] [Scilit]
- Fang, H.; Sha, M.; Xie, Y.; Lin, W.; Qiu, D.; Tu, J.; Tan, X.; Li, X.; Sha, Z. Shifted Global Vegetation Phenology in Response to Climate Changes and Its Feedback on Vegetation Carbon Uptake. Remote Sens. 2023, 15, 2288. [Google Scholar] [CrossRef] [Scilit]
- Hassan, T.; Gulzar, R.; Hamid, M.; Ahmad, R.; Waza, S.A.; Khuroo, A.A. Plant Phenology Shifts under Climate Warming: A Systematic Review of Recent Scientific Literature. Environ. Monit. Assess. 2024, 196, 36. [Google Scholar] [CrossRef] [Scilit] [PubMed]
- Tucker, C.J. Red and Photographic Infrared Linear Combinations for Monitoring Vegetation. Remote Sens. Environ. 1979, 8, 127–150. [Google Scholar] [CrossRef] [Scilit]
- Montandon, L.; Small, E. The Impact of Soil Reflectance on the Quantification of the Green Vegetation Fraction from NDVI. Remote Sens. Environ. 2008, 112, 1835–1845. [Google Scholar] [CrossRef] [Scilit]
- Landsat Normalized Difference Vegetation Index|U.S. Geological Survey. Available online: https://www.usgs.gov/landsat-missions/landsat-normalized-difference-vegetation-index (accessed on 19 May 2026).
- Rouse, W.; Haas, R.H. Monitoring Vegetation Systems in the Great Plains with ERTS. In Goddard Space Flight Center 3d ERTS-1 Symposium; NASA: Washington, DC, USA, 1974. [Google Scholar]
- Reinermann, S.; Gessner, U.; Asam, S.; Kuenzer, C.; Dech, S. The Effect of Droughts on Vegetation Condition in Germany: An Analysis Based on Two Decades of Satellite Earth Observation Time Series and Crop Yield Statistics. Remote Sens. 2019, 11, 1783. [Google Scholar] [CrossRef] [Scilit]
- Bastos, A.; Gouveia, C.M.; Trigo, R.M.; Running, S.W. Analysing the Spatio-Temporal Impacts of the 2003 and 2010 Extreme Heatwaves on Plant Productivity in Europe. Biogeosciences 2014, 11, 3421–3435. [Google Scholar] [CrossRef] [Scilit]
- Yuan, X.; Li, S.; Chen, J.; Yu, H.; Yang, T.; Wang, C.; Huang, S.; Chen, H.; Ao, X. Impacts of Global Climate Change on Agricultural Production: A Comprehensive Review. Agronomy 2024, 14, 1360. [Google Scholar] [CrossRef] [Scilit]
- Yu, Z.; Wang, J.; Liu, S.; Rentch, J.S.; Sun, P.; Lu, C. Global Gross Primary Productivity and Water Use Efficiency Changes under Drought Stress. Environ. Res. Lett. 2017, 12, 014016. [Google Scholar] [CrossRef] [Scilit]
- Telesca, L.; Lovallo, M.; Cardettini, G.; Aromando, A.; Abate, N.; Proto, M.; Loperte, A.; Masini, N.; Lasaponara, R. Urban and Peri-Urban Vegetation Monitoring Using Satellite MODIS NDVI Time Series, Singular Spectrum Analysis, and Fisher–Shannon Statistical Method. Sustainability 2023, 15, 11039. [Google Scholar] [CrossRef] [Scilit]
- Nouri, H.; Nagler, P.; Chavoshi Borujeni, S.; Barreto Munez, A.; Alaghmand, S.; Noori, B.; Galindo, A.; Didan, K. Effect of Spatial Resolution of Satellite Images on Estimating the Greenness and Evapotranspiration of Urban Green Spaces. Hydrol. Process. 2020, 34, 3183–3199. [Google Scholar] [CrossRef] [Scilit]
- Qin, L.; Yan, C.; Yu, L.; Chai, M.; Wang, B.; Hayat, M.; Shi, Z.; Gao, H.; Jiang, X.; Xiong, B.; et al. High-Resolution Spatio-Temporal Characteristics of Urban Evapotranspiration Measured by Unmanned Aerial Vehicle and Infrared Remote Sensing. Build. Environ. 2022, 222, 109389. [Google Scholar] [CrossRef] [Scilit]
- Faridatul, M.I.; Wu, B.; Zhu, X.; Wang, S. Improving Remote Sensing Based Evapotranspiration Modelling in a Heterogeneous Urban Environment. J. Hydrol. 2020, 581, 124405. [Google Scholar] [CrossRef] [Scilit]
- Qiu, G.Y.; Yan, C.; Liu, Y. Urban Evapotranspiration and Its Effects on Water Budget and Energy Balance: Review and Perspectives. Earth-Sci. Rev. 2023, 246, 104577. [Google Scholar] [CrossRef] [Scilit]
- Fu, Y.; Zhu, Z.; Liu, L.; Zhan, W.; He, T.; Shen, H.; Zhao, J.; Liu, Y.; Zhang, H.; Liu, Z.; et al. Remote Sensing Time Series Analysis: A Review of Data and Applications. J. Remote Sens. 2024, 4, 0285. [Google Scholar] [CrossRef] [Scilit]
- Graz-Stadtvermessungsamt. Grünes Netz Graz (GNG). Available online: https://www.graz.at/cms/beitrag/10295906/8115447/Gruenes_Netz_Graz_GNG.html (accessed on 24 July 2026).
- Stratégie d’adaptation de la Ville de Paris. Available online: https://www.adaptation-changement-climatique.gouv.fr/agir/espace-documentaire/strategie-dadaptation-la-ville-paris (accessed on 24 July 2026).
- Council, B.C. Green Living Spaces Plan. Available online: https://www.birmingham.gov.uk/greenlivingspaces (accessed on 24 July 2026).
- Histórico de Planes|Espacios Verdes|Ayuntamiento de Barcelona. Available online: https://ajuntament.barcelona.cat/espaisverds/es/el-instituto/instituto-municipal-de-parques-y-jardines/historico-de-planes (accessed on 24 July 2026).
- Singergise Solutions d.o.o. Sentinel Hub. Available online: https://www.sentinel-hub.com/faq/ (accessed on 26 May 2026).
- Masek, J.G.; Vermote, E.F.; Saleous, N.E.; Wolfe, R.; Hall, F.G.; Huemmrich, K.F.; Gao, F.; Kutler, J.; Lim, T.-K. A Landsat Surface Reflectance Dataset for North America, 1990–2000. IEEE Geosci. Remote Sens. Lett. 2006, 3, 68–72. [Google Scholar] [CrossRef] [Scilit]
- Vermote, E.; Justice, C.; Claverie, M.; Franch, B. Preliminary Analysis of the Performance of the Landsat 8/OLI Land Surface Reflectance Product. Remote Sens. Environ. 2016, 185, 46–56. [Google Scholar] [CrossRef] [Scilit] [PubMed]
- Landsat Known Issues|U.S. Geological Survey. Available online: https://www.usgs.gov/landsat-missions/landsat-known-issues (accessed on 3 July 2025).
- Huete, A.; Didan, K.; Miura, T.; Rodriguez, E.P.; Gao, X.; Ferreira, L.G. Overview of the Radiometric and Biophysical Performance of the MODIS Vegetation Indices. Remote Sens. Environ. 2002, 83, 195–213. [Google Scholar] [CrossRef] [Scilit]
- Hashim, H.; Abd Latif, Z.; Adnan, N.A. Urban Vegetation Classification with NDVI Threshold Value Method with Very High Resolution (VHR) Pleiades Imagery. Int. Arch. Photogramm. Remote Sens. Spat. Inf. Sci. 2019, XLII-4/W16, 237–240. [Google Scholar] [CrossRef] [Scilit]
- Walz, J.H.; Weber, K.T. Identifying Actively Growing Vegetation Using NDVI Threshold Values; Idaho State University: Pocatello, ID, USA, 2021. [Google Scholar]
- Zhu, Z.; Woodcock, C.E. Continuous Change Detection and Classification of Land Cover Using All Available Landsat Data. Remote Sens. Environ. 2014, 144, 152–171. [Google Scholar] [CrossRef] [Scilit]
- Gray, J.; Sulla-Menashe, D.; Friedl, M.A. User Guide to Collection 6 MODIS Land Cover Dynamics (MCD12Q2) Product; NASA EOSDIS Land Processes DAAC: Missoula, MT, USA, 2019. [Google Scholar] [PubMed]
- Huang, X.; Liu, J.; Zhu, W.; Atzberger, C.; Liu, Q. The Optimal Threshold and Vegetation Index Time Series for Retrieving Crop Phenology Based on a Modified Dynamic Threshold Method. Remote Sens. 2019, 11, 2725. [Google Scholar] [CrossRef] [Scilit]
- Forkel, M.; Carvalhais, N.; Verbesselt, J.; Mahecha, M.; Neigh, C.; Reichstein, M. Trend Change Detection in NDVI Time Series: Effects of Inter-Annual Variability and Methodology. Remote Sens. 2013, 5, 2113–2144. [Google Scholar] [CrossRef] [Scilit]
- Mann, H.B. Nonparametric Tests Against Trend. Econometrica 1945, 13, 245–259. [Google Scholar] [CrossRef] [Scilit]
- Kendall, M.G.; Maurice, G. Rank Correlation Methods; E. Arnold: London, UK; Oxford University Press: New York, NY, USA, 1990. [Google Scholar]
- Theil, H. A Rank-Invariant Method of Linear and Polynomial Regression Analysis. In Henri Theil’s Contributions to Economics and Econometrics: Econometric Theory and Methodology; Raj, B., Koerts, J., Eds.; Springer: Dordrecht, The Netherlands, 1992; pp. 345–381. [Google Scholar]
- Sen, P.K. Estimates of the Regression Coefficient Based on Kendall’s Tau. J. Am. Stat. Assoc. 1968, 63, 1379–1389. [Google Scholar] [CrossRef] [Scilit]
- Zhang, Q.; Gu, L.; Liu, Y.; Zhang, Y. Spatio-Temporal Dynamics of Normalized Difference Vegetation Index and Its Response to Climate Change in Xinjiang, 2000–2022. Forests 2024, 15, 370. [Google Scholar] [CrossRef] [Scilit]
- Ren, Y.; Qiu, J.; Zeng, Z.; Liu, X.; Sitch, S.; Pilegaard, K.; Yang, T.; Wang, S.; Yuan, W.; Jain, A.K. Earlier Spring Greening in Northern Hemisphere Terrestrial Biomes Enhanced Net Ecosystem Productivity in Summer. Commun. Earth Environ. 2024, 5, 122. [Google Scholar] [CrossRef] [Scilit]
- Catalán, G.; Di Bella, C.; Meli, P.; De La Barrera, F.; Vargas-Gaete, R.; Reyes-Riveros, R.; Reyes-Packe, S.; Altamirano, A. Every Pixel You Take: Unlocking Urban Vegetation Insights Through High- and Very-High-Resolution Remote Sensing. Urban Sci. 2025, 9, 385. [Google Scholar] [CrossRef] [Scilit]
- Granata, F.; Zhu, S.; Di Nunno, F. Hydrological Extremes in the Mediterranean Basin: Interactions, Impacts, and Adaptation in the Face of Climate Change. Reg. Environ. Change 2025, 25, 100. [Google Scholar] [CrossRef] [Scilit]
- Eisfelder, C.; Üreyen, S.; Asam, S.; Hirner, A.; Reiners, P.; Huth, J.; Bachofer, F.; Bachmann, M.; Holzwarth, S.; Kuenzer, C. Thirty-Year Analyses of Seasonal NDVI and Climatic Drivers Across Different Land Cover Types and Biogeographical Regions in Europe. IEEE J. Sel. Top. Appl. Earth Obs. Remote Sens. 2025, 18, 11225–11249. [Google Scholar] [CrossRef] [Scilit]
- Pataki, D.E.; Litvak, E.; Jenerette, G.D.; Endter-Wada, J.; Wilfong, M. Urban Landscape Irrigation and the Future of Sustainable Cities. Earth’s Future 2026, 14, e2025EF007097. [Google Scholar] [CrossRef] [Scilit]
- Fisher, J.B.; Lee, B.; Purdy, A.J.; Halverson, G.H.; Dohlen, M.B.; Cawse-Nicholson, K.; Wang, A.; Anderson, R.G.; Aragon, B.; Arain, M.A.; et al. ECOSTRESS: NASA’s Next Generation Mission to Measure Evapotranspiration From the International Space Station. Water Resour. Res. 2020, 56, e2019WR026058. [Google Scholar] [CrossRef] [Scilit]
- Shurtz, K.M.; Dicataldo, E.; Sowby, R.B.; Williams, G.P. Insights into Efficient Irrigation of Urban Landscapes: Analysis Using Remote Sensing, Parcel Data, Water Use, and Tiered Rates. Sustainability 2022, 14, 1427. [Google Scholar] [CrossRef] [Scilit]
- Tran, B.N.; Van Der Kwast, J.; Seyoum, S.; Uijlenhoet, R.; Jewitt, G.; Mul, M. Uncertainty Assessment of Satellite Remote-Sensing-Based Evapotranspiration Estimates: A Systematic Review of Methods and Gaps. Hydrol. Earth Syst. Sci. 2023, 27, 4505–4528. [Google Scholar] [CrossRef] [Scilit]
- Derardja, B.; Khadra, R.; Abdelmoneim, A.A.A.; El-Shirbeny, M.A.; Valsamidis, T.; De Pasquale, V.; Deflorio, A.M.; Volden, E. Advancements in Remote Sensing for Evapotranspiration Estimation: A Comprehensive Review of Temperature-Based Models. Remote Sens. 2024, 16, 1927. [Google Scholar] [CrossRef] [Scilit]

Disclaimer/Publisher’s Note: The statements, opinions and data contained in all publications are solely those of the individual author(s) and contributor(s) and not of MDPI and/or the editor(s). MDPI and/or the editor(s) disclaim responsibility for any injury to people or property resulting from any ideas, methods, instructions or products referred to in the content. |
© 2026 by the authors. Licensee MDPI, Basel, Switzerland. This article is an open access article distributed under the terms and conditions of the Creative Commons Attribution (CC BY) license.