


Highlights
What are the main findings?
- Quantitative analysis of the effects of daytime and nighttime dust aerosols on the stability of atmospheric stratification and boundary layer height.
- As the dust layer height decreases due to aerosol deposition, the height of the maximum nighttime warming effect also decreases.
What are the implications of the main findings?
- The interaction between dust aerosol, temperature field and boundary layer is mainly affected by dust layer height, dust concentration, maintenance time and temperature advection.
- The change in urban temperature under the influence of dust weather is mainly controlled by two factors: the direct radiation effect of dust aerosol and the effect of temperature advection.
Abstract
Every spring, the dust weather in the northwest and northern regions of China comes into a frequent period, which seriously affects people’s lives and capacity for production. When the direct radiative effect of dust aerosol changes the energy distribution of the Earth-atmosphere system, the temperature field and boundary layer in the dust-affected area respond quickly. Therefore, it is of great scientific significance to study the direct radiative effect of dust aerosol on the temperature field and boundary layer. In this case study of a typical dust storm event during 5–8 May 2021, we use ground-based observations, satellite data, reanalysis products, and numerical model simulations to quantitatively evaluate the influence of the direct radiative effect of dust aerosols on the daytime and nighttime temperature field. We also focus on the impact of dust weather on the boundary layer and the interaction mechanisms among dust aerosols, the temperature field, and the boundary layer. The results showed the following: (1) Dust aerosols tend to make atmospheric stratification more stable during the day and less stable at night. Dust aerosols decreased the planetary boundary layer height (PBLH) by 109 m in the daytime, but increased it by 215 m at night. (2) The most significant daytime cooling effect is −0.26 °C at an altitude of 0–1 km, while the most significant nighttime warming effect is 0.07 °C at an altitude of 2–3 km. (3) In this event, warm advection was present prior to dust arrival. When dust weather occurs at night, the warming effect of dust aerosol is superimposed on the influence of warm advection, resulting in a temperature increase range near the surface caused by dust aerosol up to 1.55 °C. This results in enhanced thermal instability in the middle and lower layers, further sustaining the development of the ongoing dust weather.
1. Introduction
The arid and semi-arid region of East Asia is one of the largest dust sources in the world, and a large amount of dust is discharged into the atmosphere every spring [1,2]. These dust aerosols are transported over long distances under the action of the westerlies, causing adverse effects on the social economy, ecological environment and human health [3,4,5]. There remain significant uncertainties in the estimation of aerosol impacts on climate [6], and comprehending the characteristics of aerosol types and trends across Asia is crucial for understanding aerosol-climate interactions [7]. Dust aerosols influence climate through three mechanisms: direct radiative effect, semi-direct radiative effect, and indirect radiative effect. The direct radiative effect refers to the scattering and absorption of longwave (LW) and shortwave (SW) radiation solely caused by dust aerosols. The semi-direct radiative effect involves changes in atmospheric temperature stratification and cloud droplet evaporation due to sand and dust aerosols. The indirect radiative effect occurs when dust aerosols impact cloud life cycle and optical properties, thereby influencing precipitation processes [8,9,10].
The direct radiative forcing (DRF) of dust is quantitatively calculated, which holds significant implications for comprehending climate change in dust-affected regions. In the Taklimakan Desert, a strong sandstorm occurred from 6 to 9 June 2020, resulting in a net warming effect on the atmosphere (47.8 W/m2) and a cooling effect on the surface (−62.6 W/m2). Notably, during this event, SW radiation within the surface sensible heat flux experienced a substantial reduction to 57 W/m2 [11]. In May 2022, a series of major dust storms occurred in the Middle East. As the dust moved south to the southern part of the Arabian Peninsula at a height of 4 km, it sank to the ground due to strong subsidence. Observations revealed that these sandstorms caused a decrease of 350 W/m2 in SW flux and an increase of 70 W/m2 in LW flux while ultimately inducing a nighttime air temperature rise by approximately 9 °C [12]. Based on multi-event simulations over northwestern China during 2014–2019, it was found that when dust concentration is high with low-level dust layers present, the increase in total surface energy at night is greater than the decrease in the daytime, with total energy and surface temperature increasing and relative humidity decreasing throughout the daytime. Conversely, when dust concentration is low, but high-level dust layers prevail, opposite effects are observed [13,14]. Sandstorms influence changes in surface radiation and subsequently directly impact temperature variations.
The stable pressure equalization field in the atmospheric boundary layer is the main pressure system for the formation of mesoscale and even large-scale heavy pollution in China [15]. The positive feedback between aerosol and the boundary layer is particularly strong in heavy-pollution events. Aerosols weaken solar radiation reaching the surface, resulting in increased atmospheric stability and delayed boundary layer development, thus inhibiting the diffusion of pollutants and leading to further increases in aerosol concentrations in lower boundary layers [16]. The duration of sandstorms in the arid area of northwest China is inversely proportional to the thickness of the maximum mixed layer. The drier and cooler the near-ground and the stronger the northwest wind, the longer the duration of strong sandstorms [17]. During dust weather maintenance, the near-ground stratiform is stable, the vertical turbulence is weak, the temperature difference in the inversion layer has a good corresponding relationship with the visibility, and the inversion layer thickness is stable [18]. Dust weather impacts the atmospheric boundary layer, resulting in decreased intensity and increased thickness of its inner inversion layer. However, as dust weather intensity increases, the inversion intensity significantly weakens [19]. The presence of a temperature inversion layer promotes stability within the atmospheric boundary layer, hindering pollutant dispersion and contributing to prolonged sand and dust accumulation that leads to severe pollution events [20]. This is also an important reason why air pollution incidents still occur after China has adopted pollution prevention and control measures.
However, the diurnal impact of dust aerosols on the vertical temperature field and atmospheric stability has not been fully addressed. Zhang et al. [21] investigated dust–PBL interactions over the Tarim Basin, emphasizing entrainment and advection processes. While their work focused on PBL height variations, our study extends this by examining vertical temperature structure, atmospheric stability, and interaction mechanisms over northwestern China, with station-scale and regional-scale comparisons. Based on these considerations, this paper uses WRF-Chem simulations to quantify the effects of dust aerosols on radiation, temperature, and boundary layer structure, offering data support for springtime air pollution research in China. The paper is structured as follows: Section 2 introduces the data, model configuration, and methods; Section 3 presents results and discussion; and Section 4 provides the summary.
2. Data and Model
2.1. Data Sources
The Moderate Resolution Imaging Spectroradiometer (MODIS) data carried on Aqua and Terra satellites were used to verify the model simulation capability. In arid and semi-arid regions of China, the aerosol optical thickness (AOD) products inverted by MODIS using the “Deep Blue” (DB) algorithm have good applicability [22,23,24]. This article uses AOD data at 550 nm (MOD04-L2, MYD04-L2), with a horizontal resolution of 10 km × 10 km, collected during satellite overpasses from 5 to 8 May 2021, to observe the distribution of dust levels and evaluate the simulation performance of the model. The download address is as follows: https://ladsweb.modaps.eosdis.nasa.gov/search/ (accessed on 15 March 2024).
Regarding the ground observation data during this sandstorm weather process, the hourly monitoring data of particulate matter (PM10) comes from the national urban air quality real-time release platform of the China Environmental Monitoring Station (http://106.37.208.233:20035, accessed on 15 November 2021).
The FNL reanalysis data with a spatial resolution of 1° × 1° from the National Centers for Environmental Prediction (NCEP) of the United States are also used for the initial and boundary conditions of the meteorological field in the WRF-Chem model.
2.2. Model Description
This study employs the Weather Research and Forecasting model coupled with Chemistry (WRF-Chem), a three-dimensional Eulerian chemical transport model capable of simulating complex physical and chemical processes [25]. A configuration of WRF-Chem version 4.1.5, which has been demonstrated as reliable in our previous research [13,14], is used. The model domain spans from 13.3°N to 58.4°N in latitude and 54.9°E to 144.3°E in longitude, centered at (37°N, 100°E), with a horizontal resolution of 27 km. Vertically, the atmosphere is divided into 48 layers, with the model top set at 100 hPa. The time integration step is 60 s.
The meteorological initial and boundary conditions are provided by the Final Operational Global Analysis (FNL) reanalysis data, which has a spatial resolution of 1° × 1° and a temporal interval of 6 h. To obtain a more realistic wind field, the Grid Nudging method is applied, nudging the U and V wind components toward the FNL data every 6 h. The model is initialized using a “cold start,” with initial atmospheric dust concentrations set to zero. The first 24 h of each simulation are treated as spin-up and excluded from subsequent analysis.
In our previous study, the model configuration was demonstrated to be reliable [13,14], with its associated parameterization schemes detailed in Table 1.
Table 1.
Model configuration.
To investigate the radiative feedback effect of dust aerosols, this study enables aerosol–radiation interactions and related aerosol processes. Since the Shao04 scheme has been validated to perform well in simulating dust events over northwestern China [13,14,35,36], it is employed here to simulate a dust event that occurred from 5 to 8 May 2021.
2.3. Sensitivity Experiments
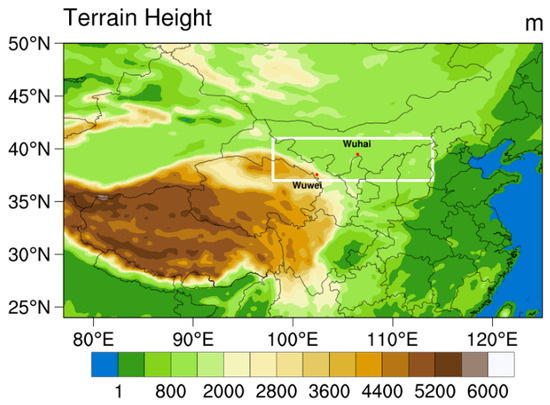
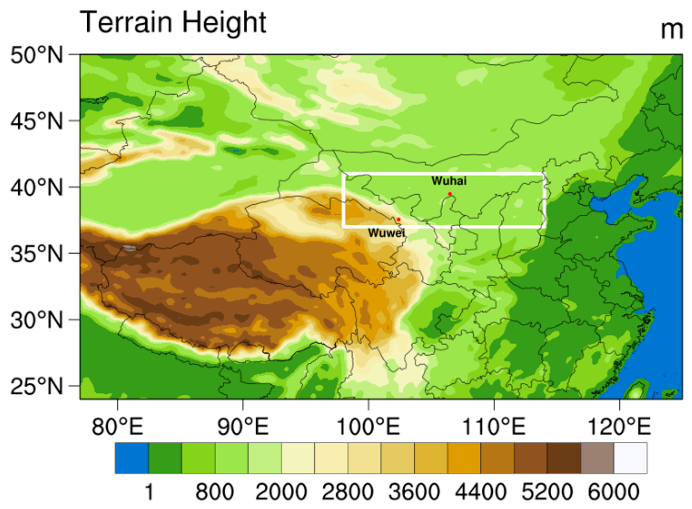
In order to quantitatively evaluate the influence of dust aerosol on the radiation field and temperature field, the differences between two groups of experiments (dust–no dust) were utilized for the study: the first group simulated dust aerosol under real conditions as the control experiment (CTL), initiating the feedback between dust and radiation (dust); Another group did not consider dust aerosols, and the dust concentration was set to zero (no dust). The study domain covers the white box region in Figure 1, with Wuwei and Wuhai as the key analysis sites.
Figure 1.
Terrain height (m) and site distribution in the study area (red dots: sites; white box: study area).
2.4. Method
Considering the influence of warm and cold advection on air temperature, the temperature advection is calculated:
In Formula (1), is the change in local temperature, t is time, V is the horizontal velocity vector, is the horizontal gradient operator, and T is temperature.
Consider the parameters representing atmospheric thermal instability, namely the K index, A index, and total total (TT) index, and their calculation formulas are as follows:
In the formula, T and Td are the air temperature and dew point temperature, respectively, and the subscripts 850, 700 and 500 indicate that the heights of T and Td are 850 hPa, 700 hPa and 500 hPa, respectively. It is worth noting that all three indices take into account the difference △T(850-500) between the temperature fields at 850 hPa and 500 hPa. The physical difference is that the TT index considers the 850 hPa water vapor condition and 500 hPa temperature field, and the K index considers the 850 hPa water vapor condition and 700 hPa water vapor saturation degree. The A index takes into account the saturation of water vapor throughout the middle and lower atmosphere (850 hPa, 700 hPa, and 500 hPa). The larger their values, the more unstable the atmospheric stratification is [37]. The atmospheric drying during the dust process discussed in this paper does not include the physical quantity of water vapor, so only the change of △T(850-500) in the middle and lower atmosphere is discussed.
3. Results
3.1. Model Evaluation
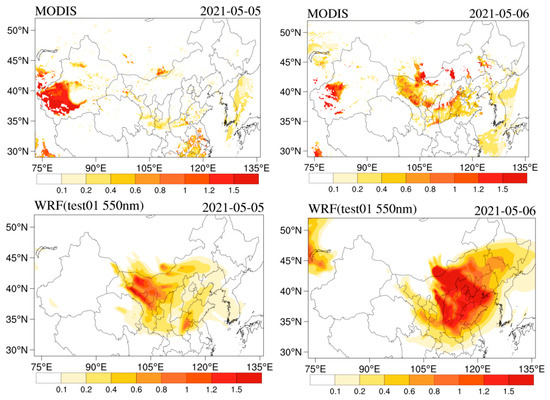
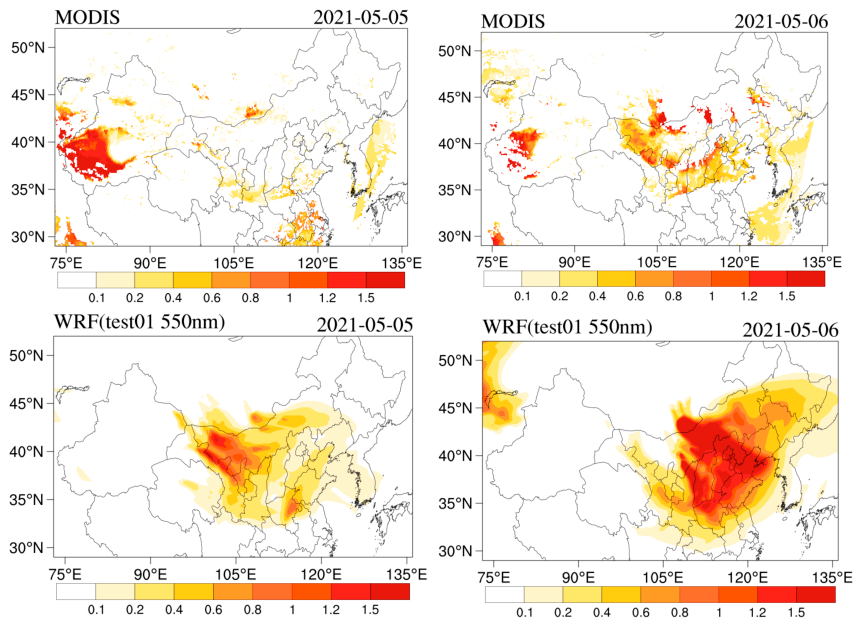
During the dust weather from 5 to 6 May 2021, the distribution of dust aerosol shows obvious spatio-temporal variations. Through comparison between MODIS satellite retrievals and model-simulated AOD at 550 nm, the model performance is evaluated. The WRF-Chem model generally reproduces the major spatial transport characteristics of dust aerosol in this dust process, particularly the changes in the distribution of the high-AOD region (Figure 2). However, the AOD simulation over the Hexi area on 5 May is overestimated, which may be attributable to uncertainties in the dust emission scheme or surface wind fields. The simulation of AOD distribution on 6 May shows better agreement with observations. The maximum AOD values during the dust process are located near the desert areas of Inner Mongolia (Tengger Desert, Badain Jaran Desert, Kubuqi Desert, Ulan Buhe Desert), the Loess Plateau, and the North China Plain.
Figure 2.
MODIS satellite retrieval (first row) and model simulation (second row) for 550 nm AOD from 5th to 6th.
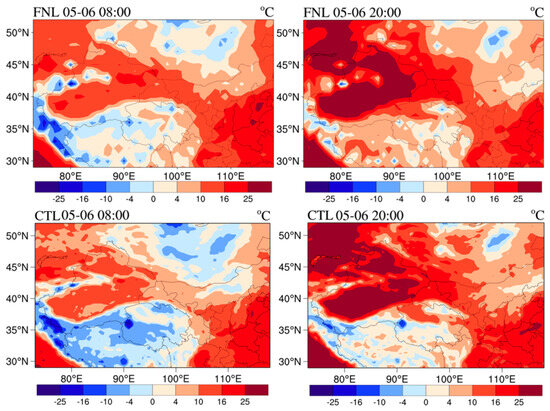
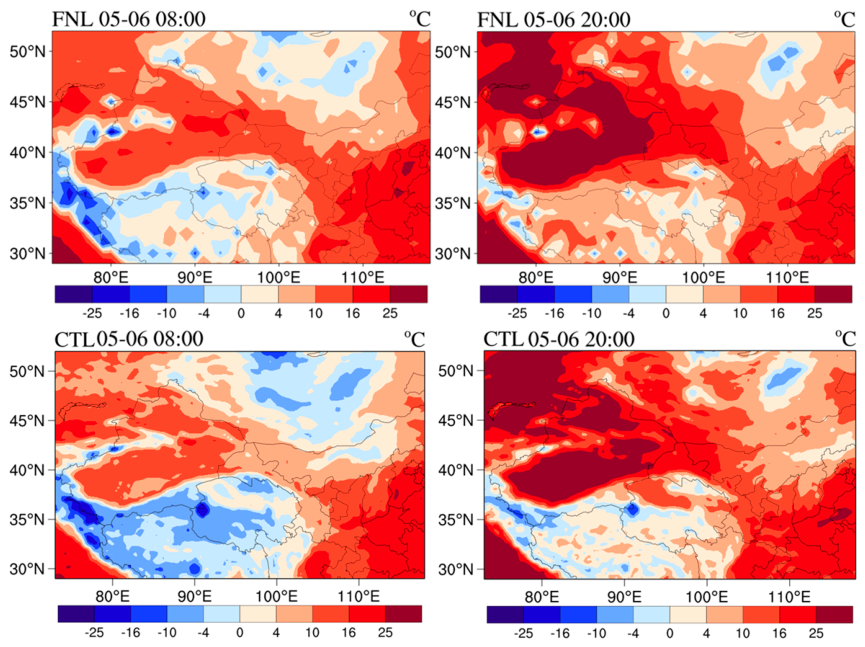
The 2 m temperature field simulated by the model was then compared with the NCEP/FNL reanalysis data on 6 May (08:00 and 20:00 Beijing time) (Figure 3). The FNL reanalysis data show that the low-temperature area in the southwestern part of Mongolia had a temperature increase over time, and this basic feature was captured by the model. At 08:00, the FNL reanalysis data showed that except for the Qinghai–Tibet Plateau, the temperature field over China was generally higher than 10 °C. The simulated temperature field shows reasonable consistency with the FNL reanalysis data in terms of spatial distribution, particularly in capturing the high-temperature area in southern Hebei Province. At 20:00, the temperature field was high in the northwest and low in the southwest, and the high temperature was mainly distributed in the desert area of the Tarim Basin in Xinjiang. The simulated temperature field was generally consistent with the FNL reanalysis data in terms of spatial distribution. Low temperatures over the Qinghai–Tibet Plateau were well captured, although some false high-temperature areas appeared in parts of Henan and Shandong. However, these regions are not the focus of this study. Overall, the model simulations show reasonable consistency with the FNL reanalysis data, with only small differences. We emphasize that this comparison serves as a consistency check rather than an independent validation.
Figure 3.
Temperature field at 2 m above the surface from NCEP/FNL reanalysis data (first row) and model simulation (second row) on 6 May (08:00 and 20:00 Beijing time, unit: °C).
The observed and modeled PM10 concentrations at the dust-affected cities (Wuwei and Wuhai) were compared (Figure S1). The locations of the two sites are indicated in Figure 1 in red. The model generally reproduced the temporal variation in PM10 concentrations at both sites, although some discrepancies were observed, particularly in the peak values and timing. These differences are not uncommon in dust storm simulations and may be attributed to uncertainties in the dust emission scheme, localized meteorological conditions (e.g., surface wind fields), or the representation of soil properties [38]. The details of the model performance regarding PM10 can be found in the Supplementary Materials.
3.2. Influence of Dust Weather Process on Vertical Change in Temperature
The net DRF of dust aerosols in the study area during daytime was −20.39 W/m2 at the surface (SFC), 14.71 W/m2 in the atmosphere (ATM), and −5.69 W/m2 at the top of the atmosphere (TOA), as shown in Figure S2. Among these levels, the DRF exerted the strongest effect at the surface, followed by the atmosphere and then the TOA. During nighttime, the net DRF decreased significantly compared to daytime values. Specifically, the nighttime DRF values were 41.25%, 68.39%, and 28.99% of the corresponding daytime levels at the SFC, ATM, and TOA, respectively (Figure S3). Further details on the DRF of dust aerosols during both daytime and nighttime are provided in the Supplementary Material.
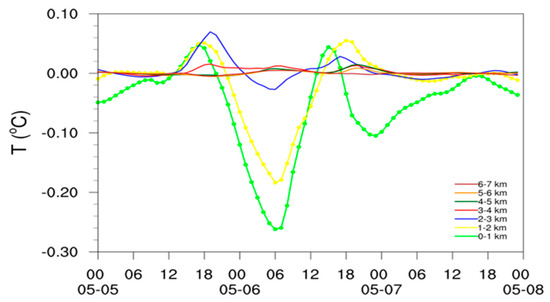
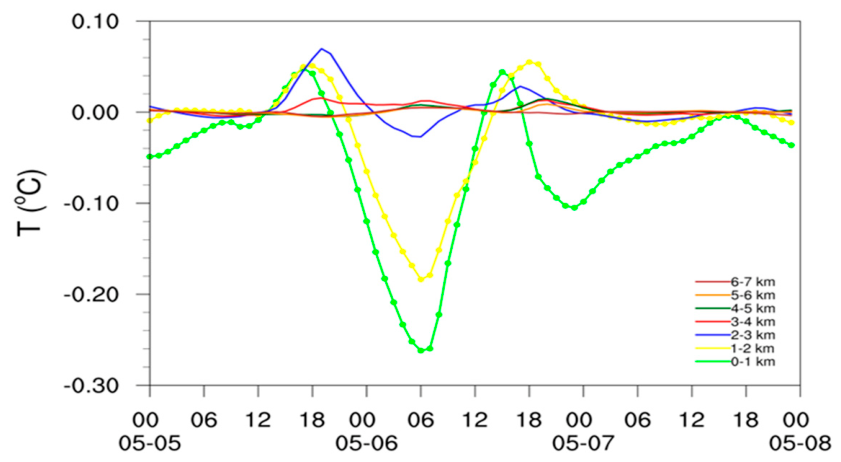
The change in radiation and energy budget will inevitably cause a change in the temperature field. The temperature in the dust-affected area from the ground to the height of the dust layer has a diurnal variation. Figure 4 shows that during the dust process, the temperature at 0~4 km ranges from −0.26 °C to 0.07 °C. The temperature fluctuation ranges at 0~1 km, 1~2 km, 2~3 km and 3~4 km are 0.31 °C, 0.24 °C, 0.10 °C and 0.02 °C, respectively. The temperature fluctuation above 4 km is close to 0.00 °C.
Figure 4.
Diurnal variation in regional average temperature (°C) caused by dust.
As shown in Figure 4, the direct radiative effects of dust were most evident throughout the study area on 6 May. The most significant nighttime warming effect is at the height of 2~3 km (0.07 °C), followed by 1~2 km; the most significant daytime cooling effect is at the height of 0~1 km (−0.26 °C), followed by 1~2 km. As dust aerosol deposited and the dust layer height decreased across the study area, the nighttime warming effect on 7 May became most significant at 1~2 km, while the daytime cooling effect remained at 0~1 km.
The daytime cooling effect weakens with altitude and transitions to a warming effect at the dust layer. The nighttime warming effect strengthens with altitude and transitions to a cooling effect above the dust layer. Zhou et al. [39] found that the higher the concentration of dust aerosol at night, the stronger the heating effect was. With the increase in height and the decrease in dust aerosol concentration, this ability to heat the atmosphere weakened.
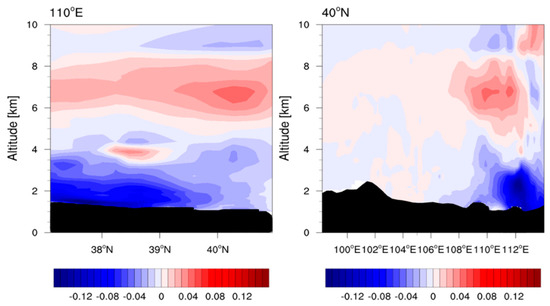
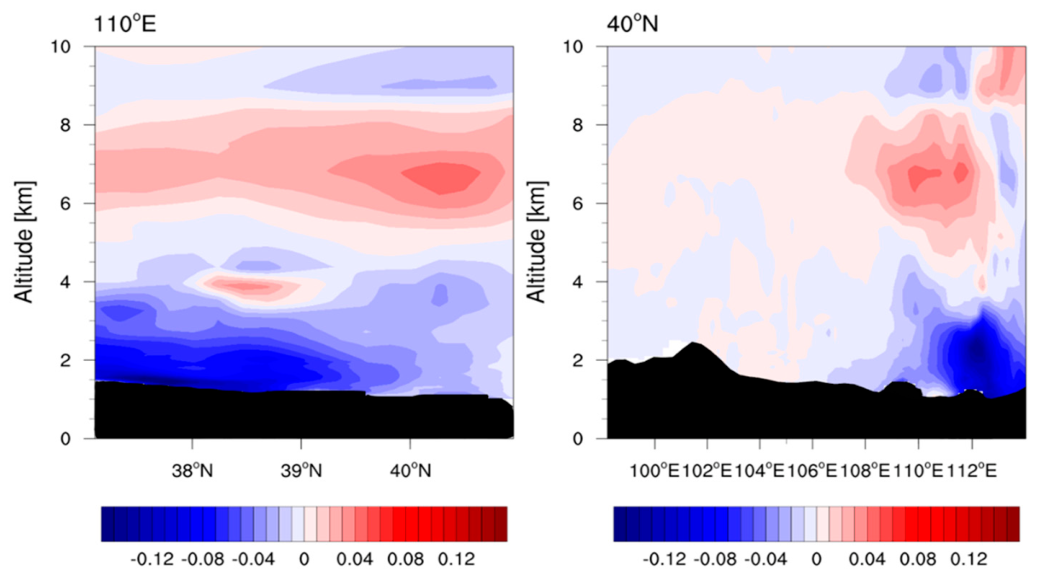
The temperature change caused by dust aerosol has a good correspondence with the vertical distribution of dust aerosol DRF (Figure 5). The left figure is a latitudinal and altitude profile of the temperature change caused by dust aerosols simulated by WRF along 110°E. The near-surface DRF caused by dust aerosol is negative, so the near-surface cooling is the most significant. The atmospheric DRF caused by the dust aerosol is positive, and the atmospheric temperature increases 4~7 km above the ground. Dust aerosols in the upstream region (high latitude) increase the atmospheric temperature by 0.05 °C, and reduce the temperature near the ground to −0.05 °C. With the transmission of dust aerosol to the downstream (low latitude), the temperature rise develops to the downstream low altitude, and there is a strong temperature rise zone of 0.04 °C at 38.5°N, about 3 km from the ground. The decrease in temperature increases with the decrease in height, and a strong cooling zone of −0.17 °C appears on the ground from 37°N to 38.5°N. The right figure is a longitude-altitude profile of the temperature change caused by aerosols simulated by WRF along 40°N. West of 110°E, the temperature is weakly affected by dust aerosol, while east of 110°E, the temperature from 3 km to the ground is significantly cooled (−0.15 °C) and the atmosphere is heated (0.05 °C).
Figure 5.
Latitude-height (left) and longitude-height (right) cross-sections of model-simulated temperature changes (°C) due to dust aerosols, averaged over 5–8 May 2021. Black shading denotes terrain height.
3.3. The Evolution of the PBLH and the Stability of Atmospheric Stratification
The boundary layer structure responds significantly to the occurrence, development, transport, and sedimentation of dust events [40]. Dust aerosols not only affect changes in radiation and the energy budget, but also affect changes in PBLH. The PBLH has a significant impact on the concentration of pollutants. Compared with clear air, the PBLH in the presence of dust aerosols decreases by 30% [41]. When the PBLH decreases, atmospheric pollution increases [21]. The turbulent movement in the boundary layer is conducive to the diffusion of pollutants in the boundary layer, so it is particularly important to explore the diurnal variation characteristics of PBLH in the area affected by dust.
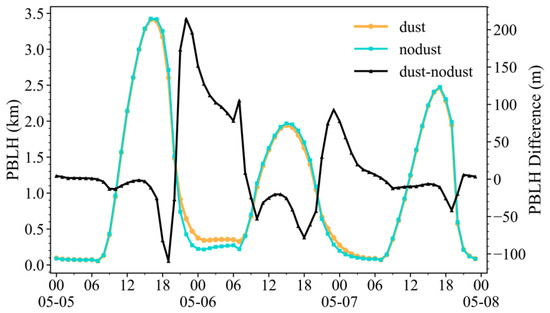
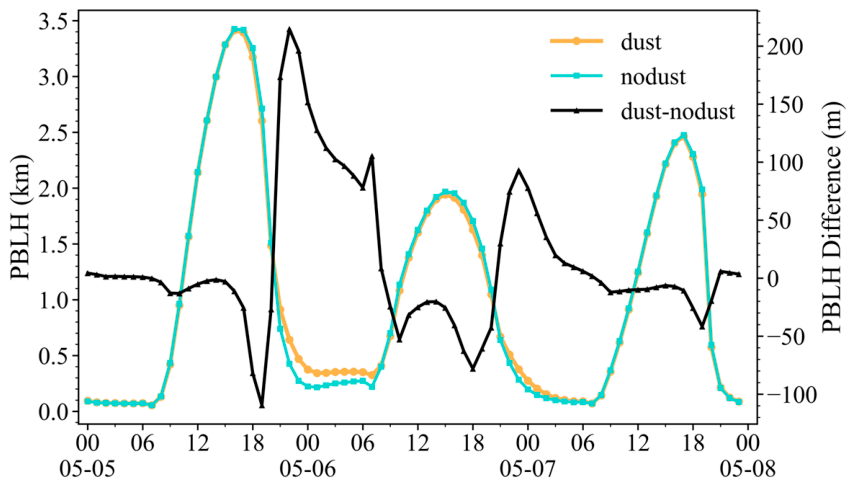
PBLH changes strongly during dust weather (Figure 6). The dust weather was the most serious in the whole region on the 6th, and the average PBLH in the whole region was also the lowest, less than 2 km, which was not conducive to atmospheric turbulent activities and made it difficult for dust aerosol particles to disperse. In order to explore the influence of dust weather, the PBLH difference (dust minus no dust) was calculated, and it was found that the peak value of the average PBLH in the daytime of the study area on the 5th, 6th and 7th was decreased (−109 m, −78 m and −42 m), while the PBLH in the nighttime of the 6th and 7th was increased (215 m and 93 m). Compared with the clear sky, the average PBLH in the study area under the dust weather increased by 71.6% at the maximum from 21:00 on the 5th to 8:00 on the 6th, and decreased by 4.7% at the maximum from 9:00 to 20:00 on the 6th. From a radiation perspective, dust aerosols can reduce nighttime surface cooling by increasing downward LW radiation, which enhances vertical turbulence and facilitates the transport of dust aerosols to upper levels through the increased PBLH.
Figure 6.
Time series of the PBLH.
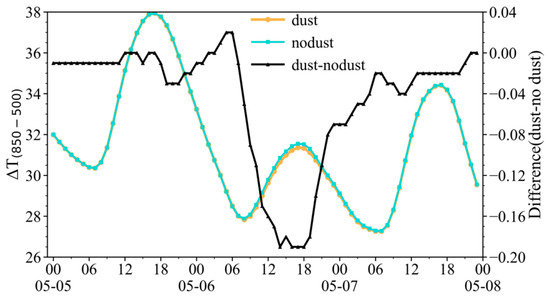
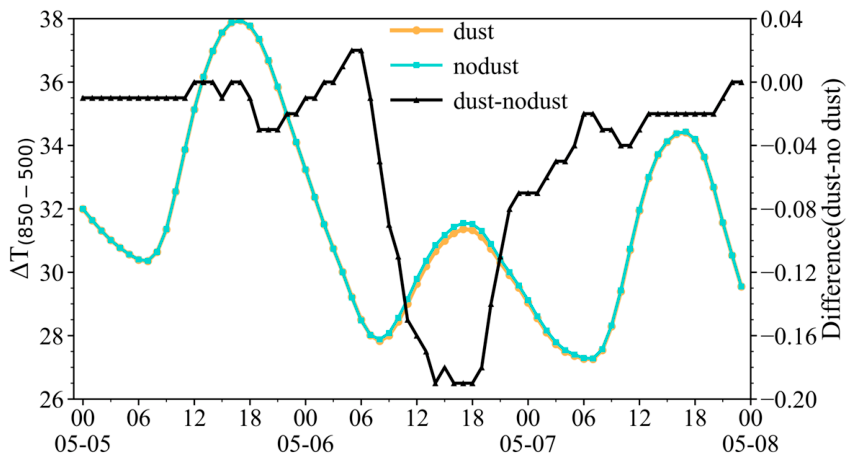
When discussing the influence of dust aerosol on the stability of the middle and lower troposphere, we found that the regional mean values of K index, A index and TT index during the dust period ranged from 4 to 19 °C, −12 to 2 °C and 39 to 48 °C, respectively. Among them, the increase in K index and A index on the 6th was related to the weather mainly dominated by sand blowing and dust floating in the region [42]. Figure 7 shows the change of △T(850-500) with time under dust, no dust, and dust–no dust conditions. Under dust conditions, △T(850-500) has a diurnal variation with a range of 27~38 °C. The atmospheric layer is considered unstable when △T(850-500) exceeds 31 °C [43]. At 18:00 △T(850-500) on the 5th, the atmospheric stratification instability reaches its maximum at 37.9 °C. During the day, the atmospheric layer itself was unstable, but under the influence of radiation inversion of dust aerosols, the atmosphere transitioned to a stable layer. As the influence of dust weakened, the atmospheric layer became more stable on the night of the 7th than on the night of the 6th. The change of △T(850-500) in the nodust condition is similar to that in the dust condition.
Figure 7.
Evolution of △T(850-500) with time (unit: °C).
In the dust–no dust case, △T(850-500) is negative. It shows that the smaller the region △T(850-500) in the dust case, the more stable the atmospheric stratification tends to be. Conversely, △T(850-500) is positive. It shows that the larger the region △T(850-500) in the dust case, the more unstable the atmospheric stratification tends to be. The peak value of △T(850-500) on the night of the 6th was 0.02 °C, and the trough value on the daytime of the 6th was −0.19 °C, indicating that the effect of dust aerosol on the atmospheric layer was more significant in the day than at night. As the dust aerosols settled, △T(850-500) was smaller on the night of the 7th than on the night of the 6th, and the atmosphere changed from unstable to stable stratification at night.
Based on the analysis of vertical potential temperature variation during dust weather, it is further confirmed that the dust layer can stabilize the atmospheric stratification (Figure S4). See Supplementary Materials for details.
3.4. Causes of Station Temperature Profile During Dust Period
The energy redistribution caused by the dust radiative effect subsequently leads to the adjustment of meteorological conditions, especially in the planetary boundary layer with fast energy exchange [10]. The direct radiation effect of dust weather largely depends on the content and vertical distribution of dust aerosols in the atmosphere. In this paper, the model is used to calculate the vertical distribution of the extinction coefficient of dust aerosol over the study site during the dust process (Figure S5). During the dust weather, the extinction effect (>0.1 km−1) of the dust layer in Wuwei and Wuhai is mainly concentrated in the middle and lower atmosphere below 1.5 km and 3.8 km, and the peak extinction coefficient of the dust layer is 0.723 km−1 and 1.431 km−1, respectively.
Regional characteristics were explored in Section 3.2 and Section 3.3, followed by analysis of the influence of radiative effects associated with dust and temperature field adjustments at different sites. Table 2 shows the simulated DRF of dust aerosol at the SFC, the ATM, and the TOA in Wuwei and Wuhai under clear sky conditions. It can be found that the absolute value of DRF of dust aerosol at different heights in Wuwei is greater than that in Wuhai during the day. In Wuwei, the LW DRF of dust aerosol is 6.19 W/m2, while the SW DRF is −17.74 W/m2, so the surface temperature decreases the most in the daytime. The absolute value of DRF of dust aerosol at different altitudes in Wuhai at night is greater than that in Wuwei, and the net DRF of dust aerosol at the ground and in the atmosphere is 16.52 W/m2 and −18.40 W/m2. From the diurnal variation in dust aerosol DRF, the dust cooling effect is significant during the day in Wuwei, whereas the warming effect is significant at night in Wuhai. The higher nighttime net radiative forcing at Wuhai is attributed to the substantially higher dust aerosol loading there, as supported by the PM10 concentration, extinction coefficient, and vertical extent of the dust layer shown in Figures S1 and S5.
Table 2.
DRF of dust aerosol under simulated clear-sky conditions (W/m2).
The dust event of 5–8 May 2021 was influenced by the combined effects of a Mongolian cyclone and a surface cold front, consistent with the typical weather patterns documented in previous studies [44,45,46]. The main influence systems of dust weather include strong cold air and a Mongolian cyclone. On the one hand, strong cold advection makes the low trough and cold front move east; on the other hand, it promotes the development of the Mongolian cyclone together with warm advection [44]. The warm advection provides thermal conditions for the occurrence of dust, which is conducive to the deepening of the Mongolian trough, resulting in thermal instability in the middle and low levels and the increase in surface wind speed. At the same time, the surface dust particles are heated up and spread to the southeast under the northwest airflow [45,46].
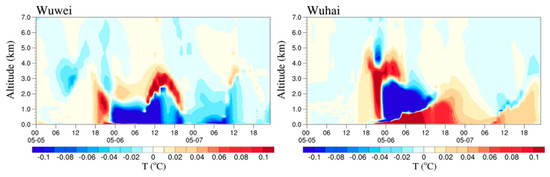
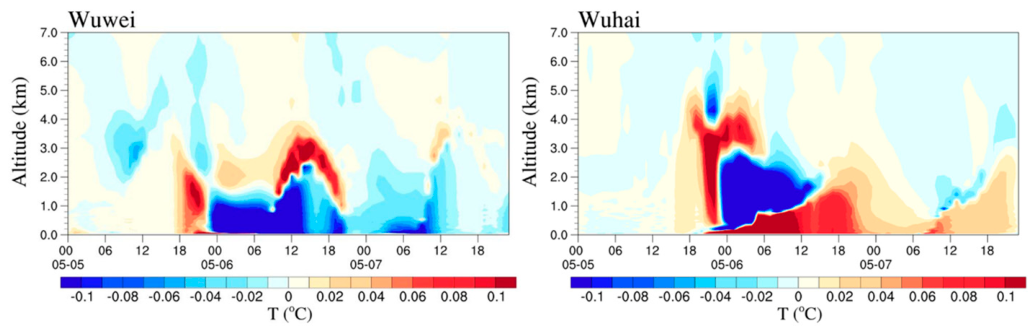
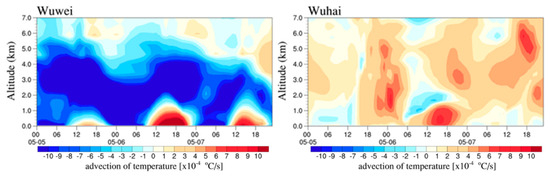
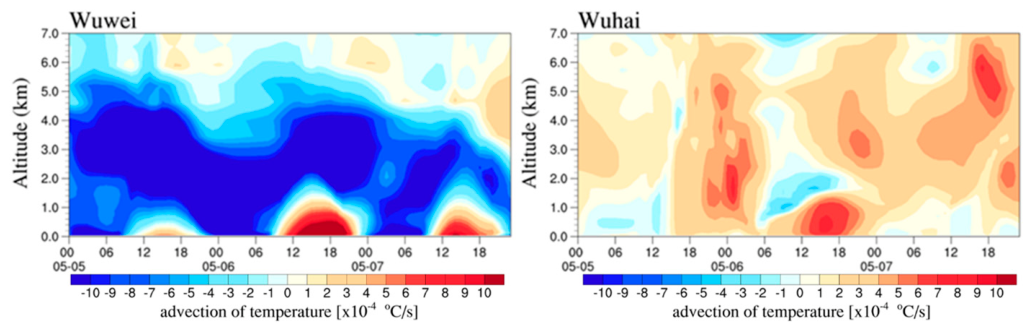
The temperature change is mainly affected by the direct radiative effect of dust aerosol and temperature advection. The spatial evolution of the 850 hPa temperature and wind fields during this process is presented in Figure S6, with a detailed analysis provided in the Supplementary Materials. In order to quantitatively estimate their contributions to the vertical temperature change, the temperature change caused by dust in Wuwei and Wuhai and the temperature advection characteristics above it are analyzed (Figure 8 and Figure 9).
Figure 8.
Temperature changes caused by dust from 5 to 7 May 2021.
Figure 9.
Temperature advection profile from 5 to 7 May 2021.
The dust weather in Wuwei lasted approximately 30 h, and the height of the dust layer and the dust concentration were low. Both the nighttime dust warming effect and the daytime cooling effect are weaker than the effects of temperature advection. From 20:00 on the 5th to 6:00 on the 6th, the temperature rise near the ground was 0.3 °C; the lower layer of the atmosphere is mainly cooled, with a peak cooling of −0.5 °C. The middle and lower troposphere (0~6 km) experienced cold advection (2.1 × 10⁻³ °C/s) from 20:00 on the 5th to 9:00 on the 6th. On the 6th night, the average temperature change caused by aerosol was 0.24 °C, −0.04 °C and 0.02 °C near the ground, 1 km and 2 km, while the effect of cold advection on the average temperature at the same height was −0.31 °C, −0.40 °C and −0.49 °C.
From 7:00 on the 6th to 2:00 on the 7th, the temperature drops near the ground, and the peak temperature drop is −0.4 °C; the temperature rise in the lower layer of the atmosphere is 0.3 °C. From 10:00 to 22:00 on the 6th, the lower troposphere was warm advection (1.4 × 10⁻³ °C/s), and the middle troposphere was cold advection (2.0 × 10⁻³ °C/s). Cold advection (1.5 × 10⁻³ °C/s) was observed in the middle and lower troposphere from 23:00 on the 6th to 2:00 on the 7th. On the 6th, the changes in average temperature caused by aerosol in the daytime were −0.18 °C, −0.08 °C and 0.03 °C near the ground, at 1 km, and 2 km, while the effects of temperature advection on average temperature at the same height were 0.28 °C, −0.02 °C, and −0.34 °C.
The duration of dust weather in Wuhai is short, the height of the dust layer is high, and the dust concentration is strong. From 19:00 on the 5th to 6:00 on the 6th, there was a strong warming near the ground, with a peak temperature of 2.9 °C. The lower layer of the atmosphere cooled down, and the peak temperature of the cooling reached −0.6 °C. The middle and lower troposphere experienced warm advection (7.4 × 10⁻⁴ °C/s). During the night of the 6th, the average temperature change caused by aerosol was 1.55 °C, −0.20 °C, −0.13 °C, 0.05 °C and 0.03 °C near the ground, 1 km, 2 km, 3 km and 4 km. The influence of warm advection on average temperature at the same height is 0.04 °C, 0.12 °C, 0.13 °C, 0.13 °C and 0.09 °C. It is worth noting that the thermal insulation effect of dust at night and the warm advection jointly affect the temperature change in Wuhai.
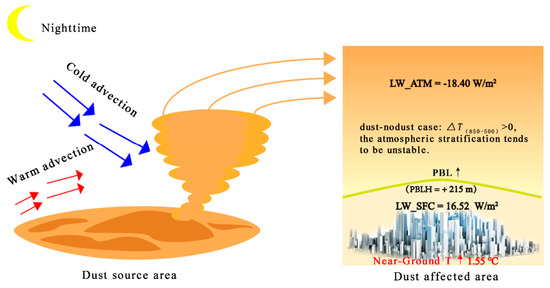
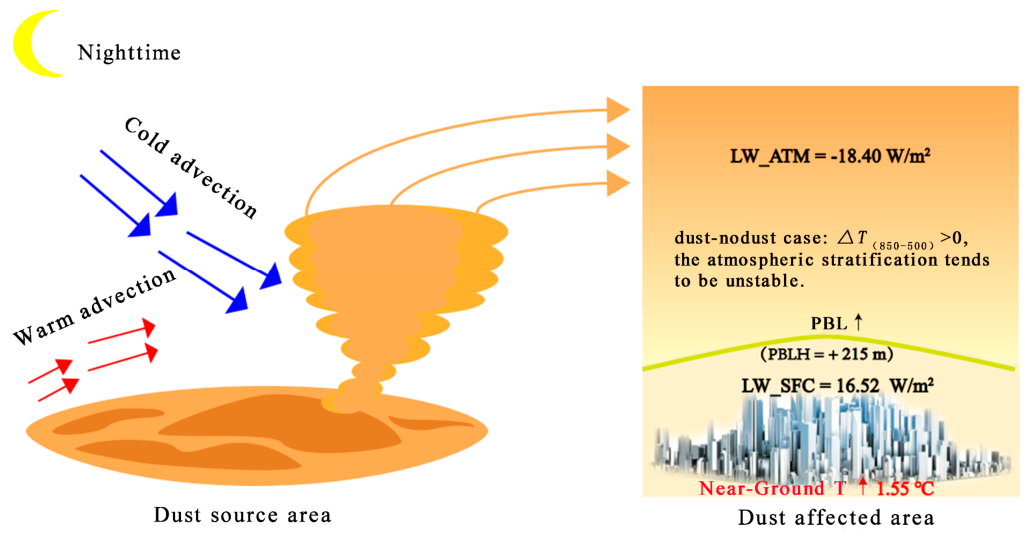
In summary, the mechanism of the influence of dust aerosol on the temperature field at night is obtained. As shown in Figure 10, warm advection in the lower atmosphere and strong cold advection carried by fronts and cyclones make the atmosphere over the dust source unstable, thus enhancing the occurrence and development of dust weather. When the dust aerosol is transported to the downstream area (dust-affected area) with the northwest airflow, the direct radiative effect of the dust aerosol enhances the downward LW DRF in the atmosphere; the atmospheric stratification tends to be unstable, the PBLH at night rises, and the strong night thermal insulation effect makes the temperature near the ground significantly increase by 1.55 °C.
Figure 10.
Schematic diagram of the effect of dust aerosols on the temperature field at night.
4. Discussion
This paper presents a preliminary investigation of the interaction mechanisms among dust aerosols, the boundary layer, and the temperature field based on a single model-simulated dust event, offering a new approach for dust weather research; however, several limitations remain. The qualitative mechanisms identified here are expected to be broadly representative. However, the quantitative magnitudes require further validation using multi-event and multi-region simulations to enable more integrated analyses and to enhance the generality of the conclusions. The temperature field is highly complex, and the role of additional meteorological factors, such as humidity, has not yet been examined in the quantitative assessment of dust aerosol impacts on the temperature field. The practical applicability of the findings in dust impact forecasting, impact assessment, and model improvement requires further exploration. Future work will focus on these aspects to achieve a more comprehensive and quantitative understanding of dust–atmosphere interactions.
We acknowledge that this study focuses exclusively on the direct radiative forcing of dust aerosols and does not account for semi-direct or indirect radiative effects, nor feedbacks involving water vapor and cloud processes. In addition, the dust optical properties (e.g., single scattering albedo, asymmetry parameter, and extinction efficiency) used in the model are based on default assumptions, which may introduce uncertainties in the calculated radiative forcing. These factors can influence the temperature field and boundary layer through additional pathways, and their exclusion represents a limitation of this work. Future studies will incorporate these additional feedbacks and more accurate dust optical properties to provide a more comprehensive understanding of dust–atmosphere interactions.
5. Conclusions
In this paper, the influence of dust aerosols on the temperature field and boundary layer is quantitatively estimated in dust-prone areas in China, and the mechanism of interaction between dust aerosols and the temperature field during day and night is discussed.
WRF-Chem simulation found that the net DRF of dust aerosols in the daytime study area was −20.39 W/m2, 14.71 W/m2, and −5.69 W/m2 at the surface, atmosphere, and top of atmosphere, respectively. The most significant daytime cooling effect is −0.26 °C at 0~1 km altitude. The net DRF of dust aerosol at night is significantly less than that in the daytime, and the net DRF of dust aerosol at night is 8.41 W/m2, −10.06 W/m2, and −1.65 W/m2 at the surface, atmosphere, and top of atmosphere, respectively. At night, the most significant thermal insulation effect was 0.07 °C at 2–3 km altitude.
Dust aerosols reduce the regional average PBLH, which decreases during the day (−109 m) and increases during the night (215 m). However, the change in atmospheric stratification is significantly more affected by dust during the day than at night. The analysis of potential temperature changes only shows that dust aerosols during the day make atmospheric stratification more stable. The three parameters, namely K index, A index and TT index, which represent the atmospheric thermal instability during the dust period, vary from 4~19 °C, −12~2 °C and 39~48 °C, respectively. The difference in temperature field △T(850-500) between 850 hPa and 500 hPa is considered in the parameters. The change in temperature field difference △T(850-500) in the middle and lower atmosphere is discussed. It is found that the atmospheric stratification tends to be unstable at night and more stable during the day due to the influence of dust aerosols.
The intensity of dust weather and the duration of dust weather will lead to differences in the influence of dust aerosol on the temperature field. In Wuhai, the warm advection before the dust process and the thermal insulation effect of dust aerosol at night caused strong thermal instability in the middle and low layers. The dust aerosol DRF at ground level was significant (16.52 W/m2), and the temperature change caused by dust aerosol at night (1.55 °C) was much greater than the influence of warm advection on temperature (0.04 °C).
Supplementary Materials
The following supporting information can be downloaded at: https://www.mdpi.com/article/10.3390/rs18162656/s1, Figure S1: Time series of observed and simulated PM10 concentrations (ug/m3) from 5 to 7 May 2021 (the locations of stations are indicated by red dots in Figure 1); Figure S2: Spatial distribution of daytime dust DRF (W/m2) under clear sky conditions from simulation averaged during 5–6 May 2021 (From left to right are SW DRF, LW DRF, and net DRF, respectively. From top to bottom, the TOA, the ATM and the SFC); Figure S3: Spatial distribution of nighttime dust DRF (W/m2) under clear sky conditions from simulation averaged during 5–6 May 2021 (From left to right are LW DRF at the SFC, the ATM, and the TOA); Figure S4: Height-time profile of potential temperature (K); Figure S5: Vertical profile of extinction coefficient (km−1) from 5 to 7 May 2021; Figure S6: 850 hPa temperature field and wind vectors at 08:00 and 20:00 BJT on 5–6 May 2021.
Author Contributions
Conceptualization, C.S. and J.W.; methodology, C.S. and J.W.; software, C.S. and J.W.; validation, C.S. and J.W.; investigation, C.S., J.W. and Y.C.; writing—original draft preparation, C.S.; writing—review and editing, C.S., J.W., Y.C., S.S., S.T. and J.H.; visualization, C.S., J.W. and Y.C.; supervision, J.W.; project administration, Y.C.; funding acquisition, Y.C. All authors have read and agreed to the published version of the manuscript.
Funding
This research was funded by the Project of Key Research and Development Program of Xinjiang Uygur Autonomous Region, China: “The Impact of Future Climate Change on Water Resources in Typical River Basins of Xinjiang” (2023B02044-1).
Data Availability Statement
The ground observation data, satellite data, and reanalysis data involved in this research work are from publicly available websites and are described in detail in the article. All datasets have been correctly cited and are used solely for academic research purposes.
Acknowledgments
We acknowledge NOAA/ESRL, NOAA/NCEP, and NCAR for developing the WRF-Chem model. Thank you for the support from the Supercomputing Center of Lanzhou University. We thank the Level-1 and Atmosphere Archive & Distribution System Distributed Active Archive Center for the MODIS 550 nm AOD. Thanks to NCEP for the FNL reanalysis data. We thank the Ministry of Ecology and Environment of the People’s Republic of China for the PM10 observation data. In addition, we sincerely appreciate the editors and reviewers for their instructions and suggestions.
Conflicts of Interest
The authors declare no conflicts of interest.
References
- Zhao, T.; Gong, S.; Zhang, X.; Blanchet, J.-P.; McKendry, I.G.; Zhou, Z.J. A simulated climatology of Asian dust aerosol and its trans-Pacific transport. Part I: Mean climate and validation. J. Clim. 2006, 19, 88–103. [Google Scholar] [CrossRef] [Scilit]
- Choobari, O.; Zawar-Reza, P.; Sturman, A. The global distribution of mineral dust and its impacts on the climate system: A review. Atmos. Res. 2014, 138, 152–165. [Google Scholar] [CrossRef] [Scilit]
- Liu, M.; Westphal, D.; Wang, S.; Shimizu, A.; Sugimoto, N.; Zhou, J.; Chen, Y. A high-resolution numerical study of the Asian dust storms of April 2001. J. Geophys. Res. Atmos. 2003, 108, 8653. [Google Scholar] [CrossRef] [Scilit]
- Li, L.; Li, J.; Wang, R.; Zheng, H.H.; Shi, F.; Ren, M. The Analysis for the lmpact of Dust-weather On the Urban Ambient Air Quality in China During 2005~2010. Environ. Monit. China 2013, 29, 15–19. (In Chinese) [Google Scholar]
- Yang, Z.; Zhang, Y.; Zhang, Q.; Zhang, J.; Lu, B.; Meng, Z.Q. Association of PM10 derived from dust events with daily outpatient number for cardiovascular diseases. China Environ. Sci. 2015, 35, 277–284. (In Chinese) [Google Scholar]
- Arias, P.; Bellouin, N.; Coppola, E.; Jones, R.; Krinner, G.; Marotzke, J.; Naik, V.; Palmer, M.; Plattner, G.-K.; Rogelj, J.; et al. IPCC, 2021. Climate Change 2021: The Physical Science Basis. Contribution of Working Group I to the Sixth Assessment Report of the Intergovernmental Panel on Climate Change; Cambridge University Press: Cambridge, UK; Cambridge University Press: New York, NY, USA, 2021. [Google Scholar]
- Ramachandran, S.; Rupakheti, M. Trends in the types and absorption characteristics of ambient aerosols over the Indo-Gangetic Plain and North China Plain in last two decades. Sci. Total Environ. 2022, 831, 154867. [Google Scholar] [CrossRef] [Scilit] [PubMed]
- Xin, J.; Gong, C.; Wang, S.; Wang, Y. Aerosol direct radiative forcing in desert and semi-desert regions of northwestern China. Atmos. Res. 2016, 171, 56–65. [Google Scholar] [CrossRef] [Scilit]
- Chen, A.; Zhao, C.; Fan, T. Spatio-temporal distribution of aerosol direct radiative forcing over mid-latitude regions in north hemisphere estimated from satellite observations. Atmos. Res. 2022, 266, 105938. [Google Scholar] [CrossRef] [Scilit]
- Huang, J.; Wang, T.; Wang, W.; Li, Z.; Yan, H. Climate effects of dust aerosols over East Asian arid and semiarid regions. J. Geophys. Res. Atmos. 2014, 119, 11398–11416. [Google Scholar] [CrossRef] [Scilit]
- Li, H.; Wang, C. Impact of dust radiation effect on simulations of temperature and wind–A case study in Taklimakan Desert. Atmos. Res. 2022, 273, 106163. [Google Scholar] [CrossRef] [Scilit]
- Francis, D.; Fonseca, R.; Nelli, N.; Bozkurt, D.; Cuesta, J.; Bosc, E. On the Middle East’s severe dust storms in spring 2022: Triggers and impacts. Atmos. Environ. 2023, 296, 119539. [Google Scholar] [CrossRef] [Scilit]
- Su, S.; Wang, J.; Yin, Z.; Wang, T.; Yasheng, D.; Xie, X.; Yang, Y. Understanding the daytime and nighttime impacts of dust aerosols on surface energy and meteorological fields in northwest China. J. Geophys. Res. Atmos. 2022, 127, e2022JD037619. [Google Scholar] [CrossRef] [Scilit]
- Wang, J.; Su, S.; Yin, Z.; Sun, C.; Xie, X.; Wang, T.; Yasheng, D.; Chen, J.; Zhang, X.; Yang, Y. Quantitatively Assessing the Contributions of Dust Aerosols to Direct Radiative Forcing Based on Remote Sensing and Numerical Simulation. Remote Sens. 2022, 14, 660. [Google Scholar] [CrossRef] [Scilit]
- Ren, Z.H.; Su, F.Q.; Gao, Q.X.; Lu, S.Q.; Hong, Z.X.; Hu, F.; Zhang, M.G.; Lei, T. Analysis of the Serious Atmospheric Pollution Event Caused by Emissions in Boundary Layer. Chin. J. Atmos. Sci. 2005, 29, 57–63+169. (In Chinese) [Google Scholar]
- Wang, C.; Jia, M.; Xia, H.; Wu, Y.; Wei, T.; Shang, X.; Yang, C.; Xue, X.; Dou, X. Relationship analysis of PM2.5 and boundary layer height using an aerosol and turbulence detection lidar. Atmos. Meas. Tech. 2019, 12, 3303–3315. [Google Scholar] [CrossRef] [Scilit]
- Li, Y.; Zhang, Q.; Chen, Y.; Hu, X. Vertical structure of atmosphere boundary layer during wind- sandstorm process over sandstorn source in arid area of Northwest China. J. Desert Res. 2014, 34, 206–214. (In Chinese) [Google Scholar]
- Qiu, H.; Zhou, C.; Yang, F.; Ma, K.; Ye, X.-T.; Zhou, X.-Y. Analysis of a typical regional sand-dust event over the eastern Tarim Basin. J. Meteorol. Environ. 2018, 34, 19–27. (In Chinese) [Google Scholar]
- Ren, G.; Ke, W.; Wang, T.; Qiao, G. Characteristics of atmospheric boundary layer inversion and the relationship with dust weather in Jiuquan City. Desert Oasis Meteorol. 2021, 15, 101–108. (In Chinese) [Google Scholar]
- Guo, X.; Wang, Y.; Ma, X.; Tian, C.; Zhang, X.; Zhang, J.; Zhang, H.; Chen, J. Analysis of a typical heavy dust pollution weather in semi-arid region: A case study in eastern Qinghai. Acta Sci. Circumstantiae 2021, 41, 343–353. (In Chinese) [Google Scholar]
- Zhang, X.; Xu, X.; Chen, H.; Hu, X.-M.; Gao, L. Dust-planetary boundary layer interactions amplified by entrainment and advections. Atmos. Res. 2022, 278, 106359. [Google Scholar] [CrossRef] [Scilit]
- Li, X.; Xia, X.; Wang, S.; Mao, J.; Liu, Y. Validation of MODIS and Deep Blue aerosol optical depth retrievals in an arid/semi-arid region of northwest China. Particuology 2012, 10, 132–139. [Google Scholar] [CrossRef] [Scilit]
- Sayer, A.; Munchak, L.; Hsu, N.; Levy, R.C.; Bettenhausen, C.; Jeong, M.-J. MODIS Collection 6 aerosol products: Comparison between Aqua’s e-Deep Blue, Dark Target, and “merged” data sets, and usage recommendations. J. Geophys. Res. Atmos. 2014, 119, 13965–13989. [Google Scholar] [CrossRef] [Scilit]
- Xie, G.; Wang, M.; Pan, J.; Zhu, Y. Spatio-temporal variations and trends of MODIS C6.1 Dark Target and Deep Blue merged aerosol optical depth over China during 2000–2017. Atmos. Environ. 2019, 214, 116846. [Google Scholar] [CrossRef] [Scilit]
- Grell, G.; Peckham, S.; Schmitz, R.; McKeen, S.A.; Frost, G.; Skamarock, W.C.; Eder, B. Fully coupled “online” chemistry within the WRF model. Atmos. Environ. 2005, 39, 6957–6975. [Google Scholar] [CrossRef] [Scilit]
- Chen, S.-H.; Sun, W.-Y. A one-dimensional time dependent cloud model. J. Meteorol. Soc. Jpn. 2002, 80, 99–118. [Google Scholar] [CrossRef] [Scilit]
- Iacono, M.J.; Delamere, J.S.; Mlawer, E.J.; Shephard, M.W.; Clough, S.A.; Collins, W.D. Radiative forcing by long-lived greenhouse gases: Calculations with the AER radiative transfer models. J. Geophys. Res. 2008, 113, D13103. [Google Scholar] [CrossRef] [Scilit]
- Grell, G.A.; Freitas, S.R. A scale and aerosol aware stochastic convective parameterization for weather and air quality modeling. Atmos. Chem. Phys. 2014, 14, 5233–5250. [Google Scholar] [CrossRef] [Scilit]
- Chen, F.; Dudhia, J. Coupling an advanced land surface-hydrology model with the Penn State-NCAR MM5 modeling system. Part II: Preliminary model validation. Mon. Weather Rev. 2001, 129, 587–604. [Google Scholar] [CrossRef] [Scilit]
- Hong, S.; Noh, Y.; Dudhia, J. A New Vertical Diffusion Package with an Explicit Treatment of Entrainment Processes. Mon. Weather Rev. 2006, 134, 2318–2341. [Google Scholar] [CrossRef] [Scilit]
- Jiménez, P.A.; Dudhia, J.; González-Rouco, J.F.; Navarro, J.; Montávez, J.P.; García-Bustamante, E. A Revised Scheme for the WRF Surface Layer Formulation. Mon. Weather Rev. 2012, 140, 898–918. [Google Scholar] [CrossRef] [Scilit]
- Hewson, M.; McGowan, H.; Phinn, S. Comparing Remotely Sensed and Modelled Aerosol Properties for a Region of Low Aerosol Optical Depth. In Proceedings of the IEEE International Geoscience and Remote Sensing Symposium (IGARSS), Munich, Germany, 22–27 July 2012; pp. 2512–2515. [Google Scholar]
- Fast, J.D.; Gustafson, W.I., Jr.; Easter, R.C.; Zaveri, R.A.; Barnard, J.C.; Chapman, E.G.; Grell, G.A.; Peckham, S.E. Evolution of ozone, particulates, and aerosol direct radiative forcing in the vicinity of Houston using a fully coupled meteorology-chemistry aerosol model. J. Geophys. Res. Atmos. 2006, 111, D21305. [Google Scholar] [CrossRef] [Scilit]
- Bohren, C.F.; Huffman, D.R. Absorption and Scattering of Light by Small Particles; Wiley: Hoboken, NJ, USA, 1983. [Google Scholar]
- Shao, Y. Simplification of a dust emission scheme and comparison with data. J. Geophys. Res. Earth Surf. 2004, 109, D10202. [Google Scholar] [CrossRef] [Scilit]
- Shao, Y.; Ishizuka, M.; Mikami, M.; Leys, J. Parameterization of size-resolved dust emission and validation with measurements. J. Geophys. Res. Earth Surf. 2011, 116, D08203. [Google Scholar] [CrossRef] [Scilit]
- Zhang, G. Modern Weather Forecasting Techniques and Methods; China Meteorology Press: Beijing, China, 2007. (In Chinese) [Google Scholar]
- Joshi, J.R. Quantifying the impact of cropland wind erosion on air quality: A high-resolution modeling case study of an Arizona dust storm. Atmos. Environ. 2021, 263, 118658. [Google Scholar] [CrossRef] [Scilit]
- Zhou, X.; Zhang, L.; Chen, L.; Guo, Q. Influence of the dust aerosols on meteorological fields during dust storm. Plateau Meteorol. 2017, 36, 1422–1432. (In Chinese) [Google Scholar]
- Tan, Z.; Ma, M.; Huang, W.; Tan, C.; Zhao, Z.; Ding, F. Study on dust occurrence and transportation related to boundary layer height in Northwest China. Atmos. Sci. Lett. 2022, 23, e1083. [Google Scholar] [CrossRef] [Scilit]
- Liu, L.; Huang, X.; Ding, A. Dust-induced radiative feedbacks in North China: A dust storm episode modeling study using WRF-Chem. Atmos. Environ. 2016, 129, 43–54. [Google Scholar] [CrossRef] [Scilit]
- Ablimitjan, A.; Li, N.; Zhao, K.; Sun, M.; Min, Y. Characteristics of Atmospheric Boundary Layer during an East Irrigated Sandstorm in Tarim Basin. Desert Oasis Meteorol. 2019, 13, 7. (In Chinese) [Google Scholar]
- Zhang, Z.; Yi, Y.; Chen, B.; Du, H. Effect of Dust Weather on Urban Air Quality over Northern China in Spring of 2018 and its Weather Analysis. J. Desert Res. 2019, 39, 13–22. (In Chinese) [Google Scholar]
- Li, G.; Shou, S.; Zhang, G.; Bai, J.; Zhang, C.; Ji, S.; Zhu, L. A Mesoscale DustWeather Dynamic Mechanisn Analysis in Pingdingshan on April 11–12 2006. Meteorol. Environ. Sci. 2007, 1, 66–71. (In Chinese) [Google Scholar]
- Zhang, H.; Yang, C. Analysis of a Severe Cold Wave Weather Process Accompanied by Strong Winds. Meteorol. J. Inn. Mong. 2007, 167, 17–18. (In Chinese) [Google Scholar]
- Yang, J. Study on the FormationMechanism of Gale Sand Dust Weather in Alxa League on April 26, 2022. J. Agric. Catastrophology 2023, 13, 79–81. (In Chinese) [Google Scholar]

Disclaimer/Publisher’s Note: The statements, opinions and data contained in all publications are solely those of the individual author(s) and contributor(s) and not of MDPI and/or the editor(s). MDPI and/or the editor(s) disclaim responsibility for any injury to people or property resulting from any ideas, methods, instructions or products referred to in the content. |
© 2026 by the authors. Licensee MDPI, Basel, Switzerland. This article is an open access article distributed under the terms and conditions of the Creative Commons Attribution (CC BY) license.