


Highlights
What are the main findings?
- The original AIS vessel types were reorganized into nine SAR interpretable ship categories by jointly considering vessel functional attributes, SAR visual separability, sample support, existing SAR ship classification practice, and maritime surveillance requirements.
- An SAR ship classification dataset containing 4472 ship chips was constructed through global optimal SAR and AIS association and high-confidence label filtering.
What are the implications of the main findings?
- The study provides a practical way to transform AIS vessel type information into reliable category supervision for SAR ship classification during dataset construction.
- The classifier trained on the dataset can perform vessel category recognition using SAR imagery alone, supporting maritime surveillance scenarios where AIS information is missing, delayed, or unreliable.
Abstract
Spaceborne Synthetic Aperture Radar (SAR) provides all-weather, day and night and wide-area imaging capability, and plays a critical role in maritime surveillance. While substantial progress has been achieved in SAR ship detection, SAR ship classification remains relatively underexplored, mainly due to the scarcity of reliable category labels. Automatic Identification System (AIS) provides vessel identity, type, and dynamic trajectory information, and thus offers vessel type information that is difficult to obtain directly from SAR imagery. This paper proposes a fine-grained nine-category SAR ship classification method based on AIS association, which reorganizes the original AIS vessel types into nine fine-grained categories of SAR ship, transfers AIS vessel type information to SAR detection through a global optimal matching strategy, and supports SAR-only vessel category recognition. By retaining only high-confidence SAR and AIS matched pairs and cropping the corresponding SAR ship chips, an SAR ship classification dataset containing 4472 ship chips across the nine categories is constructed. In Monte Carlo experiments based on real AIS records, the proposed association strategy achieves more reliable high-confidence label generation than the compared association methods under close ship ambiguity, spatial perturbation, distractor AIS candidates, and AIS static size errors. In the benchmark experiment on the constructed classification dataset, ConvNeXt-Tiny achieves the best performance among the compared mainstream classifiers. These results demonstrate that AIS association can provide reliable category supervision for SAR ship classification, and the trained classifier can perform ship classification using SAR imagery alone.
1. Introduction
Synthetic Aperture Radar (SAR), with its all-weather, day and night and wide-area observation imaging capability, has become an important technology for wide-area maritime surveillance [1]. With recent advances in artificial intelligence, detectors based on deep learning have significantly outperformed traditional constant false alarm rate (CFAR) methods in ship detection performance [2,3], and have achieved substantial progress in multiscale detection [4,5,6], complex scene detection [7,8,9] and lightweight model design [10,11,12]. However, existing studies mainly focus on ship detection, while relatively limited attention has been paid to SAR ship classification [13]. Compared with detection, SAR ship classification is more challenging because SAR images mainly reflect microwave scattering responses. Vessel type differences are often expressed through indirect cues such as target scale, hull structure, scattering center distribution, polarization response, and imaging geometry, which makes fine category interpretation inherently difficult [14].
Early SAR ship classification studies mainly relied on handcrafted features and classical classifiers, including joint feature and classifier selection [15], geometric features combined with multiple kernel learning [16], polarimetric scattering characteristics, sparse representation, and structural descriptors [17,18]. With the development of deep learning, convolutional neural networks (CNNs) and transfer learning have been introduced to improve SAR ship classification performance, especially under limited labeled samples and complex imaging conditions [19,20]. Recent studies have further explored metric learning, dual polarization feature fusion, attention mechanisms, feature embedding, and imbalance-aware learning for SAR ship classification [21,22,23,24,25]. These studies show the potential of learning-based methods, but also indicate that reliable category supervision remains a key bottleneck. In terms of category granularity, most existing SAR ship classification studies adopt relatively coarse settings, such as three-category, four-category, or eight-category recognition tasks [26,27,28]. Compared with these settings, the nine categories considered in this work provide a finer operational category granularity for SAR ship classification. Here, fine-grained classification does not mean directly recognizing every original AIS vessel type. Instead, it refers to an SAR-suitable category design that is finer than coarse vessel grouping while remaining interpretable in SAR imagery and useful for maritime surveillance.
The Automatic Identification System (AIS), as a cooperative maritime monitoring system, provides vessel identity, position, speed, heading, and vessel type information at a relatively high update rate. Previous studies have shown that AIS can improve SAR ship classification by providing vessel type supervision for detected SAR ship targets [29], and that SAR and AIS association can effectively support maritime target interpretation and ship surveillance [30]. However, AIS cannot be directly used as a reliable label source because temporal misalignment, spatial discrepancy, sparse reports, GPS drift, abnormal messages, and dense traffic conditions may introduce incorrect correspondences between AIS records and SAR detections. Traditional nearest neighbor association is efficient in sparse scenes but may produce ambiguous assignments in ports, anchorages, or busy waterways [31,32]. Existing studies have therefore incorporated kinematic and geometric information [33,34], uncertainty reasoning [35], and data-driven metric learning or graph matching [36,37] to improve association robustness. Nevertheless, the label generation requires association results that are not only accurate, but also physically interpretable, globally consistent, and able to reject uncertain pairs. Since multi feature similarity combined with Hungarian assignment has been shown to robustly associate AIS with visual maritime targets in complex traffic scenes [38], a global optimal association formulation is suitable for this work. By constructing a cost matrix that jointly considers position, heading, and vessel size, global matching can reduce local conflicts and improve association reliability [39]. More importantly, rejecting matched pairs with high-association costs helps prevent unreliable AIS vessel types from being transferred to SAR ship chips, which is essential for learning physically meaningful and generalizable SAR ship classification representations.
Based on the above considerations, this paper focuses on fine-grained nine-category SAR ship classification based on AIS association. AIS is used only during dataset construction, whereas the final inference process relies on SAR imagery alone. Specifically, original AIS vessel types are reorganized into nine fine-grained SAR ship categories by jointly considering vessel functional attributes, SAR visual separability, sample support, existing SAR ship classification practice, and maritime surveillance requirements. Reliable category labels are then generated by associating SAR detections with AIS records, and an SAR ship classification dataset is constructed. Finally, representative deep learning classifiers are trained and evaluated on the constructed SAR ship classification dataset to verify whether the AIS-associated labels can provide effective category supervision for SAR ship classification.
The main contributions of this paper are as follows:
- A fine-grained nine-category SAR ship classification method based on AIS association is established. Original AIS vessel types are reorganized by jointly considering vessel functional attributes, SAR visual separability, sample support, existing SAR ship classification practice, and maritime surveillance requirements.
- A nine-category SAR ship classification dataset is constructed from HISEA-1, Sentinel-1, and Gaofen-3 SAR images using AIS-associated label generation. The dataset contains 4472 SAR ship chips with high-confidence category labels.
- A global optimal SAR and AIS association method is used to generate reliable category labels. Based on the constructed dataset, mainstream deep classifiers are benchmarked for nine-category SAR ship classification.
The remainder of this paper is organized as follows. Section 2 presents the proposed method, including SAR image preprocessing, AIS preprocessing, SAR ship detection and feature extraction, SAR and AIS association, and AIS type reorganization for classification dataset construction. Section 3 presents the experimental results and analysis. Section 4 discusses the findings in relation to previous studies, practical implications, limitations, and future research directions. Section 5 concludes the paper.
2. Methods
2.1. Method Overview
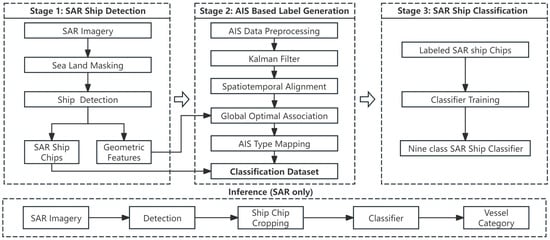
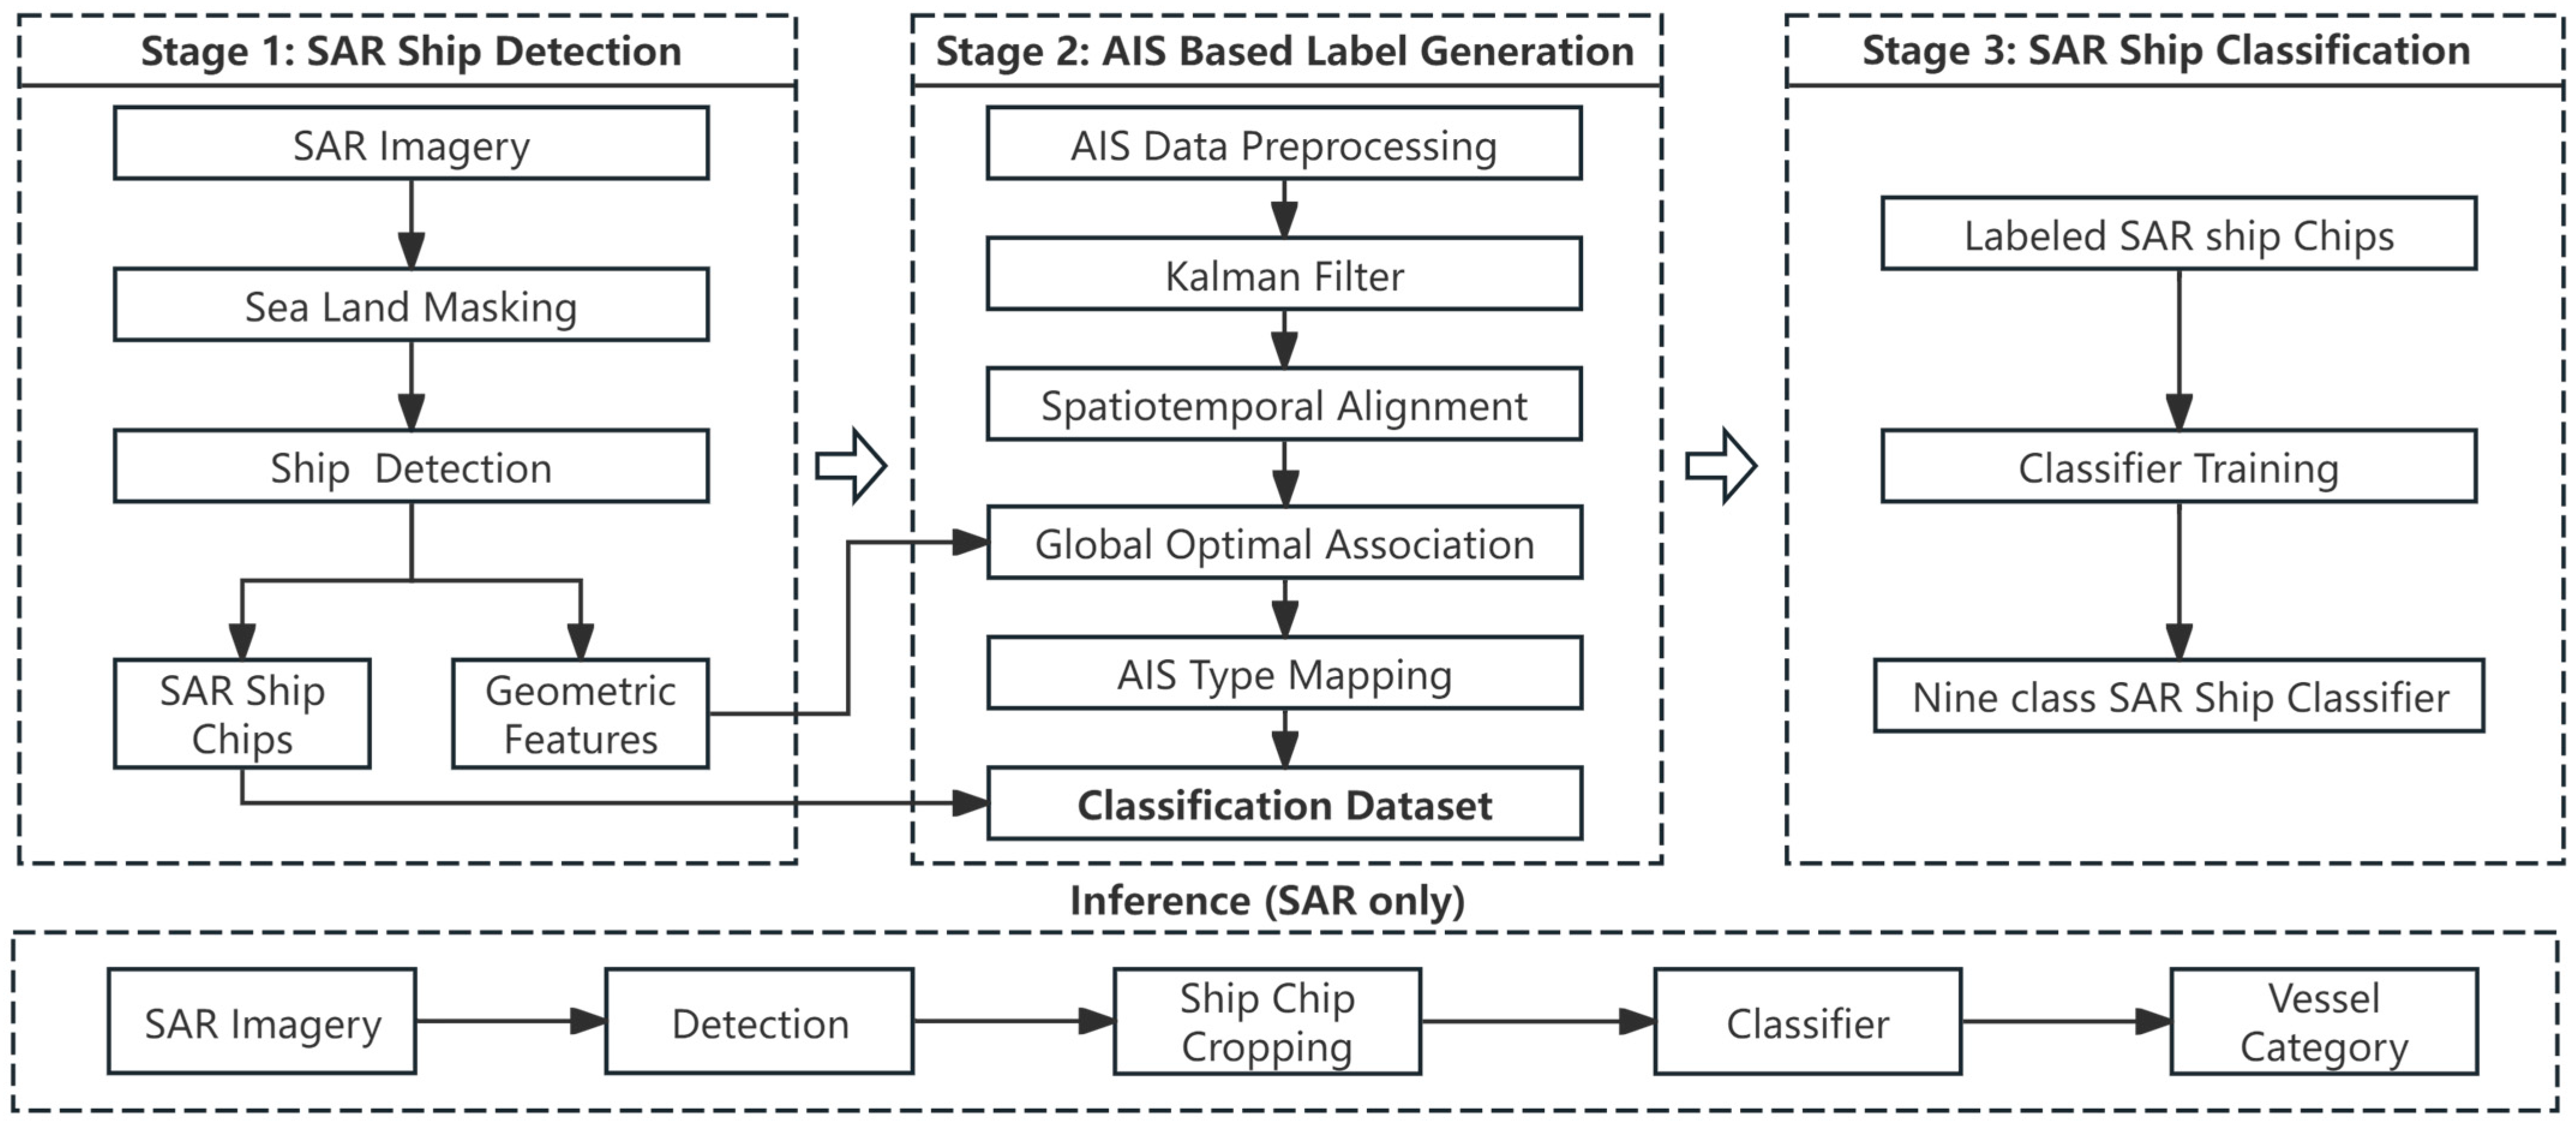
This study presents an SAR ship classification method based on AIS-associated label generation. Figure 1 illustrates the overall workflow of the proposed method, which consists of three connected stages. Stage 1 extracts SAR ship detections and geometric cues from SAR imagery. Stage 2 transfers AIS vessel type information to SAR detections. Stage 3 uses the constructed AIS-associated SAR ship chips to train SAR ship classifiers. Through these stages, AIS information is converted into reliable category supervision during dataset construction, while the final inference process relies only on SAR imagery.
Figure 1.
Overall framework for SAR ship classification based on AIS-associated label generation.
In Stage 1, after sea land masking, YOLOv11-L is applied to the SAR image to localize ship targets. The detected bounding boxes are used to crop SAR ship chips and to extract geometric cues, including position, size, and heading. These cues provide the information required for the following association with AIS records.
In Stage 2, raw AIS messages are first decoded and preprocessed to remove invalid records, reconstruct vessel trajectories, and align AIS positions with the SAR imaging epoch. Then, SAR detections and AIS candidates are associated through a global matching strategy that jointly considers position, heading, and vessel size. Only high-confidence matched pairs are retained. The AIS vessel types of the accepted pairs are further mapped into the nine fine-grained training categories defined in this work, thereby forming a labeled SAR ship classification dataset.
In Stage 3, SAR ship classifiers are trained to recognize the nine vessel categories based on the dataset.
During inference, an SAR image is first processed by ship detection, the detected targets are cropped into SAR ship chips, and the trained classifier predicts vessel categories from SAR imagery alone. Therefore, AIS serves only as a supervision source during dataset construction, whereas the final vessel category prediction is performed using SAR imagery alone.
2.2. Data Preprocessing
2.2.1. SAR Image Preprocessing
Sea land masking is a basic preprocessing step for SAR ship detection to suppress strong land clutter, reduce false alarms, and restrict the search space to the ocean area. Specifically, the World Geodetic System 1984 (WGS84) geographic coordinates corresponding to SAR image pixels are extracted, and the high-resolution Global Self-consistent Hierarchical High-resolution Shoreline (GSHHS) database is introduced as geographic prior information. The cropped land polygons are rasterized and interpolated by nearest neighbor interpolation to generate a land mask.
2.2.2. AIS Data Preprocessing
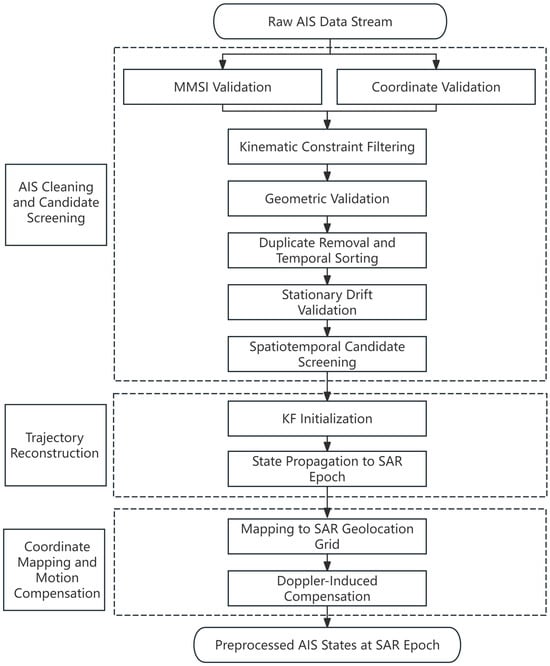
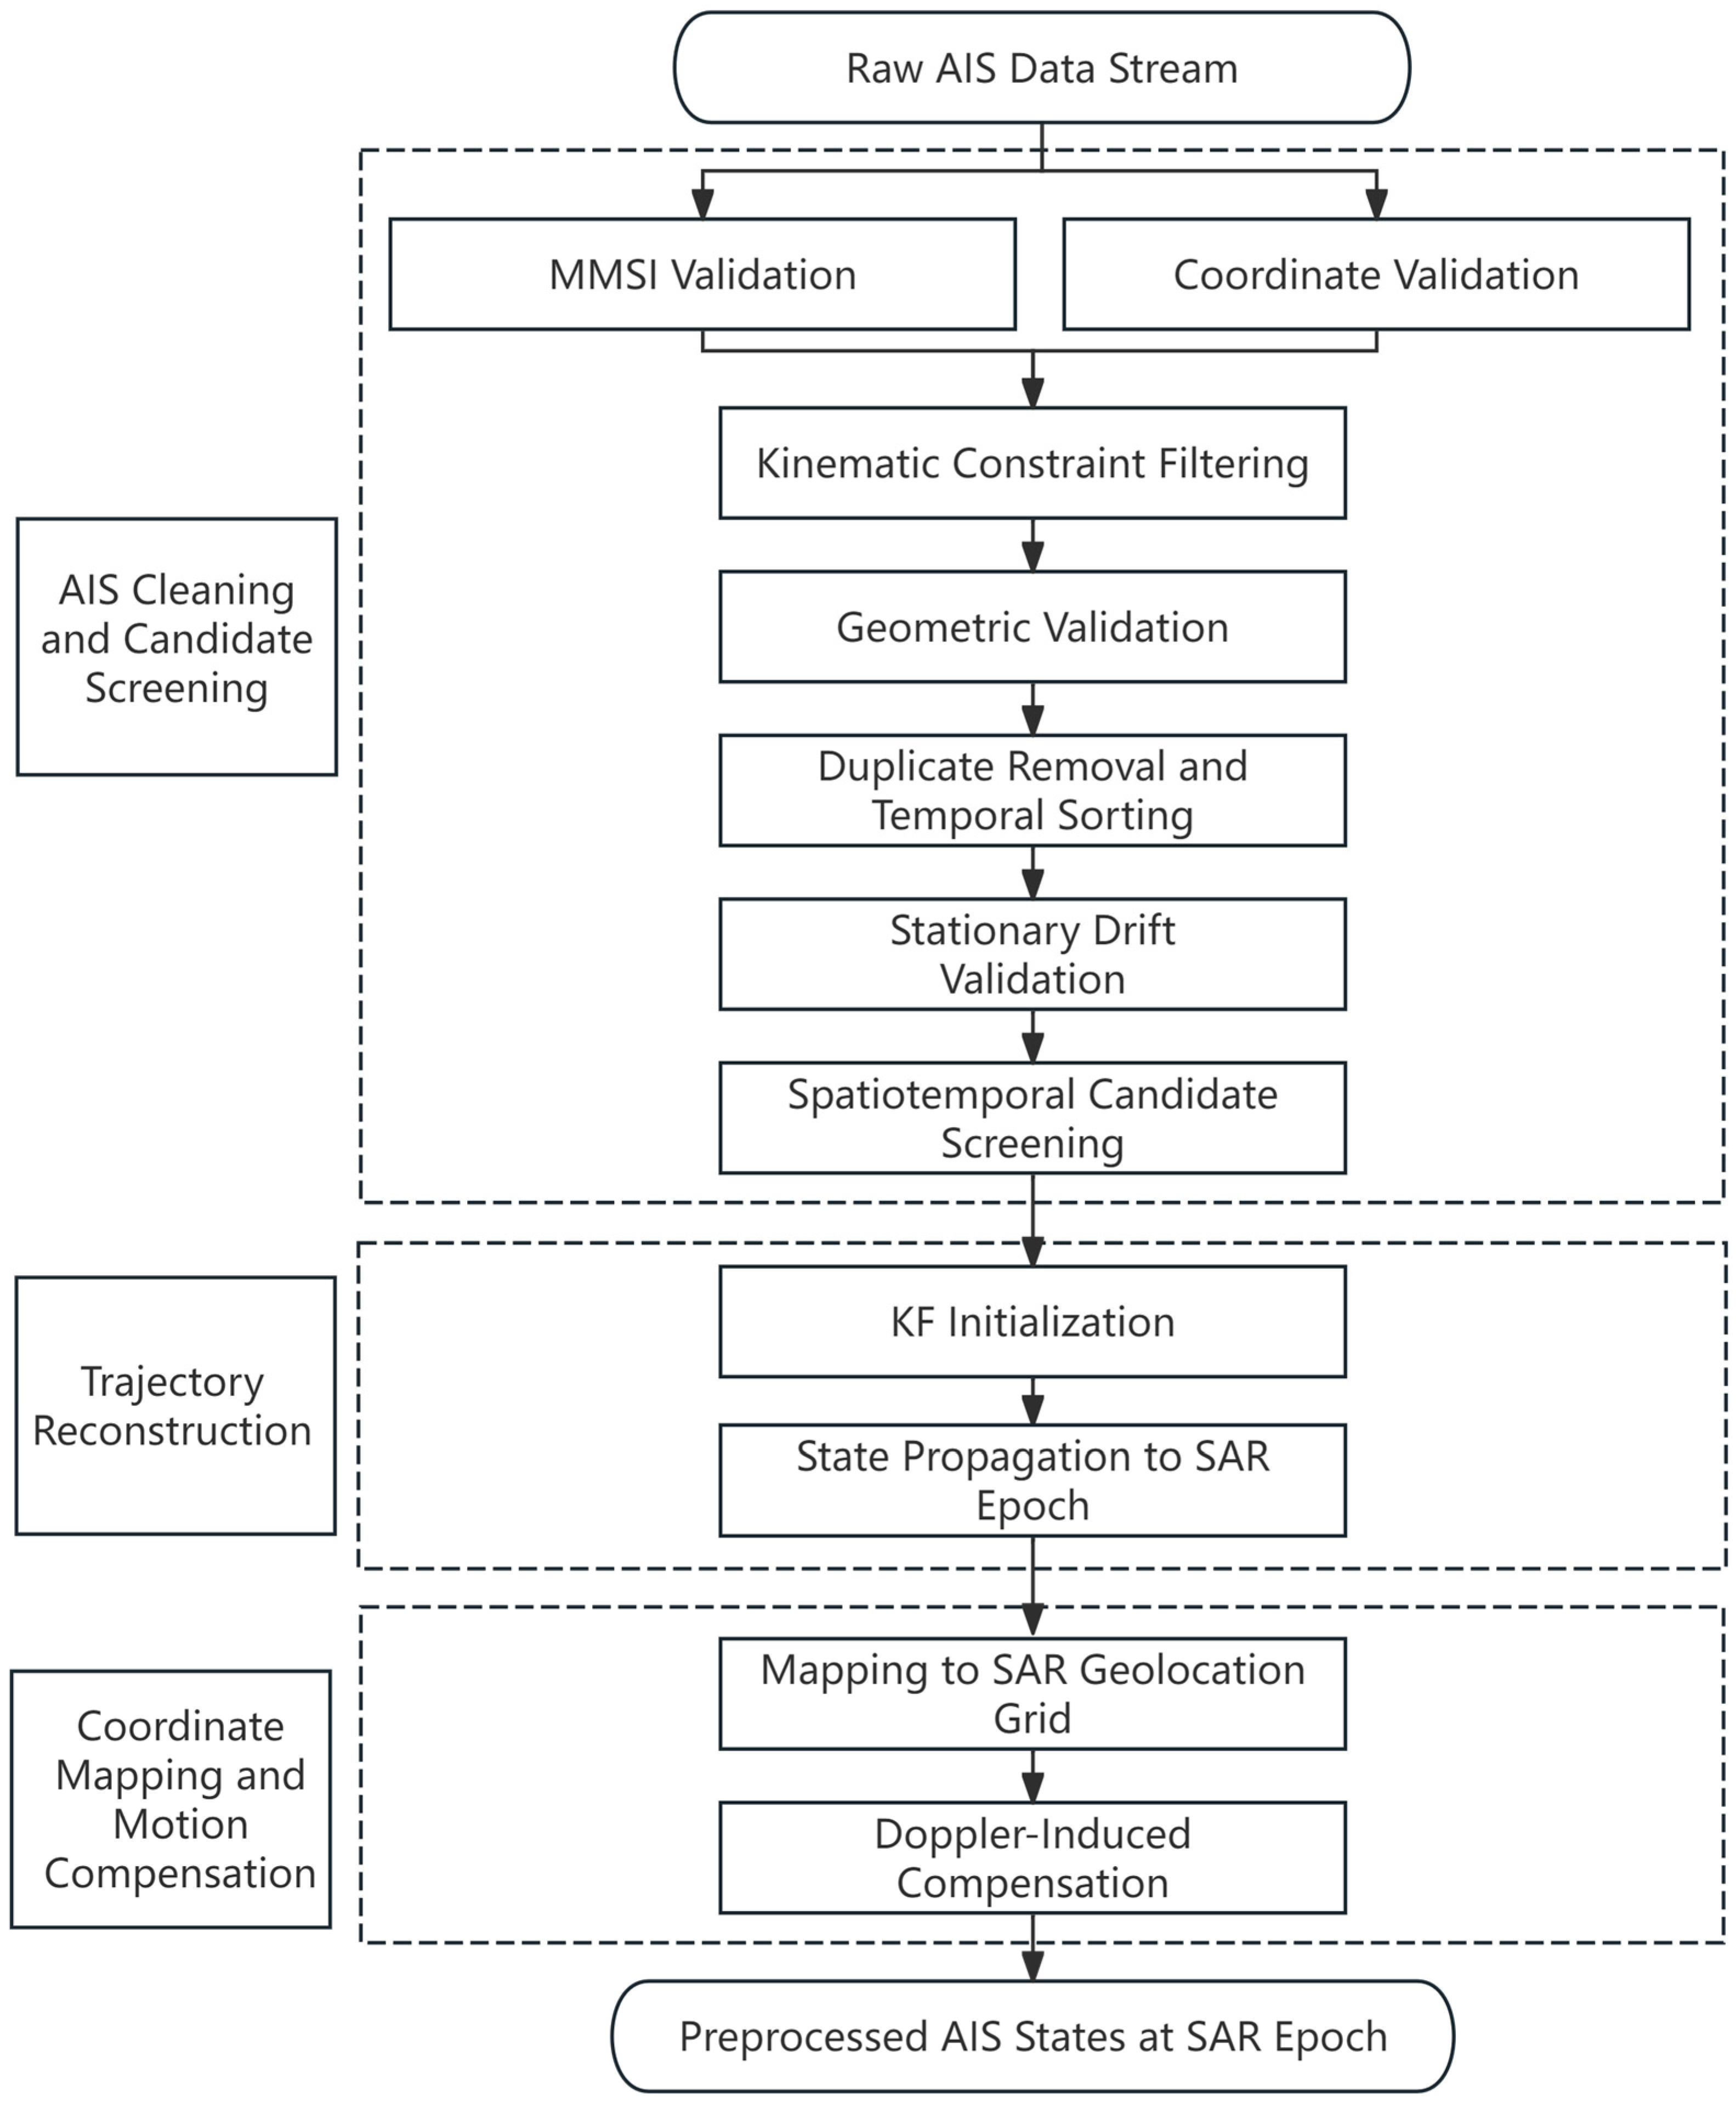
Raw AIS messages are transmitted in National Marine Electronics Association (NMEA) 0183 format following International Telecommunication Union Radiocommunication Sector (ITU-R) Recommendation M.1371 and are decoded before use [40]. As shown in Figure 2, AIS preprocessing is performed to obtain clean, temporally aligned, and spatially consistent AIS states for subsequent SAR and AIS association. The workflow consists of three parts: AIS cleaning and candidate screening, trajectory reconstruction, and coordinate mapping and motion compensation.
Figure 2.
Workflow of AIS data preprocessing.
First, AIS cleaning and candidate screening is applied to remove records that violate explicit and deterministic validity rules. This step is necessary because decoded AIS records may contain missing or invalid MMSI, abnormal coordinates, duplicated reports, unrealistic motion jumps, GPS drift during near stationary periods, or physically implausible vessel dimensions. A record is discarded when it violates a predefined message validity, geographic plausibility, kinematic plausibility, geometric plausibility, duplicate reporting, or stationary drift rule. Table 1 reports the AIS quality control criteria and filtering statistics on a representative 24 h decoded AIS subset used in this study. A partial display of the corresponding decoded AIS records is shown in Figure 3, including key fields such as timestamp, MMSI, longitude, latitude, speed over ground, course over ground, heading, and vessel dimension-related attributes, which is obtained from the decoded AIS dataset provided by the data provider. The selected subset contains 1,347,145 AIS records from 17 April 2025 08:00:00 to 18 April 2025 07:59:59. After sequential filtering, 3702 records are removed, corresponding to a removal ratio of 0.275%, and 1,343,443 records are retained for trajectory reconstruction and association candidate generation.
Table 1.
AIS quality control rules and filtering statistics.
Figure 3.
Example of decoded AIS records used in this study. To protect vessel identity information, the last three digits of each MMSI are anonymized and replaced with “XXX”.
Second, vessel trajectories are reconstructed with a Kalman filter (KF) and propagated to the SAR imaging epoch to obtain temporally aligned position, velocity, and heading estimates. Vessels are grouped by MMSI, sorted chronologically, and reconstructed under a constant velocity motion model. Compared with direct interpolation, the KF suppresses short-term observation noise and reduces unrealistic fluctuations caused by sparse AIS reporting or local GPS drift.
Third, the predicted AIS states are mapped to the SAR geolocation reference. When reliable SAR orbit and imaging geometry metadata are available and the AIS record provides valid vessel speed and course, Doppler-related azimuth displacement is compensated before association. The SAR XML metadata are used to obtain the satellite velocity, flight heading, look direction, and incidence angle. The look azimuth is determined by the satellite heading and look direction. The AIS speed over ground and course over ground are then projected onto the radar line of sight to estimate the radial velocity:
where vAIS is the vessel speed converted from knots to m/s, θcog is the AIS course over ground, θlook is the radar look azimuth, and alpha is the incidence angle. The Doppler-related azimuth displacement is then calculated as
where R is the slant range and Vs is the satellite platform velocity. The sign is determined by the SAR azimuth coordinate convention. The predicted AIS position is shifted along the SAR azimuth direction by ∆az before association. For scenes without reliable orbit or imaging geometry metadata, or for vessels without valid motion information, deterministic Doppler compensation is not applied. In such cases, possible residual displacement is handled by the subsequent distance gate, multi feature association cost, and final cost-based rejection.
AIS states generated from the above workflow provide vessel identity, position, heading, size, and vessel type information for the following label generation stage.
2.3. SAR Detection and Feature Extraction
SAR ship detection is used as the front-end step for generating ship detection and geometric cues required for subsequent AIS-associated label generation. After sea land masking, YOLOv11-L is applied to the SAR image to localize ship targets. It is trained with an input size of 1280 × 1280 pixels, a batch size of 8, and 160 training epochs using the SGD optimizer with an initial learning rate of 0.01 and a cosine learning rate schedule. On the validation set, the detector achieves a Precision of 0.8779, a Recall of 0.8221, an mAP@0.5 of 0.8910, and an mAP@0.5:0.95 of 0.6313. These results indicate that the detector can provide reliable ship localization for subsequent chip cropping, geometric feature extraction, and AIS-associated label generation.
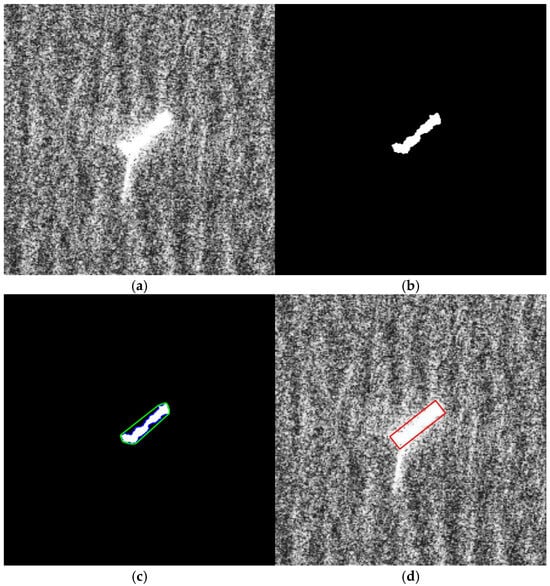
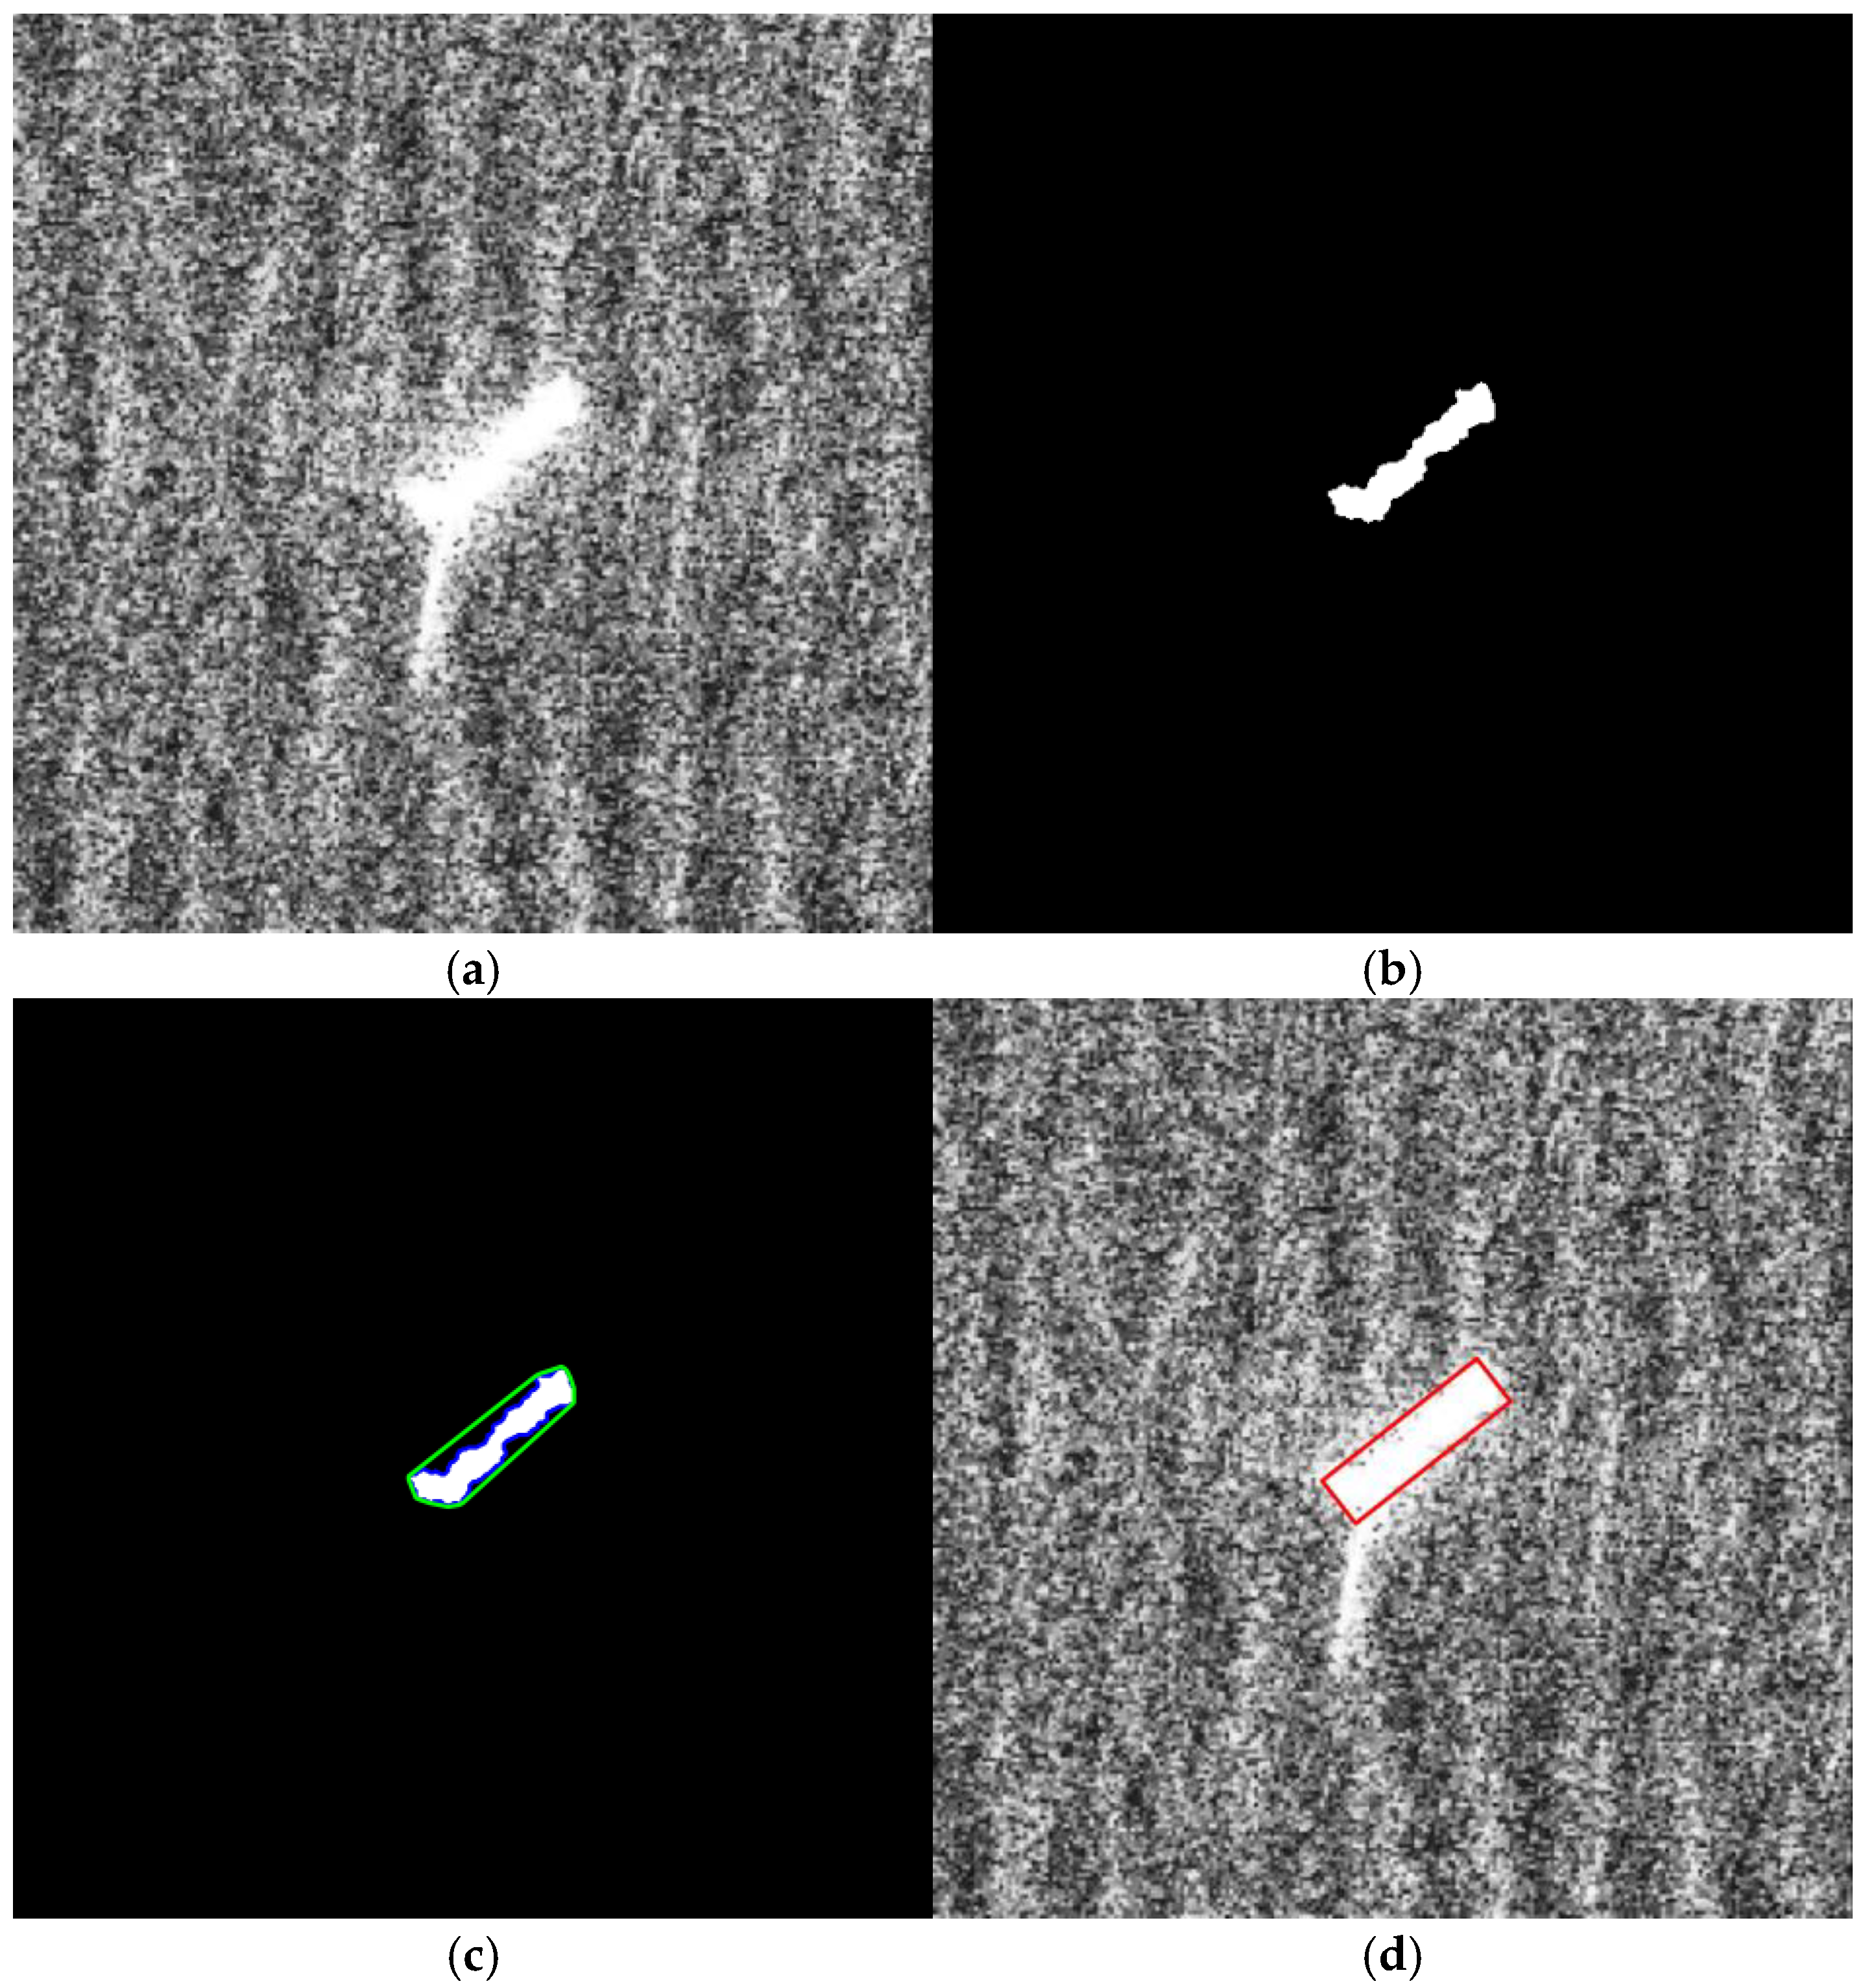
For each detected target, the bounding box is enlarged by 5 pixels on each side before cropping the local chip and geometric feature extraction is then performed on the cropped chip, as illustrated in Figure 4 and key parameters are summarized in Table 2. Figure 4a presents an original SAR ship chip, where the ship body is mixed with sea clutter and sidelobe responses. Figure 4b shows the purified ship body obtained after chip adaptive Otsu thresholding, morphology-based denoising, and significant component filtering. The threshold is estimated independently for each cropped ship chip according to its own gray level histogram. For strong scattering targets whose maximum gray value is larger than 220, a 3 × 3 morphological opening operation is first applied to suppress isolated bright sidelobe responses, followed by Otsu thresholding and two iterations of 5 × 5 morphological closing. For other targets, Otsu thresholding is directly applied after Gaussian smoothing, followed by one iteration of 3 × 3 morphological closing. To avoid treating small isolated fragments as independent ship structures, only significant contours whose areas are larger than 15% of the largest contour area in the chip are retained. Based on these, background clutter is suppressed and the main scattering region of the ship is retained. Figure 4c further extracts the ship contour and fits its convex hull. Finally, Figure 4d derives the minimum bounding rectangle from the convex hull, which provides the geometric basis for subsequent feature calculation. Key parameters for SAR ship feature extraction are summarized in Table 2.
Figure 4.
An example of the visualized process of SAR ship feature extraction. (a) Original SAR Ship Chip; (b) purified ship body; (c) ship contour and convex hull fitting, where the green line denotes the fitted convex hull of the extracted ship body; (d) minimum bounding rectangle-based feature extraction, where the red rectangle denotes the fitted minimum bounding rectangle.
Table 2.
Key parameters for SAR ship feature extraction.
Three types of features are extracted from each SAR ship detection. The position (Cpos) is obtained from the detection center and the SAR geolocation grid. The geometric size (Csize) is estimated from the length and width of the minimum bounding rectangle and converted into meters according to the SAR image resolution. The heading (Chead) is estimated from the principal axis direction of the minimum bounding rectangle, the long side of which is defined as the principal axis of the SAR ship target, and normalized to the range of 0–180° to account for the inherent directional ambiguity of SAR ship detections. These features provide the position, size, and heading cues used in the subsequent global association step, thereby enabling reliable AIS-associated category labels to be assigned to SAR ship chips.
2.4. AIS-Associated Label Generation for SAR Ship Classification
The AIS-associated label generation procedure is used to assign vessel category labels to SAR ship detections and to construct the SAR ship classification dataset.
2.4.1. SAR and AIS Association
After AIS preprocessing and SAR ship detection, each SAR detection is associated with AIS candidates that are temporally aligned with the SAR acquisition time. To reduce ambiguous matches in dense maritime scenes, the association is formulated as a global assignment problem with cost-based rejection. For the (i)-th SAR detection and the (j)-th AIS candidate, let and denote their projected positions in meters at the SAR imaging epoch. Let and denote their headings. Let and denote their estimated length and width, respectively. AIS candidates are first filtered by the temporal matching window and the hard distance gate. Candidate pairs outside the matching window or with a spatial distance larger than Dgate are assigned an invalid cost and are not considered in the assignment.
For valid candidate pairs, the association cost consists of three normalized terms, including position discrepancy, heading inconsistency, and vessel size incompatibility. The position cost is defined as
where (Dpos) is the position normalization scale. The heading cost is defined as
where (Dhead) is the heading normalization scale, and () is computed by considering the 180° directional ambiguity of SAR ship detections:
The size cost is defined using the logarithmic ratio of length and width:
where (Dsize) is the size normalization scale and (ϵ) is a small constant used to avoid numerical instability. In this study, (ϵ) is set to 1 m.
The final composite association cost is calculated as
where (wpos), (whead), and (wsize) are the weights of the three cost terms and sum to one. AIS vessel type is not included in the association cost.
After the cost matrix is constructed, the Hungarian algorithm is used to obtain a one-to-one global optimal assignment between SAR detections and AIS candidates. This algorithm is selected because the SAR and AIS association problem in this study can be formulated as a bipartite linear assignment problem, where each SAR detection should be matched with at most one AIS candidate and each AIS candidate should be assigned to at most one SAR detection. The Hungarian algorithm optimizes the total association cost over all candidate pairs simultaneously. In addition, it is computationally efficient for the reduced candidate set after temporal filtering and distance gating. Therefore, it is suitable for generating large volumes of accurate AIS-associated label generation. Its specific formula is
subject to
Here, (Xij = 1) indicates that the (i)-th SAR detection is assigned to the (j)-th AIS candidate.
Finally, cost-based rejection is applied to the assigned pairs. A matched pair is accepted as a high-confidence SAR and AIS association only when
A lower association cost indicates higher consistency between an SAR detection and an AIS candidate. In addition, when the cost margin between the best and second-best AIS candidates is smaller than Δmargin, the pair is considered ambiguous and rejected. In this way, the association process not only selects globally consistent matches, but also prevents ambiguous or physically inconsistent AIS vessel type information from being transferred to the SAR ship classification dataset. The key parameters used in candidate screening, cost normalization, global assignment, and final acceptance are summarized in Table 3.
Table 3.
Key hyperparameters for SAR and AIS label generation.
2.4.2. AIS Type Reorganization and SAR Classification Dataset Construction
The vessel type information used for category reorganization is derived from the AIS data source. Specifically, standard AIS messages provide the basic vessel identity and type-related information, while the fine vessel type names used in Table 4, such as Cement Carrier, Timber Carrier, Ore Carrier, LPG, LNG, Reefer Ship, and Pure Car and Truck Carrier, are obtained from vessel static attribute fields. Because AIS vessel types are usually defined at a relatively fine granularity, directly using the original AIS types as training labels may lead to an overly fragmented category system for SAR ship classification. Therefore, the category design in this work is determined by jointly considering vessel functional attributes, the visual separability of ship types in SAR imagery, category settings in existing SAR ship classification datasets, and practical requirements from maritime surveillance applications. Specifically, this category design follows four principles. First, original AIS vessel types with highly similar transportation functions and similar SAR scale morphology are merged into the same training category, such as Tanker-related vessel types. Second, vessel groups with clear functional meanings and relatively distinguishable SAR appearance are retained as independent categories, such as Container Ship, Fishing, Tug, and Passenger. Third, categories with sufficient sample support are preserved to avoid over compressing semantically meaningful vessel groups into a heterogeneous residual class. Fourth, rare, ambiguous, or structurally heterogeneous vessel types that cannot support a stable SAR interpretable category are assigned to “Others”.
Table 4.
Correspondence between AIS vessel types and SAR ship training categories.
Based on four principles, the original AIS vessel types are reorganized into nine fine-grained SAR ship training categories including Bulk Carrier, Container Ship, Tanker, Others Types Dry Cargo Ship, Engineering and Service Vessels, Tug, Fishing, Passenger, and Others, as summarized in Table 4. Here, fine-grained refers to the relative category granularity of the proposed SAR ship classification scheme. It is finer than coarse ship grouping, but it still avoids using excessively detailed AIS types that cannot be reliably distinguished from SAR image evidence. For each accepted SAR and AIS matched pair, a fixed-size SAR ship chip is cropped from the original SAR image according to the detected bounding box. The corresponding AIS vessel type is then assigned to one of the nine training categories according to Table 4 and assigned as the class label of the SAR ship chip. Only matched pairs whose total association cost is lower than a predefined acceptance threshold are retained. In this way, the dataset construction process introduces a label rejection mechanism and reduces the propagation of uncertain AIS associations into the final classifier.
After the AIS-associated SAR ship classification dataset is constructed, the accepted ship chips and their nine reorganized category labels are used to train SAR ship classifiers. During inference, AIS information is no longer required. Ship targets are first localized from SAR imagery, then cropped into SAR ship chips, and finally fed into the classifier after training to obtain vessel category predictions. Therefore, AIS serves only as a supervision source during dataset construction, whereas the final classification process is performed using SAR imagery alone.
3. Experimental Results and Analysis
3.1. Evaluation of AIS-Associated Label Generation
3.1.1. Trajectory Reconstruction Evaluation
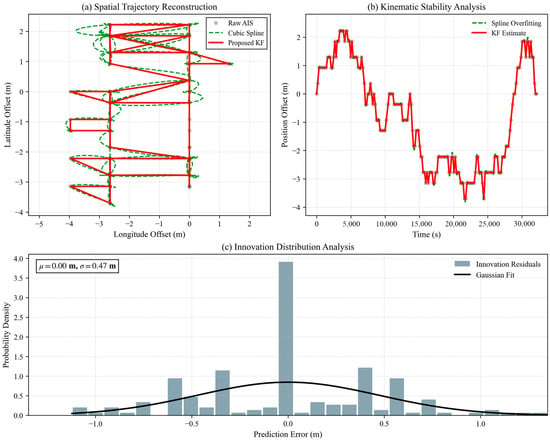
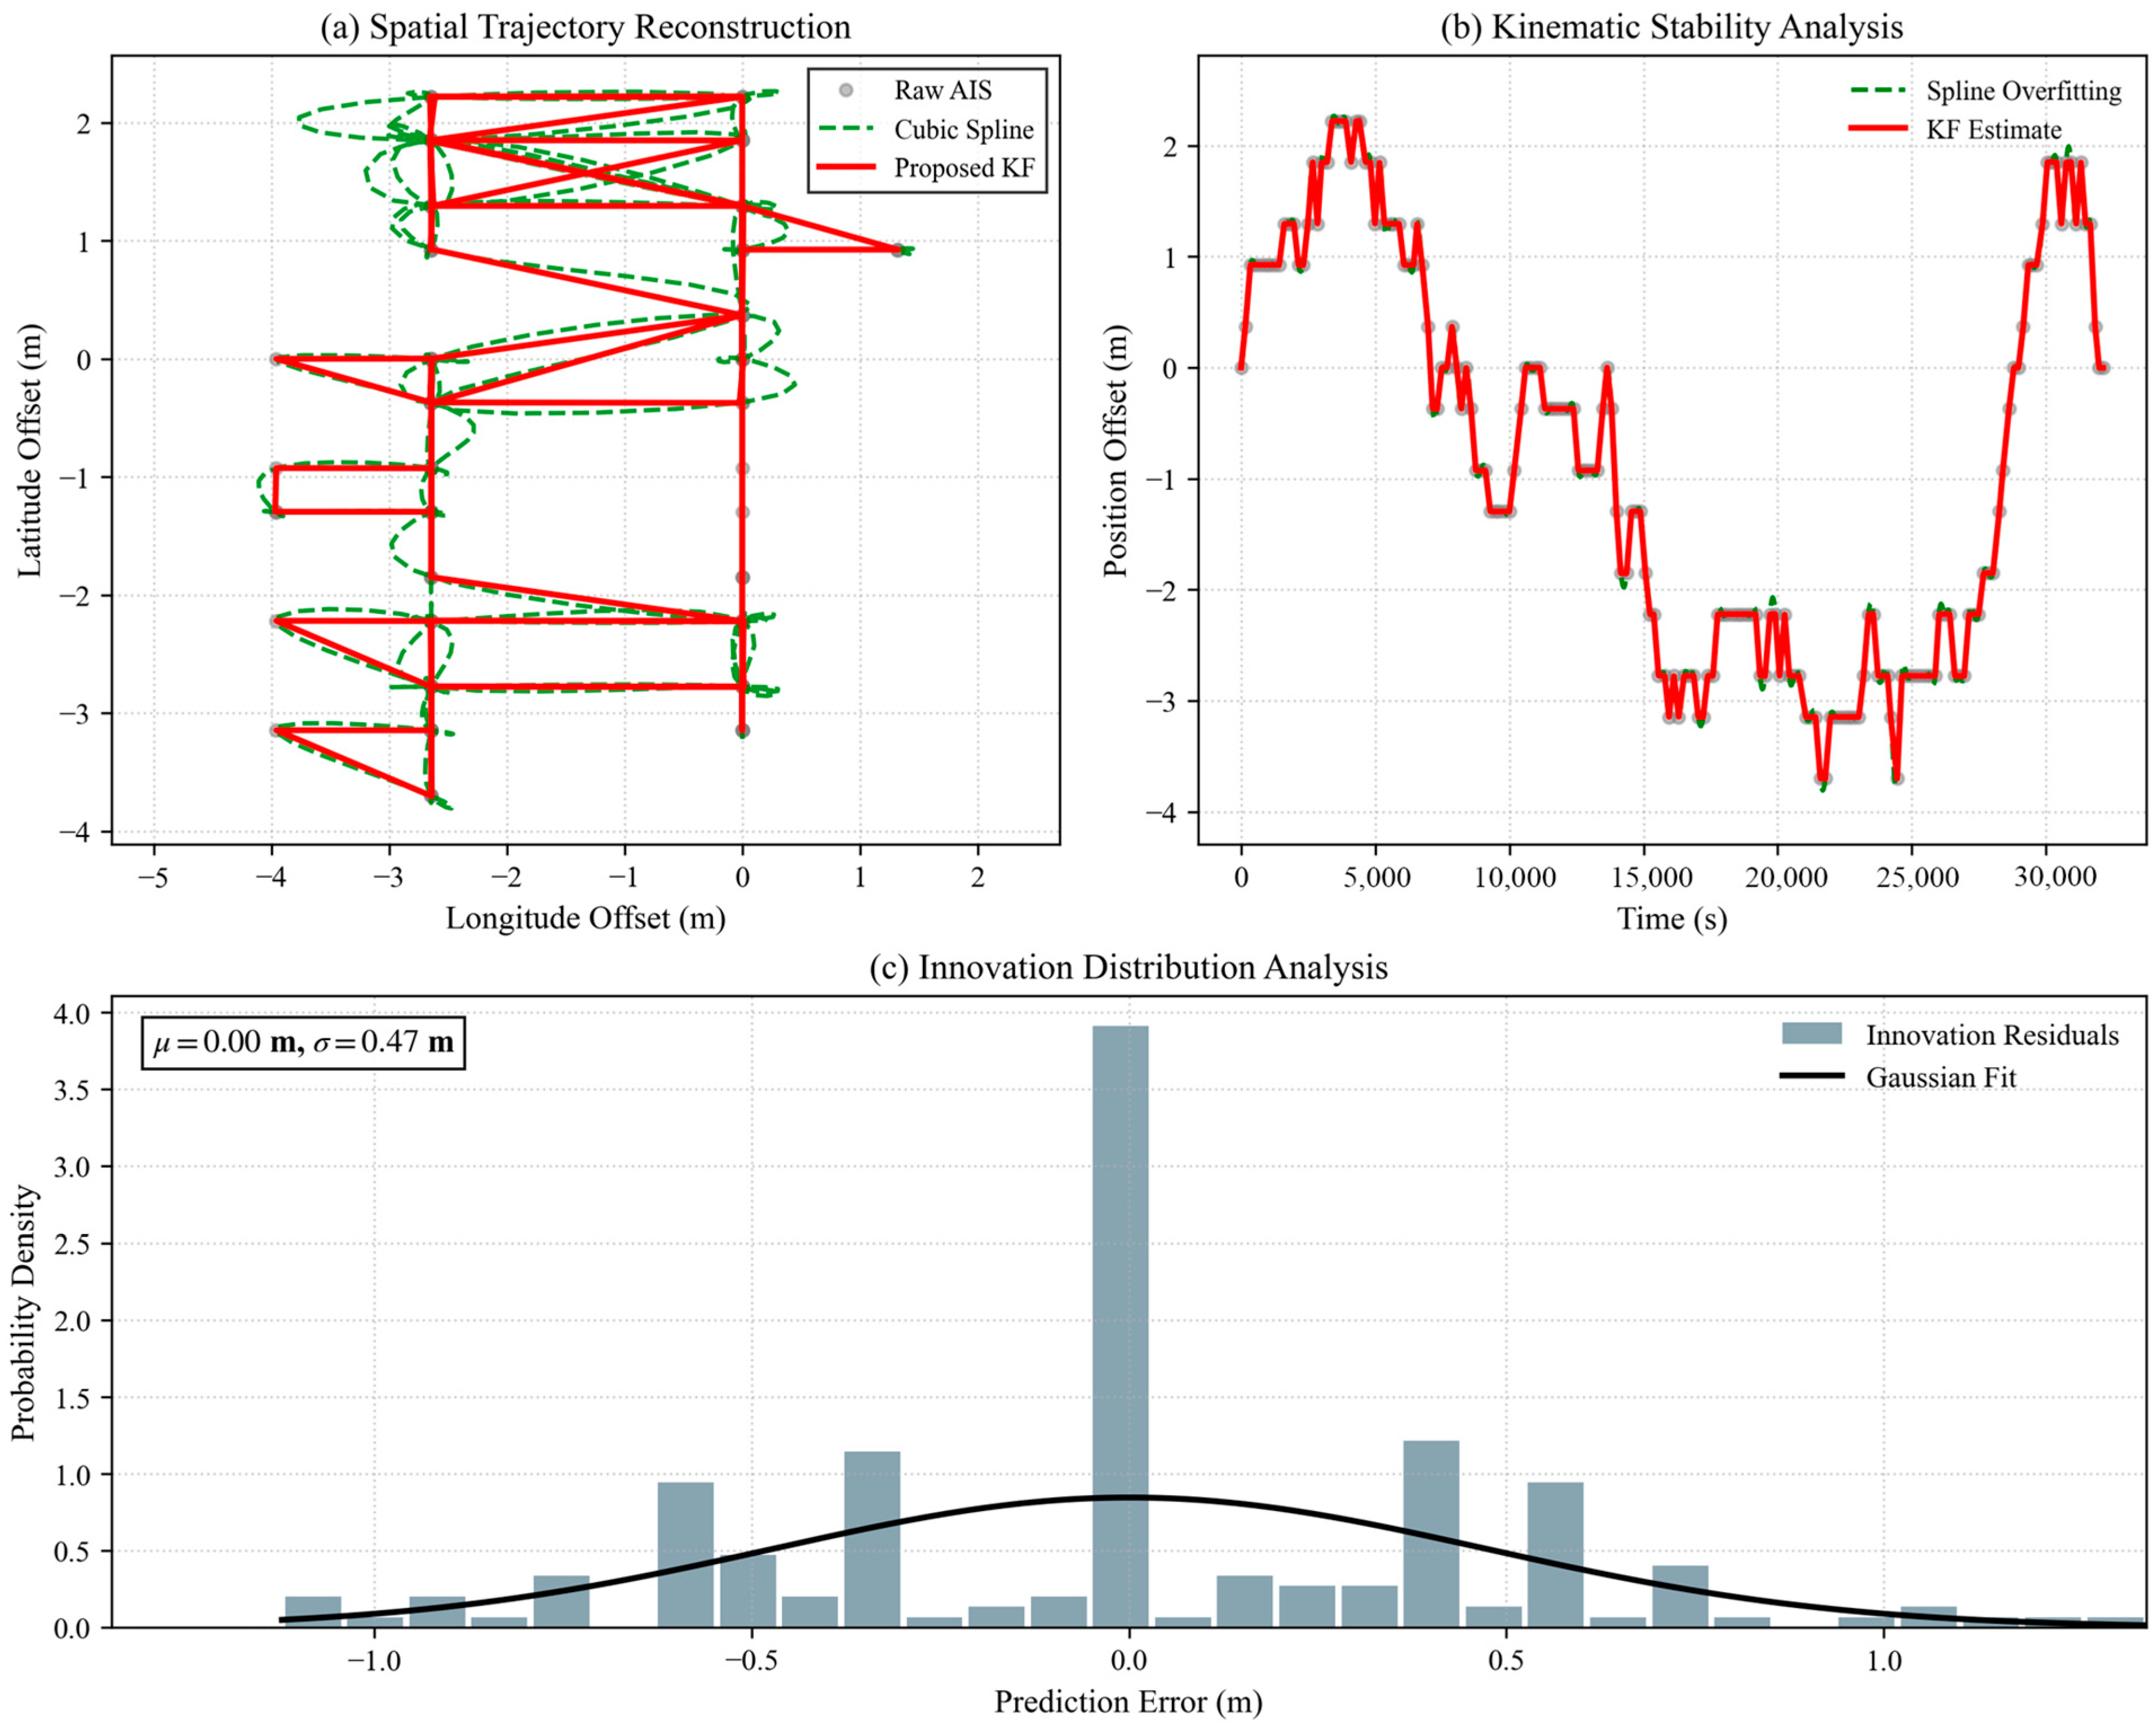
AIS trajectory reconstruction is evaluated because SAR and AIS association requires temporally aligned AIS states at the SAR imaging epoch rather than raw asynchronous AIS reports. Figure 5 presents the reconstruction result from three complementary aspects, including the spatial trajectory comparison, the local kinematic stability, and the innovation residual distribution of the KF. In Figure 5a, the cubic spline interpolation tends to follow local AIS perturbations, which may introduce unrealistic fluctuations when AIS reports are noisy or unevenly sampled. In contrast, the KF incorporates a motion consistency constraint and produces a smoother trajectory that is more suitable for extrapolating vessel states to the SAR acquisition time. Figure 5b further compares the temporal position offsets. In this panel, the grey dots represent Raw AIS position offsets at discrete AIS sampling times, the green dashed line represents the Cubic Spline reconstruction, and the red solid line represents the KF Estimate. The KF Estimate follows the main motion trend while suppressing local fluctuations. The innovation residual distribution in Figure 5c is concentrated around zero with limited dispersion, suggesting that the reconstructed trajectory is consistent with the AIS observations while avoiding excessive fitting to local noise. These results indicate that the KF-based trajectory reconstruction provides stable AIS position estimates for the following SAR and AIS association step.
Figure 5.
Evaluation of AIS trajectory reconstruction for SAR and AIS temporal alignment. (a) Spatial Trajectory Reconstruction; (b) kinematic stability analysis; (c) innovation distribution analysis.
3.1.2. Comparative Evaluation of SAR and AIS Association Reliability
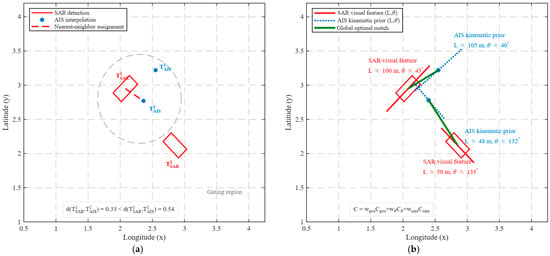
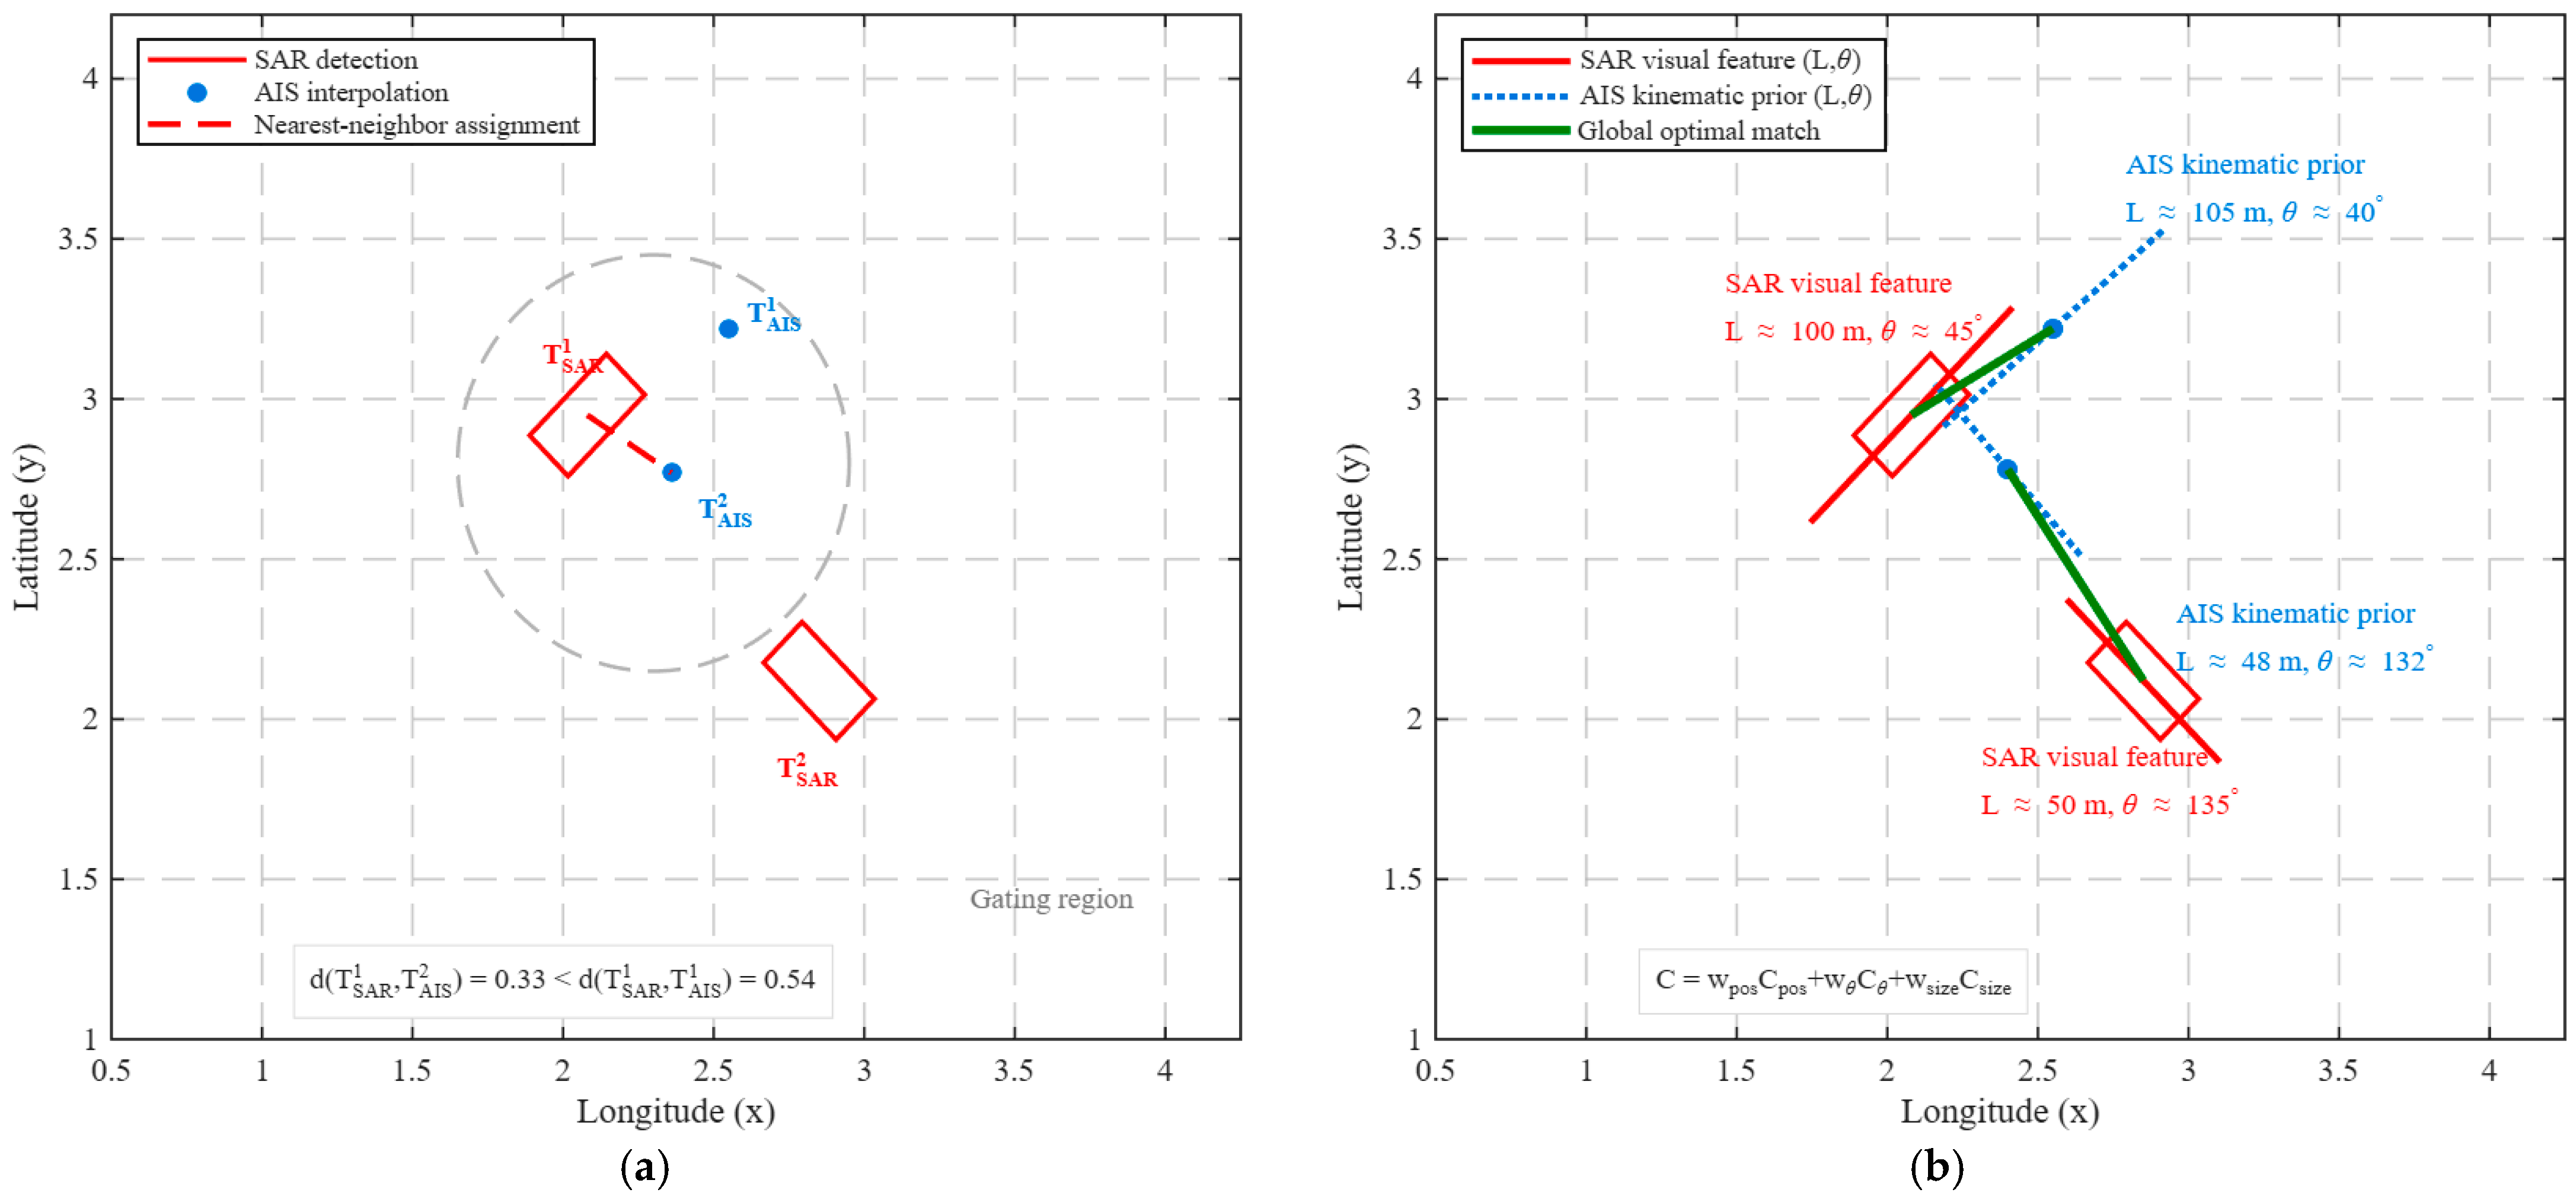
The association step determines whether AIS vessel type information can be reliably transferred to SAR ship chips. Figure 6 illustrates SAR and AIS association under close vessel ambiguity, comparing the conventional nearest neighbor (NN) association strategy with the proposed global optimal association strategy. In this scenario, several AIS candidates are spatially close to the SAR detections, and the spatial distance between different candidates may be comparable to the SAR geolocation error, AIS prediction error, or motion-induced displacement. As shown in Figure 6a, the grey dashed circle represents the spatial gating region for candidate AIS selection, indicating that multiple AIS candidates can fall within the same feasible association region when vessels are close to each other. The NN strategy may assign an SAR detection to a spatially closer but physically inconsistent AIS candidate, leading to incorrect vessel identity transfer. In contrast, Figure 6b shows that the proposed strategy avoids such locally greedy assignments by performing global one-to-one matching with multi-feature consistency constraints.
Figure 6.
Illustrative comparison of SAR and AIS association under close vessel ambiguity. (a) Conventional NN Association; (b) proposed global optimal association.
To evaluate whether the proposed SAR and AIS association strategy can provide reliable labels for dataset construction, a controlled Monte Carlo experiment was conducted using vessel states sampled from real AIS records. In each trial, 45 vessel states were used as ground truth vessel states at the SAR imaging epoch. Simulated SAR detections and AIS predicted states were generated by adding perturbations to position, heading, and vessel size. In addition, close AIS distractors, extremely close ambiguous candidates, random AIS distractors, and AIS static size errors were introduced to evaluate the robustness of different association strategies in spatially crowded scenes. Two metrics were used for evaluation. Accepted association precision measures the proportion of correct matches among all accepted SAR and AIS pairs, and therefore reflects the reliability of labels retained for dataset construction. Correct accepted association coverage measures the proportion of true vessels that are correctly accepted after the rejection process, and therefore indicates whether the method retains a sufficient number of reliable associations. The main settings of the experiment are shown in Table 5.
Table 5.
Main settings of the Monte Carlo association reliability experiment.
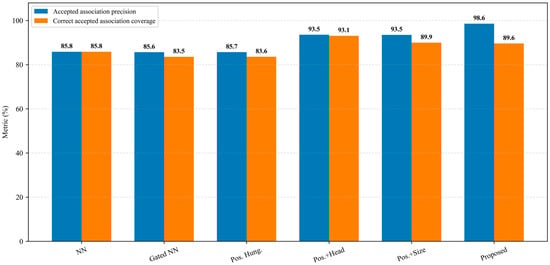
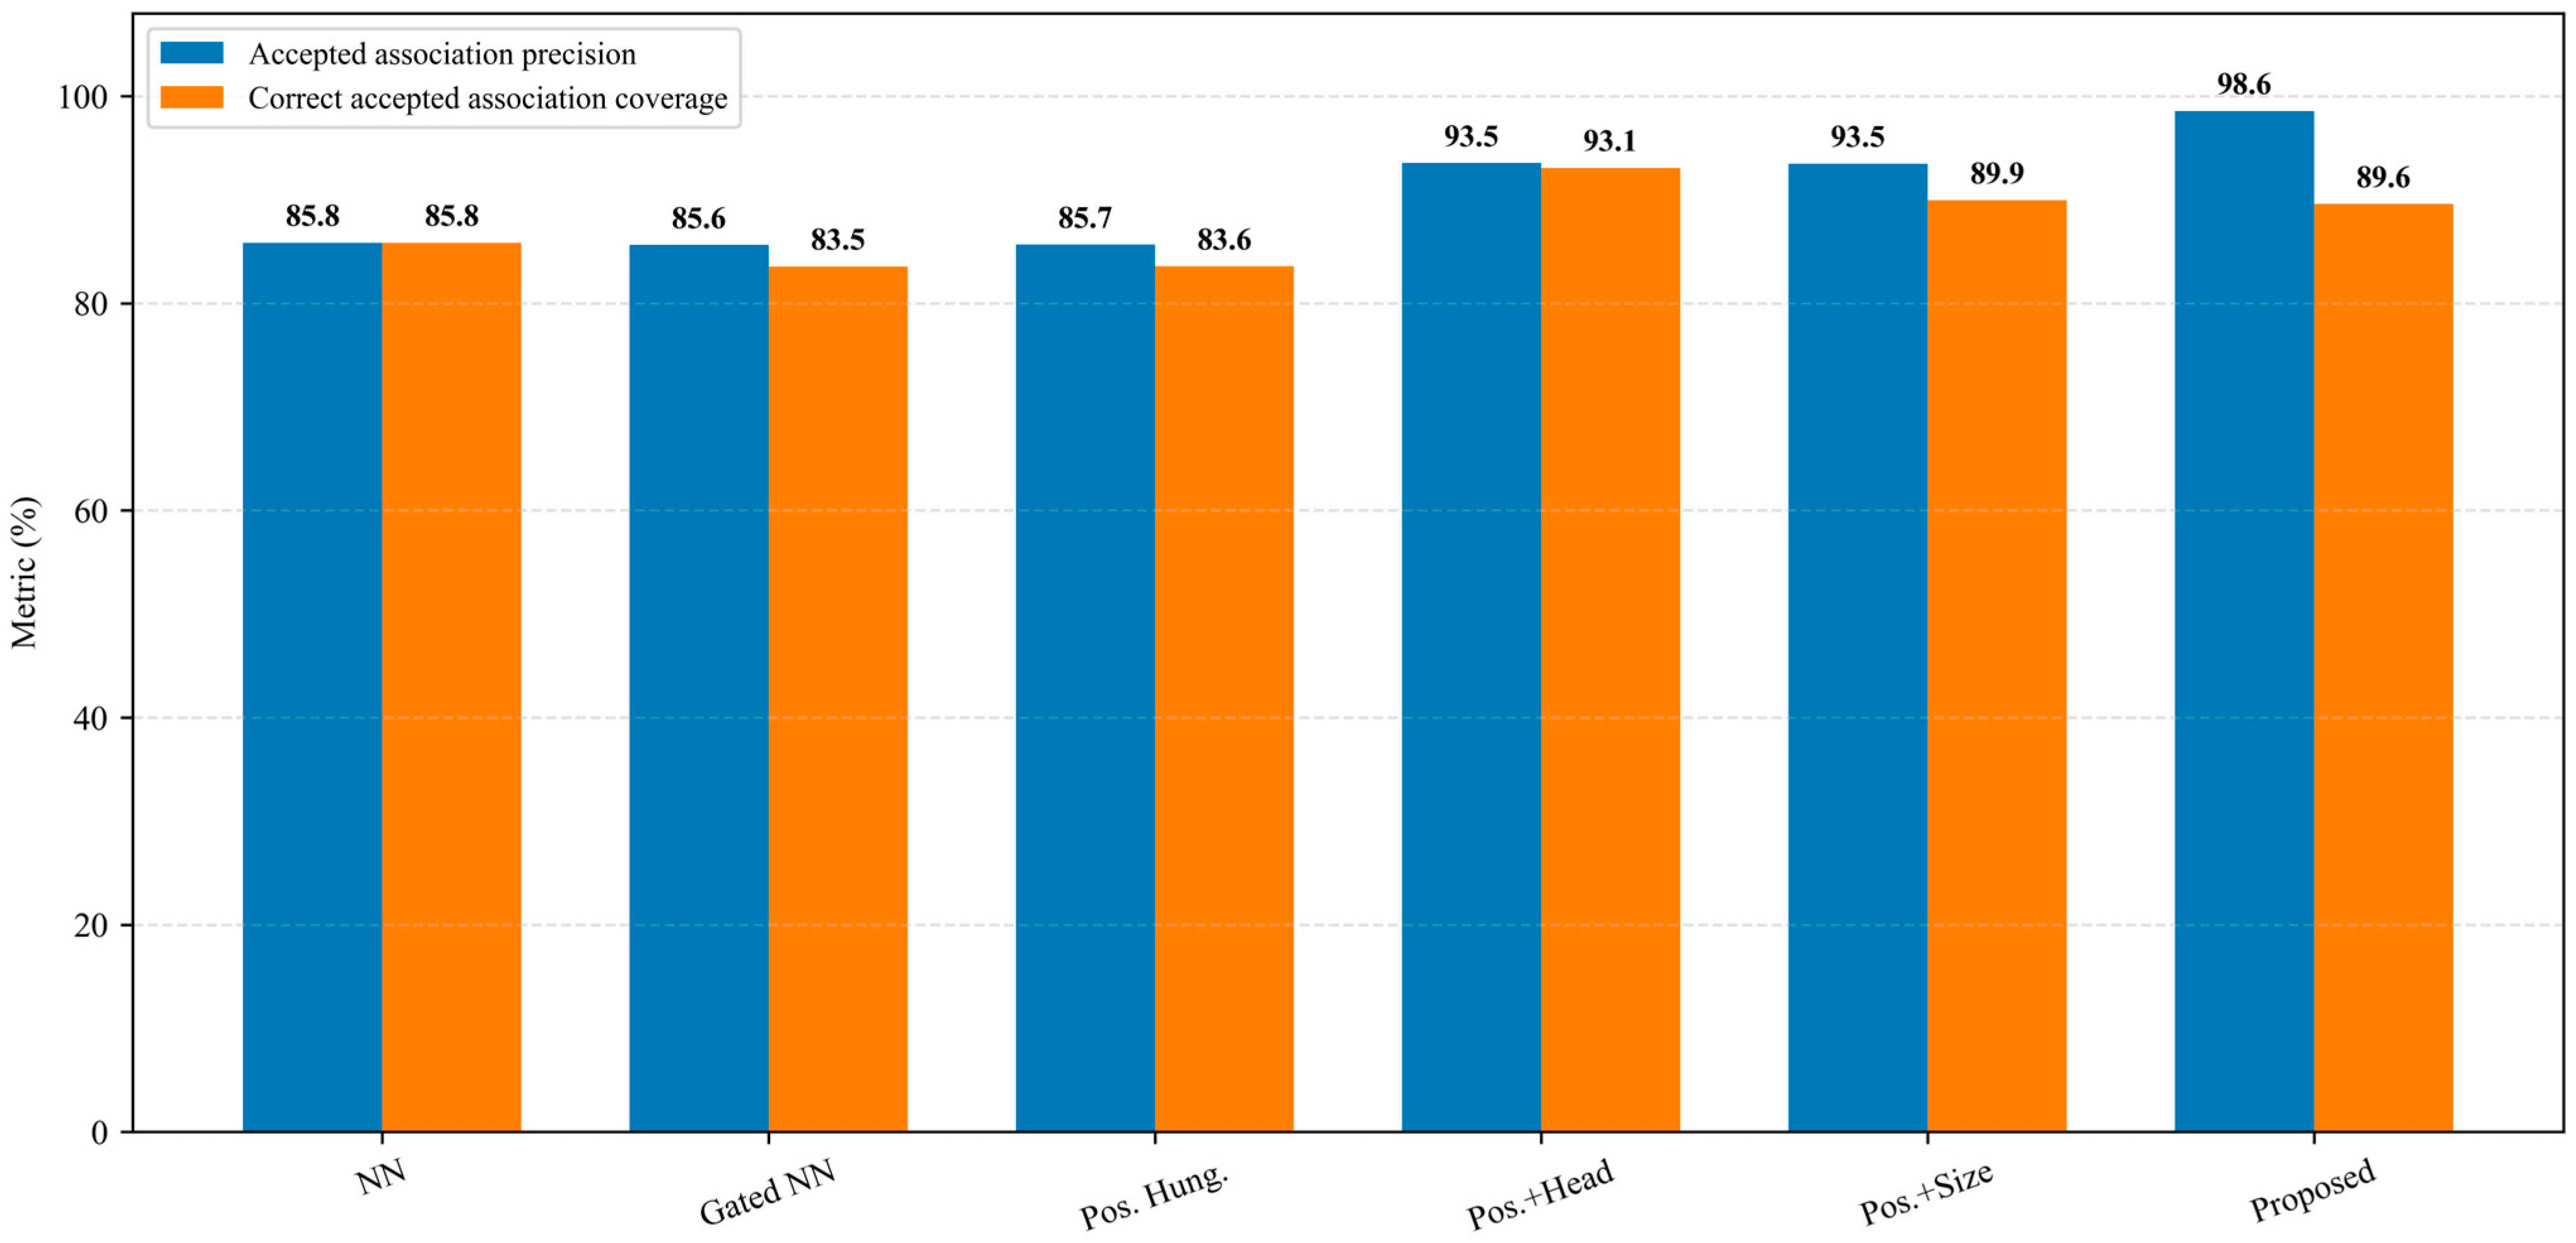
As shown in Figure 7, the position-only strategies, including NN, Gated NN, and position-only Hungarian matching, achieve accepted association precision values of 85.8%, 85.6%, and 85.7%, respectively. After introducing heading or size consistency, the accepted association precision increases to 93.5%. The proposed method further improves the accepted association precision to 98.6%, while maintaining a correct accepted association coverage of 89.6%. These results demonstrate that the combination of multi feature cost evaluation, global optimal assignment, and rejection of ambiguous matches can effectively improve the reliability of AIS-associated label generation. For extremely close vessels, if the best and second-best AIS candidates remain difficult to distinguish after position, heading, and size consistency evaluation, the matched pair is rejected and is not used for classification dataset construction. Therefore, the reported precision reflects the reliability of accepted high-confidence labels.
Figure 7.
Comparison of accepted association precision and correct accepted association coverage.
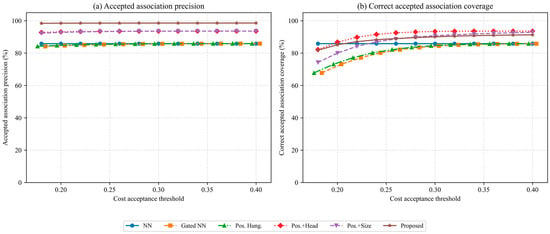
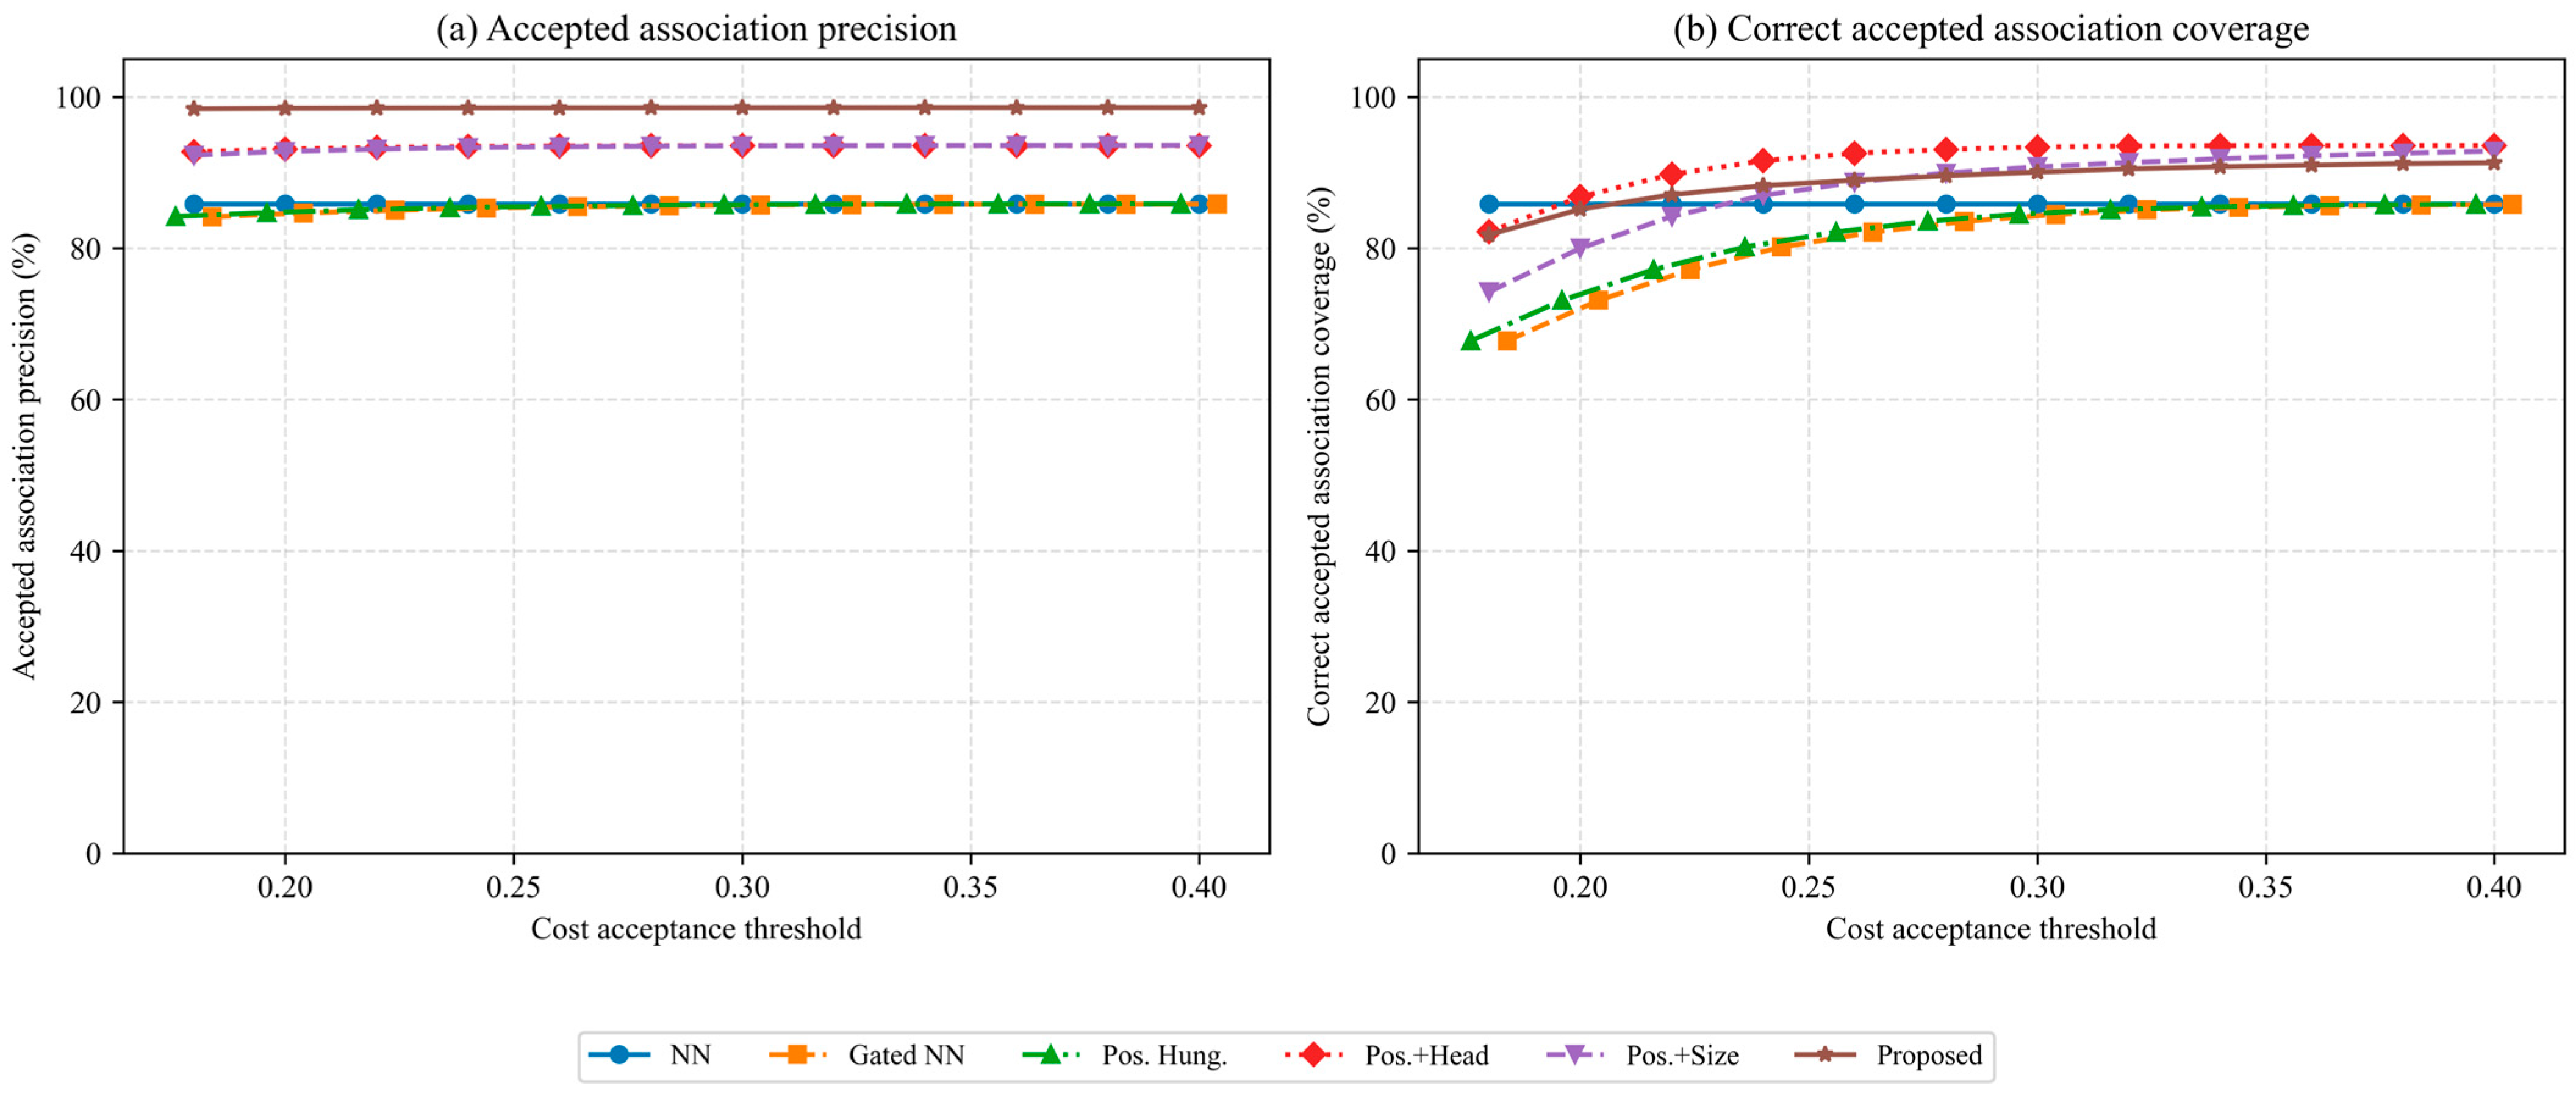
As shown in Figure 8, the choice of the final cost acceptance threshold was further examined by threshold sensitivity analysis. The proposed method maintains an accepted association precision close to 98.6% over the tested threshold range from 0.18 to 0.40, indicating that its high-confidence association performance is not sensitive to a specific threshold value. When the threshold is too small, the rejection rule becomes overly strict and the correct accepted association coverage decreases because more potentially correct pairs are discarded. As the threshold increases, more matched pairs are accepted and the coverage increases accordingly. In this study, τcost = 0.28 is selected because it lies in the stable high-precision region and provides a balanced result, with an accepted association precision of 98.6% and a correct accepted association coverage of 89.6%. Larger thresholds only provide limited additional coverage while making the acceptance rule less conservative. Therefore, τcost is used as the final threshold for high-confidence AIS-associated label generation.
Figure 8.
Sensitivity analysis of accepted association precision and correct accepted association coverage under different cost acceptance thresholds. (a) Accepted association precision. (b) Correct accepted association coverage. The markers of Gated NN and Pos. Hung. are displayed with x-axis offsets of +0.004 and −0.004 cost threshold units, respectively, only for visual clarity, and the original threshold values remain unchanged.
3.2. Benchmark Evaluation on the Constructed Classification Dataset
3.2.1. Dataset and Split Protocol
Based on the AIS-associated label generation pipeline described in Section 2.4, an SAR ship classification dataset is constructed from HISEA-1, Sentinel-1, and Gaofen-3 SAR images. The dataset contains 4472 SAR ship chips covering nine vessel categories, and the sample distribution across different SAR data sources is summarized in Table 6. HISEA-1 and Gaofen-3 mainly contribute large cargo-related categories, such as Bulk Carrier, Container Ship, Tanker, and Others Types Dry Cargo Ship, whereas Sentinel-1 mainly contributes samples from Engineering and Service Vessels, Tug, Fishing, Passenger, and Others. The SAR ship classification dataset is partitioned according to vessel identity and imaging context. When AIS identity is reliable, the split is performed jointly by vessel identity and imaging scene to prevent chips from the same MMSI from appearing in different subsets. For samples without reliable identity information, the split is instead performed by acquisition scene and date to reduce potential leakage caused by repeated background texture, imaging condition, or local contextual similarity.
Table 6.
Sample distribution of the constructed SAR ship classification dataset by SAR data source.
3.2.2. Benchmark Results of Mainstream Deep Classifiers
To evaluate whether the constructed AIS-associated SAR ship classification dataset provides effective category supervision, benchmark experiments are conducted using representative mainstream classifiers, including EfficientNet-B0, ResNet50, ConvNeXt-Tiny, Swin-Tiny, and YOLOv11-L classifier. Since the constructed nine-category SAR ship classification dataset is imbalanced, Overall Accuracy (OA), Macro Precision, Macro Recall, and Macro F1 are used for evaluation. Overall Accuracy measures the global classification correctness, whereas the macro-averaged metrics evaluate the average performance across all categories and reduce the dominance of majority classes in performance assessment. In particular, Macro Recall reflects the average recall over the nine vessel categories. The SAR ship chips were converted to three channel images and resized to 320 × 320 pixels. For EfficientNet-B0, ResNet50, ConvNeXt-Tiny, and Swin-Tiny, ImageNet pretrained weights were used, while the YOLOv11-L classifier used the official pretrained classification checkpoint. All deep models were trained for a maximum of 21 epochs using the AdamW optimizer with a batch size of 16. The learning rate was set to 1 × 10⁻⁴ for the backbone and 3 × 10⁻⁴ for the classification head, and the weight decay was set to 1 × 10⁻⁴. A cosine annealing learning rate scheduler was adopted. Early stopping was performed with a patience of 5 epochs according to Macro F1, because the dataset is imbalanced. Class-weighted cross entropy with label smoothing of 0.05 was used, and the class weights were computed from the class distribution of the training split. The random seed was fixed to 3407. During training, the same data augmentation strategy was applied to all deep models, including resizing, random horizontal flipping, random vertical flipping, and ImageNet normalization.
The benchmark results are summarized in Table 7. The results show clear performance differences among the compared architectures. EfficientNet-B0 and Swin-Tiny achieve Overall Accuracy values of 81.84% and 84.04%, respectively, indicating that the AIS-associated labels are learnable but that not all architectures adapt equally well to the current SAR ship chip distribution. ResNet50 and YOLOv11-L classifiers obtain substantially higher performance, with Overall Accuracy values of 95.39% and 95.00%, respectively. ConvNeXt-Tiny achieves the best performance among all compared models, with 97.63% Overall Accuracy, 97.26% Macro Precision, 97.95% Macro Recall, and 97.59% Macro F1. These results indicate that the constructed AIS-associated labels provide effective category supervision, while the final classification performance still depends on the representational capability of the selected model architecture.
Table 7.
Benchmark results of mainstream deep classifiers on the constructed AIS-associated SAR ship classification dataset.
To further examine source-related behavior, ConvNeXt-Tiny which achieves the best performance among the compared deep learning models was evaluated on source-stratified validation subsets from HISEA-1, Sentinel-1, and Gaofen-3 and subsequent experiments. The results are reported in Table 8. Since the three data sources contain different category subsets and sample sizes, this evaluation is used as a diagnostic analysis. For this reason, Macro F1 is computed over the observed categories in each source subset. The ConvNeXt-Tiny classifier maintains high performance on all three source-stratified subsets, with OA values of 97.43%, 96.61%, and 98.43% on HISEA-1, Sentinel-1, and Gaofen-3, respectively. The corresponding observed Macro F1 scores are 97.01%, 94.90%, and 98.30%. These results suggest that the learned SAR ship representations are not limited to a single SAR data source.
Table 8.
Source-stratified diagnostic evaluation of ConvNeXt-Tiny.
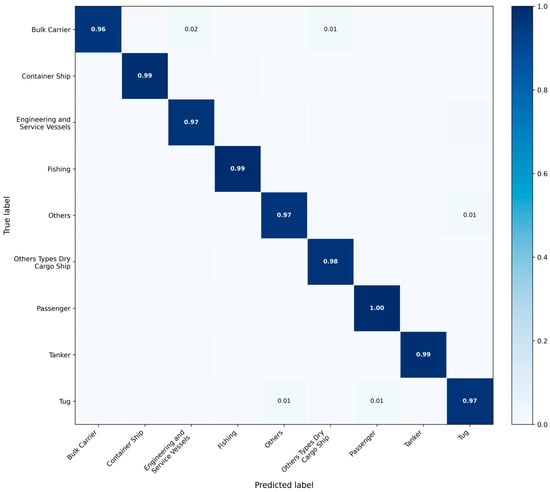
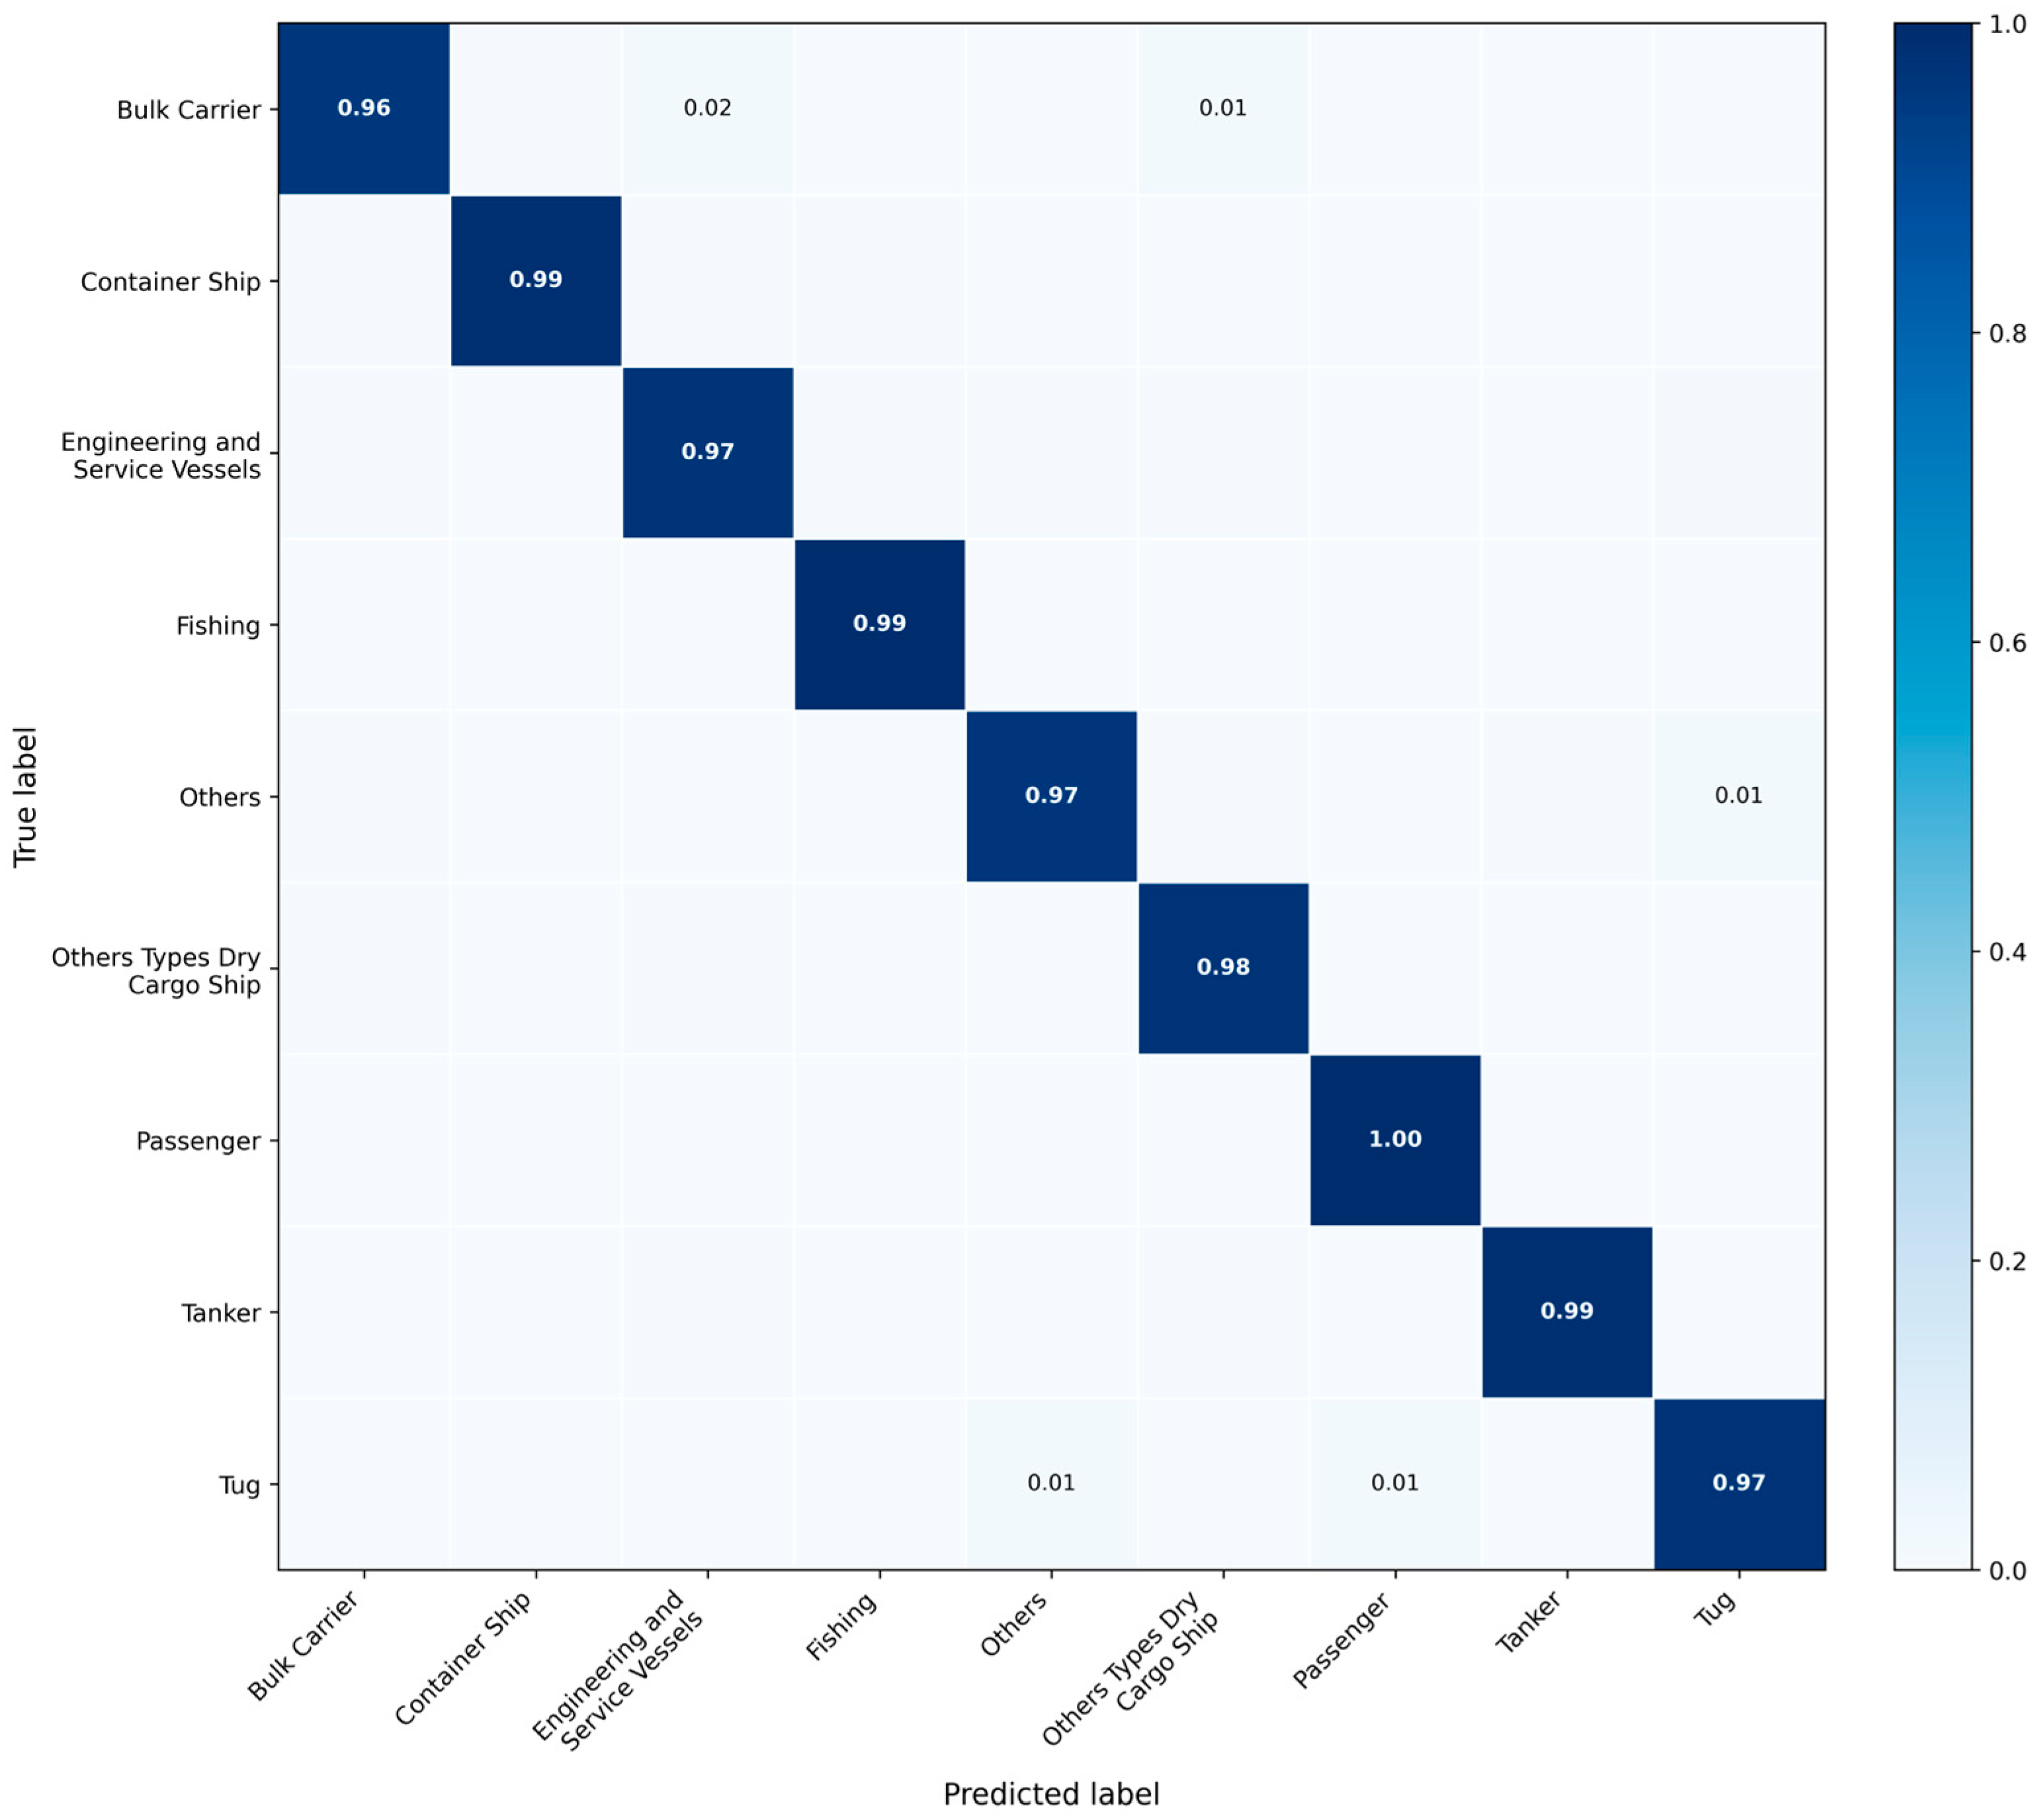
To further examine whether the classification performance is consistent across vessel categories, the row-normalized confusion matrix of ConvNeXt-Tiny is shown in Figure 9. The diagonal entries represent the recall of each category. The results show that most categories achieve high diagonal values, indicating that the benchmark performance is not dominated only by majority classes. In particular, minority categories such as Passenger, Tug, and Tanker also show strong class level performance, with normalized diagonal values of 1.00, 0.97, and 0.99, respectively. This suggests that the class-weighted loss and the AIS-associated category supervision help the classifier learn discriminative features for both frequent and less frequent categories. The remaining errors are mainly distributed among categories with relatively similar target extent or structural characteristics. A small proportion of Bulk Carrier is concentrated in Engineering and Service Vessels and Others Types Dry Cargo Ship. This confusion is physically reasonable. On the one hand, Bulk Carrier itself belongs to the broader dry cargo ship family, and therefore may share similar elongated hull structures, target extent, and scattering layouts with other dry cargo-related vessels. On the other hand, some Engineering and Service Vessels may also present relatively elongated bright target signatures in SAR imagery, especially when the spatial resolution is limited and the internal structural details are not fully distinguishable. As a result, the classifier may confuse these categories when the dominant SAR cues are mainly global shape and scattering distribution. For Tug, the main confusion is observed with Others and Passenger. Tug vessels are usually small- or medium-sized targets, and their SAR signatures are often dominated by compact bright scattering clusters. In practical scenes, some small passenger vessels or vessels grouped into Others may exhibit similar target extent, scattering intensity concentration, and geometric appearance. Overall, the confusion matrix indicates that the remaining errors mainly occur between categories with related vessel morphology or similar SAR scattering characteristics, rather than randomly across all classes. This suggests that the AIS-associated labels are sufficiently consistent to support meaningful fine-grained SAR ship classification, while the observed confusions are also consistent with the physical limitations of SAR-based category discrimination.
Figure 9.
Row-normalized confusion matrix of ConvNeXt-Tiny on the constructed nine-category SAR ship classification dataset.
3.3. Classification Results on Real SAR Scenes
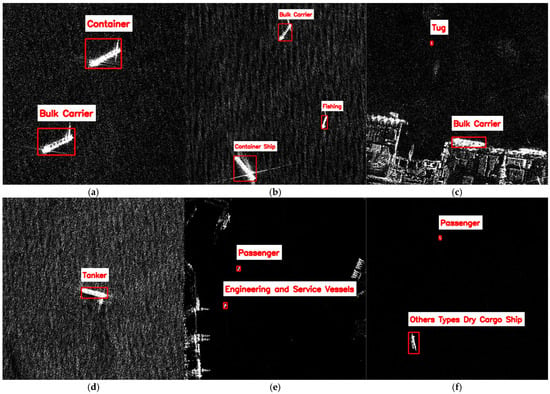
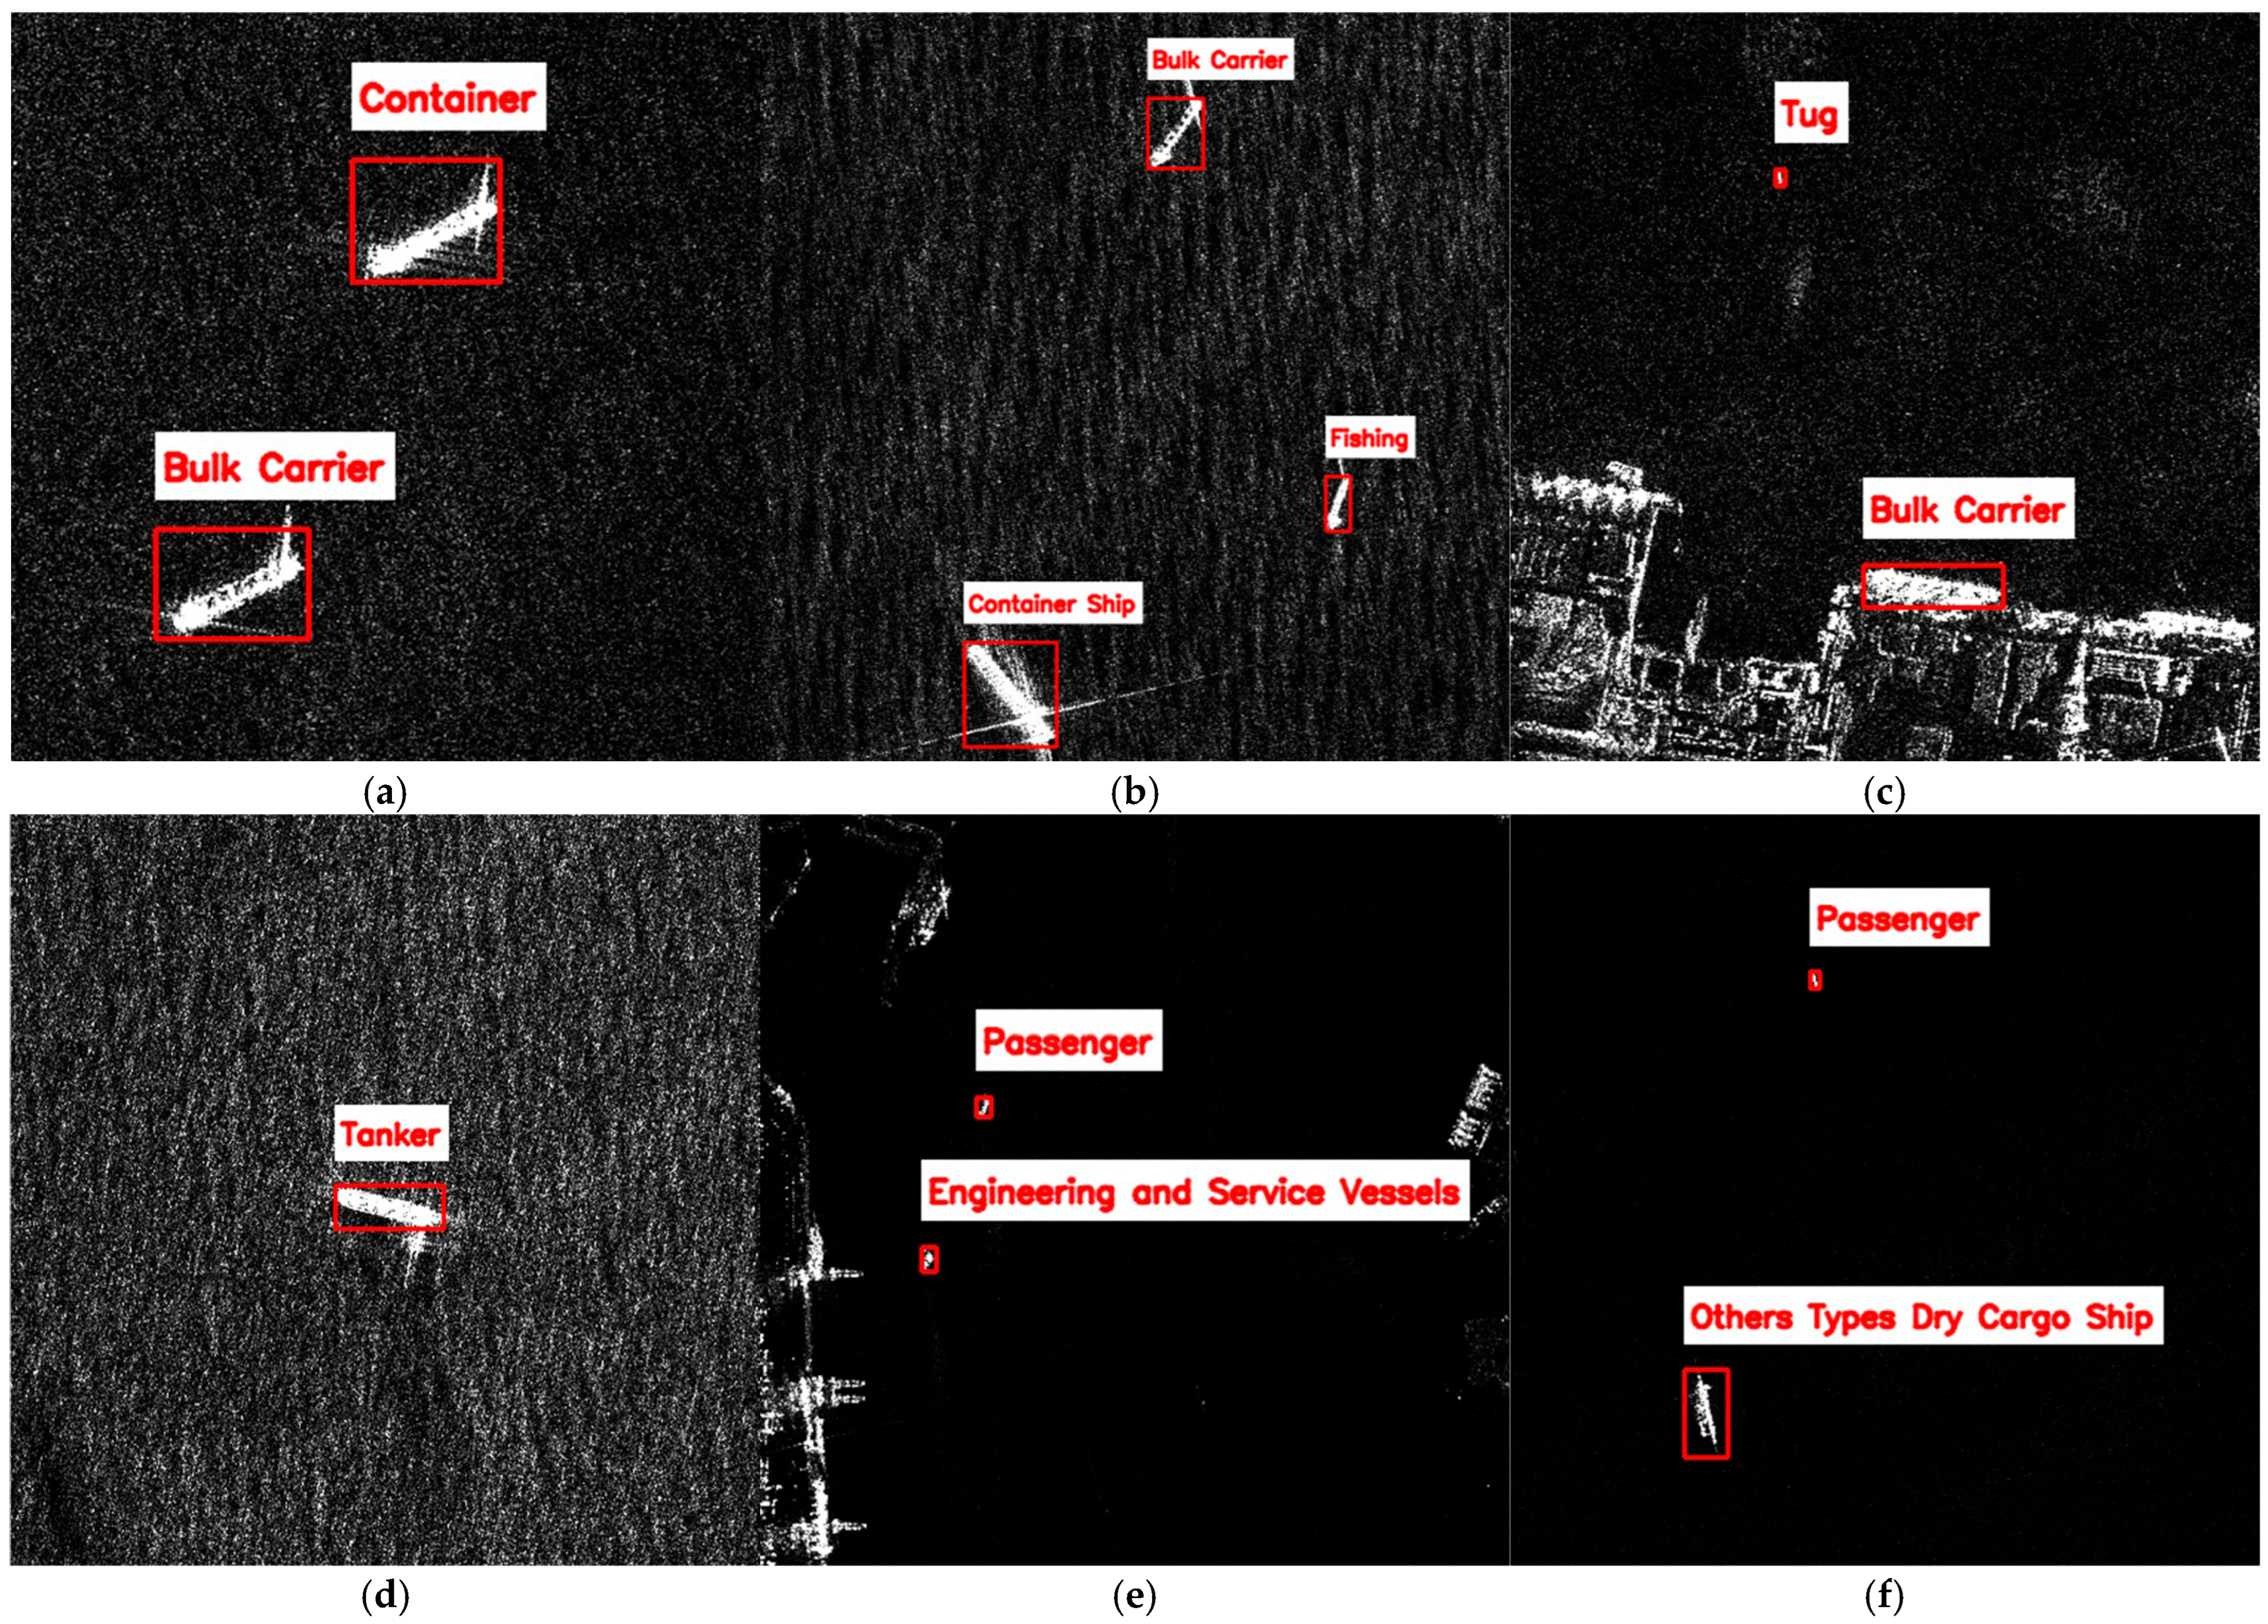
To further evaluate the applicability of the classifier trained on the constructed ship category dataset in real scenes, ConvNeXt-Tiny is used for qualitative ship classification on real SAR scenes. Figure 10 shows the visualization results on HISEA-1 SAR scenes acquired over Fujian coastal waters at different acquisition dates. All scenes are acquired in Stripmap Mode (SM) with 3 m spatial resolution and vertical transmit and vertical receive (VV) polarization. During inference, AIS information is not used. Ship targets are first detected from the SAR image, then cropped into SAR ship chips, and finally classified by the trained ConvNeXt-Tiny classifier. In Figure 10, the red bounding boxes indicate the detected ship targets, and the red text labels denote the predicted vessel categories. The results show that the classifier trained on the constructed dataset can achieve ship classification in real SAR images, indicating that the category supervision provided by AIS-associated labels during training can support SAR-only ship classification in practical scenes.
Figure 10.
Visualized SAR imagery only ship classification results on HISEA-1 (SM, 3 m, VV) scenes of Fujian coastal waters. Acquisition dates: (a) 16 February 2025; (b,c) 8 March 2025; (d) 23 April 2025; (e,f) 8 March 2025.
4. Discussion
4.1. Interpretation of AIS-Associated Label Generation
AIS preprocessing and data association are indispensable steps before ship information can be reliably used in SAR-based maritime surveillance. AIS information can benefit SAR ship classification, but only when the transfer from AIS to SAR is carefully controlled. As shown in Figure 5, AIS trajectory reconstruction provides temporally aligned and smoother vessel states for subsequent association. Figure 6 further illustrates a dense close vessel scenario, where a conventional nearest neighbor rule may produce locally greedy assignments and lead to incorrect matching when several AIS candidates are spatially close to the SAR detections. Together, Figure 7 and Figure 8 demonstrate that spatial proximity alone is not sufficient for reliable SAR and AIS association. Global assignment based only on position also provides limited benefit when nearby AIS candidates are present. By jointly considering position discrepancy, heading consistency, and vessel size compatibility, the proposed method can generate more reliable high-confidence SAR and AIS matched pairs. These results support the use of multi feature global optimal association and cost-based rejection for AIS-associated label generation before constructing the SAR ship classification dataset.
4.2. Implications for SAR Ship Classification Dataset Construction
The benchmark results in Table 7 indicate that the AIS-associated labels generated by the proposed pipeline are learnable by mainstream deep classifiers. ConvNeXt-Tiny obtains the best performance among the compared models. This is consistent with the motivation of ConvNeXt, which modernizes CNNs while preserving convolutional inductive biases and achieving competitive visual representation capability [41]. For SAR ship chips, such convolutional representation may be beneficial because vessel categories are often expressed through local scattering structures, target extent, and shape-related cues rather than through rich optical texture [42]. Nevertheless, this observation should be understood as a benchmark result on the current dataset, not as a universal conclusion that ConvNeXt-Tiny will always outperform other architectures across sensors, resolutions, or sea conditions. Compared with previous AIS-assisted SAR ship classification studies [43,44], the focus of this work is not only to use AIS information to improve classification performance, but also to establish a controlled label generation pathway for SAR-only classification.
To further place the classification results in the context of existing SAR ship classification studies, Table 9 summarizes several representative methods. It should be noted that these reported results are not strictly comparable with the results of this study because the datasets, sensors, spatial resolutions, category definitions, number of classes, and train test protocols are different. Therefore, Table 9 serves as a reference comparison for different methods, and mainly highlights the sensor source, classes, and main focus, rather than a direct accuracy ranking. Compared with these studies, the main difference in this work is the construction of a fine-grained nine-category SAR ship classification dataset through high-confidence SAR and AIS association. AIS is used only for category label generation, while the final classifier performs SAR-only inference.
Table 9.
Contextual comparison with representative SAR ship classification studies and datasets.
4.3. Practical Significance for SAR-Only Maritime Surveillance
The proposed method uses AIS as a supervision source during dataset construction and classifier training, while preserving SAR-only inference capability after the classifier has been trained. This design is meaningful for wide-area maritime surveillance, port and anchorage monitoring, and vessel type awareness in busy waterways. In practical maritime surveillance, AIS reports may be missing, delayed, intentionally disabled, or inconsistent with the observed SAR target. In such cases, a classifier that depends on AIS input during inference would have limited applicability. By contrast, the proposed method transfers AIS vessel type information into SAR ship chips only during label generation, and the trained classifier can subsequently predict vessel categories from SAR imagery alone. The real scene visualization results in Figure 10 further suggest that the trained classifier can assign vessel category labels to detected ships in practical SAR scenes without using AIS information during inference, which provides a complementary use of heterogeneous data. Therefore, the proposed strategy can support SAR-only vessel category recognition in scenarios where AIS is unavailable or unreliable, while still benefiting from multi-source information during dataset construction. This is consistent with the broader trend that maritime surveillance increasingly integrates satellite imagery, AIS, radar tracks, and other contextual information for more reliable maritime situation awareness [45].
4.4. Limitations and Future Work
4.4.1. AIS Type Reliability and Label Uncertainty
Although AIS vessel type information provides valuable category supervision for SAR ship classification, the present study does not independently verify the correctness of the AIS type field for every vessel, because complete vessel registry ground truth or manual verification is not available for all samples. Therefore, the main association reliability experiment assumes that AIS type information is correct once a high-confidence SAR and AIS association is established. This assumption should be regarded as a limitation of the current dataset construction process. If the accepted association precision is Passoc and the unknown AIS type error rate is Ptype, the expected category label precision can be approximated as Passoc (1 − Ptype). Future work will incorporate AIS integrity assessment, vessel registry verification, and uncertainty aware label screening when such independent information is available.
4.4.2. Category Imbalance and Dataset Expansion
The current dataset is constructed from SAR ship chips with high-confidence AIS-associated labels. However, the available AIS records and their corresponding SAR scenes are naturally imbalanced across vessel types. Some vessel categories appear frequently in the collected AIS data and SAR scenes, while others have only a limited number of valid associated samples. This imbalance may affect the classifier in two aspects. First, categories with fewer samples may not provide sufficient intra class diversity for robust feature learning. Second, the evaluation of minority categories may be less stable because their performance is more sensitive to individual samples. Although class-weighted loss and macro-averaged metrics are used to reduce the influence of class imbalance during training and evaluation, the imbalance of the underlying dataset remains a limitation. Future work will further expand the dataset by collecting more SAR and AIS paired samples for underrepresented categories, and will improve the dataset construction strategy toward a more balanced category distribution.
4.4.3. Computational and Real-Time Considerations
Combining algorithmic perspectives and actual computer running speed, the computational cost of the proposed pipeline is mainly distributed across SAR ship detection, AIS preprocessing and trajectory reconstruction, SAR and AIS association, and ship classification. AIS quality control and trajectory propagation are approximately linear with respect to the number of AIS records after temporal filtering. The construction of the association cost matrix has a complexity proportional to the number of SAR detections and AIS candidates. The Hungarian assignment has cubic complexity with respect to the reduced candidate set size. After the dataset has been constructed, the trained classifier no longer requires AIS input and can perform SAR-only ship classification. Its computational cost is proportional to the number of detected ship chips, and it is usually lower than full scene detection because the classifier processes only cropped target regions. The trained detector and classifier can potentially support onboard or edge-side SAR ship detection and classification after hardware adaptation.
In practical spaceborne SAR applications, real-time performance is constrained not only by algorithmic computation, but also by SAR acquisition scheduling, image formation, data downlink, ground processing, and the availability of temporally corresponding AIS records. Therefore, the complete SAR and AIS matching process in this study is currently more suitable for offline or near real-time processing after SAR imagery and AIS records are available. Nevertheless, if real-time SAR image formation and onboard AIS reception are jointly available, the proposed method, including SAR and AIS matching, SAR ship detection, and SAR ship classification, could potentially be implemented onboard with lightweight model design and hardware acceleration. The implementation and validation of truly onboard real-time processing are therefore regarded as an important direction for future work.
4.4.4. Extension to Multi Sensor Maritime Surveillance
This study focuses on SAR ship classification based on spaceborne SAR and AIS association, but the proposed association strategy may also provide useful reference for other maritime surveillance sensors. A representative example is high-frequency surface wave radar (HFSWR), which can provide long-range and more continuous sea surface monitoring. Recent high-resolution HFSWR studies have improved sea surface target detection by enhancing range Doppler processing, Doppler estimation, and azimuth estimation [46,47]. In addition, SAR, HFSWR, and AIS association have been investigated for vessel target detection and multi sensor fusion, showing that these sensors can complement each other in wide-area maritime surveillance [32,34]. Therefore, more comprehensive multi source association among SAR, AIS, HFSWR, and other maritime sensing systems may provide stronger support for ship detection, identity verification, trajectory interpretation, and non-cooperative target monitoring. Extending the proposed method to such multi sensor maritime surveillance scenarios is an important direction for future work.
5. Conclusions
This paper proposed a fine-grained nine-category SAR ship classification method based on AIS-associated label generation. The original AIS vessel types were reorganized into nine SAR interpretable ship categories by jointly considering vessel functional attributes, SAR visual separability, sample support, existing SAR ship classification practice, and maritime surveillance requirements. During dataset construction, AIS vessel type information was transferred to SAR detections through global optimal SAR and AIS association, and only high-confidence matched pairs were retained to construct an SAR ship classification dataset containing 4472 ship chips from HISEA-1, Sentinel-1, and Gaofen-3 images. Experimental results show that the proposed association strategy improves the reliability of AIS-associated label generation under dense traffic ambiguity and spatial perturbation, and that the constructed dataset provides learnable category supervision for mainstream deep classifiers. Real scene visualization further indicates that the trained classifier can assign vessel category labels using SAR imagery alone, without AIS input during inference.
Two open questions remain for future work. First, truly onboard or real-time implementation still requires joint support from real-time SAR image formation, onboard AIS reception, lightweight model design, and hardware acceleration. Second, extending the proposed association strategy to multi sensor maritime surveillance systems, such as SAR, AIS, and HFSWR fusion, remains an important future direction.
Author Contributions
Conceptualization, X.C., Y.Z. and X.G.; methodology, X.C., Y.Z. and X.G.; software, X.C.; validation, X.C., Y.Z., L.H. and H.Z.; formal analysis, X.C. and Y.Z.; investigation, X.C., Y.Z., L.H. and H.Z.; resources, Y.Z. and X.G.; data curation, X.C., Y.Z., L.H. and H.Z.; writing—original draft preparation, X.C.; writing—review and editing, X.C., Y.Z., L.H., H.Z., L.L. and X.G.; visualization, X.C., L.H. and H.Z.; supervision, L.L. and X.G.; project administration, X.G.; funding acquisition, Y.Z. and X.G. All authors have read and agreed to the published version of the manuscript.
Funding
This research was funded by National Natural Science Foundation of China under Grant 42192561; Digital Deep-sea Typical Habitats Programme of China Deep Ocean Affairdministration; the Major Science and Technology Project of Fujian Province under Grant 2024YZ040025 and Xiamen Natural Science Foundation Project under Grant 3502Z202573006.
Data Availability Statement
Researchers who need the dataset and model code of this study for academic research can contact the corresponding author (gengxp@xmu.edu.cn).
Acknowledgments
The authors would like to thank Fujian Satellite Data Development Co., Ltd. (Fuzhou, China) and Fujian Hisea Digital Technology Co., Ltd. (Sanming, China) for the cooperation in HISEA-1 project.
Conflicts of Interest
The authors declare no conflicts of interest.
Abbreviations
The following abbreviations are used in this manuscript:
| AIS | Automatic Identification System |
| CFAR | Constant False Alarm Rate |
| CNN | Convolutional Neural Network |
| GSHHS | Global Self-consistent Hierarchical High-resolution Shoreline |
| HFSWR | High-frequency surface wave radar |
| ITU-R | International Telecommunication Union Radiocommunication Sector |
| KF | Kalman Filter |
| MMSI | Maritime Mobile Service Identity |
| NMEA | National Marine Electronics Association |
| NN | Nearest Neighbor |
| OA | Overall Accuracy |
| SAR | Synthetic Aperture Radar |
| SM | Stripmap Mode |
| VV | Vertical Transmit and Vertical Receive Polarization |
| WGS84 | World Geodetic System 1984 |
| YOLO | You Only Look Once |
References
- El Darymli, K.; Gill, E.W.; Power, D.; Moloney, C.; Power, R.W. Target detection in synthetic aperture radar imagery: A state of the art survey. J. Appl. Remote Sens. 2013, 7, 071598. [Google Scholar] [CrossRef] [Scilit]
- Li, J.; Xu, C.; Su, H.; Gao, L.; Wang, T. Deep learning for SAR ship detection: Past, present and future. Remote Sens. 2022, 14, 2712. [Google Scholar] [CrossRef] [Scilit]
- Passah, A.; Sur, S.N.; Abraham, A. Synthetic aperture radar image analysis based on deep learning: A review of a decade of research. Eng. Appl. Artif. Intell. 2023, 123, 106305. [Google Scholar] [CrossRef] [Scilit]
- Chai, B.; Nie, X.; Zhou, Q.; Zhou, X. Enhanced Cascade R CNN for multiscale object detection in dense scenes from SAR images. IEEE Sens. J. 2024, 24, 20143–20153. [Google Scholar] [CrossRef] [Scilit]
- Cui, Z.; Li, Q.; Cao, Z.; Liu, N. Dense attention pyramid networks for multi scale ship detection in SAR images. IEEE Trans. Geosci. Remote Sens. 2019, 57, 8983–8997. [Google Scholar] [CrossRef] [Scilit]
- Zhang, Y.; Dong, C.; Guo, L.; Meng, X.; Liu, Y.; Wei, Q. AFMSFFNet: An anchor free based feature fusion model for ship detection. Remote Sens. 2024, 16, 3465. [Google Scholar] [CrossRef] [Scilit]
- Shi, Y.; Liu, Q.; Jia, H.; Wang, H. Densely arranged ship detection in SAR images based on cluster detection. In Proceedings of the IEEE International Geoscience and Remote Sensing Symposium, Athens, Greece, 7–12 July 2024; pp. 7689–7692. [Google Scholar]
- Li, H.; Wang, D.; Hu, J.; Zhi, X.; Yang, D. FANT-Det: Flow-aligned nested transformer for SAR small ship detection. Remote Sens. 2025, 17, 3416. [Google Scholar] [CrossRef] [Scilit]
- Fu, J.; Sun, X.; Wang, Z.; Fu, K. An anchor free method based on feature balancing and refinement network for multiscale ship detection in SAR images. IEEE Trans. Geosci. Remote Sens. 2021, 59, 1331–1344. [Google Scholar] [CrossRef] [Scilit]
- Hu, B.; Miao, H. A lightweight SAR ship detection network based on deep multiscale grouped convolution, network pruning, and knowledge distillation. IEEE J. Sel. Top. Appl. Earth Obs. Remote Sens. 2025, 18, 2190–2207. [Google Scholar] [CrossRef] [Scilit]
- Sun, Y.; Liu, C.; He, Z.; Zhang, Z. A lightweight deep learning framework with reduced computational overhead for ship detection in satellite SAR imagery. J. Mar. Sci. Eng. 2025, 13, 2234. [Google Scholar] [CrossRef] [Scilit]
- Lang, P.; Fu, X.; Dong, J.; Yang, H.; Yin, J.; Yang, J.; Martorella, M. Recent advances in deep learning based SAR image target detection and recognition. IEEE J. Sel. Top. Appl. Earth Obs. Remote Sens. 2025, 18, 6884–6915. [Google Scholar] [CrossRef] [Scilit]
- Qiao, S.; Zhang, Q.; Wang, Z. A review of deep learning based SAR image ship interpretation technology: The latest advances. IEEE J. Sel. Top. Appl. Earth Obs. Remote Sens. 2025, 18, 26152–26185. [Google Scholar] [CrossRef] [Scilit]
- Margarit, G.; Mallorqui, J.J.; Fortuny Guasch, J.; Lopez Martinez, C. Exploitation of ship scattering in polarimetric SAR for an improved classification under high clutter conditions. IEEE Trans. Geosci. Remote Sens. 2009, 47, 1224–1235. [Google Scholar] [CrossRef] [Scilit]
- Lang, H.; Zhang, J.; Zhang, X.; Meng, J. Ship classification in SAR image by joint feature and classifier selection. IEEE Geosci. Remote Sens. Lett. 2016, 13, 212–216. [Google Scholar] [CrossRef] [Scilit]
- Lang, H.; Wu, S. Ship classification in moderate resolution SAR image by naive geometric features combined multiple kernel learning. IEEE Geosci. Remote Sens. Lett. 2017, 14, 1765–1769. [Google Scholar] [CrossRef] [Scilit]
- Jiang, M.; Yang, X.; Dong, Z.; Fang, S.; Meng, J. Ship classification based on superstructure scattering features in SAR images. IEEE Geosci. Remote Sens. Lett. 2016, 13, 616–620. [Google Scholar] [CrossRef] [Scilit]
- Xing, X.; Ji, K.; Zou, H.; Chen, W.; Sun, J. Ship classification in TerraSAR X images with feature space based sparse representation. IEEE Geosci. Remote Sens. Lett. 2013, 10, 1562–1566. [Google Scholar] [CrossRef] [Scilit]
- Wang, Y.; Wang, C.; Zhang, H. Ship classification in high resolution SAR images using deep learning of small datasets. Sensors 2018, 18, 2929. [Google Scholar] [CrossRef] [Scilit] [PubMed]
- Lu, C.; Li, W. Ship classification in high resolution SAR images via transfer learning with small training dataset. Sensors 2019, 19, 63. [Google Scholar] [CrossRef] [Scilit] [PubMed]
- Xu, Y.; Lang, H. Ship classification in SAR images with geometric transfer metric learning. IEEE Trans. Geosci. Remote Sens. 2021, 59, 6799–6813. [Google Scholar] [CrossRef] [Scilit]
- Zhang, T.; Zhang, X. Squeeze and excitation Laplacian pyramid network with dual polarization feature fusion for ship classification in SAR images. IEEE Geosci. Remote Sens. Lett. 2022, 19, 4019905. [Google Scholar] [CrossRef] [Scilit]
- He, J.; Chang, W.; Wang, F.; Liu, Y.; Wang, Y.; Liu, H.; Li, Y.; Liu, L. Group bilinear CNNs for dual polarized SAR ship classification. IEEE Geosci. Remote Sens. Lett. 2022, 19, 4015805. [Google Scholar] [CrossRef] [Scilit]
- Zhang, T.; Zhang, X.; Ke, X.; Liu, C.; Xu, X.; Zhan, X.; Wang, C.; Ahmad, I.; Zhou, Y.; Pan, D. HOG ShipCLSNet: A novel deep learning network with HOG feature fusion for SAR ship classification. IEEE Trans. Geosci. Remote Sens. 2022, 60, 5210322. [Google Scholar] [CrossRef] [Scilit]
- Zeng, L.; Zhu, Q.; Lu, D.; Zhang, T.; Wang, H.; Yin, J.; Yang, J. Dual polarized SAR ship grained classification based on CNN with hybrid channel feature loss. IEEE Geosci. Remote Sens. Lett. 2022, 19, 4011905. [Google Scholar] [CrossRef] [Scilit]
- Yan, Z.; Song, X.; Yang, L. Research on AIS data aided ship classification in spaceborne SAR images. In Proceedings of the 2022 11th International Conference on Computer and Pattern Recognition, Beijing, China, 17–19 November 2022; pp. 179–185. [Google Scholar] [CrossRef] [Scilit]
- Huang, L.; Liu, B.; Li, B.; Guo, W.; Yu, W.; Zhang, Z.; Yu, W. OpenSARShip: A dataset dedicated to Sentinel 1 ship interpretation. IEEE J. Sel. Top. Appl. Earth Obs. Remote Sens. 2018, 11, 195–208. [Google Scholar] [CrossRef] [Scilit]
- Hou, X.; Ao, W.; Song, Q.; Lai, J.; Wang, H.; Xu, F. FUSAR-Ship: Building a high-resolution SAR-AIS matchup dataset of Gaofen-3 for ship detection and recognition. Sci. China Inf. Sci. 2020, 63, 140303. [Google Scholar] [CrossRef] [Scilit]
- Lang, H.; Wu, S.; Xu, Y. Ship classification in SAR images improved by AIS knowledge transfer. IEEE Geosci. Remote Sens. Lett. 2018, 15, 439–443. [Google Scholar] [CrossRef] [Scilit]
- Li, F.; Yu, K.; Yuan, C.; Tian, Y.; Yang, G.; Yin, K.; Li, Y. Dark ship detection via optical and SAR collaboration: An improved multi feature association method between remote sensing images and AIS data. Remote Sens. 2025, 17, 2201. [Google Scholar] [CrossRef] [Scilit]
- Mazzarella, F.; Vespe, M.; Santamaria, C. SAR ship detection and self reporting data fusion based on traffic knowledge. IEEE Geosci. Remote Sens. Lett. 2015, 12, 1685–1689. [Google Scholar] [CrossRef] [Scilit]
- Ji, Y.; Zhang, J.; Meng, J.; Wang, Y. Point association analysis of vessel target detection with SAR, HFSWR and AIS. Acta Oceanol. Sin. 2014, 33, 73–81. [Google Scholar] [CrossRef] [Scilit]
- Zhao, Z.; Ji, K.; Xing, X.; Zou, H.; Zhou, S. Ship surveillance by integration of space borne SAR and AIS: Further research. J. Navig. 2014, 67, 295–309. [Google Scholar] [CrossRef] [Scilit]
- Zhang, H.; Liu, Y.; Ji, Y.; Wang, L.; Zhang, J. Multi-feature maximum likelihood association with space-borne SAR, HFSWR and AIS. J. Navig. 2017, 70, 359–378. [Google Scholar] [CrossRef] [Scilit]
- Fang, N.; Cui, J. An improved Dempster Shafer evidence theory with symmetric compression and application in ship probability. Symmetry 2024, 16, 900. [Google Scholar] [CrossRef] [Scilit]
- Yu, J.Y.; Sghaier, M.O.; Grabowiecka, Z. Deep learning approaches for AIS data association in the context of maritime domain awareness. In Proceedings of the OCEANS 2020 MTS/IEEE Singapore, Singapore, 5–30 October 2020; pp. 1–6. [Google Scholar]
- Yang, Y.; Yang, F.; Sun, L.; Xiang, T.; Lv, P. Multi-target association algorithm of AIS-radar tracks using graph matching-based deep neural network. Ocean Eng. 2022, 266, 112208. [Google Scholar] [CrossRef] [Scilit]
- Qu, J.; Liu, R.W.; Guo, Y.; Lu, Y.; Su, J.; Li, P. Improving maritime traffic surveillance in inland waterways using the robust fusion of AIS and visual data. Ocean Eng. 2023, 275, 114198. [Google Scholar] [CrossRef] [Scilit]
- Chen, Z.; Gao, G.; Yao, L.; Zhang, X.; Liu, Y.; Yao, B.; Li, C. GTAN: A dual geometric transformer based optimal association network for SAR and AIS. IEEE J. Sel. Top. Appl. Earth Obs. Remote Sens. 2026, 19, 3001–3019. [Google Scholar] [CrossRef] [Scilit]
- International Telecommunication Union. Recommendation ITU R M.1371 6: Technical Characteristics for VHF Automatic Identification System Using Time Division Multiple Access in the Maritime Mobile Service; ITU: Geneva, Switzerland, 2026. [Google Scholar]
- Liu, Z.; Mao, H.; Wu, C.Y.; Feichtenhofer, C.; Darrell, T.; Xie, S. A ConvNet for the 2020s. In Proceedings of the 2022 IEEE/CVF Conference on Computer Vision and Pattern Recognition, New Orleans, LA, USA, 18–24 June 2022; pp. 11966–11976. [Google Scholar] [CrossRef] [Scilit]
- Zhu, J.W.; Qiu, X.L.; Pan, Z.X.; Zhang, Y.T.; Lei, B. An improved shape contexts based ship classification in SAR images. Remote Sens. 2017, 9, 145. [Google Scholar] [CrossRef] [Scilit]
- Rodger, M.; Guida, R. Classification-Aided SAR and AIS Data Fusion for Space-Based Maritime Surveillance. Remote Sens. 2021, 13, 104. [Google Scholar] [CrossRef] [Scilit]
- Yan, Z.; Song, X.; Yang, L.; Wang, Y. Ship Classification in Synthetic Aperture Radar Images Based on Multiple Classifiers Ensemble Learning and Automatic Identification System Data Transfer Learning. Remote Sens. 2022, 14, 5288. [Google Scholar] [CrossRef] [Scilit]
- Riveiro, M.; Pallotta, G.; Vespe, M. Maritime Anomaly Detection: A Review. WIREs Data Min. Knowl. Discov. 2018, 8, e1266. [Google Scholar] [CrossRef] [Scilit]
- Golubović, D.; Erić, M.; Vukmirović, N. High-Resolution Doppler and Azimuth Estimation and Target Detection in HFSWR: Experimental Study. Sensors 2022, 22, 3558. [Google Scholar] [CrossRef] [Scilit] [PubMed]
- Golubović, D.; Erić, M.; Vukmirović, N.; Orlić, V. High-Resolution Sea Surface Target Detection Using Bi-Frequency High-Frequency Surface Wave Radar. Remote Sens. 2024, 16, 3476. [Google Scholar] [CrossRef] [Scilit]



Disclaimer/Publisher’s Note: The statements, opinions and data contained in all publications are solely those of the individual author(s) and contributor(s) and not of MDPI and/or the editor(s). MDPI and/or the editor(s) disclaim responsibility for any injury to people or property resulting from any ideas, methods, instructions or products referred to in the content. |
© 2026 by the authors. Licensee MDPI, Basel, Switzerland. This article is an open access article distributed under the terms and conditions of the Creative Commons Attribution (CC BY) license.