1. Introduction
As climate change intensifies alongside rapid urbanization, the environmental impacts of human activities are increasingly manifested through the coupled dynamics of urban thermal conditions and energy consumption, posing growing challenges for achieving carbon neutrality [
1,
2]. Cities, as the primary loci of human activities, are major sources of global energy consumption and greenhouse gas emissions [
3,
4], and are also highly vulnerable to climate change. With the rapid expansion of built-up areas and increasing population density, the surface energy balance in urban environments has been fundamentally altered, leading to an intensification of the urban heat island (UHI) effect and a persistent deterioration of urban thermal conditions. Such elevated thermal environments not only threaten ecological security and public health [
5], but also reshape urban energy demand and consumption patterns. By increasing cooling demand and modifying local microclimatic conditions, UHI effects exert a significant influence on carbon emissions [
6]. In rapidly urbanizing regions, this challenge also reflects the growing interdependence between climate adaptation and carbon mitigation, with direct implications for sustainable urban development and climate governance.
Existing studies have extensively investigated the driving factors of carbon emissions from multiple perspectives. Rapid urbanization, land-use change, and socioeconomic development are widely recognized as key contributors to rising emissions. Empirical evidence suggests that the expansion of built-up land significantly increases carbon emissions at the urban scale [
7,
8], while urban morphological characteristics—such as development intensity and spatial compactness—along with socioeconomic factors including population density and GDP, play decisive roles in shaping emission patterns [
9,
10]. At a broader scale, technological progress and capital investment contribute to substantial regional heterogeneity in carbon intensity [
11,
12]. In parallel, a growing body of research has examined the spatiotemporal dynamics of urban thermal environments. Studies have documented a persistent intensification of the urban heat island effect across major Chinese urban agglomerations alongside urban expansion [
13,
14]. This trend is largely attributed to anthropogenic land surface modifications and increased energy consumption, which alter surface energy balance and enhance heat accumulation [
15]. Together, these studies provide a solid basis for understanding the environmental consequences of urbanization from both carbon emission and thermal environment perspectives.
Increasing attention has been directed toward the coupling relationship between urban thermal environments and carbon emissions, facilitated by advances in multi-source remote sensing data and spatial analytical techniques [
16]. Empirical studies consistently report a positive association between urban heat island intensity and carbon emissions. For example, Du et al. [
17] found in the Yangtze River Delta that higher surface temperatures were closely associated with increased energy consumption and urban expansion. Subsequent research has further confirmed a strong relationship between land surface temperature (LST) and carbon emissions using machine learning and spatial analytical approaches [
18]. This line of work has gradually conceptualized the heat–carbon relationship as a coupled system, in which high-emission areas tend to coincide with elevated surface temperatures and pronounced spatial clustering [
19]. At the scale of urban agglomerations, this coupling relationship has been shown to intensify along the urban–rural gradient, reflecting the co-evolution of anthropogenic activities and thermal environments [
20]. Beyond spatial co-occurrence, evidence from household electricity records and urban-scale behavioral data further suggests that heat stress can reshape cooling-related energy use and the temporal organization of socioeconomic activities [
21,
22]. These findings indicate that the heat–carbon nexus involves not only physical warming, but also adaptive behavioral responses and associated changes in energy use.
However, a comprehensive understanding of this relationship remains constrained by two limitations. First, many studies still treat the heat–carbon linkage primarily as a direct environmental association, while the behavioral pathway connecting heat exposure, energy use, and carbon emissions remains insufficiently represented in spatial econometric models. In reality, UHI effects do not directly generate carbon emissions; rather, their carbon-related consequences may be partly embedded in adaptive adjustments within human socioeconomic systems. Excessive urban heat can increase building cooling demand and produce an “energy penalty” effect [
23,
24]. Under high-temperature conditions, elevated cooling loads further stimulate electricity consumption and fossil-fuel-based emissions [
25,
26,
27,
28], while the increasing frequency of extreme heat events reinforces reliance on mechanical cooling technologies [
29,
30]. Although these behavior-based responses have been documented in energy and urban climate studies, energy-related human activity is seldom treated as an explicit mediating pathway in gridded spatial models of carbon emissions. Second, most existing studies do not sufficiently account for the spatial interdependence of urban agglomerations. Regional interactions are structured through complex networks of industrial linkages, transportation systems, and shared energy infrastructure [
31,
32], within which factors such as energy investment [
33], green finance [
34], transportation [
35], and technological innovation [
36] can generate significant spatial spillover effects. This is particularly evident in highly integrated regions such as the Yangtze River Delta [
37,
38]. At the same time, urban thermal environments themselves exhibit cross-boundary characteristics through atmospheric circulation and thermal convection processes [
39]. Evidence from major Chinese urban agglomerations indicates that intercity interactions can amplify urban warming under heatwave conditions [
40]. While transportation development and polycentric urban structure can reshape regional carbon emissions through intercity spillovers [
41,
42]. Ignoring such spatial dependence may therefore lead to biased estimations and an incomplete understanding of the heat–carbon relationship [
43,
44]. Therefore, behavioral adaptation, spatial interaction, and carbon outcomes need to be examined within a unified analytical framework rather than as separate research streams.
To address these limitations, this study focuses on the Yangtze River Delta urban agglomeration and develops an integrated analytical framework linking urban thermal environments, anthropogenic energy activity, and carbon emissions. Nighttime light remote sensing and multi-source geospatial integration provide a feasible way to approximate human activity intensity, electricity use, and anthropogenic heat at fine spatial scales [
45,
46,
47,
48]. However, these proxies have rarely been embedded into a spatial mediation framework that simultaneously links urban heat, energy-related activity, carbon emissions, and spatial dependence. Clarifying these linkages is scientifically important because urban climate adaptation and carbon mitigation are increasingly intertwined in highly urbanized regions, with direct implications for carbon neutrality, regional climate governance, and the urban sustainability goals embedded in the UN SDGs.
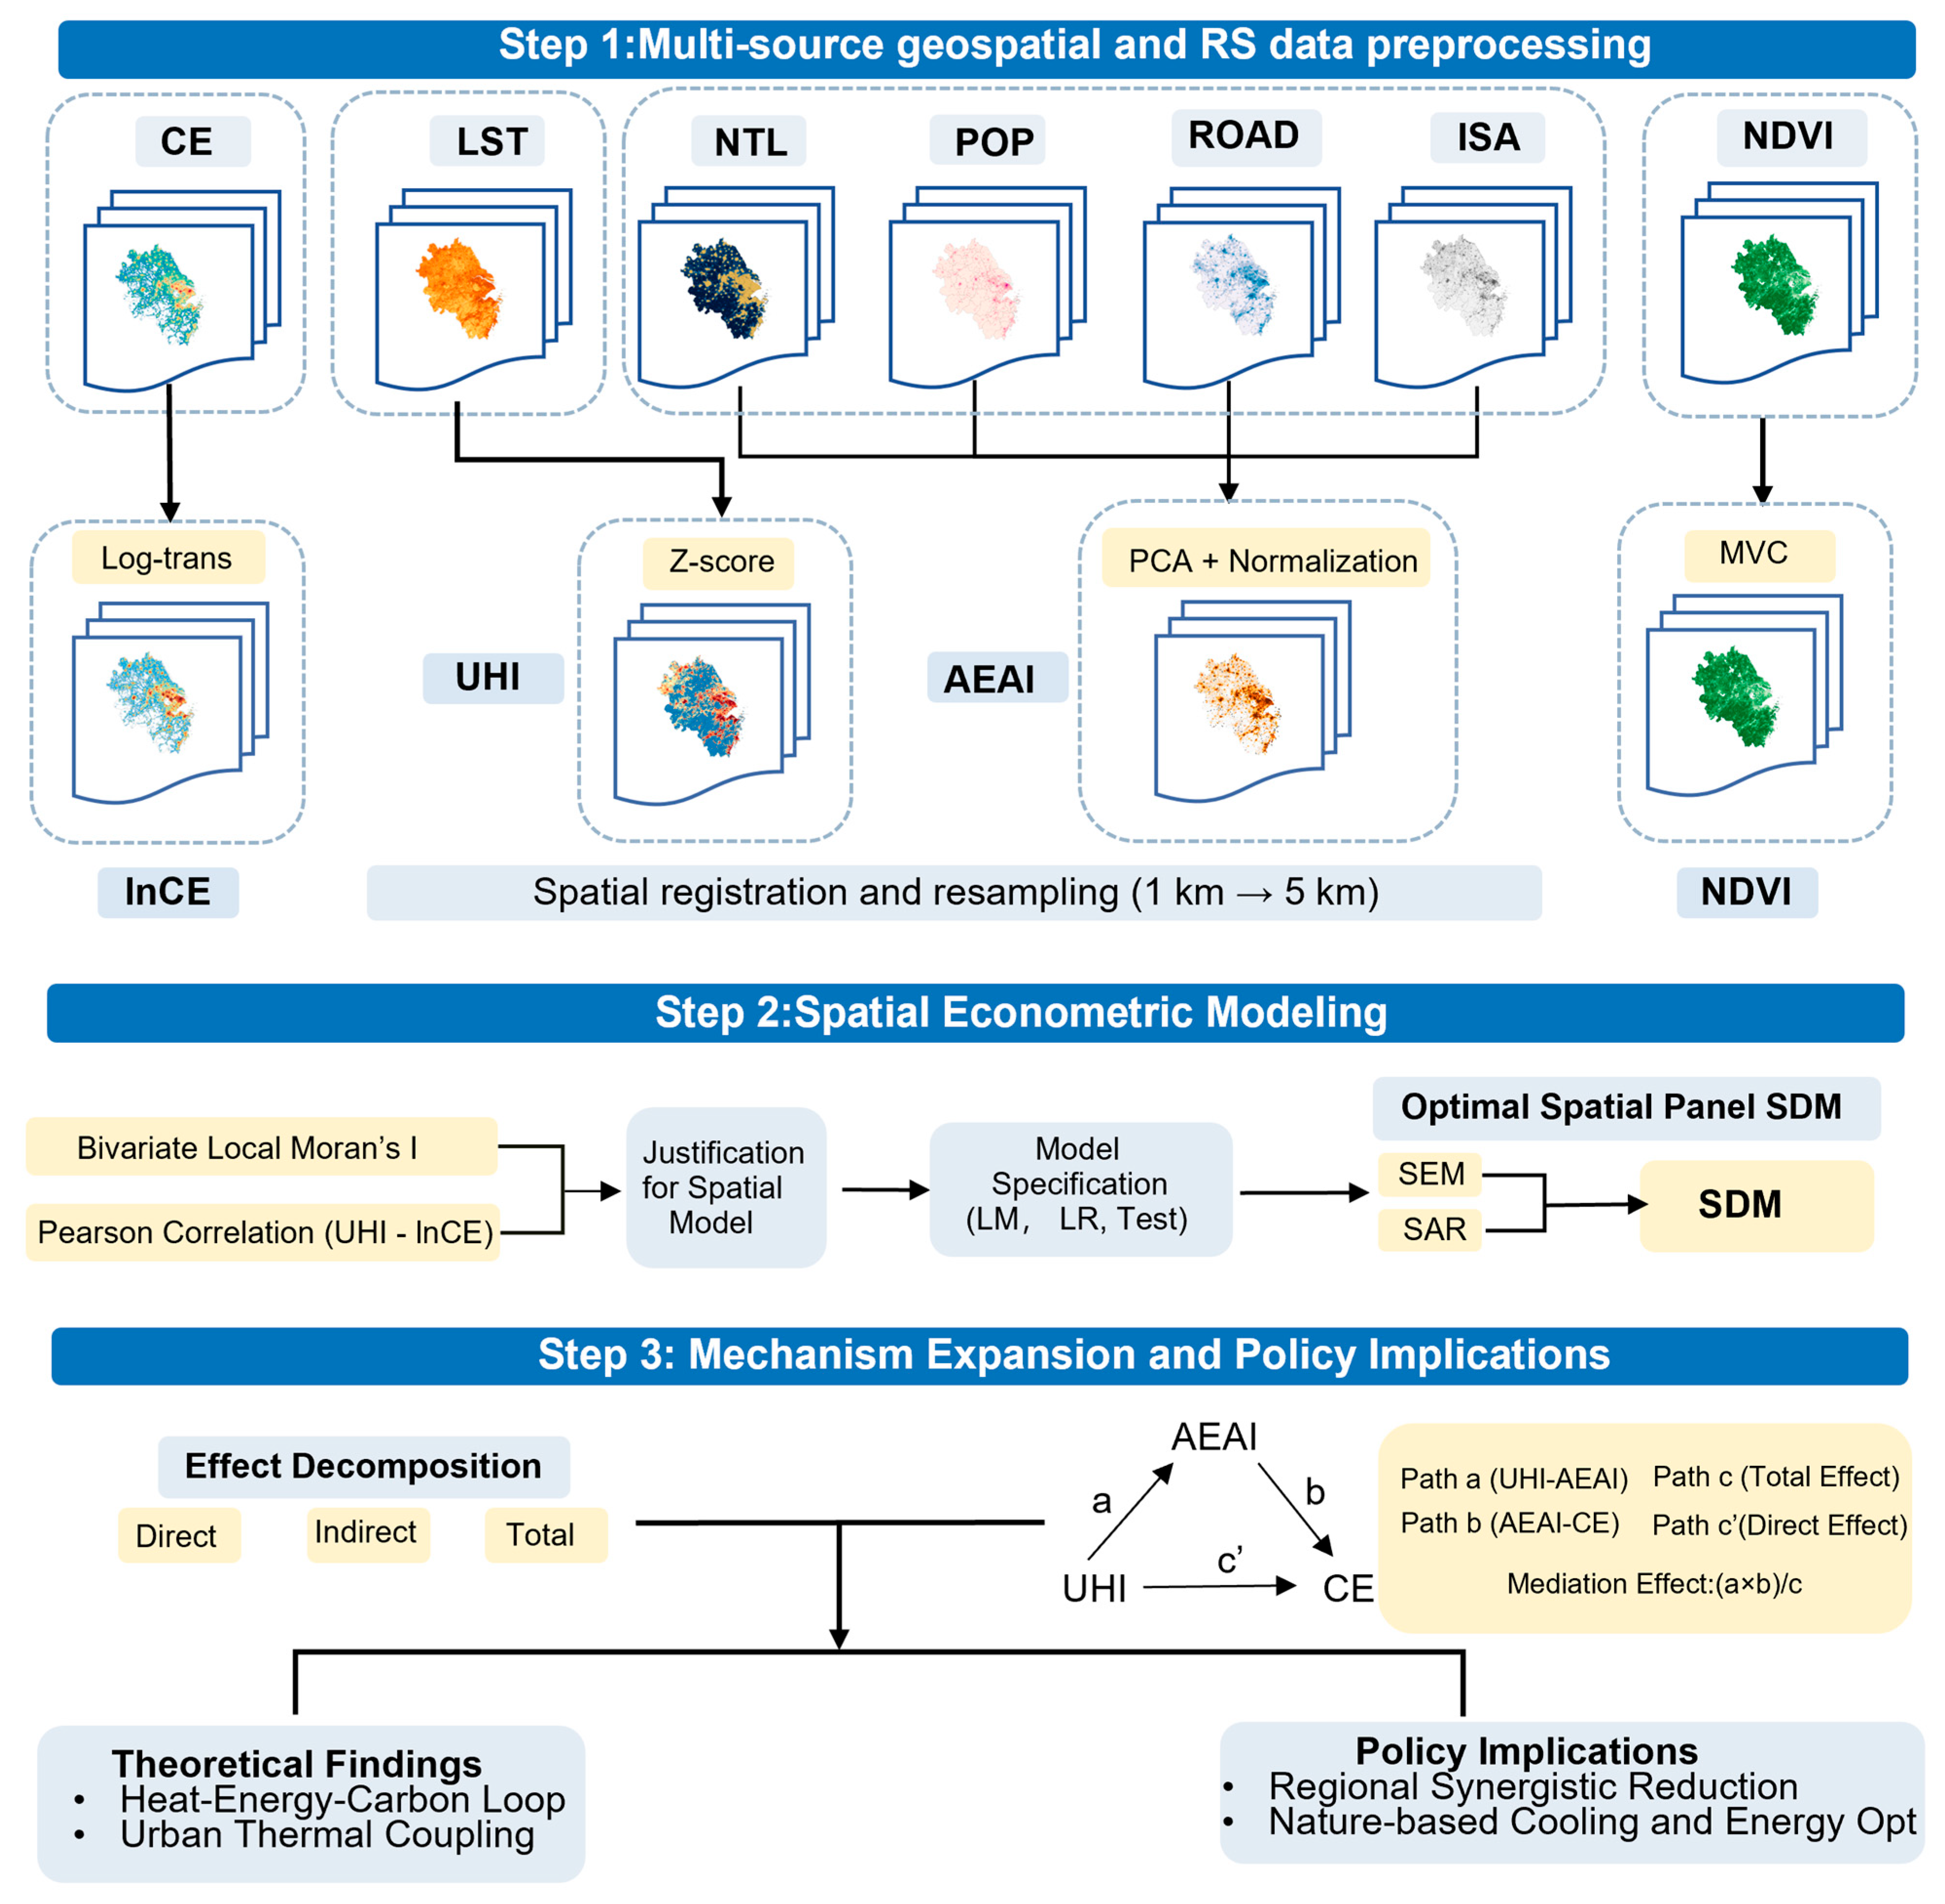
Accordingly, this study pursues one primary objective and two secondary objectives. The primary objective is to clarify whether and how urban heat islands are statistically associated with carbon emissions across the Yangtze River Delta. The secondary objectives are to test whether anthropogenic energy activity represents a statistical mediation pathway in this relationship and to assess whether the association extends beyond local boundaries through spatial dependence and spillover processes. The overall research design and analytical workflow are summarized in
Figure 1. To achieve these objectives, this study makes three main contributions. First, it constructs a standardized and scalable indicator of Anthropogenic Energy Activity Intensity (AEAI) based on multi-source datasets, providing a proxy for energy-related human activities at the grid scale. Second, it employs a multi-scale spatial econometric framework to distinguish local associations and cross-regional spillovers in the UHI–carbon emission relationship. Third, by integrating a spatial mediation approach with the Spatial Durbin Model (SDM), it identifies a statistically mediated pathway linking thermal environments, energy-related human activity, and carbon emissions. These contributions help clarify the coupled “physical–behavioral–carbon” processes within urban agglomerations and provide evidence for regional climate governance, carbon mitigation, and climate-adaptive urban planning.
2. Materials and Methods
2.1. Study Area
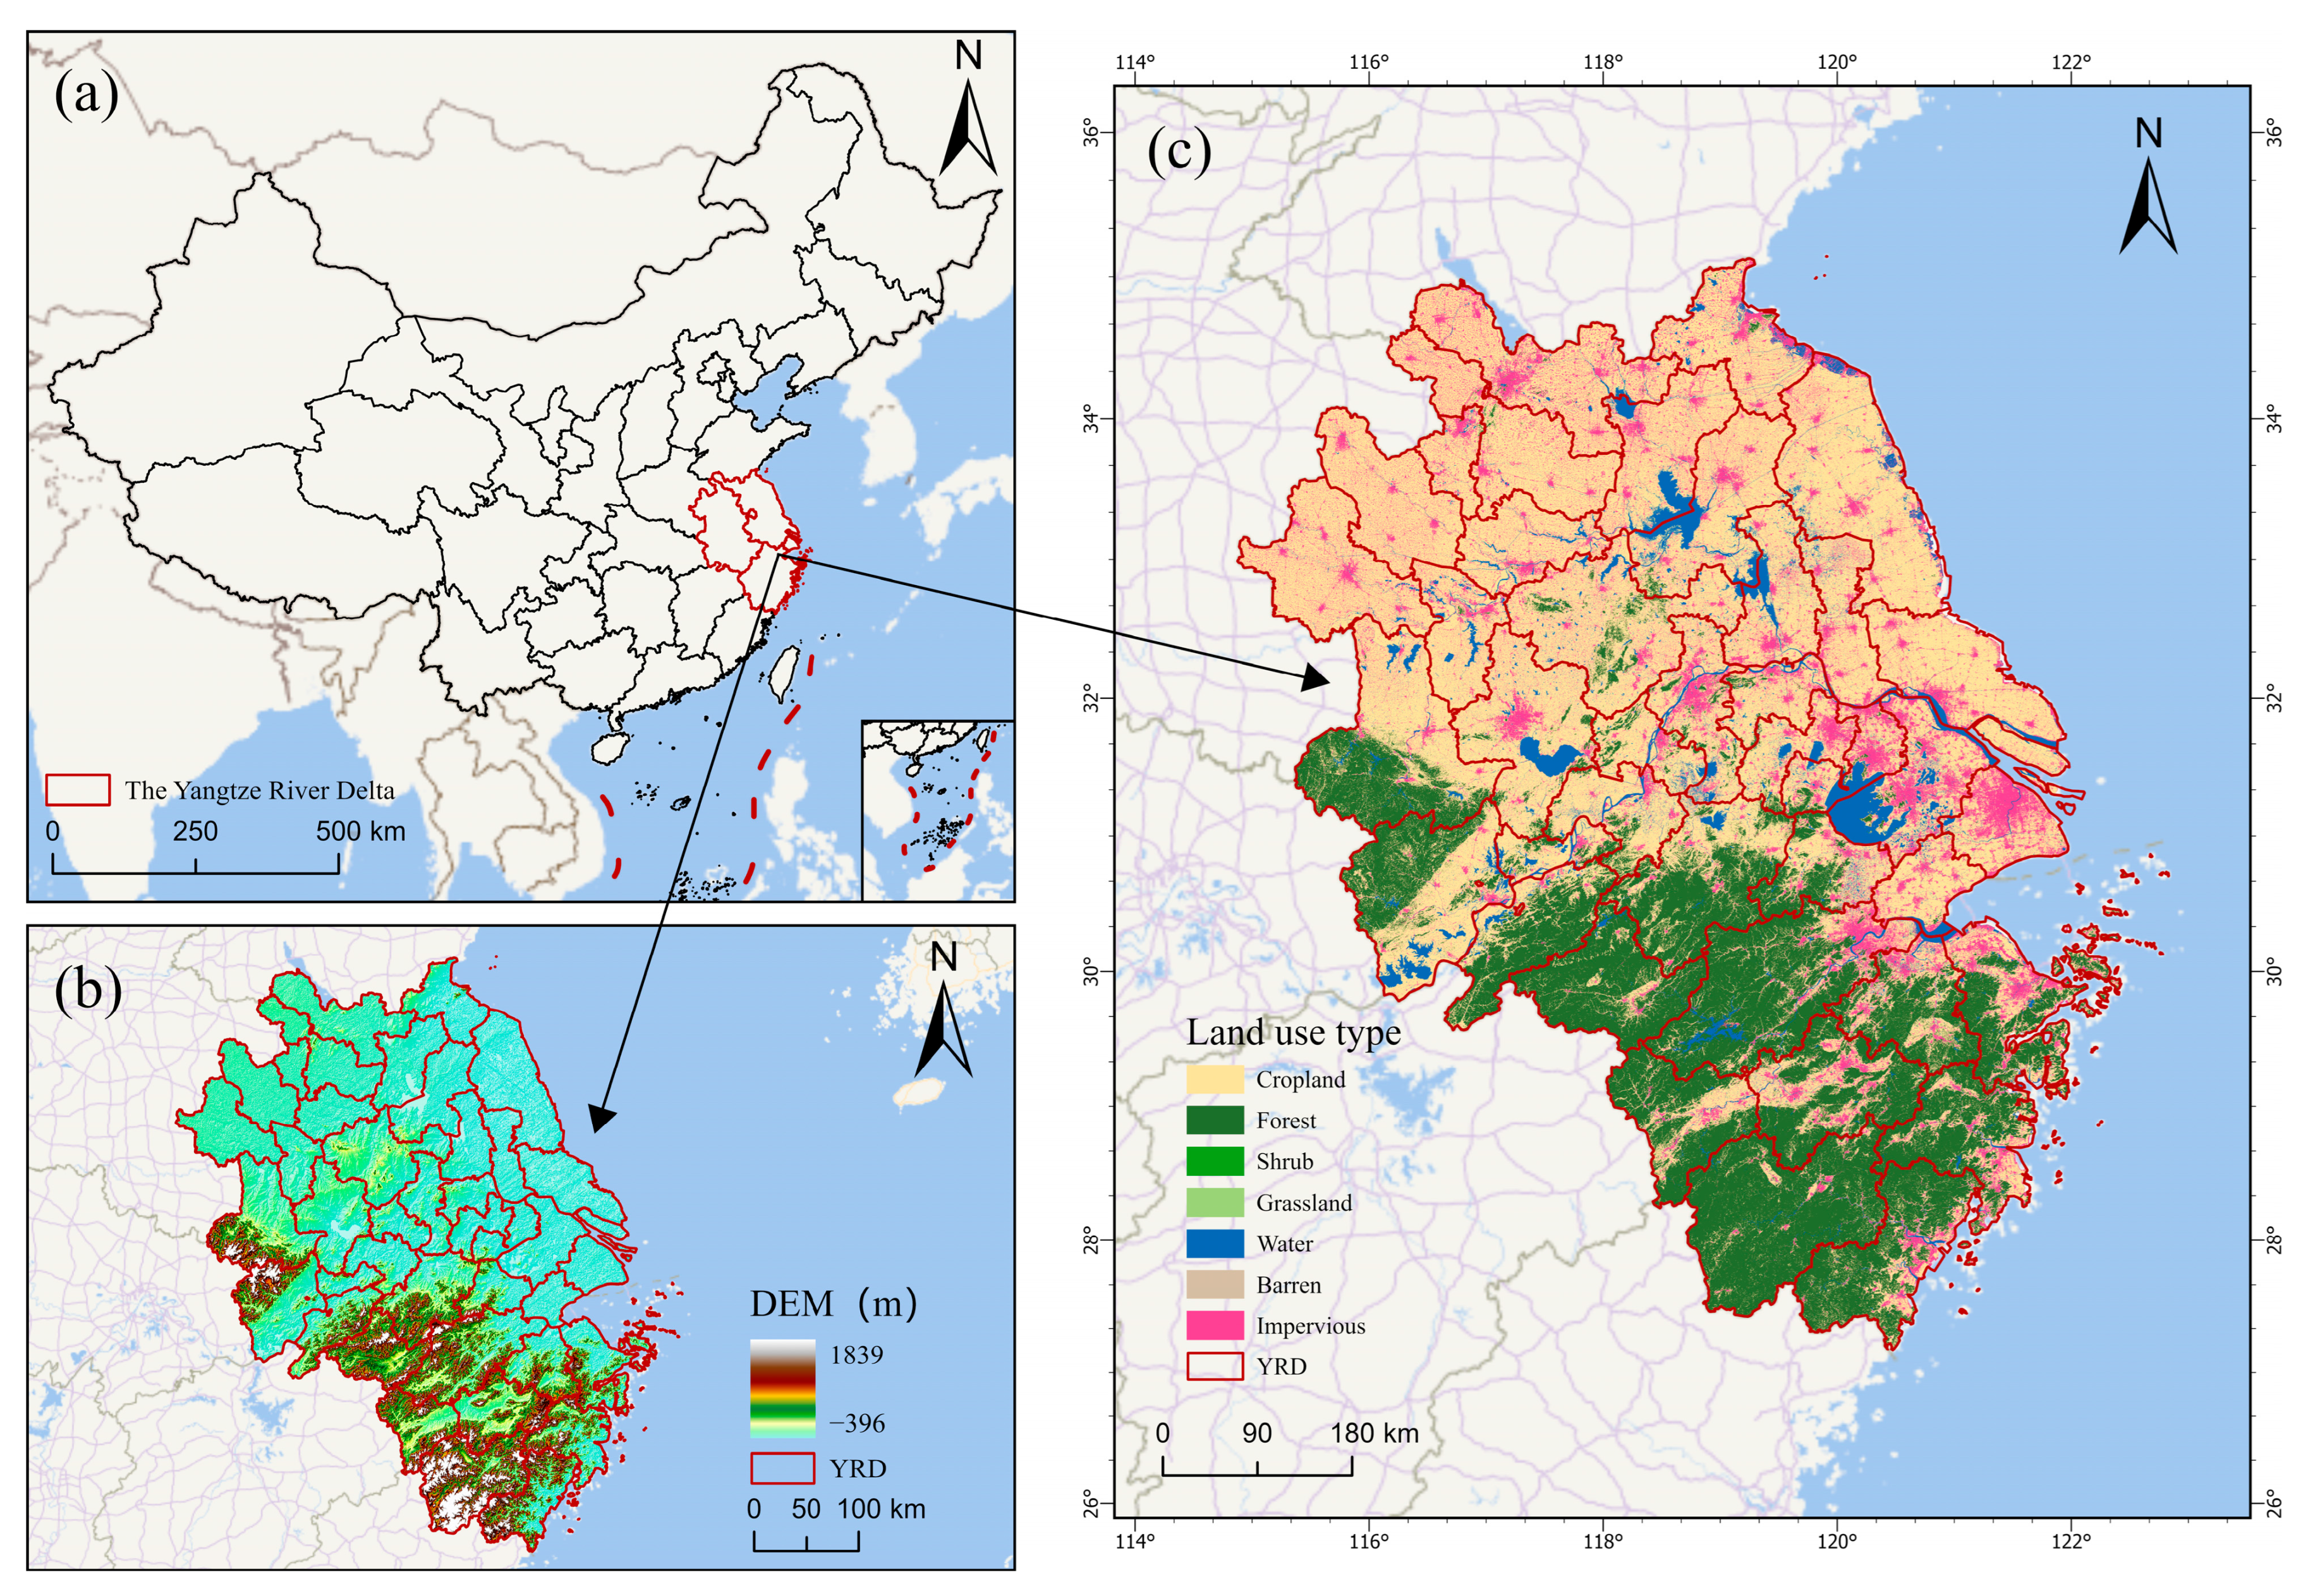
The YRD urban agglomeration, located in China’s eastern coastal region and the alluvial plain of the lower Yangtze River (
Figure 2a), spans approximately 358,000 km
2 across Shanghai, Jiangsu, Zhejiang, and Anhui provinces. Influenced by a subtropical monsoon climate, the region exhibits pronounced spatial heterogeneity, with natural landscapes transitioning from plains in the north to low hills and foothills in the south. As one of China’s most economically dynamic and highly urbanized regions, the YRD is characterized by intense concentrations of human activities. The urbanized belts centered on Shanghai stand in stark contrast to the surrounding areas in terms of land use. This typical context of rapid urbanization has intensified the synergistic evolution of regional urban heat islands and carbon emissions. The YRD is selected as the study area not only due to its complex topography, climate, and land-use patterns but also because, as a national strategic core region, it provides an ideal empirical setting to systematically investigate the cross-scale coupling mechanisms of the “thermal–energy–carbon” nexus under high-intensity urbanization.
2.2. Data Sources and Preprocessing
To ensure data consistency and comparability, this study integrates multi-source geospatial datasets for the Yangtze River Delta urban agglomeration across three representative years (2014, 2019, and 2023). Core remote sensing data were processed using the Google Earth Engine (GEE) platform, enabling efficient and reproducible large-scale analysis [
49,
50,
51]. Considering the fine-scale spatial heterogeneity of carbon emissions, urban heat islands, and anthropogenic energy activities, a 1 km grid was adopted as the fundamental analytical unit, consistent with the native resolution of the ODIAC and MODIS datasets.
Carbon emissions data were obtained from the high-resolution (1 km) ODIAC global dataset, which spatially disaggregates fossil fuel CO2 emissions using night-time light observations and energy statistics. During data integration, all high-resolution datasets were aggregated to the 1 km grid to ensure spatial consistency while preserving physical interpretability.
Urban thermal environment metrics were derived from the MOD11A1 V6.1 daily land surface temperature (LST) product via the Google Earth Engine platform, following standard procedures for temporal filtering and spatial aggregation [
52]. To reduce cloud contamination and ensure data reliability, the observation period was restricted from 1 July to 15 September, and median compositing was applied. Specifically, all valid daytime LST observations within this period were used to generate a pixel-wise median composite, and invalid or masked observations caused by cloud contamination or retrieval failure were not included in the median calculation. Urban heat island intensity was then normalized using Z-score standardization:
Here,
and
represent the mean and standard deviation of land surface temperature within the study area, respectively. This standardization effectively removes interannual background temperature fluctuations, enhancing the comparability of urban heat island intensity across different years.
Vegetation cover was characterized using the MOD13A2 V6.1 16-day NDVI product. To reduce cloud contamination, the observation period was extended from 1 June to 30 September, and the Maximum Value Composite (MVC) method was applied [
53,
54]. Pixels with NDVI ≤ 0 were excluded to remove water bodies and background noise. For continuous variables such as LST and NDVI, statistical compositing methods (e.g., median and maximum value composites) were applied to reduce the influence of outliers and cloud-induced noise.
Impervious surface data were derived from the China Land Cover Dataset (CLCD), and the proportion of impervious surfaces was calculated at the 1 km grid level [
55]. Nighttime light data were obtained from the final released improved DMSP-OLS-like dataset for China (1992–2024) [
56], rather than by directly merging raw DMSP-OLS and SNPP-VIIRS products. This dataset was developed by calibrating DMSP-OLS data using a pseudo-invariant-pixel-based quadratic model, patching missing pixels in monthly SNPP-VIIRS data using an exponential smoothing model, and converting SNPP-VIIRS observations into simulated DMSP-OLS data using a sigmoid model to ensure temporal consistency [
56]. Population data were sourced from the LandScan dataset, while road network data from OpenStreetMap were converted into continuous density indicators using line-density analysis. All datasets were reprojected to the Albers equal-area conic coordinate system and resampled to a uniform 1 km × 1 km grid. This ensures spatial consistency across heterogeneous data sources while balancing the retention of fine-scale spatial information with the statistical stability required for spatial econometric analysis. Although the datasets used in this study have been widely applied in regional environmental and socioeconomic analyses, their uncertainties should be acknowledged. ODIAC carbon emissions are derived from fossil-fuel emission inventories and spatially disaggregated using nighttime light and point-source information; therefore, pixel-level estimates may contain uncertainty associated with spatial allocation. In this study, ODIAC was mainly used to characterize relative spatial patterns and spatial associations rather than to provide an independent bottom-up estimate of absolute local emissions. For MODIS LST, missing values and retrieval uncertainty caused by cloud contamination and invalid observations were reduced through the 1 July–15 September summer window and pixel-wise median compositing based on valid, unmasked observations in Google Earth Engine. LandScan population data, as a modeled gridded population product, may also contain local allocation uncertainty, but it provides a consistent population distribution proxy for regional-scale analysis. Detailed information is provided in
Table 1.
2.3. Construction of Anthropogenic Energy Activity Intensity
Energy consumption processes within urban systems are inherently multidimensional and complex, making it difficult for a single indicator to fully capture their spatial heterogeneity. To address this, a composite Anthropogenic Energy Activity Intensity (AEAI) index was developed by integrating four key dimensions: energy consumption, built environment intensity, population activity, and transportation accessibility. Specifically, night-time lights (NTL) were used as a proxy for macroeconomic activity and energy consumption; the proportion of impervious surfaces (ISA) captured the intensity of energy-consuming built environments (aggregated from 30 m CLCD data to 1 km grids); population density (POP) reflected the concentration of human activities; and road density (ROAD), derived from line-density analysis of OpenStreetMap data, represented transportation-related energy demand. All indicators were standardized prior to aggregation.
To assess potential multicollinearity, we conducted a variance inflation factor (VIF) test for the candidate explanatory variables and AEAI component variables. As shown in
Table 2, the maximum VIF value is 3.113 for ROAD, and the mean VIF is 2.670. All VIF values are below the commonly used threshold of 5, indicating that severe multicollinearity is not present among the selected variables.
To ensure objective weighting and reduce dimensional redundancy, Principal Component Analysis (PCA) was applied to the standardized variables. The results show that the first principal component (PC1) consistently captures the majority of the shared variance across all study years (approximately 60%), indicating a stable and robust representation of anthropogenic energy activity intensity. The loadings suggest that transportation infrastructure and economic activity proxies (ROAD and NTL) contribute most strongly to the composite index, while population density and built-up intensity also provide consistent positive contributions. Based on these results, the AEAI index was constructed using PC1 scores at the 1 km grid scale and employed as a key explanatory variable in subsequent spatial econometric analyses. It should be noted that NTL is also involved in the spatial disaggregation of the ODIAC carbon emission dataset. However, in ODIAC, NTL mainly serves as a spatial allocation proxy for distributing fossil-fuel CO
2 emissions that are constrained by energy statistics, whereas in this study it is only one component of the PCA-based AEAI index, together with impervious surface area, population density, and road density. Therefore, AEAI should be interpreted as a multidimensional proxy for anthropogenic energy activity intensity rather than a direct measurement of energy consumption. For this reason, NTL, ISA, POP, and ROAD were not reintroduced as separate control variables in the spatial econometric models, as doing so could lead to conceptual overlap and multicollinearity with the AEAI index. To further evaluate the reliability of AEAI, we conducted an auxiliary external validation using an independently developed global 1 km × 1 km gridded electricity consumption product [
57]. This dataset provides gridded electricity consumption estimates for 1992–2019; therefore, the validation was limited to 2014 and 2019, while 2023 could not be included due to data availability constraints. Although this product is also partly derived from calibrated nighttime light data, it is constrained by electricity consumption statistics and was developed independently from the AEAI construction framework. Therefore, it was used here as an auxiliary spatial-consistency validation rather than as direct ground-truth measurement. Since AEAI is a normalized composite index ranging from 0 to 1, the validation focused on spatial consistency rather than direct unit-to-unit equivalence. Electricity consumption values were extracted at the corresponding AEAI grid cells, and Pearson and Spearman correlation coefficients were calculated between AEAI and log-transformed electricity consumption. As shown in
Table 3, AEAI shows strong and significant positive correlations with ln(Electricity + 1) in both years. The Pearson correlation coefficients were 0.739 and 0.796 in 2014 and 2019, respectively, while the Spearman correlation coefficients were 0.816 and 0.846. These results indicate that AEAI is broadly consistent with the spatial distribution of the electricity consumption product, providing auxiliary support for its use as a proxy for anthropogenic energy activity intensity.
2.4. Spatial Autocorrelation Analysis
To assess whether urban heat island (UHI) intensity and carbon emissions (CE) exhibit significant spatial clustering across the Yangtze River Delta, we first applied the Global Moran’s I statistic. Global Moran’s I is a widely used measure of spatial autocorrelation that evaluates whether the spatial distribution of a variable is random, clustered, or dispersed. Its calculation is formalized as:
where
denotes the total number of spatial units (grid cells) within the study area.
and
represent the observed attribute values for the
-th and
-th spatial units, respectively, while
denotes the mean value of the attribute.
represents the elements of the spatial weights matrix, which defines the spatial adjacency relationship between units
and
.
Given the high-resolution gridded nature of our data, the spatial weight matrix was constructed using the k-nearest neighbors algorithm, followed by row-standardization to ensure comparability across units.
While the global Moran’s I captures the overall spatial dependence of a variable, it cannot reveal local heterogeneity or the spatial interaction between two different attributes. To address this limitation, we further employed the bivariate local Moran’s I to investigate the spatial cluster types between urban heat island intensity (UHI) and carbon emissions (CE) at the grid-cell level. This approach allows identification of high–high, low–low, high-low, and low-high, highlighting local spatial spillovers in the “heat–carbon” system. The bivariate local Moran’s I is calculated as follows:
where
denotes the bivariate local spatial autocorrelation index for the
-th grid cell.
represents the row-standardized spatial weight matrix, which defines the spatial relationship between units
and
.
denotes the standardized value of urban heat island intensity (UHI) for spatial unit
, while
represents the standardized value of log-transformed carbon emissions (lnCE) for the neighboring spatial unit
.
2.5. Spatial Econometric Models
The spatial weights matrix (W) forms the foundation of spatial econometric analysis by quantifying the adjacency relationships among geographic units. Given the irregular spatial distribution of our high-resolution 1 km × 1 km gridded data, the grids were resampled to 5 km × 5 km resolution to reduce computational burden while preserving essential spatial heterogeneity, a knn algorithm was employed to ensure each unit captures sufficient neighborhood information. The original 1 km dataset contains more than 300,000 grid cells in each study year, resulting in nearly one million grid-year observations across the three representative years. Estimating a full spatial panel SDM at this native resolution would require an extremely large spatial weights matrix and would substantially increase computational burden and numerical instability. Therefore, the 1 km grid was retained for exploratory spatial analysis to preserve fine-scale spatial patterns, while the 5 km grid was adopted as the baseline econometric scale to balance spatial detail, statistical stability, and computational feasibility. Specifically, based on the geographic coordinates of the 2014 baseline grid cells, a row-standardized KNN-8 spatial weight matrix was constructed as the baseline specification. Because the econometric units are gridded centroids rather than administrative polygons, KNN-based matrices are more suitable than rook or queen contiguity matrices for maintaining a comparable number of neighboring units across clipped and irregular boundary grids. The KNN-8 setting represents a local eight-neighbor structure while balancing neighborhood information and computational feasibility. To examine whether the results are sensitive to the spatial weight specification, alternative matrices, including a broader KNN-12 matrix and an inverse-distance-weighted KNN-8 matrix, were further tested. A purely global inverse-distance matrix was not adopted because it would generate a dense matrix for more than 10,000 gridded units and introduce numerous weak long-distance links, which is less consistent with the local spillover assumption of this study. Building upon this spatial weight matrix, we constructed a spatial Durbin model (SDM) to comprehensively capture the direct effects of urban heat island intensity (UHI) and anthropogenic energy activity intensity (AEAI) on carbon emissions (lnCE), as well as their cross-regional spatial spillover effects. The SDM framework is particularly advantageous as it incorporates spatial lags of both dependent and independent variables, thereby effectively mitigating estimation bias arising from omitted spatial interaction terms. The baseline time-fixed effects SDM is specified as follows:
where
denotes the spatial grid unit and
represents the year.
refers to the log-transformed carbon emissions for spatial unit
in year
.
denotes the element of the KNN-8 spatial weight matrix, which defines the spatial interaction between units
and
.
is the spatial autoregressive coefficient, reflecting the influence of neighboring carbon emissions on local emissions.
represents the elasticity coefficient of the explanatory variables, while
denotes the coefficient of the spatially lagged explanatory variables, capturing the spatial spillover effects of these variables.
denotes year fixed effects, which control for common temporal shocks across the study years, and
is the random error term.
Given the large cross-sectional and short-panel structure of the dataset (N = 10,726, T = 3), several fixed-effects specifications were examined during the model-testing stage. We first attempted to estimate individual grid-cell fixed-effects and two-way fixed-effects SDM specifications. However, these models did not converge reliably and produced numerical instability, including near-singular estimation problems, under the current gridded spatial panel structure. This is mainly because each year contains more than 10,000 spatial units after aggregation to the 5 km grid, and the SDM further introduces both the spatially lagged dependent variable and spatially lagged explanatory variables. As a result, incorporating a large number of grid-cell fixed effects substantially increases the dimensionality of the estimation problem and leads to unstable parameter estimation.
Therefore, the time-fixed effects SDM was adopted as the baseline specification. This specification controls for common temporal shocks across the study years, such as regional economic cycles, background climate variability, and policy-period effects, while maintaining model convergence and numerical stability. Although individual fixed effects would be desirable for controlling time-invariant unobserved heterogeneity at the grid-cell level, the time-fixed effects specification provides a more stable and reproducible modeling strategy under the current large-N, small-T spatial panel setting. Accordingly, the estimated relationships should be interpreted as spatial associations under a time-fixed SDM framework rather than as strict causal effects.
Furthermore, because the SDM includes spatially lagged terms, the estimated coefficients (
) do not represent direct marginal effects. Following LeSage and Pace [
58], total effects were decomposed into direct effects—which measure the local impact including feedback loops—and indirect effects—which capture spatial spillovers from neighboring units. Statistical significance was assessed via Monte Carlo simulations.
2.6. Spatial Mediation Model
Given the significant spatial dependence and spillover effects between urban heat island intensity (UHI) and carbon emissions (lnCE), conventional ordinary least squares (OLS) or non-spatial panel models may produce biased estimates due to the neglect of spatial autocorrelation. To address this, a spatial mediation modeling framework was developed by integrating the Spatial Durbin Model (SDM) with the stepwise regression approach of Baron and Kenny [
59], enabling the examination of the statistical mediated pathway from “urban heat island → anthropogenic energy activity → carbon emissions.” Given the observational nature of the dataset and the use of three representative years, the estimated relationships should be interpreted as spatial associations and statistically mediated pathways rather than strict causal effects. The combination of the SDM and the stepwise mediation framework was adopted for two reasons. First, the SDM explicitly accounts for spatial dependence by incorporating both the spatially lagged dependent variable and spatially lagged explanatory variables, thereby reducing bias caused by omitted spatial interactions. Second, the stepwise mediation framework provides a transparent way to examine whether the statistical association between UHI and carbon emissions is partly transmitted through AEAI. In this study, all three mediation equations were estimated within the same spatial panel SDM framework, ensuring that the total association, the UHI–AEAI pathway, and the direct association after controlling for AEAI were assessed under a consistent spatial dependence structure. Therefore, this framework was used to identify statistically mediated pathways rather than strict causal mediation effects.
First: Testing the total statistical association between UHI and carbon emissions (Model M1).
A spatial panel model was specified with carbon emissions as the dependent variable and urban heat island intensity as the core explanatory variable to evaluate the total statistical association. The model is formulated as follows:
Second: Testing the association between UHI and AEAI (Model M2).
The Anthropogenic Energy Activity Intensity (AEAI) was specified as the dependent variable to examine whether urban heat island intensity is statistically associated with AEAI. The model is formulated as follows:
Third: Testing the association between AEAI and carbon emissions after controlling for UHI (Model M3).
Finally, both AEAI and UHI were included in the regression equation to assess the statistical association between UHI and carbon emissions after accounting for the AEAI pathway. The model is specified as follows:
where
and
denote the spatial unit (grid cell) and year, respectively.
represents the spatial weight matrix, which in this study is constructed using a K-nearest neighbors (KNN) approach with k = 8.
is the spatial autoregressive coefficient, reflecting the spatial spillover effect of the dependent variable.
denotes the control variables (e.g., NDVI).
denotes year fixed effects, which are included in all three spatial mediation equations to ensure consistency with the baseline time-fixed effects SDM specification. and
is the random error term. Identification and decomposition of the statistical mediation pathway: Following the mediation testing procedure proposed by [
60,
61,
62], the statistical mediation pathway was evaluated as follows. If the coefficient in Equation (5) is statistically significant, a total statistical association between UHI and carbon emissions is considered to exist. If the coefficient in Equation (6) and the coefficient of AEAI in Equation (7) are both statistically significant, the AEAI-related mediated pathway is supported. Under these conditions, if the coefficient of UHI in Equation (7) remains significant but is smaller in magnitude than that in Equation (5), a partial statistical mediation pathway is identified.
In this case, the statistically mediated association is calculated as the product of the UHI–AEAI association and the AEAI–carbon emission association. The remaining UHI–carbon emission association after accounting for AEAI is interpreted as the direct statistical association, and the mediation proportion is calculated as the ratio of the statistically mediated association to the total statistical association. To assess the uncertainty of the mediation estimates, we conducted a parametric Monte Carlo simulation based on the estimated coefficient vectors and variance–covariance matrices of the three spatial panel SDM mediation equations. In each iteration, the total statistical association, direct statistical association, statistically mediated association, and mediation proportion were recalculated. Monte Carlo standard errors and 95% confidence intervals were then obtained from the simulated distributions.
3. Results
3.1. Spatiotemporal Patterns of Carbon Emissions, Urban Heat Islands, and AEAI
3.1.1. Spatial Patterns of Carbon Emissions
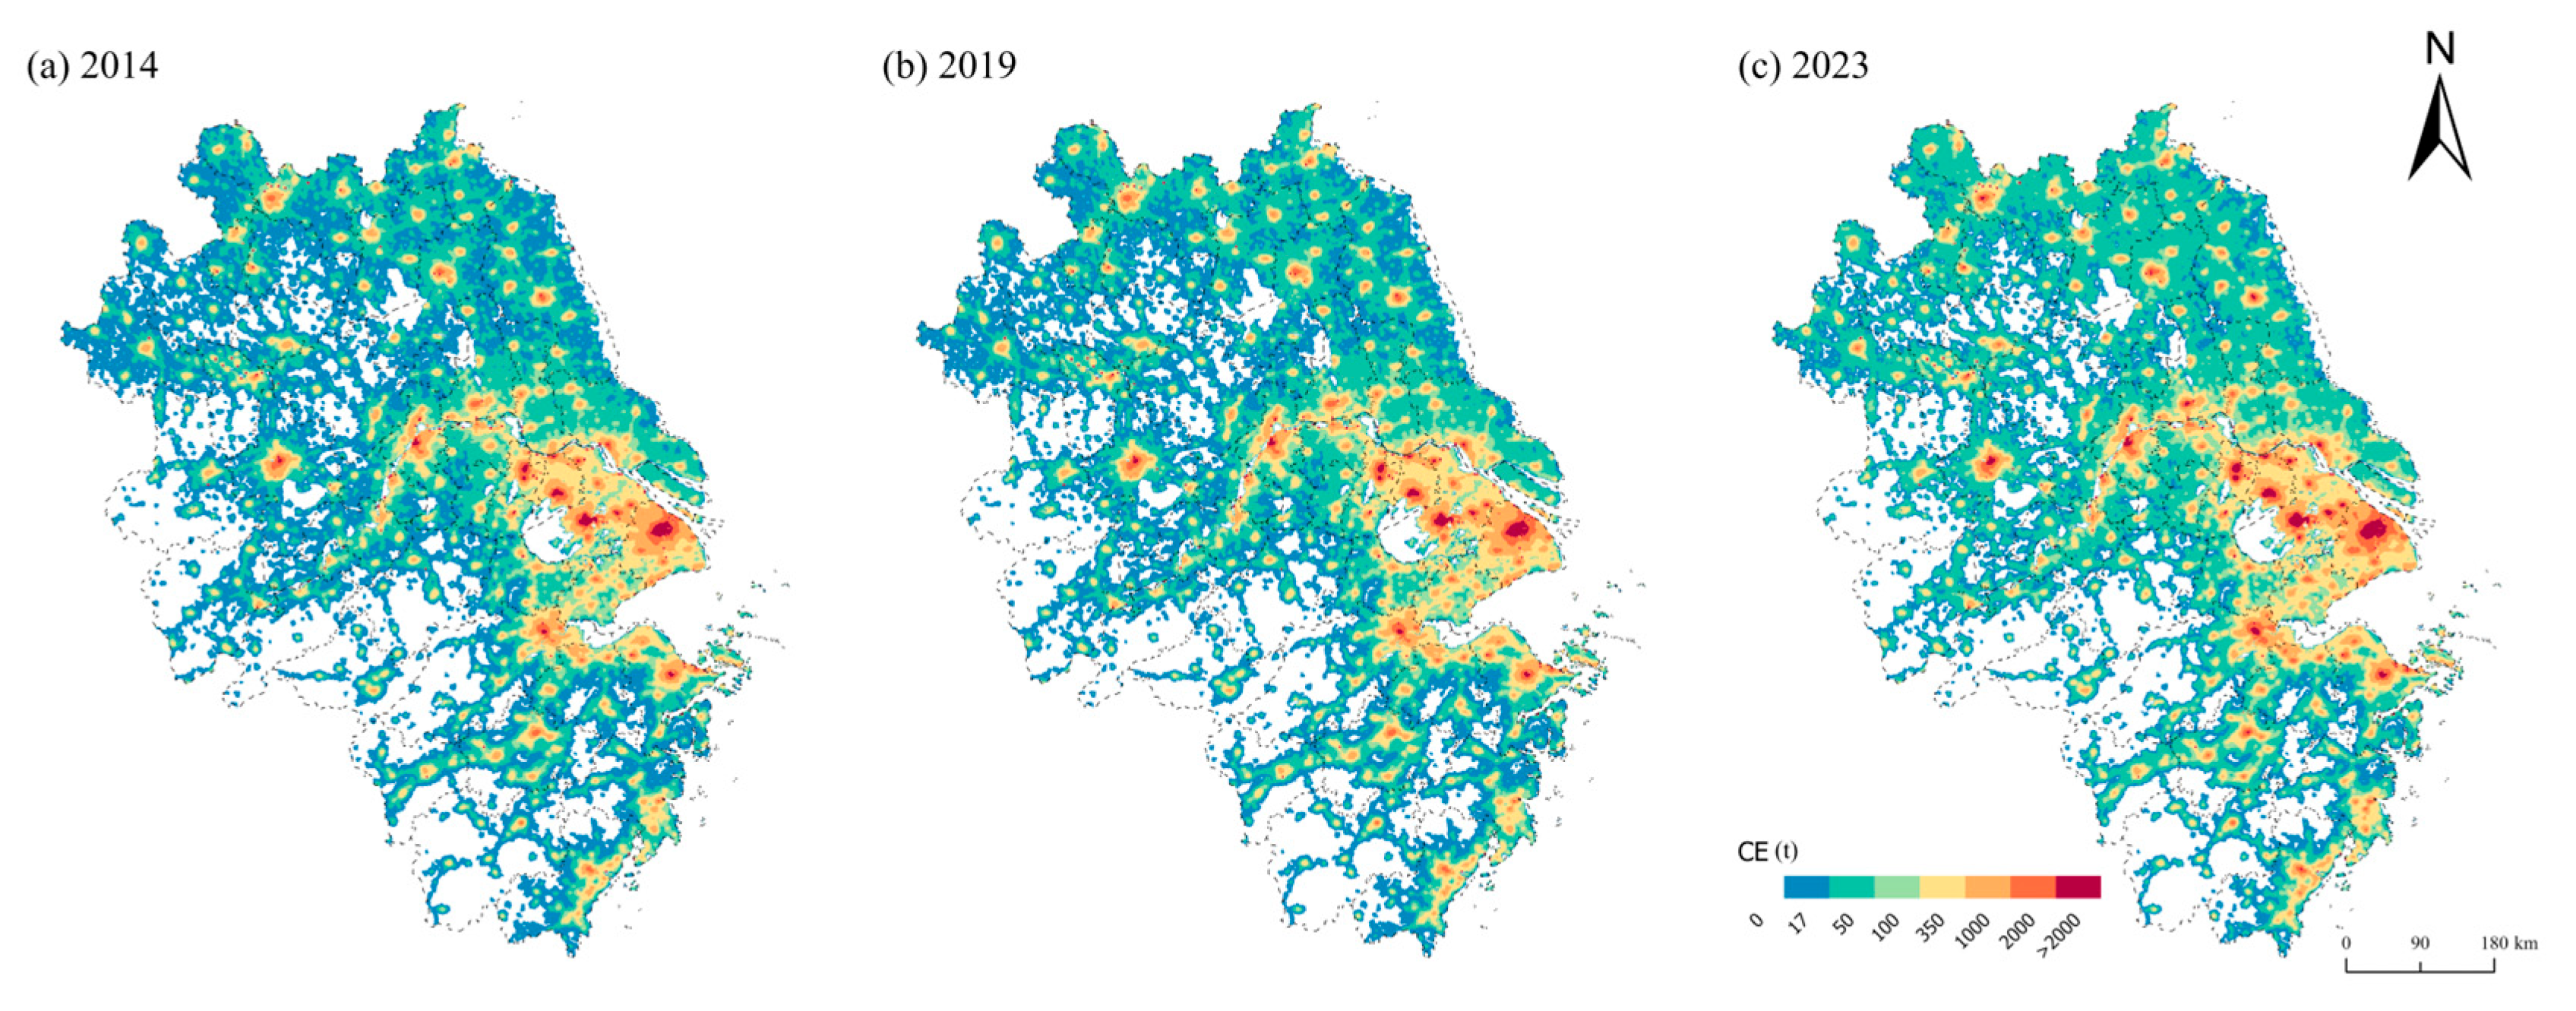
Figure 3 illustrates the spatial distribution of absolute carbon emissions (CE) in the Yangtze River Delta from 2014 to 2023. In terms of spatial morphology, carbon emissions exhibit a pronounced pattern of “multi-center agglomeration with axial expansion. Over the study period, high-emission pixels gradually evolved from isolated urban cores to more extensive peripheral areas, forming continuous and high-density emission corridors along the Yangtze River and Hangzhou Bay.
To preserve the intuitive physical magnitude, absolute CE values are presented in this section. In subsequent spatial econometric analyses, the variable is log-transformed (lnCE) to address heteroscedasticity.
3.1.2. Spatial Patterns of Urban Heat Islands
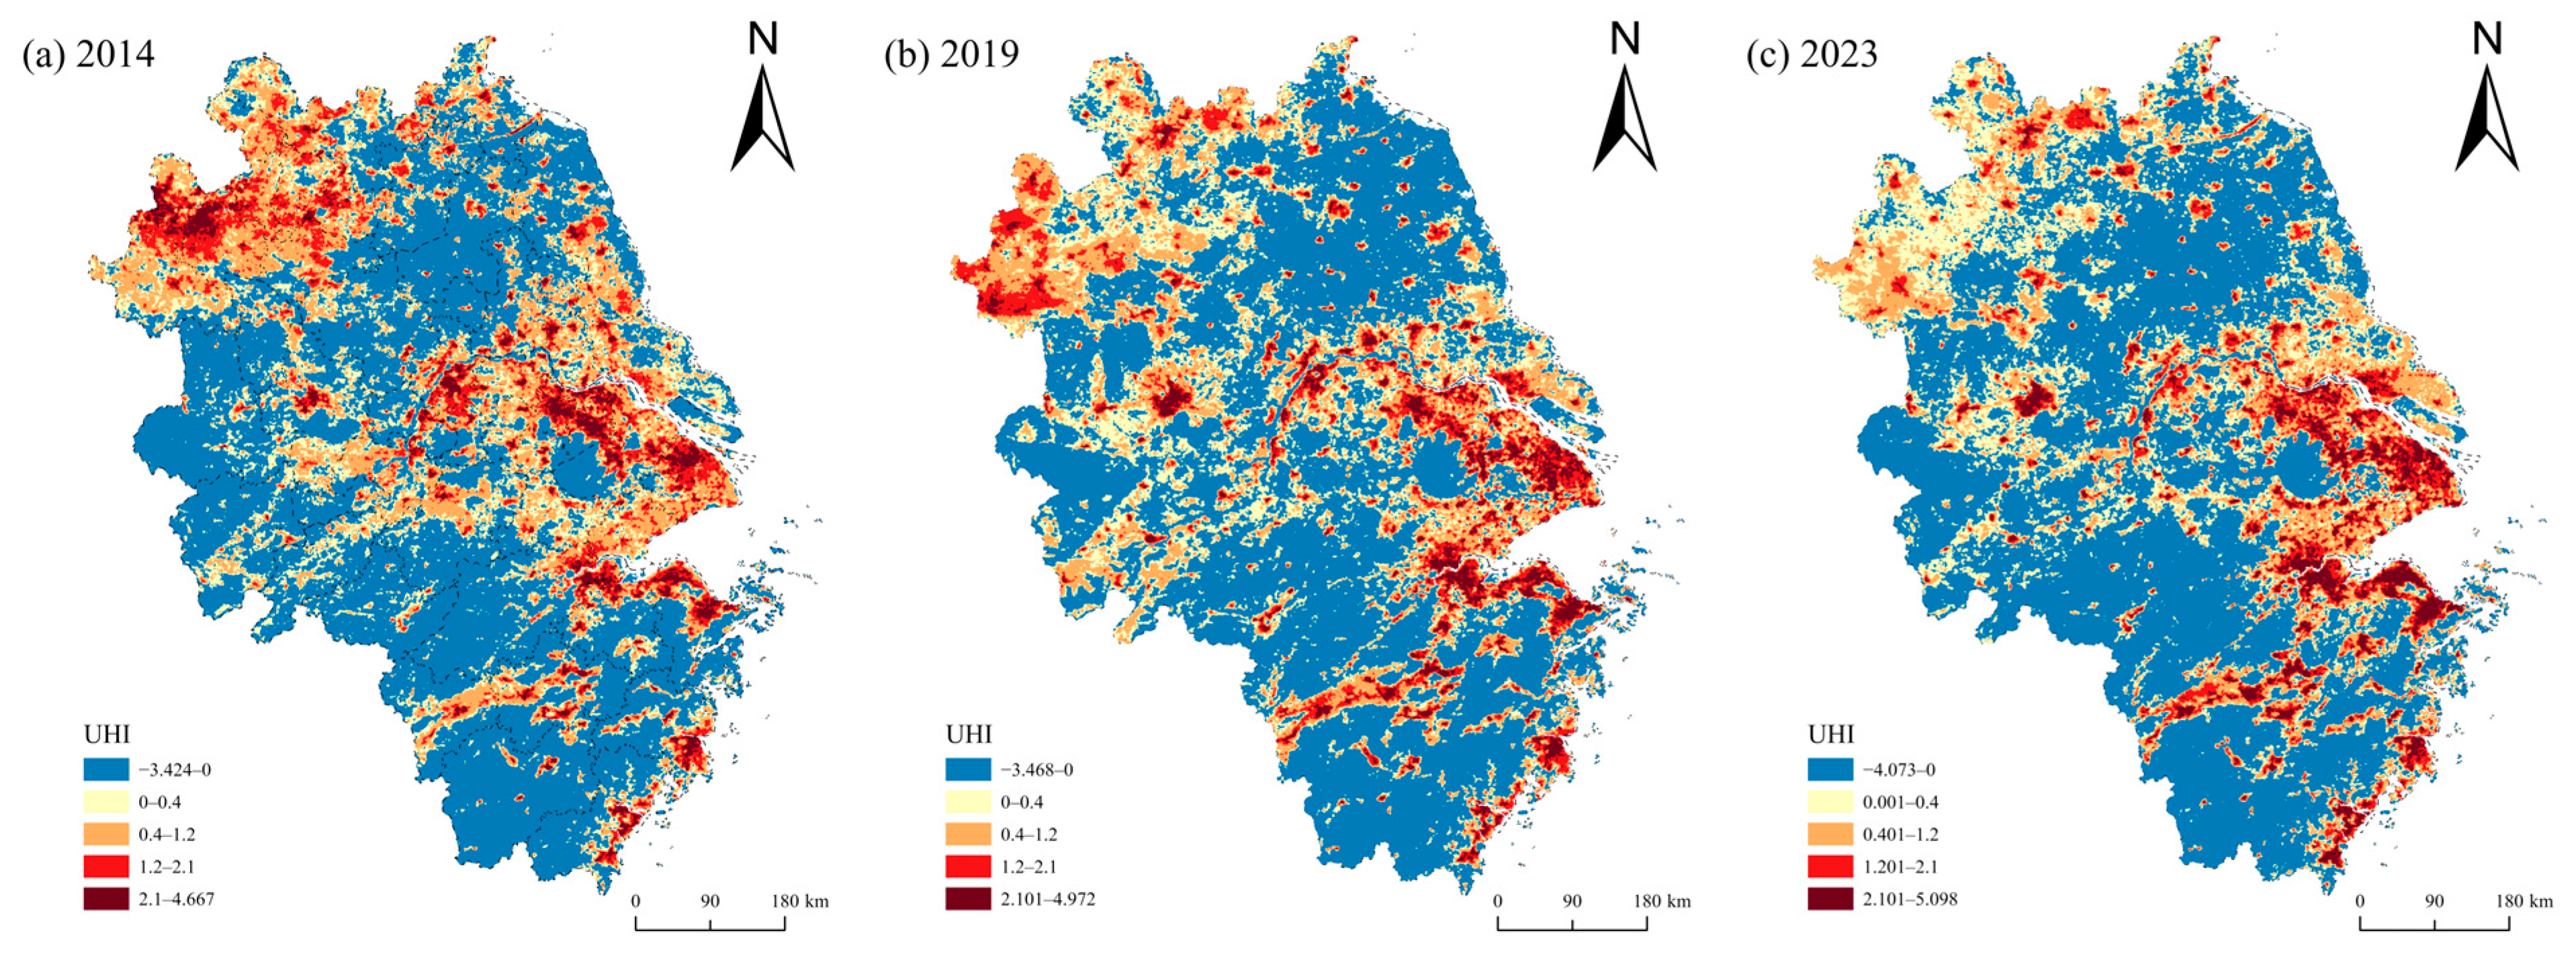
Figure 4 depicts the systematic evolution of regional thermal anomalies. From 2014 to 2023, the spatial pattern of the urban heat island (UHI) effect transitioned from fragmented and scattered patches to a more continuous and densely clustered structure. This spatial aggregation is particularly prominent in the Suzhou–Shanghai–Jiaxing corridor, where initially discrete hotspots gradually coalesced into an evident belt-like urban heat island zone.
3.1.3. Spatial Patterns of AEAI
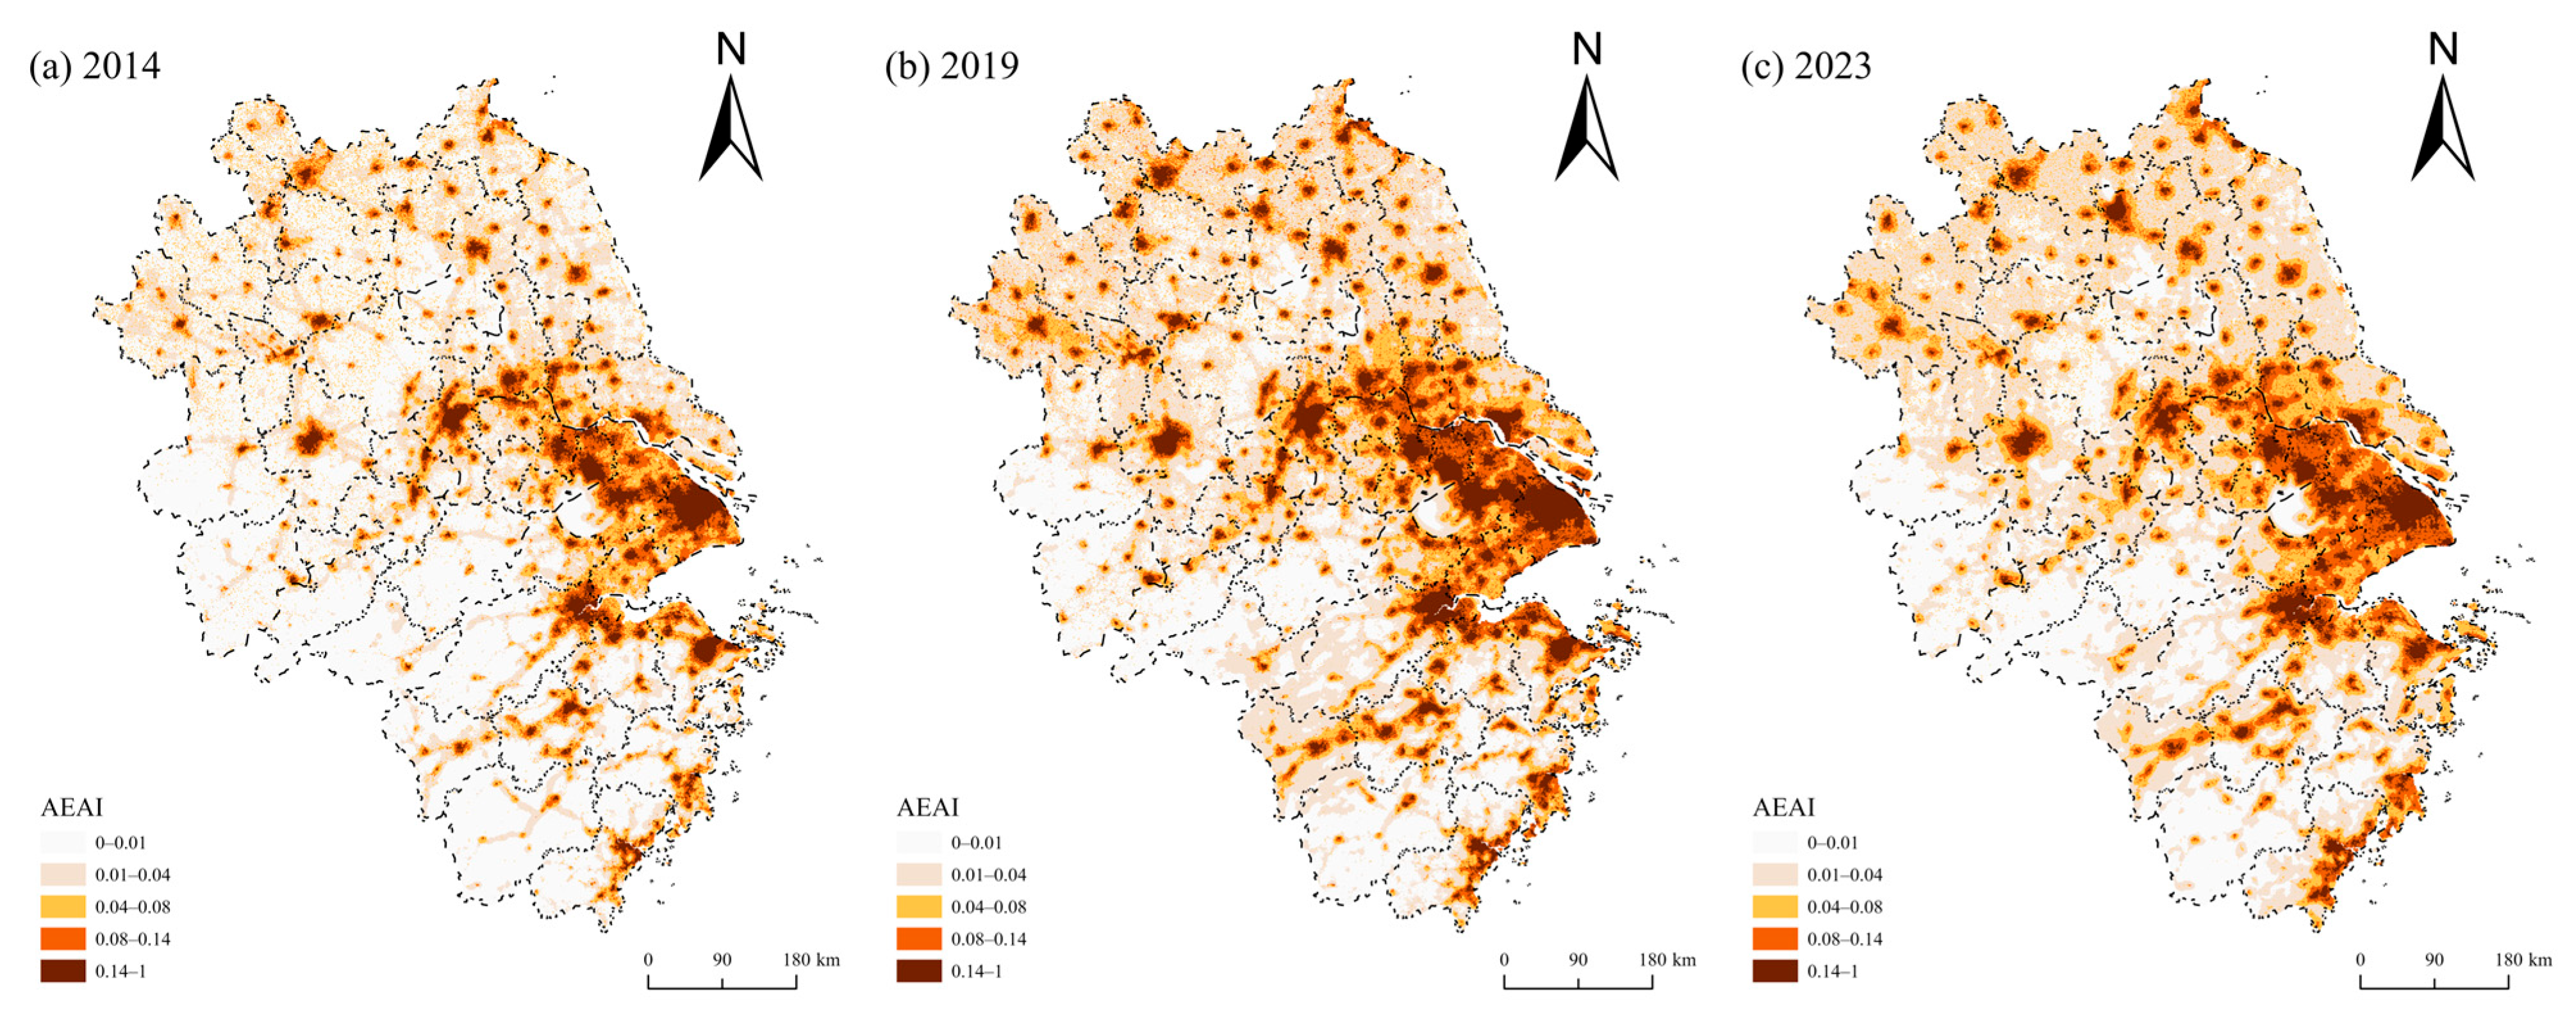
Figure 5 presents the spatial pattern of the anthropogenic energy activity intensity (AEAI) index, which serves as a proxy for human activity intensity. AEAI demonstrates a strong tendency toward spatial connectivity and network-like expansion. With ongoing urbanization, high-intensity human activity areas progressively expanded outward from core urban nodes, filling spatial gaps between adjacent cities.
A comparative observation of
Figure 5a–c reveals a high degree of spatial overlap among the high-value clusters of CE, UHI, and AEAI, particularly in core urban areas and their surrounding regions. This pronounced spatial co-occurrence indicates a strong consistency in their geographic distribution and expansion trajectories.
3.2. Spatial Coupling Between Urban Heat Islands and Carbon Emissions
To quantitatively examine the statistical association and spatial dependence between urban heat island intensity (UHI) and carbon emissions, Pearson correlation and Global Moran’s I analyses were conducted at the 1 km grid scale (
Table 4). The Pearson correlation coefficients between UHI and logarithm of carbon emissions (lnCE) were 0.554, 0.622, and 0.671 for 2014, 2019, and 2023, respectively, all significant at the 1% level (
p < 0.001). These results not only confirm a robust positive linear relationship but also reveal a temporal strengthening of the coupling between urban thermal conditions and carbon emissions as urbanization progresses.
The Global Moran’s I statistics for the three observation periods are consistently positive (around 0.886) and statistically significant at the 1% level, firmly rejecting the null hypothesis of spatial randomness. This exceptionally high spatial autocorrelation indicates that regional carbon emissions exhibit significant spatial agglomeration rather than an independent random distribution. These diagnostic findings provide robust empirical justification for explicitly incorporating spatial dependence in subsequent spatial econometric specifications.
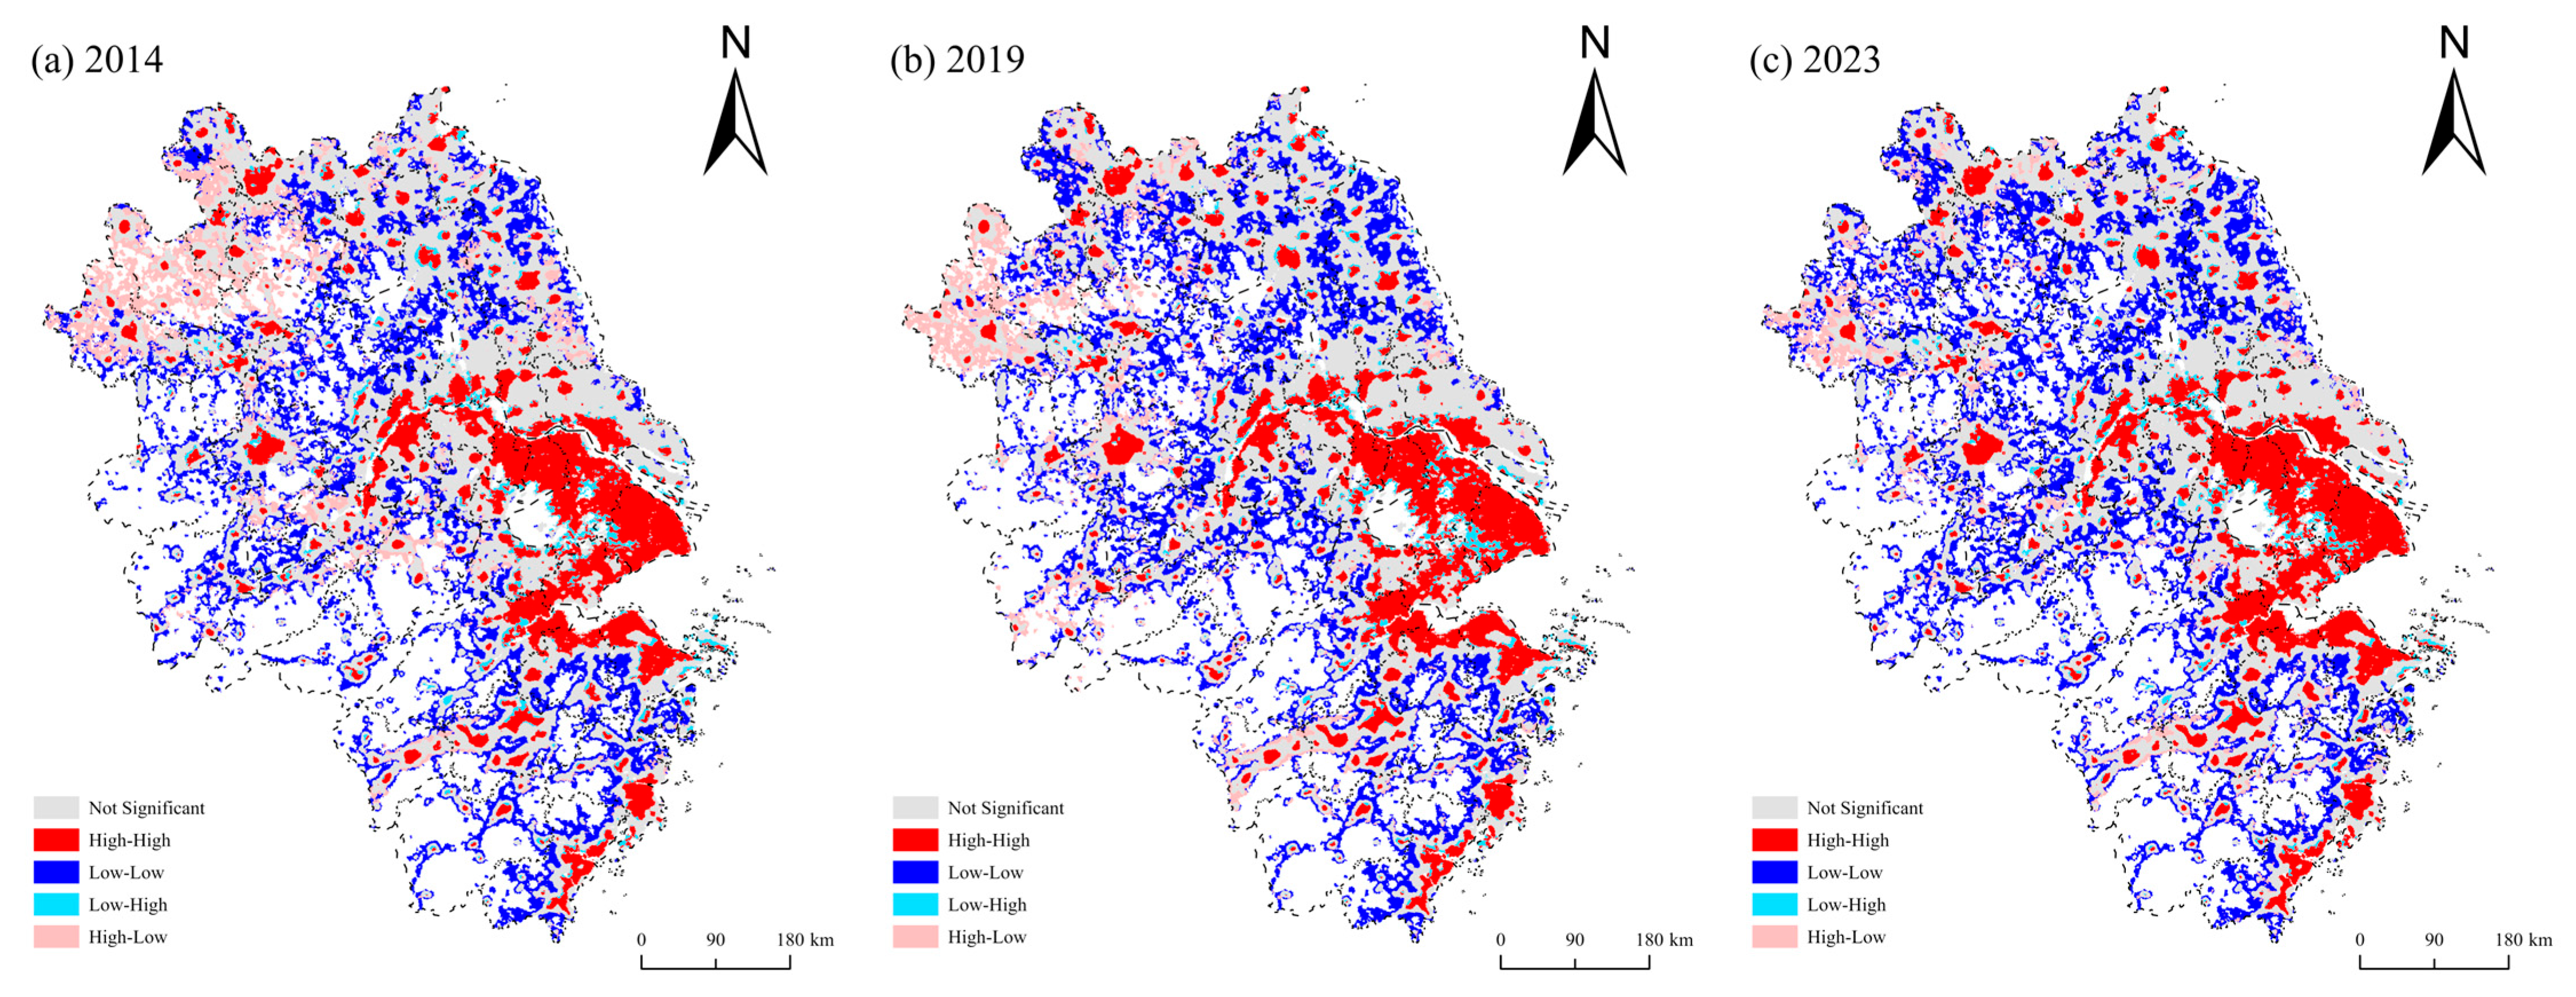
To uncover fine-grained local-scale spatial interactions, the Bivariate Local Moran’s I statistic was employed to generate Local Indicators of Spatial Association (LISA) cluster maps (
Figure 6). The results reveal a pronounced spatial agglomeration pattern between UHI and carbon emissions, dominated by High-High (HH) and Low-Low (LL) regimes. Specifically, HH clusters (red) are highly concentrated in the core urban agglomerations of Shanghai, Suzhou-Wuxi-Changzhou, and the Hangjiahu Plain, exhibiting strong spatial connectivity. This spatial coincidence quantitatively confirms that these regions simultaneously experience intense heat island effects and high carbon emission densities. In contrast, LL clusters (blue) are widely distributed across southern mountainous forests and agricultural hinterlands, reflecting the dual mitigating effects of favorable ecological conditions on both urban thermal anomalies and carbon emissions. A temporal comparison indicates that from 2014 to 2023, HH clusters continuously expanded outward along the urban periphery, highlighting the dynamic evolution of the “thermal-carbon” coupling nexus in rapidly urbanizing regions.
3.3. Spatial Spillover Effects of UHI and AEAI
To ensure the robustness of the econometric results, the optimal spatial panel specification was determined following the model selection and diagnostic procedures of [
63], and the corresponding diagnostic results are reported in
Table 5. The Lagrange Multiplier (LM) tests consistently reject the null hypothesis of no spatial dependence at the 1% significance level, indicating significant spatial autocorrelation in the sample and supporting the use of spatial econometric models. Further, the Likelihood Ratio (LR) tests show that the SDM cannot be reduced to either a Spatial Autoregressive (SAR) or Spatial Error Model (SEM), suggesting that the SDM provides a more appropriate framework for capturing both direct and spillover effects.
With respect to the panel structure, the dataset is characterized by a typical large-N and small-T setting (N = 10,726; T = 3). In this context, conventional random effects estimation is subject to incidental parameter problems, leading to instability in the variance–covariance matrix and convergence difficulties, which makes the Hausman test infeasible. At the same time, introducing individual fixed effects in such a high-dimensional cross-sectional setting entails considerable computational burden and may reduce estimation efficiency. Taking these factors into account, a specification that incorporates time-specific effects is adopted as a baseline to control for common temporal shocks and unobserved period heterogeneity. This choice mainly serves to improve estimation stability and does not materially affect the main results.
Table 6 reports the estimation results of the time-fixed effects Spatial Durbin Model (SDM) and the corresponding spatial effect decomposition. The spatial autoregressive coefficient is significantly positive (ρ = 0.829,
p < 0.001), indicating strong positive spatial dependence in gridded carbon emissions across the Yangtze River Delta. This result is consistent with the high Global Moran’s I values reported in the exploratory spatial analysis and suggests that carbon emissions are spatially clustered across neighboring grid cells.
The decomposition results further show that UHI has significant positive direct, indirect, and total effects. Its total effect reaches 1.742, indicating that urban thermal intensity is statistically associated not only with local carbon emissions but also with cross-regional spillover effects. AEAI exhibits the largest effect among the explanatory variables, with a direct effect of 14.132, an indirect effect of 55.079, and a total effect of 69.210. This suggests that carbon emissions are more strongly associated with the composite intensity of anthropogenic energy-related activities than with thermal conditions alone. Because AEAI is a normalized composite index, the magnitude of its effect should be interpreted as the contrast across the full index range rather than as a physical-unit elasticity.
In contrast, NDVI does not show statistically significant direct, indirect, or total effects after controlling for spatial dependence, UHI, AEAI, and time fixed effects. Although the spatially lagged NDVI term is statistically significant, the impact decomposition indicates that the overall vegetation-related effect is not robust. Therefore, NDVI is interpreted as a vegetation-related control variable rather than as part of the core heat–energy–carbon transmission mechanism.
To further examine whether the main conclusions are sensitive to the spatial weight specification, we re-estimated the time-fixed effects SDM using alternative spatial weight matrices. As shown in
Table 7, the spatial autoregressive coefficient remains significantly positive across the KNN-8 baseline, KNN-8 inverse-distance, and KNN-12 specifications. UHI and AEAI are consistently positive and statistically significant under all three specifications, confirming the robustness of the core heat–energy–carbon association.
By contrast, NDVI remains statistically insignificant across the three spatial weight specifications. This suggests that the vegetation-related control effect is not robust after accounting for spatial dependence and time fixed effects. Overall, the robustness analysis indicates that the key UHI–AEAI–carbon emission relationship is not driven solely by the baseline KNN-8 matrix, while spatial weight selection remains an important modeling assumption.
To examine whether the baseline results are sensitive to the 5 km modeling scale, an additional scale sensitivity analysis was conducted using a 10 km grid. Carbon emissions were aggregated by summation, while UHI, AEAI, and NDVI were aggregated by averaging. The 10 km dataset was then re-estimated using the baseline spatial econometric specification to ensure comparability with the 5 km model. As shown in
Table 8, the spatial dependence of carbon emissions remains statistically significant at the 10 km scale. More importantly, both UHI and AEAI retain significant positive total impacts, indicating that the core heat–energy–carbon association is not dependent on the specific choice of the 5 km modeling scale. AEAI continues to exhibit the strongest total impact among the explanatory variables, further supporting its dominant statistical association with carbon emissions.
NDVI remains statistically insignificant in both the corrected 5 km baseline model and the 10 km model. Since NDVI is included as a control variable rather than a core explanatory or mediating variable, this result does not alter the main conclusion. Instead, it suggests that vegetation-related effects are more sensitive to model specification and spatial aggregation, and should be interpreted with caution in the current gridded spatial econometric framework.
3.4. Statistical Mediation Pathway of AEAI
To examine the statistically mediated pathway linking urban heat island intensity and carbon emissions, Anthropogenic Energy Activity Intensity (AEAI) was introduced as a mediator within a spatial mediation framework. A stepwise regression procedure was applied to test the hypothesized statistical pathways, with detailed estimation results presented in
Table 9. In Model M1, which excludes the mediator, UHI shows a significantly positive total statistical association with carbon emissions (coefficient = 0.540,
p < 0.01), indicating that higher regional thermal intensity tends to be associated with higher carbon emissions. Model M2 evaluates the association between UHI and AEAI. The results indicate that UHI is significantly and positively associated with AEAI (coefficient = 0.020,
p < 0.01), suggesting that areas with stronger urban thermal anomalies tend to exhibit higher levels of anthropogenic energy activity. In Model M3, when both UHI and AEAI are included as explanatory variables, AEAI shows a strong positive association with carbon emissions (coefficient = 11.861,
p < 0.01). Meanwhile, the UHI–carbon emission association after accounting for AEAI remains significant (0.300,
p < 0.01) but is reduced relative to the total statistical association estimated in Model M1. These findings satisfy the statistical criteria for partial mediation, indicating that AEAI represents a substantial partial statistical mediation pathway in the association between urban heat islands and carbon emissions.
A further decomposition of the statistical mediation estimates and the uncertainty assessment are reported in
Table 10. The statistically mediated association through the “UHI → AEAI → carbon emissions” pathway is 0.241, with a Monte Carlo standard error of 0.005 and a 95% confidence interval of [0.231, 0.250]. The mediation proportion is 44.63%, with a Monte Carlo standard error of 1.163 percentage points and a 95% confidence interval of [42.47%, 46.88%]. These results suggest that AEAI constitutes a substantial partial statistical mediation pathway in the association between urban heat islands and carbon emissions. The UHI–carbon emission association is partly mediated through AEAI, while the direct statistical association remains significant. Therefore, AEAI should be interpreted as a substantial partial statistical mediation pathway rather than as the sole or dominant pathway.
4. Discussion
4.1. Spatial Spillovers in the Heat–Carbon Nexus
Drawing upon the estimation results of the Spatial Durbin Model (SDM), carbon emissions in the Yangtze River Delta exhibit a robust positive spatial spillover effect (ρ = 0.829,
p < 0.01) [
11,
38]. This suggests that regional emissions are not isolated occurrences within individual cities but are fundamentally shaped by spatial interaction networks across adjacent urban areas [
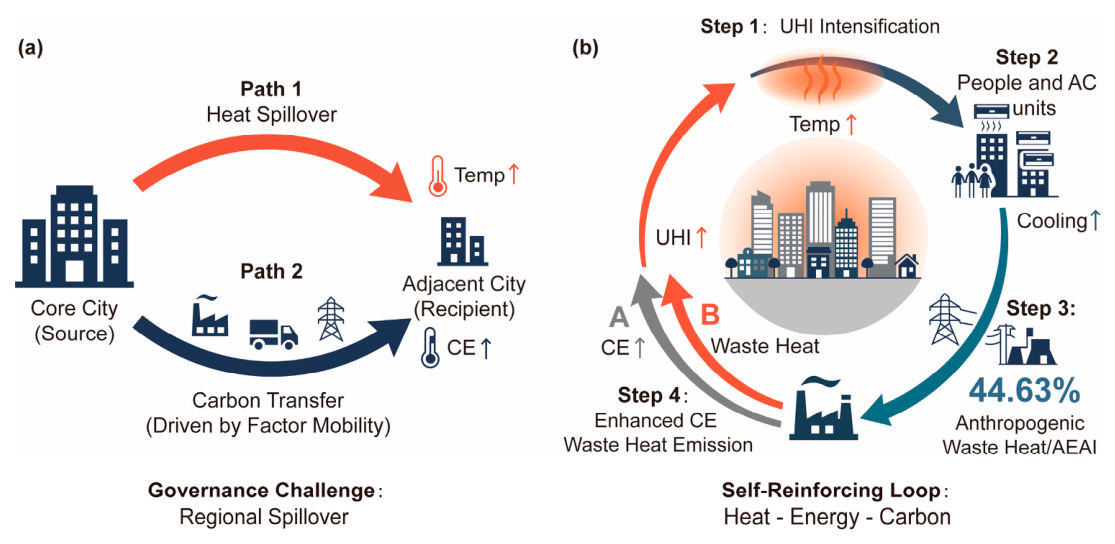
37]. A further decomposition of the spatial effects reveals that both UHI and AEAI exert significantly positive direct and indirect effects, highlighting the cross-regional transmission characteristics of the “thermal-carbon” nexus (Path 1: Heat Spillover,
Figure 7a) [
20].
As illustrated in
Figure 7a, this cross-boundary transmission operates through both physical and socio-economic mechanisms. From a physical climatology perspective, the flat terrain and contiguous built-up areas of the YRD facilitate the alteration of near-surface atmospheric dynamics by localized high-temperature centers. Advective thermal circulations propagate these heat anomalies beyond jurisdictional boundaries, resulting in a thermal “footprint” that far exceeds the physical urban extent and leads to a region-wide intensification of urban thermal degradation [
39].
From a socioeconomic perspective, the large indirect effect of AEAI (55.079) indicates that anthropogenic energy-related activity intensity is strongly associated with cross-regional carbon emission spillovers. The urban agglomeration exhibits tightly integrated industrial divisions and transportation networks [
35]. High-intensity energy consumption in core cities often displaces carbon emission pressures to hinterlands through industrial relocation and inter-city commuting, collectively elevating regional emission trajectories (Path 2: Carbon Transfer,
Figure 7a) [
38]. Consequently, the evolution of the “thermal-energy-carbon” nexus in urban agglomerations is inherently a cross-regional systemic phenomenon posing a significant governance challenge [
9,
10]. Unilateral mitigation or cooling policies implemented in a single city are highly susceptible to being partially offset by negative spillover effects from neighboring jurisdictions, rendering isolated interventions suboptimal.
4.2. The “Heat-Energy-Carbon” Loop
One important finding of this study is the identification of AEAI as a substantial partial statistical mediation pathway in the “thermal–carbon” association. As shown in
Figure 7b, the updated mediation analysis indicates that the pathway through AEAI accounts for 44.63% of the total association between UHI and carbon emissions, while the direct association remains statistically significant. This suggests that the UHI–carbon emission linkage is partly embedded in spatial patterns of energy-intensive human activities, rather than being fully explained by direct thermal conditions alone. At the same time, the remaining direct association implies that other pathways, such as urban form, sectoral energy structure, building energy use, transportation activity, air pollution, and ventilation conditions, may also contribute to the observed heat–carbon relationship [
9,
10].
Mechanistically, this partial mediation pathway is consistent with a potential “thermal–energy–carbon” feedback process within highly urbanized areas (Steps 1–4 in
Figure 7b). Under intensified UHI conditions (Step 1), residents and enterprises may increase the use of cooling equipment, such as air conditioners, to maintain thermal comfort and productivity (Step 2) [
29,
64]. Such adaptive responses can increase cooling-related electricity demand and associated energy consumption, leading to a cooling energy penalty (Step 3) [
23]. In turn, additional energy use and waste heat from cooling systems may further reinforce local thermal stress under certain urban conditions (Step 4,
Figure 7b), locking the urban system in a self-reinforcing cycle of “high temperature–high energy consumption–high emissions” [
65,
66].
This feedback loop highlights an important mitigation–adaptation tradeoff in highly urbanized regions. The socio-economic system’s behavioral responses to climate change often exert a stronger influence on carbon emissions than the physical changes in the natural environment, underscoring a critical mitigation-adaptation tradeoff [
30]. Consequently, high urban carbon emissions are not solely “passively dictated” by extreme temperatures, but are largely shaped by human energy-use decisions. Therefore, reducing carbon lock-in under elevated thermal conditions requires not only physical-environmental cooling strategies, but also demand-side interventions targeting cooling energy use, building efficiency, and low-carbon energy transitions. This provides an entry point for coordinated regional emission mitigation and climate-adaptive urban governance [
10,
67].
4.3. Policy Implications
In light of these empirical findings, this study proposes targeted policy interventions spanning three dimensions—spatial governance, urban planning, and energy systems—to facilitate the coordinated amelioration of urban thermal conditions and carbon mitigation in the Yangtze River Delta.
(1) Foster cross-jurisdictional synergistic governance frameworks based on spatial spillover patterns.
Given the significant spatial associations and spillover effects of carbon emissions and urban heat islands identified in this study, governance strategies must transcend rigid administrative boundaries. For the high-value clusters identified within the Yangtze River Delta, the development of inter-city ecological corridors and the strategic optimization of industrial spatial layouts can help disrupt the regional propagation of the “thermal-carbon” coupling [
20], thereby avoiding the misallocation of local emission reduction responsibilities that often arises from neglected spatial interactions.
(2) Strengthen passive cooling-oriented urban design to reduce heat-induced energy demand.
Since AEAI represents a substantial partial statistical mediation pathway in the UHI–carbon emission association, mitigation strategies should not only focus on physical cooling but also on reducing the sensitivity of energy demand to heat exposure. Nature-based solutions, such as increasing urban canopy coverage, improving blue-green infrastructure, and deploying high-albedo materials, can help alleviate thermal stress and reduce reliance on mechanical cooling [
24,
67]. However, because NDVI is treated as a control variable and does not show robust significant impacts in the current model, vegetation-related measures should be interpreted as complementary planning strategies rather than as a directly verified carbon-reduction mechanism in this study.
(3) Accelerate multi-scale climate-adaptive transformations on the energy demand side.
Building on the spatial heterogeneity of anthropogenic energy activities revealed in this study, green building design, high-efficiency cooling technologies, and demand-side energy management should be prioritized in core urban areas and densely populated districts to reduce the sensitivity of socioeconomic activities to thermal stress [
65,
66]. During peak summer cooling periods, increasing the share of renewable electricity and improving the efficiency of cooling systems can help reduce the carbon intensity of adaptive energy use. These interventions can support the Yangtze River Delta in gradually weakening the “high temperature–high cooling demand–high emissions” feedback risk and enhancing regional climate resilience.
4.4. Limitations and Future Work
Despite the multi-scale spatial econometric framework developed in this study, several limitations remain. First, Anthropogenic Energy Activity Intensity (AEAI), as a composite proxy, cannot fully differentiate the heterogeneous responses of industrial, transportation, and residential sectors, although it captures the overall intensity of anthropogenic energy-related activities. Sector-specific industrial structure and detailed economic controls were not independently disentangled in the current grid-level framework. Future studies could incorporate sectoral energy consumption, industrial structure, and city-level economic statistics to further examine their marginal effects.
Another source of uncertainty concerns the gridded datasets used in this study, especially the pixel-level allocation of ODIAC carbon emissions, MODIS LST retrievals under cloudy conditions, and LandScan population distribution modeling. Although preprocessing and quality-control procedures were applied, these datasets should still be interpreted as spatially consistent proxies rather than direct ground-truth measurements. In addition, several atmospheric and meteorological confounders, such as aerosol concentrations, air pollution, wind speed, boundary-layer height, and urban ventilation conditions, were not explicitly incorporated. Their omission may partly affect the estimated association between UHI and carbon emissions, especially in highly urbanized and industrialized areas. Future research could integrate electricity load records, sectoral energy statistics, local census data, air-quality observations, and meteorological variables to further validate and refine the heat–energy–carbon relationships identified in this study.
A further methodological issue relates to scale effects, the modifiable areal unit problem, and spatial weight specification in gridded spatial econometric analysis. Although the 10 km scale sensitivity analysis and alternative spatial weight matrix tests confirm that the core UHI–AEAI–carbon emission association remains generally stable, the NDVI control effect and the magnitude of spatial dependence vary across spatial aggregation levels and weight specifications. Therefore, the 5 km baseline SDM should be interpreted as a compromise between spatial detail, statistical stability, and computational feasibility rather than as a uniquely optimal scale. Future studies could conduct systematic comparisons across additional grid resolutions, spatial weight structures, and hierarchical or multi-scale spatial interaction models.
Finally, due to the use of three representative observation years and the observational nature of the dataset, the estimated relationships should be interpreted as spatial associations and statistically mediated pathways rather than strict causal effects. Future studies could employ annual or higher-frequency panel data, temporal lag structures, instrumental variables, or quasi-experimental designs to better capture year-to-year variability, short-term shocks, and causal dynamics within the heat–energy–carbon nexus.
5. Conclusions
Under the combined pressures of rapid urbanization and climate warming, systematically understanding the mechanisms linking urban thermal environments and carbon emissions is critical for advancing low-carbon urban transitions and climate-adaptive governance. Using multi-source remote sensing data for the Yangtze River Delta from 2014, 2019, and 2023, this study constructs a multi-scale spatial analytical framework of “urban heat island–anthropogenic energy activity–carbon emissions,” systematically revealing the spatial patterns and statistically mediated pathways linking urban heat islands and regional carbon emissions.
The results indicate that: (1) carbon emissions in the Yangtze River Delta exhibit significant spatial dependence and spillover effects, with urban heat islands (UHI) and Anthropogenic Energy Activity Intensity (AEAI) showing associations with carbon emissions beyond local boundaries through inter-city interaction networks, reflecting strong systemic characteristics at the regional scale; (2) AEAI exhibits the strongest association with carbon emissions among the explanatory variables and represents a substantial partial statistical mediation pathway in the UHI–carbon emission relationship, accounting for 44.63% of the total statistical association. This indicates that energy-related human activities are an important pathway linking urban thermal conditions and carbon emissions, while other pathways may also contribute; and (3) By adopting a multi-scale analytical strategy—from 1 km exploratory analysis to 5 km spatial econometric modeling—this study suggests that coordinated interventions targeting thermal environment improvement, behavioral regulation, and passive cooling may contribute to reducing urban heat stress and supporting regional carbon mitigation at the city-cluster scale.
Overall, this study elucidates the cross-scale transmission dynamics of the “thermal–energy–carbon” coupling system within the Yangtze River Delta, highlighting the necessity of coordinated interventions targeting both human energy-use behaviors and thermal stress from a city-cluster perspective. These findings provide a scientific basis for breaking the spatial lock-in of regional carbon emissions and advancing climate-adaptive urban development.





 ,
,