Next Issue
Volume 15, December-2
Previous Issue
Volume 15, November-2
 
 
remotesensing-logo

Journal Browser

Journal Browser

Remote Sens., Volume 15, Issue 23 (December-1 2023) – 193 articles

Cover Story (view full-size image): 
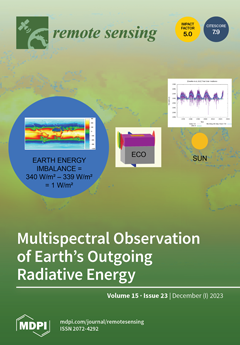
The Earth Climate Observatory (ECO) is a new space mission concept for the measurement of the Earth Energy Imbalance (EEI). The Incoming Solar Radiation (ISR)—of the order of 340 W/m2—and the Total Outgoing terrestrial Radiation (TOR)—of the order of 339 W/m2—are measured by identically designed, intercalibrated wide-field-of-view radiometers, such that a significant measurement of the EEI—of the order of 1 W/m2—can be made. Auxiliary visible and thermal multispectral cameras will be used to increase the spatial resolution of the radiometer observations, and to separate the TOR spectrally in the Reflected Solar Radiation (RSR) and the Outgoing Longwave Radiation (OLR). View this paper
  • Issues are regarded as officially published after their release is announced to the table of contents alert mailing list.
  • You may sign up for e-mail alerts to receive table of contents of newly released issues.
  • PDF is the official format for papers published in both, html and pdf forms. To view the papers in pdf format, click on the "PDF Full-text" link, and use the free Adobe Reader to open them.
Order results
Result details
Section
Select all
Export citation of selected articles as:
20 pages, 6638 KiB  
Article
Spatio-Temporal Dynamics of Total Suspended Sediments in the Belize Coastal Lagoon
by Chintan B. Maniyar, Megha Rudresh, Ileana A. Callejas, Katie Osborn, Christine M. Lee, Jennifer Jay, Myles Phillips, Nicole Auil Gomez, Emil A. Cherrington, Robert Griffin, Christine Evans, Andria Rosado, Samir Rosado, Stacey L. Felgate, Claire Evans, Vanesa Martín-Arias and Deepak R. Mishra
Remote Sens. 2023, 15(23), 5625; https://doi.org/10.3390/rs15235625 - 04 Dec 2023
Viewed by 1522
Abstract
Increased tourism in Belize over the last decade and the growth of the local population have led to coastal development and infrastructure expansion. Land use alteration and anthropogenic activity may change the sediment and nutrient loads in coastal systems, which can negatively affect [...] Read more.
Increased tourism in Belize over the last decade and the growth of the local population have led to coastal development and infrastructure expansion. Land use alteration and anthropogenic activity may change the sediment and nutrient loads in coastal systems, which can negatively affect ecosystems via mechanisms such as reducing photosynthetically active radiation fields, smothering sessile habitats, and stimulating eutrophication events. Accurate monitoring and prediction of water quality parameters such as Total Suspended Sediments (TSS), are essential in order to understand the influence of land-based changes, climate, and human activities on the coastal systems and devise strategies to mitigate negative impacts. This study implements machine learning algorithms such as Random Forests (RF), Extreme Gradient Boosting (XGB), and Deep Neural Networks (DNN) to estimate TSS using Sentinel-2 reflectance data in the Belize Coastal Lagoon (BCL) and validates the results using TSS data collected in situ. DNN performed the best and estimated TSS with a testing R2 of 0.89. Time-series analysis was also performed on the BCL’s TSS trends using Bayesian Changepoint Detection (BCD) methods to flag anomalously high TSS spatio-temporally, which may be caused by dredging events. Having such a framework can ease the near-real-time monitoring of water quality in Belize, help track the TSS dynamics for anomalies, and aid in meeting and maintaining the sustainable goals for Belize. Full article
(This article belongs to the Section Ocean Remote Sensing)
Show Figures

Figure 1

22 pages, 8199 KiB  
Article
Weather Radar Parameter Estimation Based on Frequency Domain Processing: Technical Details and Performance Evaluation
by Shuai Zhang, Yubao Chen, Zhifeng Shu, Haifeng Yu, Hui Wang, Jianjun Chen and Lu Li
Remote Sens. 2023, 15(23), 5624; https://doi.org/10.3390/rs15235624 - 04 Dec 2023
Viewed by 779
Abstract
Parameter estimation is important in weather radar signal processing. Time-domain processing (TDP) and frequency-domain processing (FDP) are two basic parameter estimation methods used in the weather radar field. TDP is widely used in operational weather radars because of its high efficiency and robustness; [...] Read more.
Parameter estimation is important in weather radar signal processing. Time-domain processing (TDP) and frequency-domain processing (FDP) are two basic parameter estimation methods used in the weather radar field. TDP is widely used in operational weather radars because of its high efficiency and robustness; however, it must be assumed that the received signal has a symmetrical or Gaussian power spectrum, which limits its performance. FDP does not require assumptions about its power spectrum model and has a seamless connection to spectrum analysis; however, its application performance has not been fully validated to ensure its robustness in an operational environment. In this study, we introduce several technical details in FDP, including window function selection, aliasing correction, and noise correction. Additionally, we evaluate the performance of FDP and compare the performance of FDP and TDP based on simulated and measured weather in-phase/quadrature (I/Q) data. The results show that FDP has potential for operational applications; however, further improvements are required, e.g., windowing processing for signals mixed with severe clutter. Full article
(This article belongs to the Special Issue Synergetic Remote Sensing of Clouds and Precipitation II)
Show Figures

Graphical abstract

0 pages, 4813 KiB  
Article
Grassland Chlorophyll Content Estimation from Drone Hyperspectral Images Combined with Fractional-Order Derivative
by Aiwu Zhang, Shengnan Yin, Juan Wang, Nianpeng He, Shatuo Chai and Haiyang Pang
Remote Sens. 2023, 15(23), 5623; https://doi.org/10.3390/rs15235623 - 04 Dec 2023
Viewed by 1048
Abstract
Chlorophyll plays a critical role in assessing the photosynthetic capacity and health of grasslands. However, existing studies on the hyperspectral inversion of chlorophyll have mainly focused on field crops, leading to limited accuracy when applied to natural grasslands due to their complex canopy [...] Read more.
Chlorophyll plays a critical role in assessing the photosynthetic capacity and health of grasslands. However, existing studies on the hyperspectral inversion of chlorophyll have mainly focused on field crops, leading to limited accuracy when applied to natural grasslands due to their complex canopy structures and species diversity. This study aims to address this challenge by extrapolating the measured leaf chlorophyll to the canopy level using the green vegetation coverage approach. Additionally, fractional-order derivative (FOD) methods are employed to enhance the sensitivity of hyperspectral data to chlorophyll. Several FOD spectral indices are developed to minimize interference from factors such as bare soil and hay, resulting in improved chlorophyll estimation accuracy. The study utilizes partial least squares regression (PLSR) and support vector machine regression (SVR) to construct inversion models based on full-band FOD, two-band FOD spectral indices, and their combination. Through comparative analysis, the optimal model for estimating grassland chlorophyll content is determined, yielding an R2 value of 0.808, RMSE value of 1.720, and RPD value of 2.347. Full article
Show Figures

Graphical abstract

19 pages, 24180 KiB  
Article
Comparison of GPM IMERG Version 06 Final Run Products and Its Latest Version 07 Precipitation Products across Scales: Similarities, Differences and Improvements
by Yaji Wang, Zhi Li, Lei Gao, Yong Zhong and Xinhua Peng
Remote Sens. 2023, 15(23), 5622; https://doi.org/10.3390/rs15235622 - 04 Dec 2023
Viewed by 1063
Abstract
Precipitation is an essential element in earth system research, which greatly benefits from the emergence of Satellite Precipitation Products (SPPs). Therefore, assessment of the accuracy of the SPPs is necessary both scientifically and practically. The Integrated Multi-Satellite Retrievals for GPM (IMERG) is one [...] Read more.
Precipitation is an essential element in earth system research, which greatly benefits from the emergence of Satellite Precipitation Products (SPPs). Therefore, assessment of the accuracy of the SPPs is necessary both scientifically and practically. The Integrated Multi-Satellite Retrievals for GPM (IMERG) is one of the most widely used SPPs in the scientific community. However, there is a lack of comprehensive evaluation for the performance of the newly released IMERG Version 07, which is essential for determining its effectiveness and reliability in precipitation estimation. In this study, we compare the IMERG V07 Final Run (V07_FR) with its predecessor IMERG V06_FR across scales from January 2016 to December 2020 over the globe (cross-compare their similarities and differences) and a focused study on mainland China (validate against 2481 rain gauges). The results show that: (1) Globally, the annual mean precipitation of V07_FR increases 2.2% compared to V06_FR over land but decreases 5.8% over the ocean. The two SPPs further exhibit great differences as indicated by the Critical Success Index (CSI = 0.64) and the Root Mean Squared Difference (RMSD = 3.42 mm/day) as compared to V06_FR to V07_FR. (2) Over mainland China, V06_FR and V07_FR detect comparable precipitation annually. However, the Probability of Detection (POD) improves by 5.0%, and the RMSD decreases by 3.7% when analyzed by grid cells. Further, the POD (+0%~+6.1%) and CSI (+0%~+8.8%) increase and the RMSD (−11.1%~0%) decreases regardless of the sub-regions. (3) Under extreme rainfall rates, V07_FR measures 4.5% lower extreme rainfall rates than V06_FR across mainland China. But V07_FR tends to detect more accurate extreme precipitation at both daily and event scales. These results can be of value for further SPP development, application in climatological and hydrological modeling, and risk analysis. Full article
(This article belongs to the Section Environmental Remote Sensing)
Show Figures

Figure 1

23 pages, 3668 KiB  
Article
Evaluating Feature Selection Methods and Machine Learning Algorithms for Mapping Mangrove Forests Using Optical and Synthetic Aperture Radar Data
by Zhen Shen, Jing Miao, Junjie Wang, Demei Zhao, Aowei Tang and Jianing Zhen
Remote Sens. 2023, 15(23), 5621; https://doi.org/10.3390/rs15235621 - 04 Dec 2023
Cited by 1 | Viewed by 1113
Abstract
Mangrove forests, mostly found in the intertidal zone, are among the highest-productivity ecosystems and have great ecological and economic value. The accurate mapping of mangrove forests is essential for the scientific management and restoration of mangrove ecosystems. However, it is still challenging to [...] Read more.
Mangrove forests, mostly found in the intertidal zone, are among the highest-productivity ecosystems and have great ecological and economic value. The accurate mapping of mangrove forests is essential for the scientific management and restoration of mangrove ecosystems. However, it is still challenging to perform the rapid and accurate information mapping of mangrove forests due to the complexity of mangrove forests themselves and their environments. Utilizing multi-source remote sensing data is an effective approach to address this challenge. Feature extraction and selection, as well as the selection of classification models, are crucial for accurate mangrove mapping using multi-source remote sensing data. This study constructs multi-source feature sets based on optical (Sentinel-2) and SAR (synthetic aperture radar) (C-band: Sentinel-1; L-band: ALOS-2) remote sensing data, aiming to compare the impact of three feature selection methods (RFS, random forest; ERT, extremely randomized tree; MIC, maximal information coefficient) and four machine learning algorithms (DT, decision tree; RF, random forest; XGBoost, extreme gradient boosting; LightGBM, light gradient-boosting machine) on classification accuracy, identify sensitive feature variables that contribute to mangrove mapping, and formulate a classification framework for accurately recognizing mangrove forests. The experimental results demonstrated that using the feature combination selected via the ERT method could obtain higher accuracy with fewer features compared to other methods. Among the feature combinations, the visible bands, shortwave infrared bands, and the vegetation indices constructed from these bands contributed the greatest to the classification accuracy. The classification performance of optical data was significantly better than SAR data in terms of data sources. The combination of optical and SAR data could improve the accuracy of mangrove mapping to a certain extent (0.33% to 4.67%), which is essential for the research of mangrove mapping in a larger area. The XGBoost classification model performed optimally in mangrove mapping, with the highest overall accuracy of 95.00% among all the classification models. The results of the study show that combining optical and SAR remote sensing data with the ERT feature selection method and XGBoost classification model has great potential for accurate mangrove mapping at a regional scale, which is important for mangrove restoration and protection and provides a reliable database for mangrove scientific management. Full article
(This article belongs to the Special Issue GIS and Remote Sensing in Ocean and Coastal Ecology)
Show Figures

Graphical abstract

25 pages, 5631 KiB  
Article
Learn by Yourself: A Feature-Augmented Self-Distillation Convolutional Neural Network for Remote Sensing Scene Image Classification
by Cuiping Shi, Mengxiang Ding, Liguo Wang and Haizhu Pan
Remote Sens. 2023, 15(23), 5620; https://doi.org/10.3390/rs15235620 - 04 Dec 2023
Viewed by 957
Abstract
In recent years, with the rapid development of deep learning technology, great progress has been made in remote sensing scene image classification. Compared with natural images, remote sensing scene images are usually more complex, with high inter-class similarity and large intra-class differences, which [...] Read more.
In recent years, with the rapid development of deep learning technology, great progress has been made in remote sensing scene image classification. Compared with natural images, remote sensing scene images are usually more complex, with high inter-class similarity and large intra-class differences, which makes it difficult for commonly used networks to effectively learn the features of remote sensing scene images. In addition, most existing methods adopt hard labels to supervise the network model, which makes the model prone to losing fine-grained information of ground objects. In order to solve these problems, a feature-augmented self-distilled convolutional neural network (FASDNet) is proposed. First, ResNet34 is adopted as the backbone network to extract multi-level features of images. Next, a feature augmentation pyramid module (FAPM) is designed to extract and fuse multi-level feature information. Then, auxiliary branches are constructed to provide additional supervision information. The self-distillation method is utilized between the feature augmentation pyramid module and the backbone network, as well as between the backbone network and auxiliary branches. Finally, the proposed model is jointly supervised using feature distillation loss, logits distillation loss, and cross-entropy loss. A lot of experiments are conducted on four widely used remote sensing scene image datasets, and the experimental results show that the proposed method is superior to some state-ot-the-art classification methods. Full article
Show Figures

Figure 1

25 pages, 19930 KiB  
Article
Fusing Ascending and Descending Time-Series SAR Images with Dual-Polarized Pixel Attention UNet for Landslide Recognition
by Bin Pan and Xianjian Shi
Remote Sens. 2023, 15(23), 5619; https://doi.org/10.3390/rs15235619 - 04 Dec 2023
Viewed by 1049
Abstract
Conducting landslide recognition research holds notable practical significance for disaster management. In response to the challenges posed by noise, information redundancy, and geometric distortions in single-orbit SAR imagery during landslide recognition, this study proposes a dual-polarization SAR image landslide recognition approach that combines [...] Read more.
Conducting landslide recognition research holds notable practical significance for disaster management. In response to the challenges posed by noise, information redundancy, and geometric distortions in single-orbit SAR imagery during landslide recognition, this study proposes a dual-polarization SAR image landslide recognition approach that combines ascending and descending time-series information while considering polarization channel details to enhance the accuracy of landslide identification. The results demonstrate notable improvements in landslide recognition accuracy using the ascending and descending fusion strategy compared to single-orbit data, with F1 scores increasing by 5.19% and 8.82% in Hokkaido and Papua New Guinea, respectively. Additionally, utilizing time-series imagery in Group 2 as opposed to using only pre- and post-event images in Group 4 leads to F1 score improvements of 6.94% and 9.23% in Hokkaido and Papua New Guinea, respectively, confirming the effectiveness of time-series information in enhancing landslide recognition accuracy. Furthermore, employing dual-polarization strategies in Group 4 relative to single-polarization Groups 5 and 6 results in peak F1 score increases of 7.46% and 12.07% in Hokkaido and Papua New Guinea, respectively, demonstrating the feasibility of dual-polarization strategies. However, due to limitations in Sentinel-1 imagery resolution and terrain complexities, omissions and false alarms may arise near landslide edges. The improvements achieved in this study hold critical implications for landslide disaster assessment and provide valuable insights for further enhancing landslide recognition capabilities. Full article
(This article belongs to the Topic Landslides and Natural Resources)
Show Figures

Figure 1

17 pages, 10155 KiB  
Article
Delineation of Backfill Mining Influence Range Based on Coal Mining Subsidence Principle and Interferometric Synthetic Aperture Radar
by Yafei Yuan, Meinan Zheng, Huaizhan Li, Yu Chen, Guangli Guo, Zhe Su and Wenqi Huo
Remote Sens. 2023, 15(23), 5618; https://doi.org/10.3390/rs15235618 - 04 Dec 2023
Cited by 1 | Viewed by 753
Abstract
The present study explores a three-dimensional deformation monitoring method for the better delineation of the surface subsidence range in coal mining by combining the mining subsidence law with the geometries of SAR imaging. The mining surface subsidence of the filling working face in [...] Read more.
The present study explores a three-dimensional deformation monitoring method for the better delineation of the surface subsidence range in coal mining by combining the mining subsidence law with the geometries of SAR imaging. The mining surface subsidence of the filling working face in Shandong, China, from March 2018 to June 2021, was obtained with 97 elements of Sentinel-1A data, the small baseline subset (SBAS) technique, and the proposed method, respectively. By comparison with the ground leveling of 46 observation stations, it is shown that the average standard deviation of the SBAS monitoring results is 10.3 mm; with this deviation, it is difficult to satisfy the requirements for the delimitation of the mining impact area. Meanwhile, the average standard deviation of the vertical deformation obtained by the proposed method is 6.2 mm. Compared to the SBAS monitoring accuracy, the monitoring accuracy of the proposed method is increased by 39.8%; thus, it meets the requirements for the precise delineation of the surface subsidence range for backfill mining. Full article
(This article belongs to the Section Environmental Remote Sensing)
Show Figures

Figure 1

21 pages, 4327 KiB  
Article
Research on the Extraction Method Comparison and Spatial-Temporal Pattern Evolution for the Built-Up Area of Hefei Based on Multi-Source Data Fusion
by Jianwei Huang, Chaoqun Chu, Lu Wang, Zhaofu Wu, Chunju Zhang, Jun Geng, Yongchao Zhu and Min Yu
Remote Sens. 2023, 15(23), 5617; https://doi.org/10.3390/rs15235617 - 04 Dec 2023
Viewed by 2383
Abstract
With the development of urban built-up areas, accurately extracting the urban built-up area and spatiotemporal pattern evolution trends could be valuable for understanding urban sprawl and human activities. Considering the coarse spatial resolution of nighttime light (NTL) data and the inaccurate regional boundary [...] Read more.
With the development of urban built-up areas, accurately extracting the urban built-up area and spatiotemporal pattern evolution trends could be valuable for understanding urban sprawl and human activities. Considering the coarse spatial resolution of nighttime light (NTL) data and the inaccurate regional boundary reflection on point of interest (POI) data, land surface temperature (LST) data were introduced. A composite index method (LJ–POI–LST) was proposed based on the positive relationship for extracting the boundary and reflecting the spatial-temporal evolution of urban built-up areas involving the NTL, POIs, and LST data from 1993 to 2018 in this paper. This paper yielded the following results: (1) There was a spatial-temporal pattern evolution from north-east to south-west with a primary quadrant orientation of IV, V, and VI in the Hefei urban area from 1993–2018. The medium-speed expansion rate, with an average value of 14.3 km2/a, was much faster than the population growth rate. The elasticity expansion coefficient of urbanization of 1.93 indicated the incongruous growth rate between the urban area and population, leading to an incoordinate and unreasonable development trend in Hefei City. (2) The detailed extraction accuracy for urban and rural junctions, urban forest parks, and other error-prone areas was improved, and the landscape connectivity and fragmentation were optimized according to the LJ–POI–LST composite index based on a high-resolution remote sensing validation image in the internal spatial structure. (3) Compared to the conventional NTL data and the LJ–POI index, the LJ–POI–LST composite index method displayed an extraction accuracy greater than 85%, with a similar statistical and landscape pattern index result. This paper provides a suitable method for the positive relationship among these LST, NTL, and POI data for accurately extracting the boundary and reflecting the spatial-temporal evolution of urban built-up areas by the fusion data. Full article
(This article belongs to the Special Issue Application of Photogrammetry and Remote Sensing in Urban Areas)
Show Figures

Figure 1

26 pages, 37177 KiB  
Article
An Integrated Approach for 3D Solar Potential Assessment at the City Scale
by Hassan Waqas, Yuhong Jiang, Jianga Shang, Iqra Munir and Fahad Ullah Khan
Remote Sens. 2023, 15(23), 5616; https://doi.org/10.3390/rs15235616 - 03 Dec 2023
Cited by 1 | Viewed by 1555
Abstract
The use of solar energy has shown the fastest global growth of all renewable energy sources. Efforts towards careful evaluation are required to select optimal locations for the installation of photovoltaics (PV) because their effectiveness is strongly reliant on exposure to solar irradiation. [...] Read more.
The use of solar energy has shown the fastest global growth of all renewable energy sources. Efforts towards careful evaluation are required to select optimal locations for the installation of photovoltaics (PV) because their effectiveness is strongly reliant on exposure to solar irradiation. Assessing the shadows cast by nearby buildings and vegetation is essential, especially at the city scale. Due to urban complexity, conventional methods using Digital Surface Models (DSM) overestimate solar irradiation in dense urban environments. To provide further insights into this dilemma, a new modeling technique was developed for integrated 3D city modeling and solar potential assessment on building roofs using light detection and ranging (LiDAR) data. The methodology used hotspot analysis to validate the workflow in both site and without-site contexts (e.g., trees that shield small buildings). Field testing was conducted, covering a total area of 4975 square miles and 10,489 existing buildings. The results demonstrate a considerable impact of large, dense trees on the solar irradiation received by smaller buildings. Considering the site’s context, a mean annual solar estimate of 99.97 kWh/m2/year was determined. Without considering the site context, this value increased by 9.3% (as a percentage of total rooftops) to 109.17 kWh/m2/year, with a peak in July and troughs in December and January. The study suggests that both factors have a substantial impact on solar potential estimations, emphasizing the importance of carefully considering the shadowing effect during PV panel installation. The research findings reveal that 1517 buildings in the downtown area of Austin have high estimated radiation ranging from 4.7 to 6.9 kWh/m2/day, providing valuable insights for the identification of optimal locations highly suitable for PV installation. Additionally, this methodology can be generalized to other cities, addressing the broader demand for renewable energy solutions. Full article
Show Figures

Graphical abstract

18 pages, 5922 KiB  
Article
Weed–Crop Segmentation in Drone Images with a Novel Encoder–Decoder Framework Enhanced via Attention Modules
by Sultan Daud Khan, Saleh Basalamah and Ahmed Lbath
Remote Sens. 2023, 15(23), 5615; https://doi.org/10.3390/rs15235615 - 03 Dec 2023
Cited by 1 | Viewed by 1083
Abstract
The rapid expansion of the world’s population has resulted in an increased demand for agricultural products which necessitates the need to improve crop yields. To enhance crop yields, it is imperative to control weeds. Traditionally, weed control predominantly relied on the use of [...] Read more.
The rapid expansion of the world’s population has resulted in an increased demand for agricultural products which necessitates the need to improve crop yields. To enhance crop yields, it is imperative to control weeds. Traditionally, weed control predominantly relied on the use of herbicides; however, the indiscriminate application of herbicides presents potential hazards to both crop health and productivity. Fortunately, the advent of cutting-edge technologies such as unmanned vehicle technology (UAVs) and computer vision has provided automated and efficient solutions for weed control. These approaches leverage drone images to detect and identify weeds with a certain level of accuracy. Nevertheless, the identification of weeds in drone images poses significant challenges attributed to factors like occlusion, variations in color and texture, and disparities in scale. The utilization of traditional image processing techniques and deep learning approaches, which are commonly employed in existing methods, presents difficulties in extracting features and addressing scale variations. In order to address these challenges, an innovative deep learning framework is introduced which is designed to classify every pixel in a drone image into categories such as weed, crop, and others. In general, our proposed network adopts an encoder–decoder structure. The encoder component of the network effectively combines the Dense-inception network with the Atrous spatial pyramid pooling module, enabling the extraction of multi-scale features and capturing local and global contextual information seamlessly. The decoder component of the network incorporates deconvolution layers and attention units, namely, channel and spatial attention units (CnSAUs), which contribute to the restoration of spatial information and enhance the precise localization of weeds and crops in the images. The performance of the proposed framework is assessed using a publicly available benchmark dataset known for its complexity. The effectiveness of the proposed framework is demonstrated via comprehensive experiments, showcasing its superiority by achieving a 0.81 mean Intersection over Union (mIoU) on the challenging dataset. Full article
Show Figures

Figure 1

18 pages, 4806 KiB  
Article
Extracting Citrus in Southern China (Guangxi Region) Based on the Improved DeepLabV3+ Network
by Hao Li, Jia Zhang, Jia Wang, Zhongke Feng, Boyi Liang, Nina Xiong, Junping Zhang, Xiaoting Sun, Yibing Li and Shuqi Lin
Remote Sens. 2023, 15(23), 5614; https://doi.org/10.3390/rs15235614 - 03 Dec 2023
Cited by 1 | Viewed by 1192
Abstract
China is one of the countries with the largest citrus cultivation areas, and its citrus industry has received significant attention due to its substantial economic benefits. Traditional manual forestry surveys and remote sensing image classification tasks are labor-intensive and time-consuming, resulting in low [...] Read more.
China is one of the countries with the largest citrus cultivation areas, and its citrus industry has received significant attention due to its substantial economic benefits. Traditional manual forestry surveys and remote sensing image classification tasks are labor-intensive and time-consuming, resulting in low efficiency. Remote sensing technology holds great potential for obtaining spatial information on citrus orchards on a large scale. This study proposes a lightweight model for citrus plantation extraction that combines the DeepLabV3+ model with the convolutional block attention module (CBAM) attention mechanism, with a focus on the phenological growth characteristics of citrus in the Guangxi region. The objective is to address issues such as inaccurate extraction of citrus edges in high-resolution images, misclassification and omissions caused by intra-class differences, as well as the large number of network parameters and long training time found in classical semantic segmentation models. To reduce parameter count and improve training speed, the MobileNetV2 lightweight network is used as a replacement for the Xception backbone network in DeepLabV3+. Additionally, the CBAM is introduced to extract citrus features more accurately and efficiently. Moreover, in consideration of the growth characteristics of citrus, this study augments the feature input with additional channels to better capture and utilize key phenological features of citrus, thereby enhancing the accuracy of citrus recognition. The results demonstrate that the improved DeepLabV3+ model exhibits high reliability in citrus recognition and extraction, achieving an overall accuracy (OA) of 96.23%, a mean pixel accuracy (mPA) of 83.79%, and a mean intersection over union (mIoU) of 85.40%. These metrics represent an improvement of 11.16%, 14.88%, and 14.98%, respectively, compared to the original DeepLabV3+ model. Furthermore, when compared to classical semantic segmentation models, such as UNet and PSPNet, the proposed model achieves higher recognition accuracy. Additionally, the improved DeepLabV3+ model demonstrates a significant reduction in both parameters and training time. Generalization experiments conducted in Nanning, Guangxi Province, further validate the model’s strong generalization capabilities. Overall, this study emphasizes extraction accuracy, reduction in parameter count, adherence to timeliness requirements, and facilitation of rapid and accurate extraction of citrus plantation areas, presenting promising application prospects. Full article
(This article belongs to the Section Remote Sensing in Agriculture and Vegetation)
Show Figures

Figure 1

21 pages, 56215 KiB  
Article
Landscape Pattern of Sloping Garden Erosion Based on CSLE and Multi-Source Satellite Imagery in Tropical Xishuangbanna, Southwest China
by Rui Tan, Guokun Chen, Bohui Tang, Yizhong Huang, Xianguang Ma, Zicheng Liu and Junxin Feng
Remote Sens. 2023, 15(23), 5613; https://doi.org/10.3390/rs15235613 - 03 Dec 2023
Cited by 1 | Viewed by 1053
Abstract
Inappropriate soil management accelerates soil erosion and thus poses a serious threat to food security and biodiversity. Due to poor data availability and fragmented terrain, the landscape pattern of garden erosion in tropical Xishuangbanna is not clear. In this study, by integrating multi-source [...] Read more.
Inappropriate soil management accelerates soil erosion and thus poses a serious threat to food security and biodiversity. Due to poor data availability and fragmented terrain, the landscape pattern of garden erosion in tropical Xishuangbanna is not clear. In this study, by integrating multi-source satellite imagery, field investigation and visual interpretation, we realized high-resolution mapping of gardens and soil conservation measures at the landscape scale. The Chinese Soil Loss Equation (CSLE) model was then performed to estimate the garden erosion rates and to identify critical erosion-prone areas; the landscape pattern of soil erosion was further discussed. Results showed the following: (1) For the three major plantations, teas have the largest degree of fragmentation and orchards suffer the highest soil erosion rate, while rubbers show the largest patch area, aggregation degree and soil erosion ratio. (2) The average garden erosion rate is 1595.08 t·km−2a−1, resulting in an annual soil loss of 9.73 × 10⁶ t. Soil erosion is more susceptible to elevation and vegetation cover rather than the slope gradient. Meanwhile, irreversible erosion rates only occur in gardens with fraction vegetation coverage (FVC) lower than 30%, and they contribute 68.19% of total soil loss with the smallest land portion, indicating that new plantations are suffering serious erosion problems. (3) Garden patches with high erosion intensity grades and aggregation indexes should be recognized as priorities for centralized treatment. For elevations near 1900 m and lowlands (<950 m), the decrease in the fractal dimension index of erosion-prone areas indicates that patches are more regular and aggregated, suggesting a more optimistic conservation situation. Full article
(This article belongs to the Special Issue Remote Sensing of Soil Erosion in Forest Area)
Show Figures

Figure 1

23 pages, 2966 KiB  
Article
DVST: Deformable Voxel Set Transformer for 3D Object Detection from Point Clouds
by Yaqian Ning, Jie Cao, Chun Bao and Qun Hao
Remote Sens. 2023, 15(23), 5612; https://doi.org/10.3390/rs15235612 - 03 Dec 2023
Viewed by 1381
Abstract
The use of a transformer backbone in LiDAR point-cloud-based models for 3D object detection has recently gained significant interest. The larger receptive field of the transformer backbone improves its representation capability but also results in excessive attention being given to background regions. To [...] Read more.
The use of a transformer backbone in LiDAR point-cloud-based models for 3D object detection has recently gained significant interest. The larger receptive field of the transformer backbone improves its representation capability but also results in excessive attention being given to background regions. To solve this problem, we propose a novel approach called deformable voxel set attention, which we utilized to create a deformable voxel set transformer (DVST) backbone for 3D object detection from point clouds. The DVST aims to efficaciously integrate the flexible receptive field of the deformable mechanism and the powerful context modeling capability of the transformer. Specifically, we introduce the deformable mechanism into voxel-based set attention to selectively transfer candidate keys and values of foreground queries to important regions. An offset generation module was designed to learn the offsets of the foreground queries. Furthermore, a globally responsive convolutional feed-forward network with residual connection is presented to capture global feature interactions in hidden space. We verified the validity of the DVST on the KITTI and Waymo open datasets by constructing single-stage and two-stage models. The findings indicated that the DVST enhanced the average precision of the baseline model while preserving computational efficiency, achieving a performance comparable to state-of-the-art methods. Full article
Show Figures

Graphical abstract

21 pages, 2913 KiB  
Article
Interactive Change-Aware Transformer Network for Remote Sensing Image Change Captioning
by Chen Cai, Yi Wang and Kim-Hui Yap
Remote Sens. 2023, 15(23), 5611; https://doi.org/10.3390/rs15235611 - 03 Dec 2023
Cited by 2 | Viewed by 1094
Abstract
Remote sensing image change captioning (RSICC) aims to automatically generate sentences describing the difference in content in remote sensing bitemporal images. Recent works extract the changes between bitemporal features and employ a hierarchical approach to fuse multiple changes of interest, yielding change captions. [...] Read more.
Remote sensing image change captioning (RSICC) aims to automatically generate sentences describing the difference in content in remote sensing bitemporal images. Recent works extract the changes between bitemporal features and employ a hierarchical approach to fuse multiple changes of interest, yielding change captions. However, these methods directly aggregate all features, potentially incorporating non-change-focused information from each encoder layer into the change caption decoder, adversely affecting the performance of change captioning. To address this problem, we proposed an Interactive Change-Aware Transformer Network (ICT-Net). ICT-Net is able to extract and incorporate the most critical changes of interest in each encoder layer to improve change description generation. It initially extracts bitemporal visual features from the CNN backbone and employs an Interactive Change-Aware Encoder (ICE) to capture the crucial difference between these features. Specifically, the ICE captures the most change-aware discriminative information between the paired bitemporal features interactively through difference and content attention encoding. A Multi-Layer Adaptive Fusion (MAF) module is proposed to adaptively aggregate the relevant change-aware features in the ICE layers while minimizing the impact of irrelevant visual features. Moreover, we extend the ICE to extract multi-scale changes and introduce a novel Cross Gated-Attention (CGA) module into the change caption decoder to select essential discriminative multi-scale features to improve the change captioning performance. We evaluate our method on two RSICC datasets (e.g., LEVIR-CC and LEVIRCCD), and the experimental results demonstrate that our method achieves a state-of-the-art performance. Full article
(This article belongs to the Section Remote Sensing Image Processing)
Show Figures

Figure 1

24 pages, 6085 KiB  
Article
SSCNet: A Spectrum-Space Collaborative Network for Semantic Segmentation of Remote Sensing Images
by Xin Li, Feng Xu, Xi Yong, Deqing Chen, Runliang Xia, Baoliu Ye, Hongmin Gao, Ziqi Chen and Xin Lyu
Remote Sens. 2023, 15(23), 5610; https://doi.org/10.3390/rs15235610 - 03 Dec 2023
Cited by 2 | Viewed by 1102
Abstract
Semantic segmentation plays a pivotal role in the intelligent interpretation of remote sensing images (RSIs). However, conventional methods predominantly focus on learning representations within the spatial domain, often resulting in suboptimal discriminative capabilities. Given the intrinsic spectral characteristics of RSIs, it becomes imperative [...] Read more.
Semantic segmentation plays a pivotal role in the intelligent interpretation of remote sensing images (RSIs). However, conventional methods predominantly focus on learning representations within the spatial domain, often resulting in suboptimal discriminative capabilities. Given the intrinsic spectral characteristics of RSIs, it becomes imperative to enhance the discriminative potential of these representations by integrating spectral context alongside spatial information. In this paper, we introduce the spectrum-space collaborative network (SSCNet), which is designed to capture both spectral and spatial dependencies, thereby elevating the quality of semantic segmentation in RSIs. Our innovative approach features a joint spectral–spatial attention module (JSSA) that concurrently employs spectral attention (SpeA) and spatial attention (SpaA). Instead of feature-level aggregation, we propose the fusion of attention maps to gather spectral and spatial contexts from their respective branches. Within SpeA, we calculate the position-wise spectral similarity using the complex spectral Euclidean distance (CSED) of the real and imaginary components of projected feature maps in the frequency domain. To comprehensively calculate both spectral and spatial losses, we introduce edge loss, Dice loss, and cross-entropy loss, subsequently merging them with appropriate weighting. Extensive experiments on the ISPRS Potsdam and LoveDA datasets underscore SSCNet’s superior performance compared with several state-of-the-art methods. Furthermore, an ablation study confirms the efficacy of SpeA. Full article
(This article belongs to the Special Issue Multisource Remote Sensing Image Interpretation and Application)
Show Figures

Figure 1

21 pages, 15312 KiB  
Article
Enhancing Leaf Area Index Estimation with MODIS BRDF Data by Optimizing Directional Observations and Integrating PROSAIL and Ross–Li Models
by Hu Zhang, Xiaoning Zhang, Lei Cui, Yadong Dong, Yan Liu, Qianrui Xi, Hongtao Cao, Lei Chen and Yi Lian
Remote Sens. 2023, 15(23), 5609; https://doi.org/10.3390/rs15235609 - 02 Dec 2023
Viewed by 1945
Abstract
The Leaf Area Index (LAI) is a crucial vegetation parameter for climate and ecological models. Reflectance anisotropy contains valuable supplementary information for the retrieval of properties of an observed target surface. Previous studies have utilized multi-angular reflectance data and physically based Bidirectional Reflectance [...] Read more.
The Leaf Area Index (LAI) is a crucial vegetation parameter for climate and ecological models. Reflectance anisotropy contains valuable supplementary information for the retrieval of properties of an observed target surface. Previous studies have utilized multi-angular reflectance data and physically based Bidirectional Reflectance Distribution Function (BRDF) models with detailed vegetation structure descriptions for LAI estimation. However, the optimal selection of viewing angles for improved inversion results has received limited attention. By optimizing directional observations and integrating the PROSAIL and Ross–Li models, this study aims to enhance LAI estimation from MODIS BRDF data. A dataset of 20,000 vegetation parameter combinations was utilized to identify the directions in which the PROSAIL model exhibits higher sensitivity to LAI changes and better consistency with the Ross–Li BRDF models. The results reveal significant variations in the sensitivity of the PROSAIL model to LAI changes and its consistency with the Ross–Li model over the viewing hemisphere. In the red band, directions with high sensitivity to LAI changes and strong model consistency are mainly found at smaller solar and viewing zenith angles. In the near-infrared band, these directions are distributed at positions with larger solar and viewing zenith angles. Validation using field measurements and LAI maps demonstrates that the proposed method achieves comparable accuracy to an algorithm utilizing 397 viewing angles by utilizing reflectance data from only 30 directions. Moreover, there is a significant improvement in computational efficiency. The accuracy of LAI estimation obtained from simulated multi-angle data is relatively high for LAI values below 3.5 when compared with the MODIS LAI product from two tiles. Additionally, there is also a slight improvement in the results when the LAI exceeds 4.5. Overall, our results highlight the potential of utilizing multi-angular reflectance in specific directions for vegetation parameter inversion, showcasing the promise of this method for large-scale LAI estimation. Full article
Show Figures

Figure 1

24 pages, 13702 KiB  
Article
Dual-Channel Semi-Supervised Adversarial Network for Building Segmentation from UAV-Captured Images
by Wenzheng Zhang, Changyue Wu, Weidong Man and Mingyue Liu
Remote Sens. 2023, 15(23), 5608; https://doi.org/10.3390/rs15235608 - 02 Dec 2023
Viewed by 1068
Abstract
Accurate building extraction holds paramount importance in various applications such as urbanization rate calculations, urban planning, and resource allocation. In response to the escalating demand for precise low-altitude unmanned aerial vehicle (UAV) building segmentation in intricate scenarios, this study introduces a semi-supervised methodology [...] Read more.
Accurate building extraction holds paramount importance in various applications such as urbanization rate calculations, urban planning, and resource allocation. In response to the escalating demand for precise low-altitude unmanned aerial vehicle (UAV) building segmentation in intricate scenarios, this study introduces a semi-supervised methodology to alleviate the labor-intensive process of procuring pixel-level annotations. Within the framework of adversarial networks, we employ a dual-channel parallel generator strategy that amalgamates the morphology-driven optical flow estimation channel with an enhanced multilayer sensing Deeplabv3+ module. This approach aims to comprehensively capture both the morphological attributes and textural intricacies of buildings while mitigating the dependency on annotated data. To further enhance the network’s capability to discern building features, we introduce an adaptive attention mechanism via a feature fusion module. Additionally, we implement a composite loss function to augment the model’s sensitivity to building structures. Across two distinct low-altitude UAV datasets within the domain of UAV-based building segmentation, our proposed method achieves average mean pixel intersection-over-union (mIoU) ratios of 82.69% and 79.37%, respectively, with unlabeled data constituting 70% of the overall dataset. These outcomes signify noteworthy advancements compared with contemporaneous networks, underscoring the robustness of our approach in tackling intricate building segmentation challenges in the domain of UAV-based architectural analysis. Full article
(This article belongs to the Special Issue Remote Sensing and SAR for Building Monitoring)
Show Figures

Graphical abstract

24 pages, 21652 KiB  
Article
A Multi-Source-Data-Assisted AUV for Path Cruising: An Energy-Efficient DDPG Approach
by Tianyu Xing, Xiaohao Wang, Kaiyang Ding, Kai Ni and Qian Zhou
Remote Sens. 2023, 15(23), 5607; https://doi.org/10.3390/rs15235607 - 02 Dec 2023
Viewed by 971
Abstract
As marine activities expand, deploying underwater autonomous vehicles (AUVs) becomes critical. Efficiently navigating these AUVs through intricate underwater terrains is vital. This paper proposes a sophisticated motion-planning algorithm integrating deep reinforcement learning (DRL) with an improved artificial potential field (IAPF). The algorithm incorporates [...] Read more.
As marine activities expand, deploying underwater autonomous vehicles (AUVs) becomes critical. Efficiently navigating these AUVs through intricate underwater terrains is vital. This paper proposes a sophisticated motion-planning algorithm integrating deep reinforcement learning (DRL) with an improved artificial potential field (IAPF). The algorithm incorporates remote sensing information to overcome traditional APF challenges and combines the IAPF with the traveling salesman problem for optimal path cruising. Through a combination of DRL and multi-source data optimization, the approach ensures minimal energy consumption across all target points. Inertial sensors further refine trajectory, ensuring smooth navigation and precise positioning. The comparative experiments confirm the method’s energy efficiency, trajectory refinement, and safety excellence. Full article
(This article belongs to the Topic Artificial Intelligence in Navigation)
Show Figures

Figure 1

19 pages, 8205 KiB  
Article
Investigation on the Utilization of Millimeter-Wave Radars for Ocean Wave Monitoring
by Xindi Liu, Yunhua Wang, Fushun Liu and Yuting Zhang
Remote Sens. 2023, 15(23), 5606; https://doi.org/10.3390/rs15235606 - 02 Dec 2023
Viewed by 901
Abstract
The feasibility of using millimeter-wave radars for wave observations was investigated in this study. The radars used in this study operate at a center frequency of 77.572 GHz. To investigate the feasibility of wave observations and extract one-dimensional and two-dimensional wave spectra, arrays [...] Read more.
The feasibility of using millimeter-wave radars for wave observations was investigated in this study. The radars used in this study operate at a center frequency of 77.572 GHz. To investigate the feasibility of wave observations and extract one-dimensional and two-dimensional wave spectra, arrays consisting of multiple radar units were deployed for observations in both laboratory and field environments. Based on the data measured with the millimeter-wave radars, one-dimensional wave spectra and two-dimensional wave directional spectra were evaluated using the periodogram method and the Bayesian directional spectrum estimation method (BDM), respectively. Meanwhile, wave parameters such as the significant wave height, wave period, and wave direction were also calculated. Via comparative experiments with a capacitive wave height meter in a wave tank and RADAC’s WG5-HT-CP radar in an offshore field, the viability of using millimeter-wave radars to observe water waves was validated. The results indicate that the one-dimensional wave spectra measured with the millimeter-wave radars were consistent with those measured with the mature commercial capacitive wave height meter and the WG5-HT-CP wave radar. Via wave direction measurement experiments conducted in a wave tank and offshore environment, it is evident that the wave directions retrieved with the millimeter-wave radars were in good alignment with the actual wave directions. Full article
Show Figures

Figure 1

36 pages, 66724 KiB  
Review
Planetary Radar—State-of-the-Art Review
by Anne K. Virkki, Catherine D. Neish, Edgard G. Rivera-Valentín, Sriram S. Bhiravarasu, Dylan C. Hickson, Michael C. Nolan and Roberto Orosei
Remote Sens. 2023, 15(23), 5605; https://doi.org/10.3390/rs15235605 - 02 Dec 2023
Viewed by 6817
Abstract
Planetary radar observations have provided invaluable information on the solar system through both ground-based and space-based observations. In this overview article, we summarize how radar observations have contributed in planetary science, how the radar technology as a remote-sensing method for planetary exploration and [...] Read more.
Planetary radar observations have provided invaluable information on the solar system through both ground-based and space-based observations. In this overview article, we summarize how radar observations have contributed in planetary science, how the radar technology as a remote-sensing method for planetary exploration and the methods to interpret the radar data have advanced in the eight decades of increasing use, where the field stands in the early 2020s, and what are the future prospects of the ground-based facilities conducting planetary radar observations and the planned spacecraft missions equipped with radar instruments. The focus of the paper is on radar as a remote-sensing technique using radar instruments in spacecraft orbiting planetary objects and in Earth-based radio telescopes, whereas ground-penetrating radar systems on landers are mentioned only briefly. The key scientific developments are focused on the search for water ice in the subsurface of the Moon, which could be an invaluable in situ resource for crewed missions, dynamical and physical characterization of near-Earth asteroids, which is also crucial for effective planetary defense, and a better understanding of planetary geology. Full article
(This article belongs to the Special Issue Radar for Planetary Exploration)
Show Figures

Figure 1

22 pages, 16268 KiB  
Article
Satellite and High-Spatio-Temporal Resolution Data Collected by Southern Elephant Seals Allow an Unprecedented 3D View of the Argentine Continental Shelf
by Melina M. Martinez, Laura A. Ruiz-Etcheverry, Martin Saraceno, Anatole Gros-Martial, Julieta Campagna, Baptiste Picard and Christophe Guinet
Remote Sens. 2023, 15(23), 5604; https://doi.org/10.3390/rs15235604 - 02 Dec 2023
Viewed by 2305
Abstract
High spatial and temporal resolution hydrographic data collected by Southern Elephant Seals (Mirounga leonina, SESs) and satellite remote sensing data allow a detailed oceanographic description of the Argentine Continental Shelf (ACS). In-situ data were obtained from the CTD (Conductivity, Temperature, and Depth), [...] Read more.
High spatial and temporal resolution hydrographic data collected by Southern Elephant Seals (Mirounga leonina, SESs) and satellite remote sensing data allow a detailed oceanographic description of the Argentine Continental Shelf (ACS). In-situ data were obtained from the CTD (Conductivity, Temperature, and Depth), accelerometer, and hydrophone sensors attached to five SESs that crossed the ACS between the 17th and 31st of October 2019. The analysis of the temperature (T) and salinity (S) along the trajectories allowed us to identify two different regions: north and south of 42°S. Satellite Sea Surface Temperature (SST) data suggests that north of 42°S, warm waters are coming from the San Matias Gulf (SMG). The high spatio-temporal resolution of the in-situ data shows regions with intense gradients along the T and S sections that were associated with a seasonal front that develops north of Península Valdés in winter due to the entrance of cold and fresh water to the SMG. The speed of the SESs is correlated with tidal currents in the coastal portion of the northern region, which is in good agreement with the macrotidal regime observed. A large number of Prey Catch Attempts (PCA), a measure obtained from the accelerometer sensor, indicates that SESs also feed in this region, contradicting suggestions from previous works. The analysis of wind intensity estimated from acoustic sensors allowed us to rule out the local wind as the cause of fast thermocline breakups observed along the SESs trajectories. Finally, we show that the maximum depth reached by the elephant seals can be used to detect errors in the bathymetry charts. Full article
(This article belongs to the Special Issue Oceans from Space V)
Show Figures

Graphical abstract

23 pages, 7675 KiB  
Article
Satellite-Based Localization of IoT Devices Using Joint Doppler and Angle-of-Arrival Estimation
by Iza S. Mohamad Hashim and Akram Al-Hourani
Remote Sens. 2023, 15(23), 5603; https://doi.org/10.3390/rs15235603 - 02 Dec 2023
Cited by 2 | Viewed by 1100
Abstract
While global navigation satellite system (GNSS) technologies have always been the go-to solution for localization problems, they may not be the best choice for some Internet-of-Things (IoT) applications due to the incurred power consumption and cost. In this paper, we present an alternative [...] Read more.
While global navigation satellite system (GNSS) technologies have always been the go-to solution for localization problems, they may not be the best choice for some Internet-of-Things (IoT) applications due to the incurred power consumption and cost. In this paper, we present an alternative satellite-based localization method exploiting the signature of Doppler shifts and angle-of-arrival measurements as seen by a low-Earth-orbit (LEO) satellite. We first derive the joint likelihood function of the measurements, which is represented as a combination of three Gaussian distributions. Then, we show that the maximum likelihood problem reduces to a more-efficient mean squared error minimization in the Gaussian case as inferred from real measurements we collected from low-Earth-orbit satellite using a tracking ground station. Thus, we propose utilizing a stochastic optimizer to search for the global minimum of the mean squared error, which represents the location of the ground IoT device as estimated by the satellite platform. The emulated results show that the IoT device localization, in such a realistic model, can be performed with sufficient accuracy for IoT applications. Full article
(This article belongs to the Section Engineering Remote Sensing)
Show Figures

Figure 1

43 pages, 18503 KiB  
Article
Suitability of Satellite Imagery for Surveillance of Maize Ear Damage by Cotton Bollworm (Helicoverpa armigera) Larvae
by Fruzsina Enikő Sári-Barnácz, Mihály Zalai, Stefan Toepfer, Gábor Milics, Dóra Iványi, Mariann Tóthné Kun, János Mészáros, Mátyás Árvai and József Kiss
Remote Sens. 2023, 15(23), 5602; https://doi.org/10.3390/rs15235602 - 01 Dec 2023
Viewed by 1033
Abstract
The cotton bollworm (Helicoverpa armigera, Lepidoptera: Noctuidae) poses significant risks to maize. Changes in the maize plant, such as its phenology, influence the short-distance movement and oviposition of cotton bollworm adults and, thus, the distribution of the subsequent larval damage. We [...] Read more.
The cotton bollworm (Helicoverpa armigera, Lepidoptera: Noctuidae) poses significant risks to maize. Changes in the maize plant, such as its phenology, influence the short-distance movement and oviposition of cotton bollworm adults and, thus, the distribution of the subsequent larval damage. We aim to provide an overview of future approaches to the surveillance of maize ear damage by cotton bollworm larvae based on remote sensing. We focus on finding a near-optimal combination of Landsat 8 or Sentinel-2 spectral bands, vegetation indices, and maize phenology to achieve the best predictions. The study areas were 21 sweet and grain maze fields in Hungary in 2017, 2020, and 2021. Correlations among the percentage of damage and the time series of satellite images were explored. Based on our results, Sentinel-2 satellite imagery is suggested for damage surveillance, as 82% of all the extremes of the correlation coefficients were stronger, and this satellite provided 20–64% more cloud-free images. We identified that the maturity groups of maize are an essential factor in cotton bollworm surveillance. No correlations were found before canopy closure (BBCH 18). Visible bands were the most suitable for damage surveillance in mid–late grain maize (|rmedian| = 0.49–0.51), while the SWIR bands, NDWI, NDVI, and PSRI were suitable in mid–late grain maize fields (|rmedian| = 0.25–0.49) and sweet maize fields (|rmedian| = 0.24–0.41). Our findings aim to support prediction tools for cotton bollworm damage, providing information for the pest management decisions of advisors and farmers. Full article
(This article belongs to the Special Issue Spectral Imaging Technology for Crop Disease Detection)
Show Figures

Figure 1

29 pages, 14690 KiB  
Article
Polarimetric Synthetic Aperture Radar Ship Potential Area Extraction Based on Neighborhood Semantic Differences of the Latent Dirichlet Allocation Bag-of-Words Topic Model
by Weixing Qiu and Zongxu Pan
Remote Sens. 2023, 15(23), 5601; https://doi.org/10.3390/rs15235601 - 01 Dec 2023
Viewed by 826
Abstract
Recently, deep learning methods have been widely studied in the field of polarimetric synthetic aperture radar (PolSAR) ship detection. However, extracting polarimetric and spatial features on the whole PolSAR image will result in high computational complexity. In addition, in the massive data ship [...] Read more.
Recently, deep learning methods have been widely studied in the field of polarimetric synthetic aperture radar (PolSAR) ship detection. However, extracting polarimetric and spatial features on the whole PolSAR image will result in high computational complexity. In addition, in the massive data ship detection task, the image to be detected contains a large number of invalid areas, such as land and seawater without ships. Therefore, using ship coarse detection methods to quickly locate the potential areas of ships, that is, ship potential area extraction, is an important prerequisite for PolSAR ship detection. Since existing unsupervised PolSAR ship detection methods based on pixel-level features often rely on fine sea–land segmentation pre-processing and have poor applicability to images with complex backgrounds, in order to solve the abovementioned issue, this paper proposes a PolSAR ship potential area extraction method based on the neighborhood semantic differences of an LDA bag-of-words topic model. Specifically, a polarimetric feature suitable for the scattering diversity condition is selected, and a polarimetric feature map is constructed; the superpixel segmentation method is used to generate the bag of words on the feature map, and latent high-level semantic features are extracted and classified with the improved LDA bag-of-words topic model method to obtain the PolSAR ship potential area extraction result, i.e., the PolSAR ship coarse detection result. The experimental results on the self-established PolSAR dataset validate the effectiveness and demonstrate the superiority of our method. Full article
Show Figures

Graphical abstract

25 pages, 9398 KiB  
Article
Variations and Depth of Formation of Submesoscale Eddy Structures in Satellite Ocean Color Data in the Southwestern Region of the Peter the Great Bay
by Nadezhda A. Lipinskaya, Pavel A. Salyuk and Irina A. Golik
Remote Sens. 2023, 15(23), 5600; https://doi.org/10.3390/rs15235600 - 01 Dec 2023
Viewed by 917
Abstract
The aim of this study was to develop methods for determining the most significant contrasts in satellite ocean color data arising in the presence of a submesoscale eddy structure, as well as to determine the corresponding depths of the upper layer of the [...] Read more.
The aim of this study was to develop methods for determining the most significant contrasts in satellite ocean color data arising in the presence of a submesoscale eddy structure, as well as to determine the corresponding depths of the upper layer of the sea where these contrasts are formed. The research was carried out on the example of the chain of submesoscale eddies identified in the Tumen River water transport area in the Japan/East Sea. MODIS Aqua/Terra satellite data of the remotely sensed reflectance (Rrs) and Rrs band ratio at various wavelengths, chlorophyll-a concentration, and, for comparison, sea surface temperature (sst) were analyzed. Additionally, the results of ship surveys in September 2009 were used to study the influence of eddy vertical structure on the obtained remote characteristics. The best characteristic for detecting the studied eddies in satellite ocean color data was the MODIS chlor_a standard product, which is an estimate of chlorophyll-a concentration obtained by a combination of the three-band reflectance difference algorithm (CI) for low concentrations and the band-ratio algorithm (OCx) for high concentrations. At the same time, the weakest contrasts were in sst data due to similar water heating inside and outside the eddies. The best eddy contrast-to-noise ratio according to Rrs spectra is achieved at 547 nm in the spectral region of seawater with maximum transparency and low relative errors of measurements. The Rrs at 678 nm and associated products may be a significant characteristic for eddy detection if there are many phytoplankton in the eddy waters. The maximum depth of the remotely sensed contrast formation of the considered eddy vertical structure was ~6 m, which was significantly less than the maximum spectral penetration depth of solar radiation for remote sensing, which was in the 14–17 m range. The results obtained can be used to determine the characteristics that provide the best contrast for detecting eddy structures in remotely sensed reflectance data and to improve the interpretation of remote spectral ocean color data in the areas of eddies activity. Full article
(This article belongs to the Special Issue Remote Sensing Applications in Ocean Observation II)
Show Figures

Graphical abstract

17 pages, 26835 KiB  
Technical Note
The Impact of Side-Scan Sonar Resolution and Acoustic Shadow Phenomenon on the Quality of Sonar Imagery and Data Interpretation Capabilities
by Artur Grządziel
Remote Sens. 2023, 15(23), 5599; https://doi.org/10.3390/rs15235599 - 01 Dec 2023
Viewed by 1646
Abstract
Side-scan sonar is designed and used for a variety of survey work, in both military and civilian fields. These systems provide acoustic imageries that play a significant role in a variety of marine and inland applications. For this reason, it is extremely important [...] Read more.
Side-scan sonar is designed and used for a variety of survey work, in both military and civilian fields. These systems provide acoustic imageries that play a significant role in a variety of marine and inland applications. For this reason, it is extremely important that the recorded sonar image is characterized by high resolution, detail and sharpness. This article is mainly aimed at the demonstration of the impact of side-scan sonar resolution on the imaging quality. The article also presents the importance of acoustic shadow in the process of analyzing sonar data and identifying underwater objects. The real measurements were carried out using two independent survey systems: hull-mounted sonar and towed side-scan sonar. Six different shipwrecks lying in the Baltic Sea were selected as the objects of research. The results presented in the article also constitute evidence of how the sonar technology has changed over time. The survey findings show that by maintaining the appropriate operational conditions and meeting several requirements, it is possible to obtain photographic-quality sonar images, which may be crucial in the process of data interpretation and shipwreck identification. Full article
(This article belongs to the Special Issue Advances in Remote Sensing of the Inland and Coastal Water Zones II)
Show Figures

Graphical abstract

14 pages, 5158 KiB  
Article
Difference between WMO Climate Normal and Climatology: Insights from a Satellite-Based Global Cloud and Radiation Climate Data Record
by Abhay Devasthale, Karl-Göran Karlsson, Sandra Andersson and Erik Engström
Remote Sens. 2023, 15(23), 5598; https://doi.org/10.3390/rs15235598 - 01 Dec 2023
Cited by 1 | Viewed by 974
Abstract
The World Meteorological Organization (WMO) recommends that the most recent 30-year period, i.e., 1991–2020, be used to compute the climate normals of geophysical variables. A unique aspect of this recent 30-year period is that the satellite-based observations of many different essential climate variables [...] Read more.
The World Meteorological Organization (WMO) recommends that the most recent 30-year period, i.e., 1991–2020, be used to compute the climate normals of geophysical variables. A unique aspect of this recent 30-year period is that the satellite-based observations of many different essential climate variables are available during this period, thus opening up new possibilities to provide a robust, global basis for the 30-year reference period in order to allow climate-monitoring and climate change studies. Here, using the satellite-based climate data record of cloud and radiation properties, CLARA-A3, for the month of January between 1981 and 2020, we illustrate the difference between the climate normal, as defined by guidelines from WMO on calculations of 30 yr climate normals, and climatology. It is shown that this difference is strongly dependent on the climate variable in question. We discuss the impacts of the nature and availability of satellite observations, variable definition, retrieval algorithm and programmatic configuration. It is shown that the satellite-based climate data records show enormous promise in providing a climate normal for the recent 30-year period (1991–2020) globally. We finally argue that the holistic perspectives from the global satellite community should be increasingly considered while formulating the future WMO guidelines on computing climate normals. Full article
(This article belongs to the Section Environmental Remote Sensing)
Show Figures

Figure 1

21 pages, 6170 KiB  
Article
Satellite Imagery-Based Cloud Classification Using Deep Learning
by Rukhsar Yousaf, Hafiz Zia Ur Rehman, Khurram Khan, Zeashan Hameed Khan, Adnan Fazil, Zahid Mahmood, Saeed Mian Qaisar and Abdul Jabbar Siddiqui
Remote Sens. 2023, 15(23), 5597; https://doi.org/10.3390/rs15235597 - 01 Dec 2023
Cited by 2 | Viewed by 1621
Abstract
A significant amount of satellite imaging data is now easily available due to the continued development of remote sensing (RS) technology. Enabling the successful application of RS in real-world settings requires efficient and scalable solutions to extend their use in multidisciplinary areas. The [...] Read more.
A significant amount of satellite imaging data is now easily available due to the continued development of remote sensing (RS) technology. Enabling the successful application of RS in real-world settings requires efficient and scalable solutions to extend their use in multidisciplinary areas. The goal of quick analysis and precise classification in Remote Sensing Imaging (RSI) is often accomplished by utilizing approaches based on deep Convolution Neural Networks (CNNs). This research offers a unique snapshot-based residual network (SnapResNet) that consists of fully connected layers (FC-1024), batch normalization (BN), L2 regularization, dropout layers, dense layer, and data augmentation. Architectural changes overcome the inter-class similarity problem while data augmentation resolves the problem of imbalanced classes. Moreover, the snapshot ensemble technique is utilized to prevent over-fitting, thereby further improving the network’s performance. The proposed SnapResNet152 model employs the most challenging Large-Scale Cloud Images Dataset for Meteorology Research (LSCIDMR), having 10 classes with thousands of high-resolution images and classifying them into respective classes. The developed model outperforms the existing deep learning-based algorithms (e.g., AlexNet, VGG-19, ResNet101, and EfficientNet) and achieves an overall accuracy of 97.25%. Full article
(This article belongs to the Section AI Remote Sensing)
Show Figures

Graphical abstract

25 pages, 47432 KiB  
Article
Research on Deformation Evolution of a Large Toppling Based on Comprehensive Remote Sensing Interpretation and Real-Time Monitoring
by Shenghua Cui, Hui Wang, Xiangjun Pei, Luguang Luo, Bin Zeng and Tao Jiang
Remote Sens. 2023, 15(23), 5596; https://doi.org/10.3390/rs15235596 - 01 Dec 2023
Viewed by 861
Abstract
Deep, unstable slopes are highly developed in mountainous areas, especially in the Minjiang River Basin, Sichuan Province, China. In this study, to reveal their deformation evolution characteristics for stability evaluation and disaster prevention, multi-period optical remote sensing images (2010–2019), SBAS-InSAR data (January 2018–December [...] Read more.
Deep, unstable slopes are highly developed in mountainous areas, especially in the Minjiang River Basin, Sichuan Province, China. In this study, to reveal their deformation evolution characteristics for stability evaluation and disaster prevention, multi-period optical remote sensing images (2010–2019), SBAS-InSAR data (January 2018–December 2019), and on-site real-time monitoring (December 2017–September 2020) were utilized to monitor the deformation of a large deep-seated toppling, named the Tizicao (TZC) Toppling. The obtained results by different techniques were cross-validated and synthesized in order to introduce the spatial and temporal characteristics of the toppling. It was found that the displacements on the north side of the toppling are much larger than those on the south side, and the leading edge exhibits a composite damage pattern of “collapse failure” and “bulging cracking”. The development process of the toppling from the formation of a tensile crack at the northern leading edge to the gradual pulling of the rear edge was revealed for a time span of up to ten years. In addition, the correlation between rainfall, earthquakes, and GNSS time series showed that the deformation of the toppling is sensitive to rainfall but does not change under the effect of earthquakes. The surface-displacement-monitoring method in this study can provide a reference for the evolution analysis of unstable slopes with a large span of deformation. Full article
Show Figures

Figure 1

Previous Issue
Back to TopTop