Article

Fusing Ascending and Descending Time-Series SAR Images with Dual-Polarized Pixel Attention UNet for Landslide Recognition

1
School of Remote Sensing and Information Engineering, Wuhan University, Wuhan 430079, China
2
Hubei Luojia Laboratory, Wuhan 430079, China
*
Author to whom correspondence should be addressed.
Remote Sens. 2023, 15(23), 5619; https://doi.org/10.3390/rs15235619
Submission received: 19 September 2023 / Revised: 5 November 2023 / Accepted: 2 December 2023 / Published: 4 December 2023
(This article belongs to the Topic Landslides and Natural Resources)

Abstract

:
Conducting landslide recognition research holds notable practical significance for disaster management. In response to the challenges posed by noise, information redundancy, and geometric distortions in single-orbit SAR imagery during landslide recognition, this study proposes a dual-polarization SAR image landslide recognition approach that combines ascending and descending time-series information while considering polarization channel details to enhance the accuracy of landslide identification. The results demonstrate notable improvements in landslide recognition accuracy using the ascending and descending fusion strategy compared to single-orbit data, with F1 scores increasing by 5.19% and 8.82% in Hokkaido and Papua New Guinea, respectively. Additionally, utilizing time-series imagery in Group 2 as opposed to using only pre- and post-event images in Group 4 leads to F1 score improvements of 6.94% and 9.23% in Hokkaido and Papua New Guinea, respectively, confirming the effectiveness of time-series information in enhancing landslide recognition accuracy. Furthermore, employing dual-polarization strategies in Group 4 relative to single-polarization Groups 5 and 6 results in peak F1 score increases of 7.46% and 12.07% in Hokkaido and Papua New Guinea, respectively, demonstrating the feasibility of dual-polarization strategies. However, due to limitations in Sentinel-1 imagery resolution and terrain complexities, omissions and false alarms may arise near landslide edges. The improvements achieved in this study hold critical implications for landslide disaster assessment and provide valuable insights for further enhancing landslide recognition capabilities.

1. Introduction

Landslides, commonly occurring natural disasters in human society, are often triggered by factors such as heavy rainfall and earthquakes [1,2]. Over the past few decades, with the increased activity in climate change and geological events, many regions worldwide have witnessed a rising trend in the frequency and severity of landslides [3,4]. As a highly destructive natural calamity, landslides not only pose a threat to human lives but also have a significant impact on infrastructure and the ecological environment, among other aspects [5]. Therefore, researching landslide identification is crucial for disaster management and risk analysis [6].
Initially, landslide identification heavily relied on manual field surveys, wherein geological experts needed to visit disaster-affected areas for on-site inspections and to create landslide maps [7]. Manual field surveys have inherent limitations, including potential hazards in disaster areas and transportation challenges [8,9]. With the advancement of optical satellite remote sensing technology and machine learning algorithms, researchers have proposed various landslide identification and interpretation methods by analyzing visual images taken before and after the disaster events in the affected areas [10,11,12,13].
Nevertheless, weather conditions and cloud cover interference can affect optical satellite remote sensing approaches, potentially leading to data gaps or reduced data quality [14]. In numerous instances, acquiring initial cloud-free, high-quality post-disaster visual images may entail waiting several months or even longer [15,16]. To expedite landslide mapping, researchers have focused on utilizing Synthetic Aperture Radar (SAR) satellite imagery, which possesses cloud-penetrating capabilities, for landslide identification studies. SAR technology uses radar waves for imaging, offering all-weather and all-day imaging capabilities and high-resolution imaging of the Earth’s surface [17,18].
Compared to optical satellites, SAR satellites demonstrate decreased sensitivity to weather conditions, lighting, and cloud cover, allowing them to maintain stable performance even during nighttime and adverse weather conditions [19]. SAR satellite imagery comprises two crucial parameters: amplitude and phase. Amplitude refers to the signal strength of the electromagnetic wave returns measured by the SAR sensor, which is typically unaffected by surface coverage or vegetation obstruction. Conversely, the phase conveys vital surface deformation and displacement information in the returned electromagnetic wave signal [20]. Landslide events significantly affect SAR echo signals, leading to abnormal changes in SAR detection information (including amplitude and phase) over landslide areas before and after the events [21]. In light of this phenomenon, scholars have begun exploring various SAR-based methods for landslide extraction and have demonstrated the potential of SAR data in landslide identification tasks [22].
Dong et al. [23] conducted a case study in Danba County, southwest China, using InSAR technology and SAR phase data from the ALOS PALSAR and ENVISAT ASAR satellites, successfully identifying landslides and measuring their displacement. Liu et al. [24], employing InSAR technology and Sentinel-1 SAR phase data, successfully identified nine geological landslides by increasing the number of measurement points on slopes in complex mountainous regions and conducted monitoring and quantitative analysis of deformation in these geological landslides. Yang et al. [25], combining InSAR technology, Sentinel-1 SAR phase data, optical imagery, and field surveys, conducted a landslide identification study in southwest China’s high mountains and valleys of the Nujiang River Basin. The results revealed the identification of 28 landslides, with 13 identified using Sentinel-1 SAR imagery, 8 using optical imagery, and 7 confirmed through field surveys. This research contributes to a better understanding of the landslide identification capabilities of SAR phase data.
It is worth noting that using the SAR phase for landslide identification is subject to limitations, including requirements for regional coherence, data processing complexity, and subtle phase changes in landslides [26,27,28,29]. SAR amplitude is another critical parameter measured by SAR sensors and is typically less susceptible to coherence-related issues than the SAR phase. When landslide events occur, surface characteristics and shapes often change, such as displacement, movement, or deformation of soil or rock formations [30]. These changes can affect the scattering properties of electromagnetic waves, resulting in variations in the measured SAR amplitude values.
Niu et al. [31] proposed a landslide identification method based on SAR amplitude images that combines change detection and hierarchical analysis. They applied this method to identify the 2015 landslide event in Shenzhen, demonstrating its effectiveness in reducing false positives while identifying the core areas of landslide events. Santangelo et al. [32] used Sentinel-1 SAR amplitude images to study the interpretation standards for pre- and post-landslide imagery and applied them to identify two significant landslide events in Chile and Myanmar. The research results showed that despite local geometric distortions and speckle effects, the landslide identification results from SAR images exhibited good consistency with optical imagery. While preliminary studies suggest the potential of SAR amplitude images in landslide identification, most current methods still require manual interpretation of SAR amplitude images to identify landslide locations, which can introduce subjectivity and dependence issues.
NAVA et al. [33] made the first attempt to combine VV-polarized SAR amplitude images with the UNet model for landslide identification, showcasing the potential of model predictions combined with SAR amplitude images for landslide identification tasks. However, SAR amplitude images contain complex noise and redundancy, and they can introduce significant distortions when capturing steep terrain areas [34,35,36]. Due to side-looking radar satellite imaging characteristics, SAR images may exhibit geometric distortions, including foreshortening, layover, and shadow, affecting landslide recognition and shape analysis [37,38,39].
While previous research has made significant strides in landslide identification, there is still relatively limited research utilizing model predictions and SAR amplitude data, especially when considering different orbital temporal data and polarization combinations. The effectiveness of landslide identification remains unclear. Therefore, the community requires more studies on how to harness the full potential of SAR data.
This paper presents a novel landslide identification approach for dual-polarization SAR data and explores various SAR data combinations. These combinations include ascending and descending orbital temporal polarization fusion, single-orbit temporal polarization combinations, and pre- and post-event dual-polarization and single-polarization combinations. Our study emphasizes analyzing the impacts of these different combinations on landslide prediction in various regions, providing valuable real-world case studies and reference points for global landslide hazard assessment.

2. Methodology

2.1. SAR Image Fusion Strategy

2.1.1. Transformation to Backscatter Coefficients

SAR amplitude represents the signal strength of electromagnetic wave returns, and its distinctive feature is its resilience to surface coverage or vegetation obstruction. This quality makes it a powerful tool capable of providing valuable information about the reflective properties of surface objects, including characteristics of soil, rocks, and vegetation. However, similar to many remote sensing data sources, SAR amplitude images often come with complex noise stemming from various factors such as sensor limitations, atmospheric interference, and surface changes. These noise sources can potentially interfere with the accurate identification of landslides. Therefore, it is imperative to undertake a series of preprocessing steps to convert SAR amplitude data into backscatter coefficients, enhancing the quality and usability of the data.
In converting Sentinel-1 SAR amplitude to the backscatter coefficient, we follow the following key steps to ensure the reliability and accuracy of the data (Figure 1). Firstly, we enhance processing efficiency by subsetting the regions of interest (ROIs) within the images, thereby constraining the scope of data processing. Next, we apply orbit files to update the orbital metadata of the images. This step aims to ensure the accuracy and precision of orbit information, providing a dependable foundation for subsequent processing. Subsequently, we remove Ground Range Detected (GRD) edge noise, aiming to eliminate low-intensity noise and invalid data within the images. To improve data quality further, we remove thermal noise to reduce inconsistencies between different sub-swaths under multi-scanning acquisition modes. We proceed with radiometric calibration, utilizing sensor calibration parameters from the GRD metadata. The primary objective of this step is to convert SAR amplitude data into backscatter intensity, hence obtaining the backscatter coefficient. Lastly, we employ the SRTM 30 m Digital Elevation Model (DEM) for terrain correction, transforming the backscatter coefficient data from the Ground Range Geometry to terrain-corrected coordinates.

2.1.2. SAR Fusion of Ascending and Descending Time Series

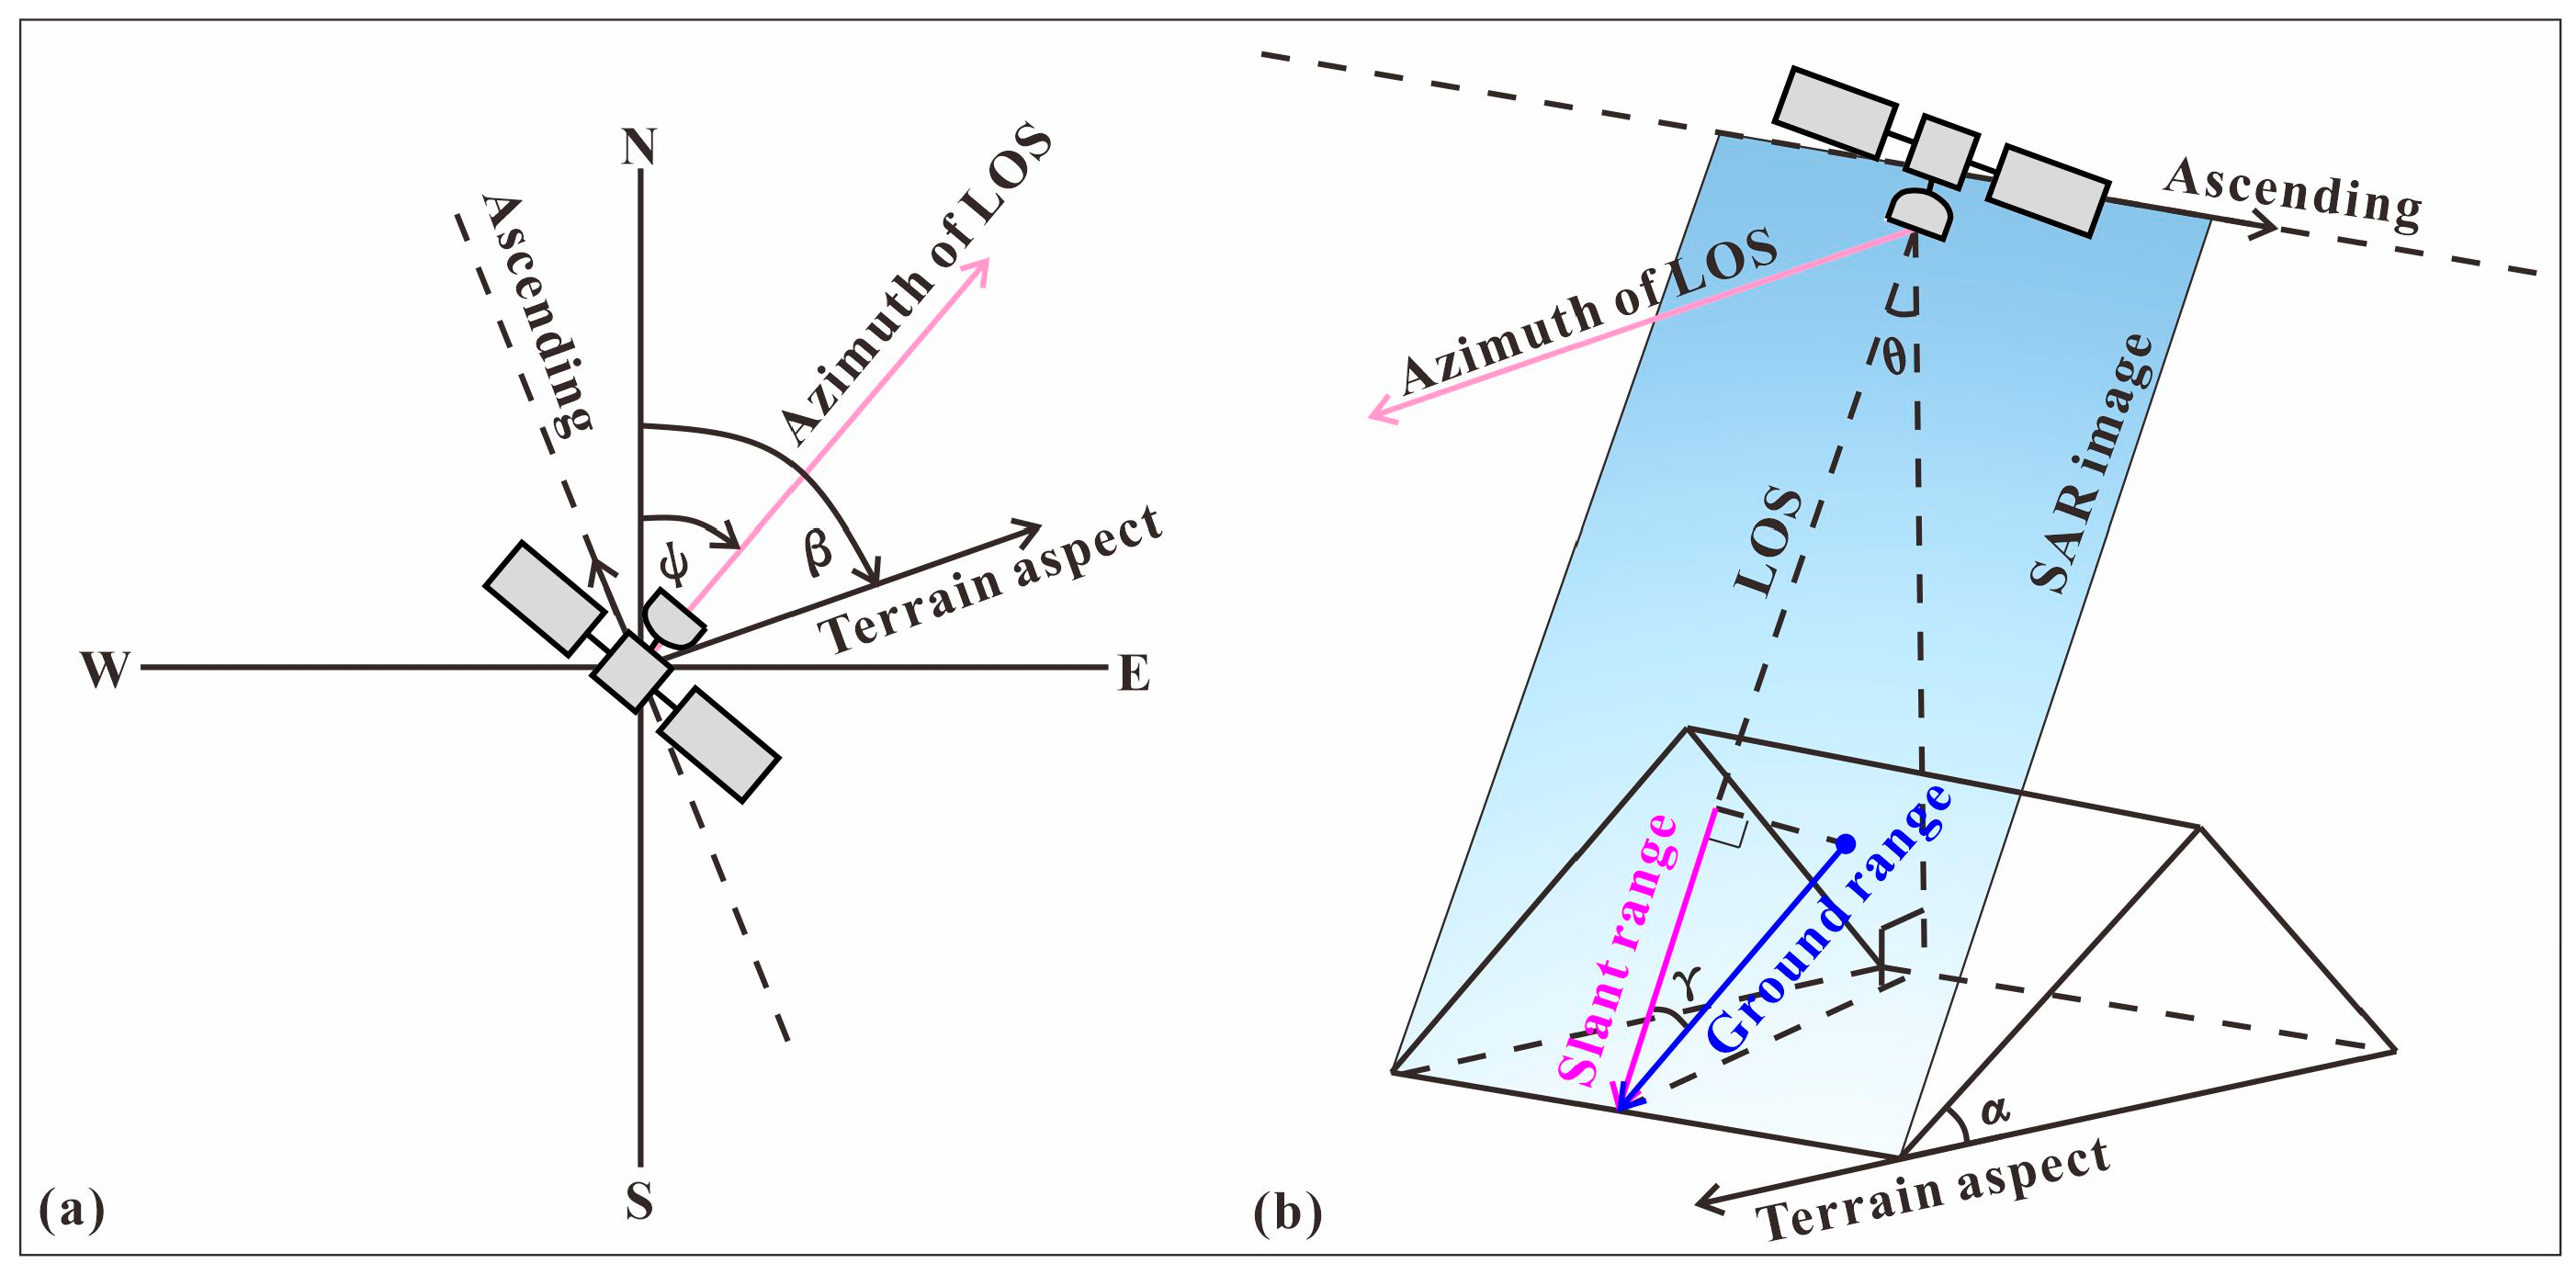
Figure 2 illustrates a schematic diagram of imaging sloping terrain by an ascending orbit Synthetic Aperture Radar (SAR) satellite. When a SAR satellite performs imaging observations of descending terrain, both the satellite’s orientation parameters (azimuth angle φ , incidence angle θ , and the angle between the radar beam and the Earth’s surface γ ) and the terrain parameters (aspect β , slope α ) significantly impact its monitoring effectiveness [40,41]. Figure 2 shows that during backscatter radar imaging, geometric distortions may occur in sloping terrain areas. Phenomena such as layover and shadow can obscure landslide information in the images, resulting in less accurate landslide extraction from a single orbit. Ren et al. [41] employed terrain visibility to fuse ascending and descending SAR images for extracting landslide deformations in the Three Gorges Reservoir area. In our initial experiments, we adopted the approach proposed by Ren et al. [41] to process SAR amplitude images but found that the accuracy of landslide identification did not significantly improve. This could be attributed to several factors. First, SAR amplitude contains surface characteristics such as soil, moisture, rocks, and vegetation, with changes in each surface characteristic altering pixel values (SAR amplitude) to some extent. Second, civilian SAR satellites have lower answers than optical satellites offering higher resolutions (e.g., 0.1 m). This implies that even minor variations in each pixel value in SAR amplitude can substantially impact landslide model recognition. Therefore, it is essential to consider using pre-event archived images and design a time-series ascending and descending orbit fusion strategy to enhance the accuracy of landslide identification.
To address the issues above, we propose a method for fusing ascending and descending time-series backscatter coefficients to enhance landslide identification accuracy. Specifically, we calculate the median of pixel values separately within time intervals before and after landslide events for ascending and descending SAR images. This enables us to obtain median images for each time interval. We calculated the median for each pixel in ascending and descending SAR images separately during pre- and post-landslide event periods. This process generated two median images. Our method, based on the principles of change detection, utilizes the median as a representative value of surface characteristics to mitigate the impact of changes in surface scattering properties. This reduces data complexity and enhances the accurate identification of surface landslides. Furthermore, we refrained from introducing minimum and maximum values to improve the model’s ability to learn variations in landslide mapping. The formulas for this process, using VV polarization as an example, are as follows.
σ a p r e ( v v ) = M ( σ a p r e )
σ a p o s t ( v v ) = M ( σ a p o s t )
σ d p r e ( v v ) = M ( σ d p r e )
σ d p o s t ( v v ) = M ( σ d p o s t )
where σ a p r e represents the ascending time-series SAR images before the event, σ a p o s t represents the ascending time-series SAR images after the event, σ d p r e represents the descending time-series SAR images before the event, and σ d p o s t represents the descending time-series SAR images after the event. M denotes the median function, signifying the operation of computing the median for each pixel across the time series. σ a p r e ( v v ) represents the median image of the ascending VV polarization before the event, σ a p o s t ( v v ) represents the median image of the ascending VV polarization after the event, σ d p r e ( v v ) represents the median image of the descending VV polarization before the event, and σ d p o s t ( v v ) represents the median image of the descending VV polarization after the event. The generation of median images serves to integrate SAR data from multiple time intervals, resulting in representative surface feature images. This approach reduces the influence of noise, decreases data volume, and enhances the reliability of surface change monitoring.
In Section 2.1.1, we converted SAR amplitude to backscatter coefficients to effectively reduce a significant portion of noise interference. Considering that surface characteristics can vary due to factors such as temperature and humidity, subsequently affecting the numerical values of backscatter coefficients, we employed a time-series median image method to capture the stable characteristics of the Earth’s surface before the landslide event. We can extract the surface backscatter coefficient changes induced by the landslide by comparing the differences between the pre- and post-event ascending and descending VV-polarized media images.
σ a c ( v v ) = σ a p r e ( v v ) σ a p o s t ( v v )
σ d c ( v v ) = σ d p r e ( v v ) σ d p o s t ( v v )
where σ a c represents the median VV change image for ascending orbits before and after the landslide event, while σ a p o s t ( v v ) represents the median VV change image for descending orbits before and after the landslide event.
To comprehensively consider the changes in backscatter coefficients for both ascending and descending orbit scenarios, we merge the median change images from both orbits.
σ f ( v v ) = σ a c ( v v ) + σ d c ( v v ) 2
where σ f ( v v ) represents the fused SAR change image. Due to potential geometric distortions in SAR satellite observations, these distortions can lead to less accurate extraction of landslide information from a single orbit. Therefore, by calculating the changes in SAR backscatter coefficients for ascending and descending orbit scenarios and averaging them, we can mitigate the issue of inaccurate landslide change information identification solely relying on a single orbit. The calculation method for the average backscatter coefficient change contributes to the integrated utilization of SAR data from different orbits and observation times. This allows for a more effective capture of surface feature changes induced by landslides.

2.2. Dual-Polarized Pixel Attention UNet

2.2.1. Model Structure

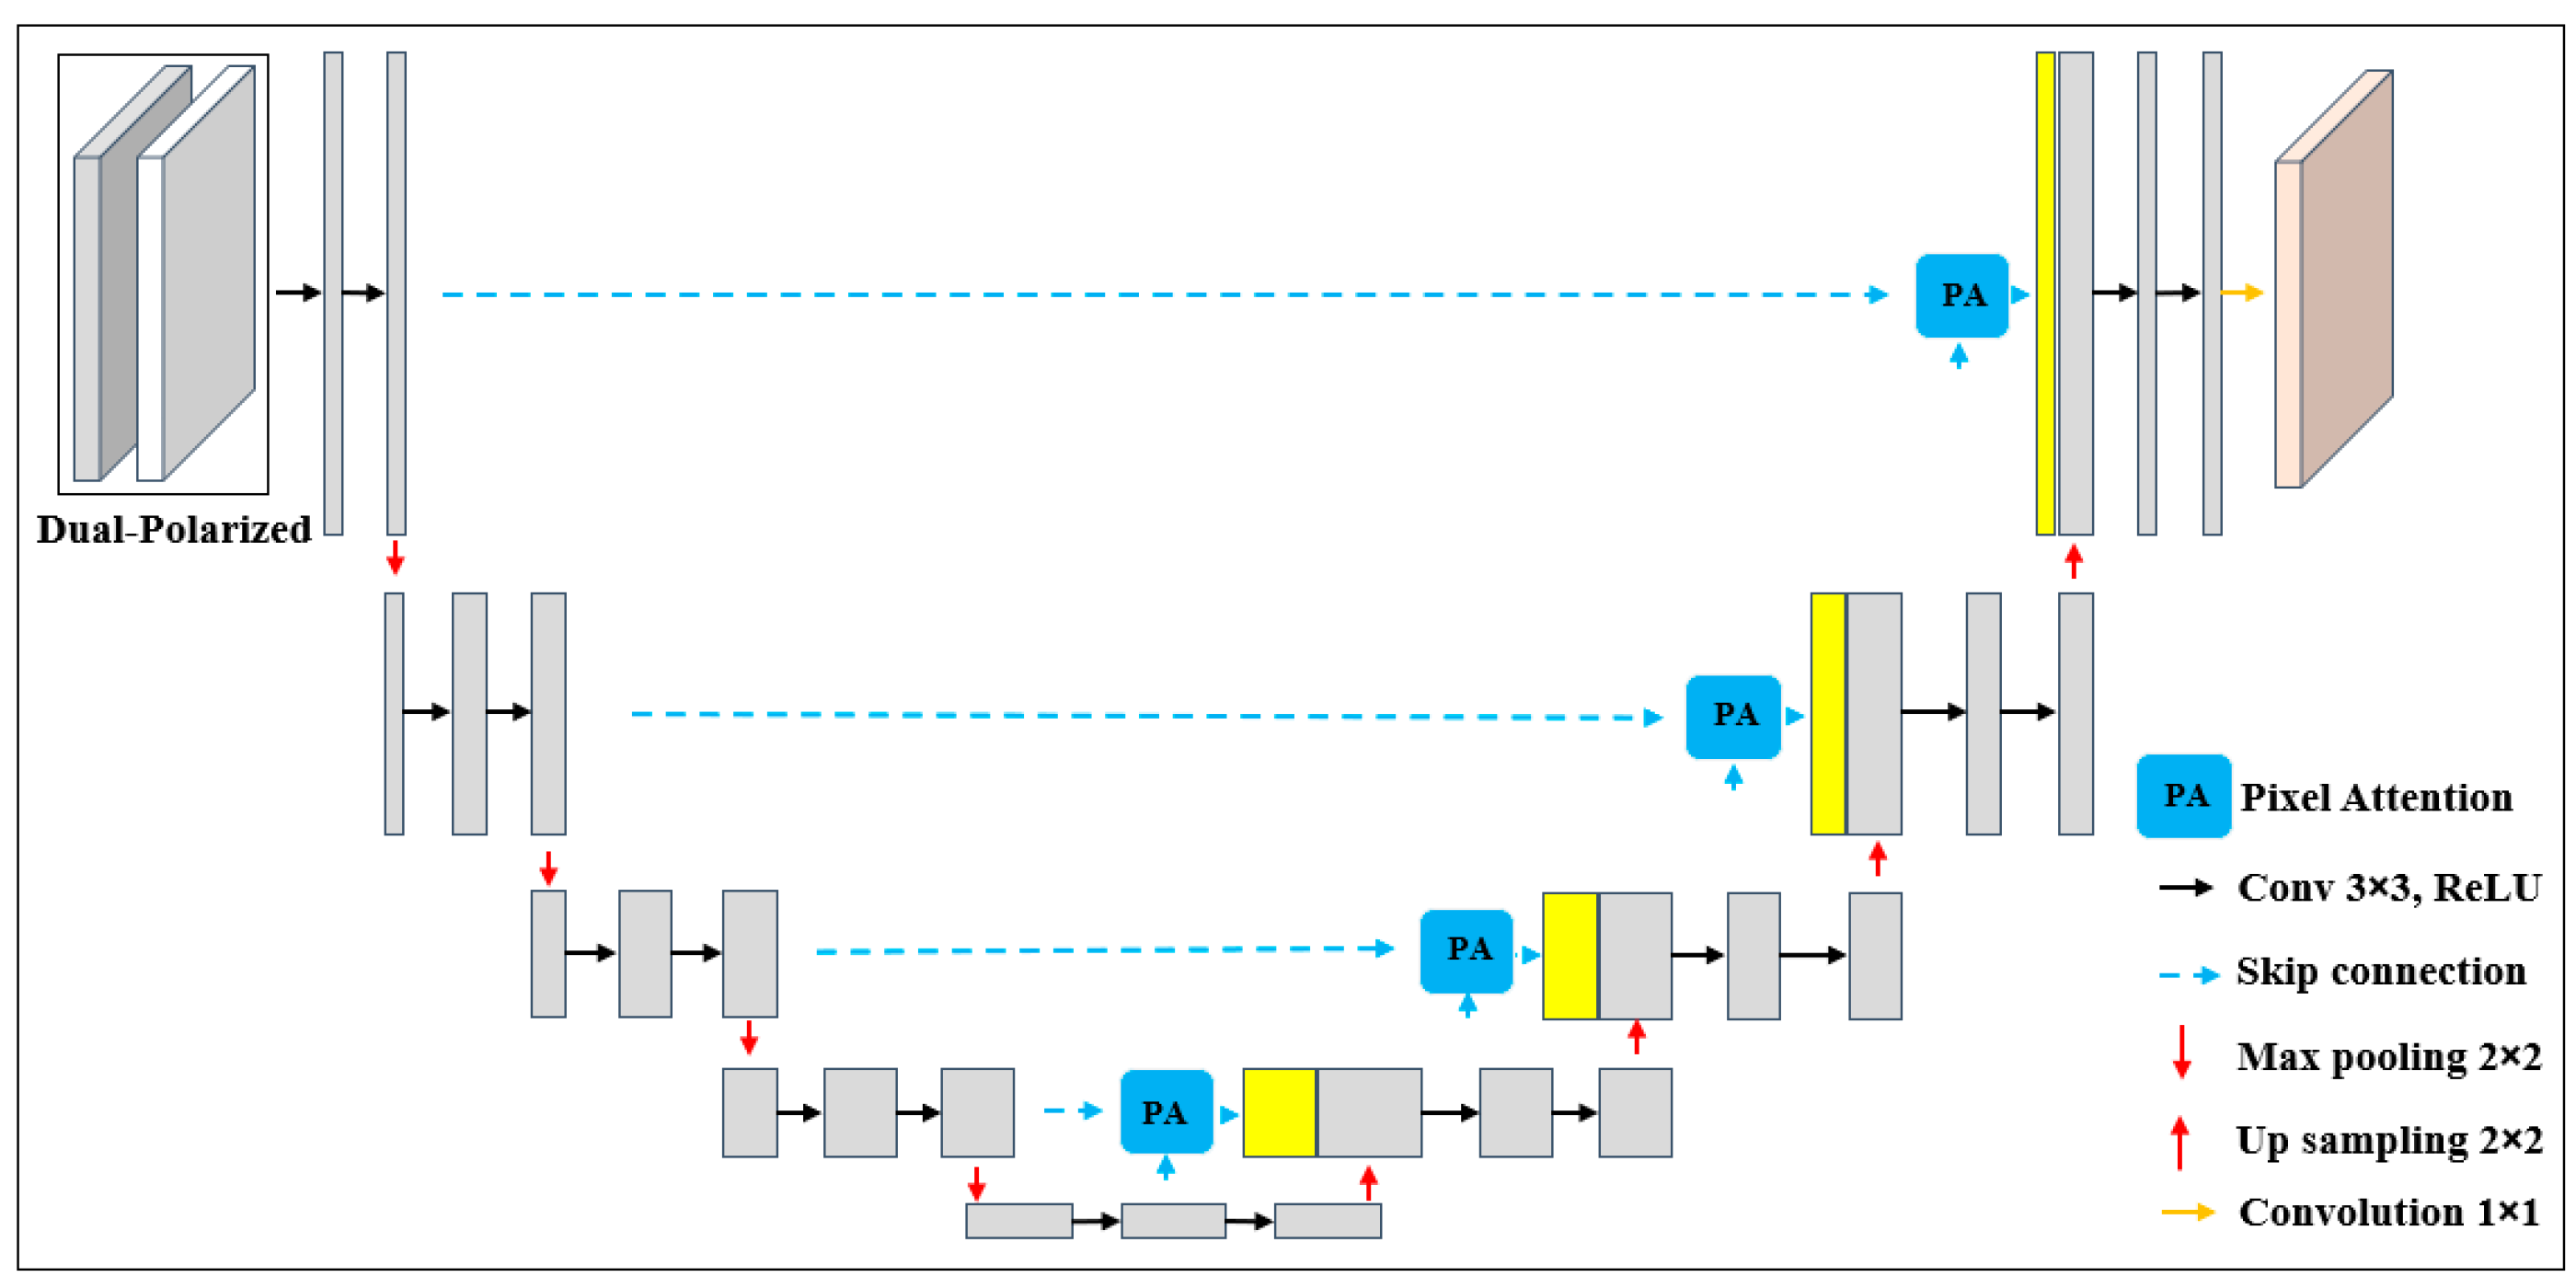
UNet was initially primarily employed in medical image segmentation, with its core feature being skip connections in the middle layers [42]. UNet ingeniously utilizes the concatenation operation to concatenate feature maps at corresponding positions, bridging the encoding and decoding stages. This enables the capture of high-resolution information and shallow features during upsampling operations, effectively restoring fine details of the original image and enhancing segmentation accuracy. However, due to significant noise and information redundancy in Synthetic Aperture Radar (SAR) backscatter coefficient images, redundancy issues may exist in the shallow features obtained through skip connections. This study adopts a strategy based on pixel-wise attention mechanisms to address this challenge. We designed a dual-polarized UNet model tailored for polarimetric SAR images and introduced a pixel-wise attention module. The primary purpose of this module is to calculate pixel-level attention weights using a sequence of convolutional and activation layers and utilize these weights to improve the representation capabilities of essential regions. Specifically, the attention mechanism calculates attention weights for each pixel using a sequence of convolutional and activation layers. These weights are then applied to input features, enhancing the representation in vital areas to align with SAR amplitude image characteristics. The overall architecture of the dual-polarized pixel attention UNet (DPPA-UNet) is depicted in Figure 3.
In the UNet network, which undergoes four downsampling operations, although some features can be extracted during this process, it also results in the loss of edge features and shallow-level information. These aspects cannot be solely regained during upsampling. To enhance this process, the study introduces a pixel-wise attention module within the UNet model (as illustrated in Figure 4) to improve performance through weight redistribution and extract crucial information.
The pixel-wise attention module utilizes Conv2D layers and a sigmoid activation function to compute pixel-wise attention weights. These weights are subsequently employed in element-wise multiplication with the input features through the Multiply layer and added back to the original input features using the Add layer. This process achieves the weighted importance of features and facilitates information fusion. Notably, the pixel-wise attention mechanism is applied at each upsampling stage of the model.
The specific operations are as follows: After each upsampling stage, we employ a Conv2DTranspose layer to upsample the feature maps. Subsequently, we concatenate the upsampled feature maps with the corresponding encoder feature maps using the link function. Following this, the concatenated feature maps are input into the pixel-wise attention mechanism, further enhancing the representation of critical regions.
The learning rate can be understood as the speed at which the model learns from the images during training (Figure 5). A higher learning rate leads to faster movement but may risk oversimplification, resulting in less precise learning. Conversely, a lower learning rate leads to slower training but allows for more detailed and accurate understanding. In the experimental phase, we opted for a relatively higher learning rate to train the network. We set the model’s learning rates to be (0.001, 0.0005, 0.0001). These experimental settings enhanced the model’s performance and practical learning features.

2.2.2. Experimental Strategy

We applied various data augmentation techniques to our dataset to enhance our model’s robustness and generalization ability. Specifically, we used horizontal and vertical flipping. Horizontal flipping involves flipping the image along its horizontal axis, while vertical flipping involves flipping it along its vertical axis. These techniques can increase the model’s adaptability to image changes, improving its performance on unseen data. In image segmentation tasks, the Dice loss function is a commonly used loss function, particularly suitable for addressing class imbalance situations. The similarity measurement is based on the Dice coefficient and the F1 score, and quantifies the resemblance between two samples. The Dice loss function, defined as one minus the Dice coefficient with values of 0 to 1, was selected for our study. Our rationale for choosing the Dice loss function is to enhance the overlap between predicted and actual segmented regions, consequently improving segmentation accuracy. In our deep learning model training, we utilized the Dice loss [43] as the primary loss function.
Dice = c 1 i = 1 N P i c g i c + ε i = 1 N P i c + g i c + ε
This equation describes the variation in the binary Dice score coefficient (DSC) for class c. In the equation, g i c [ 0 , 1 ] and P i c [ 0 , 1 ] represent the ground truth labels and predicted labels, respectively, and N denotes the total number of image pixels. A small constant is introduced to ensure numerical stability and prevent division by zero. Furthermore, we employed additional critical techniques during model training, such as batch normalization and weight initialization, to further enhance model stability and convergence speed.
During training, we employed stochastic gradient descent and chose the Adam (adaptive momentum) optimizer for the loss function. This choice of optimizer offers significant advantages when dealing with noisy data and sparse gradients in detection tasks [44]. The appropriate selection of hyperparameters is essential for effectively training this deep learning model and achieving optimal results. In pursuit of this goal, we experimented with various sets of hyperparameter combinations, including filter quantities (16, 32, 64, 128) and batch sizes (8, 16, 32). This series of attempts helped us identify the hyperparameter configuration that best suited the model training, laying the foundation for achieving superior performance outcomes.
This study employed a range of performance evaluation metrics, including accuracy, recall, F1 score, and IoU score, to comprehensively assess the model’s performance. Generally, higher values for these metrics indicate greater accuracy. For example, a higher F1 score signifies more precise results, whereas a lower F1 score may suggest less accurate predictions. In evaluating and comparing various models, we aimed to identify the model that offered the best blend of performance metrics, ultimately leading to optimal image segmentation outcomes.
In this study, we calculated standard performance metrics, such as precision, recall, F1 score, and Intersection over Union (IoU), based on the outcomes of true positives (TP), true negatives (TN), false positives (FP), and false negatives (FN). Precision, as defined in Formula (9), measures the accuracy of optimistic predictions and represents the proportion of correct positive predictions out of all predicted positives. Recall (Formula (10)) signifies the probability of correctly predicting all actual positives out of the total true positives [45]. The F1 score (Formula (11)) is a comprehensive evaluation metric that balances precision and recall, providing an insight into their trade-off. IoU (Formula (12)) measures the overlap between the predicted results and the actual annotations, assessing segmentation accuracy.
When assessing binary classification problems, it is expected to observe a trade-off relationship between precision and recall, implying that enhancing accuracy may reduce memory and vice versa. In contrast, the F1 score offers a comprehensive assessment considering precision and recall. Therefore, it is commonly used as a holistic metric in model performance evaluation to gauge the quality of the model. By judiciously combining these metrics, we can more comprehensively assess the model’s performance in image segmentation tasks.
P = TP TP + FP
R = TP TP + FN
F 1 = 2 P · R P + R
I = TP ( TP + FP + FN )

3. Experimental Area and Data Preparation

3.1. Experimental Area

The high cost of commercial SAR imagery and the significant scarcity of civilian SAR imagery have long posed challenges limiting the widespread application of SAR data in landslide identification research [46]. However, in recent years, the launch of the Sentinel-1 satellite by the European Space Agency (ESA) has transformed this landscape [47]. Sentinel-1, a vital component of the Copernicus program, comprises two satellites, each equipped with C-band Synthetic Aperture Radar (SAR) sensors, boasting exceptional observation capabilities. Sentinel-1 offers two primary polarization modes, including VV and VH polarization, and operates in ascending and descending acquisition modes. Notably significant is the satellite’s revisit period, which can be shortened to as few as six days. This unique feature positions Sentinel-1 as a valuable resource, enabling all-weather, day-and-night image acquisition and providing outstanding flexibility and coverage for landslide identification tasks on the Earth’s surface [48]. This study utilized Interferometric Wide (IW) Ground Range Detected (GRD) images from Sentinel-1. These data can be downloaded from the European Space Agency’s Science Data Center at https://scihub.copernicus.eu/ (accessed on 1 October 2023).
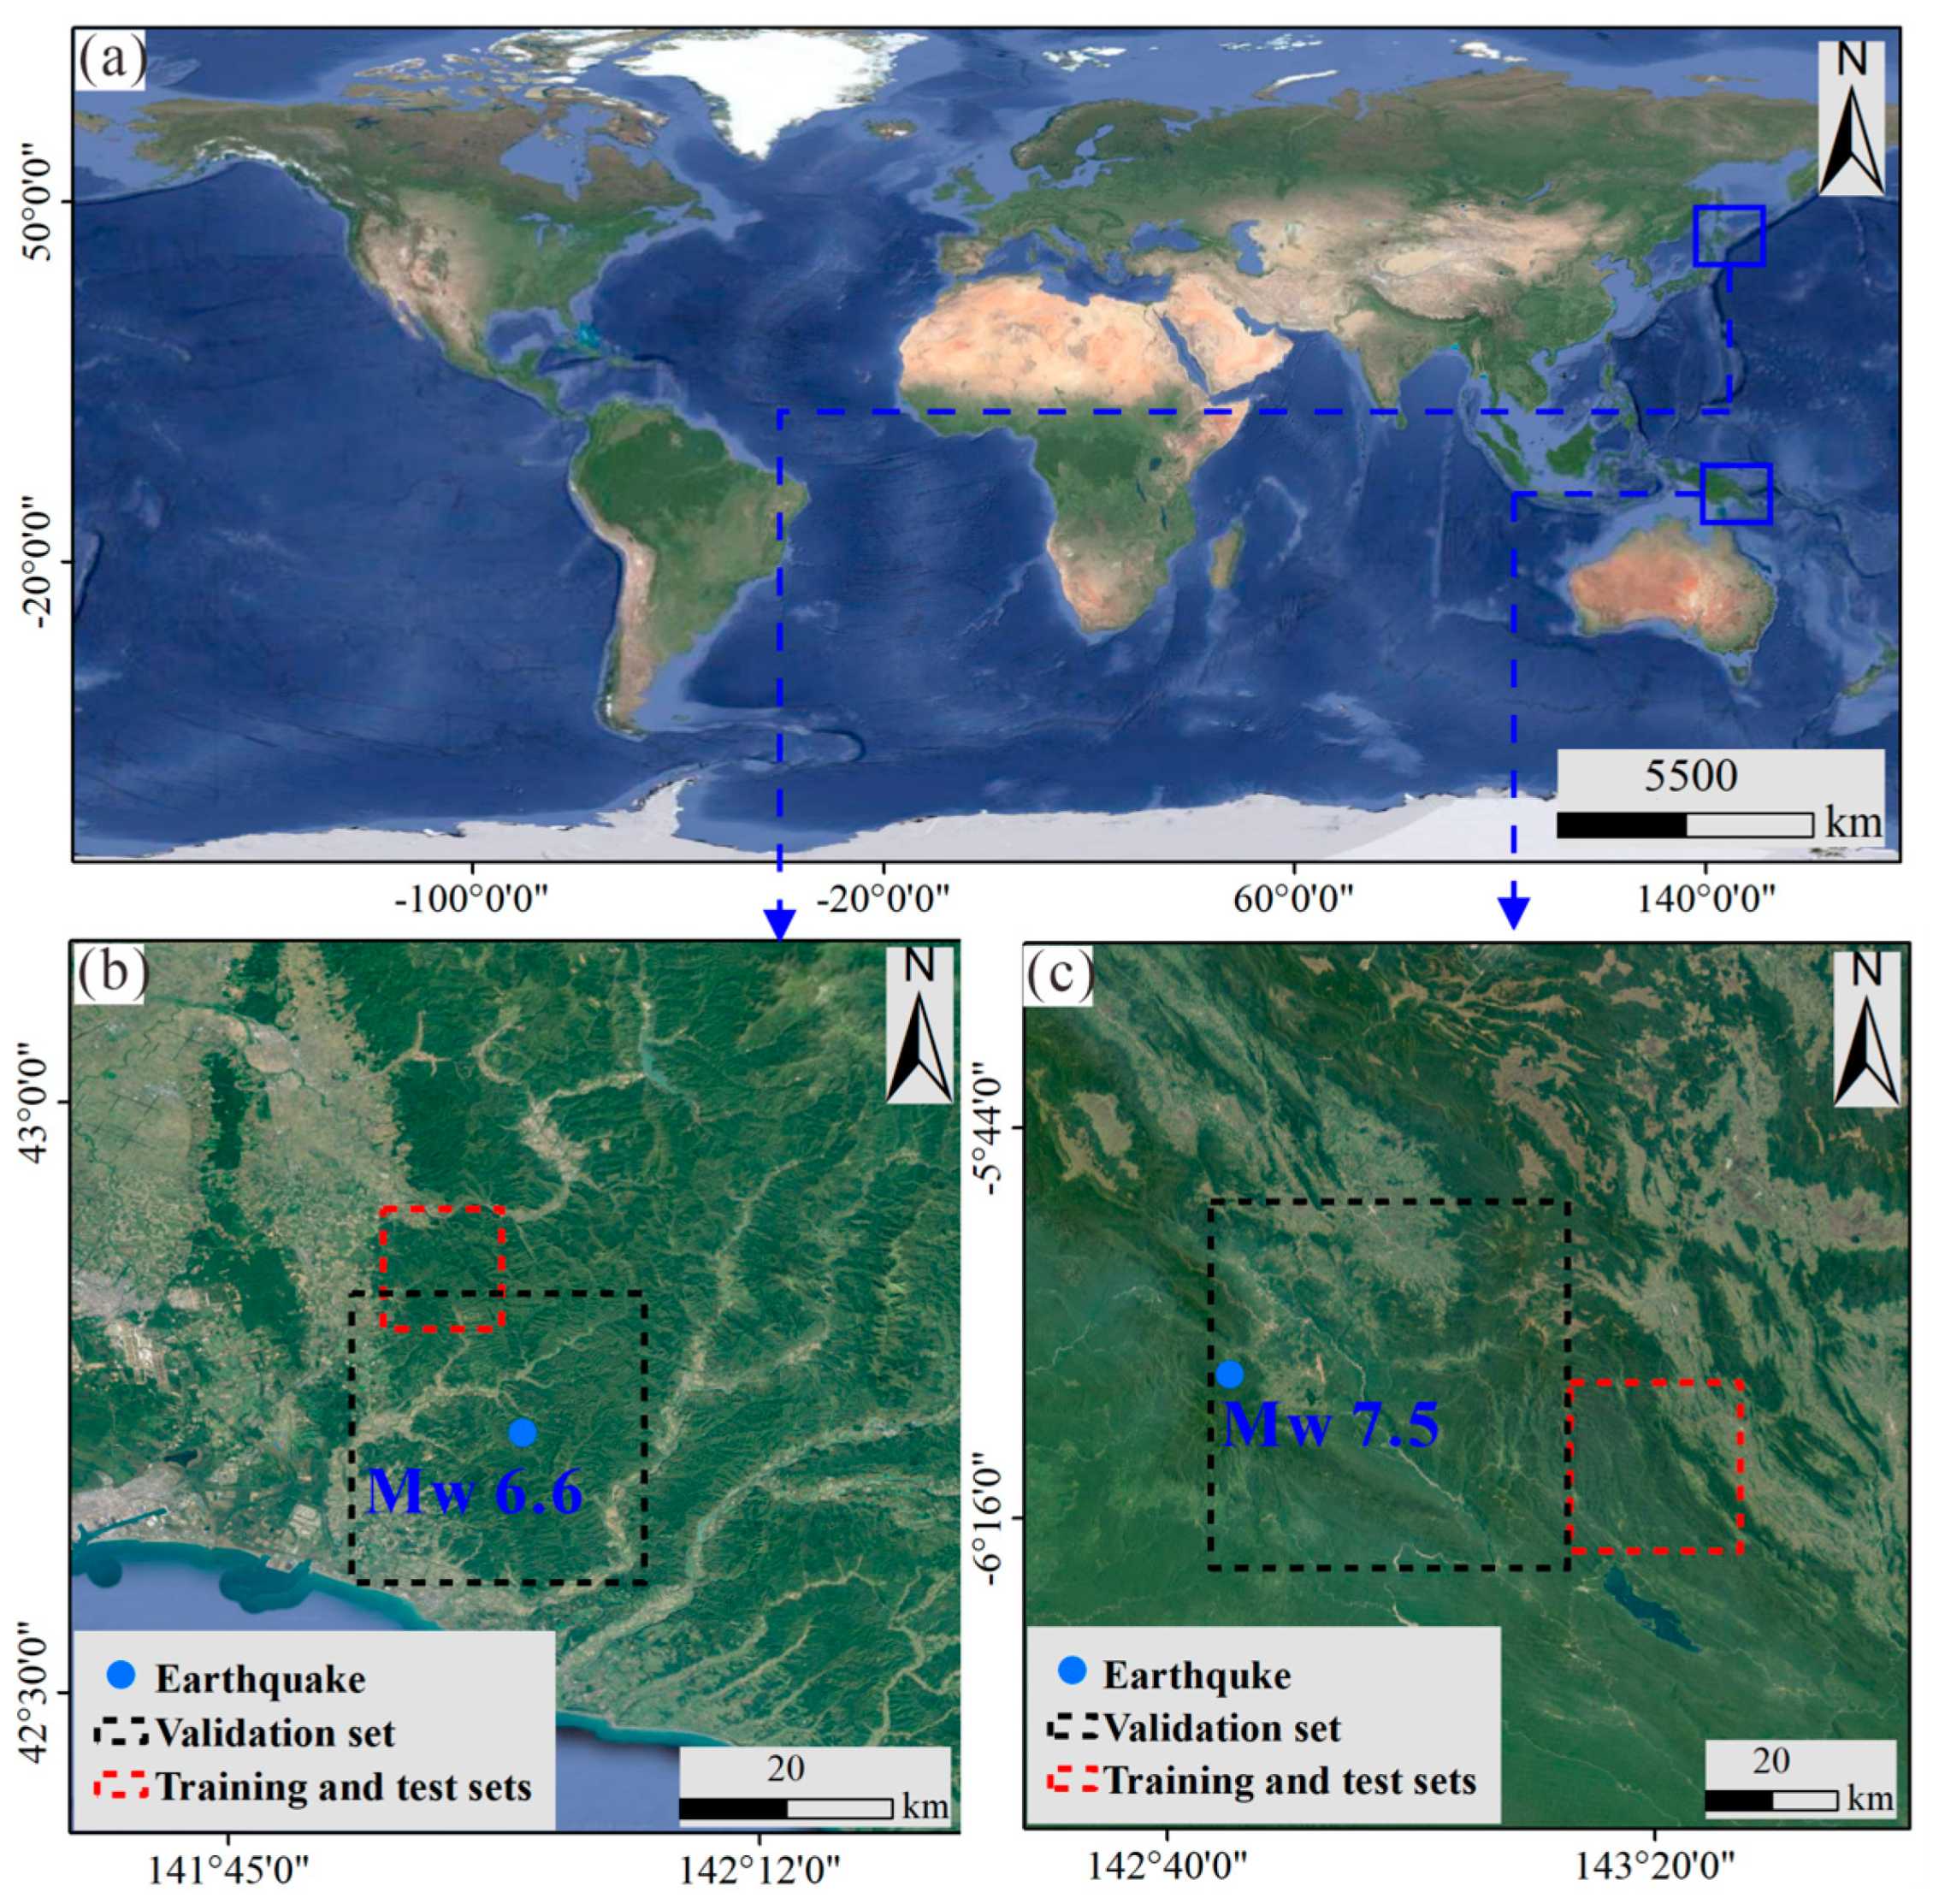
In this study, we conducted an in-depth analysis of two seismic events and their corresponding landslide inventories. Figure 6a illustrates the geographical locations of these two seismic events. The first event was a magnitude 6.6 earthquake that occurred in Iburi County, Hokkaido, Japan, on 5 September 2018 (Figure 6b). The epicenter of the Iburi Mw 6.6 earthquake was located at approximately 142.0 degrees east longitude and 42.72 degrees north latitude, with an exact occurrence time of 18:07:59 (UTC) [49,50]. Iburi County covers an area of roughly 630 square kilometers, with geographic coordinates ranging from longitude 141.84° to 142.13° and latitude from 42.64° to 42.89° [51]. The second event occurred on 25 February 2018 in Papua New Guinea and was a magnitude 7.5 earthquake (Figure 6c). The epicenter coordinates were approximately 142.754 degrees east longitude and 6.070 degrees south latitude, with an earthquake depth of 25.2 km. The specific time of occurrence was 17:44:44 (Coordinated Universal Time, UTC) [52,53,54,55].

3.2. Data Preparation

This study used Sentinel-1’s VV and VH polarized backscatter coefficients to comprehensively capture landslide information. We divided these data into six different groups, as shown in Table 1, to facilitate a more precise comparison of the differences in performance between the groups. Group 1 includes ascending and descending VV and VH time-series change data generated through the fusion strategy proposed in this paper. Groups 2 and 3 also utilize data generated using our process without ascending and descending orbit fusion. Group 4 consists of ascending VV and VH change data calculated by differencing SAR images before and after landslides. Groups 5 and 6 comprise ascending VV and VH data before and after landslides, utilizing only single-polarization SAR images. These combinations were designed to evaluate the impact of different datasets and features on our approach. Specifically, Group 1, Group 2, and Group 3 are used to compare the performance of our policy with single-orbit data in landslide detection. Additionally, the experiments involving Group 2 and Group 4 aim to analyze the differences in landslide recognition between time-series images and using only pre- and post-landslide images. Finally, Group 4, Group 5, and Group 6 are employed to assess the impact of different polarization modes on landslide recognition.
During the experimental process, we selected two seismic landslide events (Figure 6) as our case study subjects: the Mw 6.6 earthquake in Hokkaido, Japan, and the Mw 7.5 earthquake in Papua New Guinea. The critical parameters of the SAR data used are detailed in Table 2. To perform accurate landslide identification and validation, we divided each study area into training and validation sets to assess the model’s reliability and generalization performance. In the training dataset, 80% of the patches were allocated for model training and parameter optimization, with the remaining 20% set aside for evaluating and validating the model’s performance. This division method aids in verifying the model’s effectiveness on different datasets and helps mitigate overfitting issues.
Similarly, we applied the same partitioning approach for the Papua New Guinea Mw 7.5 earthquake event, dividing the study area into training and validation sets. This ensures that our research results are adequately validated for various geographical environments and seismic events. It is essential to mention that all images have a consistent resolution of 10 × 10 m, and each pixel measures 8.983 × 10−5 × 8.983 × 10−5 degrees (°). Furthermore, every shot was divided into non-overlapping patches, each measuring 128 × 128 pixels. Regarding the selection of the training set partitioning method, we ensured that this method is based on relevant theoretical foundations. Specifically, we chose this partitioning method because it has been widely applied in previous studies and has been demonstrated to yield favorable results in similar contexts [56,57,58].
In the Hokkaido event experiment, we utilized landslide data created by Wang et al. [59], and for the Papua New Guinea earthquake, the landslide data were based on the work of Tanyas et al. [53]. To align with the resolution of Sentinel-1 SAR images (10 × 10 m), we resampled the existing landslide data using the nearest-neighbor assignment approach to maintain a 1:1 ratio with background pixels. Specifically, we assigned pixel labels of 1 to landslide areas and pixel labels of 0 to non-landslide areas. This approach ensured spatial resolution alignment between ground truth labels and SAR images and allowed pixel-level correspondence between ground truth labels and SAR images. In addressing the Hokkaido event, we utilized SAR imagery to generate 1,327,104 pixels for the training set and 7,225,344 pixels for the validation set. The actual landslide training samples comprised 182,357 pixels, while the landslide validation samples comprised 597,108 pixels. For the study area in Papua New Guinea, we used SAR imagery to generate 7,929,856 pixels for the training set and 28,901,376 pixels for the validation set. The landslide training samples included 149,889 pixels, and the validation samples contained 841,906 pixels. The segmentation strategy was designed to comprehensively assess the model’s performance on different datasets and thoroughly evaluate its applicability in diverse regions.

4. Results

4.1. Hokkaido Landslide

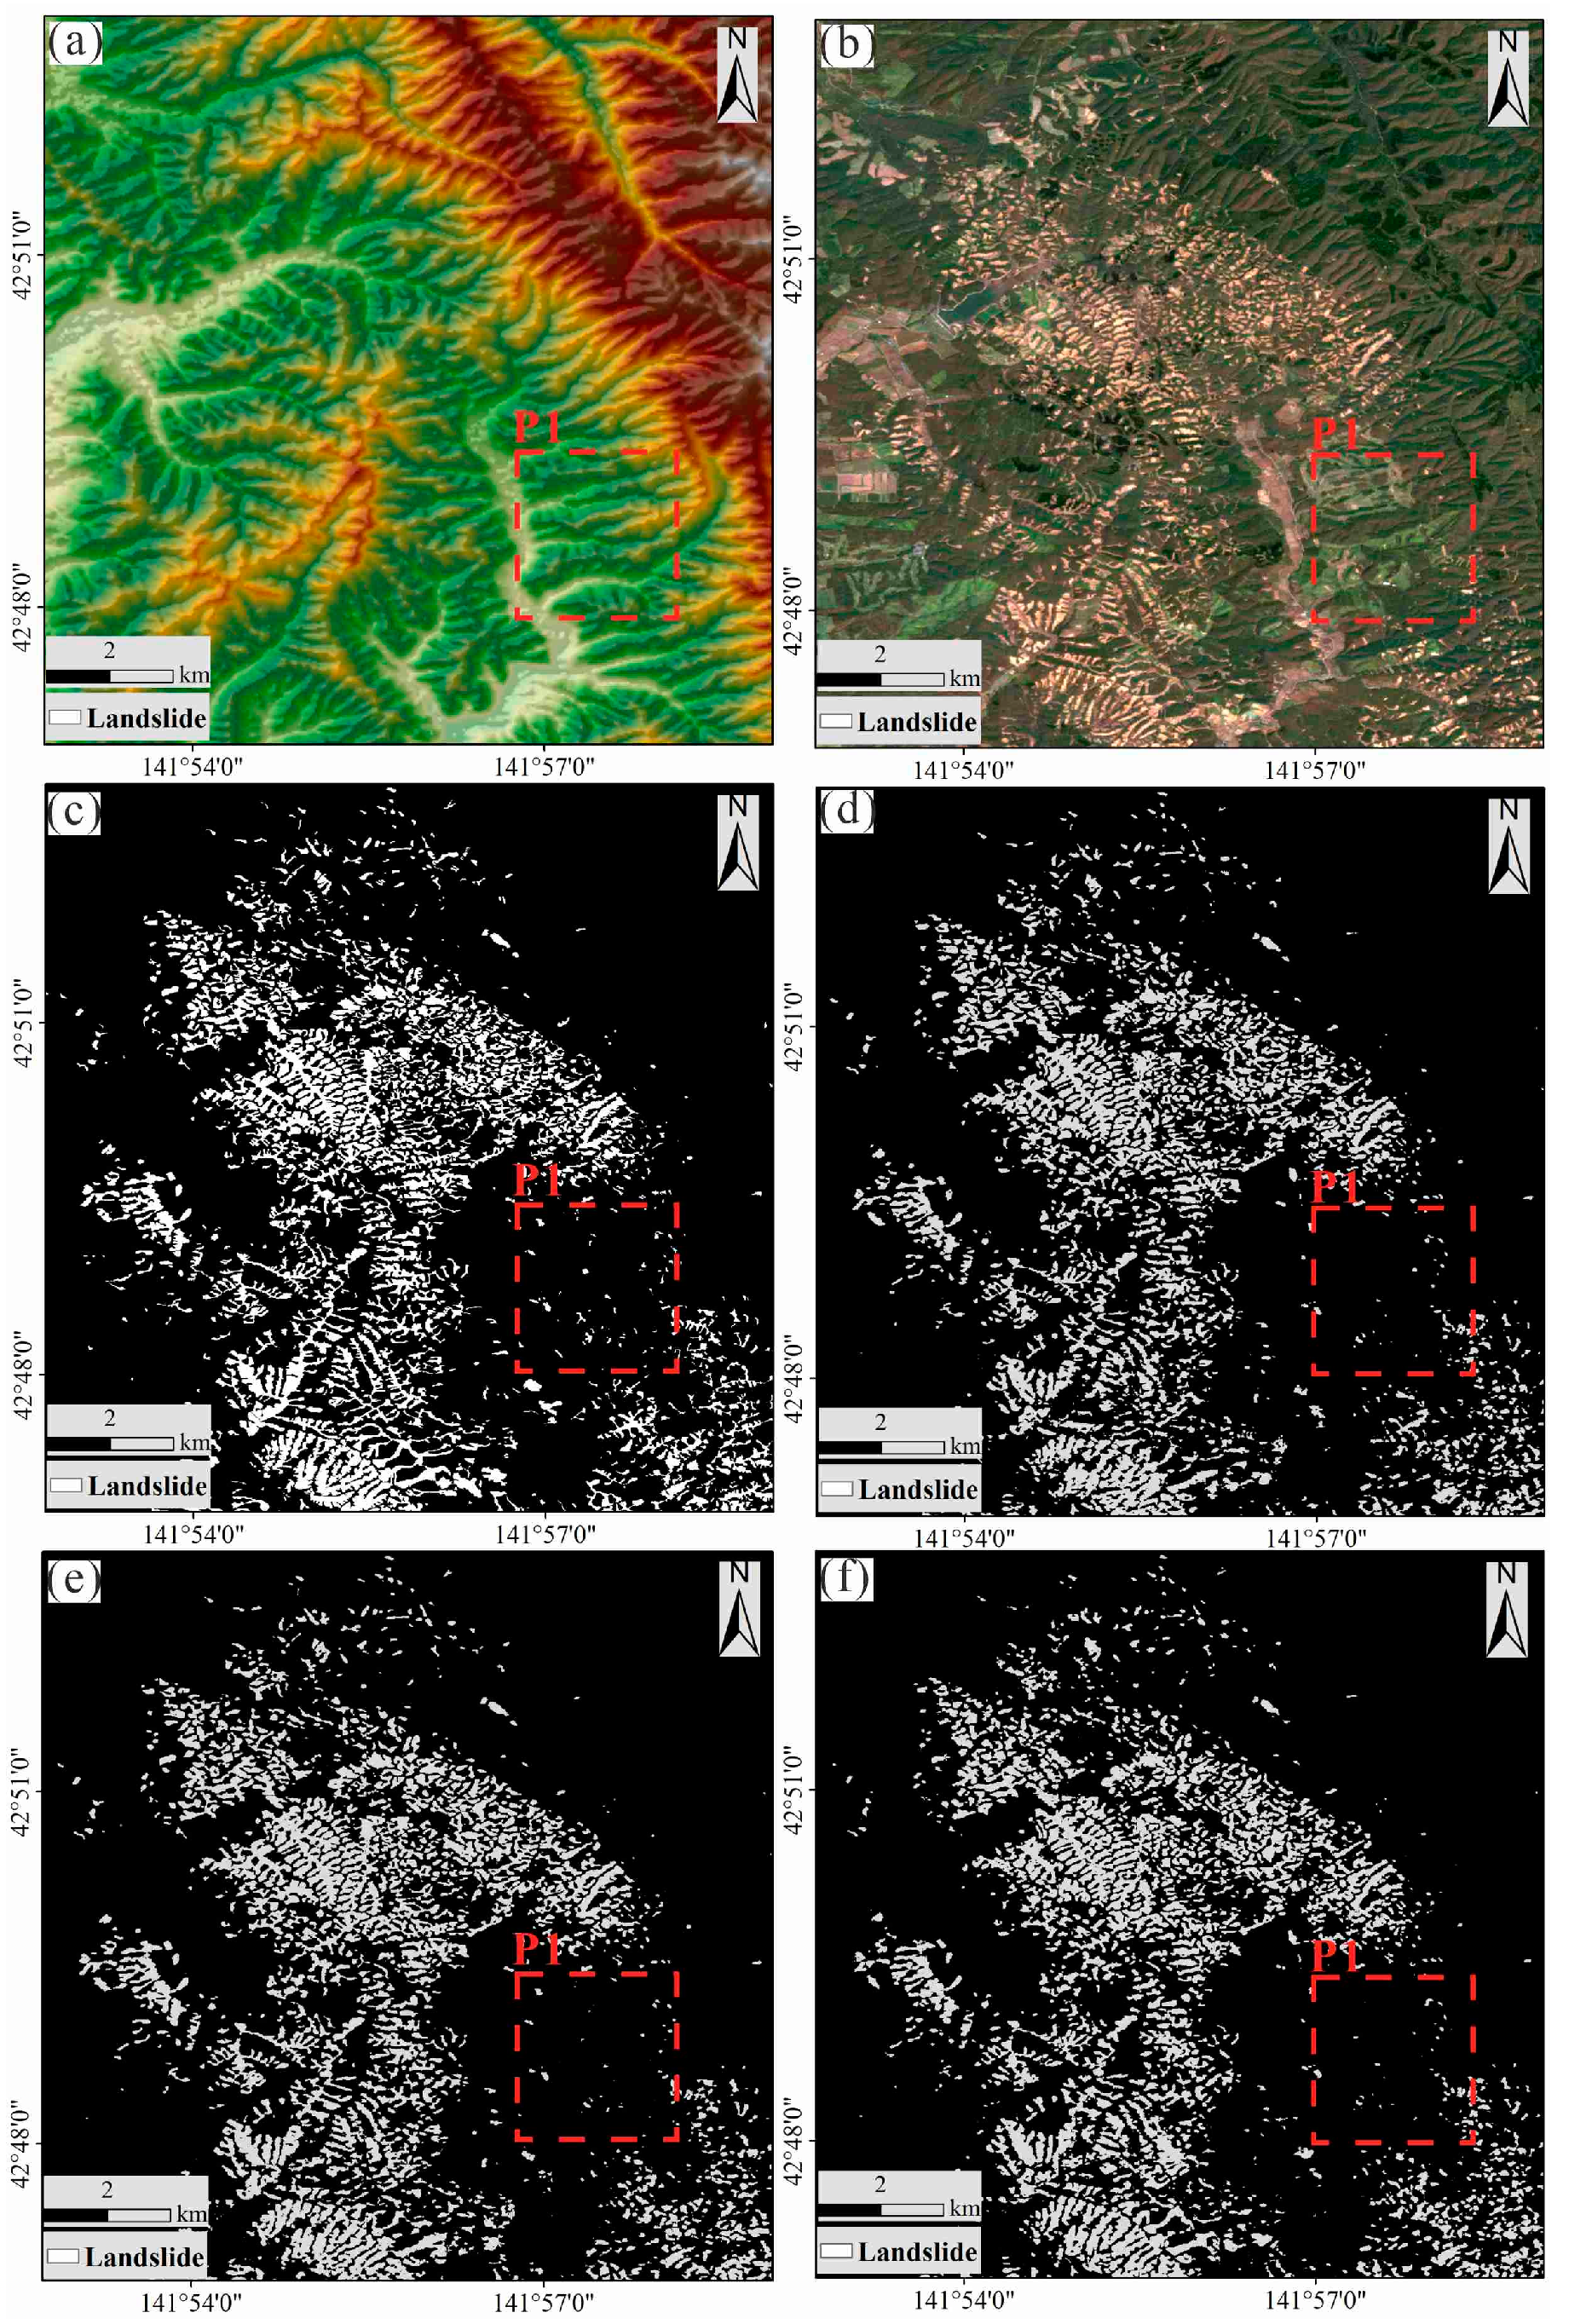
This study conducted experiments on a server with two NVIDIA RTX A5000 GPUs. Figure 7 presents the results of landslide identification on the Hokkaido training dataset. Figure 7a displays images of natural landslides, while Figure 7b–d showcase the results of landslide identification using the DPPA-UNet model, as well as the cloud removal and mosaicking results of Sentinel-2 optical imagery from 12 September 2018 to 12 September 2019. In Figure 7, Group 1 utilized the fusion of ascending and descending time-series backscatter coefficient images for landslide identification, closely matching with accurate maps, particularly in capturing details. The results obtained by Group 1 exhibit accuracy in capturing landslide edge information and effectively identifying a majority of coseismic landslides, especially when distinguishing between landslides of different scales. However, when comparing the results in the P1 region from Group 1 to Group 3, it is noteworthy that the study could not detect specific exceptionally small coseismic landslides, which could be attributed to the constraints imposed by the resolution of Sentinel-1A data. It is worth noting that although the Sentinel-2 optical image performs well for visual identification, it requires a longer wait for effective identification after a landslide has occurred.
When dealing with the Hokkaido Iburi earthquake event, we randomly partitioned the training samples in an 8:2 ratio, ensuring no overlap. This means that 20% of the training samples were exclusively used to test the accuracy of the training weights for acquiring the optimal weights. We conducted six combinations to try and obtain training scores for the best consequences. Table 3 presents the optimal training scores for recognizing Hokkaido landslides. We also evaluated the performance of Group 1 using the baseline UNet model to further validate our approach’s effectiveness. The results from Table 3 indicate that, in all cases, the best learning rate, optimal filter numbers, and batch size exhibit a trend of nearly random variation. The F1 score achieved by Group 1 using the DPPA-UNet model reached 0.81, significantly better than that of Group 1 using the baseline UNet model. This demonstrates that the DPPA-UNet model designed in this study can enhance the landslide identification performance of SAR imagery. Comparing Group 1 to Group 3, it is evident that the proposed method of fusing ascending and descending time-series backscatter coefficient images outperforms single-orbit methods in terms of the F1 score. Furthermore, by comparing the results of Group 4 to Group 6, we find that the recognition performance significantly improves when using both VV and VH polarizations compared to using a single polarization (either VV or VH alone).
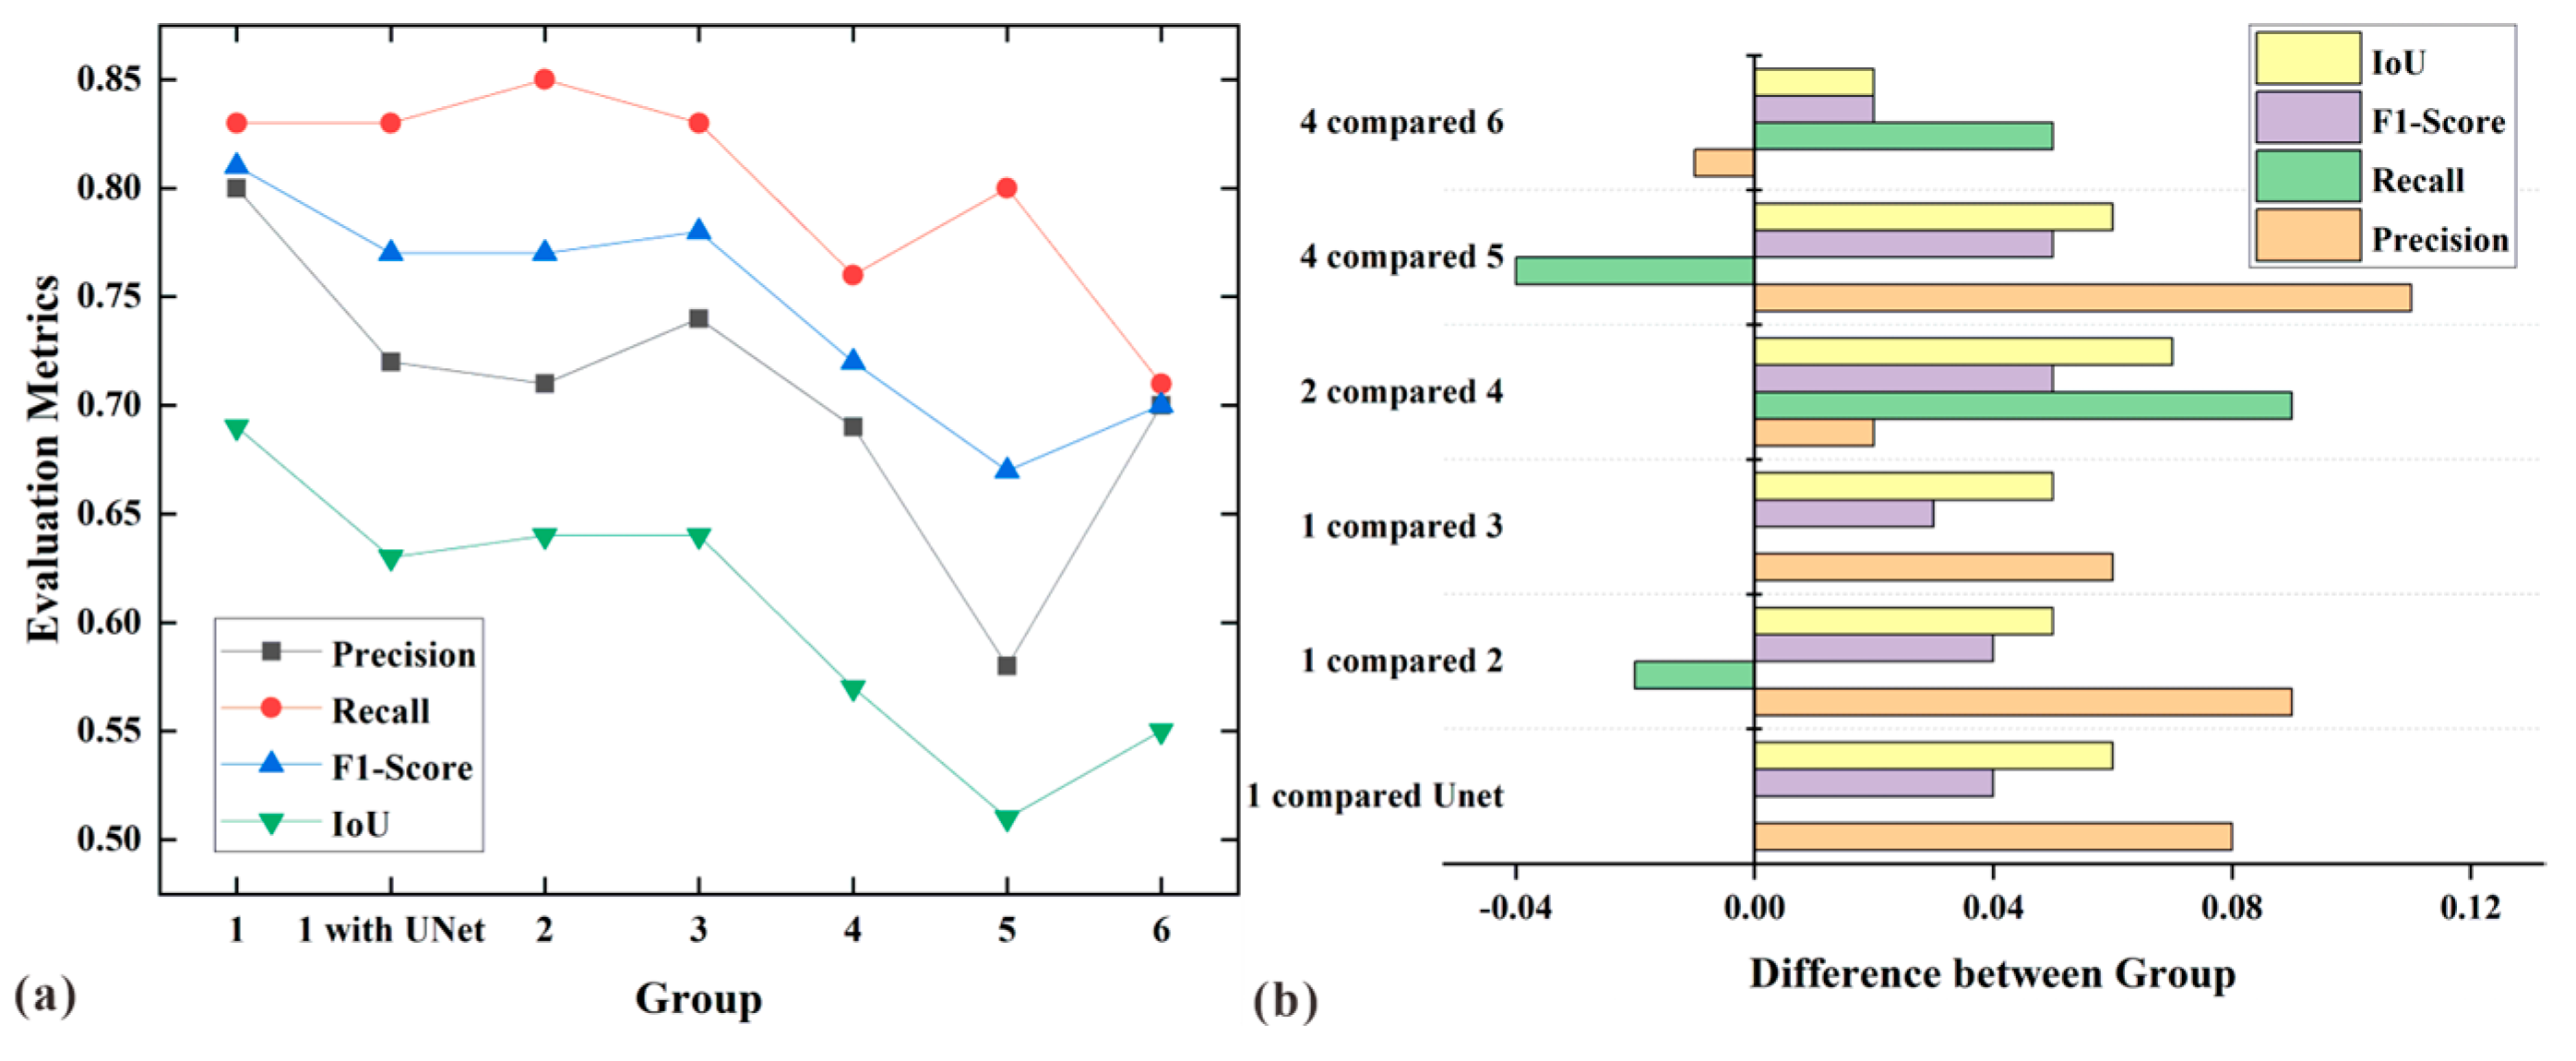
To visually assess the score differences among the experimental groups in Hokkaido, we created a statistical distribution plot containing all results, and the relevant statistical data are presented in Figure 8. Figure 8 shows that Group 1, employing the ascending and descending time-series backscatter coefficient fusion strategy, excels in various aspects. Group 1, using the DPPA-UNet model, achieved a 5.19% increase in the F1 score compared to Group 1, using the baseline UNet model, demonstrating the performance enhancement of the DPPA-UNet. When compared to the single-orbit methods of Group 2 and Group 3, which only use ascending or descending orbits, Group 1 employing the ascending and descending fusion strategy achieved increases of 5.19% and 3.85% in the F1 score, respectively, indicating the improved precision in landslide identification by the fusion strategy. Group 2, using the time series imagery, showed a 6.94% increase in the F1 score compared to Group 4, which used only pre- and post-event imagery. This result suggests that the time series change method more effectively extracts landslide features, making landslide identification easier for the model. In the experiments, Group 4, utilizing VV and VH backscatter coefficients, outperformed Group 5 and Group 6, which used single polarizations, with F1 score improvements of 7.46% and 2.86%, respectively. Group 5 performed worse than Group 6, indicating that VH polarization has less capability in landslide recognition in the Hokkaido region than VV polarization.
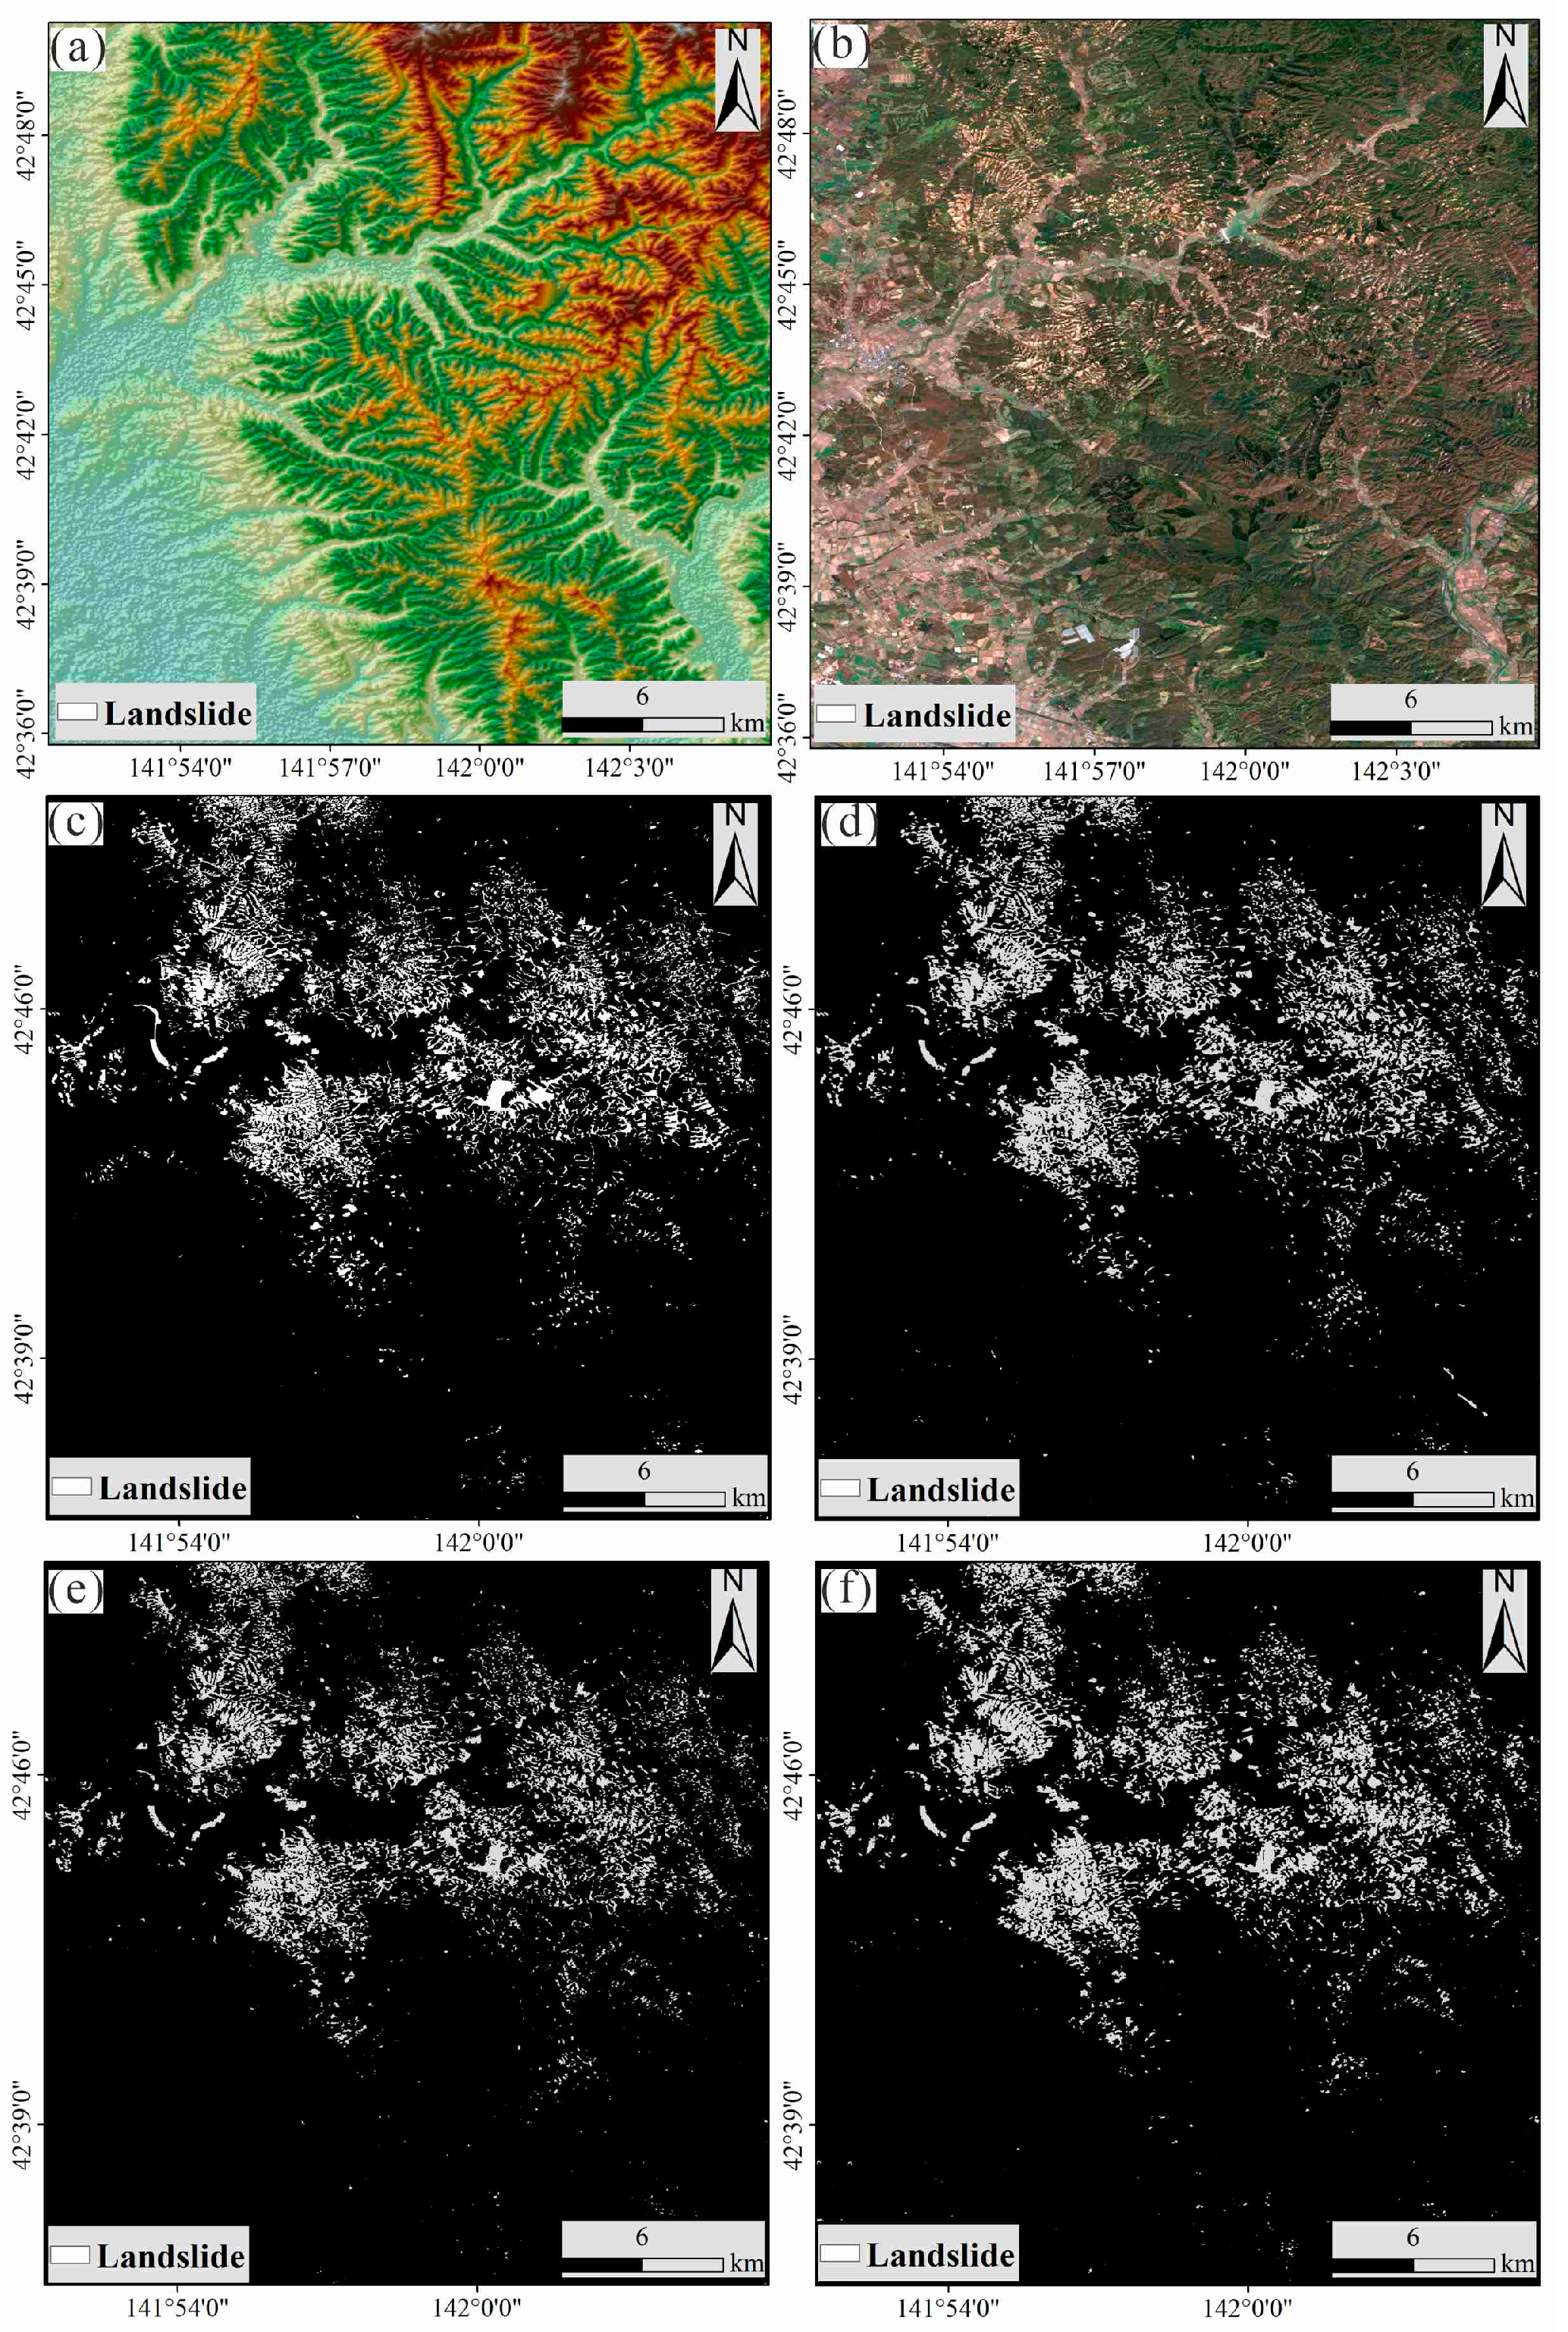
In our study, we utilized the weights obtained from the best training results in the Hokkaido training set and applied these to the validation area. As demonstrated in Figure 9, this process effectively identified the primary distribution of landslides within the validation area. Most medium- to large-scale landslides were accurately detected, providing robust support for our approach. However, due to the limitations in SAR data resolution, some omissions and false alarms may be found at the edges of some landslides. Despite these challenges, our research findings indicate that we can successfully identify large-scale mountainous landslides by training with a small-scale model and employing transfer learning. This demonstrates the effectiveness and feasibility of our approach.

4.2. Papua New Guinea Landslide

Situated near the equator, the Papua New Guinea region falls within the tropical rainforest climate zone. Its distinctive climatic conditions, encompassing factors such as sunlight, temperature, and humidity, notably influence satellite monitoring. These unique climatic conditions present specific challenges for radar data applications in this area. Furthermore, the widespread landslide events triggered by the Mw 7.5 earthquake on 25 February 2018, have heightened the complexity and difficulty of landslide detection tasks. Using the Papua New Guinea earthquake event as a case study, this study aims to validate the proposed methods’ applicability further and assess the influence of different combinations on landslide detection. Figure 10 illustrates the landslide detection results obtained during the Papua New Guinea earthquake and the cloud removal and mosaicking results of Sentinel-2 optical imagery from 26 February 2018 to 30 December 2018. From the results in Figure 10, it can be observed that the various experimental groups exhibit relatively comprehensive representations of landslides in terms of their area, distribution, and edge information, effectively reflecting the landslide event. However, some smaller-scale landslides, such as those in the P2 area, and areas with landslide boundaries prone to confusion with adjacent landslides, such as the P3 area, are still overlooked. These issues may be attributed to the insufficient image resolution of the satellites. From the Sentinel-2 optical imagery in Figure 10b, it can be observed that despite the cloud removal and mosaicking processes, visual identification of landslides remains challenging due to the severe cloud cover affecting the study area for most of the year. This further underscores the advantages of using SAR imagery for landslide detection.
In the landslide recognition experiments conducted in Papua New Guinea, we similarly partitioned the training samples in a random 8:2 ratio to ensure no overlap. Table 4 presents the training scores for the optimal weights. It can be observed from this table that the optimal learning rates, filter quantities, and batch sizes exhibit a nearly random trend under different experimental combinations. For experiments conducted within Group 1 through Group 6, we observe F1 scores ranging from 0.58 to 0.74. Notably, the employment of the DPPA-UNet model within Group 1 achieves an impressive F1 score of 0.74, a significant improvement compared to Group 1 using the baseline UNet model. This outcome strongly supports the effectiveness of the DPPA-UNet model in enhancing SAR image landslide recognition performance. Through a comparison of the results from Group 1 to Group 3, we discern a significant advantage of the time-series fusion method for backscatter coefficients in ascending and descending orbits in terms of the F1 score when compared to the single-orbit method. Likewise, when comparing the results from Group 4 to Group 6, it becomes evident that landslide detection using the combination of polarization channels outperforms cases using either VV or VH polarization alone. These findings further substantiate the efficacy and performance advantages of the proposed methodology.
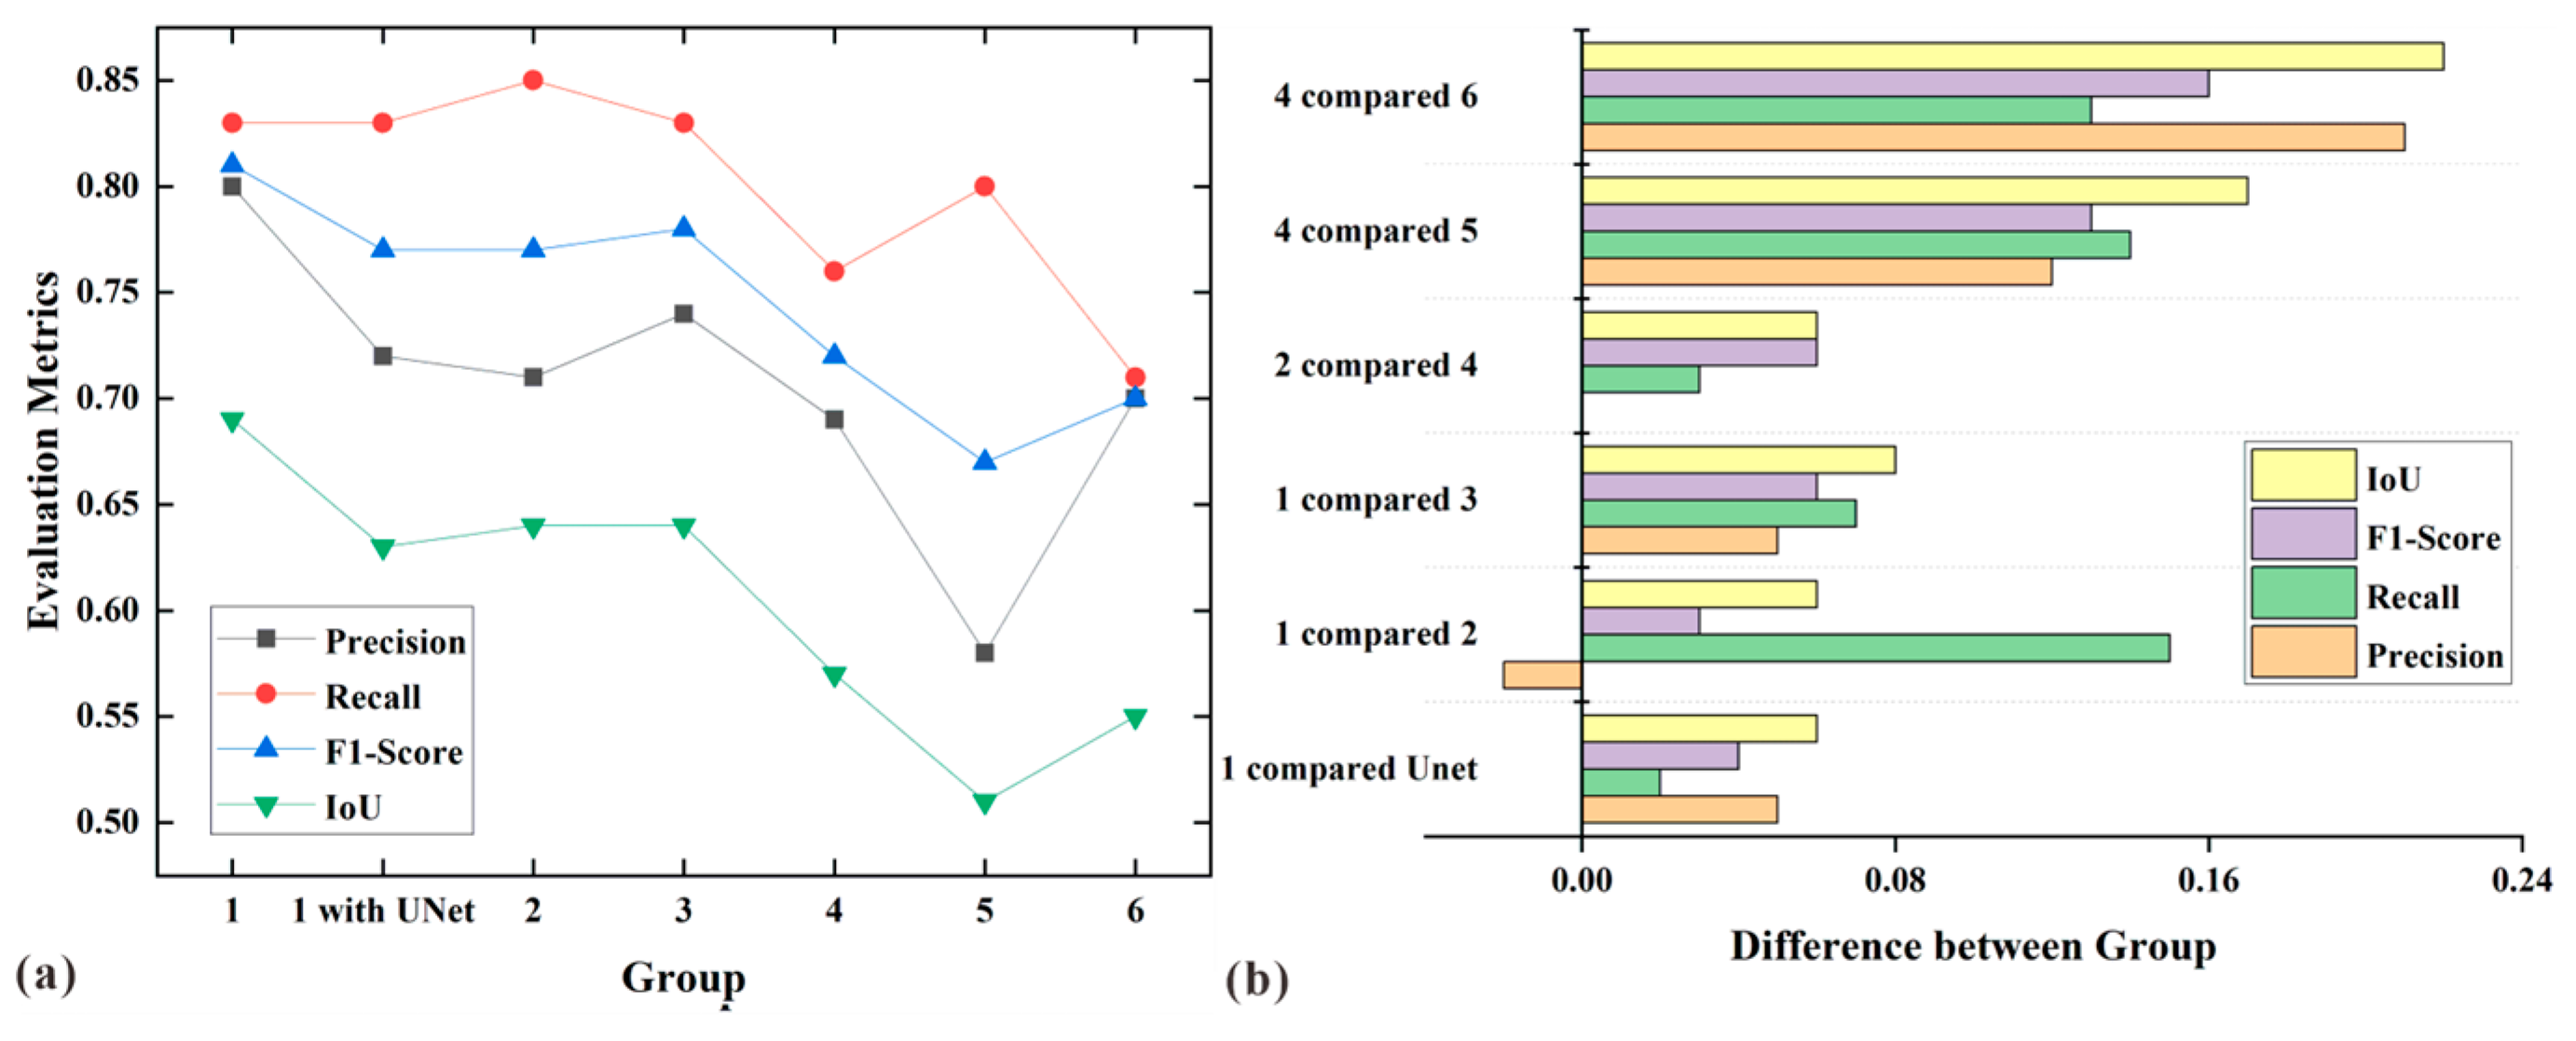
Figure 11 displays the training score statistics for the Papua New Guinea event. From Figure 11, it is evident that Group 1 excels in various aspects. Group 1, utilizing the DPPA-UNet model, achieves a 5.71% improvement in the F1 score compared to Group 1 using the baseline UNet model, further substantiating the superiority of the DPPA-UNet model. Group 1, employing the ascending and descending orbit fusion strategy, outperforms Group 2 and Group 3, utilizing single orbits, with F1 score improvements of 4.23% and 8.82%, respectively. This demonstrates that the ascending and descending orbit fusion strategy enhances landslide recognition accuracy. In Group 2, which utilizes time-series imagery, there is a 9.23% improvement in the F1 score compared to Group 4, which only uses pre- and post-event imagery. This indicates that the use of time-series imagery enhances landslide recognition accuracy. Group 4, incorporating dual-polarization information, outperforms Group 5 and Group 6, which utilize single-polarization data, with F1 score improvements of 6.56% and 12.07%, respectively, underscoring the effectiveness of using dual-polarization information to enhance landslide recognition accuracy. Notably, Group 6, which relies solely on VH polarization, exhibits the poorest performance in the Papua New Guinea region and may not be well-suited for landslide detection needs.
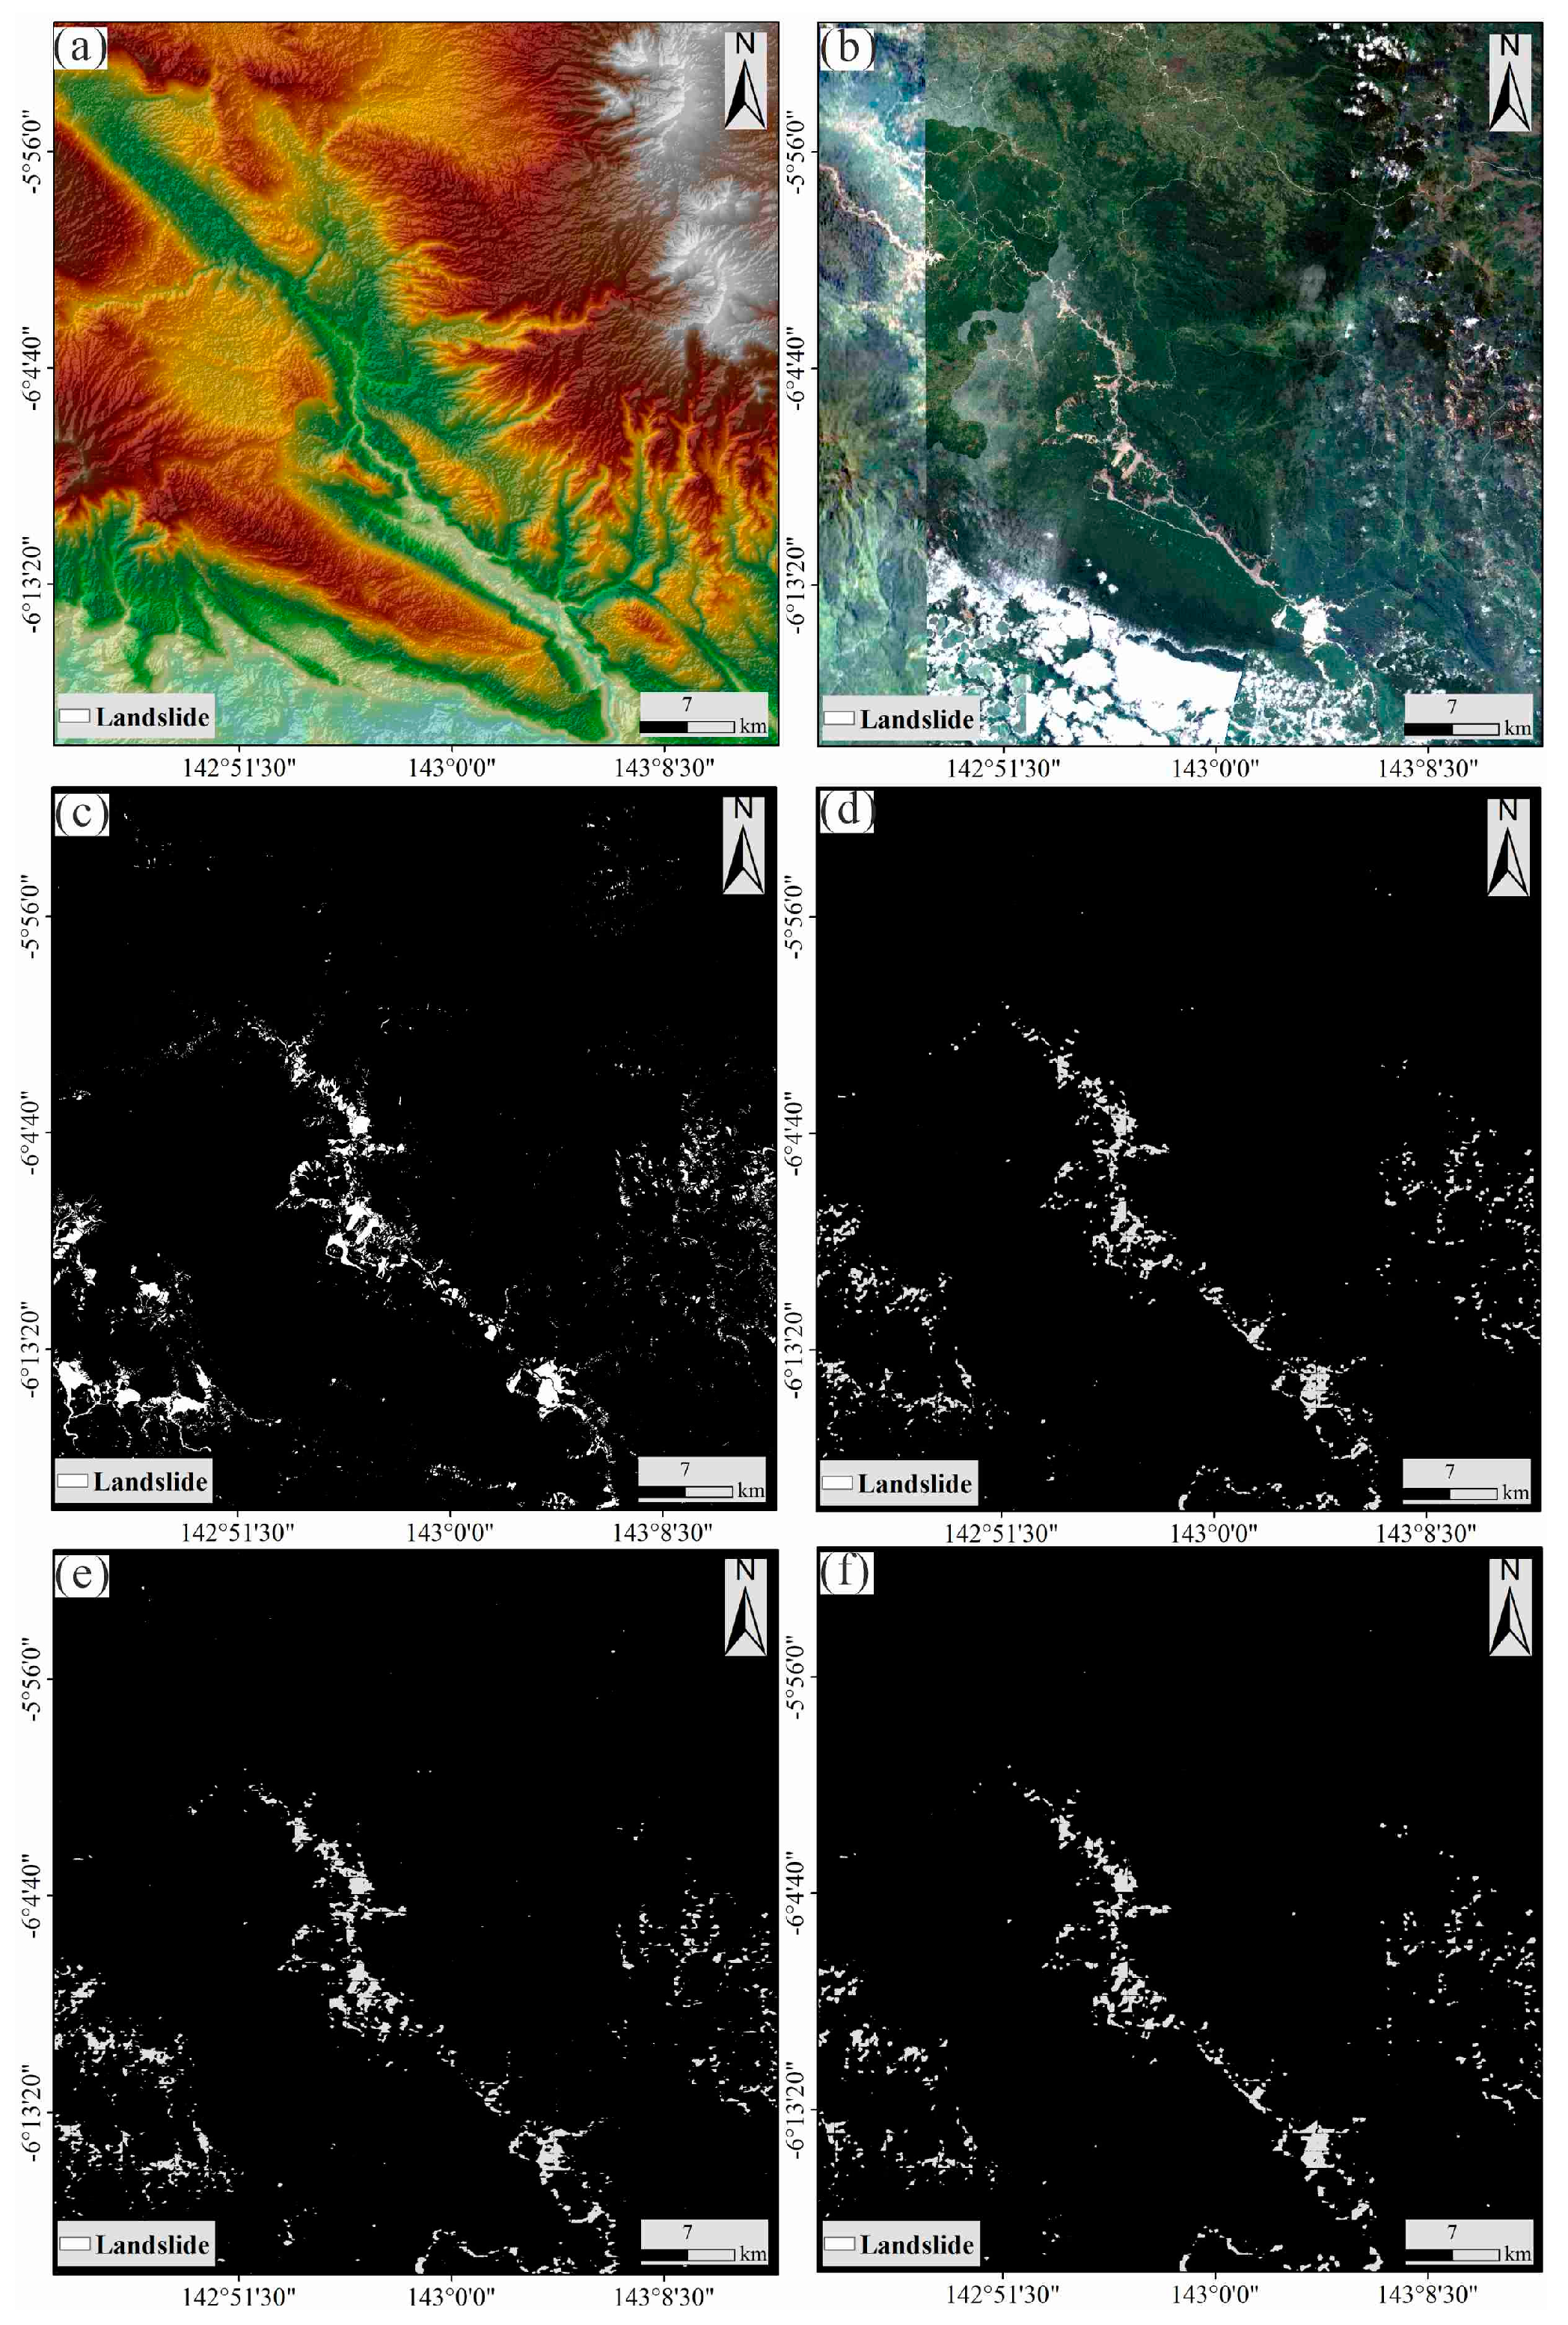
We utilized the weights derived from the best training results of the Papua New Guinea training dataset to perform landslide recognition in the validation area. Figure 12 illustrates the landslide recognition results in the Papua New Guinea validation region. Figure 12 shows the successful identification of landslide distribution within the validation area. Although minor landslides were missed, most medium- to large-scale landslides were correctly detected. However, similar to the results in the Hokkaido study area, we could not eliminate some omissions and false alarms at landslide edges due to the challenges posed by SAR data resolution. Despite these challenges, our research findings indicate that we achieved reliable recognition of extensive mountainous landslides by training small-scale models and employing transfer learning. Overall, our research methodology effectively distinguishes landslides of various sizes, with the detection process for each experimental group taking approximately only 5 min.
The complexity of SAR images has led to the latest algorithms in the field of landslide detection mainly focusing on the application of optical images. In contrast, studies on the changes in backscatter coefficient mapping of SAR images before and after landslides are relatively sparse. Our research introduces and compares a new semantic segmentation algorithm—SegNet. Experimental results show that, in landslide detection using SAR images, our method outperforms SegNet in performance and stability (see Table 3 and Table 4). This difference may stem from the distinct structures of the two models and the influence of data characteristics in different research areas. Our study is based on medium-resolution data from Sentinel-1 SAR. Future research could use high-precision commercial SAR data to enhance landslide detection accuracy.

5. Discussion

5.1. Fusion Results’ Analysis for Ascending and Descending Tracks

In the process of landslide area identification, both ascending and descending SAR data provide valuable information. However, given the geometric distortion characteristics and complexity of SAR imagery, relying solely on the results from either orbit may have specific limitations. Therefore, we propose combining ascending and descending time-series SAR backscatter coefficients to enhance landslide identification. This fusion approach aims to integrate the landslide identification results from ascending and descending orbits, offering a more comprehensive and accurate recognition of landslide areas. This method holds the potential to effectively address the limitations of single-orbit data and improve the reliability of landslide identification.
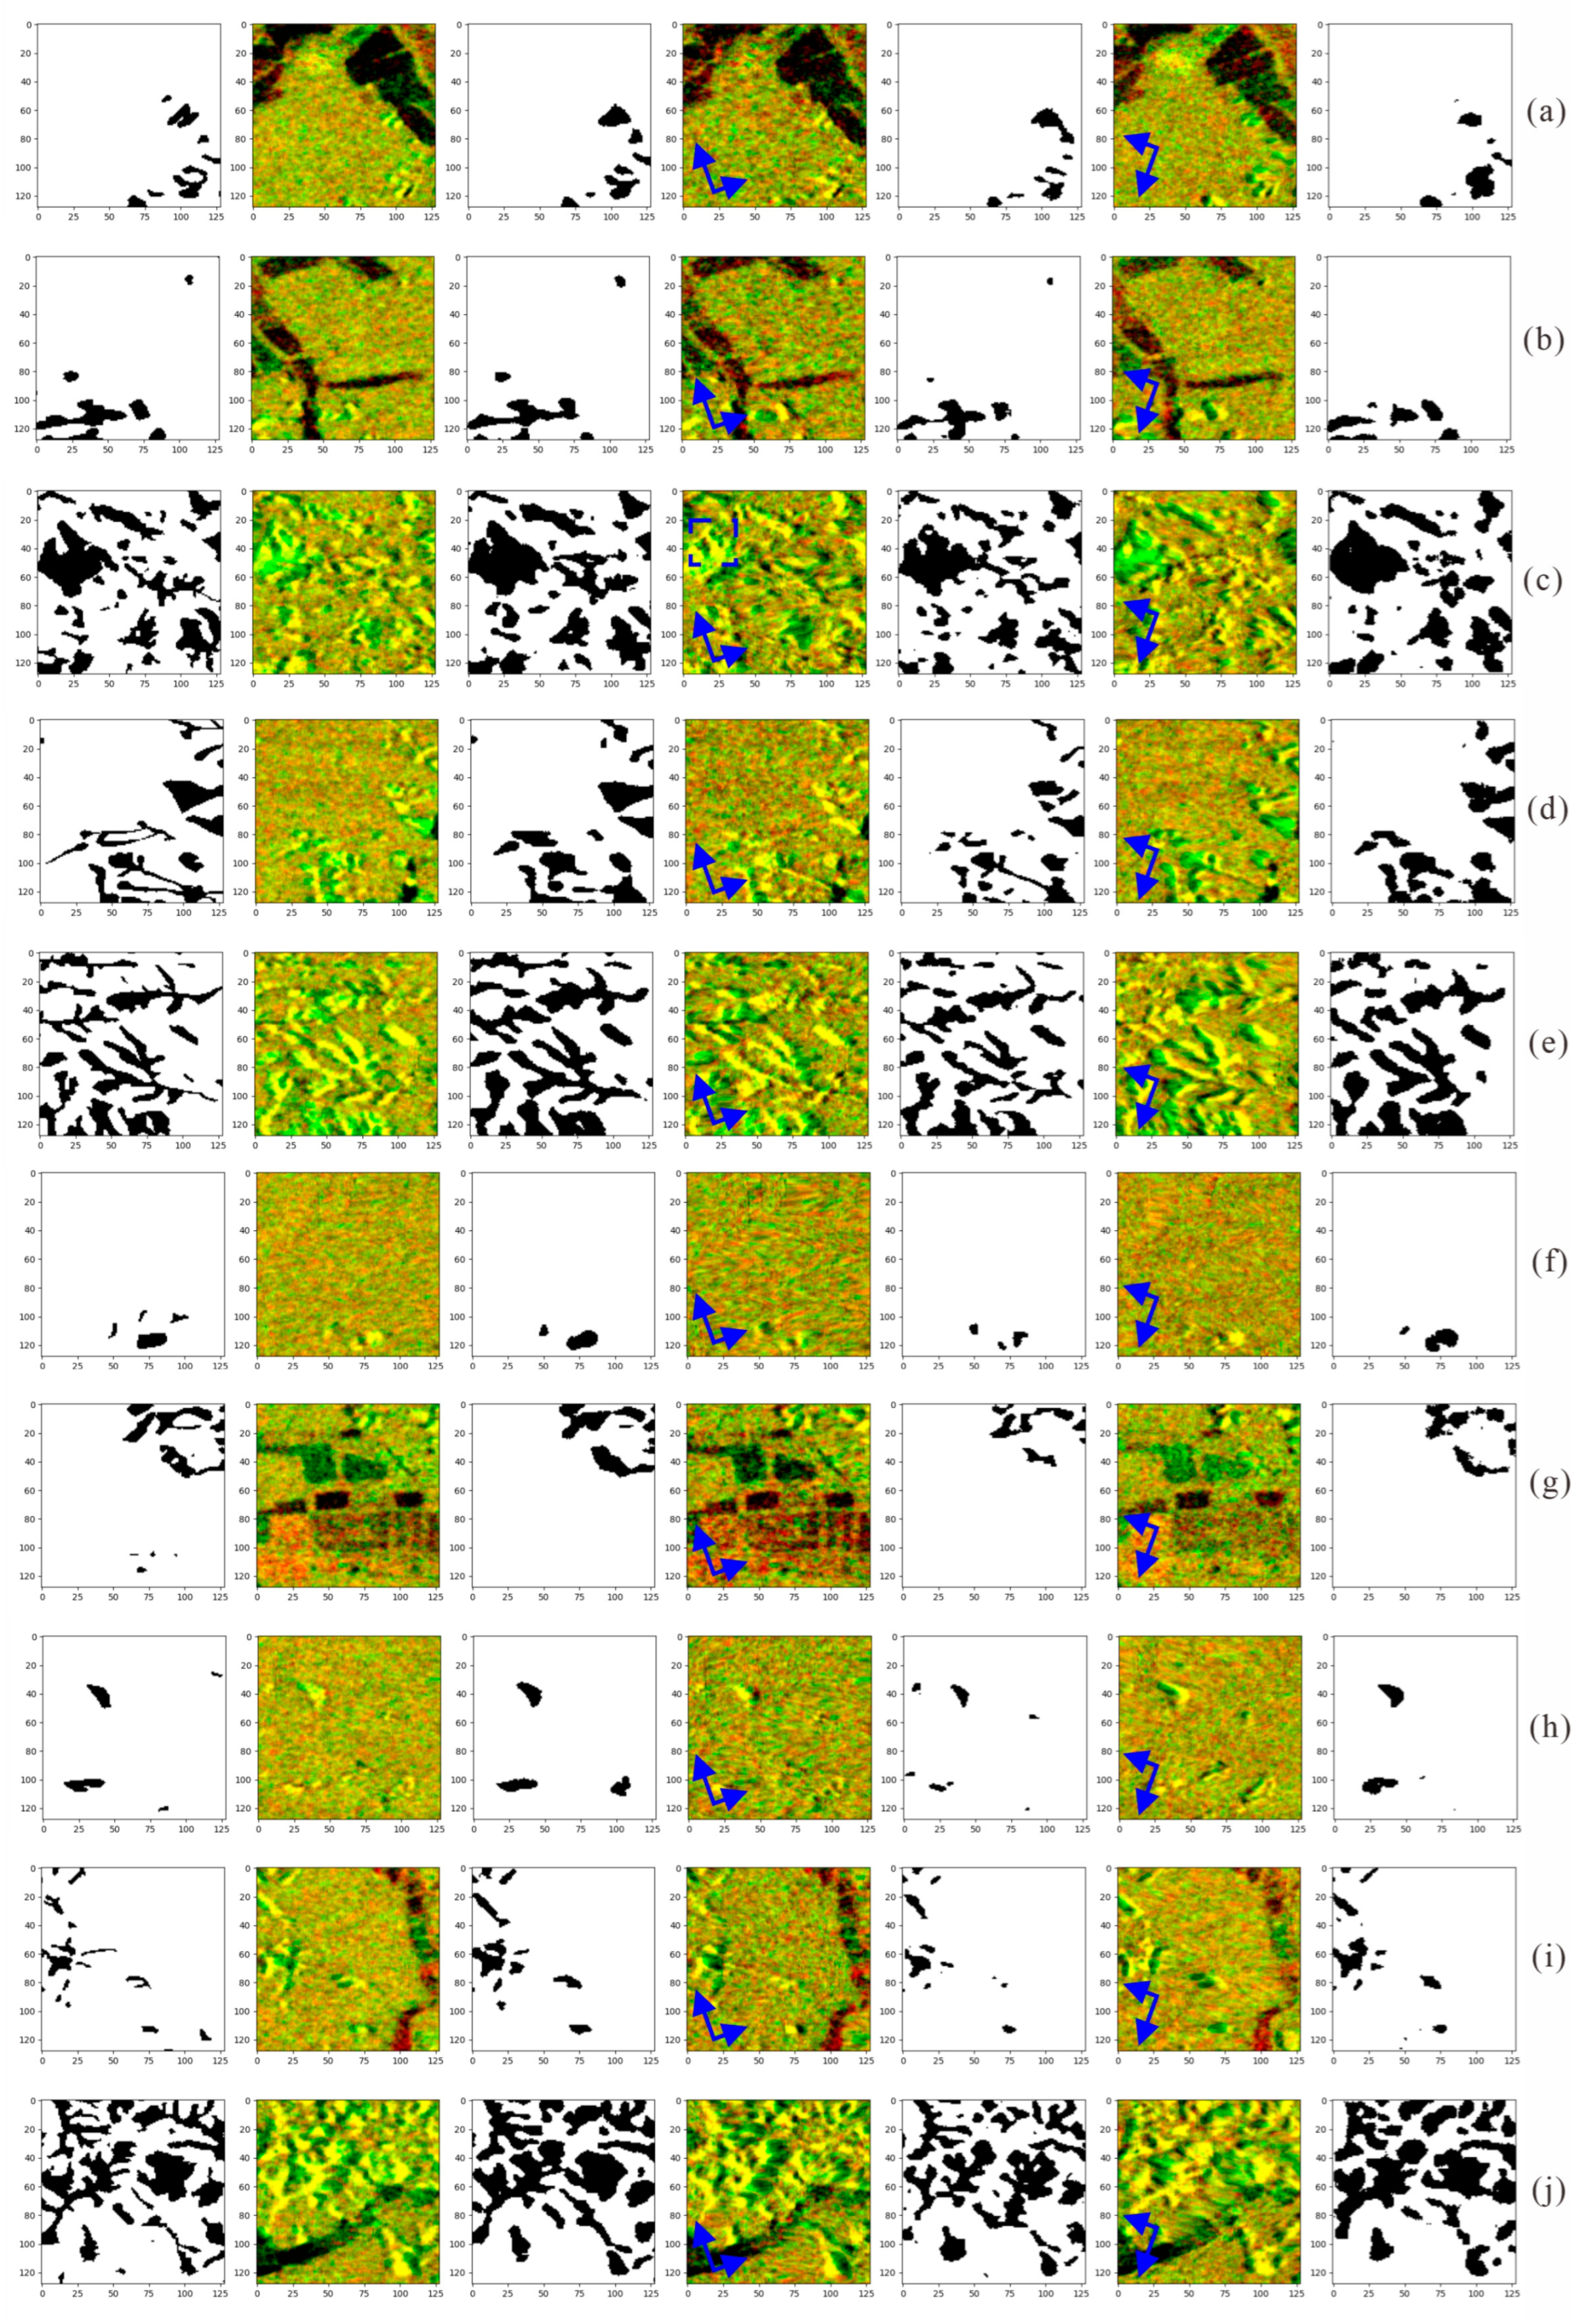
Figure 13 compares partial landslide identification results and SAR backscatter coefficients in the Hokkaido validation area. Figure 13 clearly illustrates the strong performance of Group 1 in identifying actual landslides. However, it is worth noting that there are occasional omissions and false alarms near the edges of landslides. These occurrences can be attributed to the limited resolution of Sentinel-1A SAR imagery and the relatively poor vegetation penetration of the C-band radar. Some landslides are comparable to or even smaller than the resolution of Sentinel-1A, which can result in their omission or incorrect classification as larger landslides. Observations from Figure 13a–c reveal that when using descending orbit data, there are instances of missing landslide identification results, especially on the far side of the satellite’s line of sight.
Similarly, in Figure 13d–j, there may be missing landslide identification when using ascending orbit data. These absent occurrences are mainly influenced by the characteristics of SAR satellite single-orbit data, as they are susceptible to geometric distortion features of SAR imagery, particularly on the side facing away from the satellite. However, the landslide identification results of Group 1, which employs the fusion of ascending and descending orbit data, appear more comprehensive. They more thoroughly encompass landslides’ size and edge information than single-orbit data identification. This further validates the superiority of our approach in overcoming the limitations of single-orbit data, thereby enhancing the accuracy and reliability of landslide identification.
The region of Papua New Guinea is situated near the equator, characterized by a tropical rainforest climate. The climatic conditions in this area, including factors such as illumination, temperature, and humidity, significantly impact the quality and availability of SAR imagery. Figure 14 displays the landslide identification results in the Papua New Guinea validation area compared to the corresponding SAR imagery. Figure 13 shows that Group 1 performs well in landslide identification in the Papua New Guinea region. The landslide identification results using fused SAR imagery data from ascending and descending orbits appear more comprehensive in the Papua New Guinea region. Compared to identifications relying solely on single-orbit data, these results provide a more comprehensive understanding of landslide features, including size and edge information. This improvement suggests that the fusion of SAR imagery from ascending and descending orbits can significantly mitigate the impact of geometric distortions, thus enhancing the accuracy and reliability of landslide identification. This further underscores the effectiveness of our approach, particularly in addressing challenges such as tropical rainforest climates and complex terrains, highlighting distinct advantages. However, similar to the Hokkaido validation area, landslide identification results in the Papua New Guinea region may exhibit some omissions and false alarms near the landslide edges. Some small landslides may be incorrectly classified as more significant or missed during identification.

5.2. Impact of Polarization Patterns on Results

This paper introduces a novel method for landslide identification, which leverages the fusion of ascending and descending time-series SAR imagery and a dual-polarized pixel attention UNet. The findings from our research, based on data from two seismic events, suggest that relying solely on single polarization may not yield optimal results across diverse study areas.
In the Hokkaido area, it was evident that the F1 score achieved better results when employing VH polarization than VV polarization. In contrast, our observations in Papua New Guinea revealed that VV polarization outperformed VH polarization regarding the F1 score. Furthermore, the F1 score using both VV and VH polarizations exceeded that of single polarization in both study areas.
First, using single-polarization data offers restricted terrain information and remains vulnerable to external interference, ultimately resulting in an incomplete detection of abnormal variations in landslides. Landslide events typically lead to concurrent alterations in terrain roughness and surface moisture levels. VV polarization primarily characterizes terrain roughness in this context, while VH polarization predominantly conveys surface moisture and material composition information. VV/VH polarizations also capture the Earth’s surface’s vertical and horizontal polarization properties, rendering single polarization vulnerable to interference factors such as ground clutter, multiple scattering, and external interference.
Fusing VV and VH polarizations allows for the integration of a broader range of feature information, enhancing the model’s capacity to discern the scattering attributes of various terrain targets accurately. This paper also calculates the time-series SAR backscattering coefficients of VV/VH polarizations before and after the events, emphasizing the SAR echo anomalies induced by the circumstances and aiding the model in better identifying and distinguishing normal and abnormal situations. Furthermore, the DPPA-UNet model supports dual-polarized pixel attention, enabling it to better learn and differentiate between normal and abnormal conditions.
In our experiments conducted in Papua New Guinea, we observed relatively poorer performance when using VH polarization alone, and the landslide features on SAR images were less pronounced than in the Hokkaido region. This finding may be linked to Papua New Guinea’s geographical location within the tropical rainforest climate belt near the equator. In this region, environmental variables, including lighting conditions, temperature, and humidity, substantially influence satellite surveillance. Humidity substantially controls VH polarization, increasing data complexity and reducing the model’s detection capabilities. These differences further underscore the importance of multi-polarization data, mainly when dealing with landslide identification tasks in diverse climatic and geographical conditions.

5.3. Model Performance Enhancement Directions’ Analysis

This study employs a straightforward and effective method for landslide detection, designed to be accessible to a broad range of researchers and practitioners in landslide disaster research. Despite its simplicity in design, this method demonstrated robust performance in the two experiments conducted in this paper, underscoring its value in practical applications. At the start of the research, the impact of the time series and dual-polarization information of SAR images on landslide prediction was unclear. For instance, attempts to integrate SAR visibility’s ascending and descending track information did not enhance performance in early tests. In two research areas, we validated the landslide detection accuracy of DPPA-UNet and time-series dual-polarized SAR images. We provided a complete SAR data processing strategy and model parameters, which are our new contributions to the field of SAR landslide identification.
The availability of labeled training data often limits the selection of network architecture. This paper trained our model using ascending and descending time-series dual-polarization SAR fusion imagery. The UNet architecture is extensively utilized in remote sensing applications, including the analysis of SAR imagery, and provides a range of viable data labeling strategies [60]. Therefore, one of the reasons we chose UNet as our baseline model is its well-validated design, drawing from the experiences of other SAR image analysis research. Furthermore, we constructed a dual-polarized pixel attention UNet to integrate dual-polarization channel information better and enhance its ability to focus on essential pixel regions, thereby improving landslide segmentation performance.
Other recognition algorithms, such as panoramic segmentation [61], typically require more training data and computational resources, potentially necessitating a longer convergence time. Instance segmentation algorithms, such as Mask R-CNN [62], often converge relatively quickly but usually demand more annotation work since each instance of an object requires individual labeling. The UNet architecture we employed is a semantic segmentation algorithm that converges relatively swiftly. This is because the model focuses solely on the semantic classification of each pixel in the image without the need to distinguish between different object instances. Furthermore, UNet can learn and represent complex spatial patterns and features, making it well-suited for our landslide recognition task. During the experimental process, each set of experiments took approximately 50 min for the training phase. Once the model training is complete, utilizing these well-trained weights for landslide recognition in the validation set only requires a few minutes.
Recently, some more modern image segmentation models, such as Segformer [63], have gained widespread usage. Segformer’s design objectives include breakthroughs in improving speed, addressing the inflexibility of positional encoding, and enhancing segmentation performance. Although advanced network architectures such as Segformer may offer superior performance, we adopted a UNet with pixel attention mechanisms to balance performance, the availability of labeled training data, and interpretability. We recognize that numerous other network architectures merit exploration, and future research can assess their performance in the context of landslide recognition using SAR.
While this study employed an ascending and descending time-series SAR image fusion strategy, it is important to note that applying the training weights from this study directly to another study area with a relatively small overall training sample size may significantly impact the effectiveness of landslide recognition. This is primarily because SAR image formation is influenced by surface physical characteristics, and under different geological and climatic conditions, the features of landslides and the performance of SAR images may vary.
Taking the Hokkaido region as an example, as illustrated in Figure 13, the features of landslides are relatively straightforward and visible in the images extracted using the ascending and descending time-series SAR image fusion strategy. However, in the Papua New Guinea region, even with image fusion, the features of landslides remain highly challenging to interpret visually. This indicates that the recognizability of landslides may be significantly influenced by regional climate and geological conditions.
We propose several potential improvement strategies to enhance the applicability and generalization capability of the DPPA-UNet model. An alternative approach entails collecting historical SAR images and matching optical imagery from prominent landslide-prone areas across the globe. Subsequently, the model can be retrained using the visual imagery’s landslide labels. Expanding the training dataset enables the model to improve its adaptability to diverse geographical conditions, enhancing its overall generalization performance.
Another potential improvement approach involves considering incremental learning and simulated landslide training datasets. Incremental learning allows for further training of a pretrained model with new data. The model can progressively acclimate to diverse datasets encompassing varying geographical and climatic conditions through the ongoing introduction of new data and the practice of incremental learning. This iterative process contributes to the enhancement of its generalization performance. For instance, as demonstrated in the research by Anantrasirichai et al. [64], an attempt can be made to generate simulated training samples. A substantial amount of landslide images and corresponding label data can be caused by simulating landslides under various geographical and climatic conditions. These simulated datasets can then retrain the model, improving its ability to recognize and predict landslides in diverse environments.
Furthermore, transfer learning is another viable solution worth considering. Through the initial training on a comprehensive large-scale dataset and subsequent fine-tuning on a new dataset, we can leverage the knowledge acquired by the model from the expansive dataset and tailor it to datasets originating from various geographical and climatic conditions. This process, in turn, contributes to augmenting its generalization performance.
In future studies, we can also investigate integrating various supplementary data sources, such as optical imagery, geological information, climate data, and lithological data. Methods that have proven successful in ground subsidence detection involve improving model detection performance by integrating multi-source auxiliary data [65]. Hence, in upcoming research, there is potential for further exploration of the inclusion of these multi-source supplementary data in our approach to enhance the results of landslide detection.

6. Conclusions

Considering the complexity of SAR imagery and potential issues such as distortion and geometric distortion that can arise during data acquisition on steep terrain, this study proposes an innovative dual-polarization SAR image landslide recognition method. By integrating ascending and descending time-series information and considering polarization channel information, we constructed a dual-polarized pixel attention UNet model considering multi-temporal image features. After training and transfer learning on a small-scale model, we successfully applied this method to landslide identification in large mountainous regions.
In this study, Sentinel-1 SAR dual-polarization data served as the primary data source for experimentation. Across different study regions, Group 1, which employed the ascending and descending time-series backscatter coefficient fusion strategy, demonstrated excellent performance in landslide recognition tasks. Specifically, in the Hokkaido landslide recognition task, Group 1 achieved an F1 score improvements of 5.19% and 3.85% compared to Group 2 and Group 3, which used single-orbit data only. In the Papua New Guinea landslide recognition task, Group 1 outperformed Group 2 and Group 3 by achieving F1 score improvements of 4.23% and 8.82%, respectively. These results underscore the significant enhancement in the accuracy and reliability of landslide recognition brought about by the ascending and descending orbit fusion strategy.
On the other hand, Group 2, utilizing time-series imagery, achieved F1 score improvements of 6.94% and 9.23% in the Hokkaido and Papua New Guinea landslide recognition tasks, respectively, compared to Group 4, which used pre- and post-event imagery only. This further validates the effectiveness of utilizing time-series information for extracting landslide features and enhancing the model’s accuracy in landslide recognition.
The application of dual-polarization information also yielded notable results in landslide recognition. In the Hokkaido landslide recognition task, Group 4, which utilized VV and VH backscatter coefficients, achieved F1 score improvements of 7.46% and 2.86% compared to Group 5 and Group 6, respectively, which used single-polarization data. Similarly, in the Papua New Guinea landslide recognition task, Group 4 outperformed Group 5 and Group 6 by achieving F1 score improvements of 6.56% and 12.07%, respectively. However, landslide recognition does present particular challenges, such as the potential for omissions and false alarms near landslide edges due to factors such as SAR image resolution limitations and complex terrain.
The method proposed in this paper demonstrated strong landslide recognition capabilities in different study regions (Hokkaido and Papua New Guinea). These capabilities are significant in assessing global landslide disasters and facilitating post-disaster recovery initiatives. Future research can consider expanding the training dataset, exploring more advanced deep learning architectures, and integrating multi-source auxiliary data to enhance landslide recognition performance further. This will make our approach more versatile and adaptable to landslide monitoring tasks in diverse geographical and climatic conditions.

Author Contributions

Conceptualization, B.P. and X.S.; writing—original draft preparation, X.S. All authors have read and agreed to the published version of the manuscript.

Funding

This research received partial funding from the Fengjian Highway Safety Intelligent Construction Technology Demonstration Project (Project No. 1504-250071559) in the Three Gorges Reservoir area.

Data Availability Statement

The original satellite data used in this study can be obtained from the European Space Agency (ESA). Additionally, the data supporting the findings of this study can be requested from the corresponding author upon reasonable request.

Conflicts of Interest

There are no conflict of interest/competing interest among authors.

References

  1. Yao, J.; Yao, X.; Zhao, Z.; Liu, X. Performance comparison of landslide susceptibility mapping under multiple machine-learning based models considering InSAR deformation: A case study of the upper Jinsha River. Geomat. Nat. Hazards Risk 2023, 14, 2212833. [Google Scholar] [CrossRef]
  2. Liu, Y.; Xu, P.; Cao, C.; Zhang, W.; Zhao, M.; Zhu, K. Geomorphological transformations and future deformation estimations of a large potential landslide in the high-order position area of Diexi, China. Geocarto Int. 2023, 38, 2197514. [Google Scholar] [CrossRef]
  3. He, Y.; Wang, W.; Zhang, L.; Chen, Y.; Chen, Y.; Chen, B.; He, X.; Zhao, Z. An identification method of potential landslide zones using InSAR data and landslide susceptibility. Geomat. Nat. Hazards Risk 2023, 14, 2185120. [Google Scholar] [CrossRef]
  4. Dong, J.; Niu, R.; Li, B.; Xu, H.; Wang, S. Potential landslides identification based on temporal and spatial filtering of SBAS-InSAR results. Geomat. Nat. Hazards Risk 2023, 14, 52–75. [Google Scholar] [CrossRef]
  5. Fang, K.; Tang, H.; Li, C.; Su, X.; An, P.; Sun, S. Centrifuge modelling of landslides and landslide hazard mitigation: A review. Geosci. Front. 2023, 14, 101493. [Google Scholar] [CrossRef]
  6. Dai, K.; Feng, Y.; Zhuo, G.; Tie, Y.; Deng, J.; Balz, T.; Li, Z. Applicability Analysis of Potential Landslide Identification by InSAR in Alpine-Canyon Terrain—Case Study on Yalong River. IEEE J. Sel. Top. Appl. Earth Obs. Remote Sens. 2022, 15, 2110–2118. [Google Scholar] [CrossRef]
  7. Bhuyan, K.; Tanyaş, H.; Nava, L.; Puliero, S.; Meena, S.R.; Floris, M.; van Westen, C.; Catani, F. Generating multi-temporal landslide inventories through a general deep transfer learning strategy using HR EO data. Sci. Rep. 2023, 13, 162. [Google Scholar] [CrossRef]
  8. Hussain, M.A.; Chen, Z.; Zheng, Y.; Shoaib, M.; Shah, S.U.; Ali, N.; Afzal, Z. Landslide susceptibility mapping using machine learning algorithm validated by persistent scatterer In-SAR technique. Sensors 2022, 22, 3119. [Google Scholar] [CrossRef]
  9. Zhang, X.; Pun, M.-O.; Liu, M. Semi-supervised multi-temporal deep representation fusion network for landslide mapping from aerial orthophotos. Remote Sens. 2021, 13, 548. [Google Scholar] [CrossRef]
  10. Ye, C.; Li, Y.; Cui, P.; Liang, L.; Pirasteh, S.; Marcato, J.; Goncalves, W.N.; Li, J. Landslide detection of hyperspectral remote sensing data based on deep learning with constrains. IEEE J. Sel. Top. Appl. Earth Obs. Remote Sens. 2019, 12, 5047–5060. [Google Scholar] [CrossRef]
  11. Chen, Z.; Zhang, Y.; Ouyang, C.; Zhang, F.; Ma, J. Automated landslides detection for mountain cities using multi-temporal remote sensing imagery. Sensors 2018, 18, 821. [Google Scholar] [CrossRef] [PubMed]
  12. Shao, X.; Xu, C. Earthquake-induced landslides susceptibility assessment: A review of the state-of-the-art. Nat. Hazards Res. 2022, 2, 172–182. [Google Scholar] [CrossRef]
  13. Catani, F. Landslide detection by deep learning of non-nadiral and crowdsourced optical images. Landslides 2021, 18, 1025–1044. [Google Scholar] [CrossRef]
  14. Guo, X.; Stoesser, T.; Zheng, D.; Luo, Q.; Liu, X.; Nian, T. A methodology to predict the run-out distance of submarine landslides. Comput. Geotech. 2023, 153, 105073. [Google Scholar] [CrossRef]
  15. Hamidi, E.; Peter, B.G.; Muñoz, D.F.; Moftakhari, H.; Moradkhani, H. Fast Flood Extent Monitoring With SAR Change Detection Using Google Earth Engine. IEEE Trans. Geosci. Remote Sens. 2023, 61, 1–19. [Google Scholar] [CrossRef]
  16. Nava, L.; Monserrat, O.; Catani, F. Improving landslide detection on SAR data through deep learning. IEEE Geosci. Remote Sens. Lett. 2021, 19, 1–5. [Google Scholar] [CrossRef]
  17. Scardigli, A.; Risser, L.; Haddouche, C.; Jatiault, R. Integrating Unordered Time Frames in Neural Networks: Application to the Detection of Natural Oil Slicks in Satellite Images. IEEE Trans. Geosci. Remote Sens. 2023, 61, 1–14. [Google Scholar] [CrossRef]
  18. Shi, X.; Pan, B. LADSDIn: LiCSAR-Based Anomaly Detector of Seismic Deformation in InSAR. IEEE J. Sel. Top. Appl. Earth Obs. Remote Sens. 2023, 16, 4400–4413. [Google Scholar] [CrossRef]
  19. Samsonov, S.; Blais-Stevens, A. Satellite interferometry for regional assessment of landslide hazard to pipelines in northeastern British Columbia, Canada. Int. J. Appl. Earth Obs. Geoinf. 2023, 118, 103273. [Google Scholar] [CrossRef]
  20. Shen, Y.; Dai, K.; Wu, M.; Zhuo, G.; Wang, M.; Wang, T.; Xu, Q. Rapid and Automatic Detection of New Potential Landslide Based on Phase-Gradient DInSAR. IEEE Geosci. Remote Sens. Lett. 2022, 19, 1–5. [Google Scholar]
  21. Mondini, A.C.; Guzzetti, F.; Chang, K.-T.; Monserrat, O.; Martha, T.R.; Manconi, A. Landslide failures detection and mapping using Synthetic Aperture Radar: Past, present and future. Earth-Sci. Rev. 2021, 216, 103574. [Google Scholar] [CrossRef]
  22. Ozturk, U.; Bozzolan, E.; Holcombe, E.A.; Shukla, R.; Pianosi, F.; Wagener, T. How climate change and unplanned urban sprawl bring more landslides. Nature 2022, 608, 262–265. [Google Scholar] [CrossRef]
  23. Dong, J.; Liao, M.; Xu, Q.; Zhang, L.; Tang, M.; Gong, J. Detection and displacement characterization of landslides using multi-temporal satellite SAR interferometry: A case study of Danba County in the Dadu River Basin. Eng. Geol. 2018, 240, 95–109. [Google Scholar] [CrossRef]
  24. Liu, Z.; Qiu, H.; Zhu, Y.; Liu, Y.; Yang, D.; Ma, S.; Zhang, J.; Wang, Y.; Wang, L.; Tang, B. Efficient identification and monitoring of landslides by time-series InSAR combining single-and multi-look phases. Remote Sens. 2022, 14, 1026. [Google Scholar] [CrossRef]
  25. Yang, S.; Li, D.; Liu, Y.; Xu, Z.; Sun, Y.; She, X. Landslide Identification in Human-Modified Alpine and Canyon Area of the Niulan River Basin Based on SBAS-InSAR and Optical Images. Remote Sens. 2023, 15, 1998. [Google Scholar] [CrossRef]
  26. Goorabi, A. Detection of landslide induced by large earthquake using InSAR coherence techniques–Northwest Zagros, Iran. Egypt. J. Remote Sens. Space Sci. 2020, 23, 195–205. [Google Scholar] [CrossRef]
  27. Burrows, K.; Walters, R.J.; Milledge, D.; Densmore, A.L. A systematic exploration of satellite radar coherence methods for rapid landslide detection. Nat. Hazards Earth Syst. Sci. 2020, 20, 3197–3214. [Google Scholar] [CrossRef]
  28. Biondi, F.; Addabbo, P.; Clemente, C.; Orlando, D. Measurements of surface river doppler velocities with along-track InSAR using a single antenna. IEEE J. Sel. Top. Appl. Earth Obs. Remote Sens. 2020, 13, 987–997. [Google Scholar] [CrossRef]
  29. Elyouncha, A.; Eriksson, L.E.; Romeiser, R.; Ulander, L.M. Empirical relationship between the Doppler centroid derived from X-band spaceborne InSAR data and wind vectors. IEEE Trans. Geosci. Remote Sens. 2021, 60, 1–20. [Google Scholar] [CrossRef]
  30. Shi, X.; Wu, Y.; Guo, Q.; Li, N.; Lin, Z.; Qiu, H.; Pan, B. Fast Mapping of Large-Scale Landslides in Sentinel-1 SAR Images Using SPAUNet. IEEE J. Sel. Top. Appl. Earth Obs. Remote Sens. 2023, 16, 7992–8006. [Google Scholar] [CrossRef]
  31. Niu, C.; Zhang, H.; Liu, W.; Li, R.; Hu, T. Using a fully polarimetric SAR to detect landslide in complex surroundings: Case study of 2015 Shenzhen landslide. ISPRS J. Photogramm. Remote Sens. 2021, 174, 56–67. [Google Scholar] [CrossRef]
  32. Santangelo, M.; Cardinali, M.; Bucci, F.; Fiorucci, F.; Mondini, A.C. Exploring event landslide mapping using Sentinel-1 SAR backscatter products. Geomorphology 2022, 397, 108021. [Google Scholar] [CrossRef]
  33. Nava, L.; Bhuyan, K.; Meena, S.R.; Monserrat, O.; Catani, F. Rapid mapping of landslides on SAR data by attention U-Net. Remote Sens. 2022, 14, 1449. [Google Scholar] [CrossRef]
  34. Plank, S.; Twele, A.; Martinis, S. Landslide mapping in vegetated areas using change detection based on optical and polarimetric SAR data. Remote Sens. 2016, 8, 307. [Google Scholar] [CrossRef]
  35. Antara, I.M.O.G.; Shimizu, N.; Osawa, T.; Nuarsa, I.W. An application of SegNet for detecting landslide areas by using fully polarimetric SAR data. Ecotrophic 2019, 13, 215–226. [Google Scholar] [CrossRef]
  36. Huang, Y.; Xie, C.; Li, T.; Xu, C.; He, X.; Shao, X.; Xu, X.; Zhan, T.; Chen, Z. An open-accessed inventory of landslides triggered by the MS 6.8 Luding earthquake, China on September 5, 2022. Earthq. Res. Adv. 2023, 3, 100181. [Google Scholar] [CrossRef]
  37. Zhong, C.; Liu, Y.; Gao, P.; Chen, W.; Li, H.; Hou, Y.; Nuremanguli, T.; Ma, H. Landslide mapping with remote sensing: Challenges and opportunities. Int. J. Remote Sens. 2020, 41, 1555–1581. [Google Scholar] [CrossRef]
  38. Zhou, C.; Cao, Y.; Yin, K.; Intrieri, E.; Catani, F.; Wu, L. Characteristic comparison of seepage-driven and buoyancy-driven landslides in Three Gorges Reservoir area, China. Eng. Geol. 2022, 301, 106590. [Google Scholar] [CrossRef]
  39. Ohki, M.; Abe, T.; Tadono, T.; Shimada, M. Landslide detection in mountainous forest areas using polarimetry and interferometric coherence. Earth Planets Space 2020, 72, 67. [Google Scholar] [CrossRef]
  40. Colesanti, C.; Wasowski, J. Investigating landslides with space-borne Synthetic Aperture Radar (SAR) interferometry. Eng. Geol. 2006, 88, 173–199. [Google Scholar] [CrossRef]
  41. Ren, T.; Gong, W.; Bowa, V.M.; Tang, H.; Chen, J.; Zhao, F. An Improved R-Index Model for Terrain Visibility Analysis for Landslide Monitoring with InSAR. Remote Sens. 2021, 13, 1938. [Google Scholar] [CrossRef]
  42. Trebing, K.; Staǹczyk, T.; Mehrkanoon, S. SmaAt-UNet: Precipitation nowcasting using a small attention-UNet architecture. Pattern Recognit. Lett. 2021, 145, 178–186. [Google Scholar] [CrossRef]
  43. Bousias Alexakis, E.; Armenakis, C. Evaluation of UNet and UNet++ architectures in high resolution image change detection applications. Int. Arch. Photogramm. Remote Sens. Spat. Inf. Sci. 2020, 43, 1507–1514. [Google Scholar] [CrossRef]
  44. Hameed, A.A.; Karlik, B.; Salman, M.S. Back-propagation algorithm with variable adaptive momentum. Knowl.-Based Syst. 2016, 114, 79–87. [Google Scholar] [CrossRef]
  45. Farahnakian, F.; Sheikh, J.; Farahnakian, F.; Heikkonen, J. A comparative study of state-of-the-art deep learning architectures for rice grain classification. J. Agric. Food Res. 2023, 100890. [Google Scholar] [CrossRef]
  46. Kothyari, G.C.; Malik, K.; Dumka, R.K.; Naik, S.P.; Biswas, R.; Taloor, A.K.; Luirei, K.; Joshi, N.; Kandregula, R.S. Identification of active deformation zone associated with the April 28 2021 Assam earthquake (Mw 6.4) using the PSInSAR time series. J. Appl. Geophys. 2022, 206, 104811. [Google Scholar] [CrossRef]
  47. Confuorto, P.; Del Soldato, M.; Solari, L.; Festa, D.; Bianchini, S.; Raspini, F.; Casagli, N. Sentinel-1-based monitoring services at regional scale in Italy: State of the art and main findings. Int. J. Appl. Earth Obs. Geoinf. 2021, 102, 102448. [Google Scholar] [CrossRef]
  48. Friedl, P.; Seehaus, T.; Braun, M. Global time series and temporal mosaics of glacier surface velocities derived from Sentinel-1 data. Earth Syst. Sci. Data 2021, 13, 4653–4675. [Google Scholar] [CrossRef]
  49. Zhang, S.; Li, R.; Wang, F.; Iio, A. Characteristics of landslides triggered by the 2018 Hokkaido Eastern Iburi earthquake, Northern Japan. Landslides 2019, 16, 1691–1708. [Google Scholar] [CrossRef]
  50. Shao, X.; Ma, S.; Xu, C.; Zhang, P.; Wen, B.; Tian, Y.; Zhou, Q.; Cui, Y. Planet image-based inventorying and machine learning-based susceptibility mapping for the landslides triggered by the 2018 Mw 6.6 Tomakomai, Japan Earthquake. Remote Sens. 2019, 11, 978. [Google Scholar] [CrossRef]
  51. Yamagishi, H.; Yamazaki, F. Landslides by the 2018 hokkaido iburi-tobu earthquake on september 6. Landslides 2018, 15, 2521–2524. [Google Scholar] [CrossRef]
  52. Smith, I.; Moise, A.; Inape, K.; Murphy, B.; Colman, R.; Power, S.; Chung, C. ENSO-related rainfall changes over the New Guinea region. J. Geophys. Res. Atmos. 2013, 118, 10665–10675. [Google Scholar] [CrossRef]
  53. Tanyaş, H.; Hill, K.; Mahoney, L.; Fadel, I.; Lombardo, L. The world’s second-largest, recorded landslide event: Lessons learnt from the landslides triggered during and after the 2018 Mw 7.5 Papua New Guinea earthquake. Eng. Geol. 2022, 297, 106504. [Google Scholar] [CrossRef]
  54. Wang, S.; Xu, C.; Li, Z.; Wen, Y.; Song, C. The 2018 Mw 7.5 Papua New Guinea earthquake: A possible complex multiple faults failure event with deep-seated reverse faulting. Earth Space Sci. 2020, 7, e2019EA000966. [Google Scholar] [CrossRef]
  55. Zhang, X.; Feng, W.; Du, H.; Li, L.; Wang, S.; Yi, L.; Wang, Y. The 2018 Mw 7.5 Papua New Guinea earthquake: A dissipative and cascading rupture process. Geophys. Res. Lett. 2020, 47, e2020GL089271. [Google Scholar] [CrossRef]
  56. Akter, S.; Habib, A.; Islam, M.A.; Hossen, M.S.; Fahim, W.A.; Sarkar, P.R.; Ahmed, M. Comprehensive performance assessment of deep learning models in early prediction and risk identification of chronic kidney disease. IEEE Access 2021, 9, 165184–165206. [Google Scholar] [CrossRef]
  57. Wu, X.; Hong, D.; Chanussot, J. UIU-Net: U-Net in U-Net for infrared small object detection. IEEE Trans. Image Process. 2022, 32, 364–376. [Google Scholar] [CrossRef] [PubMed]
  58. John, D.; Zhang, C. An attention-based U-Net for detecting deforestation within satellite sensor imagery. Int. J. Appl. Earth Obs. Geoinf. 2022, 107, 102685. [Google Scholar] [CrossRef]
  59. Wang, F.; Fan, X.; Yunus, A.P.; Siva Subramanian, S.; Alonso-Rodriguez, A.; Dai, L.; Xu, Q.; Huang, R. Coseismic landslides triggered by the 2018 Hokkaido, Japan (Mw 6.6), earthquake: Spatial distribution, controlling factors, and possible failure mechanism. Landslides 2019, 16, 1551–1566. [Google Scholar] [CrossRef]
  60. Ge, S.; Gu, H.; Su, W.; Praks, J.; Antropov, O. Improved semisupervised unet deep learning model for forest height mapping with satellite sar and optical data. IEEE J. Sel. Top. Appl. Earth Obs. Remote Sens. 2022, 15, 5776–5787. [Google Scholar] [CrossRef]
  61. Jaus, A.; Yang, K.; Stiefelhagen, R. Panoramic panoptic segmentation: Insights into surrounding parsing for mobile agents via unsupervised contrastive learning. IEEE Trans. Intell. Transp. Syst. 2023, 24, 4438–4453. [Google Scholar] [CrossRef]
  62. Xu, X.; Zhao, M.; Shi, P.; Ren, R.; He, X.; Wei, X.; Yang, H. Crack detection and comparison study based on faster R-CNN and mask R-CNN. Sensors 2022, 22, 1215. [Google Scholar] [CrossRef] [PubMed]
  63. Xie, E.; Wang, W.; Yu, Z.; Anandkumar, A.; Alvarez, J.M.; Luo, P. SegFormer: Simple and efficient design for semantic segmentation with transformers. Adv. Neural Inf. Process. Syst. 2021, 34, 12077–12090. [Google Scholar]
  64. Anantrasirichai, N.; Biggs, J.; Albino, F.; Bull, D. A deep learning approach to detecting volcano deformation from satellite imagery using synthetic datasets. Remote Sens. Environ. 2019, 230, 111179. [Google Scholar] [CrossRef]
  65. Wu, Z.; Ma, P.; Zheng, Y.; Gu, F.; Liu, L.; Lin, H. Automatic detection and classification of land subsidence in deltaic metropolitan areas using distributed scatterer InSAR and Oriented R-CNN. Remote Sens. Environ. 2023, 290, 113545. [Google Scholar] [CrossRef]
Figure 1. Processing steps for SAR amplitude to backscattering coefficient.
Remotesensing 15 05619 g001
Figure 2. Schematic illustration of sloping terrain imaging by an ascending orbit SAR satellite: (a) orientation parameters of the SAR satellite and terrain aspect; (b) geometric relationship between the SAR satellite and the Earth’s surface.
Remotesensing 15 05619 g002
Figure 3. The general structure of DPPA-UNet.
Remotesensing 15 05619 g003
Figure 4. Pixel attention mechanism.
Remotesensing 15 05619 g004
Figure 5. Learning rate.
Remotesensing 15 05619 g005
Figure 6. Overview of the study area, covering the following aspects: (a) geographic location of the study area; (b) overview of the location of the Mw 6.6 magnitude earthquake in Chuzen, Hokkaido, Japan; and (c) overview of the location of the Mw 7.5 magnitude earthquake in Papua New Guinea.
Remotesensing 15 05619 g006
Figure 7. Landslide identification results for Hokkaido training region: (a) DEM; (b) Sentinel-2 optical imagery (results of cloud removal and stitching from 12 September 2018 to 12 September 2019); (c) natural landslide; (d) Group 1; (e) Group 2; (f) Group 3.
Remotesensing 15 05619 g007
Figure 8. Training score statistics for Hokkaido events: (a) evaluation metrics’ distribution for various combinations; (b) discrepancy among group statistics.
Remotesensing 15 05619 g008
Figure 9. Landslide identification results for the Hokkaido validation area: (a) DEM; (b) Sentinel-2 optical imagery (results of cloud removal and stitching from 12 September 2018 to 12 September 2019); (c) natural landslide; (d) Group 1; (e) Group 2; (f) Group 3.
Remotesensing 15 05619 g009
Figure 10. Landslide identification results for the training area in Papua New Guinea: (a) DEM; (b) Sentinel-2 optical imagery (results of cloud removal and stitching from 12 September 2018 to 12 September 2019); (c) natural landslide; (d) Group 1; (e) Group 2; (f) Group 3.
Remotesensing 15 05619 g010
Figure 11. Training score statistics for Papua New Guinea events: (a) evaluation metrics’ distribution for various combinations; (b) discrepancy among groups.
Remotesensing 15 05619 g011
Figure 12. Landslide identification results for the validation area in Papua New Guinea: (a) DEM; (b) Sentinel-2 optical imagery (results of cloud removal and stitching from 26 February 2018 to 30 December 2018); (c) natural landslide; (d) Group 1; (e) Group 2; (f) Group 3.
Remotesensing 15 05619 g012
Figure 13. (aj) Comparison of Hokkaido validation area identification results with SAR images: the first column is the natural landslide; the second column is the SAR fusion image; the third column is the Group 1 result; the fourth column is the ascending SAR image; the fifth column is the Group 2 identification; the sixth column is the descending SAR image; and the seventh column is the Group 3 result. The short blue arrow represents the line of sight of the satellite, and the long blue arrow represents the flight direction of the satellite.
Remotesensing 15 05619 g013
Figure 14. (aj) Comparison of Papua New Guinea validation area identification results with SAR imagery: the first column is natural landslides; the second column is SAR fusion imagery; the third column is Group 1 results; the fourth column is ascending SAR imagery; the fifth column is Group 2 identification; the sixth column is descending SAR imagery; and the seventh column is Group 3 results.
Remotesensing 15 05619 g014
Table 1. Dataset information and characteristics.
CombinationPolarization 1Polarization 2
Group 1Ascending and descending VV TS changesAscending and descending VH TS changes
Group 2Ascending VV TS changesAscending VH TS changes
Group 3Descending VV TS changesDescending VH TS changes
Group 4Ascending VV changesAscending VH changes
Group 5Pre-ascending VVPost-ascending VV
Group 6Pre-ascending VHPost-ascending VH
Table 2. The parameters of Sentinel-1A SAR data.
EventCombinationPre-Event TimePre-Event Number of ImagesPost-Event TimePost-Event Number of ImagesTrack
5 September 2018 Hokkaido EarthquakeGroup 1~31 January 2018~6 September 20185612 September 2018~30 November 201820Ascending
6227Descending
Group 4~61 September 2018113 September 20181Ascending
25 February 2018 Papua New Guinea EarthquakeGroup 1~31 August 2017~24 February 20187026 February 2018~24 April 201822Ascending
348Descending
Group 4~623 February 2018119 March 20181Ascending
Table 3. Optimal training scores for Hokkaido landslide identification.
CombinationBatch SizeLearning RateFiltersPrecisionRecallF1 ScoreIoU
Group 1160.0005640.800.830.810.69
1-UNet80.0001640.720.830.770.63
1-SegNet320.0001320.1510.260.15
Group 2160.00011280.710.850.770.64
Group 3160.0005160.740.830.780.64
Group 480.0001640.690.760.720.57
Group 5160.00051280.580.800.670.51
Group 6160.0011280.700.710.700.55
Table 4. Best training scores for Papua New Guinea landslides.
CombinationBatch SizeLearning RateFiltersPrecisionRecallF1 ScoreIoU
Group 1160.00011280.710.840.740.63
1-UNet160.0005640.660.820.700.57
1-SegNet80.0001320.690.760.690.57
Group 2160.0001160.730.690.710.57
Group 380.0001320.660.770.680.55
Group 4160.0001320.730.660.650.51
Group 580.00011280.590.700.610.46
Group 6320.001640.500.710.580.41
Disclaimer/Publisher’s Note: The statements, opinions and data contained in all publications are solely those of the individual author(s) and contributor(s) and not of MDPI and/or the editor(s). MDPI and/or the editor(s) disclaim responsibility for any injury to people or property resulting from any ideas, methods, instructions or products referred to in the content.