Article

Delineation of Backfill Mining Influence Range Based on Coal Mining Subsidence Principle and Interferometric Synthetic Aperture Radar

1
Engineering Research Center of Ministry of Education for Mine Ecological Restoration, China University of Mining and Technology, Xuzhou 221116, China
2
School of Geomatics, Anhui University of Science and Technology, Huainan 232001, China
*
Author to whom correspondence should be addressed.
Remote Sens. 2023, 15(23), 5618; https://doi.org/10.3390/rs15235618
Submission received: 31 October 2023 / Revised: 27 November 2023 / Accepted: 2 December 2023 / Published: 4 December 2023
(This article belongs to the Section Environmental Remote Sensing)

Abstract

:
The present study explores a three-dimensional deformation monitoring method for the better delineation of the surface subsidence range in coal mining by combining the mining subsidence law with the geometries of SAR imaging. The mining surface subsidence of the filling working face in Shandong, China, from March 2018 to June 2021, was obtained with 97 elements of Sentinel-1A data, the small baseline subset (SBAS) technique, and the proposed method, respectively. By comparison with the ground leveling of 46 observation stations, it is shown that the average standard deviation of the SBAS monitoring results is 10.3 mm; with this deviation, it is difficult to satisfy the requirements for the delimitation of the mining impact area. Meanwhile, the average standard deviation of the vertical deformation obtained by the proposed method is 6.2 mm. Compared to the SBAS monitoring accuracy, the monitoring accuracy of the proposed method is increased by 39.8%; thus, it meets the requirements for the precise delineation of the surface subsidence range for backfill mining.

1. Introduction

Coal is one of the three major energy sources for ensuring world energy security and has significantly contributed to world economic development [1]. Although coal mining is useful for meeting the living and production needs of humans, the damage to the ecological environment caused by large-scale mining, such as earth surface subsidence and land desertification, is increasing day by day [2,3,4]. With the continuous deepening of industrialization and urbanization in the world’s major coal countries, coal resources are found in more and more regions, and the issue of coal mining is becoming more and more serious. Backfill mining has become one of the principal technical options to achieve safe and efficient coal mining and to protect the ecological environment on the surface. Backfill mining can control the movement of overlying rock, reduce earth surface subsidence, and protect buildings on the surface; it is a “green” and environmentally friendly mining process [5,6,7]. In this regard, various scholars have explored the earth surface subsidence of backfill mining in relation to the properties of backfill material, backfill mining technology, the backfill mining supporting roof theory, and the mechanism of overlying rock fractures [8,9,10]. Yet, due to the limited control ability of backfill mining with regard to the surface subsidence of the mining area, there are still dissimilar degrees of earth surface subsidence in backfill mining areas [11]. Consequently, it is important to accurately monitor the earth surface subsidence during backfill mining so as to protect the ecological environment of the region and evaluate the damaged area of the earth surface structures.
Because of the deformation of and damage to cultivated land, farmhouses, industrial buildings, etc., caused by coal mining subsidence, it is crucial to provide economic compensation for the damaged land and buildings. Unfortunately, the controversy related to determining what constitutes the subsidence area makes it difficult to enforce responsibilities, and so the relevant groups cannot receive reasonable compensation, or the compensation fee is too high for the coal mining enterprises to manage. As a result, the conflict of interests between the coal mine and the surrounding residents is severe, and the opposition between local workers and peasants is prominent [12]. Currently, the delineation of the damaged area is primarily achieved according to the Regulations for Coal Pillar Retention and Coal Mining for Buildings, Water Bodies, Railways and Main Roadways [13]. The damage is assessed based on the damage to the buildings, so as to provide financial compensation. In addition, some scholars have employed the entropy weight fuzzy identification model, the fuzzy clustering method, neural networks, machine learning methods, and the gray correlation model to enable the assessment of the damage [14,15,16,17]. The damage to buildings is mostly evaluated with the above approaches in relation to aspects of the mining elements or building elements. As the damage to buildings is produced by the deformation of the earth surface, the continuous alterations in the earth surface deformation result in incessant changes in the damage to buildings on the earth surface. The traditional evaluation technique is carried out according to the damage to buildings during the investigation, but the damage to buildings does not remain unchanged. Thus, the dynamic situation of buildings affected by mining can be highlighted by utilizing time-series dynamic earth surface deformation monitoring as an evaluation factor to evaluate building damage.
With the traditional method for monitoring surface deformation, the level gage and the global positioning system (GPS) are applied to periodically monitor the plane and elevation of the earth surface observation station above the working face to obtain the 3D deformation of the earth surface. The traditional monitoring approach has the benefits of high accuracy, but it is hard for it to meet the application needs in monitoring mining subsidence in mining areas due to the small monitoring area, high cost, large workload, and easy destruction of the observation stations [18,19]. InSAR is not only limitless with regard to weather or time, it also has the advantages of covering a wide area, high spatial and temporal resolution, and high precision. It has become a space-based geodetic technique that is widely applied in the detection of various geological hazards, and it has achieved many application successes in earthquakes [20,21,22], volcanic events [23,24,25], mining subsidence in mining areas, and urban earth surface subsidence [26,27,28,29,30]. In order to reduce the impact of atmospheric noise and decoherence on traditional differential interferometry synthetic aperture radar (DInSAR) technology, the scientists have proposed time-series InSAR technology, which mainly includes permanent scatterer InSAR (PS-InSAR) [31], small baseline subset InSAR (SBAS–InSAR) [32], and the StaMPS-SBAS technique [33]. As the time-series InSAR technology is able to monitor the long-sequence, low-level deformation of the earth surface and to attain the continuous earth surface deformation information of a large area, it can depict in detail the temporal and spatial evolution of the earth surface deformation during a certain period of time in the observation area. However, due to the high vegetation coverage on the surface of coal mining areas and the lack of time baseline restrictions on interference when using PSInSAR technology, it is difficult to obtain good monitoring results due to the limited number of selected coherence points in coal mining areas. SBAS technology improves the coherence of interference pairs to a certain extent by setting a spatiotemporal baseline threshold to select interference pairs. Therefore, SBAS technology selects more coherence points in coal mining areas, and SBAS technology has a good effect on mining subsidence; in addition, the SBAS technique has been employed to monitor the damage to mining structures in mining areas and the earth surface subsidence in backfill mining, but there is little research on the delineation and evaluation of the damage area of earth surface structures in backfill mining.
In this regard, this paper utilizes the 97-scene ascending Sentinel-1 data and InSAR technology to acquire the time-series deformation of the C9 and C10 filling working faces of a mine in Shandong from March 2018 to June 2021. The InSAR monitoring outcomes were confirmed by the leveling data from 46 observatories, and the factors affecting the accuracy of the monitoring fallouts were analyzed. Next, the 3D deformation of the C9 and C10 backfill mining earth surface was obtained based on a single SAR data source combined with the earth surface subsidence pattern of backfill mining, and the 3D deformation accuracy was established by comparing the results with the leveling data. Lastly, the affected area of the earth surface subsidence of the C9 and C10 backfill mining was delineated based on the 3D deformation inversion results. The impact on the villages above the mining face and on the surroundings is discussed. The findings are of great significance for evaluating the damage area of the earth surface structures and for alleviating the relationship between the workers and farmers in mining areas.

2. Materials and Methods

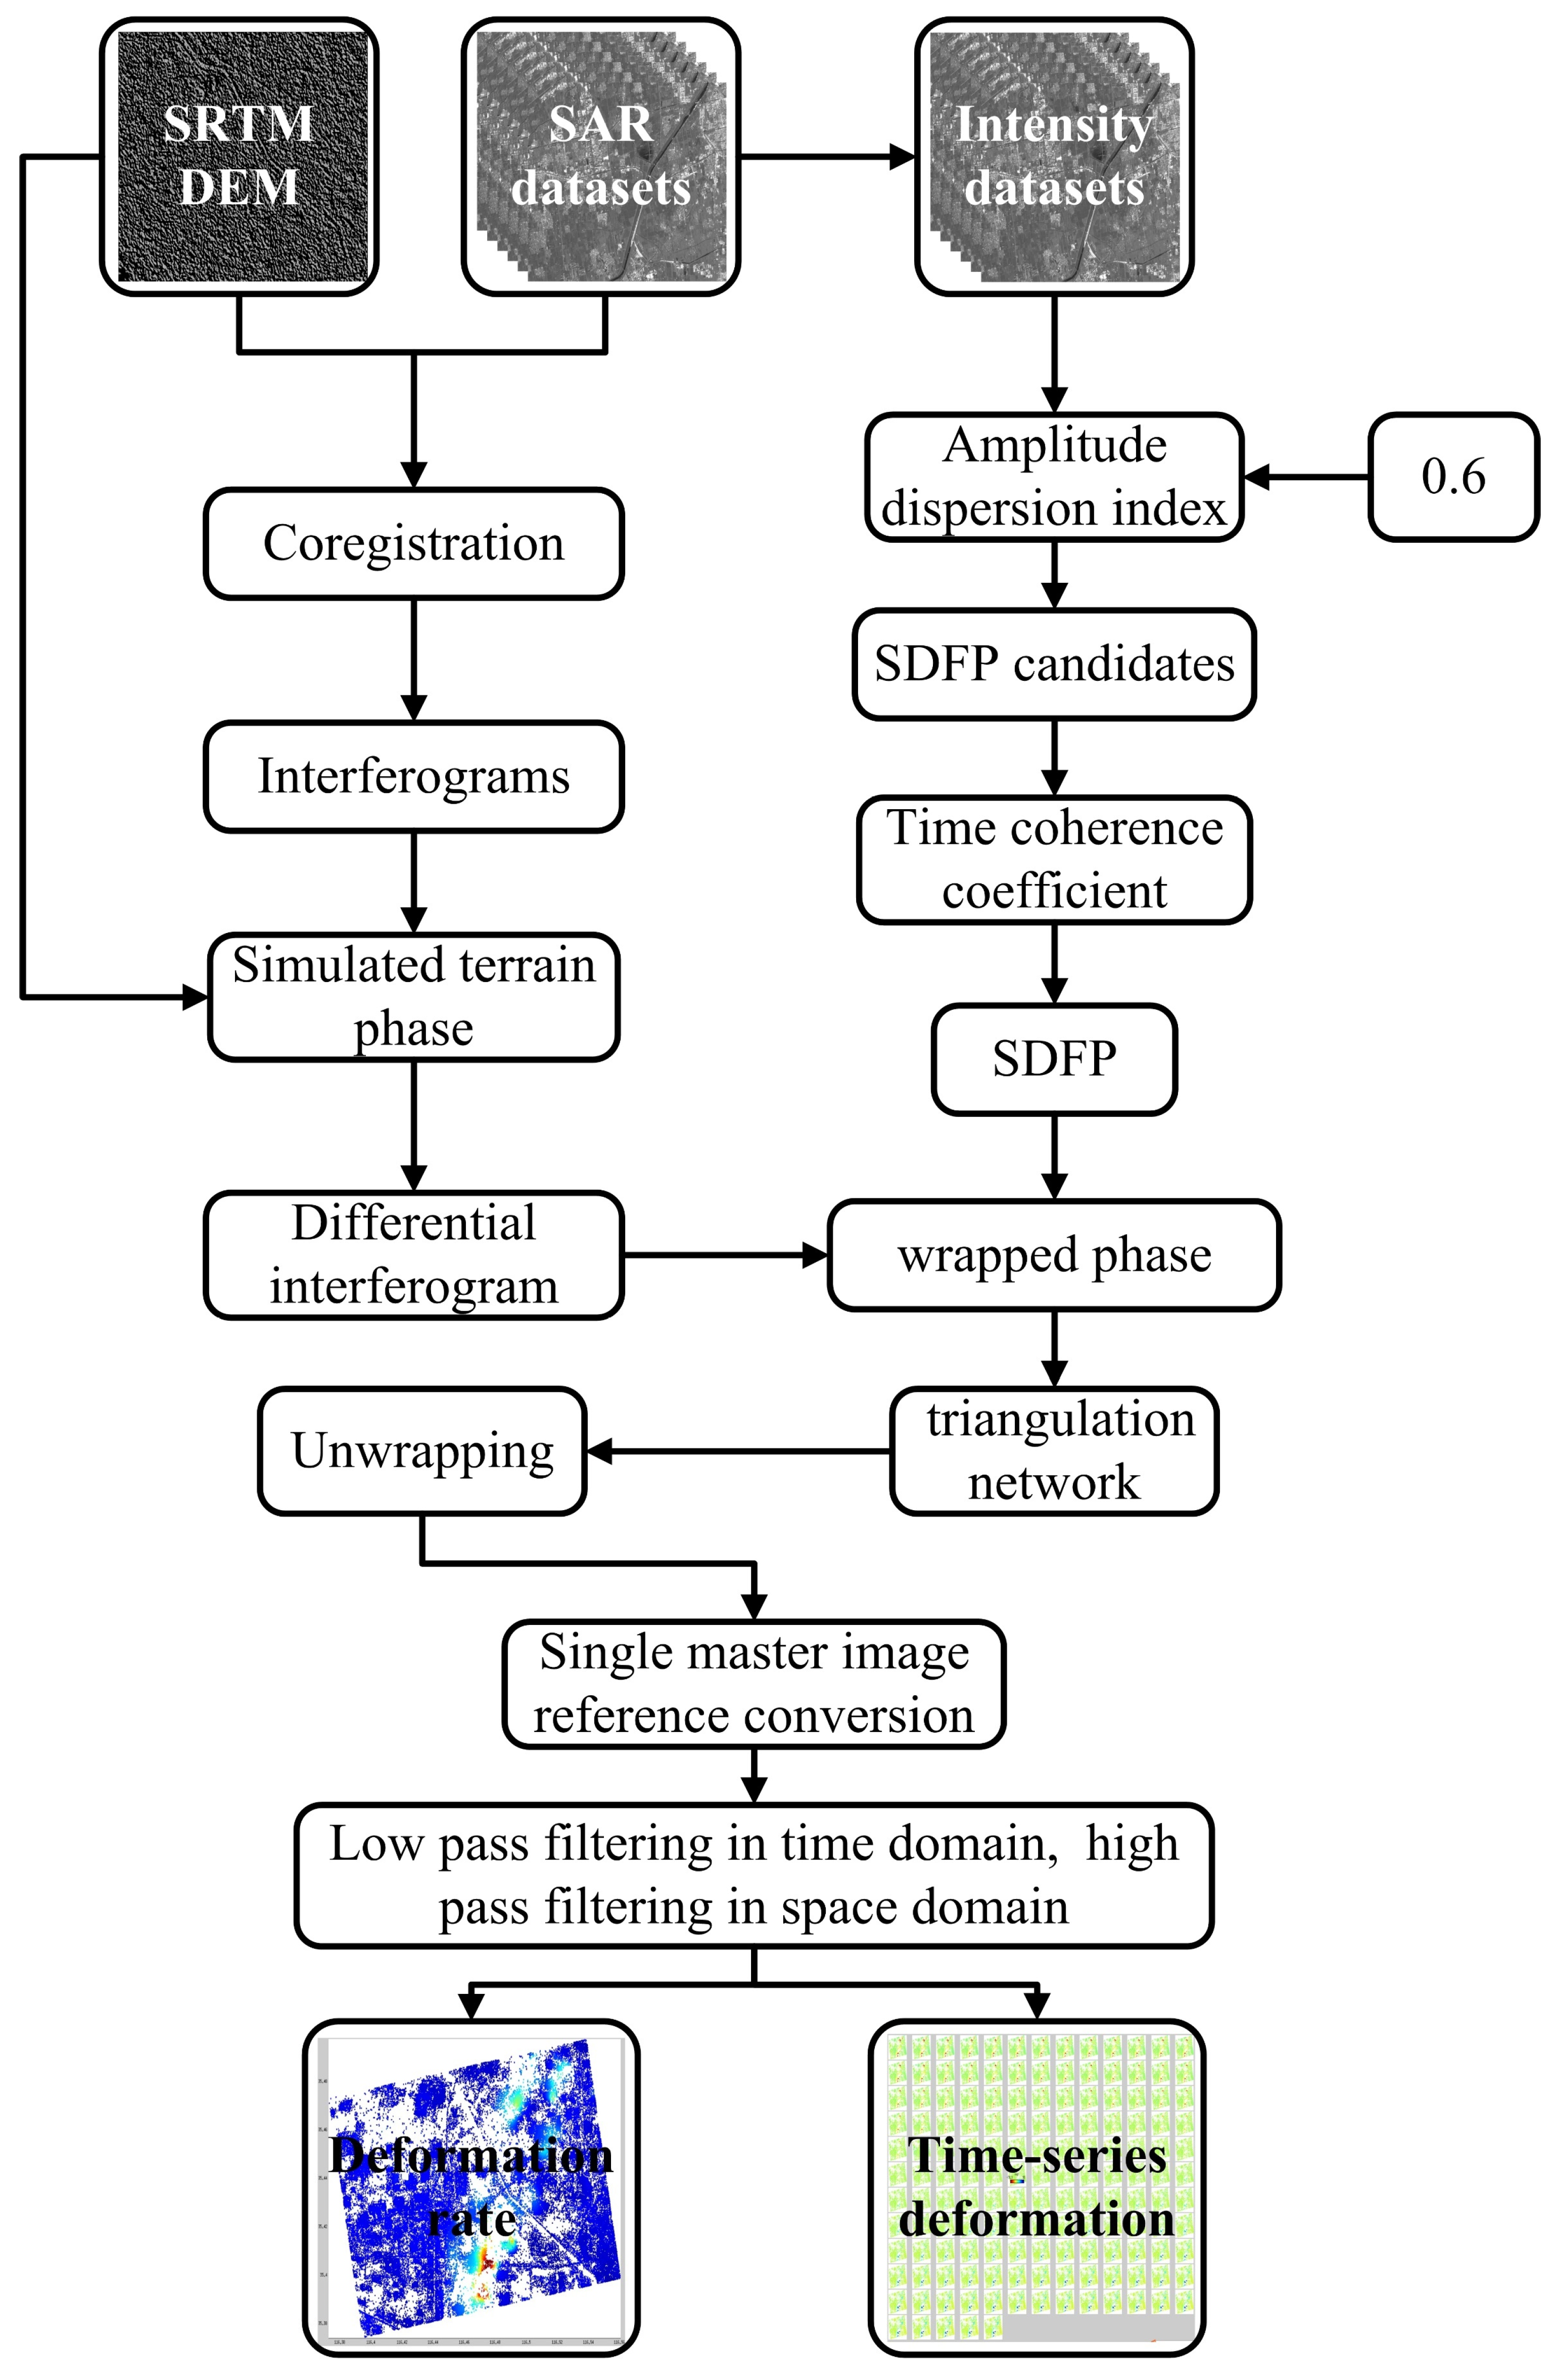
2.1. Principle of StaMPS-SBAS Technology

Assuming N + 1 SAR images, a maximum of N(N + 1)/2 interference pairs can be generated, according to the principle of permutation and combination. The interference pairs with higher interference quality can be selected from these interference pairs by setting the time and space baseline thresholds. At the same time, the interference pairs with higher interference quality can also form a complete network, and there is no isolated island in the time connection.
Generally, the chosen research points are called the slowly decorrelating filtered phase (SDFP) in the StaMPS-SBAS technology [33]; the candidate points are also selected based on the amplitude dispersion index D A , and the D A threshold is mostly set to 0.6. The SDFP pixels are identified among the candidate pixels in the same way that the PS points are selected. The spatially correlated phase of the pixel interference phase is estimated by the bandpass filtering of the surrounding pixels. A spatially uncorrelated viewing angle error term, including contributions from the spatially uncorrelated elevation errors and the deviations in the pixel phase centers from their physical centers, is then estimated by correlation with the vertical baseline. An estimate of the pixel-related noise is generated by subtracting these two estimates and is then characterized by a quantity similar to the coherence value:
γ x = 1 N | i = 1 N e x p { 1 ( ψ x , i ψ ˜ x , i Δ ϕ ^ u t o p o , x , i ) } |
where ψ x , i is the wrapping phase of the x pixel at the interferogram i ; ψ ˜ x , i is the spatial correlation estimation term; Δ ϕ ^ u t o p o , x , i is the spatially uncorrelated line-of-sight error estimation term; and N is the number of interferograms.
After eliminating the two estimated items from the original wrapping phase, the unwrapping phase is obtained through 3D phase unwrapping using SNAPHU-v2.0.5 software, and the unwrapping phase outcome can be expressed as:
ϕ ^ x , i = ϕ D , x , i + ϕ A , x , i + Δ ϕ S , x , i + Δ ϕ θ , x , i c + Δ ϕ N , x , i + 2 k x , i π
where ϕ ^ x , i is the unwrapped phase and k x , i is the remaining unknown integer ambiguity. If the unwrapping result is accurate enough, for most pixel x in a given interferogram i , k x , i will be the same integer.
After attaining the unwrapping result, there are still some phases that make it impossible to acquire the deformed phase ϕ D , x , i . The spatially correlated parts other than the deformation phase can be divided into temporally correlated parts and uncorrelated parts. These include ϕ A , x , i + Δ ϕ S , x , i , which are contributed by the master image and are composed of ϕ A , x , i + Δ ϕ S , x , i and Δ ϕ θ , x , i c from the slave image. The two parts are estimated separately with the combination of temporal and spatial filtering. Also, a low-pass filter in the time domain is employed to estimate the spatial correlation phase. Due to the influence of k x , i , ϕ ^ x , i is irrelevant in the time domain and cannot be directly filtered in the time domain. However, k x , i is the same for most adjacent SDFP pixels; so, calculating the phase difference between adjacent SDFP pixels can almost eliminate the 2 k x , i π , and the resulting phase can be filtered. In each interferogram, the following equation is given by ϕ ^ x , i between the pairs of SDFP pixels around each triangle in a clockwise direction:
Δ x 1 x 2 ϕ ^ x , i = Δ x 1 x 2 ϕ D , x , i + Δ x 1 x 2 ϕ A , x , i + Δ x 1 x 2 Δ ϕ S , x , i + Δ x 1 x 2 Δ ϕ θ , x , i c + Δ x 1 x 2 Δ ϕ N , x , i + Δ x 1 x 2 2 k x , i π
where Δ x 1 x 2 is the difference between the pixels x 2 and x 1 . For each pixel pair, the differential phase is low-pass-filtered by generating a convolution using a Gaussian function:
L T { Δ x 1 x 2 ϕ ^ x , i } Δ x 1 x 2 ϕ D , i Δ x 1 x 2 ϕ A m Δ x 1 x 2 Δ ϕ S m
where L T { } is the low-pass filtering operation, and the superscript m indicates the contribution of the master image to these terms.
To reserve the deformation phase, the Gaussian filter width is selected to be smaller than the time at which the deformation rate is expected to alter. Estimating L T { Δ x 1 x 2 ϕ ^ x , i } at the acquisition time of the master image, the deformation phase for all pixels is zero at this time point; so, an estimate value of the term Δ x 1 x 2 ϕ A m + Δ x 1 x 2 Δ ϕ S m can be obtained. The value ϕ A m Δ ϕ S m of any reference pixel can be acquired by back calculating using the least squares approach.
To achieve the contribution of the temporally uncorrelated spatially correlated phase of the slave image, a temporal high-pass filter can be applied to the phase difference between adjacent SDFP pixels. By subtracting Equation (4) from Equation (3), the following formula can be obtained:
Δ x 1 x 2 ϕ ^ x , i L T { Δ x 1 x 2 ϕ ^ x , i } Δ x 1 x 2 ϕ A , i S + Δ x 1 x 2 Δ ϕ S , i S + Δ x 1 x 2 Δ ϕ θ , i c + Δ x 1 x 2 Δ ϕ N , i
The superscript s indicates the contribution of the slave image to these terms. For each interferogram, the high-pass-filtered signal for each SDFP pixel relative to any reference SDFP pixel can be acquired from Equation (5), using the least squares method.
[ Δ x 1 x 2 ] 1 { Δ x 1 x 2 ϕ x , i L T { Δ x 1 x 2 ϕ ^ x , i } } ϕ A , x , i S + Δ ϕ S , x , i S + Δ ϕ θ , x , i c + Δ ϕ N , x , i
Next, the spatial phase of each interferogram is low-pass-filtered by convolving with a two-dimensional Gaussian function. The Gaussian convolution width is generally set to be very small, typically 50 m, to include all the signals except those localized to a single SDFP pixel. The formula can be transformed according to the previous equation:
ϕ D , x , i Δ ϕ N , x , i 2 k x , i π ϕ ^ x , i + ( ϕ ^ A , x m + Δ ϕ ^ S , x m ) ( ϕ A , x , i S + Δ ϕ S , x , i S + Δ ϕ θ , x , i c )
It is generally believed that the resulting phase is obtained with reference to a small region of the image, which excludes the effects of the 2 k x , i π term in the entire interferogram, and the final result contains only the deformed phase, the spatially uncorrelated noise, and the unwrapping errors.
The time-series InSAR data processing flow is shown in Figure 1.

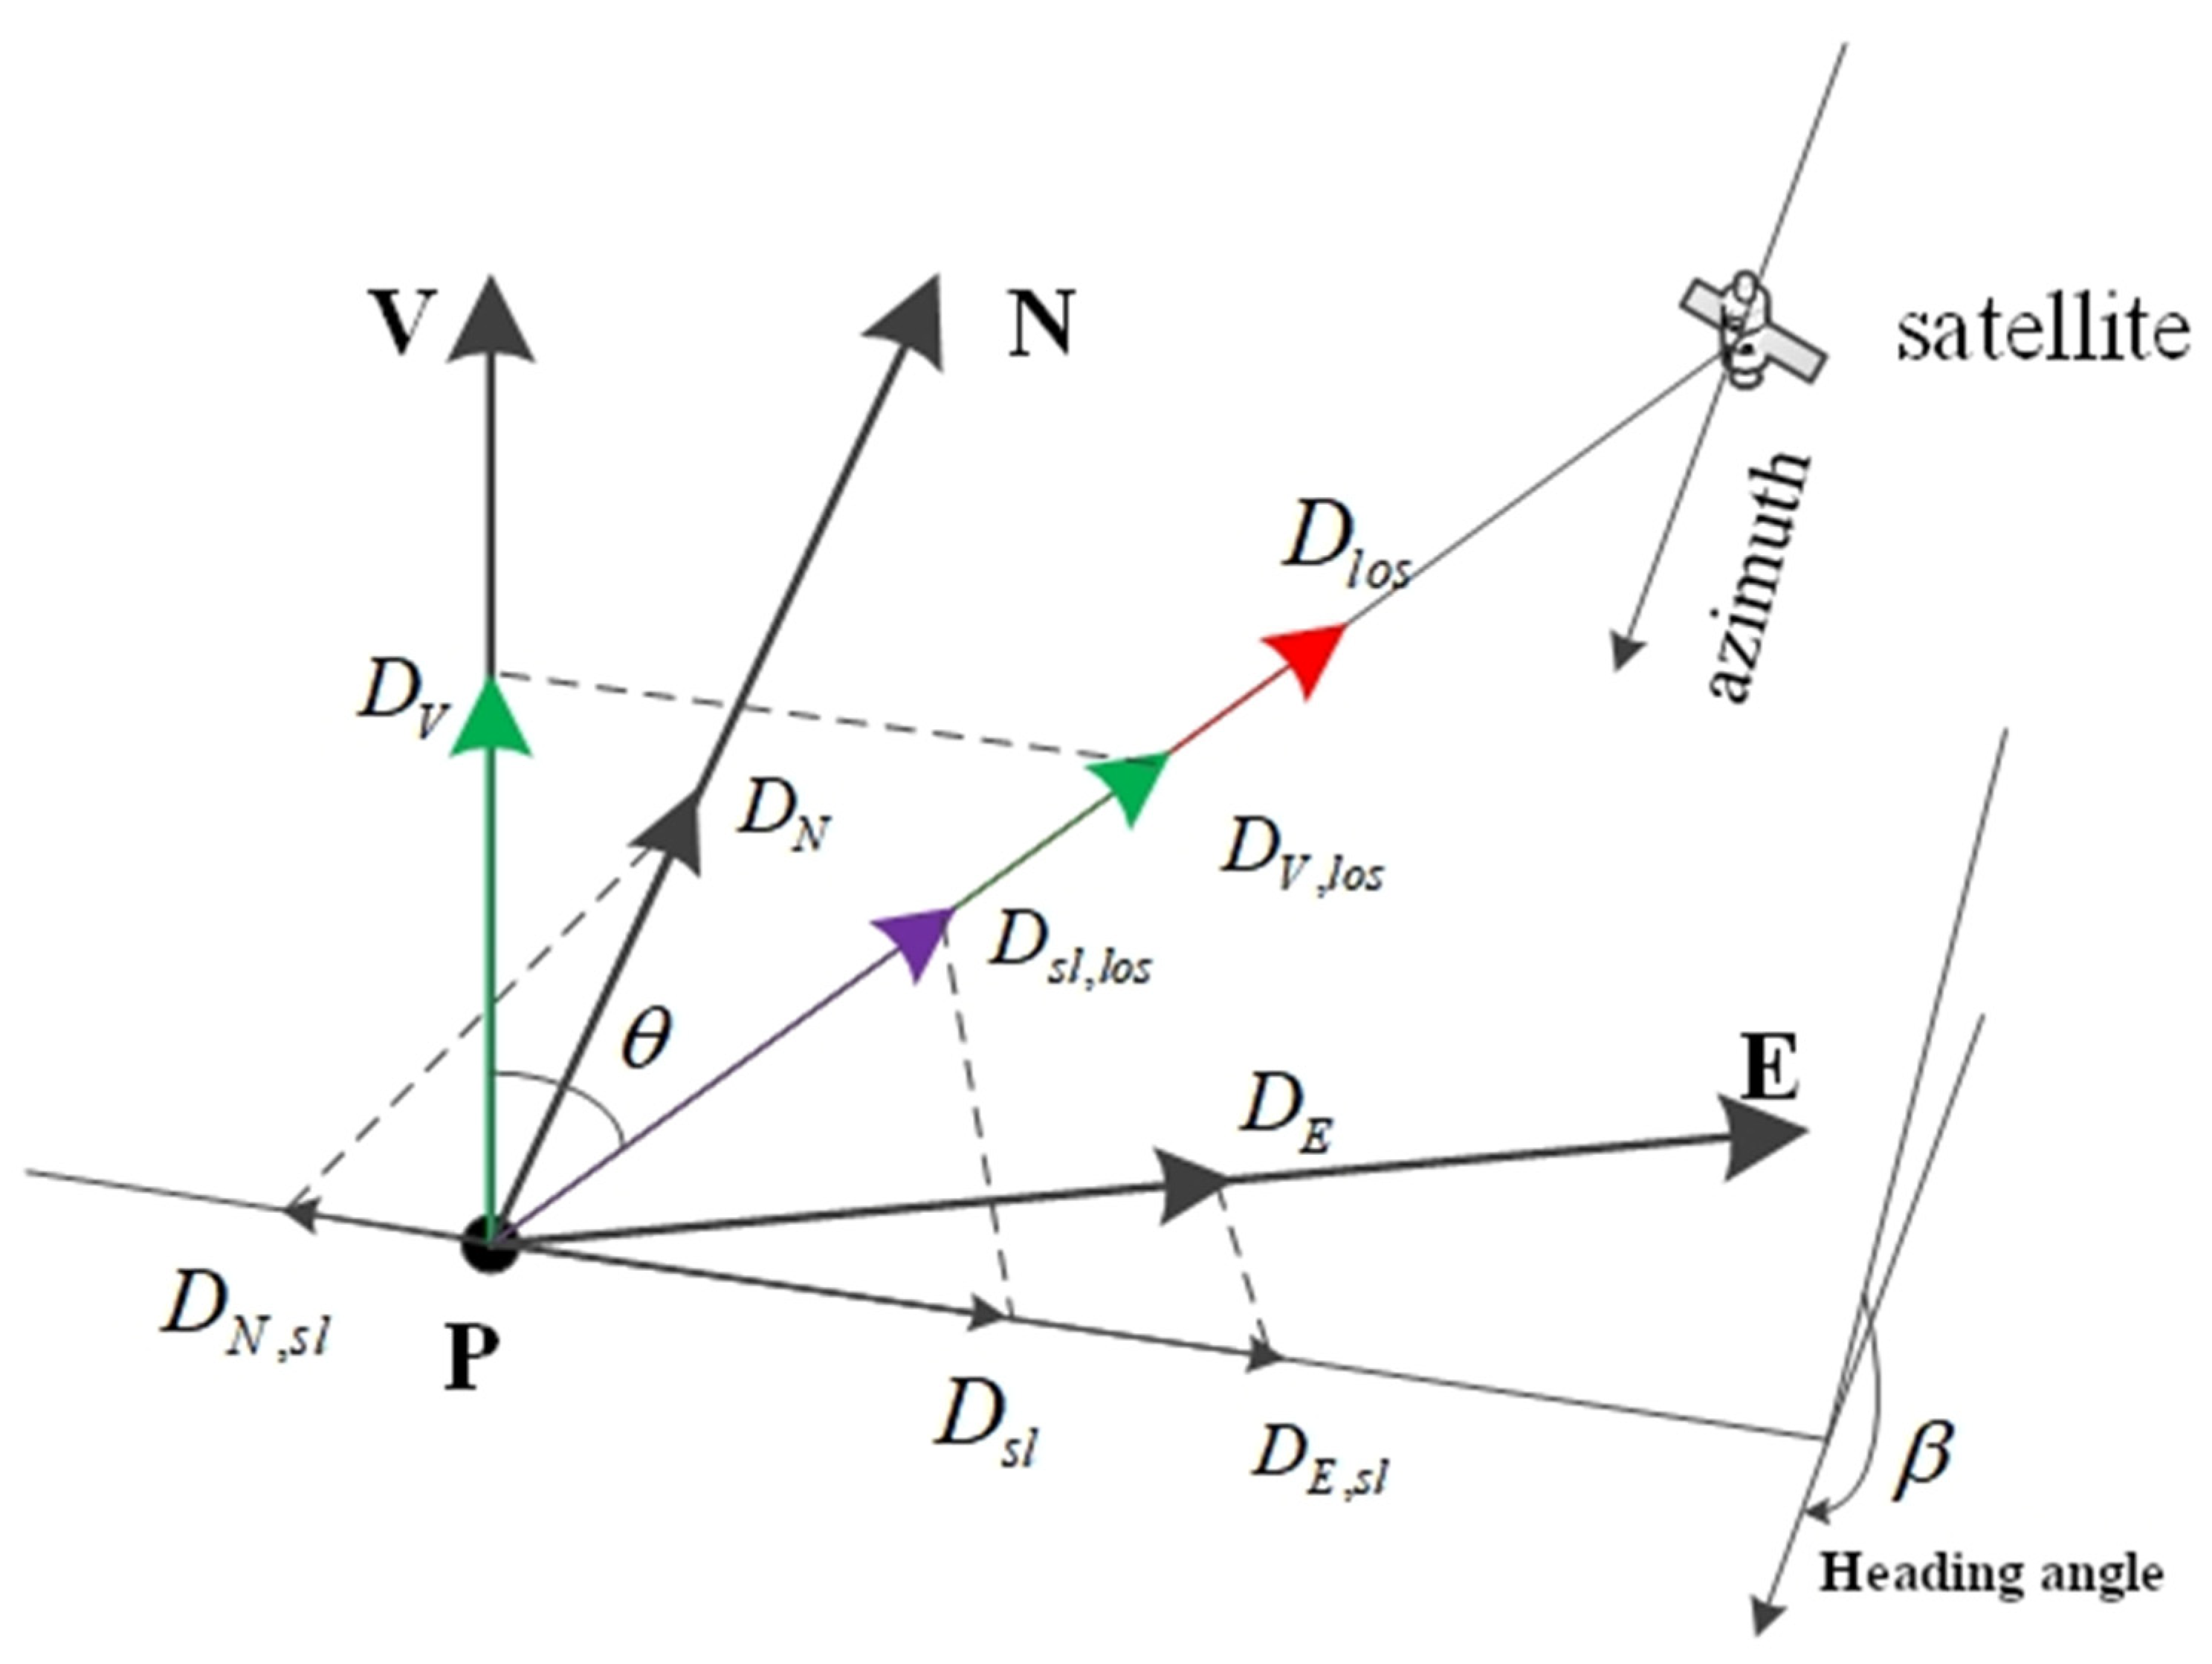
2.2. Principle of Three-Dimensional Deformation Decomposition

The distortion obtained by the InSAR technology is the projection of the real surface deformation in the direction of the satellite’s line of sight (LOS). The surface deformation caused by coal mining in the mining area comprises not only vertical subsidence but also horizontal movement. Assuming the deformation of the mining area includes only vertical subsidence, it can be approximately calculated using Equation (8); however, strictly speaking, this calculation method is not in agreement with the actual deformation of the mining area.
D = D l o s c o s ( θ )
where D is the vertical deformation; D los is the deformation along the line of sight of the satellite; and θ is the incident angle of the corresponding pixel.
To explore the projection relationship of the surface deformation in the mining area in the direction of the LOS, a spatial 3D projection model of the satellite imaging and surface deformation can be built, as shown in Figure 2, where D l o s is the projection of the deformation of the ground target point in the direction of the LOS; V , E , N correspondingly represent the vertical direction, the east–west direction, and the north–south direction of the three-dimensional spatial coordinate system, respectively; and D V , D E , D N represent the vertical deformation, east–west deformation, and north–south deformation, respectively. In addition, θ is the incident angle of the radar wave at the target point; β is the heading angle, which refers to the angle from the north to the satellite flight in a clockwise direction; D s l is the projection on the horizontal ground of the deformation of the ground target point along the LOS of the satellite; and D N , s l and D E , s l are the projection of the deformation in the north direction of the target point along the D s l direction and the projection of the deformation in the east direction at the ground target point along the D s l direction, respectively, and the vector sum of the two is D s l . D s l , l o s and D V , l o s represent the projection of the horizontal deformation of the target point along the LOS of the satellite and the projection of the vertical deformation along the LOS of the satellite, respectively, and the vector sum of the two is D l o s , i.e., the deformation measurement value of the InSAR method.
Based on the 3D decomposition model of the satellite line-of-sight deformation shown in Figure 2, the deformation D l o s of the ground target point along the radar line-of-sight can be expressed as:
D l o s = D V c o s θ D E c o s β s i n θ + D N s i n β s i n θ
From Equation (9), at least three or more SAR data points of different imaging geometries are required or combined with the azimuth deformation acquisition technology (offset-tracking and MAI) to solve the 3D deformation of the surface, which can be obtained based on the lifting track of the SAR data. However, it is not easy to obtain the SAR data of three or more different imaging geometries or the SAR data of ascending and descending orbits in the same area, and the accuracy of the north–south displacement calculated by multi-source/multi-orbit SAR data is not high, leading to a misjudgment in the surface deformation. Briefly, the SAR data of a single track combined with the knowledge of the earth surface subsidence in backfill mining are applied to infer in reverse the 3D deformation of the mining area in the present paper; this method was proposed by Li et al., 2015 [27], and was successfully applied in the acquisition of 3D deformation in mining areas.
Assuming that the size of the geocoded LOS deformation map is mxn, according to the general law of mining subsidence, there is a linear relationship between the horizontal movement of the surface and the deformation of the horizontal gradients of the subsidence [27,34]. Some scholars use the geometric integral model and drone photogrammetry to obtain the horizontal movement of the mining area [35,36], which is a very good method. However, we did not obtain relevant drone data in the research area, and whether the geometric integral model uses filling mining subsidence remains to be studied. Therefore, we used the method of Li et al., 2015 [27] to obtain three-dimensional deformation based on the mining subsidence law. For any point (i, j) on the earth surface, its horizontal movement along the east–west and north–south directions can be expressed as U E ( i , j ) and U N ( i , j ) (for a detailed theoretical derivation, refer to [2,27]):
U E ( i , j ) = b r T E ( i , j ) = b r [ W ( i , j + 1 ) W ( i , j ) ] / Δ E U N ( i , j ) = b r T N ( i , j ) = b r [ W ( i + 1 , j ) W ( i , j ) ] / Δ N ( i = 1 , 2 , , m 1 ; j = 1 , 2 , , n 1 )
where T E ( i , j ) and T N ( i , j ) are the deformations in the east–west and north–south directions, respectively, which can be acquired by vertical deformation. Also, W ( i , j ) is the subsidence of the earth surface point (i, j); Δ E and Δ N correspond to the east–west and north–south spatial resolutions of the LOS deformation map; b is the horizontal movement coefficient of the earth surface; r = H / tan β is the main influence radius, where H is the mining depth; and tan β is the main influence angle tangent.
Substituting Equation (10) into Equation (9), we can obtain:
D L O S ( i , j ) = C 1 W ( i , j ) + C 2 W ( i , j + 1 ) + C 3 W ( i + 1 , j ) ( i = 1 , 2 , , m 1 ; j = 1 , 2 , , n 1 )
Let   a 1 = cos θ ,   a 2 = sin θ cos α ,   a 3 = sin θ sin α ; this will result in:
C 1 = a 1 + b r a 2 / Δ E b r a 3 / Δ N C 2 = b r a 2 / Δ E C 3 = b r a 3 / Δ N
As the number ( n 1 ) ( m 1 ) of observation equations in Equation (11) is less than the number of unknowns ( n m ), Equation (11) is therefore an underdetermined system of equations. Considering the affected range (r) of working face mining, the greater the distance from the working face, the smaller the earth surface movement deformation (close to zero); therefore, it is assumed that the horizontal movement in the last row and last column of the LOS deformation map is 0, namely:
L O S ( i , n ) = a 1 W ( i , n ) ( i = 1 , 2 , , m 1 ) L O S ( m , j ) = a 1 W ( m , j ) ( j = 1 , 2 , , n )
Ultimately, the vertical deformation can be resolved by combining Equation (11) and Equation (13) through the backward iteration method. The east–west and north–south horizontal movement can be acquired by vertical deformation, according to Equation (10) [27].

2.3. Study Area Overview and InSAR Data Preparation

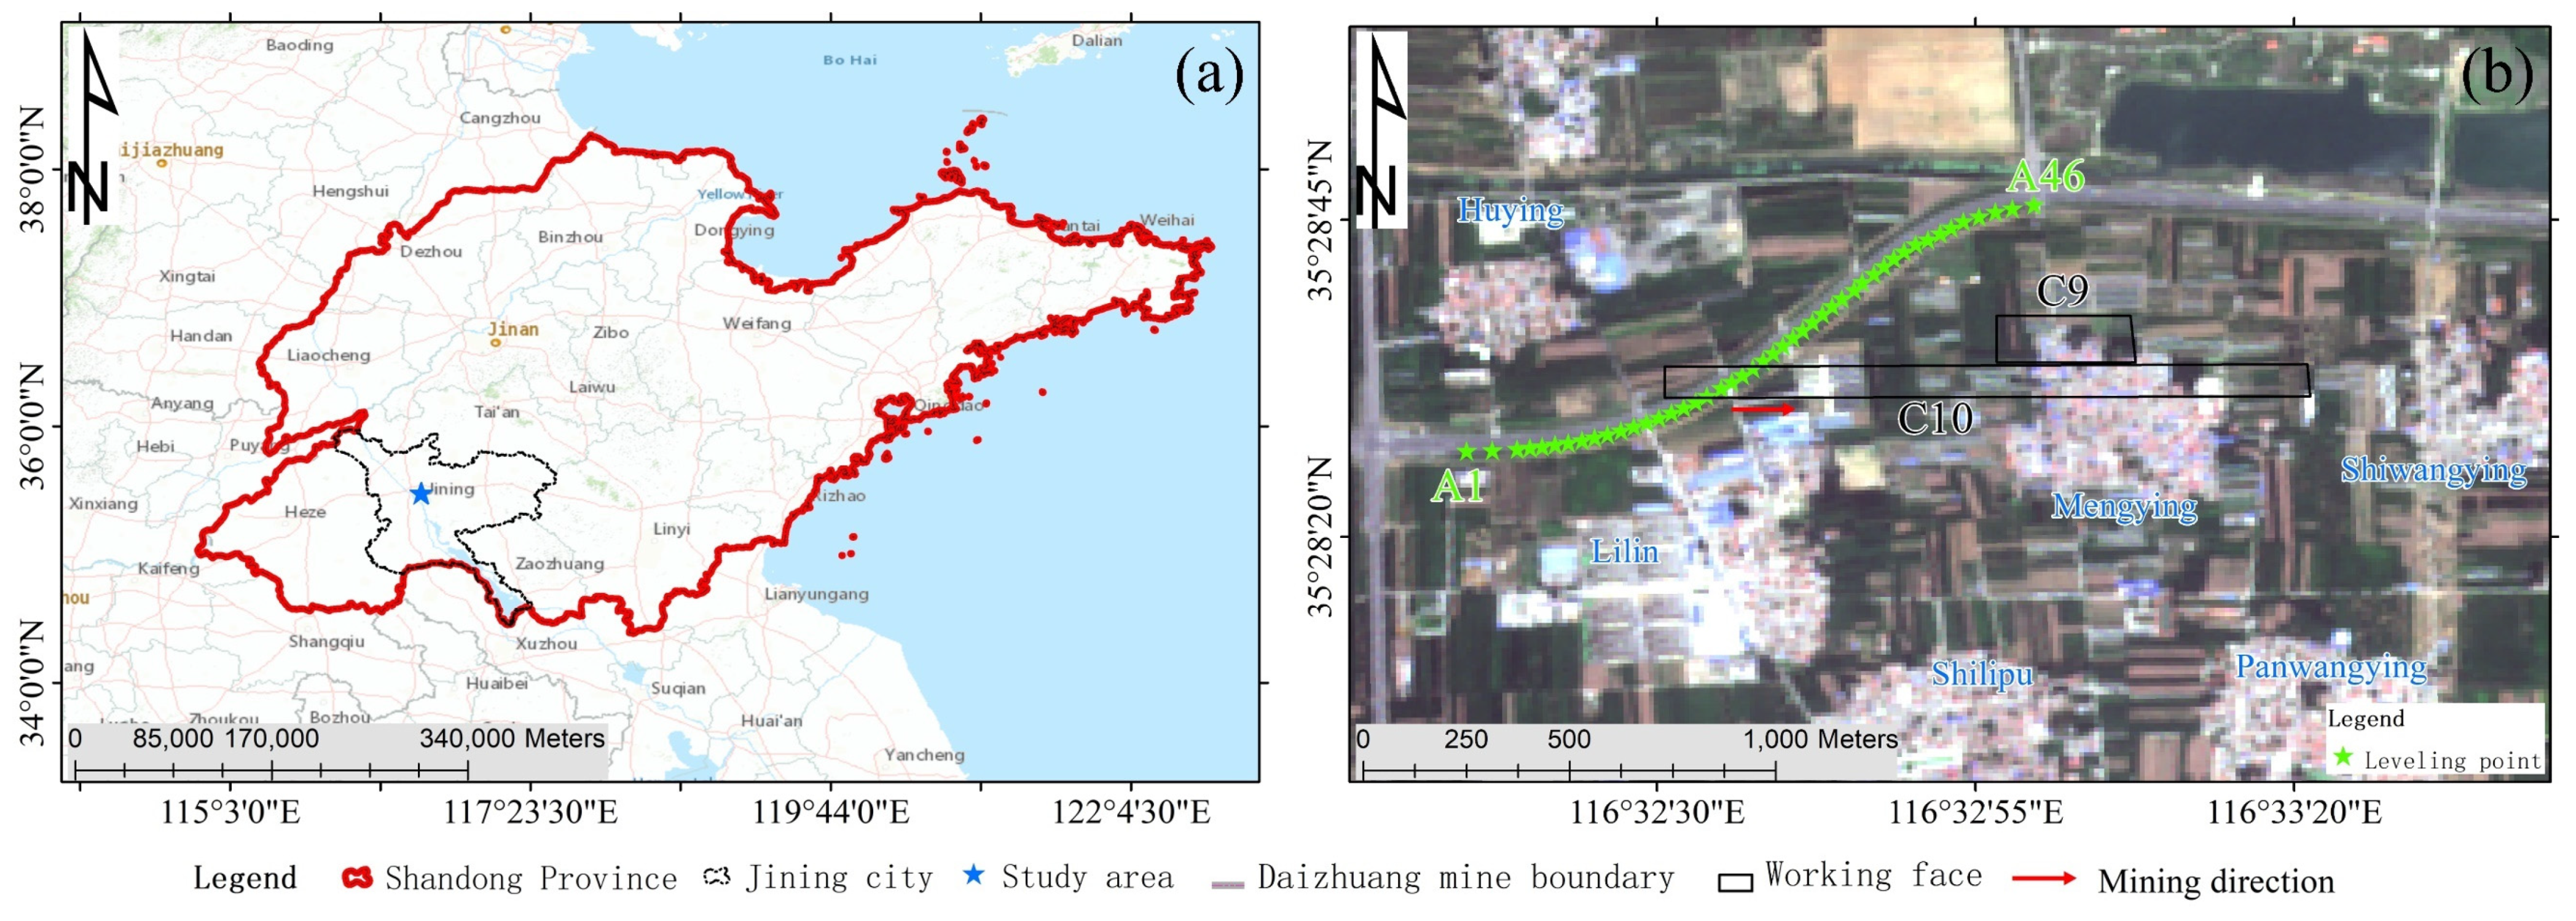
2.3.1. Study Area Overview

The investigated area is located in Jining City, Shandong Province (Figure 3a), which has convenient transportation, a dense population, and well-developed railway, highway and waterway transportation. Basically, the alluvial and lacustrine plain does not exist in this area; the surface is flat, the ground elevation is +36.24~+42.94 m, the average elevation is +39.25 m, and the natural terrain slope is 0.05%. Also, the climate is mild; it belongs to the temperate monsoon region and has a marine–continental climate. To avoid serious damage to the foundations of the houses, roads, and railways of the villages being caused by underground coal mining, the paste-filling coal mining method is applied for resource recovery, such as that of the mine filling C9 and C10 working faces (Figure 3b).
The average mining depth of C9 and C10 is 340 m; the average mining thickness is 2.8 m, and the paste-filling mining technology is adopted. The length of the C9 working face is 120 m, and the length of the C10 working face is 1280 m. The mining of the C10 working face started on 19 May 2018, and ended on 7 August 2020. The mining of the C9 working face began on 12 August 2020, and the recovery ended in April 2021.

2.3.2. InSAR Data Preparation

In the experiment, InSAR technology was employed to monitor the deformation of C9 and C10, and Sentinel-1A wide-width interferometric SAR images were applied. The image time span was from 28 March 2018 to 28 June 2021, with a total of 97 scenes. The azimuth direction and the range direction resolutions of the image were 13.9 m and 2.3 m, respectively, and the central incident angle was 39.2°. Meanwhile, the 90 m resolution SRTM DEM data covering the study region were downloaded from the U.S. Geological Survey (USGS) official website (https://www.usgs.gov/, accessed on 30 June 2021) to assist in interferogram registration and to remove the terrain phase information in the interferometric phases. The precise orbit data corresponding to the SAR image were downloaded from the Sentinel-1A satellite precise orbit data official website (https://dataspace.copernicus.eu/, accessed on 12 September 2021) and were utilized to lower the orbit error in the interference phase and to improve the registration quasi-accuracy.
The main tools employed for image data processing are GAMMA software v1.2 package (for DInSAR processing) and StaMPS software 4.1-beat (for SBAS time-series analysis), and ArcGIS software 10.0 is applied to visualize the outcomes. The preprocessing of the SAR images in the GAMMA software v1.2 package primarily includes two parts: Sentinel-1A data preprocessing and DInSAR. The main process of the Sentinel-1A preprocessing comprises the decompression of the original image; the choosing of the VV polarization information to produce the initial SLC data; the extraction of the swath and burst where the study area is located; the deburst processing; the azimuthal spectrum de-slope; the adding of the precise orbit data; geocoding; and registration. The processing flow of DInSAR mainly contains: (1) data cropping: to reduce the data processing time and obtain regions of interest; (2) interference: the SAR images need to be registered to an accuracy of at least 0.01 pixel before interference; (3) terrain phase simulation: external SRTM DEM data are used to simulate the terrain phase and to remove the differential interference phase from the interferogram; (4) filtering: Goldstein filtering is used to suppress the influence of noise, and the filtering parameter is set to 0.5; and (5) geocoding: the differential interferograms are converted to geographic coordinates. During the SBAS time-series analysis, to decrease the impact of spatiotemporal decoherence, the temporal baseline and the spatial baseline can be selected to be 50 days and 150 m, respectively, to form an SBAS network, and a total of 263 SBAS interferograms are generated.

3. Results

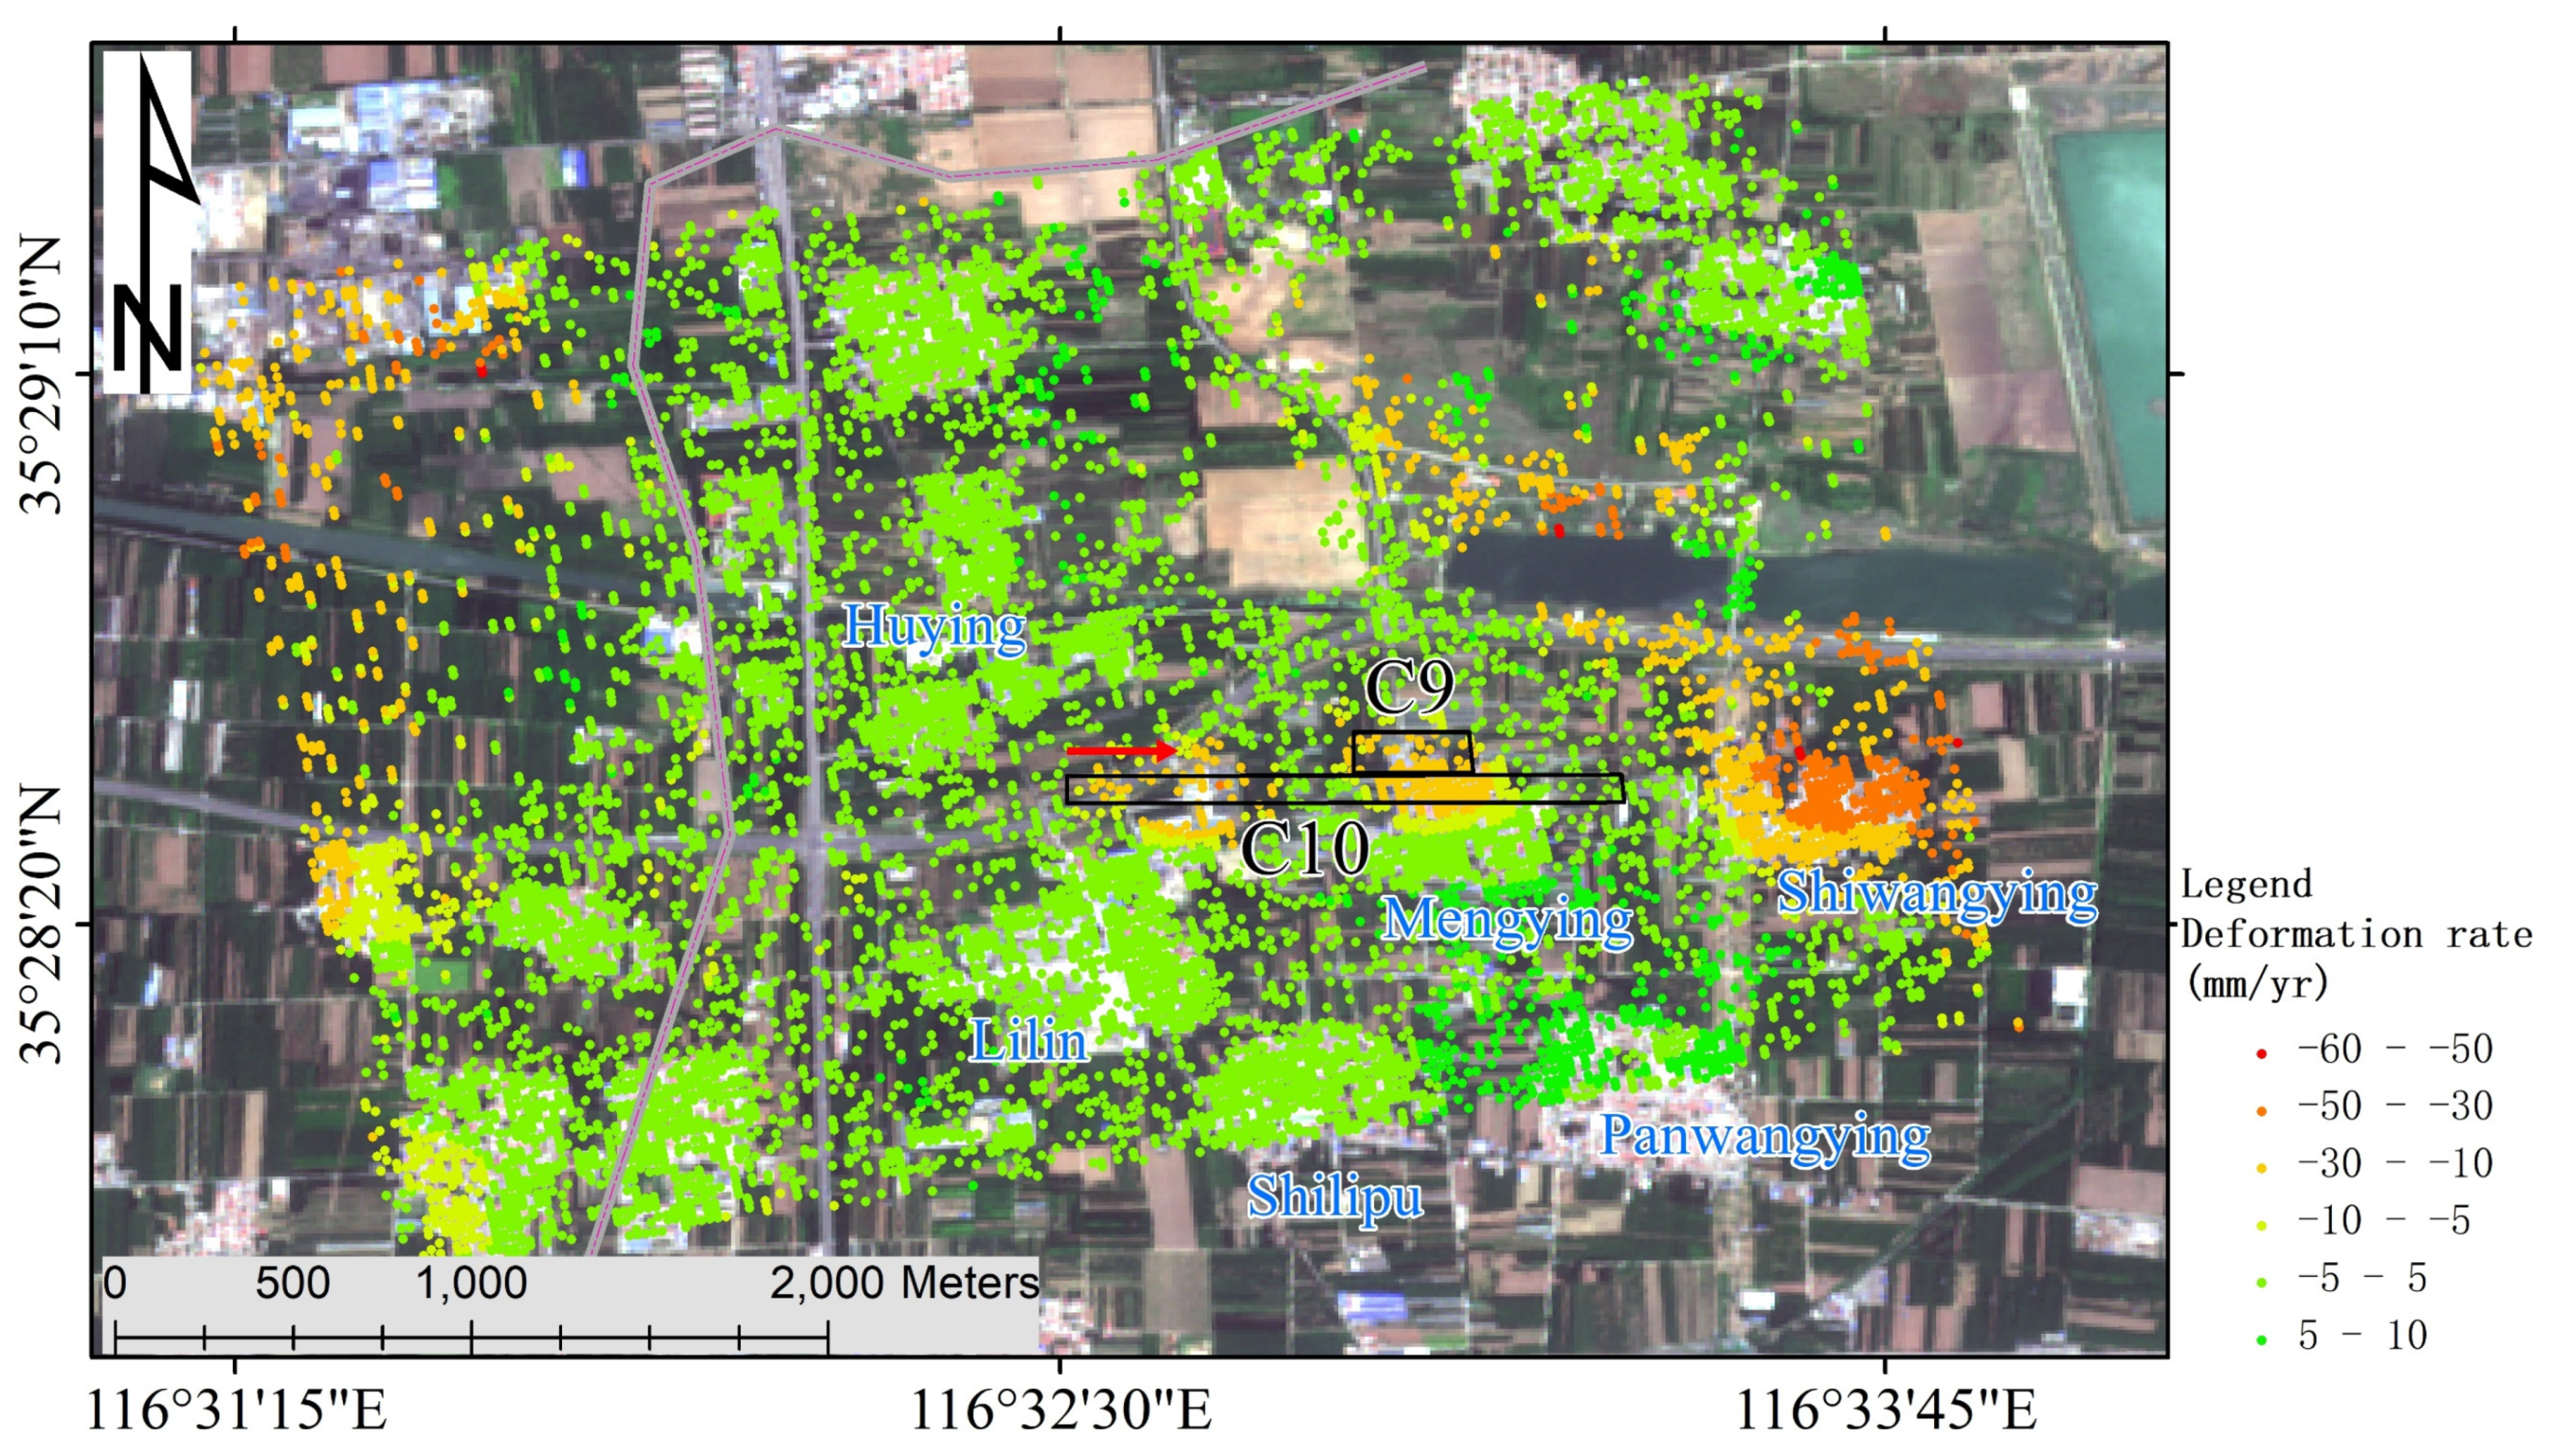
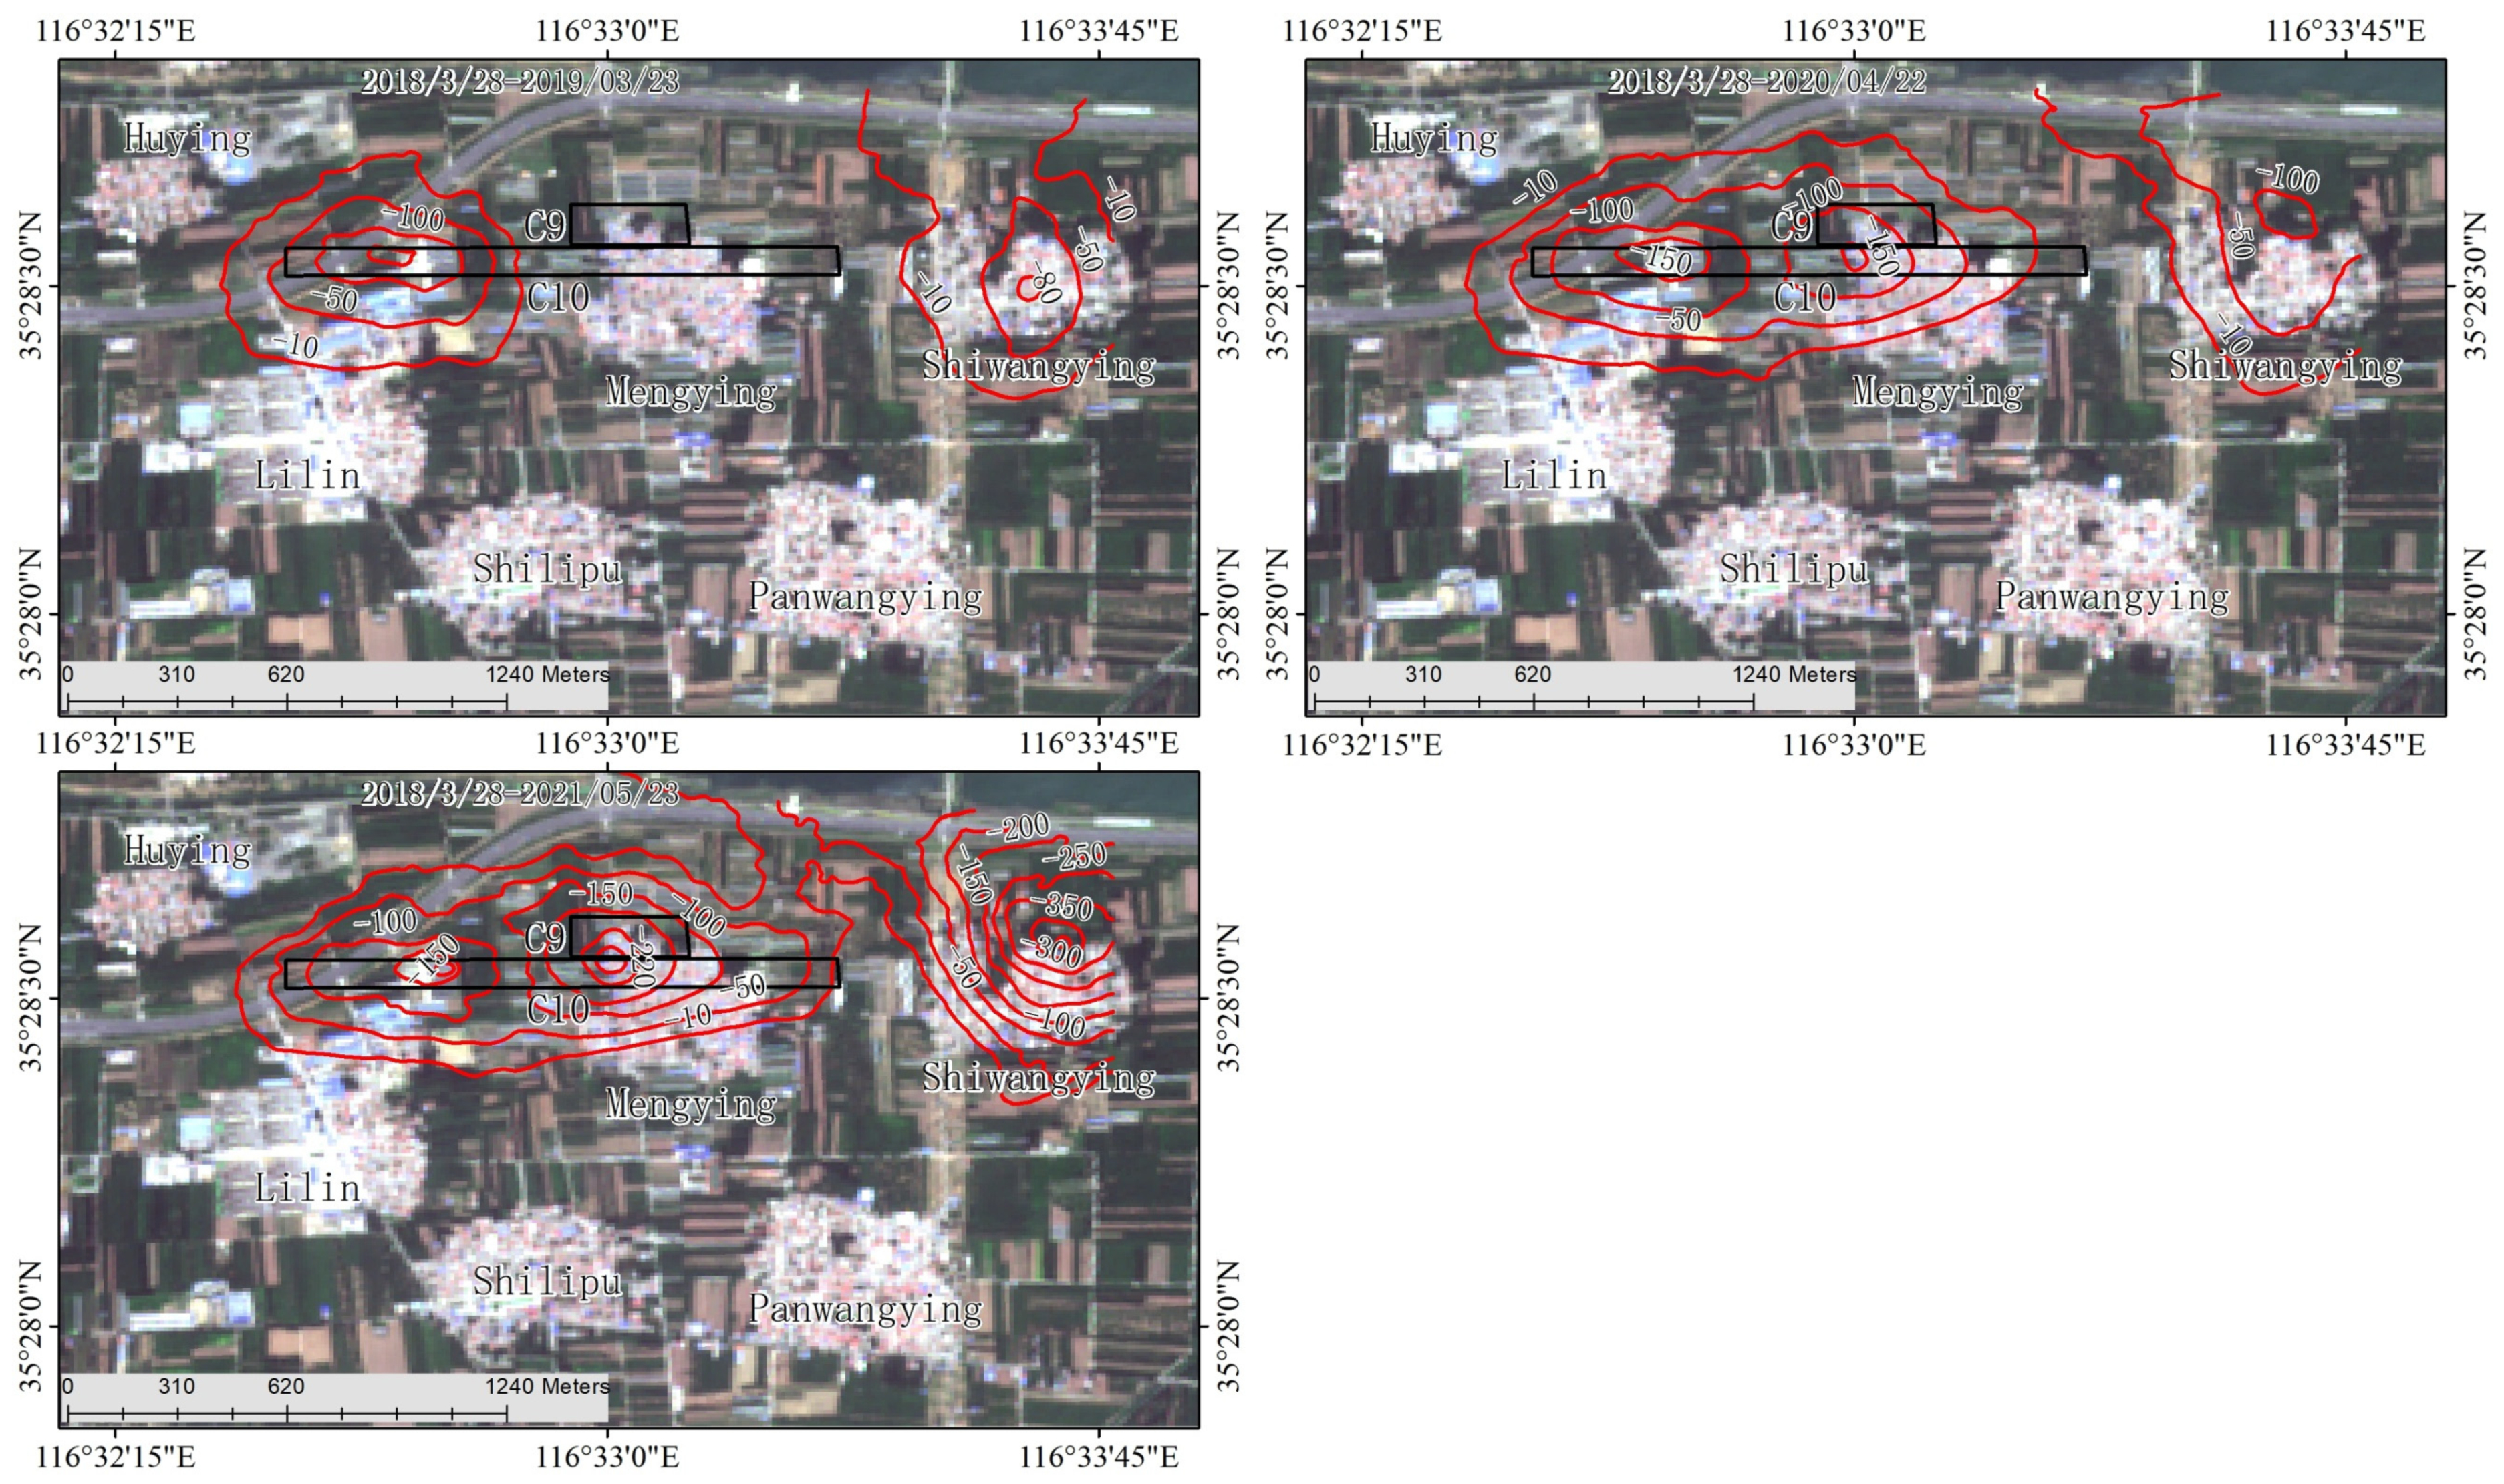
3.1. SBAS Monitoring Results

To acquire the movement and deformation range of the C9 and C10 working faces after backfilling and mining, the surface subsidence information of the C9 and C10 working faces can first be achieved according to the 97-scene Sentinel-1A images and time series InSAR technology from 28 March 2018 to 28 June 2021; the findings are provided in Figure 4. Most of the high-coherence points selected by the SBAS–InSAR technology were located above the surface structures and bare ground, while fewer high-coherence points were chosen in the farmland and vegetation areas. Briefly, a total of 9266 high-coherence points were selected by the SBAS–InSAR technology. In addition, it can be seen from the monitoring results that there were obvious subsidence areas on the surface of the monitoring area due to underground coal mining, primarily located in the northwest and east of the monitoring area, which may be produced by underground mining in adjacent mining areas. The maximum subsidence rate monitored by the SBAS–InSAR technology is 60.0 mm/a and was positioned in the eastern subsidence area.
As can be seen in Figure 4, the apparent surface subsidence is in the mining area of the C9 and C10 backfill working faces. As the mining period of the C10 working face is from April 2018 to August 2020 and the mining period of the C9 working face is from August 2020 to April 2021, the two working faces are in the middle of the InSAR monitoring period. Due to the mining of coal resources with filling technology, the surface subsidence is relatively small. The maximum subsidence rate monitored by SBAS–InSAR technology is −32.2 mm/a. From the SBAS–InSAR monitoring outcomes, Mengying and Shiwangying were significantly affected by the subsidence; some areas in the northern part of Lilin were impacted by the subsidence, while the surface of the other three villages was quite stable.
To assess the correctness of the InSAR monitoring outcomes, the leveling data of 46 observation stations located above the C9 and C10 working faces can be applied for verification. The leveling measurement period was from 28 March 2018 to 25 May 2021, with a total of 29 periods. The relationship between the leveling point and the working faces is shown in Figure 2.
Taking 28 March 2018 as the time base, combined with the mining progress of the C9 and C10 working faces, the InSAR monitoring results and the leveling measurement data were compared and verified every year according to the measurement time of the leveling data to verify the reliability of the InSAR monitoring results, as shown in Figure 5. As the InSAR technology was used to obtain the radar line-of-sight deformation, when the comparison was made with the leveling data, the influence of the horizontal movement was ignored at first; the InSAR monitoring outcomes were directly converted into vertical deformation and then compared with the leveling data. In addition, as the high-coherence point did not match the position of the leveling observation station, the mean deformation value of the high-coherence points located within 20 m of the leveling observation station was chosen for comparison and verification. Also, due to the lack of high-coherence points near the locations of some observatories, only 26 benchmarks were selected for confirmation.
As can be seen in Figure 5, some InSAR monitoring outcomes do not entirely match the time period of the leveling data, with a maximum difference of 4 days. However, considering that the surface subsidence rate of backfill mining is relatively small, the two sets of data are not normalized. By comparing the InSAR monitoring outcomes with the leveling data (Figure 5), it can be seen that the InSAR monitoring results are in good agreement with the leveling data; the overall change trend is consistent, and the subsidence magnitude is similar, indicating that the InSAR monitoring findings are reliable. Meanwhile, the monitoring accuracy of InSAR was quantitatively analyzed by the maximum deviation (maximum deviation, MaxD), the minimum deviation (MinD), and the standard deviation (StD). The assessed consequences are indicated in Table 1.
Based on the comparison between the InSAR monitoring results and the leveling data, it can be concluded that the standard deviation of the InSAR monitoring results is 10.3 mm, which is larger than the delineation standard (10 mm) for the surface subsidence range of coal mining; so, it cannot meet the actual requirements. The factors that affect the accuracy of the InSAR monitoring outcomes may involve the following: (1) The radar line-of-sight deformation obtained by the InSAR technology is the projection of the 3D surface deformation on the radar line-of-sight direction. In addition, the surface subsidence caused by mining is usually accompanied by horizontal movement, and from the inversion findings of the measured data, the horizontal movement coefficient of the C9 and C10 working faces is 0.3. Consequently, when ignoring the effect of horizontal movement, directly converting the deformation of the line of sight to the vertical direction will cause monitoring errors. (2) Few coherent points exist at the position of the observation station, and the coherent points cannot be totally matched with the position of the leveling observation station. Hence, only the coherent points near the leveling point can be selected for comparison, which may cause representative errors. (3) The distance between the benchmarks is 25 m, while the Sentinel-1A image resolution is about 20 m. In addition, due to errors in geocoding, the benchmarks may be mismatched with the nearby coherent points. (4) The error can be generated by the mismatch between the time periods of the two sets of data. Although the surface subsidence rate of backfill mining is relatively small, ignoring the time interval between the two sets of data will affect the accuracy evaluation consequences.
The statistical analysis of the standard deviation suggests that the average value of the standard deviation is 10.3 mm, indicating that the InSAR monitoring findings can reach the centimeter level. Yet, since the boundary of the mining subsidence damage range is delineated by 10 mm, the centimeter-level monitoring accuracy cannot meet the actual requirements, and the horizontal movement will cause excessive damage to the surface structures. Consequently, the combination with mining subsidence law to obtain the 3D deformation of the surface of the C9 and C10 working faces of the Daizhuang coal mine after filling mining is not only able to suppress the neglect of the horizontal movement on the vertical deformation; it can also be used to further assess the damage boundary of the surface structures according to the horizontal movement.

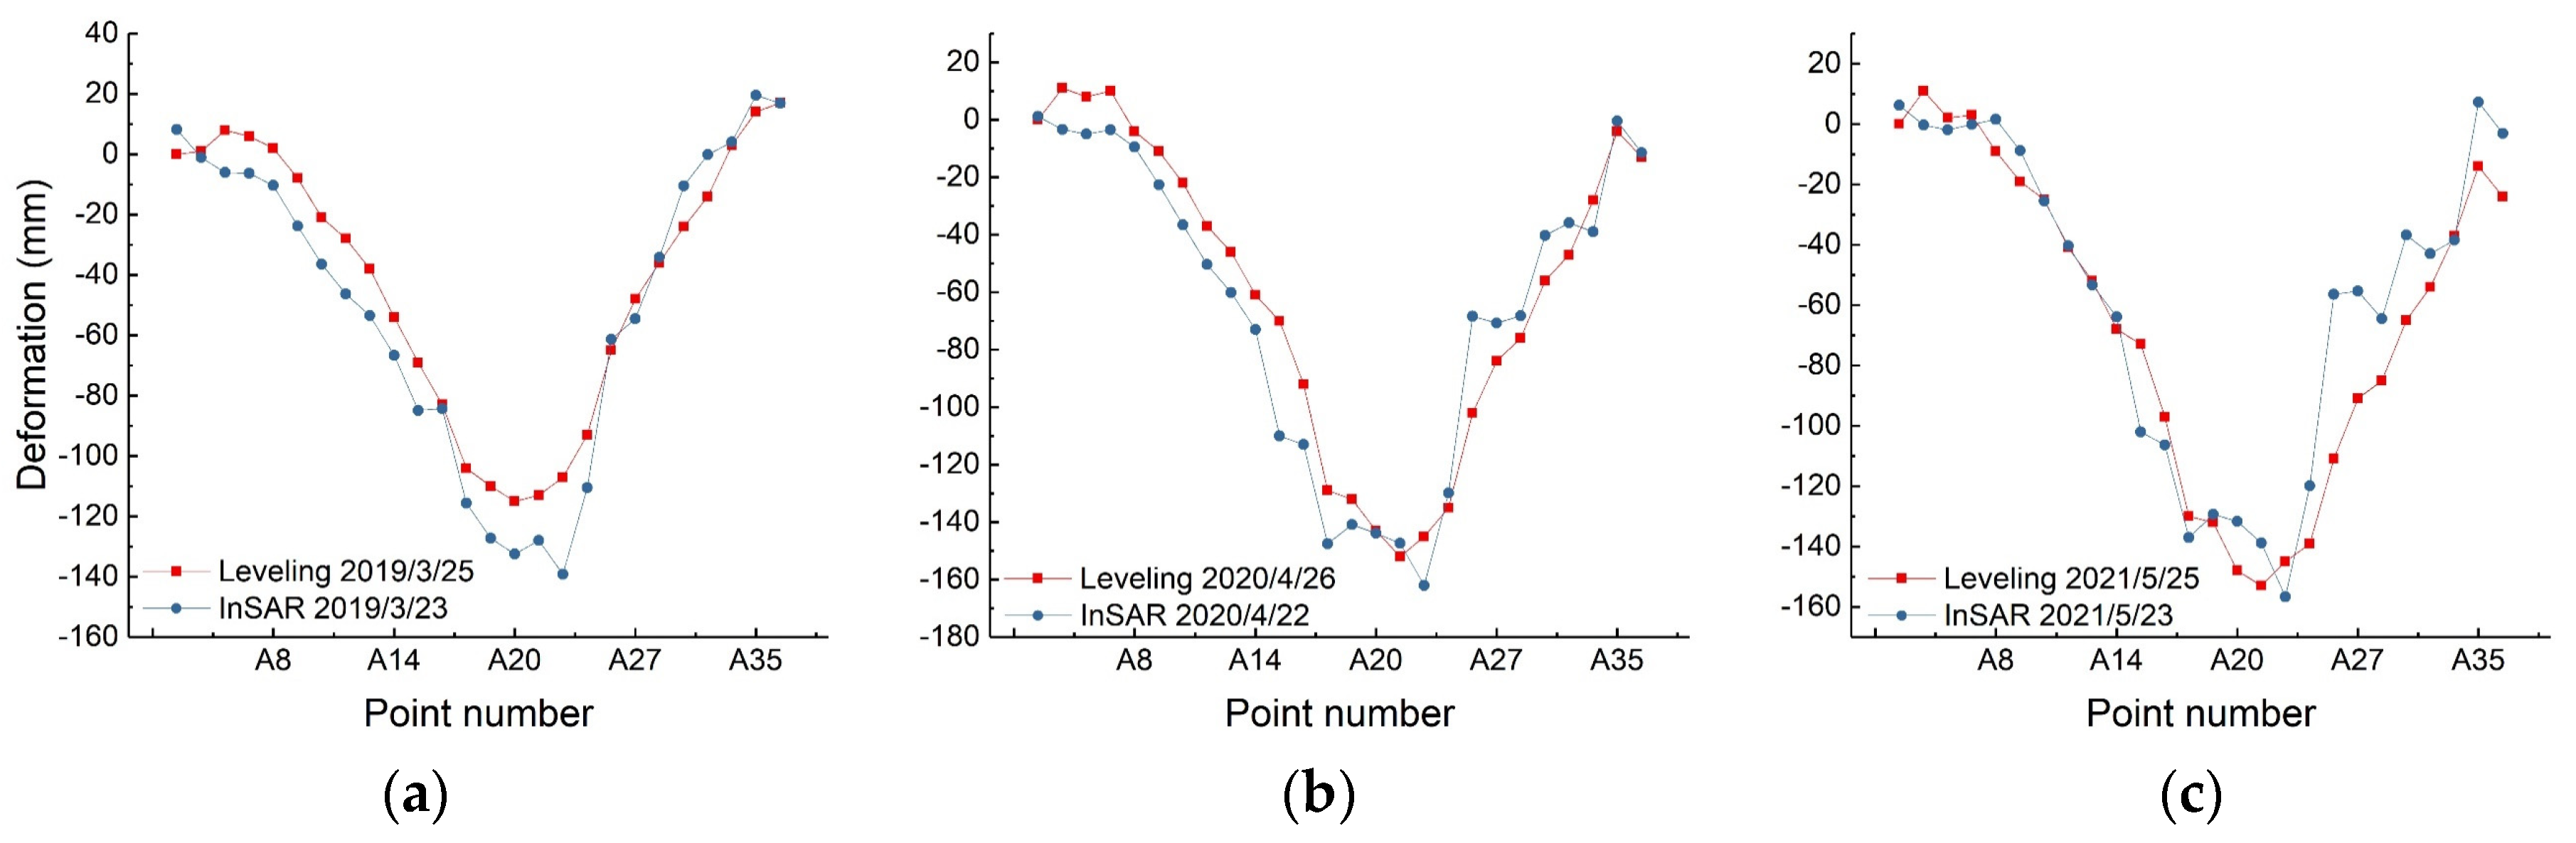
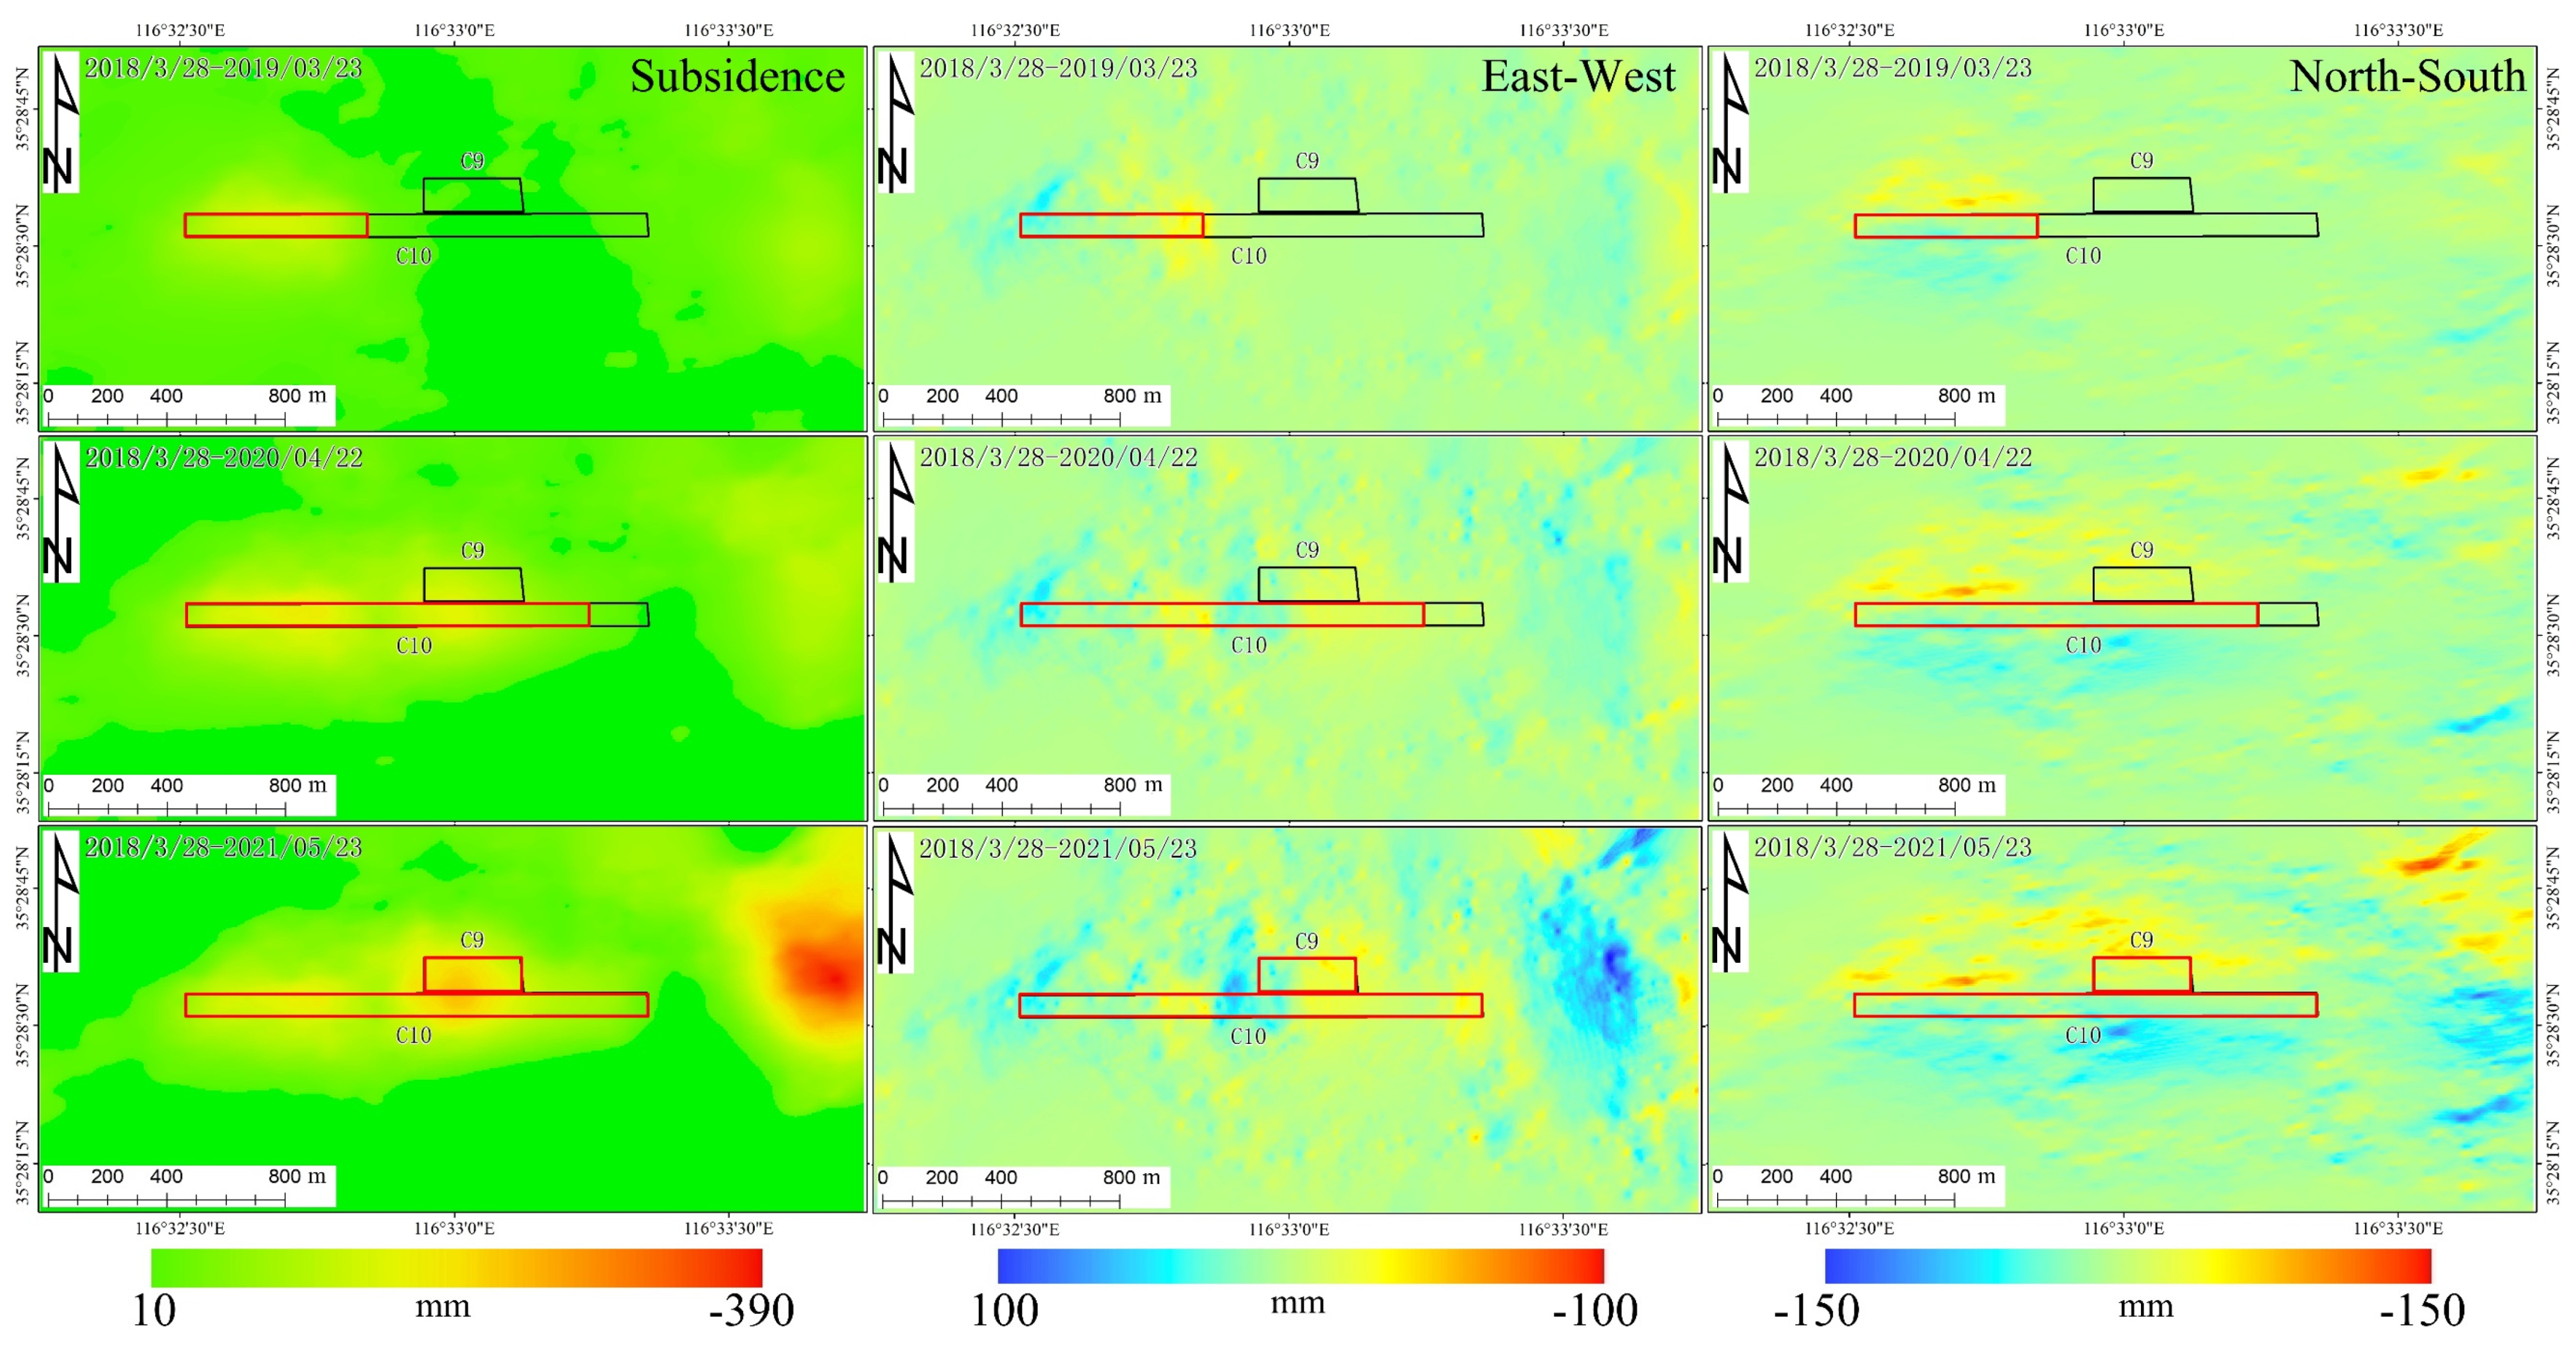
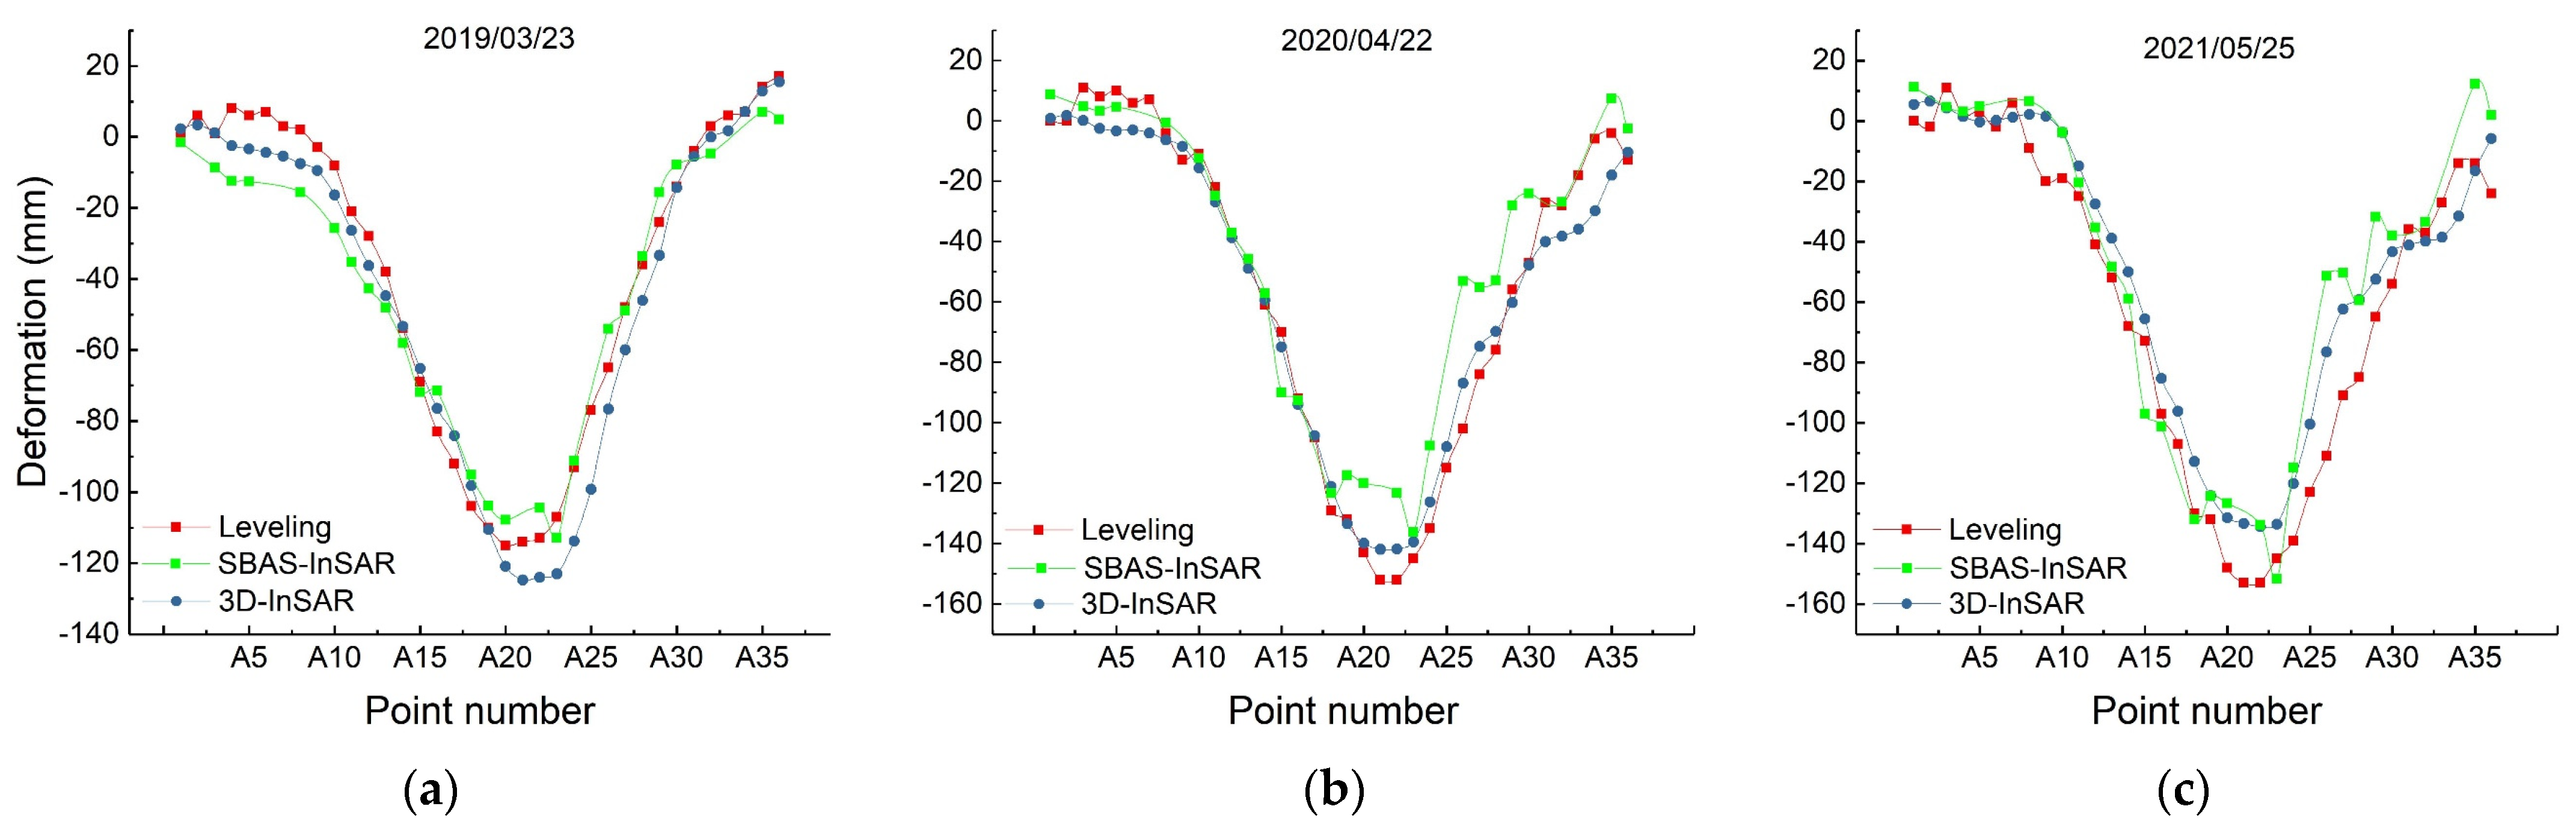
3.2. Three-Dimensional Deformation Inversion Results

To further clarify the influence of horizontal movement on the monitoring accuracy of InSAR and to reduce the errors generated by the mismatch between the position of the level observation station and the high-coherence point, the image resolution, etc., the 3D deformation of the line-of-sight deformation acquired by InSAR is decomposed based on a single SAR data source combined with the mining subsidence law (the horizontal movement is linear to the inclination). The central steps of 3D deformation decomposition include the following: (1) It can interpolate the cumulative deformation of the InSAR line-of-sight direction by using the inverse distance-weighted interpolation approach. (2) The single SAR data source of the imaging geometry and the mining subsidence law can be combined to construct a 3D deformation decomposition formula. (3) Assuming that the deformation of the subsidence position far from the surface is 0, the vertical deformation is solved by the backward iteration technique. (4) The horizontal movement is resolved according to the vertical deformation combined with the linear relationship of the horizontal movement and the inclination. Figure 6 provides the 3D deformation inversion results for each year, with 28 March 2018 as the time base.
In Figure 6, the east–west horizontal movement towards the east is positive, and the north–south horizontal movement towards the north is positive. It can be seen in Figure 6 that the vertical cumulative subsidence attained after the 3D decomposition of the line-of-sight deformation obtained by InSAR conforms to the law of surface subsidence caused by mining. With the continuous advancement of the C9 and C10 filling and mining working faces, the scope and subsidence values of the surface subsidence basins are constantly increasing. As of 23 May 2021, the maximum surface subsidence caused by the mining of the C9 and C10 working faces has been about −230 mm. Moreover, during the development of the surface subsidence basin, two subsidence funnels were formed. The two subsidence funnels are approximately elliptical and are located on the west side and the middle of the C10 working face, respectively. Due to the influence of mining adjacent to the C9 working face, the scope and magnitude of the subsidence funnel in the middle of C10 is larger than that on the west side. Also, because of the mining of the other working faces, the surface of the eastern side of the investigated area has obvious subsidence, and the maximum subsidence level can reach −390 mm. From the inversion findings of the east–west horizontal movement in Figure 6, it can be seen that the influence range and deformation level of the east–west horizontal movement are continually enhanced by the mining of the working face. As of 23 May 2021, the horizontal movement from east to west can reach −36 mm~50 mm. Furthermore, with the mining of the C9 and C10 working faces, the influence range and magnitude of the north–south horizontal movement are also increasing. As of 23 May 2021, the north–south horizontal movement can achieve −97~92 mm, which is significantly larger than the east–west horizontal movement. The reason for the analysis results is that the shape of the surface subsidence basin is approximately oval and the long axis direction is perpendicular to the north–south direction. Thus, the north–south component of the horizontal surface movement is greater than the east–west horizontal movement component. From the 3D deformation inversion findings, it can be concluded that although the surface subsidence of filling mining is small, the surface is still accompanied by a large horizontal movement. When monitoring the surface movement and deformation caused by filling and mining, to guarantee the accuracy of the monitoring results, the influence of the horizontal movement must be considered.
Because the collected leveling data can only verify the vertical deformation accuracy obtained by InSAR, the vertical deformation accuracy is verified by combining a single SAR data source and the 3D deformation findings obtained from the mining subsidence law. The results can be seen in Figure 7.
From Figure 7, it can be concluded that the vertical subsidence of the ground surface calculated by combining a single SAR data source and the linear relationship between the horizontal movement and inclination is consistent with the leveling data as a whole and that the deformation trend is similar. By the comparison with the direct conversion of the line-of-sight deformation into vertical deformation (Figure 5), the monitoring effect of the vertical deformation is appreciably enhanced, and the monitoring effect is perceptibly better than that of the direct conversion of the line-of-sight deformation into vertical deformation under the condition of ignoring horizontal movement. To quantitatively assess the vertical deformation monitoring accuracy, statistical analysis can be performed using the maximum deviation (MaxD), the minimum deviation (MinD), and the standard deviation (StD); the findings are summarized in Table 2.
As indicated in Table 2, when considering the horizontal movement, the standard deviation of the vertical sinking acquired by the 3D deformation decomposition is ~5 mm, and the overall average standard deviation is 6.2 mm, which is 39.8% higher than when ignoring the horizontal movement (Table 1). By comparing the vertical deformation and leveling data, the 3D deformation accuracy achieved by utilizing a single SAR data source and the mining subsidence law can reach the millimeter level, which can satisfy the requirements for the delineation of the mining subsidence damage range (10 mm).

4. Discussion

The surface movement and deformation pose a threat to the safe operation of ground roads, buildings, underground pipelines, power facilities, etc., and may also cause other natural disasters, such as landslides, mine earthquakes, etc. Therefore, it is of great significance to accurately delineate the influencing scope of mining subsidence for regional overall planning and design, land acquisition and reclamation, and the sustainable development of mines. Because the time-series InSAR results do not consider the influence of horizontal movement, the accuracy of the vertical deformation monitoring results is low, and the influence range of the surface subsidence cannot be accurately delineated. Therefore, based on the three-dimensional deformation results obtained from a single SAR data source combined with the mining subsidence law (the horizontal movement is linear to the inclination), the subsidence range of the C9 and C10 filling mining faces is delineated.
Figure 8 shows the influence range of the surface subsidence of the C9 and C10 filling mining faces. It can be seen from Figure 8 that the influence range of the surface movement and deformation caused by the mining of the C9 and C10 filling working faces was mainly located in the north of Lilin by March 2019. Among them, the maximum subsidence of the surface can reach −130 mm at the location on the northern edge of Lilin, while Mengying, Huying, Shilipu, and Panwangying are not affected by mining subsidence at this time. Due to the influence of the other working face mines, Shiwangying as a whole is within the scope of mining subsidence; the maximum subsidence is −80 mm and is located in the center of Shiwangying. With the advancement of the working faces, the range of surface subsidence basins has continuously expanded. Since April 2020, the influence range of the surface subsidence basins has expanded to Mengying. Regarding the southeast corner of Mengying, it is not affected by mining subsidence; however, the other areas are within the scope of the mining subsidence. The influence range of mining subsidence basins in Lilin has not changed significantly, but the maximum subsidence magnitude has reached−150 mm. Shiwangying is still in the subsidence basin as a whole due to the influence of working face mining, and the magnitude of surface subsidence is increasing, with a maximum of −100 mm. Since May 2021, the scope of the surface subsidence basin promoted by the C9 and C10 filling working faces has gradually expanded, but the scope of the villages affected by subsidence has not changed significantly; only the magnitude of the subsidence has increased significantly. The maximum subsidence of Lilin is −150 mm, the maximum subsidence of Mengying is −220 mm, and the maximum subsidence of Shiwangying is −350 mm. The other three villages (Huying, Shilipu, and Panwangying) were not affected by surface subsidence during the mining of the C9 and C10 filling working faces.

5. Conclusions

According to the 97 ascending Sentinel-1A images and the SBAS technology, the surface subsidence caused by the mining of the backfill working faces from March 2018 to June 2021 can be obtained. The comparison with the leveling data of 46 observation stations indicates that the StD of the InSAR monitoring results is 10.3 mm, which is greater than the delineation standard (10 mm) for the surface subsidence range of coal mining. Therefore, there is a significant deviation when using InSAR results to delineate the range of surface subsidence; consequently, it is difficult to meet the practical requirements.
In order to improve the accuracy of the SBAS technology monitoring results, the 3D deformation of the LOS obtained from InSAR was decomposed based on the mining subsidence law (horizontal movement and inclination are linear). The 3D deformation field indicates that the horizontal movement in the east–west and north–south directions caused by the mining of the C9 and C10 working faces can reach 50 mm and 97 mm, respectively. Therefore, the monitoring of the surface deformation caused by backfill mining must consider the influence of horizontal movement to ensure the accuracy of the monitoring results. The comparison with the leveling data indicates that the average StD of the vertical subsidence obtained by the 3D deformation decomposition is 6.2 mm; thus, the accuracy can reach the millimeter-level requirements. Compared with the results derived by ignoring the horizontal movement, the accuracy of the InSAR monitoring results is enhanced by 39.8%, which can satisfy the requirements for the delineation of the mining subsidence damage range (10 mm).

Author Contributions

All authors contributed extensively to the present paper. Conceptualization and writing, Y.Y. and G.G.; methodology and writing, M.Z.; InSAR monitoring data analysis, Y.C.; software, H.L.; investigation, W.H. and Z.S. All authors have read and agreed to the published version of the manuscript.

Funding

This research was funded by the National Natural Science Foundation of China (Grant Numbers: 42171312), the Graduate Innovation Program of China University of Mining and Technology (2023WLKXJ166), the Postgraduate Research & Practice Innovation Program of Jiangsu Province (KYCX23_2753), and the Scientific Research Project of Jiangsu Bureau of Geological and Mineral Exploration (2021KY08).

Data Availability Statement

The datasets generated during and/or analyzed during the current study are available from the corresponding author on reasonable request.

Conflicts of Interest

The authors declare no conflict of interest.

References

  1. BP. BP Statistical Review of World Energy 2018; British Petroleum Company: London, UK, 2018. [Google Scholar]
  2. Chen, B.; Li, Z.; Yu, C.; Fairbairn, D.; Kang, J.; Hu, J.; Liang, L. Three-dimensional time-varying large surface displacements in coal exploiting areas revealed through integration of SAR pixel offset measurements and mining subsidence model. Remote Sens. Environ. 2020, 240, 111663. [Google Scholar] [CrossRef]
  3. Pawluszek-Filipiak, K.; Borkowski, A. Monitoring mining-induced subsidence by integrating differential radar interferometry and persistent scatterer techniques. Eur. J. Remote Sens. 2021, 54, 18–30. [Google Scholar] [CrossRef]
  4. Declercq, P.-Y.; Dusar, M.; Pirard, E.; Verbeurgt, J.; Choopani, A.; Devleeschouwer, X. Post Mining Ground Deformations Transition Related to Coal Mines Closure in the Campine Coal Basin, Belgium, Evidenced by Three Decades of MT-InSAR Data. Remote Sens. 2023, 15, 725. [Google Scholar] [CrossRef]
  5. Emad, M.Z. Numerical modelling approach for mine backfill. Sādhanā 2017, 42, 1595–1604. [Google Scholar] [CrossRef]
  6. Raffaldi, M.J.; Seymour, J.B.; Richardson, J.; Zahl, E.; Board, M. Cemented paste backfill geomechanics at a narrow-vein underhand cut-and-fill mine. Rock Mech. Rock Eng. 2019, 52, 4925–4940. [Google Scholar] [CrossRef] [PubMed]
  7. Hasan, A.; Karrech, A.; Chareyre, B. Evaluating force distributions within virtual uncemented mine backfill using discrete element method. Int. J. Geomech. 2017, 17, 06016042. [Google Scholar] [CrossRef]
  8. Mo, S.; Canbulat, I.; Zhang, C.; Oh, J.; Shen, B.; Hagan, P. Numerical investigation into the effect of backfilling on coal pillar strength in highwall mining. Int. J. Min. Sci. Technol. 2018, 28, 281–286. [Google Scholar] [CrossRef]
  9. Akkaya, U.G.; Cinku, K.; Yilmaz, E. Characterization of strength and quality of cemented mine backfill made up of lead-zinc processing tailings. Front. Mater. 2021, 8, 740116. [Google Scholar] [CrossRef]
  10. Cavusoglu, I.; Yilmaz, E.; Yilmaz, A.O. Sodium silicate effect on setting properties, strength behavior and microstructure of cemented coal fly ash backfill. Powder Technol. 2021, 384, 17–28. [Google Scholar] [CrossRef]
  11. Fenn, D.; du Kanda, A.; Dukhan, D. Determining settlement rates and surface stability using in situ density of backfill as a proxy for displacement. J. South. Afr. Inst. Min. Metall. 2015, 115, 1035–1043. [Google Scholar] [CrossRef]
  12. Ren, H.; Xiao, W.; Zhao, Y.; Hu, Z. Land damage assessment using maize aboveground biomass estimated from unmanned aerial vehicle in high groundwater level regions affected by underground coal mining. Environ. Sci. Pollut. Res. 2020, 27, 21666–21679. [Google Scholar] [CrossRef]
  13. State Administration of Work Safety; State Administration of Coal Mine Safty; National Energy Administration; National Railway Administration of the People’s Republic of China. Regulations for Coal Pillar Retention and Coal Mining for Buildings, Water Bodies, Railways and Main Roadways; The State Council: Beijing, China, 2017.
  14. Li, J.; Wang, L. Mining subsidence monitoring model based on BPM-EKTF and TLS and its application in building mining damage assessment. Environ. Earth Sci. 2021, 80, 396. [Google Scholar] [CrossRef]
  15. Guo, W.B.; Liu, Y.X.; Li, X.S. Fuzzy Custering Analysis of Mining Induced Damages of Buildings. J. Min. Saf. Enginneing 2007, 3, 288–292. [Google Scholar]
  16. Chomacki, L.; Rusek, J.; Słowik, L. Machine Learning Methods in Damage Prediction of Masonry Development Exposed to the Industrial Environment of Mines. Energies 2022, 15, 3958. [Google Scholar] [CrossRef]
  17. Chomacki, L.; Rusek, J.; Słowik, L. Selected Artificial Intelligence Methods in the Risk Analysis of Damage to Masonry Buildings Subject to Long-Term Underground Mining Exploitation. Minerals 2021, 11, 958. [Google Scholar] [CrossRef]
  18. Zheng, M.; Deng, K.; Fan, H.; Huang, J. Monitoring and analysis of mining 3D deformation by multi-platform SAR images with the probability integral method. Front. Earth Sci. 2019, 13, 169–179. [Google Scholar] [CrossRef]
  19. Antonielli, B.; Sciortino, A.; Scancella, S.; Bozzano, F.; Mazzanti, P. Tracking Deformation Processes at the Legnica Glogow Copper District (Poland) by Satellite InSAR—I: Room and Pillar Mine District. Land 2021, 10, 653. [Google Scholar] [CrossRef]
  20. Fialko, Y.; Simons, M.; Agnew, D. The complete (3-d) surface displacement field in the epicentral area of the 1999 m w 7.1 hector mine earthquake, california, from space geodetic observations. Geophys. Res. Lett. 2001, 28, 3063–3066. [Google Scholar] [CrossRef]
  21. Nematollah, G.; Yo, F. Using InSAR for evaluating the accuracy of locations and focal mechanism solutions of local earthquake catalogues. Geophys. J. Int. 2022, 230, 607–622. [Google Scholar] [CrossRef]
  22. Nardò, S.; Ascione, A.; Mazzoli, S.; Terranova, C.; Vilardo, G. PS-InSAR data analysis: Pre-seismic ground deformation in the 2009 L′Aquila earthquake region. Boll. Di Geofis. Teor. Ed Appl. 2020, 61, 41–56. [Google Scholar] [CrossRef]
  23. Lu, Z.; Fielding, E.; Patrick, M.R.; Trautwein, C.M. Estimating lava volume by precision combination of multiple baseline spaceborne and airborne interferometric synthetic aperture radar: The 1997 eruption of okmok volcano, alaska. IEEE Trans. Geosci. Remote Sens. 2003, 41, 1428–1436. [Google Scholar]
  24. Bountos, N.I.; Papoutsis, I.; Michail, D.; Anantrasirichai, N. Self-Supervised Contrastive Learning for Volcanic Unrest Detection. IEEE Geosci. Remote Sens. Lett. 2022, 19, 1–5. [Google Scholar] [CrossRef]
  25. Anantrasirichai, N.; Biggs, J.; Albino, F.; Bull, D. A deep learning approach to detecting volcano deformation from satellite imagery using synthetic datasets. Remote Sens. Environ. 2019, 230, 111179. [Google Scholar] [CrossRef]
  26. Li, Q.Y.; Wang, Y. Research on Deformation Law of Deep Excavation Supporting Structures in Beijing Metro Station. Adv. Mater. Res. 2011, 243, 2338–2344. [Google Scholar] [CrossRef]
  27. Li, Z.W.; Yang, Z.F.; Zhu, J.J.; Hu, J.; Wang, Y.J.; Li, P.X.; Chen, G. Retrieving three-dimensional displacement fields of mining areas from a single InSAR pair. J. Geod. 2015, 89, 17–32. [Google Scholar] [CrossRef]
  28. Fan, H.D.; Cheng, D.; Deng, K.Z.; Chen, B.Q.; Zhu, C.G. Subsidence monitoring using d-insar and probability integral prediction modelling in deep mining areas. Surv. Rev. 2015, 47, 438–445. [Google Scholar] [CrossRef]
  29. Modeste, G.; Doubre, C.; Masson, F. Time evolution of mining-related residual subsidence monitored over a 24-year period using InSAR in southern Alsace, France. Int. J. Appl. Earth Obs. Geoinf. 2021, 102, 102392. [Google Scholar] [CrossRef]
  30. Chatterjee, R.S.; Lakhera, R.C.; Dadhwal, V.K. InSAR coherence and phase information for mapping environmental indicators of opencast coal mining: A case study in Jharia Coalfield, Jharkhand, India. Can. J. Remote Sens. 2010, 36, 361–373. [Google Scholar] [CrossRef]
  31. Ferretti, A.; Prati, C.; Rocca, F.L. Permanent scatterers in sar interferometry. ieee trans geosci remot sen. IEEE Trans. Geosci. Remote Sens. 2001, 39, 8–20. [Google Scholar] [CrossRef]
  32. Berardino, P.; Fornaro, G.; Lanari, R.; Sansosti, E. A new algorithm for surface deformation monitoring based on small baseline differential sar interferograms. IEEE Trans. Geosci. Remote Sens. 2002, 40, 2375–2383. [Google Scholar] [CrossRef]
  33. Hooper, A. A multi-temporal InSAR method incorporating both persistent scatterer and small baseline approaches. Geophys. Res. Lett. 2008, 35, 96–106. [Google Scholar] [CrossRef]
  34. Zheng, M.; Deng, K.; Fan, H.; Du, S.; Zou, H. Monitoring and analysis of mining 3D time-series deformation based on multi-track SAR data. Int. J. Remote Sens. 2019, 40, 1409–1425. [Google Scholar] [CrossRef]
  35. Witkowski, W.T.; Łukosz, M.; Guzy, A.; Hejmanowski, R. Estimation of Mining-Induced Horizontal Strain Tensor of Land Surface Applying InSAR. Minerals 2021, 11, 788. [Google Scholar] [CrossRef]
  36. Puniach, E.; Gruszczynski, W.; Stoch, T.; Mrocheń, D.; Ćwiąkała, P.; Sopata, P.; Pastucha, E.; Matwij, W. Determination of the coefficient of proportionality between horizontal displacement and tilt change using UAV photogrammetry. Eng. Geol. 2023, 312, 106939. [Google Scholar] [CrossRef]
Figure 1. Time-series InSAR data processing flow.
Remotesensing 15 05618 g001
Figure 2. Three-dimensional spatial decomposition model of satellite line-of-sight deformation.
Remotesensing 15 05618 g002
Figure 3. Location of the study area.
Remotesensing 15 05618 g003
Figure 4. SBAS monitoring results of surface subsidence in C9 and C10.
Remotesensing 15 05618 g004
Figure 5. Comparison between InSAR monitoring results and leveling data.
Remotesensing 15 05618 g005
Figure 6. Inversion results of 3D deformation The red rectangle represents the mined area; the black rectangle represents the area to be mined.
Remotesensing 15 05618 g006
Figure 7. Comparison of vertical deformation and horizontal data after 3D decomposition.
Remotesensing 15 05618 g007
Figure 8. Delineation of surface influence area of C9 and C10 filling mining.
Remotesensing 15 05618 g008
Table 1. Accurateness evaluation of InSAR monitoring results (unit: mm).
(a)(b)(c)Mean Value
MaxD40.2 39.9 54.6 44.9
MinD0.2 0.8 0.4 0.5
StD9.29.012.710.3
Table 2. Evaluation of vertical sinking accuracy (unit: mm).
(a)(b)(c)Mean Value
MaxD22.323.734.426.8
MinD0.10.70.50.4
StD5.45.47.86.2
Disclaimer/Publisher’s Note: The statements, opinions and data contained in all publications are solely those of the individual author(s) and contributor(s) and not of MDPI and/or the editor(s). MDPI and/or the editor(s) disclaim responsibility for any injury to people or property resulting from any ideas, methods, instructions or products referred to in the content.

