Article

Grassland Chlorophyll Content Estimation from Drone Hyperspectral Images Combined with Fractional-Order Derivative

1
Key Laboratory of 3D Information Acquisition and Application, Ministry of Education, Capital Normal University, Beijing 100048, China
2
Engineering Research Center of Spatial Information Technology, Ministry of Education, Capital Normal University, Beijing 100048, China
3
Key Laboratory of Ecosystem Network Observation and Modeling, Institute of Geographic Sciences and Natural Resources Research, Chinese Academy of Sciences, Beijing 100101, China
4
Academy of Animal Science and Veterinary Medicine, Qinghai University, Xining 810016, China
5
School of Ecology, Resources and Environment, Dezhou University, Dezhou 253023, China
*
Author to whom correspondence should be addressed.
Remote Sens. 2023, 15(23), 5623; https://doi.org/10.3390/rs15235623
Submission received: 9 October 2023 / Revised: 24 November 2023 / Accepted: 27 November 2023 / Published: 4 December 2023

Abstract

:
Chlorophyll plays a critical role in assessing the photosynthetic capacity and health of grasslands. However, existing studies on the hyperspectral inversion of chlorophyll have mainly focused on field crops, leading to limited accuracy when applied to natural grasslands due to their complex canopy structures and species diversity. This study aims to address this challenge by extrapolating the measured leaf chlorophyll to the canopy level using the green vegetation coverage approach. Additionally, fractional-order derivative (FOD) methods are employed to enhance the sensitivity of hyperspectral data to chlorophyll. Several FOD spectral indices are developed to minimize interference from factors such as bare soil and hay, resulting in improved chlorophyll estimation accuracy. The study utilizes partial least squares regression (PLSR) and support vector machine regression (SVR) to construct inversion models based on full-band FOD, two-band FOD spectral indices, and their combination. Through comparative analysis, the optimal model for estimating grassland chlorophyll content is determined, yielding an R2 value of 0.808, RMSE value of 1.720, and RPD value of 2.347.

Graphical Abstract

1. Introduction

Chlorophyll serves as a crucial indicator for assessing grass quality [1] by providing a precise reflection of the grass’s photosynthetic capacity and physiological health [2,3]. While the use of unmanned aerial vehicle (UAV) imaging hyperspectral technology in agricultural remote sensing has been increasing [4], most studies have primarily focused on estimating vegetation chlorophyll content using hyperspectral remote sensing data for single crops with broad or leafy leaves, such as maize [5,6] and wheat [7,8]. However, accurately estimating canopy-scale chlorophyll content in grassland vegetation, which is characterized by diverse species, small leaves, and a complex hierarchical structure, poses a greater challenge due to potential interferences from bare soil and hay. Ma and Wang [9] have underscored the difficulties in accurately estimating chlorophyll levels in natural, heterogeneous grassland canopies, attributing these challenges to the complex canopy structure and rich species composition inherent to these environments. To address this issue, researchers have developed hyperspectral indices tailored for vegetation monitoring. These indices are designed to enhance the discrimination of the vegetation’s physiological conditions while reducing the impact of external environmental factors. These meticulously designed indices operate by improving the reflection characteristics of vegetation, making them promising candidates for estimating chlorophyll content in natural grasslands. By utilizing specific combinations of wavelengths or spectral bands, these indices can effectively differentiate between the physiological status of vegetation and the influence of the surrounding environment. This distinction allows for a more precise assessment of chlorophyll content in natural grasslands, thereby enabling researchers and agriculturalists to gain better insights into and manage the health and quality of grassland ecosystems.
Darvishzadeh et al. [10] conducted a study to estimate leaf and canopy chlorophyll content in Mediterranean heterogeneous grasslands. Their findings revealed that the narrowband normalized difference vegetation index (NDVI) and soil-adjusted index 2 (SAVI2) demonstrated the most accurate performance. The canopy predicted R2 was approximately 0.7, while the leaf chlorophyll predicted R2 was below 0.4. These results indicate that these indices hold significant potential for accurately estimating chlorophyll content in such grassland environments. Rossini et al. [11] estimated temporary grassland chlorophyll in subalpine grasslands using a set of vegetation indices, revealing that the correlation between leaf chlorophyll content and narrowband spectral indices exceeded 0.8. Wong and He [12] studied the simple ratio index (SRI) and found that both broadband [R, NIR] and narrowband [700, 750] spectra were applicable to heterogeneous grasslands. Amiri et al. [13] employed the normalized difference index (NDI) and SRI to estimate chlorophyll content in northern Australian grasslands, demonstrating that both spectral indices were poorly applicable at a sub-continental scale. In a different approach, Han et al. [14] proposed a multispectral index called the grassland chlorophyll content index (GCI) to estimate chlorophyll content in grasslands located in Songpan, Sichuan Province, and Gonger, Inner Mongolia Autonomous Region, China. They achieved an R2 value of 0.703. While the inversion accuracy of these studies may not be exceedingly high, they still offer innovative ideas for chlorophyll estimation. These findings contribute to the exploration of diverse methods for estimating chlorophyll content in various grassland environments.
In response to the limited sensitivity of hyperspectral data in estimating grassland chlorophyll content, various studies have employed derivative techniques to enhance subtle changes in the spectral profile. Deriving reflectance spectral data allows for the removal of linear and near-linear background noise from vegetation spectra, thereby highlighting essential vegetation characteristics [15]. Differential spectra, derived from the original reflectance, have been shown to exhibit higher sensitivity to vegetation chlorophyll content [16]. However, it is important to note that using integer-order derivatives may result in a loss of asymptotic information, affecting the accuracy of chlorophyll estimation [17]. As a more refined alternative, the fractional-order derivative (FOD) extends the capabilities of integer-order derivatives, enabling the extraction of sensitive features and enhancing spectral information. FOD effectively eliminates the influence of the environmental background, revealing potential spectral information. In recent years, FOD has found wide application in digital filtering, signal processing, and image processing [18] and has demonstrated improved estimation accuracy for various parameters, including soil organic matter content [19], electrical conductivity [20], crop nitrogen content [21], and chlorophyll [16]. Its use in chlorophyll estimation has yielded promising results, underscoring the potential of FOD as a valuable tool for enhancing accuracy in remote sensing studies of grassland ecosystems.
Current methods for estimating chlorophyll content in grasslands often rely on empirical models and spectral indices composed of linear or nonlinear combinations of related bands. These indices are specifically designed to capture weak spectral signals, enhance sensitive information, reduce interference from correlated noise [22], and effectively highlight changes in chlorophyll content. Researchers have developed various specific spectral indices for different purposes. For example, Zhao et al. [23] introduced the normalized difference spectral index (NDSI) and the soil-adjusted vegetation index (SAVI) for the nitrogen nutrient index, using a combination of two bands. These newly devised indices have demonstrated improved accuracy in estimating nitrogen nutrient status. Similarly, Feng et al. [24] created the double green simple ratio index (DGSR) and double green normalized difference index (DGND) for monitoring wheat powdery mildew, utilizing the 584 nm and 550 nm bands. Their experimental results indicated that the double green indices outperformed traditional vegetation indices. Vegetation indices effectively highlight vegetation characteristics and minimize interference from atmospheric and soil background factors. Additionally, their ease of calculation makes them widely used for quantitative estimation in various applications. In summary, spectral indices play a crucial role in enhancing the accuracy and efficiency of chlorophyll content estimation in grassland studies.
In this study, leaf chlorophyll values were measured and extrapolated to the canopy level using UAV hyperspectral data. This extrapolation was based on the green vegetation coverage, which helped account for the spatial heterogeneity of the grassland. In order to enhance the hyperspectral feature information, the FOD technique was employed. FOD spectral indices were constructed to reduce the impact of soil and grass heterogeneity. Partial least squares regression (PLSR) and support vector machine regression (SVR) were used to develop models using both the FOD full-band data and FOD spectral indices. The primary goal of these models was to enhance the accuracy of chlorophyll content estimation in grasslands. By incorporating the FOD technique and advanced regression algorithms, this study aimed to provide more reliable and precise estimations of chlorophyll content in the complex and diverse grassland environment.

2. Materials and Methods
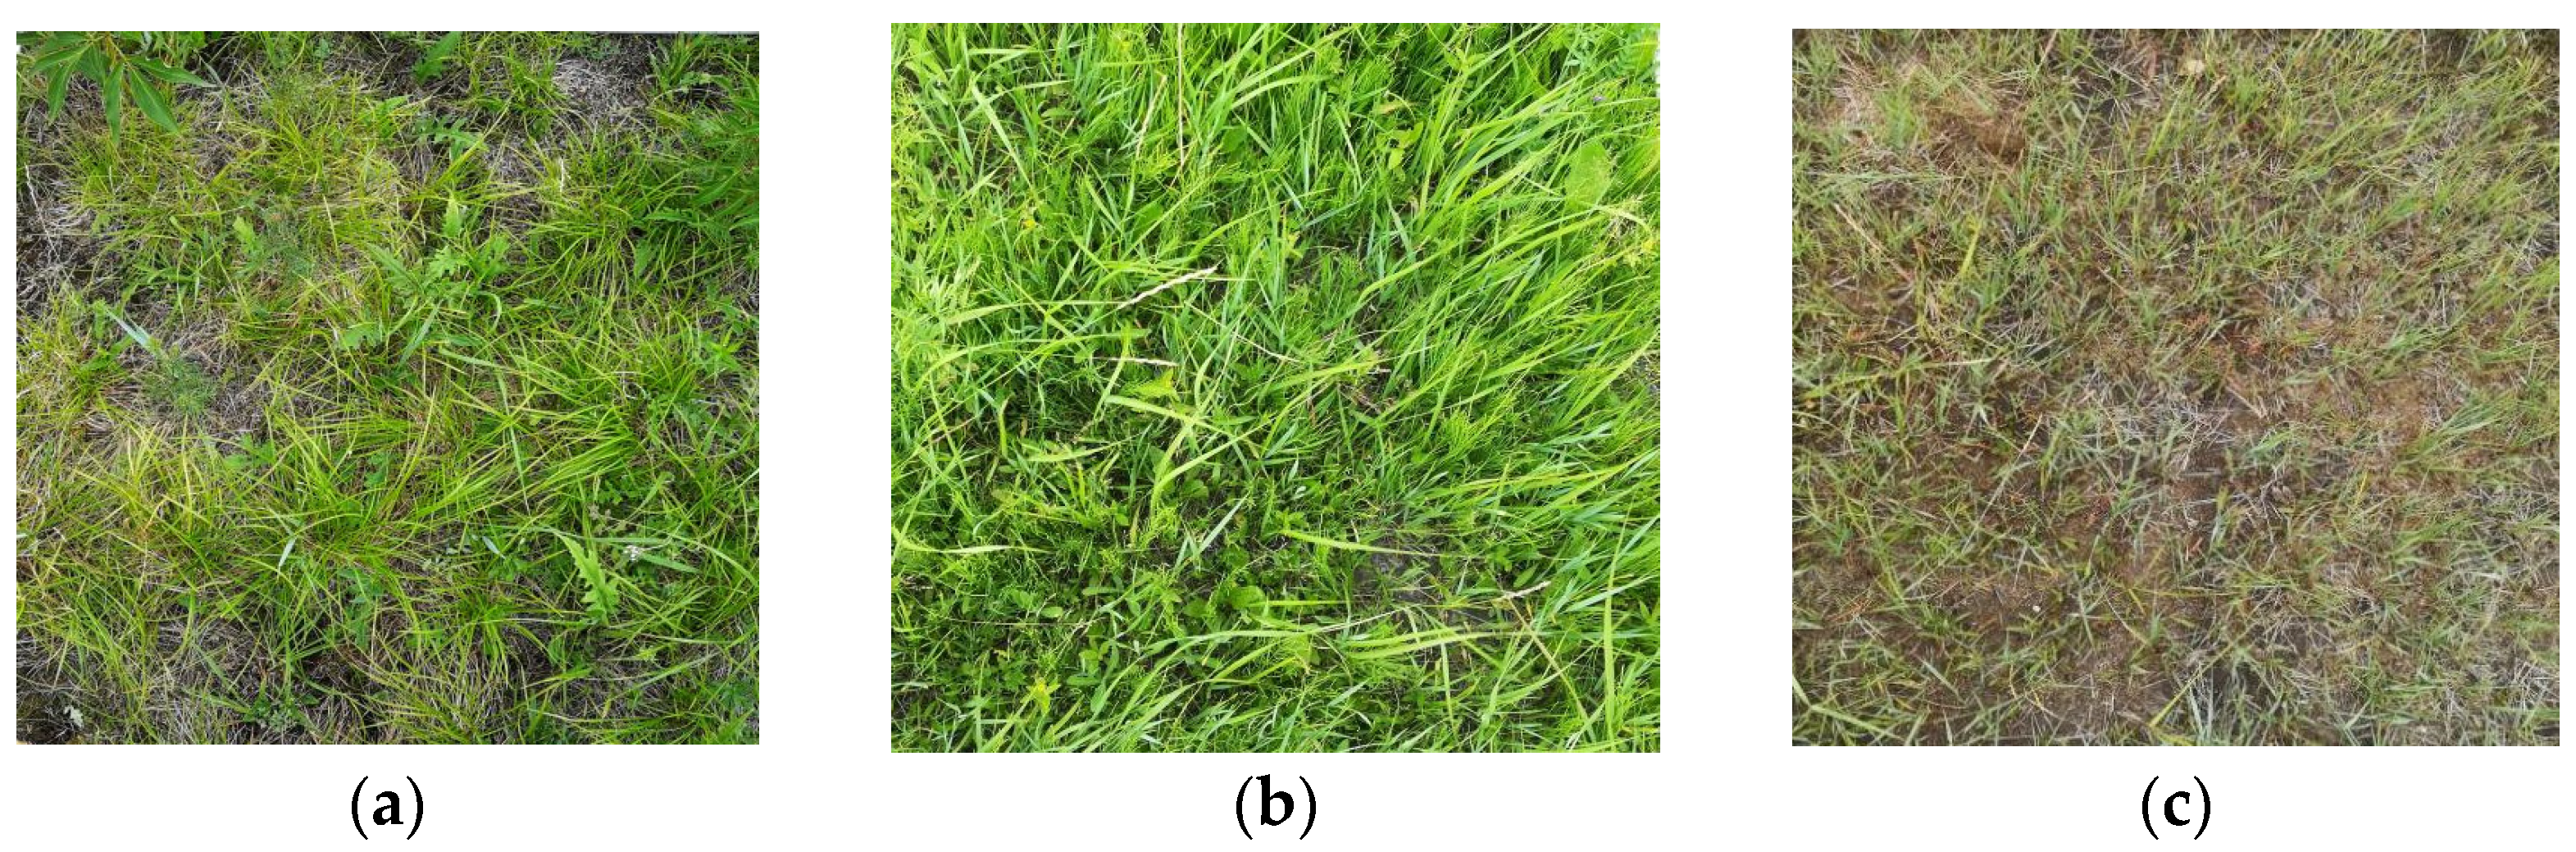
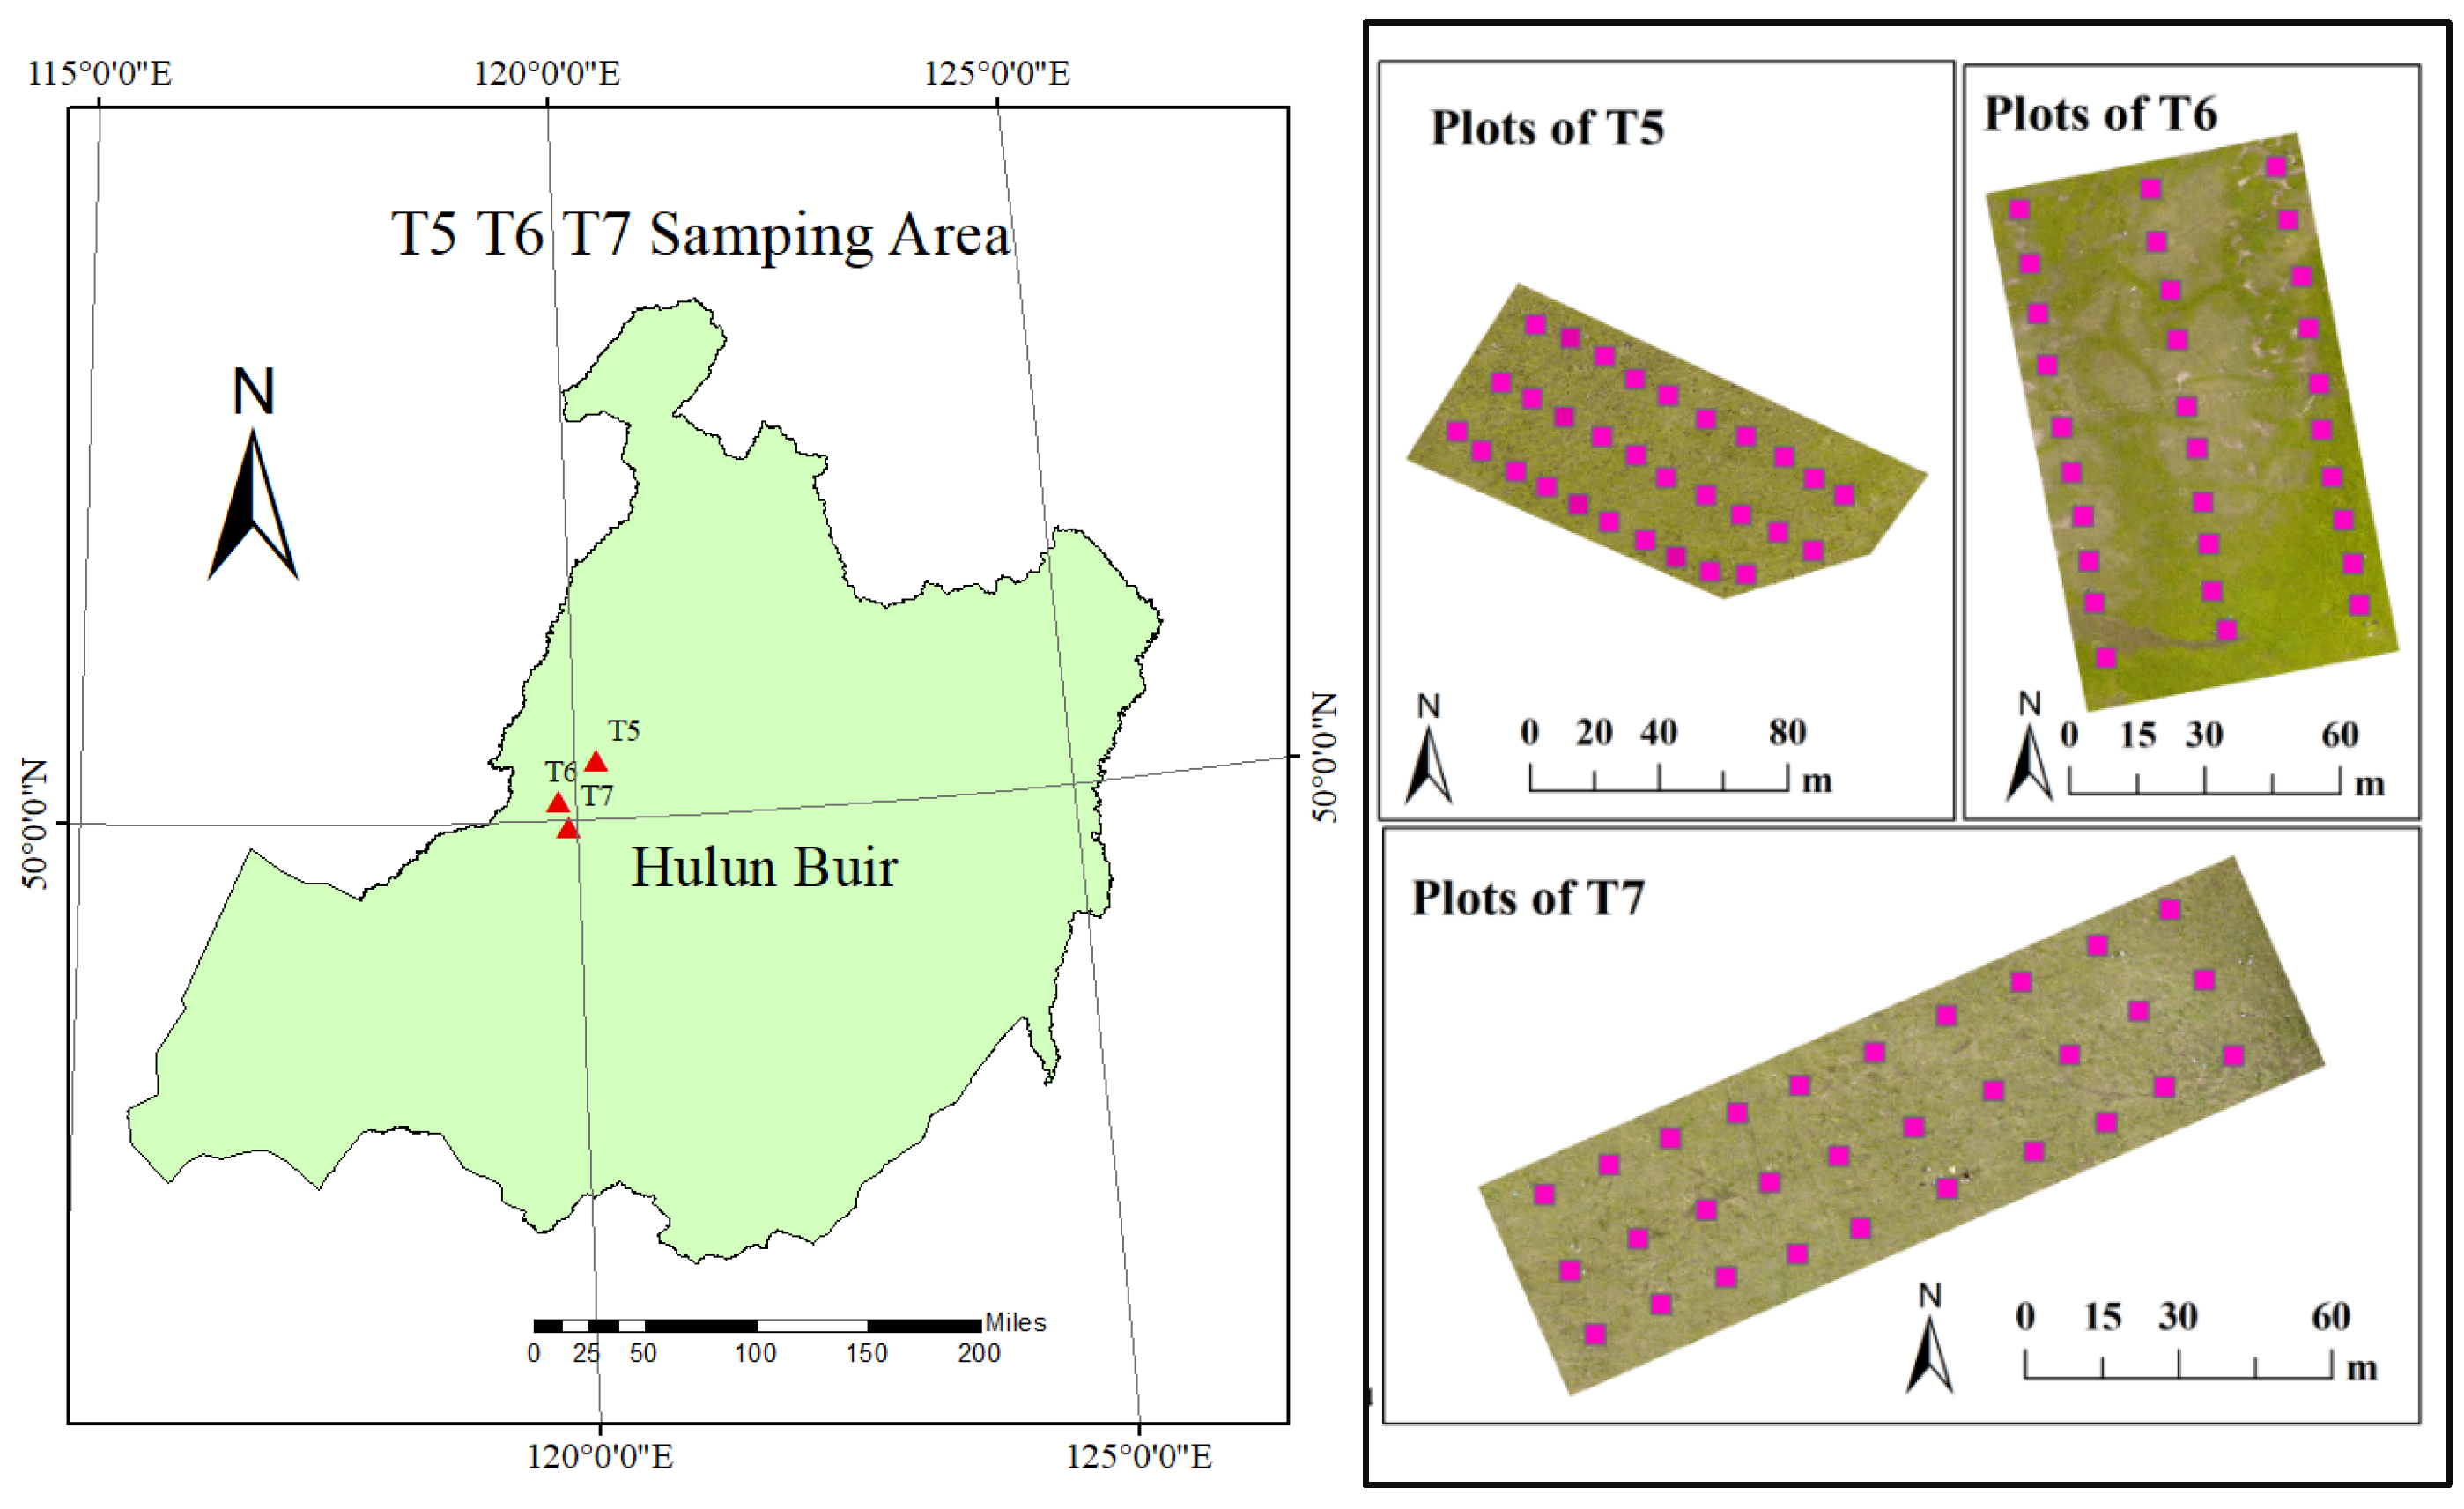
2.1. Study Area

The experimental site is located in the grassland transition zone of Erguna, Inner Mongolia, with coordinates spanning from 119°07′ to 121°49′E and 50°01′ to 53°26′N. It represents a typical temperate meadow grassland, primarily dominated by Leymus chinensis, needlegrass (Stipa), and heliotrope (Carex pedoformis). The study was conducted from 20 July to 26 July 2019, with a specific focus on selecting areas with robust grass growth and no apparent damage from external factors. These selected areas showcased uniform grass vegetation types and gentle topographical relief and maintained the original ecological integrity. Within the study area, three distinct sample zones, named T5, T6, and T7 (Figure 1), were established, each exhibiting varying green vegetation coverage. To ensure adequate representation, a grid pattern was overlaid within each sample area consisting of 30 small 1 m × 1 m sample squares spaced at 10-m intervals, resulting in a total of 90 sample squares. The dimensions of T5, T6, and T7 were 280 m × 225 m, 200 m × 225 m, and 250 m × 225 m, respectively. Figure 2 provides illustrative photographs of the three sample areas. The green vegetation coverage in the T5 and T7 samples displayed minor differences, ranging from 17% to 47.62%. In contrast, the T6 samples exhibited significant variability in green vegetation coverage, spanning from 17.49% to 87.24%. These diverse sample areas were selected deliberately to capture the full spectrum of green vegetation coverage in the temperate meadow grassland, ensuring comprehensive representation of the ecosystem for the study.

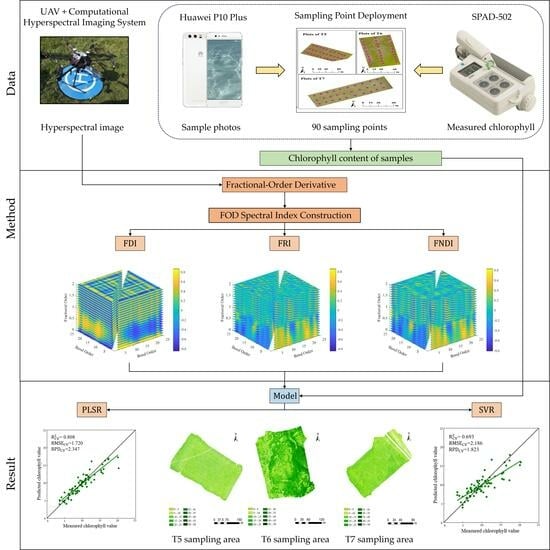
2.2. UAV Hyperspectral Data

In this study, the hyperspectral images of the T5, T6, and T7 measurement areas were captured using a computational hyperspectral imaging system developed by our research team. The system utilized a snapshot 5 × 5 mosaic sensor to reconstruct full-frame hyperspectral images. The spatial resolution of the images was 2088 × 1088 pixels, and they were composed of 25 spectral bands ranging from 600 to 1000 nm. The acquisition of the hyperspectral images was carried out using a DJI M600 Pro Drone equipped with the computational hyperspectral imaging system. The manufacturer of the equipment is DJI Innovations, based in Shenzhen, China. The flight parameters were set with a flight height of 60 m, a heading overlap of 60%, and a side overlap of 40%. The lens of the system was positioned vertically downward during the flight, resulting in an average spatial resolution of 2.75 cm.
Considering the low-altitude aerial height of 60 m in this study, the resulting remote sensing images are influenced by factors such as atmospheric aerosols, flat terrain, and small undulations. Consequently, the stitched hyperspectral image is not geometrically corrected to account for these effects. However, radiometric calibration was performed to convert the image’s digital numbers (DN values) into surface reflectance values. For the radiometric calibration, four calibration cloths with known reflectance values were used. These cloths had reflectance values of 5%, 20%, 40%, and 60%. Field spectra were collected from these cloths, and their mean corrected DN values were calculated for each band of the regions of interest (ROIs) extracted from the calibration cloth images. An ASD spectroradiometer was used for the spectral measurement of each calibration cloth, and the mean spectral measurement for each cloth was also determined. These calibration steps helped in quantifying the image DN values to generate surface reflectance values.
The hyperspectral images used in the study consist of 25 bands covering the spectral range of 600–1000 nm. The information for each band is provided in Table 1. Specifically, the first 8 bands correspond to the red band, while the remaining 17 bands belong to the near-infrared band.
To assess the reliability of the radiometric calibration, the study used ground canopy measured spectra from the samples in the three selected areas as the true values. The mean reflectance values of the image samples after calibration were considered as the test values for Pearson correlation analysis. The correlation between the reflectance values obtained from the calibration of the three areas and the ground canopy spectra was greater than 0.7. The highest correlation was observed in area T6, with most values exceeding 0.85. The correlation in areas T5 and T7 was relatively closer, ranging between 0.70 and 0.85. Overall, the results indicate that the radiometric calibration outcomes are reliable and can be utilized for the inversion of grass chlorophyll content.

2.3. Calculation of Chlorophyll Content in the Sample

In this experiment, the relative chlorophyll content was measured using the SPAD-502 chlorophyll meter, which has been previously shown to exhibit a highly significant correlation with true chlorophyll content [25]. The SPAD-502 is manufactured by Konica Minolta, Inc. in Japan. The SPAD-502 measurements were conducted simultaneously with the collection of drone images at the same location. To ensure accuracy and representativeness, a five-point sampling method was employed within each sample area. At each sampling point, the chlorophyll content of the upper, middle, and lower parts of the grass was measured using the SPAD-502. The average of these five points provided the chlorophyll value for each sample area. In total, 90 sample plots were measured across the three sample areas. However, it is worth noting that only 79 samples were ultimately used for analysis. This reduction in the sample size was due to some of the samples being obscured during the UAV flight for aerial photography due to staff sampling activities. Despite this limitation, the remaining 79 samples still provided sufficient data for the analysis and conclusions of the study.
Due to the inherent variability in green vegetation coverage and the presence of different components, such as fresh grasses, dead grasses, and bare soil, accurately estimating the chlorophyll content of grass canopies presents a challenge. This paper proposes a method to infer chlorophyll content based on the scale of green vegetation coverage [26]. Sample photos were captured using a Huawei P10 Plus smartphone positioned approximately 1 m above the ground, with the lens facing vertically downward, at the center of each sample. The HUAWEI P10 Plus is a smartphone officially released by Huawei Technologies Co., Ltd. (Shenzhen, China) on 26 February 2017, at the Mobile World Congress 2017 (MWC) held in Barcelona. Based on the color images obtained, a support vector machine (SVM) classification algorithm was employed to classify the images into two categories: green vegetation and other. The area of image elements occupied by green vegetation was then calculated, representing the green vegetation coverage of the sample. This approach allows for the estimation of chlorophyll content based on the scale of green vegetation coverage in the grass canopies. By utilizing the green vegetation coverage as a proxy for chlorophyll content, this method provides a practical and efficient way to estimate chlorophyll levels in complex grassland environments where traditional direct measurements may be challenging.
SPAD _ mean = i = 1 n SPAD i n
Cover _ greengrass = S _ greengrass S _ plot
SPAD _ cover = Cover _ greengrass × SPAD _ mean
In the provided information, the following variables are defined:
-
SPAD_cover: The estimated chlorophyll value of the sample canopy obtained through upward extrapolation of green vegetation coverage.
-
Cover_greengrass: The green vegetation coverage within the sample, expressed as a proportion.
-
SPAD_mean: The average SPAD value of the sample canopy.
-
SPADi: The individual SPAD-502 measurements obtained during the experiment.
-
n: The number of SPAD measurements taken.
-
S_greengrass: The number of pixels occupied by green vegetation in the image.
-
S_plot: The area of the sample square, which represents the size of the sampled area.

2.4. Methods

2.4.1. Fractional-Order Derivative

The FOD is derived from the integer-order derivative, which represents the slope of the spectral reflectance at any order [27]. It finds applications in various fields, such as system modeling, pattern recognition, signal filtering, and fractal theory. Fractional-order models often yield more accurate results compared to traditional integer-order models [28,29]. There are several approaches to define fractional order, including Riemann –Liouville, Caputo, and Grunwald–Letnikov approaches [30]. In this paper, the Grunwald–Letnikov form of FOD is used due to its simplicity and wide usage. The FOD is calculated using the same procedure as described in Equation (4), with the specific algorithm implemented in MATLAB 2016.
d a f λ d λ a     f λ + a f λ 1 + a a + 1 2 f λ 2 + + Γ a + 1 n ! Γ a + 1 f λ n
In the given equation, the variables are defined as follows:
-
d: The derivative operator, which represents the mathematical operation of taking the derivative.
-
Γ: The Gamma function, which is a mathematical function that generalizes the factorial function to complex numbers.
-
λ: The corresponding wavelength for which the derivative is being calculated.
-
n: The difference between the upper and lower limits of the derivative. When n is 0, 1, or 2, it represents the integer-order derivative.
-
a: An arbitrary order that can be any real or complex number, representing the fractional order of the derivative.
-
f(λ): The spectral reflectance value at the wavelength λ.
By using the derivative operator, Gamma function, and the difference between upper and lower limits, the equation allows for the calculation of both integer and fractional-order derivatives of the spectral reflectance values.

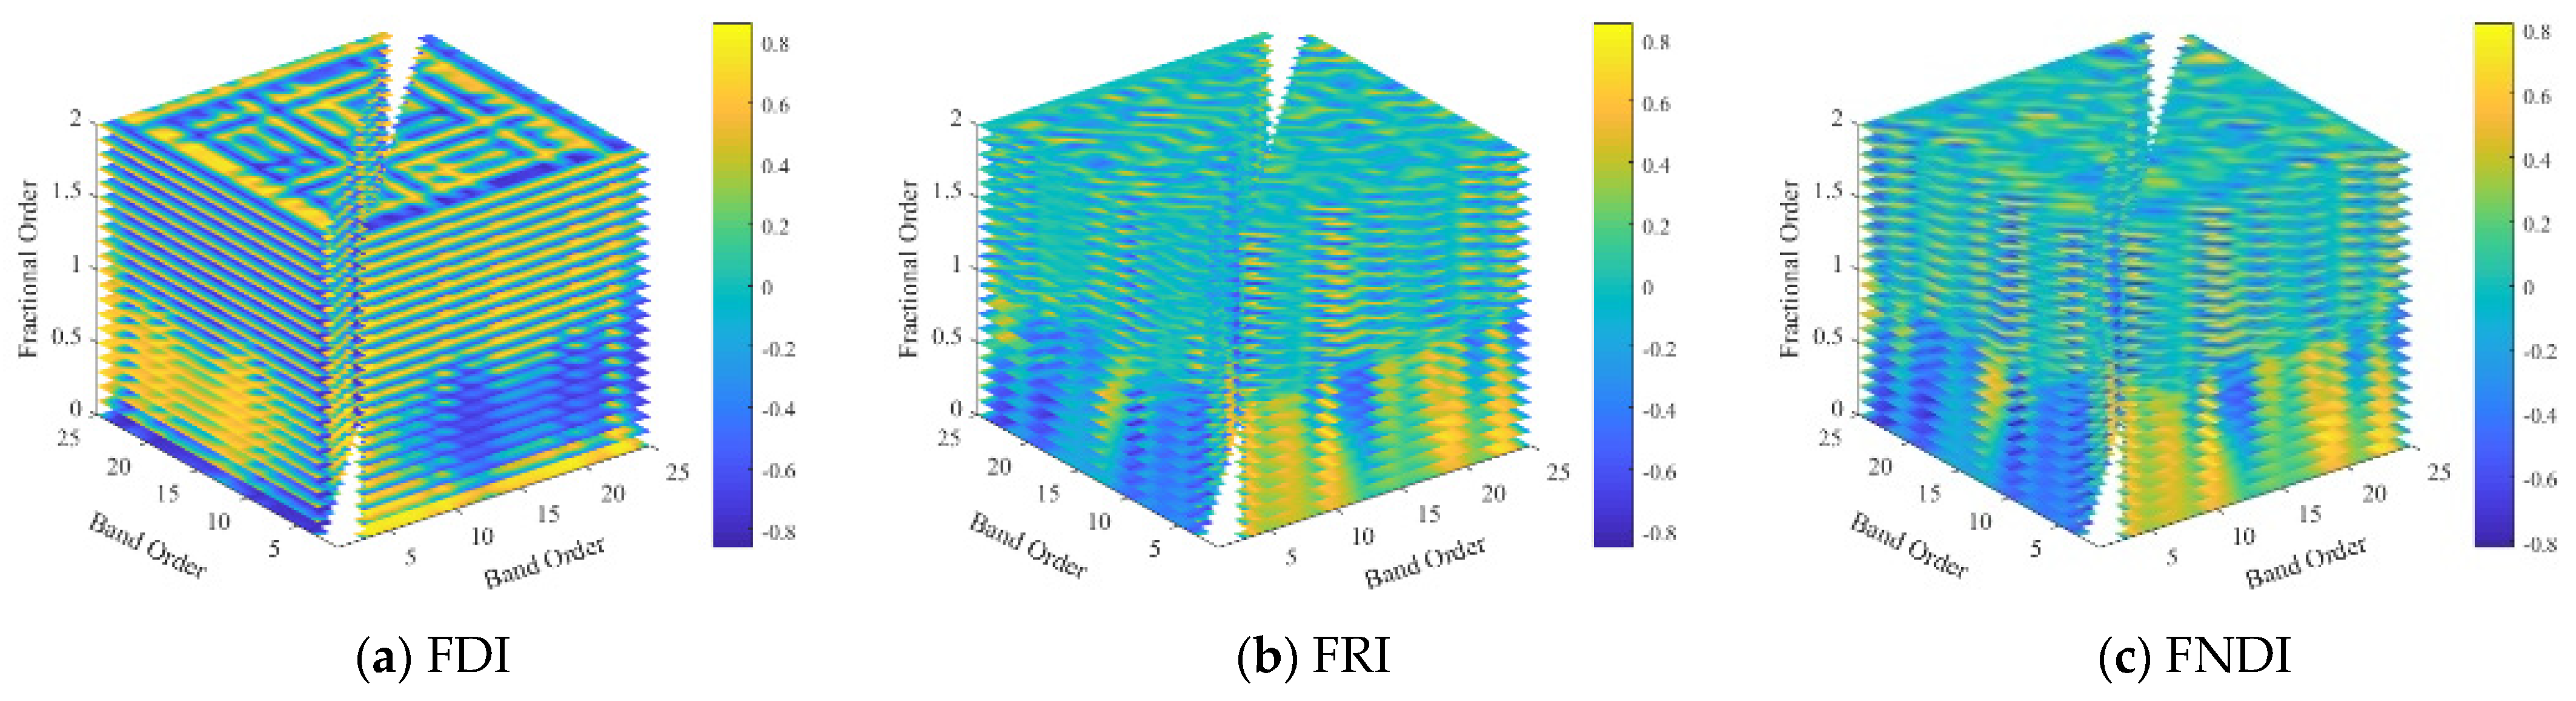
2.4.2. FOD Spectral Index Construction

In order to estimate chlorophyll content in grasslands, this study aimed to construct three two-band FOD spectral indices. These indices are called the fractional-order derivative difference index (FDI), fractional-order derivative ratio index (FRI), and fractional-order derivative normalized difference Index (FNDI). The grass canopy reflectance data underwent FOD processing. The specific formulas for each index are given in Equations (5)–(7). By calculating the coefficient of determination (R2) for FDI, FRI, and FNDI using different combinations of reflectance values from the 25 bands of the UAV hyperspectral data, the study can identify the optimal combination of bands and spectral indices for predicting chlorophyll content in grass.
FDI = ρ λ 1 α ρ λ 2 α
FRI = ρ λ 1 α ρ λ 2 α
FNDI = ρ λ 1 α ρ λ 2 α ρ λ 1 α + ρ λ 2 α
where ρ is the spectral reflectance, α is the fractional order, and λ1 and λ2 represent the band positions.

2.4.3. Chlorophyll Inversion Model Construction and Accuracy Verification

In this paper, the feature construction process utilizes the 10-fold cross-validation method for sample partitioning. Two different models, namely partial least squares regression (PLSR) and support vector machine regression (SVR), are employed for modeling. The regression function package in PyCharm is used to implement the modeling. Furthermore, different modeling methods are chosen for different spectral variables in order to evaluate the accuracy of these methods for estimating chlorophyll content in grass. This approach allows for a comprehensive examination of the performance of various modeling techniques for this specific task.
The accuracy of the estimation model is assessed using three commonly used measures: coefficients of determination (R2), root mean square error (RMSE), and relative predictive deviation (RPD). The calculation methods for each of these measures are expressed in Equations (8)–(10). These equations are used to quantify the performance and reliability of the estimation model in predicting chlorophyll content in grass.
R 2 = i = 1 n X i X ¯ 2 ( Y i Y ¯ ) 2 i = 1 n X i X ¯ 2 i = 1 n Y i Y ¯ 2
RMSE = i = 1 n X i Y i 2 n
RPD = SD RMSE
In the provided equations, n represents the total number of samples. Xi and Yi represent the predicted and measured chlorophyll content values, respectively. X ¯ and Y ¯ represent the mean values of the predicted and measured chlorophyll content. SD represents the standard error of the predicted values. The R2 measures the proportion of the variability in the measured chlorophyll content that can be explained by the predicted values. Higher values of R2 that are closer to 1 indicate a better prediction effect. RMSE measures the average magnitude of the differences between the predicted and measured chlorophyll content values. Lower values of RMSE that are closer to 0 indicate a better prediction effect. RPD is a relative evaluation index. RPD values less than 1.4 indicate poor and unusable model performance. RPD values between 1.4 and 2.0 indicate a more reliable model. RPD values greater than or equal to 2.0 indicate reliable performance with a better prediction ability.
In this paper, the raw hyperspectral data are subjected to FOD processing using orders ranging from 0 to 2 with an interval of 0.1. The sample chlorophyll values are obtained through upward extrapolation of green vegetation coverage. To ensure consistent feature dimensions for comparing the effects of FOD spectral processing on modeling results, full-band modeling is performed using different fractional-order data. For each order of FOD spectra, the FDI, FRI, and FNDI are constructed. The study then filters the order and band combinations to identify the optimal indices. The inverse modeling algorithm is programmed and implemented using PyCharm 2017 and Matlab 2016 in this paper. These tools are used to facilitate the implementation and evaluation of the inverse modeling process.
To compare the modeling effects, the experiment in this paper is divided into three groups:
(a)
Full-band models with different fractional-order values ranging from 0 to 2. This group focuses on evaluating the modeling performance using the entire spectral range with varying fractional-order values.
(b)
Two-band index models using the FDI, FRI, and FNDI constructed from fractional-order spectra ranging from 0 to 2. This group investigates the effectiveness of these specific spectral indices in estimating chlorophyll content.
(c)
Combination models that include both the fractional-order full-band data and the optimal combinations of FDI, FRI, and FNDI indices. This group aims to assess the potential improvement in modeling accuracy by incorporating FOD and selected spectral indices together.
By examining these three groups, the paper aims to compare the modeling effects and determine which approach or combination yields the best performance in estimating chlorophyll content in grass.

3. Results

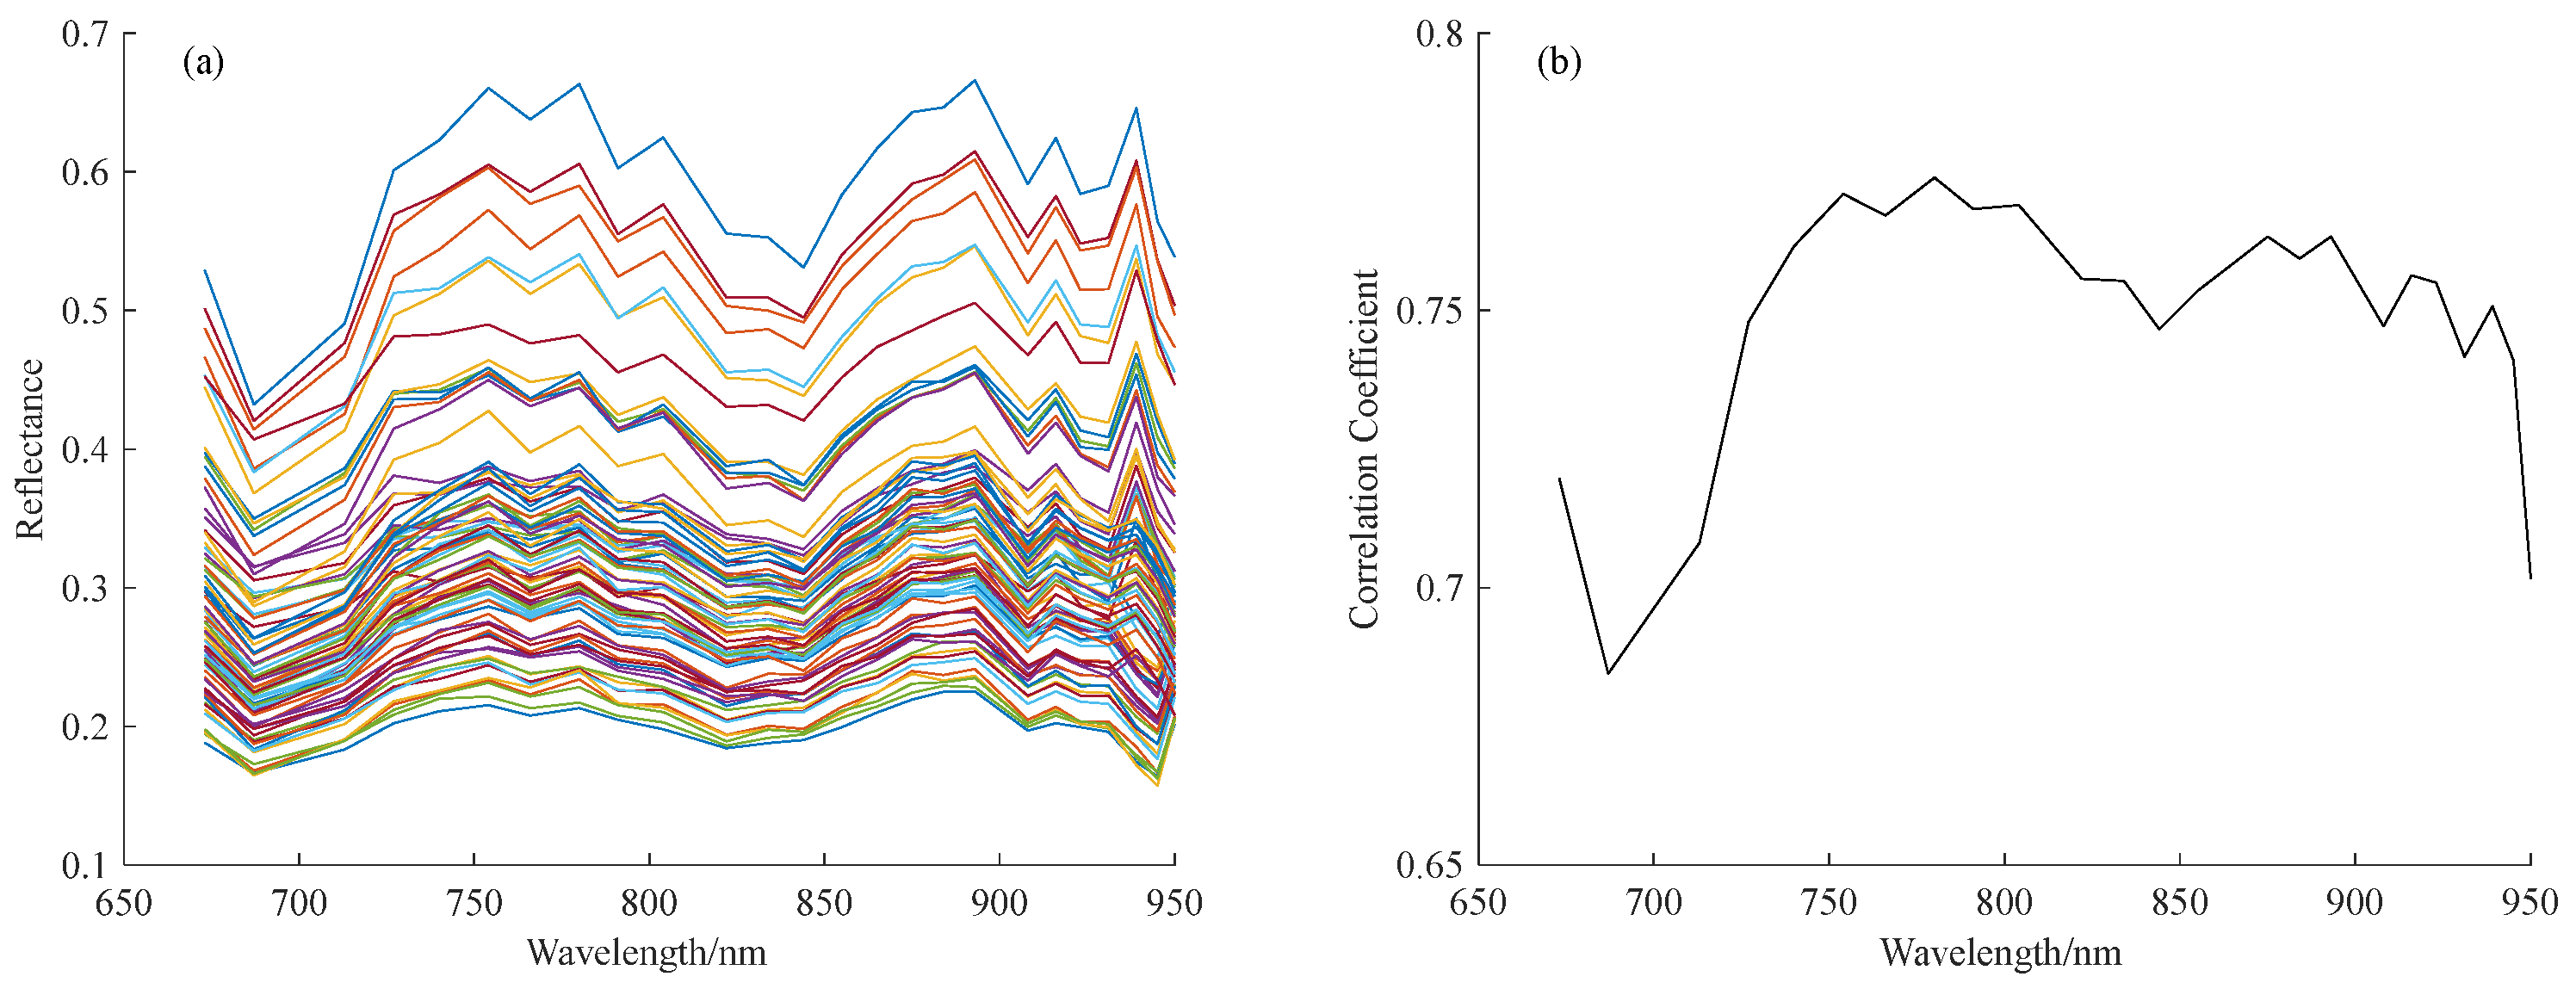
3.1. Grassland Canopy Spectral Curves and Their Correlation with Chlorophyll

After processing the UAV hyperspectral images based on the sampling criteria, we derived spectral reflectance values for each sample. These spectral reflectance curves are graphically represented in Figure 3a. These curves reveal noticeable distinctions, with reflectance values spanning from 0.2 to 0.6~0.7. Notwithstanding these disparities, the spectral profiles of grass canopies within each square exhibit consistent patterns, marked by corresponding peaks and troughs. The heightened spectral reflectance within the red and near-infrared spectral bands aligns with the characteristic features of green vegetation spectral signatures. The substantial variations in spectral reflectance across the samples underscore the potential utility of UAV hyperspectral imagery in estimating the chlorophyll content in grassland environments. To delve deeper into this phenomenon, we conducted a Pearson correlation analysis between the hyperspectral data acquired from the 25 spectral bands and the chlorophyll content at the canopy level of the grass. The results, as illustrated in Figure 3b, manifest a robust correlation between the reflectance values derived from the UAV hyperspectral image samples and the chlorophyll content of the grass, spanning from 0.68 to 0.78. The most significant correlation is observed within the 8th spectral band at a wavelength of 779.6 nanometers. These findings underscore the promising capability of UAV hyperspectral imagery for precise estimation of chlorophyll content in grasslands, with particular emphasis on the 8th spectral band, which exhibits the highest correlation.

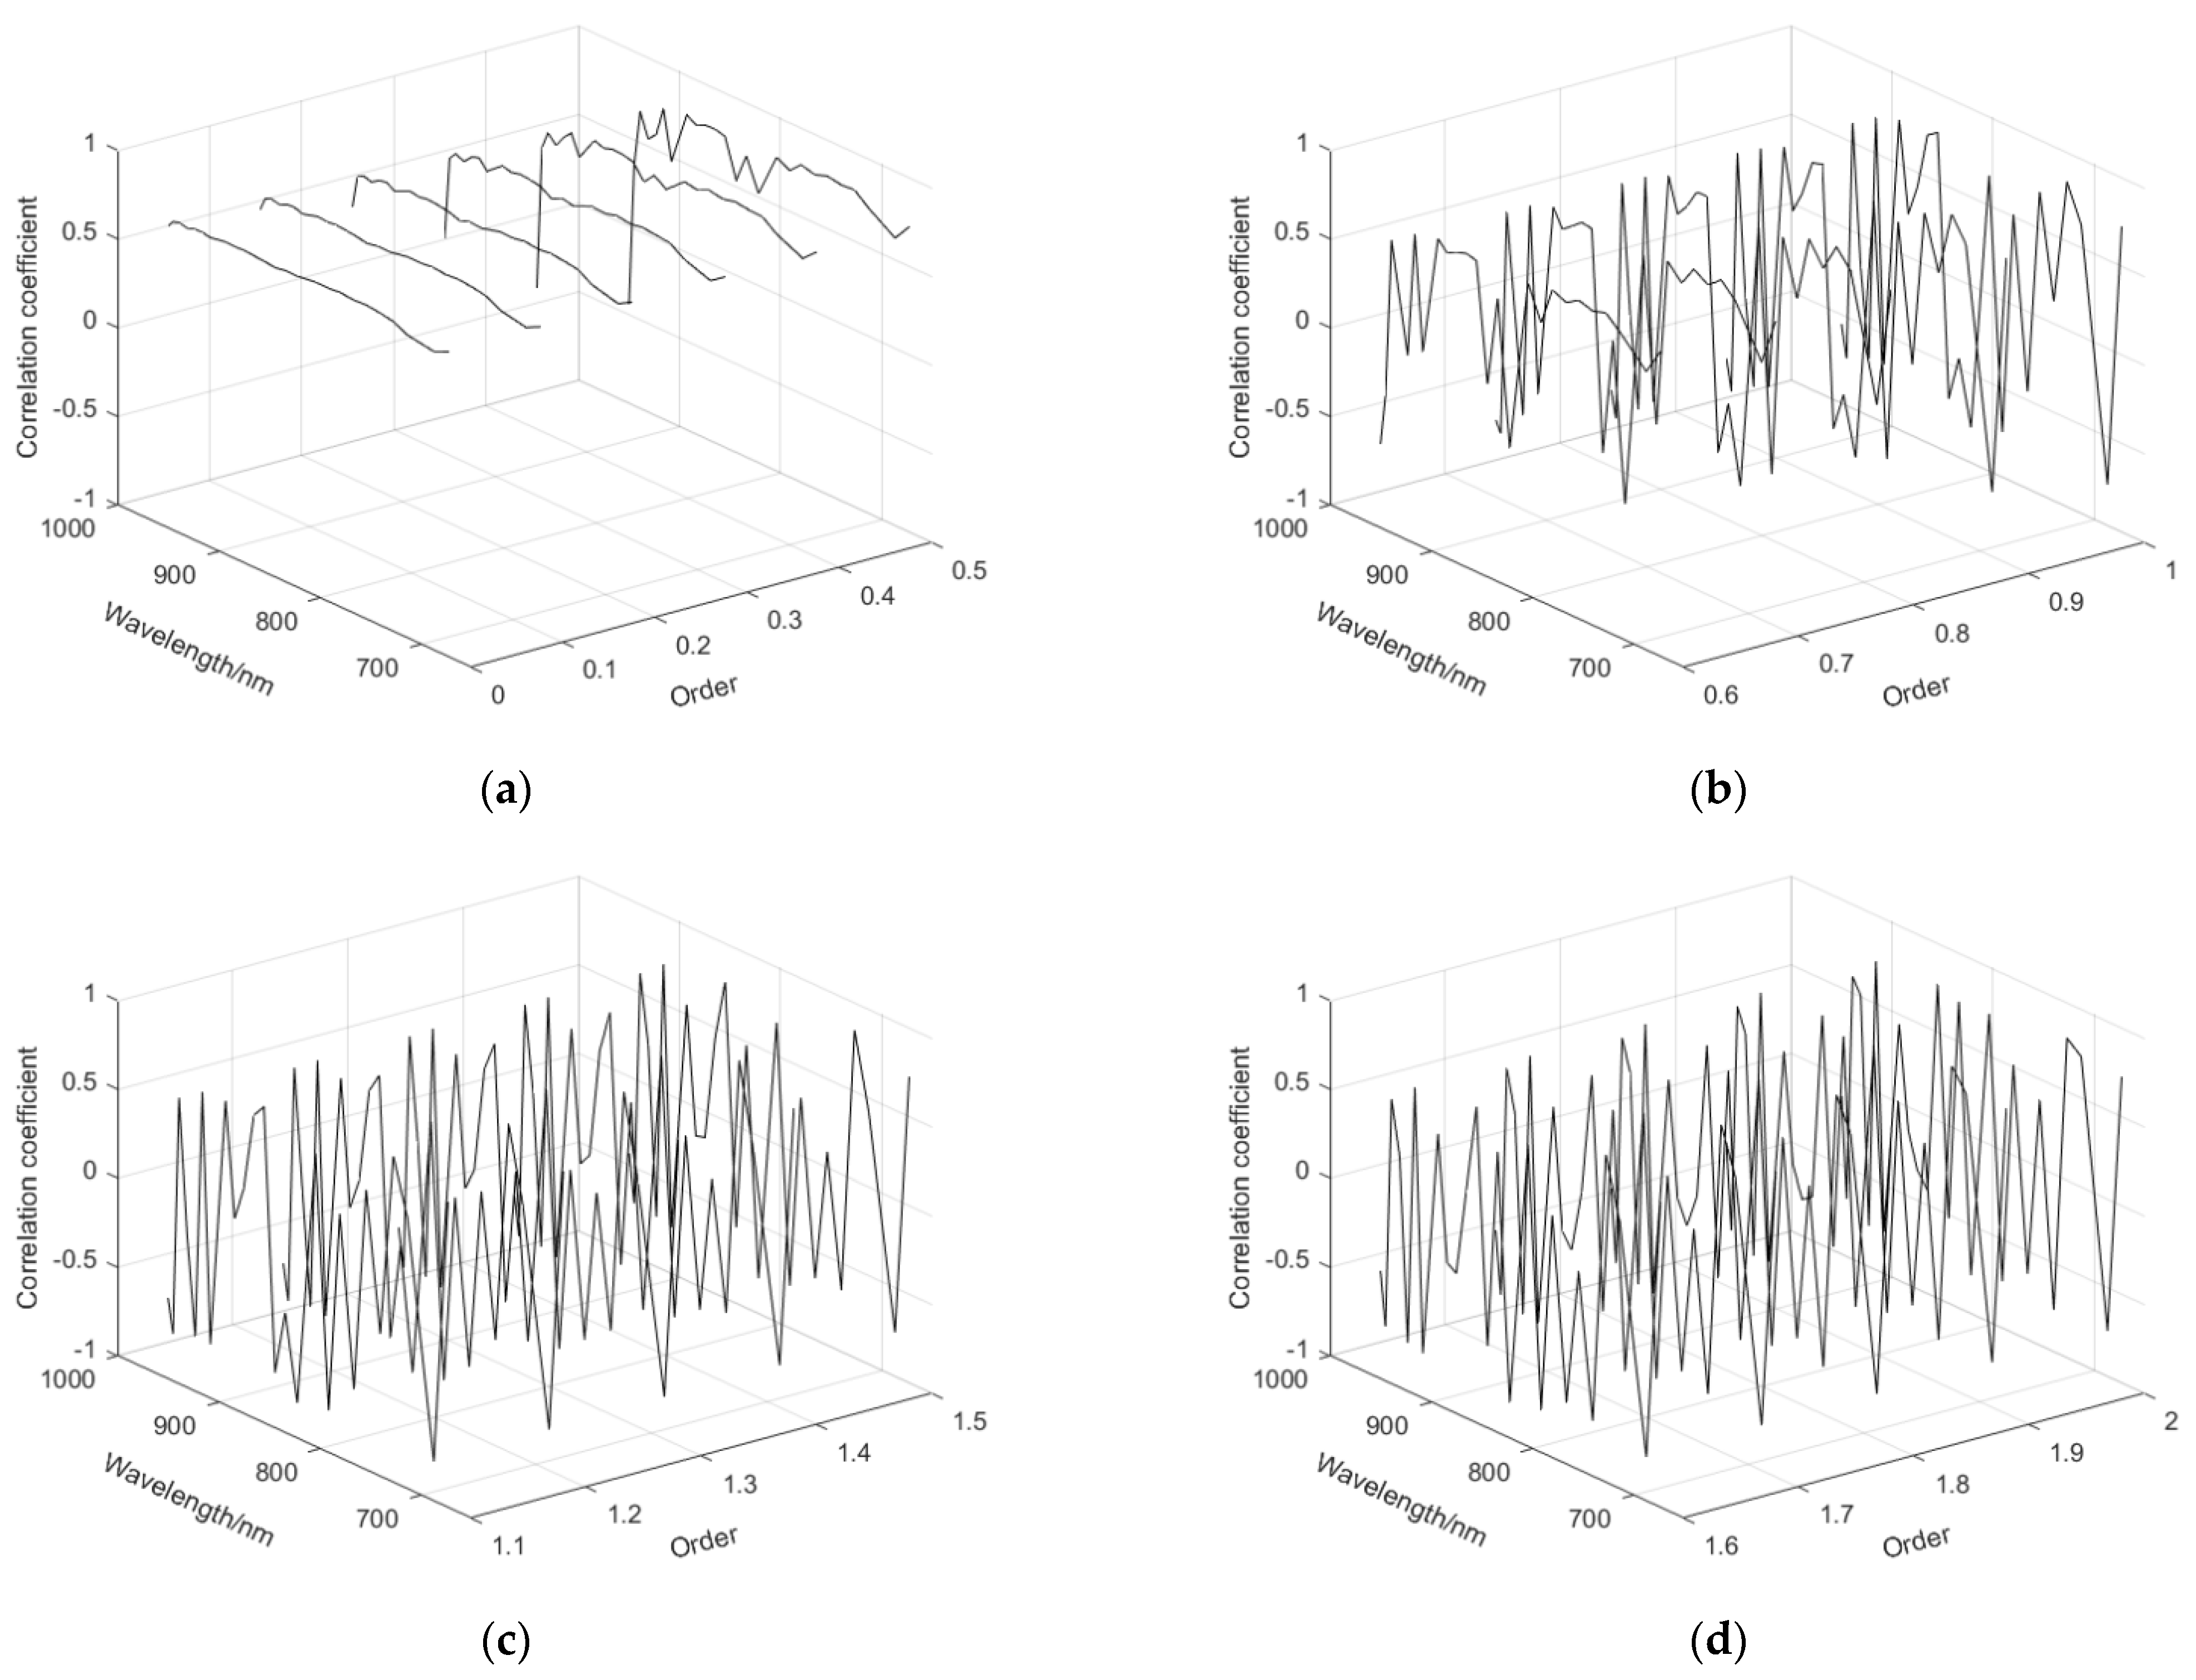
3.2. FOD Spectroscopy and Chlorophyll Correlation Analysis

In this study, the spectral data from the 25 bands of the UAV hyperspectral images for 79 samples were processed using FOD ranging from 0 to 2 with an interval of 0.1. Subsequently, a Pearson correlation analysis was conducted to explore the relationship between the FOD spectra and the grass chlorophyll content. The correlation curves for different orders are depicted in Figure 4. Specifically, Figure 4a illustrates the correlation curve for orders ranging from 0 to 0.5. Figure 4b displays the correlation curve for orders between 0.6 and 1. Figure 4c presents the correlation curve for orders from 1.1 to 1.5, and Figure 4d shows the correlation curve for orders from 1.6 to 2. Observing Figure 4, it is evident that the original reflectance spectra (order 0) demonstrated a significant positive correlation with the grass chlorophyll content. As the order increased from 0.1 to 0.5, small peaks and valleys gradually appeared in the correlation curves, with most of them showing positive correlation, except for the first band, which displayed a negative correlation. From an order of 0.6, the correlation curves underwent substantial changes, with negative correlations becoming more pronounced. Additionally, the correlation values increased, and higher transformation orders led to sharper fluctuations in the correlation curves. Furthermore, the gaps between adjacent bands in the correlation curves became larger as the order increased.
These findings indicate that FOD introduce distinctive features in the correlation analysis, showing potential in enhancing the relationship between spectral information and grass chlorophyll content. The variations in correlation patterns with different orders provide valuable insights for selecting an appropriate fractional order in estimating grassland chlorophyll content using UAV hyperspectral data.
Based on the analysis of different FOD spectra and grass chlorophyll content, the bands with the highest correlation values in each fractional-order spectrum were extracted and summarized in Table 2. The maximum correlation values were found to be 0.774, 0.833, and 0.799 for the original spectrum, 1-order derivative, and 2-order derivative, respectively. Notably, the highest correlation values of 0.844 were achieved for the 1.4 and 1.5 orders after fractional-order transformation. These correlation values surpassed those obtained from the original spectra with integer-order transformation, indicating the effectiveness of fractional-order transformation in enhancing the correlation between the spectral data and grass chlorophyll content. The results suggest that FODs offer valuable insights for improving the estimation accuracy of grassland chlorophyll content using UAV hyperspectral data.

3.3. Reflectance Spectral Index Preference

To determine the suitable fractional order for remote sensing monitoring of grassland chlorophyll content and its corresponding wavebands, three two-band FOD spectral indices (FDI, FRI, and FNDI) were constructed. The correlation between these spectral indices and grassland chlorophyll content at fractional orders ranging from 0 to 2 was analyzed, as shown in Figure 5. From Figure 5, it can be observed that for fractional orders ranging from 0.1 to 1, the combination of two bands within the B10 to B23 range is the sensitive region for the FDI index in monitoring grassland chlorophyll content. The sensitive regions for FRI and FNDI are smaller compared to FDI, and they exhibit similar distribution areas and changes in dispersion. As the order increases, the sensitive regions for all three FOD spectral indices gradually decrease and become more dispersed. FRI and FNDI show more pronounced changes than FDI. Moreover, when the order surpasses 0.8, the sensitive band regions for all three indices become even more dispersed.
To determine the optimal fractional order and corresponding bands for the three FOD spectral indices (FDI, FRI, and FNDI), the study extracted the band combinations that exhibited the highest correlation coefficients with grass chlorophyll content across fractional orders ranging from 0.1 to 2, as presented in Table 3. The maximum correlation coefficients for FDI, FRI, and FNDI with grass chlorophyll content under fractional orders ranging from 0.1 to 2 were 0.861, −0.858, and −0.821, respectively.
Based on the analysis presented in Table 3, it is evident that the FOD spectral index FDI demonstrates better correlation with grass chlorophyll content compared to the original spectral index, within the following range of orders: 0.2 to 0.6, 0.8 to 1.2, and 1.5. The optimal order for FDI is 1, with the corresponding band combination of B22 and B4, which outperforms the original spectral index. For the spectral index FRI, the FOD indices at orders 0.6 and 1.1 to 1.6 exhibit improved correlation with grass chlorophyll content compared to the original spectrum. Although the optimal order for FRI is not explicitly mentioned, the corresponding band combinations are B19 and B4. Regarding the FNDI index, the FOD index at orders 0.6 and 1.1 to 1.5 outperforms the original spectrum in terms of correlation with grass chlorophyll content. The optimal order for FNDI is determined to be 0.6, with the corresponding band combinations being B10 and B2. The FNDI constructed using order 0.6 is found to be more sensitive to grass chlorophyll content. In summary, the band combinations with the maximum correlation coefficients for the FDI, FRI, and FNDI indices are B22 and B4, B19 and B4, and B10 and B2, respectively. Based on the above analysis, the study constructs three two-band FOD spectral indices for remote sensing detection of grass chlorophyll content, expressed as Equations (11)–(13), respectively (specific equations not provided in the given information).
F D I = ρ B 22 1 ρ B 4 1
F R I = ρ B 19 1.3 ρ B 4 1.3
F N D I = ρ B 10 0.6 ρ B 2 0.6 ρ B 10 0.6 + ρ B 2 0.6
Here, the superscript ρ indicates the order of the FOD spectrum, and the subscript indicates the corresponding band order.

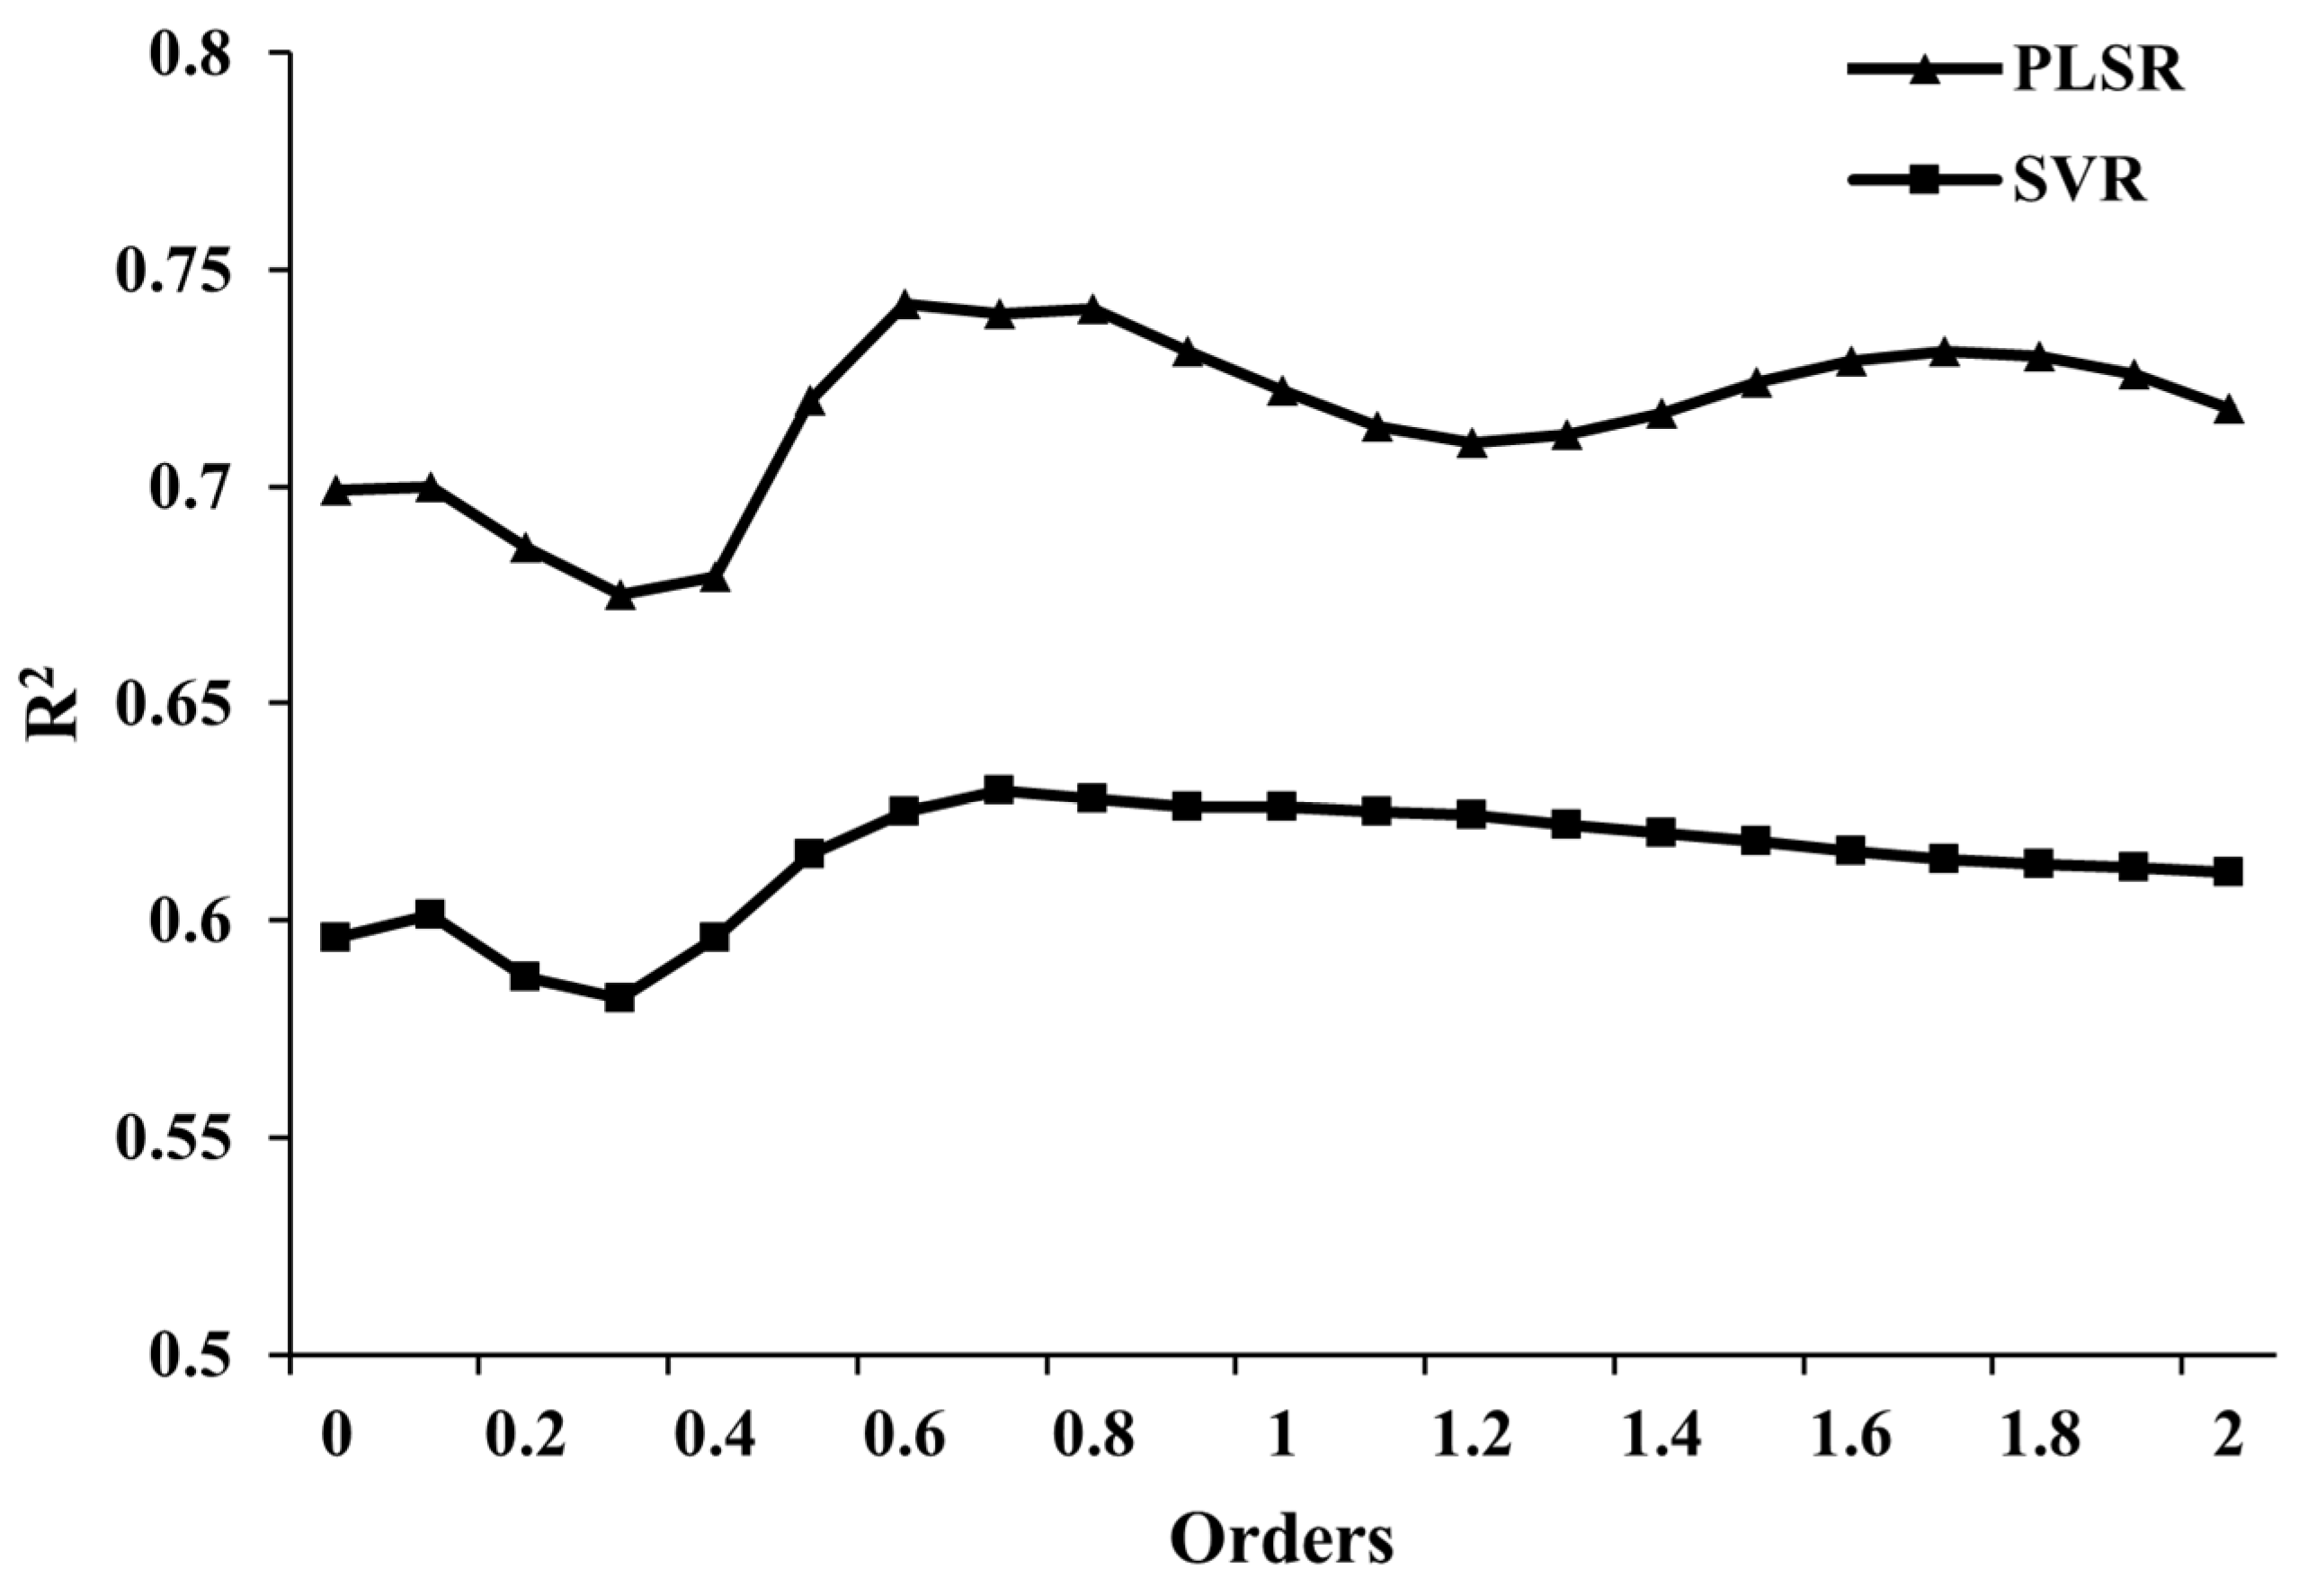
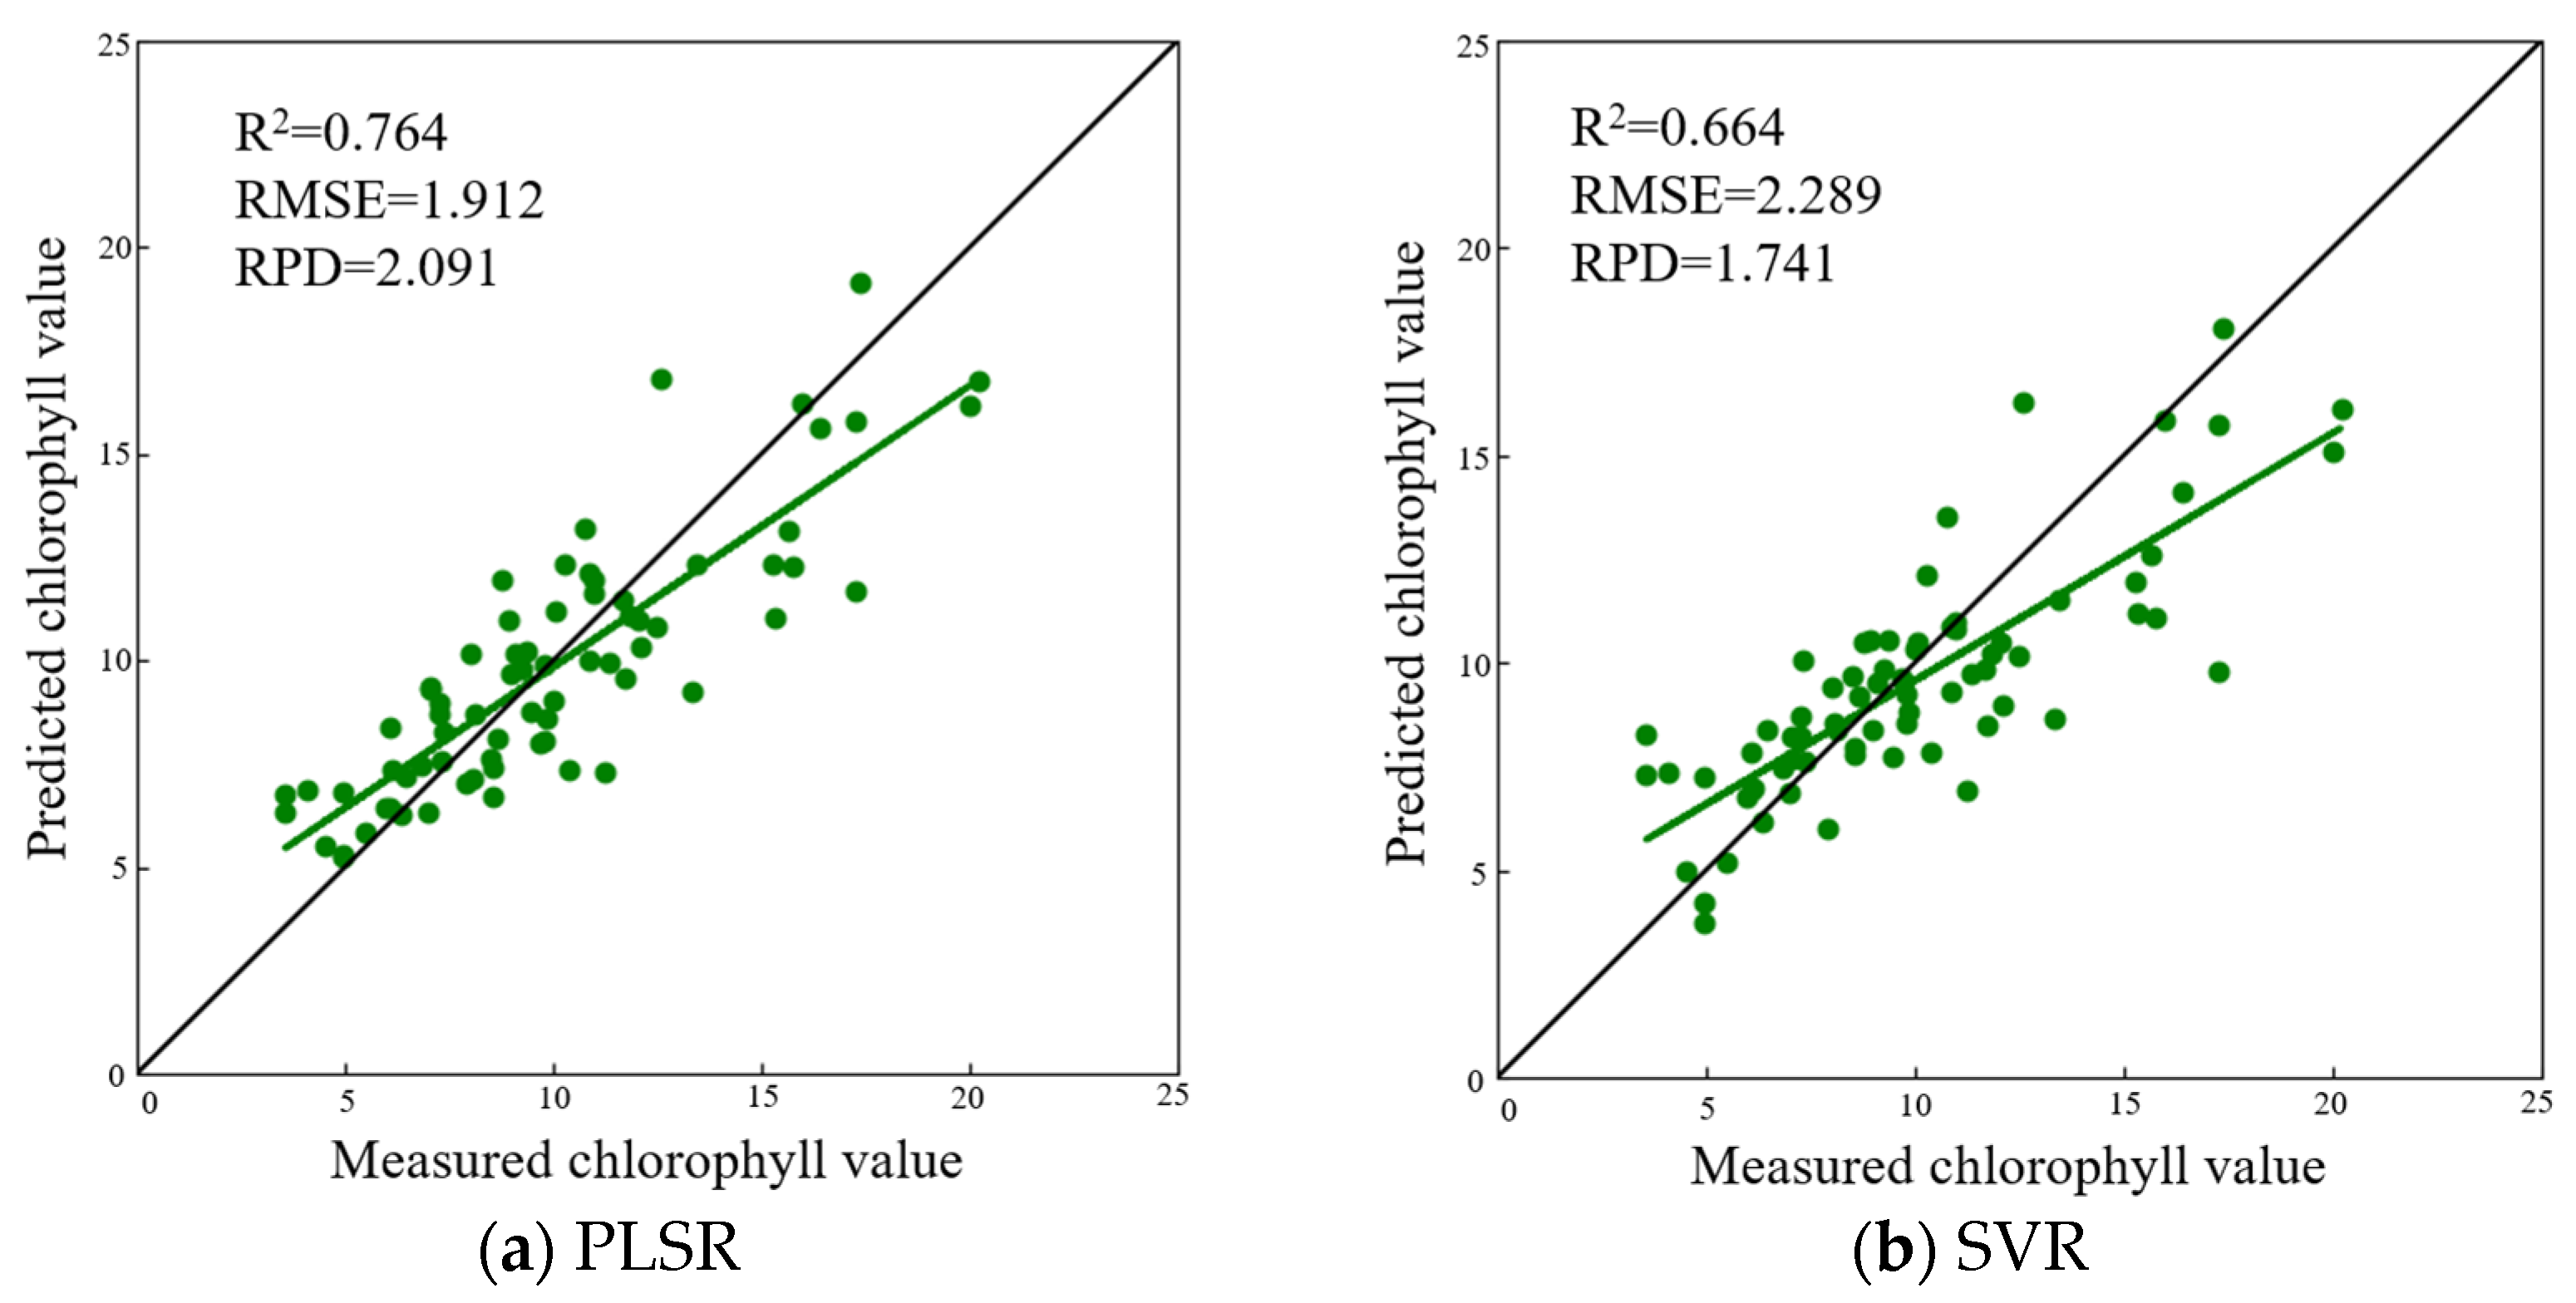
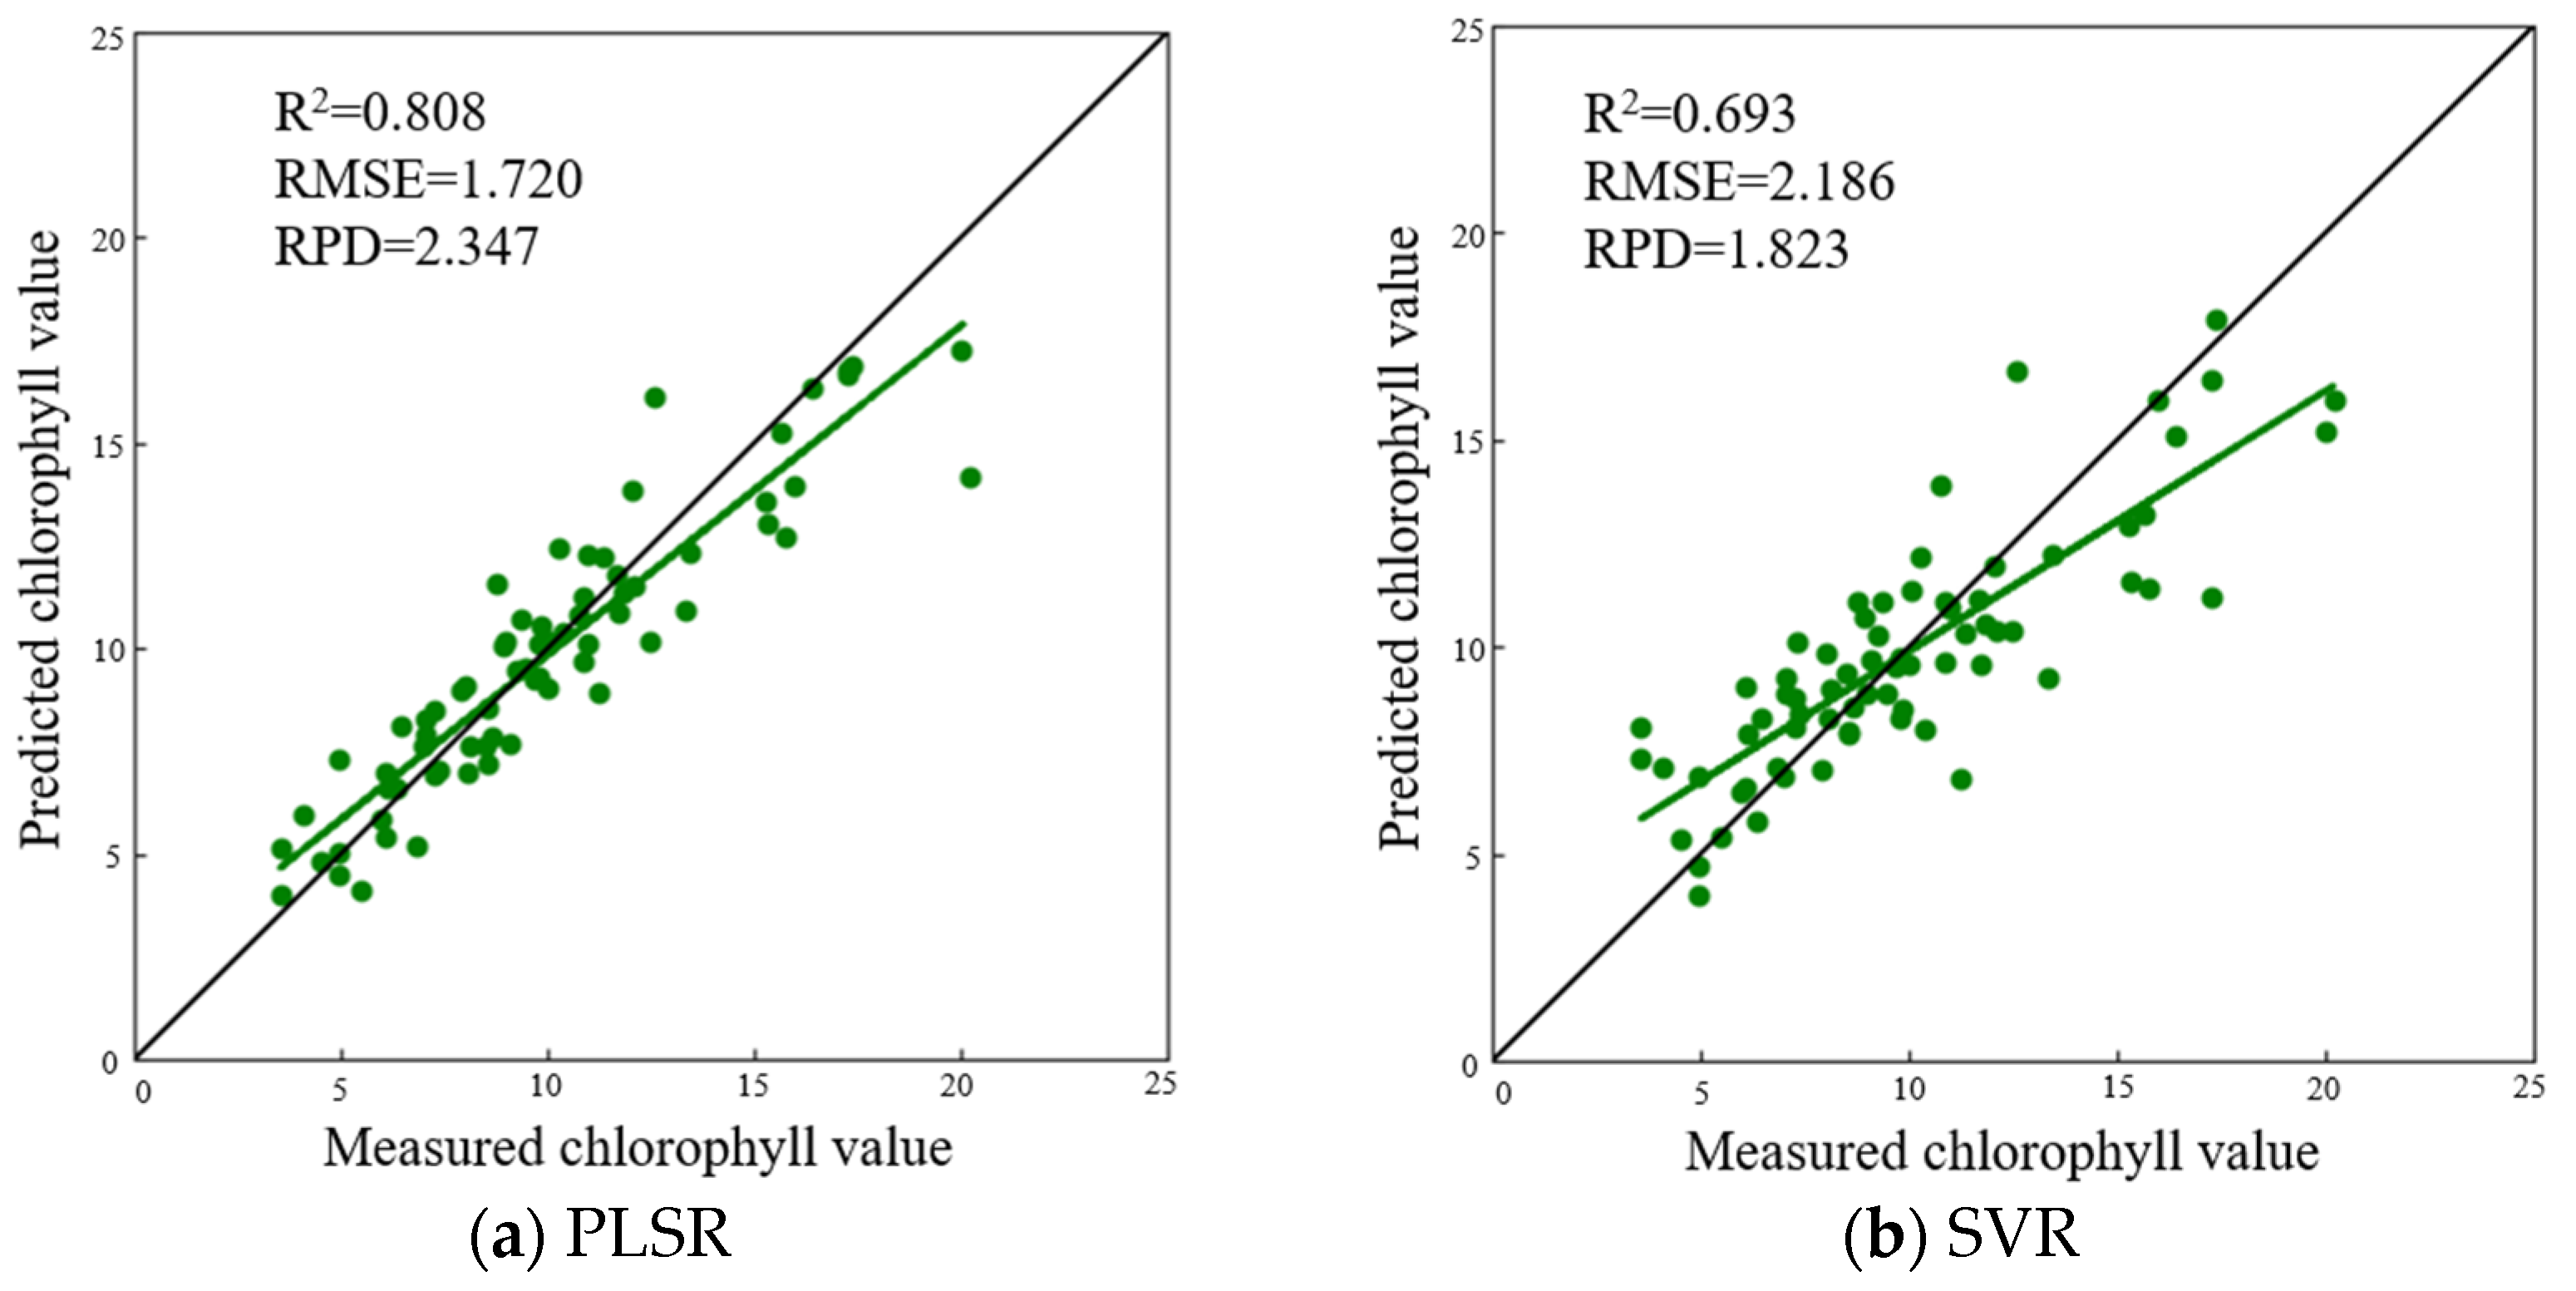
3.4. Chlorophyll Inversion Model Construction and Evaluation

To leverage UAV hyperspectral data and extract relevant FOD spectral information for estimating grass chlorophyll content, this study constructs chlorophyll estimation models using two regression techniques: PLSR and SVR. The models are trained and evaluated using a combination of stratified sampling and 10-fold cross-validation for sample partitioning.
Three types of spectral inputs are considered in the models:
1.
FOD full-band spectra.
2.
Preferential FOD spectral indices.
3.
Spectral indices derived from the full-band spectra.
By incorporating these different spectral inputs, the models aim to capture a wide range of spectral information for accurate chlorophyll estimation. The partitioning approach ensures robust evaluation and prevents overfitting. The specifics of the PLSR and SVR models, including their formulation and parameters, are not provided in the available information.

3.4.1. Full-Band FOD Spectra Model Construction

Experiments were conducted to verify the effectiveness of FOD spectral transformations in constructing grass chlorophyll content estimation models. Two regression methods based on PLSR and SVR were employed using both the original spectral reflectance and the spectral features after FOD transformations ranging from 0 to 2. Table 4 presents the specific estimation results of the different models. PLSR demonstrates higher overall prediction accuracy compared to SVR, as indicated by the higher R2 and smaller RMSE values. PLSR also exhibits better model stability compared to SVR. Figure 6 illustrates the impact of FOD transformations on R2 for both PLSR and SVR. The R2 values show a similar pattern for both modeling methods, initially increasing, then decreasing, and subsequently increasing again up to order 0.6. Beyond order 0.7, the R2 values in PLSR display a decreasing-then-increasing trend, while SVR shows a relatively stable trend with a slight decrease. The maximum value of R2 is achieved at order 0.6 for PLSR, surpassing the R2 for the original spectral reflectance by approximately 0.04. In contrast, SVR achieves the maximum R2 at order 0.7, surpassing the R2 for the original spectral reflectance by about 0.03.
Consequently, FOD transformations can significantly enhance the accuracy of the models in estimating grass chlorophyll content. The optimal combination is determined to be a fractional order of 0.6 when using PLSR. This finding underscores the effectiveness of using FOD to improve the estimation accuracy of grassland chlorophyll content, particularly when combined with the PLSR regression method.

3.4.2. Chlorophyll Inversion Model Based on Two-Band FOD Spectral Indices

To assess the effectiveness of three selected vegetation indices in constructing chlorophyll inversion models, both PLSR and SVR models were developed using these indices. In the PLSR model, a total of 25 principal components were selected. For the SVR model, the combination obtained through grid search was ′C′: 1000, ′gamma′: 0.001, and ′kernel′: linear. Scatter fit plots of predicted versus true values for the corresponding PLSR and SVR models were created, as shown in Figure 7. From Figure 7, it is evident that the PLSR model outperforms the SVR model. The scatter distribution of the predicted chlorophyll values and measured values in PLSR is closer to the 1:1 line, indicating higher accuracy and model stability. The R2 value is also improved by 0.06 compared to the original spectral model. Additionally, the PLSR model demonstrates superior performance compared to the arbitrary order full-band model. Comparing the performance with the original full-band spectral model, the PLSR model enhances R2 by approximately 0.07, thus outperforming the arbitrary order full-band model as well. These findings validate the effectiveness of the selected vegetation indices in improving the accuracy and stability of chlorophyll content prediction models for grass. The scatter fit plots provide visual evidence of the improved performance of the PLSR model in accurately estimating grassland chlorophyll content, reinforcing the utility of FOD spectral transformations and the selected vegetation indices in remote sensing applications.

3.4.3. Chlorophyll Model Combining Spectral and Constructive Indices

The study combined the FDI, FRI, and FNDI with the optimal order spectra obtained from the fractional-order full-band model. According to Table 4, the optimal order for the PLSR fractional-order full-band model is 0.6, while it is 0.7 for the SVR fractional-order full-band model. In this research, the exponential features and 0.6 order full-band spectral features were used as inputs for PLSR, while the exponential features and 0.7 order full-band spectral features were used for SVR. In the PLSR model, a total of 25 principal components were selected. For the SVR model, the combination obtained through grid search was ‘C’: 1.0, ‘gamma’: scale, and ‘kernel’: rbf. A scatter plot, represented in Figure 8, displays the measured values on the horizontal axis, corresponding estimated values on the vertical axis, the 1:1 line in black, and the fitted trend line in solid green. Observing Figure 8, it becomes evident that the PLSR estimation results outperform the SVR model. The chlorophyll estimation accuracy, indicated by R2, is 0.1 higher in the PLSR model; however, the RPD is 0.5 lower in comparison.
According to the results obtained from the validation set, the best model for estimating the chlorophyll content of grass is the PLSR model. The input variables for this model include the FDI = ρ B 22 1 ρ B 4 1 , F R I = ρ B 19 1.3 ρ B 4 1.3 , FNDI = ρ B 10 0.6 ρ B 2 0.6 ρ B 10 0.6 + ρ B 2 0.6 vegetation indices, calculated using the specified formulas, along with the 0.6 order full-band spectra. This model demonstrates superior performance based on the R2, RMSE, and RPD indicators. To visualize the spatial distribution of chlorophyll content in the study areas, the best inversion model, which is the PLSR model, was applied to the entire hyperspectral image. Figure 9 shows the resulting spatial distribution, which aligns with the observed growth distribution of grass. The chlorophyll content appears to be more uniform in T5 and T7 sampling areas, while T6 sampling area exhibits more variability. The mean chlorophyll values in T5, T6, and T7 are 7.13, 13.36, and 10.19, respectively. The minimum values are 3.53, 6.05, and 6.11, while the maximum values are 11.25, 21.87, and 15.75. These values correspond to the green vegetation coverage described in the previous section.

4. Discussion

4.1. Contribution of FOD to Chlorophyll Estimation

This paper highlights the potential of FOD processing of spectral data in remote sensing for estimating chlorophyll content in grasslands. By analyzing the fractional orders ranging from 0 to 2 with an interval of 0.1, the method effectively reduces band redundancy and captures weak but chlorophyll-sensitive spectral information. The results demonstrate that differential processing improves the sensitivity of hyperspectral data, with a 7.6% increase in correlation for the 1-order derivative and a 3.2% increase for the 2-order derivative compared to the original reflectance data. Moreover, the maximum correlation coefficients of FOD spectra exhibit a peak at orders 1.4 and 1.5, surpassing the maximum correlation coefficients of lower-order derivatives and the original reflectance data by 1.3% and 5.6%, respectively. This indicates a 9.0% improvement over the original reflectance data. The wavelengths associated with the maximum correlation coefficients shift towards longer wavelengths as the order increases, with 779.6 nm, 754.2 nm, and 727.4 nm being the optimal wavelengths for 0–0.2, 0.3–0.6, and 0.7–2 orders, respectively.

4.2. Selected Spectral Indices

The study explores the feasibility of combining FOD spectra with vegetation indices. It acknowledges the existing successful use of spectral indices for inversion and aims to enhance correlations with chlorophyll using fractional-order derivative spectra. The constructed FDI, FRI, and FNDI vegetation indices exhibit improved correlations compared to integer-order derivative indices, indicating their practical value. From Table 3, it is evident that among the three constructed two-band FOD spectral indices (FDI, FRI, and FNDI), FDI shows better correlation with grass chlorophyll content. This is attributed to the interspersed presence of grass and bare soil in the sampling area, where FDI proves more sensitive to soil background changes compared to FRI and FNDI. This aligns with the current direction in chlorophyll estimation index construction [22].

4.3. Modeling Results

In this paper, PLSR and SVR models were constructed using different fractional-order full-band indices, optimal two-band indices (FDI, FRI, and FNDI), and a combination of full-band and vegetation indices ranging from 0 to 2. The PLSR model outperformed the SVR model in the two-band spectral index modeling, improving the R2 of the original spectral model by 0.07 and outperforming the arbitrary-order full-band model. The SVR index model improved the R2 of the original full-band spectrum by approximately 0.04 and also outperformed the arbitrary-order full-band model. The combined modeling results of full-band and vegetation index features were presented in Figure 8 and demonstrated superior performance compared to models based solely on full-band spectral features or index features alone. Additionally, the PLSR model was found to outperform the SVR model. Hence, the optimal model for chlorophyll estimation in this study was determined to be the PLSR model combined with exponential features and a 0.6-order full band. This model achieved an accuracy level of R2 = 0.808 and RPD of 2.347. Compared to other studies, this model demonstrated improved performance. It outperformed the model by Darvishzadeh et al. [10] (R2 = 0.7) for canopy chlorophyll content determination at a 30 m × 30 m scale using NDVI and SAVI2 indices. It also surpassed the model by Han Xiao et al. (R2 = 0.703) for estimating grassland in Sichuan, China using the grassland chlorophyll content index (GCI). Overall, the model proposed in this paper is reliable and showcases good predictive ability.

4.4. Limitations and Future Research

In this paper, the authors obtained the optimal fractional order and indices for chlorophyll inversion based on UAV hyperspectral images through modeling and analysis. However, there are certain limitations and areas for further research. One limitation is that the UAV hyperspectral images used in the study had fewer bands (25 bands), which restricted the exploration of specific sensitive bands for chlorophyll after FOD processing. The relationship between these sensitive bands was not thoroughly investigated. This could be explored in subsequent studies using hyperspectral data with a larger number of bands. Another limitation is related to the method used for determining the optimal fractional order of the spectral index and its corresponding wavelength based on the maximum correlation index. This determination is influenced by factors such as the number and quality of samples, which may introduce limitations to the conclusions drawn. The proposed method of combining full-band spectral features with index features can be further tested and validated in subsequent studies by collecting data from grasses in different growing seasons or considering other covariates of grasses. This will help assess the generalizability and applicability of the approach. Overall, while the paper provides valuable insights into chlorophyll inversion using FOD processing of UAV hyperspectral images, there are opportunities for future research to address the limitations mentioned and further enhance the understanding and applicability of the proposed methodology.

5. Conclusions

In this study, UAV hyperspectral images were utilized to estimate the chlorophyll content of natural grasslands in the Inner Mongolia grassland transect. To address the spatial scale mismatch between leaf-scale measurements and UAV hyperspectral data, a green vegetation coverage-based approach was employed to upscale leaf-scale chlorophyll to the canopy level, reducing the impact of soil and hay and establishing a strong correlation with the hyperspectral data.
FOD processing was applied to the high-resolution hyperspectral images to identify hyperspectral information sensitive to grass chlorophyll content. Three two-band FOD spectral indexes, namely FDI (B22, B4), FRI (B19, B4), and FNDI (B10, B2), exhibited the highest correlations. The modeling results indicated that regression models constructed using FOD-processed spectral variables outperformed models built with integer-order derivative, highlighting the effectiveness of FOD for hyperspectral information extraction.
PLSR and SVR models were developed to estimate grass chlorophyll content using the inverse models for each spectral variable. The PLSR models demonstrated higher accuracy compared to the SVR models. The optimal PLSR models, utilizing 0.6-order full-band spectra combined with FDI (B22, B4), FRI (B19, B4), and FNDI (B10, B2), achieved the best performance for chlorophyll estimation in grasslands, with an R2 of 0.808 and RMSE of 1.72.
These findings showcase the feasibility of FOD processing of UAV hyperspectral images for chlorophyll content estimation in grasslands. The approach can be extended to other vegetation types and explore additional biochemical covariates in future studies.

Author Contributions

Conceptualization, A.Z. and S.Y.; methodology, A.Z. and S.Y.; software, S.Y. and A.Z.; validation, S.Y., A.Z., J.W., N.H. and S.C.; formal analysis, A.Z., S.Y., H.P. and S.C.; investigation, A.Z., N.H. and H.P.; resources, A.Z.; data curation, A.Z.; writing—original draft preparation, S.Y. and A.Z.; writing—review and editing, A.Z., S.Y. and J.W.; visualization, S.Y. and A.Z.; supervision, A.Z.; project administration, A.Z.; funding acquisition, A.Z. All authors have read and agreed to the published version of the manuscript.

Funding

This research was funded by the Science and Technology Program of Qinghai Province of China (2022-NK-136), the National Natural Science Foundation of China (42071303, 41571369), and the Joint program of Beijing Municipal Education Commission and Beijing Municipal Natural Science Foundation of China (KZ202110028044).

Data Availability Statement

No new data were created or analyzed in this study.

Acknowledgments

We are very grateful to all the teachers and students who helped us in the field surveys.

Conflicts of Interest

The authors declare no conflict of interest. The funders had no role in the design of the study; in the collection, analyses, or interpretation of data; in the writing of the manuscript; or in the decision to publish the results.

Correction Statement

This article has been republished with a minor correction to the existing affiliation information. Affiliation 2: Capital ' Normal University should be Capital Normal University. This change does not affect the scientific content of the article.

References

  1. Clevers, J.G.P.W.; Gitelson, A.A. Remote estimation of crop and grass chlorophyll and nitrogen content using red-edge bands on Sentinel-2 and -3. Int. J. Appl. Earth Obs. Geoinf. 2013, 23, 344–351. [Google Scholar] [CrossRef]
  2. Gitelson, A.A. Remote estimation of canopy chlorophyll content in crops. Geophys. Res. Lett. 2005, 32, L08403. [Google Scholar] [CrossRef]
  3. Haboudane, D.; Tremblay, N.; Miller, J.R.; Vigneault, P. Remote estimation of crop chlorophyll content using spectral indices derived from hyperspectral data. IEEE Trans. Geosci. Remote Sens. 2008, 46, 423–437. [Google Scholar] [CrossRef]
  4. Kang, X.; Zhang, A. Hyperspectral remote sensing estimation of pasture crude protein content based on multi-granularity spectral feature. Trans. Chines 2019, 35, 161–169. [Google Scholar]
  5. Liu, H.; Zhao, Y.; Wen, Y.; Sun, H.; Li, M.; Zhang, Q. Diagnose of chlorophyll content in corn canopy leaves based on multispectral detector. J. Agromed. 2015, 46 (Suppl. S1), 228–233. [Google Scholar]
  6. Wen, Y.; Li, M.; Zhao, Y.; Liu, H.; Sun, H.; Chen, J. Multispectral reflectance inversion and chlorophyll content diagnose of maize at seeding stage. Trans. Chines 2015, 31, 193–199. [Google Scholar]
  7. Niu, L.; Sun, J.; Liu, Y.; Zhang, X. Research of estimation models of wheat chlorophyll content based on imaging hyperspectral data. J. Henan Agric. Sci. 2016, 45, 150–154. [Google Scholar]
  8. Zhang, J.; Xu, S.; Zhai, Q.; Zhang, Y.; Ma, X. Hyper-spectral Remote Sensing Response and Estimation Model of Leaf Chlorophy Content of Wheat under Different Soil Textures. J. Triticeae Crops 2014, 34, 642–647. [Google Scholar]
  9. Ma, W.; Wang, X. Progress on grassland chlorophyll content estimation by hyperspectral analysis. Prog. Geogr. 2016, 35, 25–34. [Google Scholar]
  10. Darvishzadeh, R.; Skidmore, A.; Schlerf, M.; Atzberger, C.; Corsi, F.; Cho, M. LAI and chlorophyll estimation for a heterogeneous grassland using hyperspectral measurements. ISPRS J. Photogramm. Remote Sens. 2008, 63, 409–426. [Google Scholar] [CrossRef]
  11. Rossini, M.; Cogliati, S.; Meroni, M.; Migliavacca, M.; Galvagno, M.; Busetto, L.; Cremonese, E.; Julitta, T.; Siniscalco, C.; Morra di Cella, U.; et al. Remote sensing-based estimation of gross primary production in a subalpine grassland. Biogeosciences 2012, 9, 2565–2584. [Google Scholar] [CrossRef]
  12. Wong, K.K.; He, Y. Estimating grassland chlorophyll content using remote sensing data at leaf, canopy, and landscape scales. Can. J. Remote Sens. 2014, 39, 155–166. [Google Scholar] [CrossRef]
  13. Reza Amiri, J.B.; Isaac, P. Narrowband spectral indices for the estimation of chlorophyl along a precipitation gradient. In Proceedings of the 2011 3rd Workshop on Hyperspectral Image and Signal Processing: Evolution in Remote Sensing (WHISPERS), Lisbon, Portugal, 6–9 June 2011; IEEE: Piscataway, NJ, USA, 2011. [Google Scholar]
  14. Xiao, H.; Chen, X.; Yang, Z.; Li, H.; Zhu, H. Vegetation index estimation by chlorophyll content of grassland based on spectral analysis. Guang Pu Xue Yu Guang Pu Fen Xi 2014, 34, 3075–3078. [Google Scholar] [PubMed]
  15. Pu, R.; Gong, P. Hyperspectral Remote Sensing and Its Applications; Higher Education Publishing House: Beijing, China, 2000. [Google Scholar]
  16. Rukeya Sawuti, A.A.; Nijati, K.; Li, H.; Wumuti, A.; Yasenjiang, K.; Li, X. Spectral estimation of chlorophyll content in spring wheat leaves based on fractional differential. J. Triticeae Crops 2019, 6, 738–746. [Google Scholar]
  17. Wang, J.; Tiyip, T.; Ding, J.; Zhang, D.; Liu, W. Estimation of desert soil organic carbon content based on hyperspectral data preprocessing with fractional differential. Trans. Chines 2016, 32, 161–169. [Google Scholar]
  18. Tarasov, V.E. On chain rule for fractional derivatives. Commun. Nonlinear Sci. 2016, 30, 1–4. [Google Scholar] [CrossRef]
  19. Wang, X.; Zhang, F.; Kung, H.; Johnson, V.C. New methods for improving the remote sensing estimation of soil organic matter content (SOMC) in the ebinur lake wetland national nature reserve (ELWNNR) in northwest China. Remote Sens. Environ. 2018, 218, 104–118. [Google Scholar] [CrossRef]
  20. Yasenjiang, K.; Yang, S.T.; Nigara, T.; Zhang, F. Hyperspectral estimation of soil electrical conductivity based on fractional order differentially optimised spectral indices. Acta Ecol. Sin. 2019, 19, 7237–7246. [Google Scholar]
  21. Abulaiti, Y.; Sawut, M.; Maimaitiaili, B.; Chunyue, M. A possible fractional order derivative and optimized spectral indices for assessing total nitrogen content in cotton. Comput. Electron. Agric. 2020, 171, 105275. [Google Scholar] [CrossRef]
  22. Jing, X.; Zeng, T.; Zou, Q.; Yan, J.; Dong, Y. Construction of remote sensing monitoring model of wheat strip rust based on fractional-order differential spectral index. Trans. Chines 2021, 17, 142–151. [Google Scholar]
  23. Zhao, B.; Duan, A.; Ata-Ul-Karim, S.T.; Liu, Z.; Chen, Z.; Gong, Z.; Zhang, J.; Xiao, J.; Liu, Z.; Qin, A.; et al. Exploring new spectral bands and vegetation indices for estimating nitrogen nutrition index of summer maize. Eur. J. Agron. 2018, 93, 113–125. [Google Scholar] [CrossRef]
  24. Feng, W.; Shen, W.; He, L.; Duan, J.; Guo, B.; Li, Y.; Wang, C.; Guo, T. Improved remote sensing detection of wheat powdery mildew using dual-green vegetation indices. Precis. Agric. 2016, 17, 608–627. [Google Scholar] [CrossRef]
  25. Wang, R.; Chen, Y.; Chen, L.; Peng, S.; Wang, X.; Yang, X.; Ma, L. Correlation analysis of SPAD value and chlorophyll congtent in leaves of Camellia oleifera. J. Cent. South. Univ. For. Technol. 2013, 33, 77–80. [Google Scholar]
  26. Li, M. Study on High-Spectral Quantitative Inversion Method of Chlorophyll Content in Natural Grassland Canopy; Capital Normal University: Beijing, China, 2021. [Google Scholar]
  27. Liu, Y.; Feng, H.; Sun, Q.; Yang, F.; Yang, G. Estimation of potato above-ground biomass based on fractional differential of UAV hyperspectral. J. Agric. Mach. 2020, 51, 202–211. [Google Scholar]
  28. Lin, S.; Xu, C. Theoretical and numerical investigation of fractional differential equations. Math. Numer. Sin. 2016, 38, 1–24. [Google Scholar]
  29. Tian, A.; Zhao, J.S.; Zhang, S.; Fu, C.; Xiong, H. Hyperspectral estimation of saline soil electral conductivity based on fractioanal derivative. Chines J. Eco-Agric. 2020, 28, 599–607. [Google Scholar]
  30. Jin, X.; Yang, G.; Xu, X.; Yang, H.; Feng, H.; Li, Z.; Shen, J.; Lan, Y.; Zhao, C. Combined multi-temporal optical and radar parameters for estimating LAI and biomass in winter wheat using HJ and Radarsar-2 data. Remote Sens. 2015, 7, 13251–13272. [Google Scholar] [CrossRef]
Figure 1. Sample distribution of T5, T6, and T7 study areas.
Remotesensing 15 05623 g001
Figure 2. Representative photographs of the study area samples ((ac) correspond to T5, T6, and T7, respectively).
Remotesensing 15 05623 g002
Figure 3. (a) Hyperspectral reflectance curves of grass drones in T5, T6 and T7; (b) Correlation between 25 bands and grass canopy chlorophyll content.
Remotesensing 15 05623 g003
Figure 4. Correlation of FOD spectra with chlorophyll content: (a) 0~0.5 order correlation, (b) 0.6~1 order correlation, (c) 1.1~1.5 order correlation, and (d) 1.6~2 order correlation.
Remotesensing 15 05623 g004
Figure 5. Distribution of correlation coefficients between FOD spectral indices and chlorophyll content in two bands.
Remotesensing 15 05623 g005
Figure 6. Coefficients of variation of full-band modeling R2 of different orders for PLSR and SVR.
Remotesensing 15 05623 g006
Figure 7. Scatter plot of two-band vegetation index grass chlorophyll estimation model for PLSR and SVR. The green dots in the figure represent fitted values of measured biomass against predicted biomass.
Remotesensing 15 05623 g007
Figure 8. Scatter plot of the model for estimating chlorophyll in grasses combining PLSR and SVR spectral features with exponential features. The green dots in the figure represent fitted values of measured biomass against predicted biomass.
Remotesensing 15 05623 g008
Figure 9. Chlorophyll inversion results in T5, T6, and T7 sampling areas.
Remotesensing 15 05623 g009
Table 1. Wavelength information of UAV hyperspectral images.
Band
Order
Wavelength
/nm
Band
Order
Wavelength
/nm
Band
Order
Wavelength
/nm
1672.711812.621923.8
2687.212833.722930.8
3713.113843.723939.3
4727.414854.624944.9
5739.515864.825950.1
6754.216876.2
7766.417883.8
8779.618893.5
9790.819907.8
10803.520916.2
Table 2. Correlation of FOD spectra with chlorophyll content and corresponding wavelength.
OrdersCorrelationWavelength/nmOrdersCorrelationWavelength/nm
00.774779.61.10.838727.4
0.10.776779.61.20.841727.4
0.20.781779.61.30.843727.4
0.30.786754.21.40.844727.4
0.40.791754.21.50.844727.4
0.50.795754.21.60.842727.4
0.60.798754.21.70.838727.4
0.70.807727.41.80.830727.4
0.80.817727.41.90.817727.4
0.90.826727.42.00.799727.4
1.00.833727.4
Table 3. Correlation coefficients between the best FOD spectral indices and grass chlorophyll content in two bands and the corresponding band combination.
OrdersFDIFRIFNDI
CorrelationBand CombinationCorrelationBand CombinationCorrelationBand Combination
00.838(14,8)−0.817(10,14)0.817(14,10)
0.1−0.838(4,3)0.816(12,10)0.816(12,10)
0.2−0.841(4,3)0.81(12,10)0.809(12,10)
0.3−0.843(4,3)0.812(3,4)−0.81(4,3)
0.4−0.844(4,3)0.815(3,4)−0.811(4,3)
0.5−0.844(4,3)0.814(1,10)−0.812(10,1)
0.6−0.842(4,3)0.819(2,10)−0.821(10,2)
0.70.838(4,3)0.803(2,10)−0.806(10,2)
0.80.848(22,4)0.758(1,4)−0.753(4,1)
0.90.856(22,4)0.772(1,4)−0.767(4,1)
1.00.861(22,4)0.784(1,4)−0.779(4,1)
1.10.86(22,4)−0.818(19,4)0.818(4,2)
1.20.852(22,4)−0.85(19,4)0.819(4,2)
1.30.838(13,4)−0.858(19,4)0.82(4,2)
1.40.838(11,4)0.856(20,4)0.82(4,2)
1.50.839(11,4)0.852(20,4)0.818(4,2)
1.60.838(11,4)0.836(20,4)0.812(4,2)
1.70.835(11,4)0.808(20,4)0.799(4,2)
1.80.831(11,4)0.777(1,4)0.78(4,2)
1.90.831(19,4)−0.775(1,11)0.777(11,1)
2.00.832(19,4)−0.773(1,11)0.776(11,1)
Table 4. Estimation accuracy of grassland chlorophyll content in PLSR and SVR models.
OrderPLSRSVR
R2RMSERPDR2RMSERPD
00.6992.1651.8470.5962.5291.58
0.10.72.1641.8420.6012.5151.588
0.20.6862.2181.7960.5872.5591.561
0.30.6752.2571.7650.5822.5711.552
0.40.6792.2461.7690.5962.5241.579
0.50.722.0891.9070.6152.4641.615
0.60.7422.0011.9940.6252.4351.626
0.70.742.0231.9660.632.4181.648
0.80.7412.0091.9830.6282.4251.645
0.90.7312.051.9430.6262.4341.641
1.00.7222.0841.9120.6262.4351.641
1.10.7142.111.8890.6252.4371.639
1.20.712.1241.8780.6242.4411.636
1.30.7122.1181.8830.6222.4471.632
1.40.7172.0981.90.622.4541.627
1.50.7242.0751.920.6182.461.623
1.60.7292.0571.9360.6162.4661.618
1.70.7312.0491.9440.6142.4711.615
1.80.732.0521.9420.6132.4741.613
1.90.7262.0671.9280.6122.4781.611
2.00.7182.0941.9050.6112.4811.609
Disclaimer/Publisher’s Note: The statements, opinions and data contained in all publications are solely those of the individual author(s) and contributor(s) and not of MDPI and/or the editor(s). MDPI and/or the editor(s) disclaim responsibility for any injury to people or property resulting from any ideas, methods, instructions or products referred to in the content.

