


Abstract
This study evaluates how differences in data provenance and inventory construction influence whole-life carbon assessment (WLCA) results for a residential building in Colombia. Two scenarios were assessed: Scenario A, based on contractor records (building Company Z) and the public utility supplier; and Scenario B, based on drawing-derived quantity take-offs and a Colombian regulatory energy baseline (Resolution 0549 of 2015). The assessment follows UNE-EN 15978 and Royal Institution of Chartered Surveyors (RICS) WLCA for modules A1–A3, A4–A5, and B6. Scenario B reached 784.4 kg CO2e/m2, which is 37.9% higher than Scenario A. In the product stage, impacts increased from 298.1 to 332.6 kg CO2e/m2, while in the operational energy stage they increased from 246.2 to 426.2 kg CO2e/m2. The results show that WLCA outcomes are highly sensitive to data provenance, reporting gaps, and baseline selection, underscoring the need for stronger data governance and more traceable environmental reporting practices in building assessment.
1. Introduction
Sustainable development has become a crucial concern for countries all around the world. It was defined by the Brundtland Commission held in 1987 as the realization of today’s needs considering the future generation needs as well. However, the industrial revolution helped increased mechanized production activities by humans resulting in an increase in greenhouse gas (GHG) emissions (carbon dioxide, methane, nitrous oxide, hydrofluorocarbons, perfluorocarbons and sulfur hexafluoride), surpassing natural absorption and also having a negative impact on both the economy and the environment. Therefore, in 1997, the Kyoto protocol was adopted in Japan which formally obliges signatories to control their GHG emissions. In November 2021, the United Nations (UN) framework Convention on Climate Change established the Paris agreement, which stipulates “holding the increase in the global average temperature to well below 2 °C above pre-industrial levels and pursuing efforts to limit the temperature increase to 1.5 °C above pre-industrial levels” [1]. The largest constituent of GHG in the atmosphere is carbon dioxide, considered a top priority when addressing control and reductions. According to the 2018 Global Carbon Budget report, the atmospheric CO2 concentration has increased from 277 ppm in 1750 to 405 ppm in 2017 (a 46% increase), affecting the Earth’s environment and overall temperature [2].
The UN set out a 15-year plan (2015–2030) to achieve 17 Sustainable Development Goals for social welfare while tackling climate change and working to preserve oceans and forests [1]. These goals include increasing access to clean drinking water and sanitation; improving urban planning and public transportation; providing affordable and adequate housing resilient infrastructure; and reducing energy consumption for heating and cooling as well as emissions that contribute to climate change. Regarding infrastructure and building, these goals must be achieved by providing and improving them through enhanced strength and durability, optimized construction operations and more efficient building materials. Every strategy and approach must be based on regional aspects, particularly to achieve Goal 12, which addresses the sustainable management and efficient use of natural resources, especially for high volume used materials [2]. Construction is one of the most dynamic industrial sectors at the heart of global economic growth and assists the evolution of societies around the world [1]. However, since the industrial age, it has significantly contributed to the increase in carbon emissions in our environment through various activities such as land clearing, equipment engine emissions, demolition, burning, and use of dangerous chemicals, among others contributing to the Earth’s volume of gases [3]. The construction industry is responsible for 50% of global raw material consumption. Moreover, it accounts for 40% of the consumption of raw stone, gravel and sand, 25% of virgin wood, 16% of water consumption, 40% of global energy use, and is responsible for generating half of all industrial waste [4].
Buildings are among the top seven contributors to environmental emissions. In 2018, the construction and buildings sectors accounted for 36% of energy use and 39% of energy and process-related carbon dioxide emissions [5]. The manufacturing of construction materials used for new buildings and maintenance of existing ones represents 11% of global overall energy- and process-related GHG emissions, with more than half related to the manufacturing of steel and concrete [6], which has been fundamental for the industry due to its high mechanical performance, durability and accessibility worldwide. The production of concrete requires a high consumption of natural resources (aggregates, cement, fossil fuels, and energies) and generates high emissions with a significant environmental impact. Portland cement is one of the main components used in concrete production and a major source of CO2 emissions (8% of the global carbon dioxide [7]) due to the impacts of the calcination of limestone and the fuel needed to heat the kiln to 1450 °C. Moreover, the annual consumption of aggregate is increasing to produce concrete, which makes up 70–80% of the produced concrete’s volume. Therefore, the loss of natural resources due to the environmental impacts of improper extraction of materials for concrete production is a global concern [4].
In this regard, countries around the world investigate different solutions to reduce greenhouse gas emissions and the environmental problems caused by concrete production in order to cope with global warming. Two fundamental methods are offered: one is through the use of recycled aggregates instead of natural ones and the other is the use of alternative cementitious materials instead of Portland cement [7]. Construction and demolition wastes (CDW) are the heaviest and most voluminous wastes globally. According to a report by the World Bank, it is estimated that around 2.01 billion tons of CDW were generated globally in 2016 and this is expected to increase to 3.40 billion tones by 2050; this represents a USD 217.3 billion management market value by 2027 [8,9]. The reutilization of these wastes (25–35% are concrete) means that they can be turned into aggregates for concrete production, becoming a vital step towards a sustainable industry by preventing the depletion of natural resources and moving towards a circular economy [10,11]. Life cycle assessment (LCA) is an investigative method used for evaluating the environmental impacts of a system or a product over its complete life cycle by quantifying energy consumption, environmental pollutant emission and showing reduction measures [12,13]. A building’s carbon emission can be measured throughout its LCA using two recently published guidelines. The first is the whole-life carbon assessment for the built environment (WLCA) [14] created by the Royal Institution of Chartered Surveyors (RICS). The second is the Buildings Sector Science-Based Target-Setting Guidance—SBTi building [15] created by the Science-Based Targets initiative (SBTi). WLCA refers to the calculation and report of carbon impact throughout the life cycle of a building project, from the construction stage to the end of life, including potential benefits and loads beyond the system boundary. Information about each stage of a building’s life cycle uses a system boundary provided by EN 15978 [16], EN 17472 [17], EN 15804 [18], EN 15643 [19], ISO 21931 volumes 1 and 2 [20,21], and ISO 21930 [22].
For instance, the International Organization for Standardization (ISO) issued ISO 21930 which categorizes the building life cycle into five modules or stages and 17 sub-stages: building material production (A1–A3), construction (A4–A5), use (B1–B7), end of life (C1–C4) and potential benefits and loads beyond the system boundary (D). Despite the numerous studies, there is a gap and need of a consensus between the quantified carbon emissions and the physical output when constructing a building [1,7]. Construction involves a complex process of design, material selection, construction methodology, operation, maintenance and demolition. Therefore, LCA considers the different environmental impacts of each phase within a specific study scope [23]. However, in tropical regions like Latin America, the LCA of buildings projects is poorly understood, given the lack of use in standards that regulate energy consumption and materials in a building [24]. Latin America and the Caribbean have the largest number of ecoregions in the world and the greatest variety of natural species, essential for the survival of humanity: they stabilize the atmosphere and the climate, being one of the regions with the greatest abundance of natural resources on the planet [25]. Therefore, there is not only a need to implement sustainable strategies for the construction industry but to implement life cycle assessment methodologies in the region to assess the environmental impact. However, most of the tools used have been concentrated in the European and North American context, creating a need for studies in the region [26].
The construction of a building project can be divided into different subcategories such as foundations and sitework, concrete construction, masonry wall construction and finishes. These are directly related to the consumption of mortar and concrete for elements like slabs, piles, footings, beams, columns, two-way slabs, bearing walls, floor finishes, interior and exterior finishes, lintels, gutters and others. However, poor information management regarding the amount of material used during the project’s life cycle assessment leads to gaps and misinformation in analysis and reports which do not allow the assessment of the true environmental impact. This study examines the effects of differences in data origin, quantity take-off records, and operational energy baselines on the calculated whole-life carbon footprint of a residential building, in addition to verifying the accuracy of environmental impact assessments through carbon footprint analysis using bill-of-quantities calculations for a residential building across its production (A1–A3), construction (A5), and use (B6) phases. While assessing the sensitivity of whole-life carbon results to the reliability and management of activity data, two carbon accounting scenarios for a Colombian residential building were compared: one using data reported by the company and utility, including construction waste, and the other using independently calculated technical quantities based on architectural, structural, and technical drawings, alongside a local regulatory operational energy baseline. The methodology proposed by Pardo [27] was adopted to determine the relevant environmental indicators. The working hypothesis implies that discrepancies in material quantities and energy reference data can affect module-level and total carbon footprint estimates, compromising the reliability and comparability of building carbon assessments.
2. Materials and Methods
2.1. Case Study Description
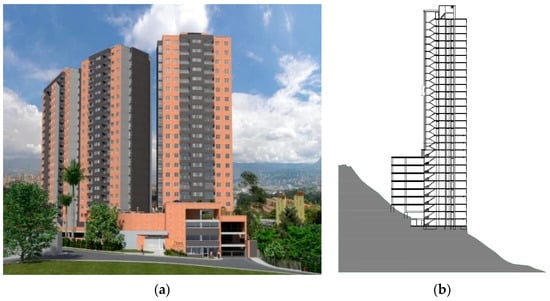
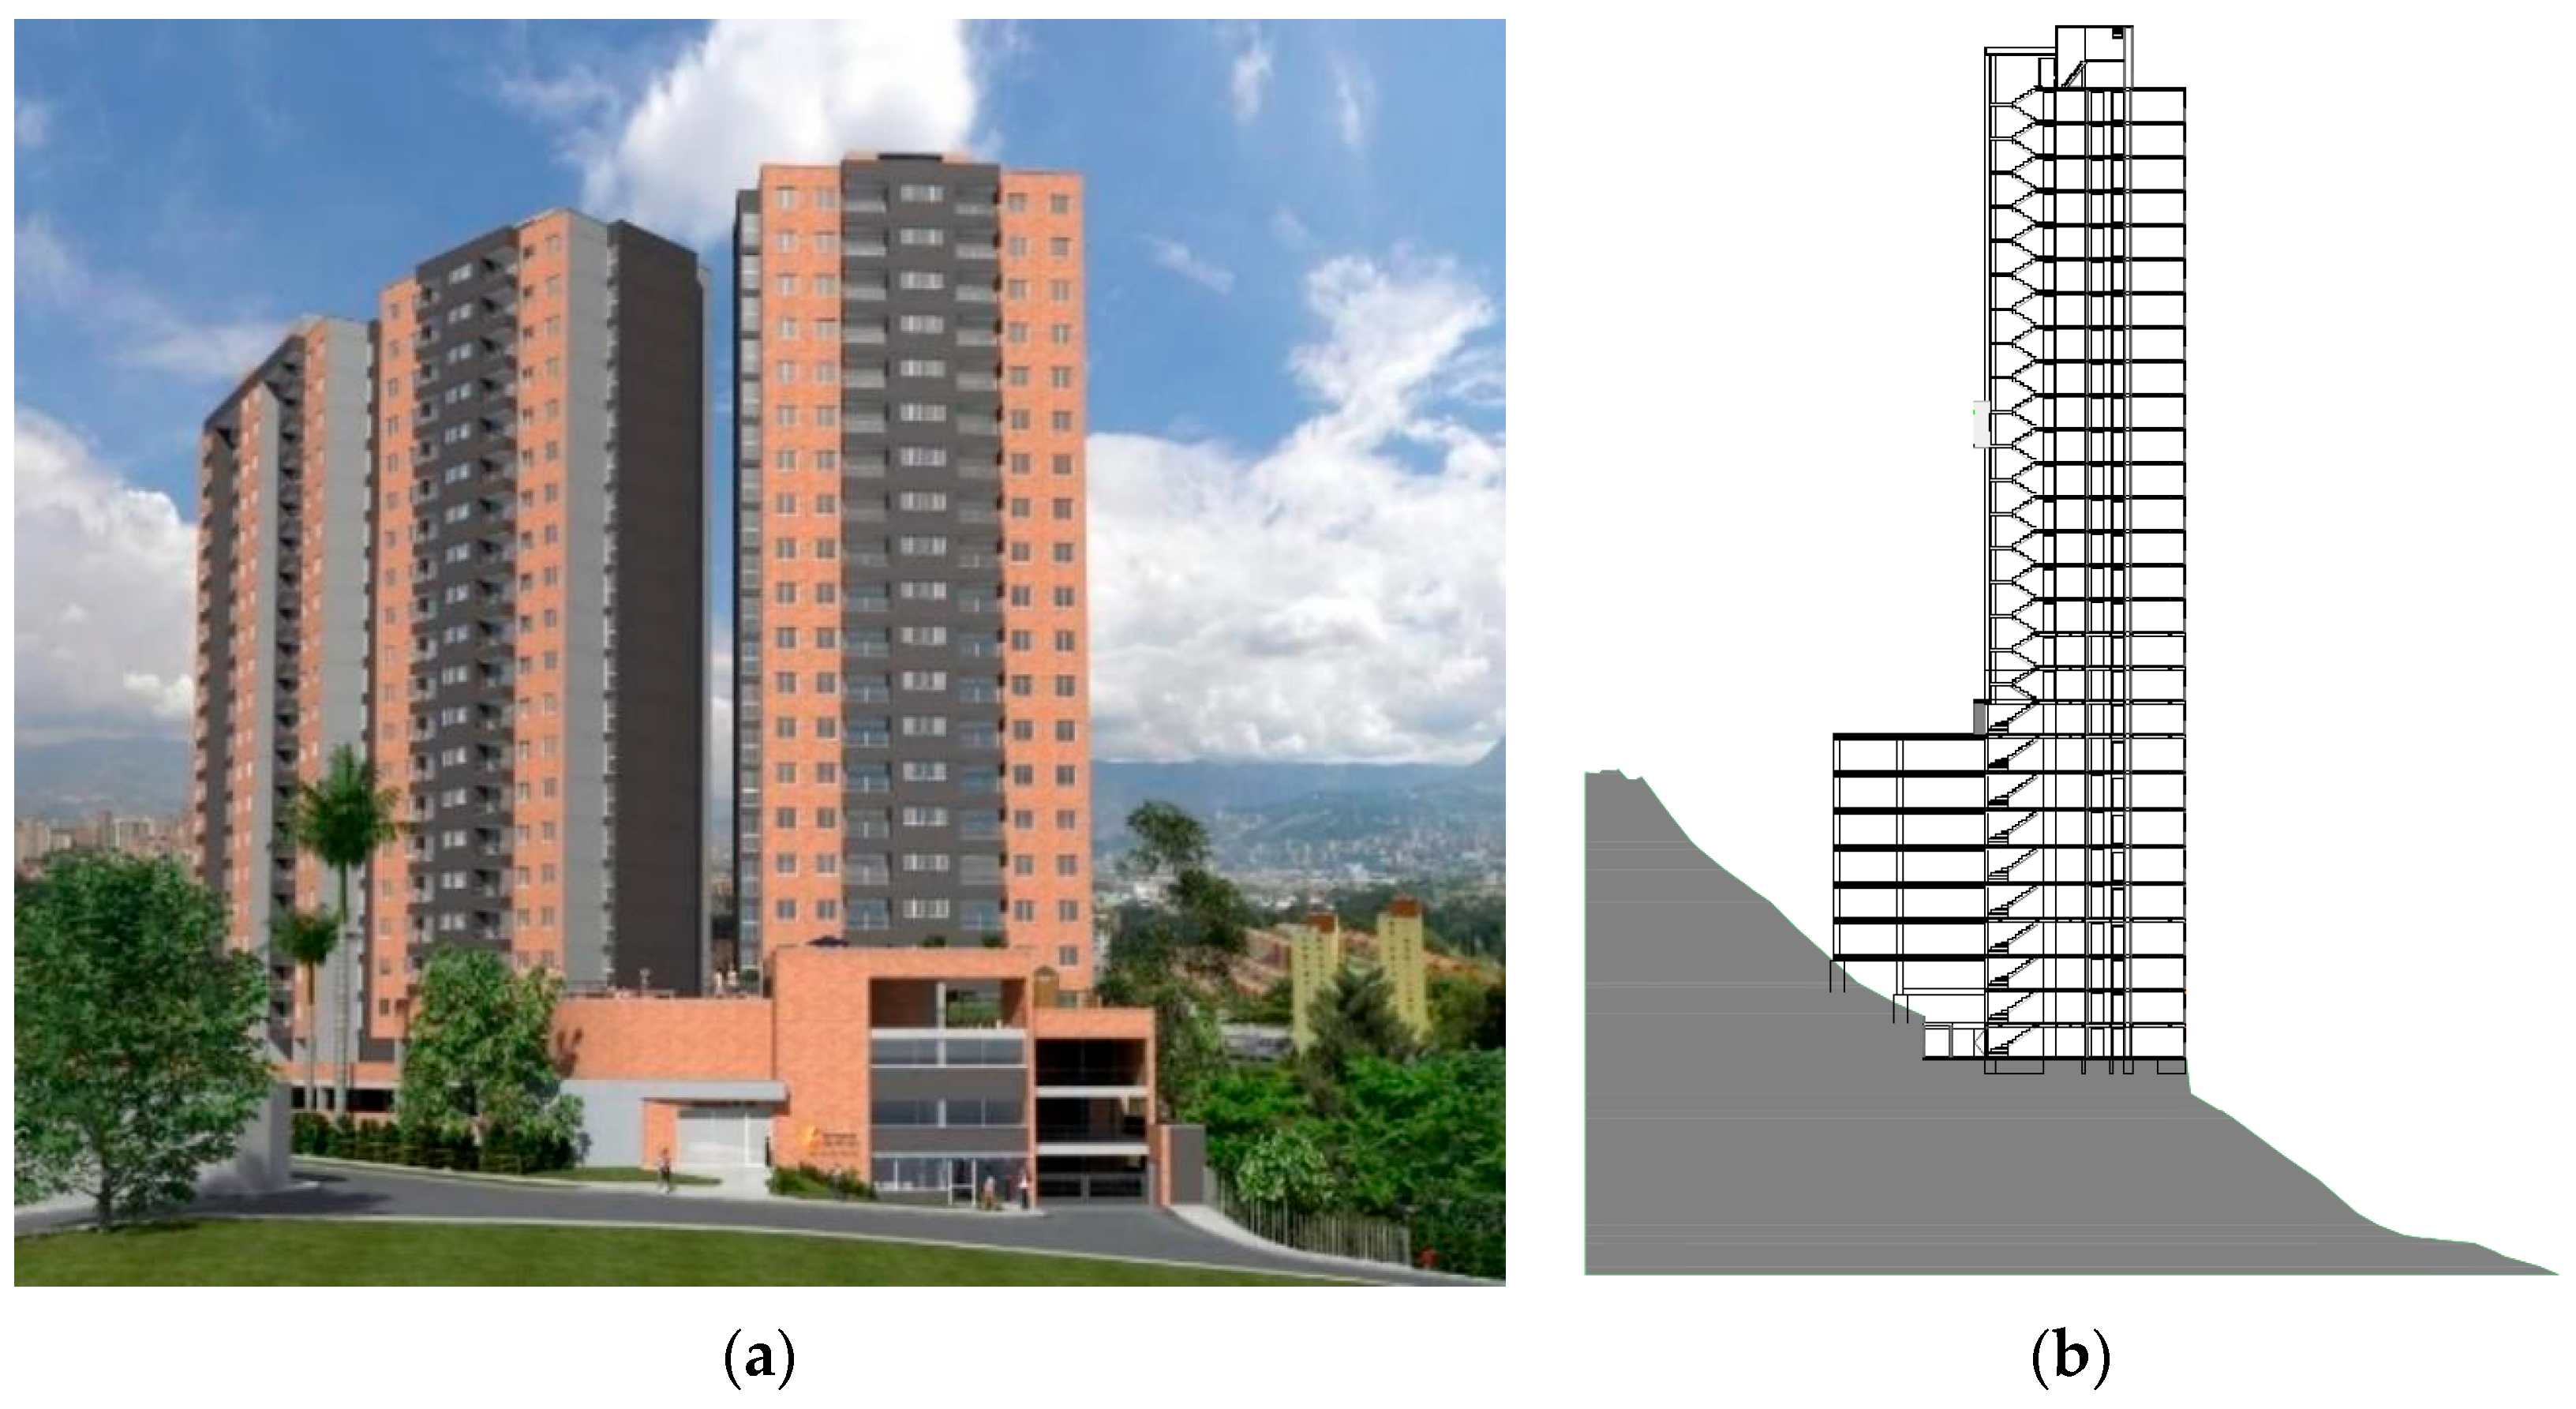
Medellín is the second most important city in Colombia, with a population of approximately 2.4 million inhabitants and a 7% share of the national gross domestic product (GDP). Colombia itself is located in the northwestern region of South America. Located in the northwest of the country, Medellín is crossed from north to south by the Medellín River. It is the main township in the Metropolitan Area of the Aburra Valley (AMVA, its Spanish acronym). In Colombia, housing and habitat projects are classified into three categories: Social Interest Housing or Priority Housing Program (VIS and VIP are the Spanish acronyms) and Non-VIS Housing. Currently, the value of a housing unit cannot exceed 90 Colombian statutory monthly minimum wages (SMMLV, its Spanish acronym) for VIP, and 135 SMMLV for VIP. Non-VIS housing projects have a value greater than 135 SMMLV [28]. The design and construction of building projects in Colombia adhere to the Colombian Earthquake Resistant Construction Regulations (NSR, its Spanish acronym). Typical residential Non-VIS housing projects consist of reinforced concrete structural rigid frame systems design to resist dead, live, dynamic and seismic loads [29]. This research will evaluate a typical residential Non-VIS case study, designated as Project Z. It consists of three main buildings, each with twenty-two floors, four apartments per floor, and two elevators in each building. Figure 1a shows a rendering and Figure 1b a cross-section of the project. Common areas include a pool, court, gym, social lounge, playground and green areas. For the purpose of this study, only Building II was analyzed. The construction started in 2013 and ending in early 2015.
Figure 1.
(a) Model of Project Z and (b) cross-section of Building II.
2.2. Life Cycle Assessment Methodology
Life cycle assessment was conducted based on UNE-EN 15978:2012 [16], complemented with the whole-life carbon assessment for the built environment—WLCA [13], developed by RICS. Following ISO 21931-1:2010 [20], ISO 14040 [30], and ISO 14044 [31], the assessment was structured around four stages: goal and scope definition, life cycle inventory analysis, life cycle impact assessment, and interpretation. In addition, inventory data quality was reviewed under the ISO 14044 [31] data-quality framework, considering temporal, geographic, and technological representativeness, as well as completeness, consistency, and reliability. Since the available records did not allow a robust quantitative pedigree-matrix scoring, the study adopted a qualitative data-quality assessment, which provides a transparent and methodologically consistent basis for interpreting the inventory and its limitations. The functional unit was expressed as kg CO2e/m2 of gross floor area over a 50-year reference study period (RSP), which is consistent with the operational projection from full occupancy in 2016 to 2065. Within this scope, this should be understood as a screening-level WLCA focused on modules A1–A3, A4–A5, and B6, because these were the stages for which verifiable and internally consistent case study data could be assembled. The environmental impact was assessed using the global warming impact category and global warming potential parameter, known as carbon footprint, per m2 of building area. Table 1 presents the system boundary for carbon emission assessment. Emission factors for materials used in the product stage (A1–A3) were sourced from the report developed by United Nations Development Programme (UNDP), Mining and Energy Planning Unit (UPME, its Spanish acronym), and Ecoingeniería [32].
Table 1.
System boundary for environmental impact of buildings (UNE-EN 15978:2012) complemented with WLCA.
Colombia had no established environmental product declaration (EPD) ecosystem for construction products, and the UNDP/UPME/Ecoingeniería dataset represented the first nationally published approximation of materials embodied impacts. These factors were intentionally selected to ensure temporal consistency between the emission intensities and the project’s construction phase, rather than incorporating later-generation fac-tors that could introduce temporal bias. International datasets, such as Ecoinvent-based generic processes, were not employed for triangulation as they may introduce a non-analogous industrial context. This approach should be understood as a scope-controlled, national grounded screening assessment rather than a definitive product-specific inventory. Construction Company Z, the builder, provided the work quantities, architectural, structural and plumbing drawings. The materials analyzed consisted of: steel, masonry, polyvinyl chloride, copper, glass, coarse aggregate, fine aggregate, cement, fly ash and chemical additive (superplasticizer).
In the construction stage (A4–A5), emission factors for fuels used by vehicles and machinery were assessed according to the Emission Factors of Colombian Fuels (FECOC, its Spanish acronym) [33]. Emission factors for fuels and electricity consumption were considered based on [34]. Carbon emissions from building material transport were evaluated considering intermunicipal, interdepartmental, and international transport distances. Processes such as concrete pumping, fuel consumption of construction equipment used for excavations, and fuel and electricity consumption of portable concrete mixers were considered. Ecoinvent [35] databases were used to assess the environmental impact of waste and waste management-related activities. The most significant impact was associated with earthmoving activities and transport to resource recovery facilities, sanitary landfills, and third-party disposal sites. The point of origin for the different types of materials used, quantities of identified construction and demolition wastes (CDW), final disposition place, electrical and fuel consumption were reported by the construction company. In addition, materials suppliers and CDW management companies reported its fuel consumption.
For module B6, operational energy impacts were assessed using utility consumption records spanning from 2016—the year of full building occupancy—to 2024, combined with nationally reported electricity emission factors sourced from the Energy and Mining Planning Unit (UPME) [34]. For the remaining years of the 50-year reference study period (RSP) [36,37], extending the projection to 2065, emission factors were derived from the long-term grid decarbonization trajectory outlined in the 2050 report published by the Ministry of Mines and Energy (Ministerio de Minas y Energía, Minenergia), which provides baseline emissions per unit of generation consistent with Colombia’s energy transition policy framework [38]. Energy consumption during this stage was reported by the local supplier and estimated based on Colombian Resolution 0549 of 2015 issued by the Ministry of Housing, City and Territory (Minvivienda) [39]. However, this data only applies to the apartment areas, since the energy consumption of staircases, fixed points, parking lots and utility rooms are shared with the other buildings.
2.3. Proposed Scenarios
Two scenarios were considered for the carbon footprint assessment (kg CO2e/m2) to determine if there are significant differences or inconsistences between reported data and theoretical material quantity. Scenario A relied on information reported by the construction company for modules A1–A5, including quantity take-off data, fuel and electricity consumption, CDW generation and management. For module B6, energy consumption data provided by the public service supplier from 2016 to 2022 was used. Based on the average consumption, this data was then projected to estimate up to the year 2065. In line with the 50-year RSP defined for the study, the verified utility data were used as the basis for projection from initial occupancy through 2065. Scenario B relied on work quantities from architectural, structural and technical drawings developed in AutoCAD 2023 (Autodesk Inc., San Rafael, CA, USA) including wastage determined by the construction company. Fuel consumption for materials and CDW transport were estimated based on the location of local suppliers and a study developed by [27]. Energy consumption was assumed the same as scenario A. For Module B6 energy use was calculated based on Resolution 0549 de 2015 [39], which adopted the Sustainable Construction Guide for water and energy savings. This document contains potential measures to achieved required saving percentages relative to a base line for Non-VIS warm weather housing. Operational energy was projected from 2016 to 2065 as a scenario-based extrapolation anchored in observed utility consumption and the regulatory baseline available at the time of the study, rather than as a forecast that incorporates future efficiency improvements, equipment replacement, technological innovation, or grid decarbonization dynamics. While the resolution has been implemented in Colombia since 2017, this estimation was conducted to establish an approximate theoretical comparison. It is important to highlight that the report and the estimations of the material work quantities in either scenario does not include construction finishes.
For the system boundary exclusions and implications, modules B1–B5 (use, maintenance, repair, replacement, and refurbishment) and B7 (operational water) were excluded due to the absence of Colombian datasets and monitoring records capable of supporting reproducible inventories within the defined scope of the study. Additionally, company reporting practices did not include traceable records for use, maintenance, repair, replacement, or refurbishment activities, or operational water use activities. Recent WLCA [40,41] literature indicates that these excluded use-stage modules may range from marginal to materially relevant depending on service life assumptions, maintenance cycles, occupant behavior, and water-related energy intensity. Therefore, their omission may lead to an underestimation of total whole-life carbon, particularly for replacement-intensive components and for water systems with non-negligible associated energy demand; however, keeping them outside the system boundary for both scenarios does not alter the comparative purpose of this study, which is to evaluate how data provenance affects the assessed modules. Operational energy projection limitation and Colombian Monitoring, Reporting and Verification (MRV) gap: The 2016–2024 utility-based consumption data constitute the only verifiable operational dataset available. Colombia’s Resolution 0549 did not establish a formal Monitoring, Reporting, and Verification (MRV) system, thereby limiting structured long-term data availability. Consequently, the 50-year projection to 2065 is based on a uniform extrapolation, without adjustments for behavioral changes, technological developments, or grid decarbonization dynamics. Therefore, long-term B6 results are interpreted as indicative estimates rather than deterministic predictions. The Resolution 0549 baseline is strictly employed as a policy-relevant benchmark for comparative purposes.
2.4. Statistical and Analytical Treatment
Because this is a single-building comparative case study, the analysis relied on descriptive and scenario-based techniques rather than inferential statistics. The analytical procedure included: normalization of impacts as kg CO2e/m2 over the 50-year RSP; scenario comparison for modules A1–A3, A4–A5, and B6; calculation of absolute and percentage differences between scenarios; contribution analysis by stage and by key materials; and consistency checks between reported and drawing-derived quantities. No hypothesis-testing statistics were applied because the study does not involve a sampled population or repeated observations suitable for inferential analysis.
3. Results
3.1. Project Z-Building II
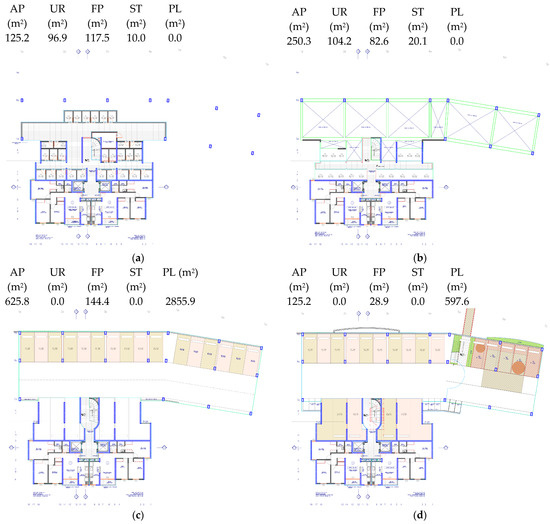
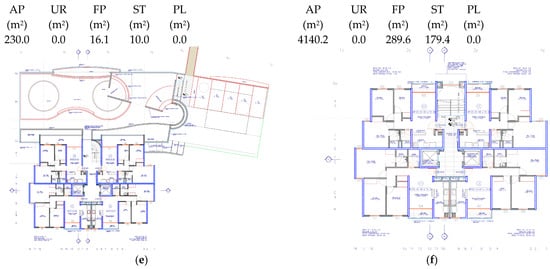
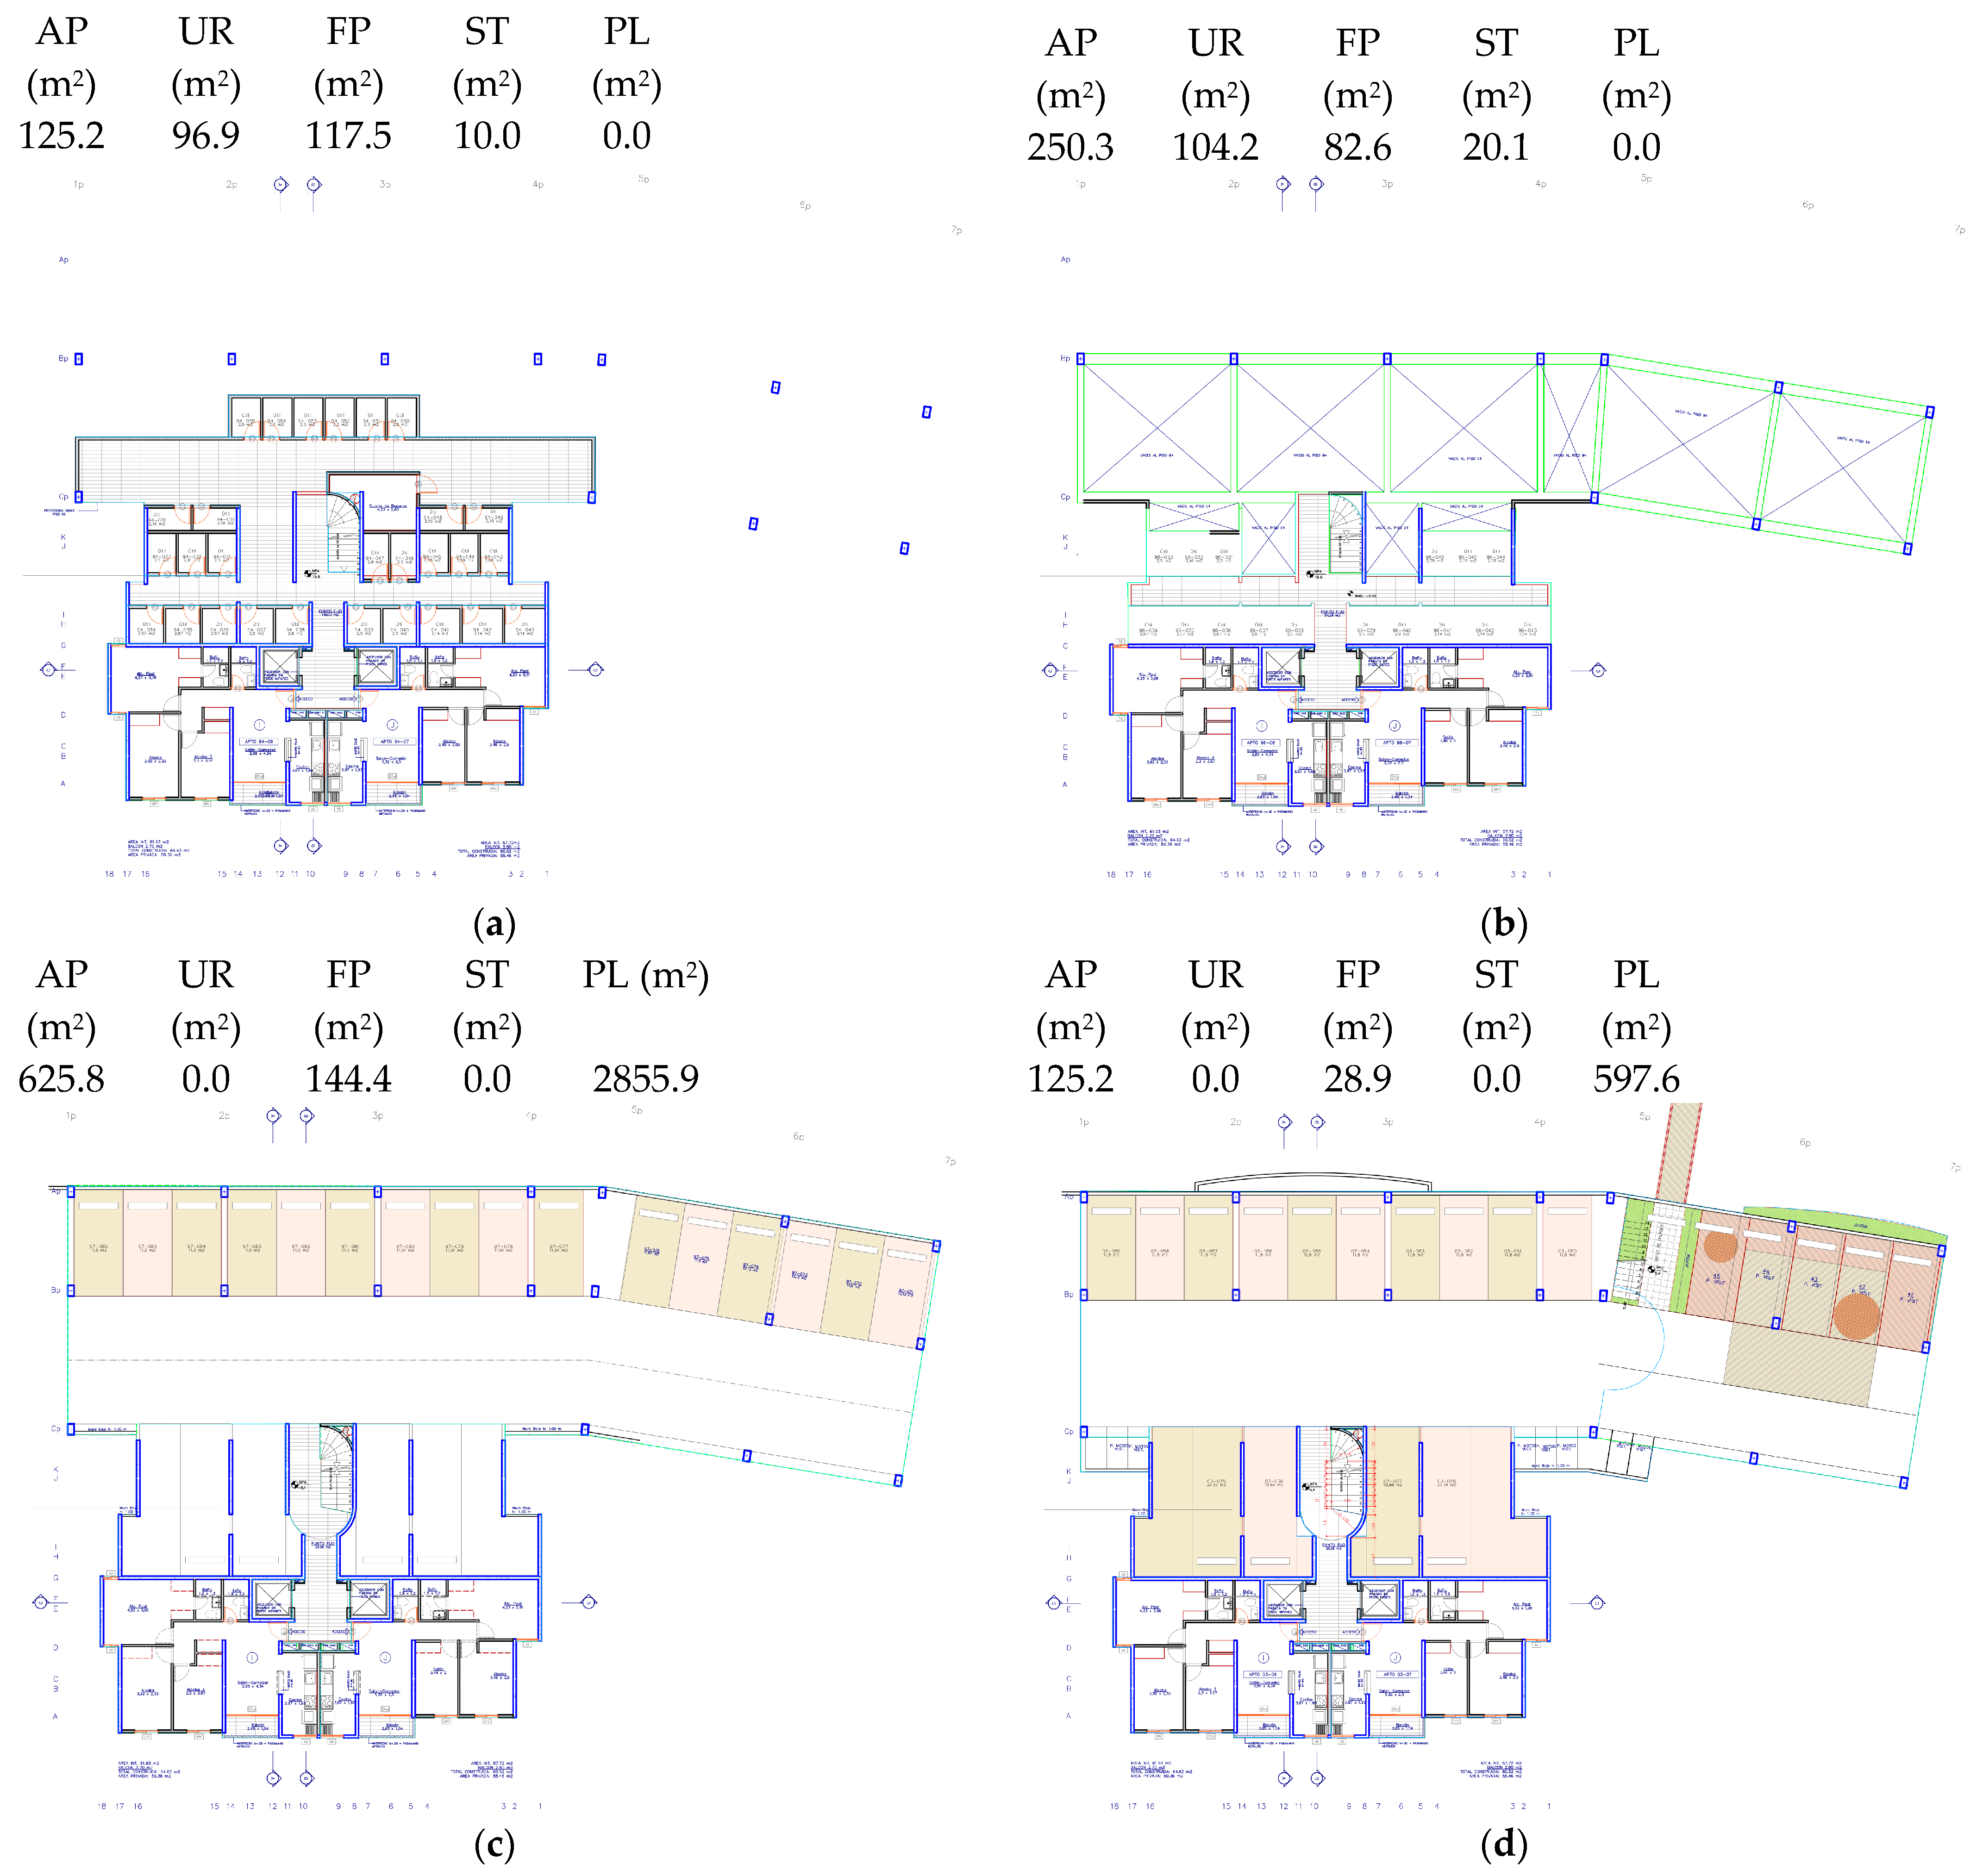
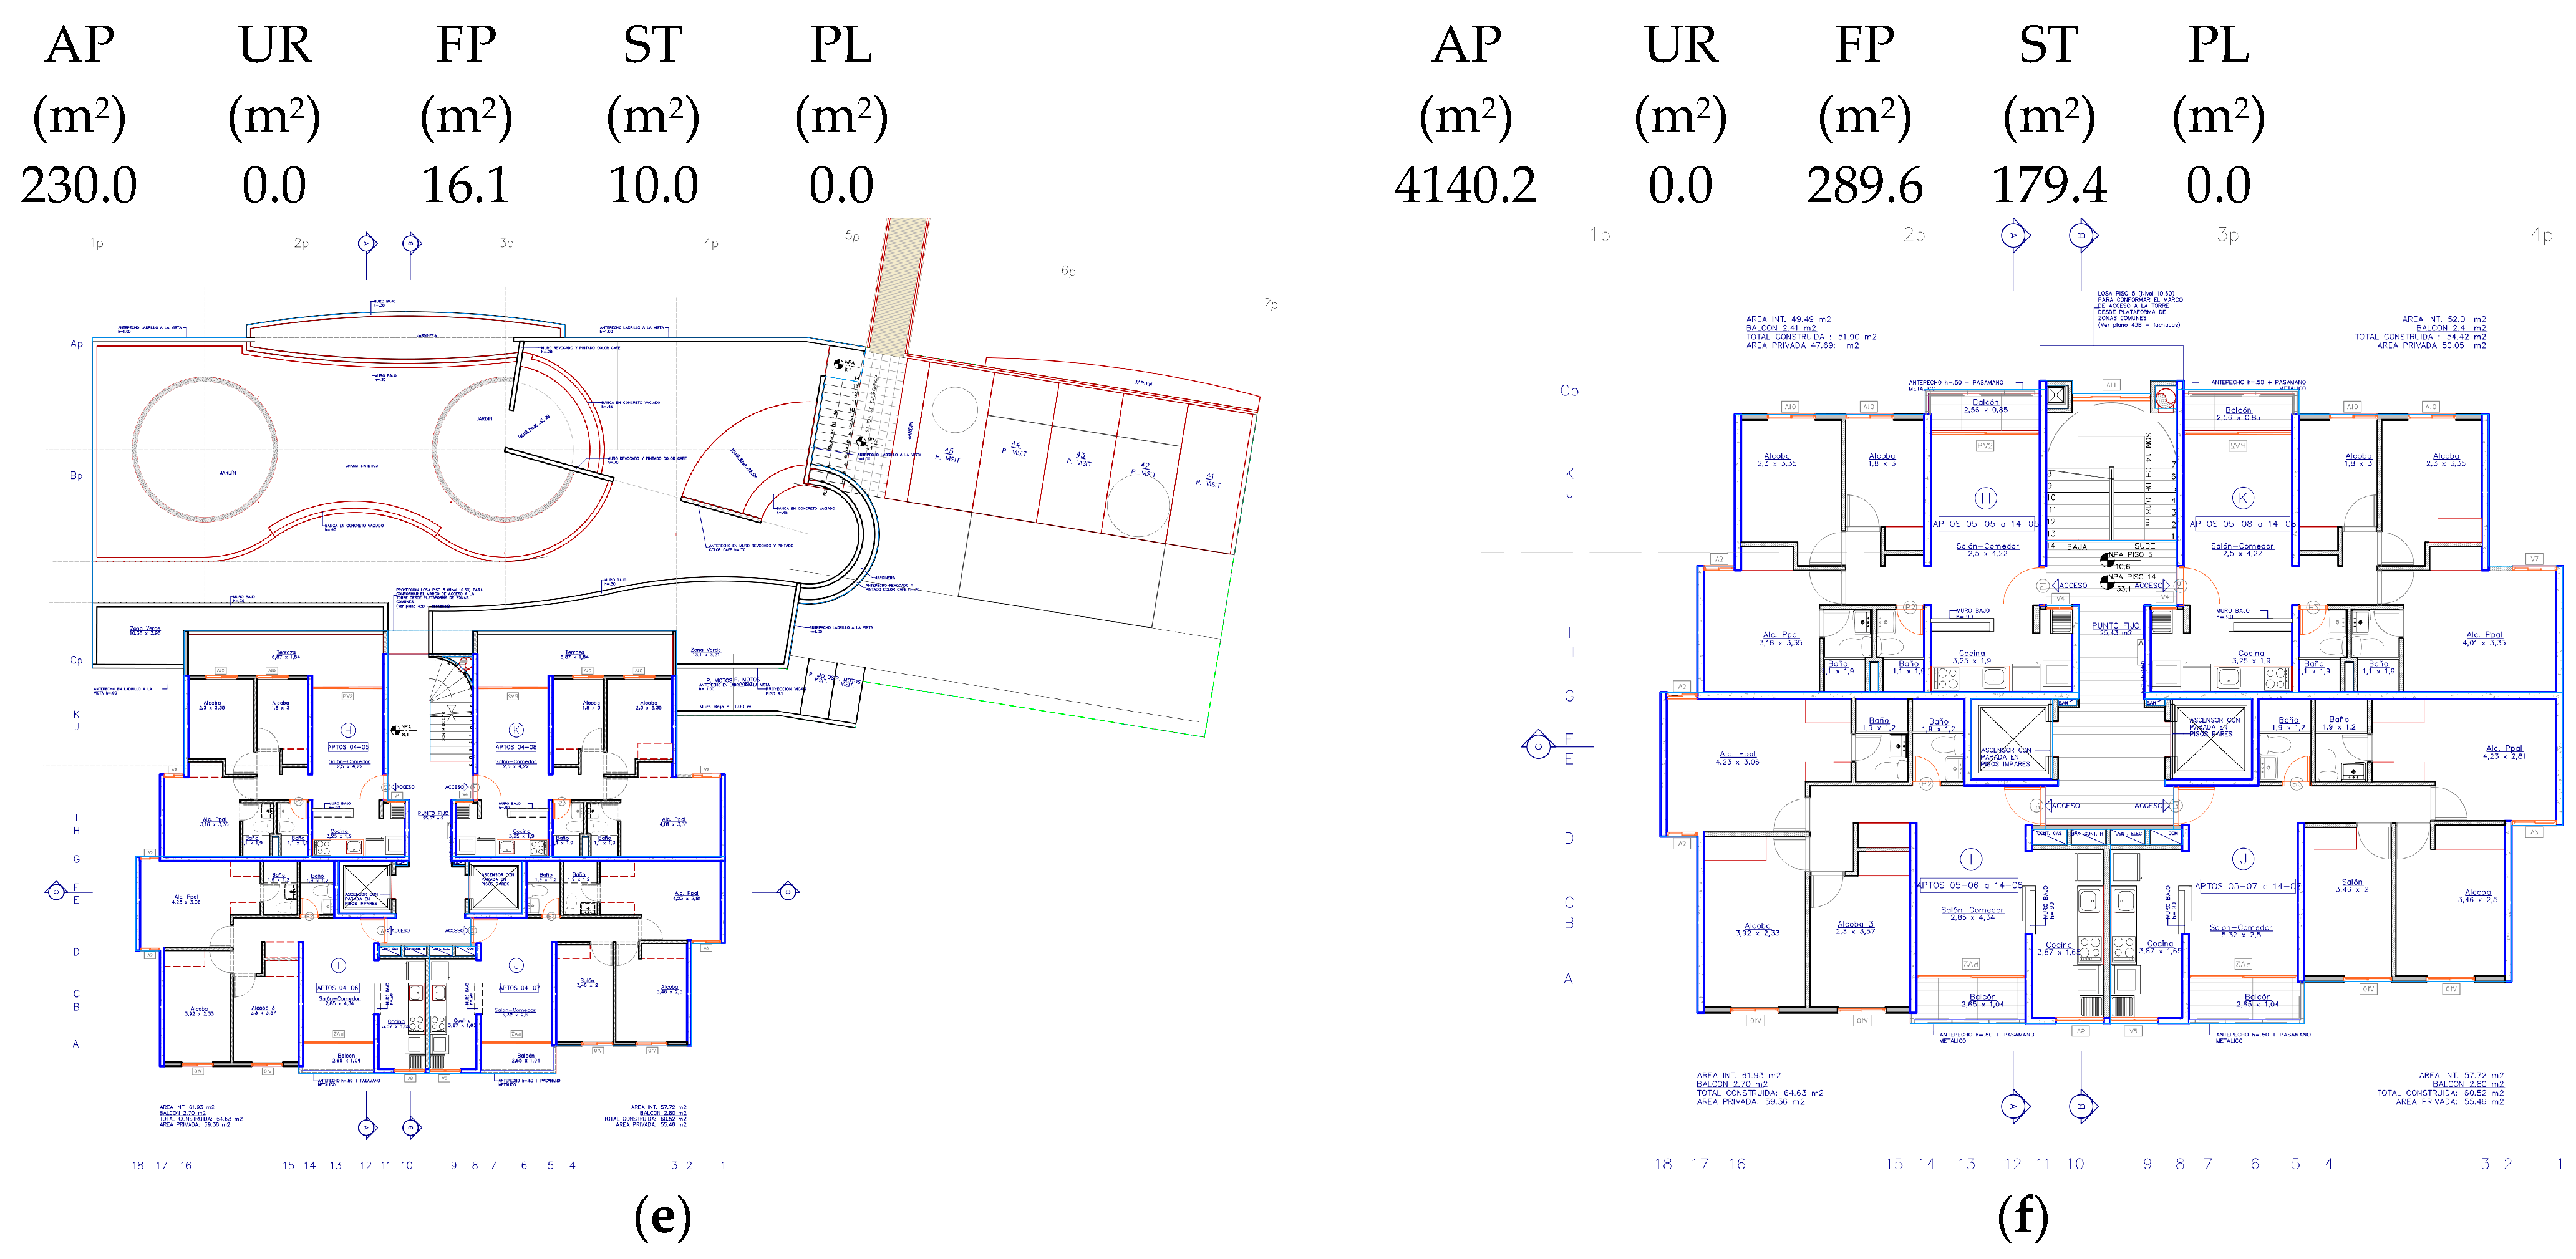
Figure 2 shows architectural drawings for typical floor plans of the residential building. The total areas in square meters (m2) break down to: 5496.7 for apartments (AP), 201.1 for utility rooms (UR), 679.1 for fixed points (FP), 219.5 for staircase (ST) and 3453.5 for parking lot (PL). It has four typical apartments designs named A, B, C and D with 54.4, 51.9, 64.1, and 60.0 m2 respectively. Floor plan distribution from the basement to the top corresponds to: floor 94 (Figure 2a), 95 and 96 (Figure 2b), 97, 98, 99, 1 and 2 (Figure 2c), 3 (Figure 2d), 4 (Figure 2e) and 5 to 22 (Figure 2f).
Figure 2.
Architectural floor plans for Project Z—Building II. (a) Floor 94, (b) Floors 95 y 96, (c) Floors 97, 98, 99, 1 y 2, (d) Floor 3, (e) Floor 4 y (f) Floors 5 al 22. Where AP corresponds to apartment, UR utility room, FP fixed points, ST staircase and PL to parking.
3.2. Carbon Footprint Comparison for the Scenarios
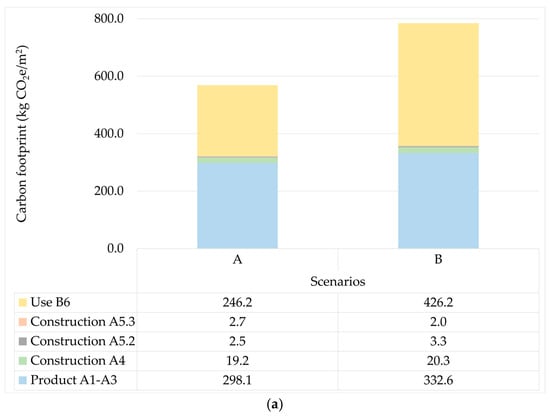
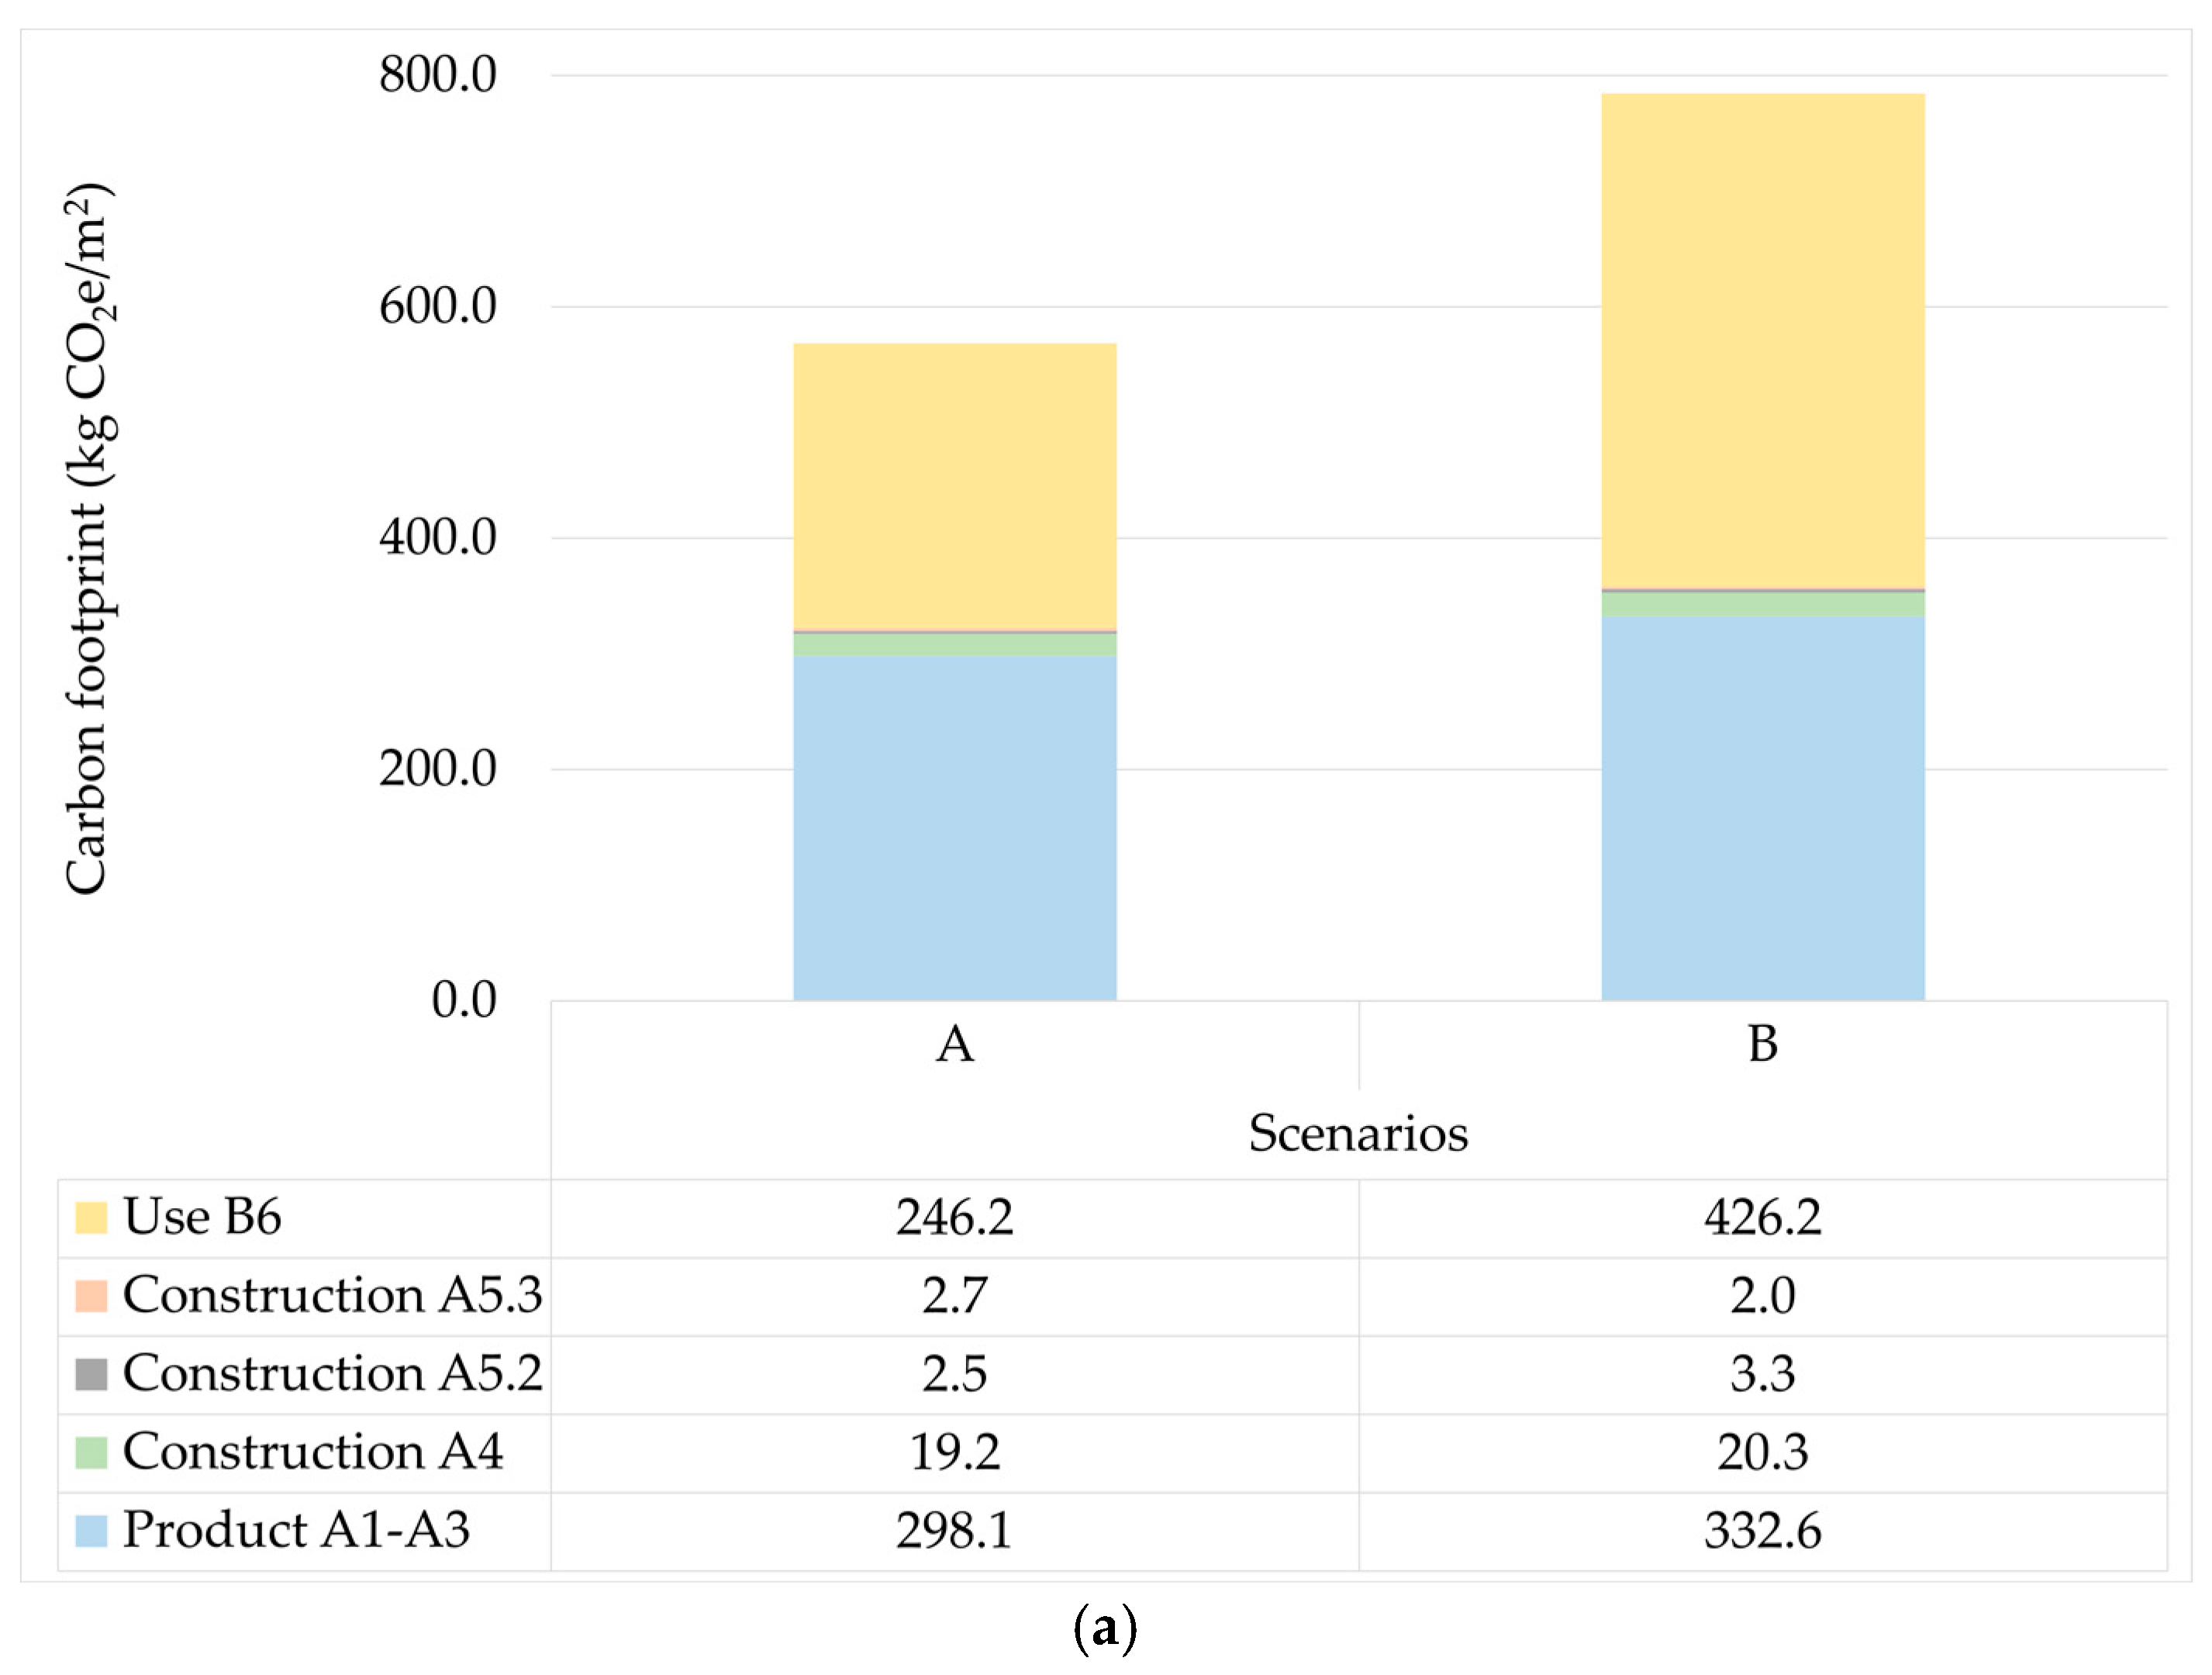
Figure 3a shows the total carbon footprint emission (CFE) for scenarios A and B. This comparison presents the overall WLCA comparison for the same residential building under two different inventory construction approaches. Scenario’s A total CFE is calculated to be 563.9 kg CO2e/m2, with product and energy use stages representing 52.9% and 42.8% of the total emission respectively. Scenario B has a total CF of 784.4.0 kg CO2e/m2, with product and energy use stages representing 42.9% and 53.8% of the total emission respectively. Overall, Scenario B is substantially higher than Scenario A, confirming that the final WLCA result is highly sensitive to the source and structure of the input data. It also shows a change in the relative contribution of life cycle stages: while Scenario A is dominated by the product stage, Scenario B is dominated by the energy use stage. This shift is relevant because it indicates that differences between scenarios affect not only the total magnitude of emissions but also the identification of the main carbon hotspots over the building life cycle.
Figure 3.
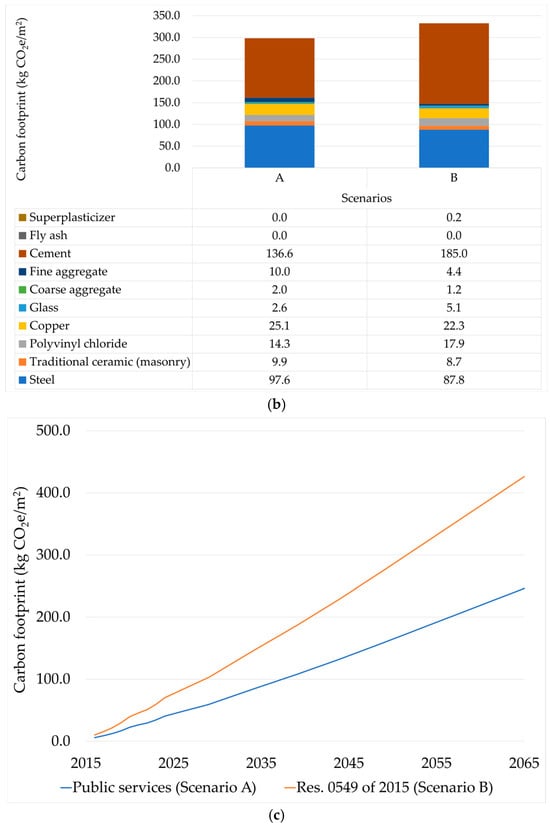
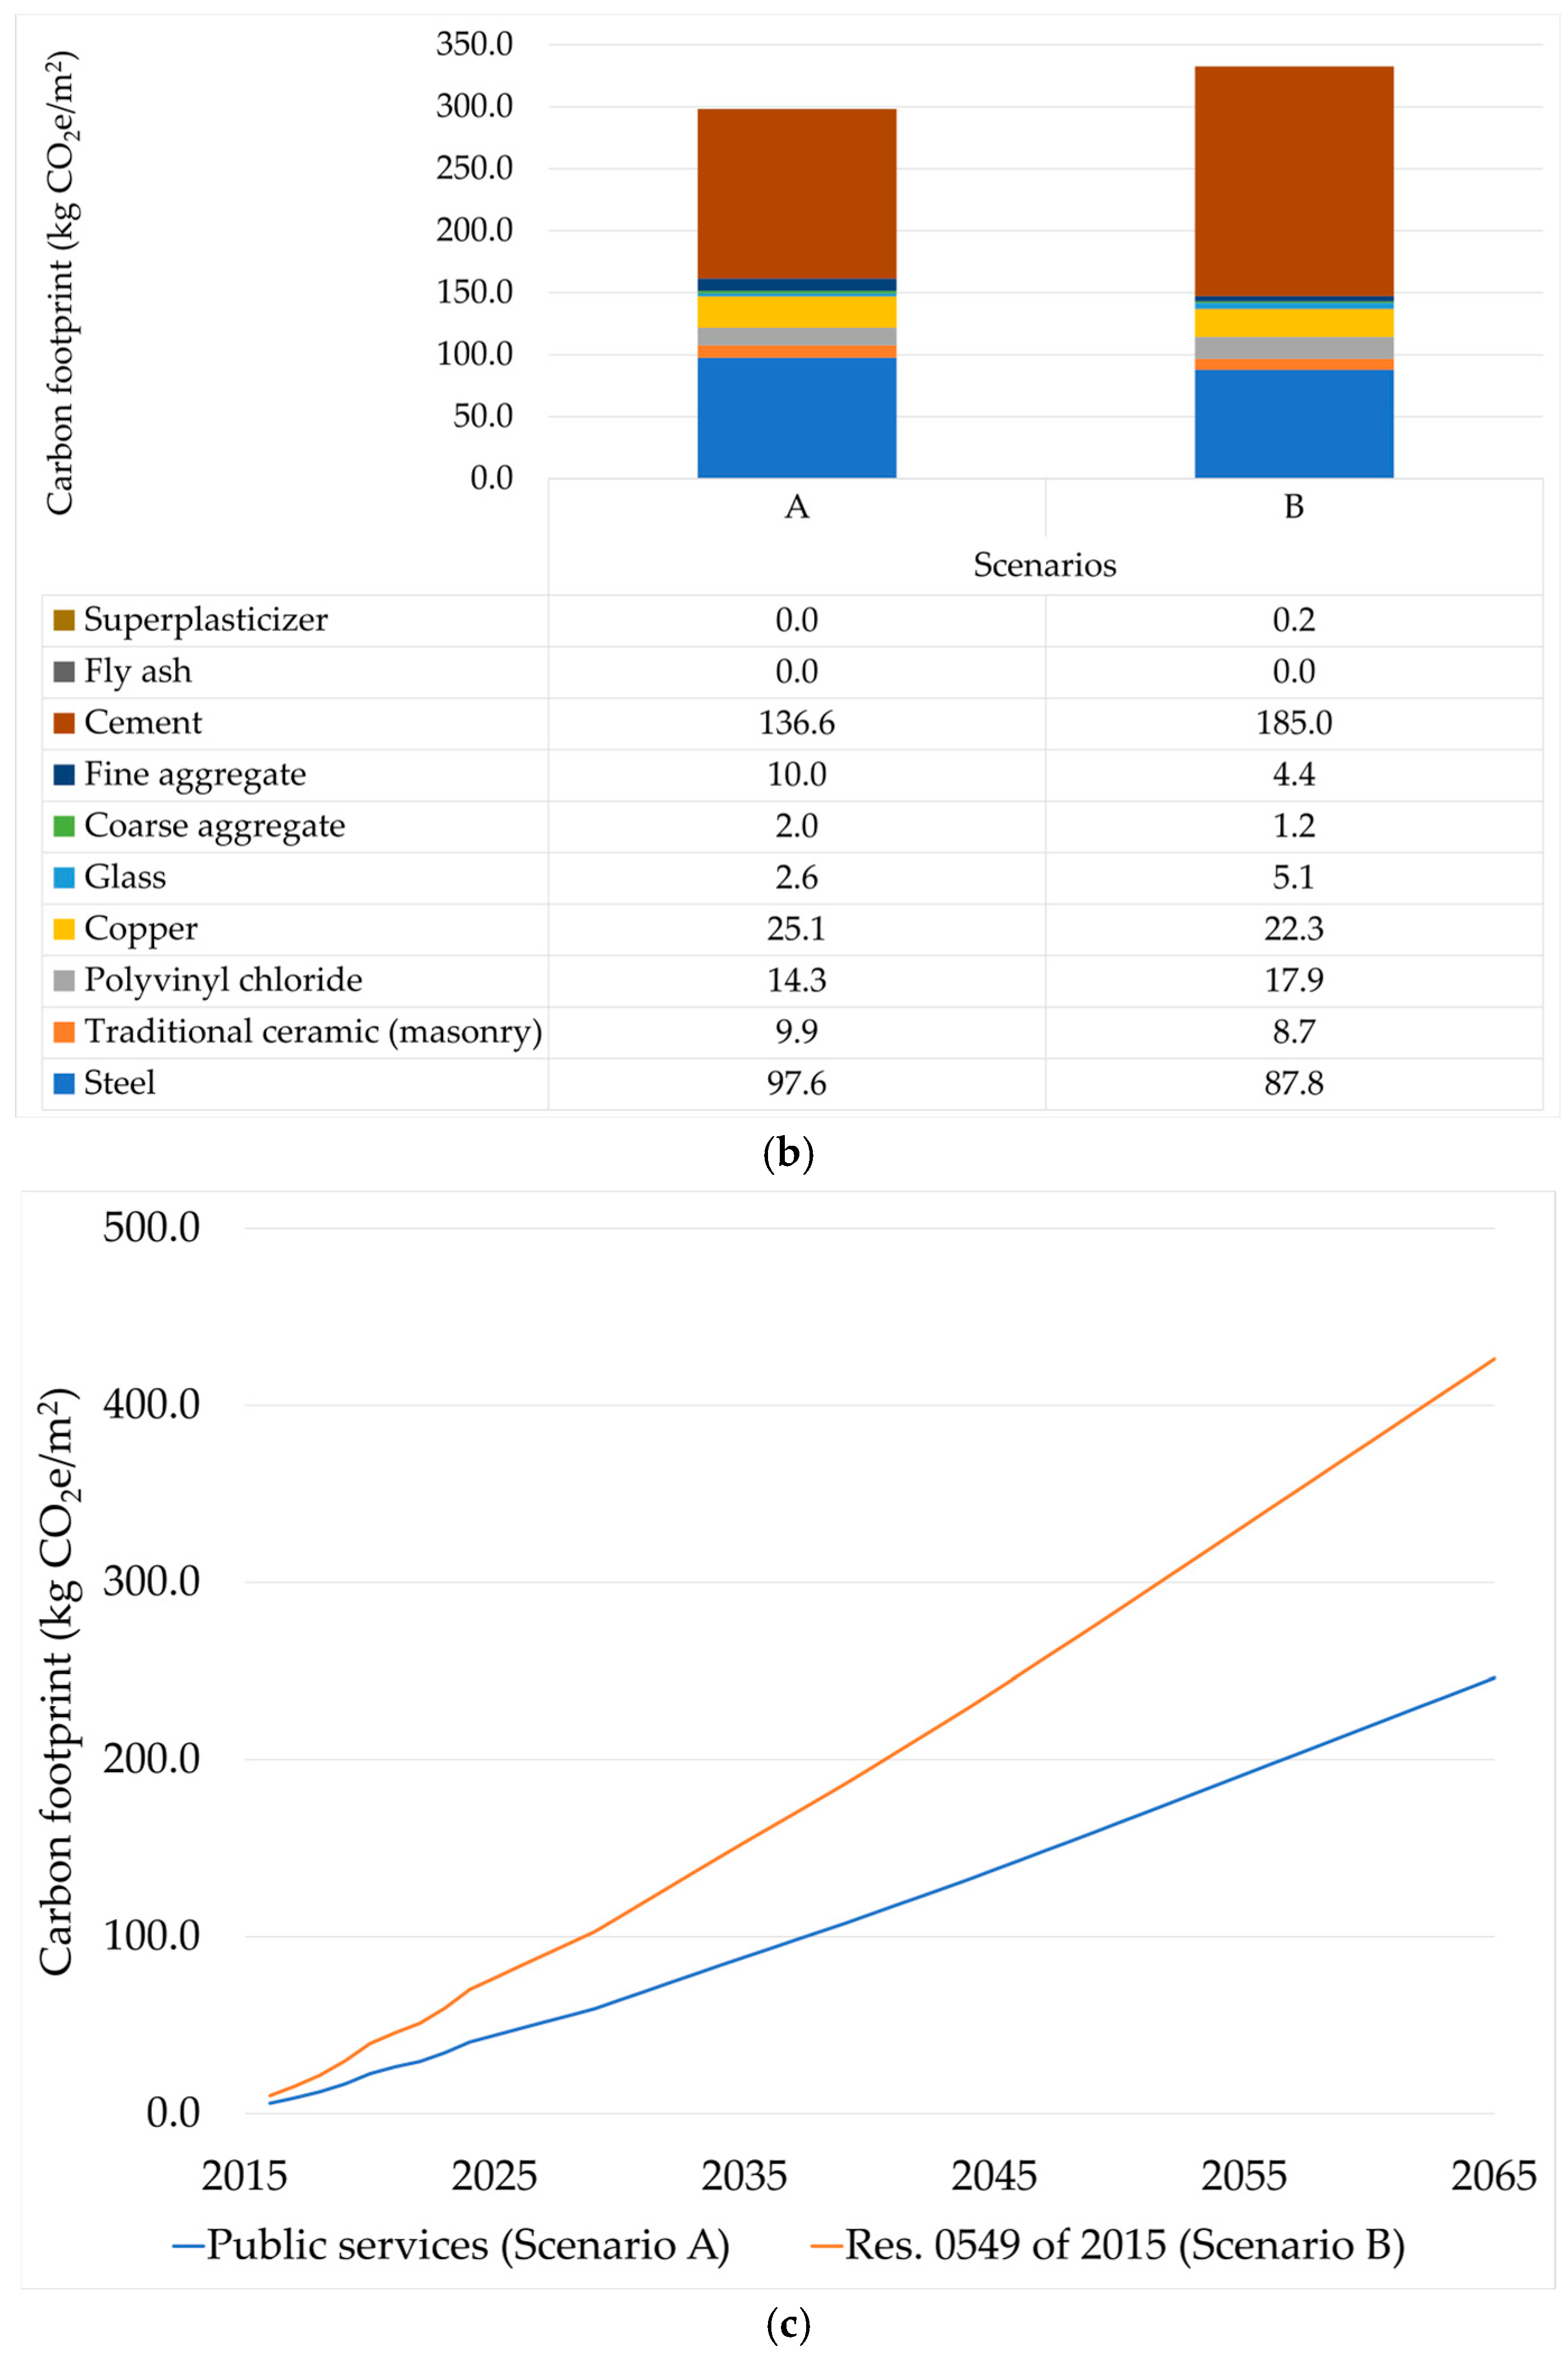
(a) Carbon footprint (kg CO2e/m2) for scenarios A and B. (b) Detail for product phase. (c) Detail for operational energy use phase.
Figure 3b shows the (CFE) associated with different construction materials used in the production stage for both scenarios. Scenario B with 332.6 kg CO2e/m2 presented an increase of 11.6% compared to Scenario A. This stage-level result helps explain how the difference observed in Figure 3a begins to emerge from the product stage itself, even before the operational stage is considered. Although multiple studies have proposed strategies to reduce the embodied carbon of these materials through clinker substitution, recycled steel content, alternative binders, and optimized structural design [41,42,43,44,45,46], cement and steel remain the dominant contributors in this case study because of their high mass intensity and central role in the reinforced-concrete structural system. Their contributions correspond to 24.2% and 17.3% for Scenario A and 23.8% and 11.3% for Scenario B, respectively. This material profile indicates that the embodied-carbon profile of the building is strongly concentrated in conventional reinforced-concrete materials, particularly cement and steel, which remain the dominant contributors regardless of the inventory pathway used. For the construction stage, Scenario B presented an increase of 4.9% with 25.6 kg CO2e/m2 compared to Scenario A, with this being a minor difference between them considering the established boundaries and scope in transport and construction modules. The main contribution is given by the intermunicipal transport of aggregates (from Bello, La Estrella, and Girardota to the construction project) and the interdepartmental transport of cement (from Puerto Nare and Río Claro to the construction project). Despite having a high intensity of use of materials corresponding to the aggregates, the fact of having them sourced from an intermunicipal region reduces the amount of generated emissions. In this sense, the increase in Scenario B is not explained only by the total amount of materials, but also by differences in material composition, mix design assumptions, and the interaction between quantities and emission factors within the inventory.
Figure 3c shows the results from the operational energy use stage. Scenario B with 426.2 kg CO2e/m2 is 73% higher than Scenario A. This operational-stage difference represents the largest divergence between scenarios. The residential building was not designed with regulatory criteria for sustainability through its operation; however, Resolution 0549 of 2015 [39] took this criteria for its formulation with the base line being the consumptions of the year 2013, for which the comparison was expected to be similar. However, Lagos [47] reported that the baseline data in Resolution 0549 overestimates real consumption and proposed that the calculation data should be based on the last consumption by the user. Accordingly, the higher value obtained for Scenario B suggests that the use of the regulatory baseline produces a substantially higher operational-carbon estimate than the value obtained from utility-reported consumption in Scenario A. This result reinforces that, for the present case study, the choice of operational data source has a stronger influence on total CFE than the differences observed in the product and construction stages.
3.3. Comparison of Scenarios for Concrete
For the product stage, the difference between scenarios suggests inconsistencies in how material quantities were consolidated and reported in Construction Company Z’s management, in addition to how material quantities used in the building were reported, particularly for concrete-related inputs. Table 2 presents the concrete mix design reported by the company for the construction of the residential building, according to the information reported by the construction company; two types of concrete mixing design, CC′ and CC″, were used. Table 3 presents the amount of concrete used in Scenarios A and B. As observed and contrary to the calculated CFE, Scenario A has a higher concrete volume with 3250.2 m3 compared to 3222.7 m3 from Scenario B. However, because both scenarios were constructed from different inventory-generation pathways, this comparison should not be interpreted as a direct one-to-one match between supplied material totals and drawing-derived installed-design quantities. Scenario A reflects the concrete volume reported through the company’s internal records and may therefore include over-ordering, pumping losses, on-site wastage, and ancillary uses captured during construction. Scenario B, in contrast, was derived from quantities measured from the drawings and converted through the specified mix designs and contractor-provided wastage assumptions; therefore, it is closer to an installed-design estimate than to a delivery log.
Table 2.
Concrete mix design.
Table 3.
Comparison between scenarios A and B for concrete quantities of Project Z Building II.
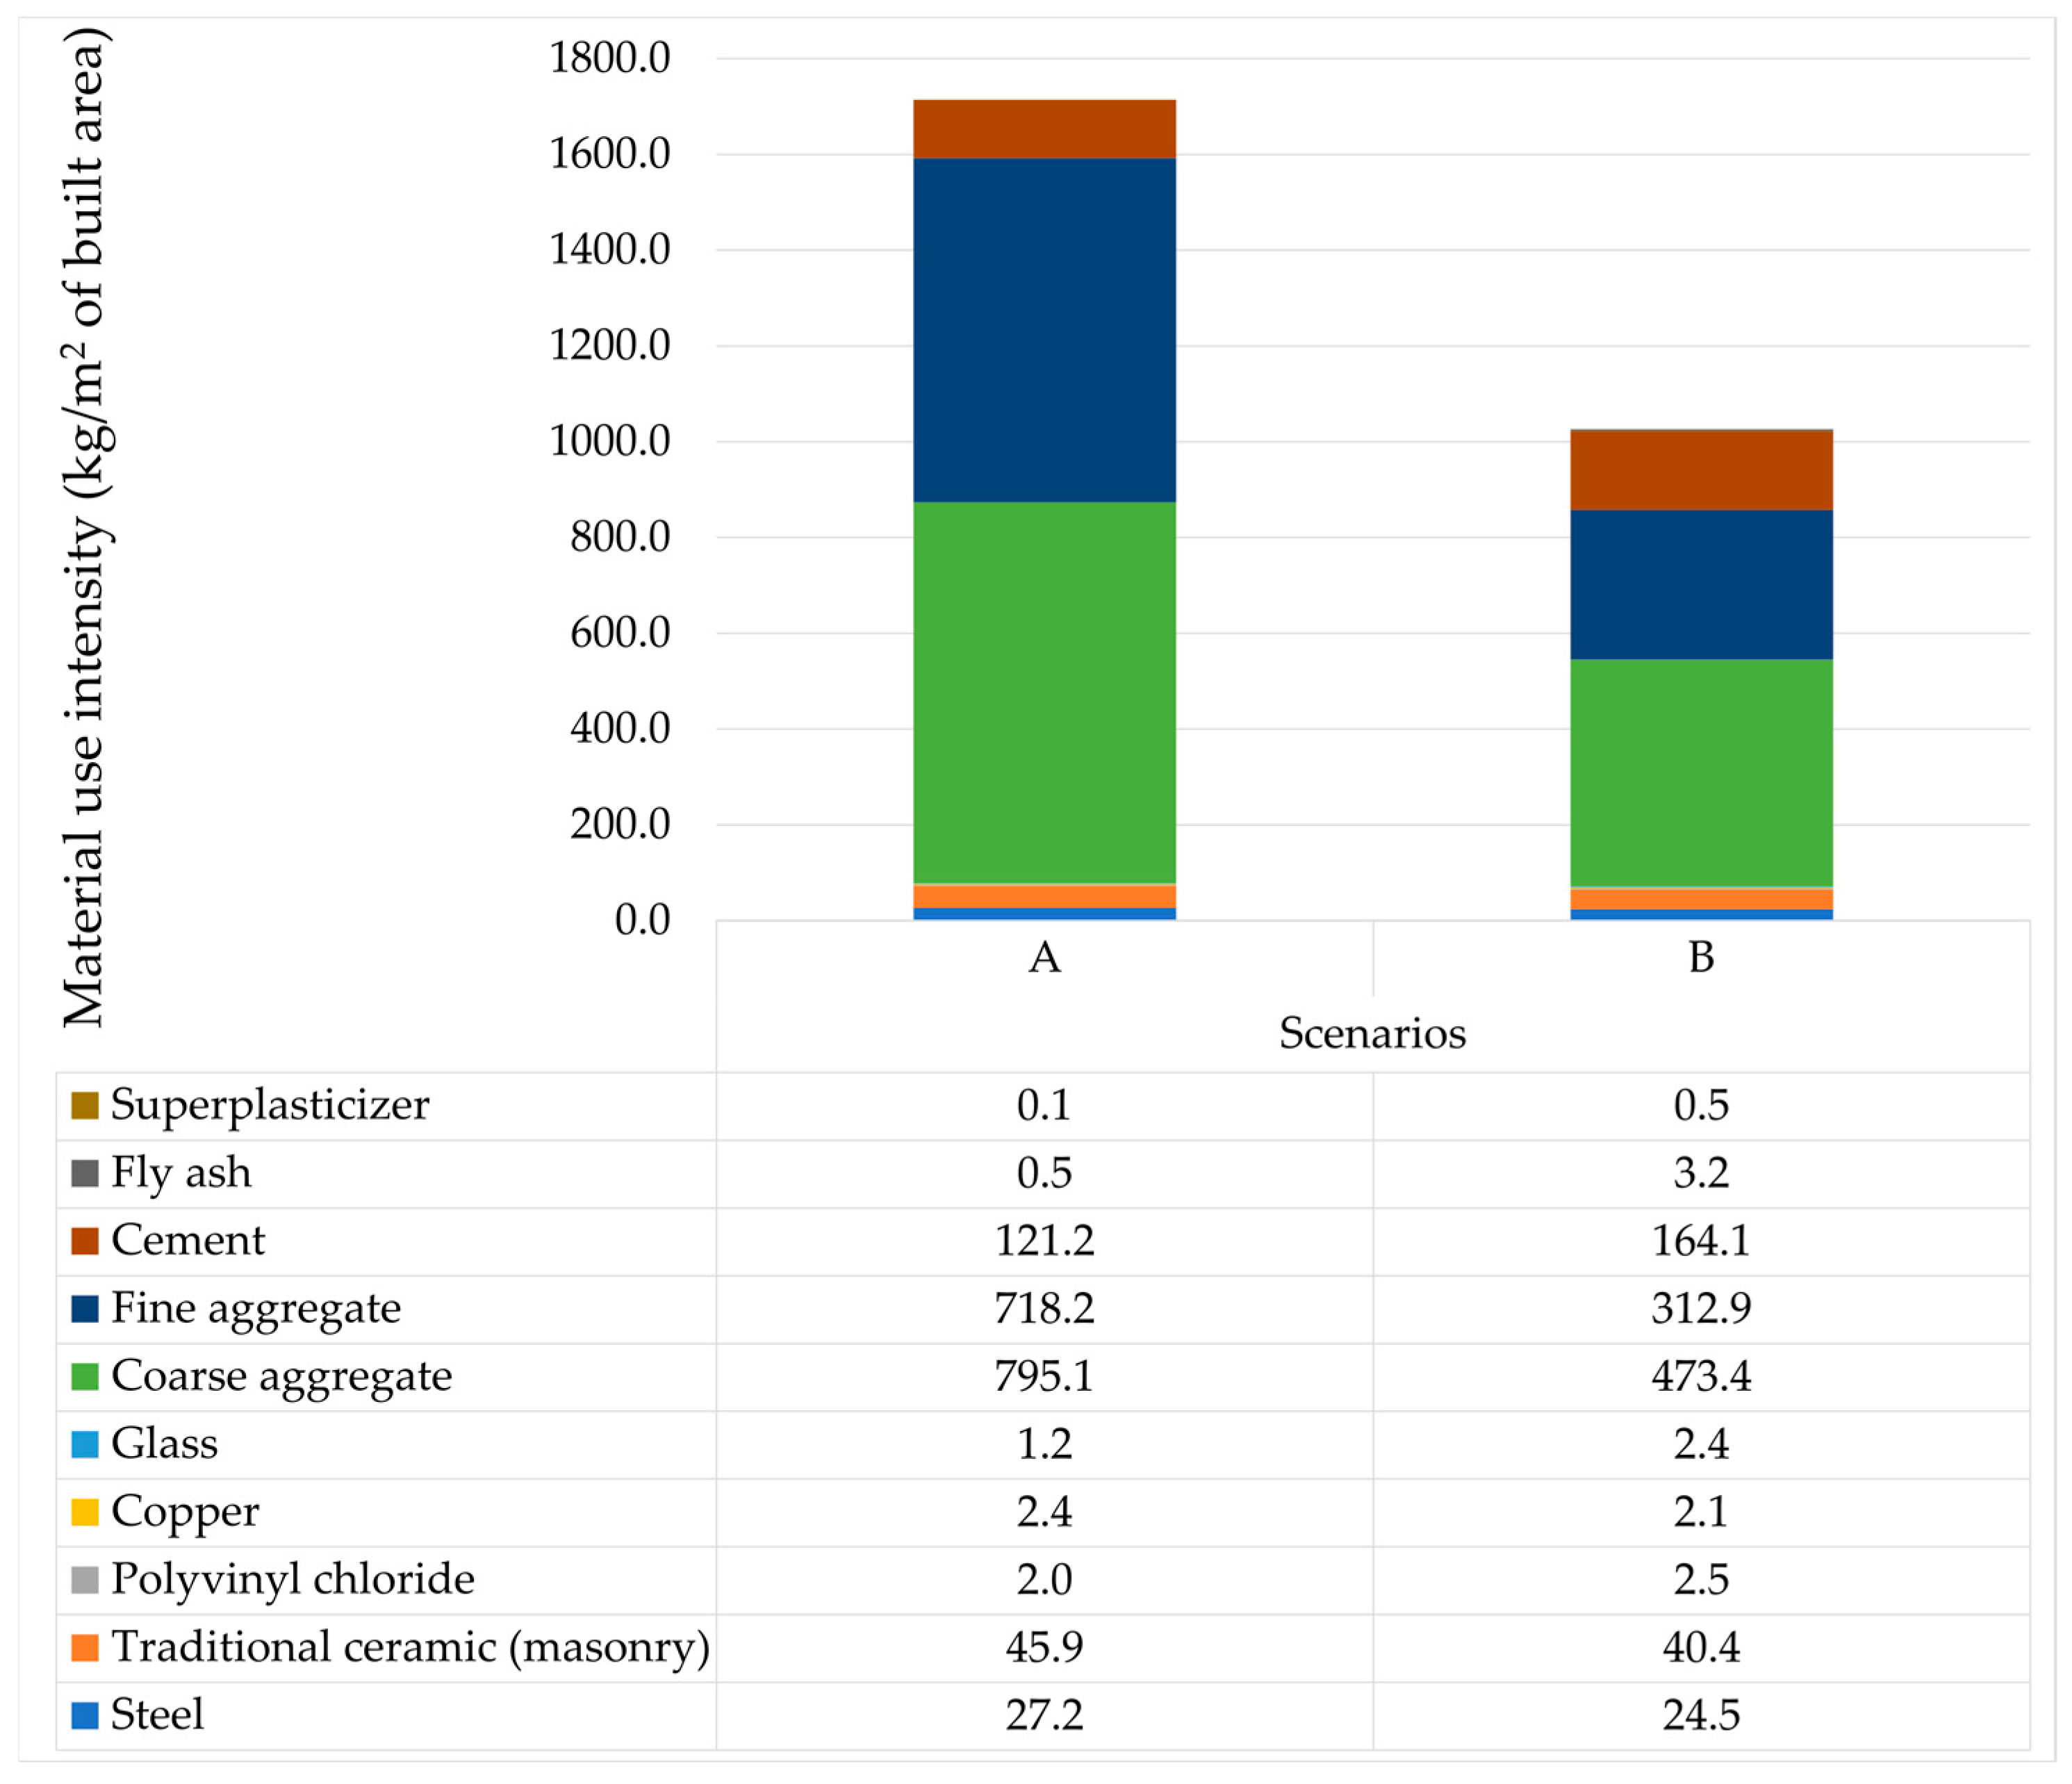
Figure 4 presents the intensity of material per square meter for both scenarios. Scenario B shows a higher intensity with cement with 164.1 kg/m2 compared to the 121.2 kg/m2 from Scenario A. However, the opposite happens to the intensity of materials for fine and coarse aggregate, adding a total of 1513.3 kg/m2 for scenario A and surpassing more than 727 kg/m2 to Scenario B. This indicates that the discrepancy between scenarios is not explained only by total concrete volume, but also by differences in material composition and mix proportions within the reported inventories. In other words, the slightly higher concrete volume in Scenario A does not contradict the higher cement intensity observed in Scenario B, because the two scenarios differ not only in total quantity but also in the balance between cement and aggregates. Based on concrete mix design, these differences imply substantial variations of 503.8 kg/m2 and 584.8 kg/m2 for coarse and fine aggregate respectively. These differences directly affect the CFE calculation, since cement has a much higher emission factor than aggregates, consequently reinforcing the need for more traceable quantity reporting and clearer material balance reconciliation in construction WLCA studies.
Figure 4.
Intensity of material per square meter for Scenarios A and B of Project Z Building II.
4. Discussion
The results presented in Section 3.2 and Section 3.3 suggest that the differences observed between scenarios should not be interpreted merely at face value but rather as structurally embedded data-management effects. These discrepancies reflect how activity data are generated, consolidated, and verified throughout project workflows. In the Colombian context, systematic under-reporting mechanisms—rather than random inaccuracies—frequently explain divergences between “reported” and “estimated” stock levels. Many companies still lack standardized and auditable templates that integrate procurement (purchase orders and invoices), logistics (delivery notes/remissions), site consumption (batch tickets, pour logs, rebar cutting lists), and waste flows (hauling manifests). Material flow reporting is further constrained by internal documentation formats primarily designed for cost control and billing instead of environmental accounting, potentially leading to artificially reduced embodied carbon results in modules A1–A3 and, to a lesser extent, A4–A5. This distortion is compounded by the absence of routine third-party quantity audits and by the lack of a nationally enforced Monitoring, Reporting, and Verification (MRV) system comparable to those operating in other regulated environmental domains. Consequently, inventories based on internal management-system records may paradoxically report lower emissions than drawing-based or engineering-estimate approaches, even when actual material consumption and construction and demolition waste (CDW) generation are likely higher. The discrepancy observed is consistent with an “information asymmetry” pattern: actors controlling primary records (contractor/suppliers) also controls quantities consolidation and disclosure, while verifiers (designer/researcher/regulator) often lack access to traceable supporting evidence. This highlights the potential role that sector leaders and industry bodies, such as Cámara Colombiana de la Construcción-CAMACOL, could assume by promoting standardized reporting templates, minimum evidence requirements (e.g., batch tickets for concrete, delivery receipts for rebar, invoices with traceable units), and voluntary assurance schemes that regulators could later formalize. In the absence of such sector-wide guidance, information sources remain fragmented, rendering WLCA outcomes highly sensitive to the origin and governance of activity data beyond methodological design alone.
The material level patterns observed for cement, steel, and ceramic brick indicate that multiple minor reporting gaps can cumulatively generate a meaningful difference in A1–A3 outcomes. For reinforced concrete, under-reporting may rise when an internal database only records the theoretical quantities from structural drawings or supplier billed tonnage, excluding additional reinforcement required for clash resolution, congestion, or constructability adjustments, offcuts and scrapped material. Where steel is procured through multiple subcontractors or bundled contracts, quantities may be aggregated and imperfectly allocated across projects, introducing systematic bias. For ceramic brick masonry, discrepancies may rise between architectural take-offs and actual quantities due to breakage rates, workmanship variability, layouts modification during construction, and differences between nominal and actual unit dimensions which affect unit counts per m2. When internal reporting relies on simplified templates that summarize “masonry” at the cost-code level, ceramic brick quantities may be merged with mortars, blocks, or substitute units, potentially lowering the reported apparent mass of ceramic products. The discrepancy observed for concrete, steel, and ceramic brick data is unlikely to result from isolated errors; rather, it reflects the cumulative under-reporting of marginal material flows across multiple documentation interfaces. This pattern is reinforced by the absence of standardized and traceable reporting protocols.
Similarly, the relatively small divergence observed between scenarios for A4–A5 does not preclude the presence of systematic bias where transport and on-site energy flows are not documented with sufficient temporal and quantitative resolution to ensure WLCA representativeness. At this stage, the apparent contradiction with “typical trends” may also be attributable to the tracking architecture applied to transport and on-site energy flows, where fuel consumption and transport services are recorded as lump-sum cost entries without consistent distance–load traceability. A4 results may reflect planned logistics rather than realized operations, thereby excluding additional trips, partial loads, or remobilizations. Although standardized haulage records and independent third-party verification would mitigate this distortion, such practices are not yet systematically institutionalized within the sector. The divergence observed in B6 highlights the structural sensitivity of operational outcomes to data source variability when formal oversight and enforcement mechanisms remain weak. In the absence of a consolidated Monitoring, Reporting, and Verification (MRV) ecosystem comprising metered datasets, standardized reporting architectures, and independent verification makes operational baselines become inherently uncertain and potentially misaligned with actual user behavior even where a regulation framework formally exists. Therefore, the B6 divergence should be interpreted not as a definitive indicator of operational performance but as a regulatory data sensitivity signal reflecting governance limitation in operational carbon accounting. Sector-level guidance from industry bodies such as the Cámara Colombiana de la Construcción (CAMACOL) and relevant public agencies could mitigate this vulnerability by establishing minimum operational data protocols, including metering requirements, standardized reporting templates, and verification procedures in order to link operational emissions to verifiable empirical evidence rather than fixed baselines with restricted empirical validation.
This same screening logic applies to the excluded modules B1–B5 and B7: although they were outside the scope because of insufficient local data, their potential contribution to total whole-life carbon is acknowledged as a source of downward bias in the absolute results and should be addressed in future Colombian case studies with more complete monitoring records. Accordingly, the 37.9% difference between scenarios should be interpreted primarily as evidence of sensitivity to data source selection and baseline construction rather than as a statistically bounded uncertainty range. Future research should test alternative B6 trajectories, including efficiency improvement, equipment replacement, occupancy change, and grid decarbonization scenarios and, where richer datasets are available, complement scenario analysis with range-based uncertainty estimation or Monte Carlo simulation. Compared with published international and regional studies, the embodied product results obtained here (298.1–332.6 kg CO2e/m2 for A1–A3) fall close to the average construction materialization value reported by Luo et al. [48] for 78 office buildings in China (326.75 kg CO2e/m2), although direct equivalence should be treated cautiously because typology, structural system, and system boundaries differ. At the same time, the dominance of cement and steel observed in the present case is consistent with broader concrete building literature, where these materials repeatedly emerge as the principal embodied carbon contributors. The absolute whole-life values reported in this study (563.9–784.4 kg CO2e/m2 over 50 years) should also be read in light of international variation in building type and operational scope. For example, Wu et al. [13] reported 119.91 kg CO2e/(m2×y) for an office building in China, a much higher annualized intensity than the present case, which is consistent with the greater service intensity and longer operating hours of office and institutional uses. Likewise, Vasishta et al. [23] found that precast sandwich-panel systems can reduce global warming potential by about 48% relative to cast-in-place alternatives, reinforcing the importance of material system decisions, while Rodriguez et al. [24] showed in a tropical NZEB case from El Salvador that operational-stage burdens can shift substantially when low-energy design and renewable strategies are incorporated. Taken together, these comparisons suggest that the values obtained for Project Z are plausible within the broader WLCA literature but that their main scientific contribution lies less in defining a universal benchmark than in demonstrating how strongly inventory construction and data provenance can alter the reported result within one concrete-intensive residential case.
The concrete-specific discrepancies identified in Section 3.3 and Figure 4 indicate that inconsistent constituent allocation can occur when concrete is considered as a single procurement entry rather than a traceable set of mix-specific inputs that are reconciled against pour evidence. Such inconsistencies suggest is not merely the result of stochastic measurement variability but instead reflects structural deficiencies in how concrete-related information is generated, consolidated, and communicated across the project life cycle. Concrete as a composite material exhibits high embodied carbon sensitivity to the binder fraction (cement and any supplementary cementitious materials), while aggregates dominate its mass and volume. Consequently, even minor discrepancies in bookkeeping, specifically cement content (kg per m3), can substantially impact A1–A3 emissions. By contrast, significant deviations in aggregate quantities can disrupt the mass balance and may signal systemic data management deficiencies (e.g., incorrect unit conversions, incorrect material category assignments, or incomplete reporting of components). In practical terms, concrete reporting is often fragmented across diverse sources, including structural design quantities (derived from drawings), supplier documentation (such as batching tickets and delivery receipts), site logs (pour records, rejection/return notes, and pumping losses), and procurement summaries prepared for cost monitoring. The internal management system may prioritize cost-code aggregation over material traceability, resulting in a single recorded purchase item of “concrete” that does not preserve the separate constituents (cement, aggregates), or it may estimate constituent quantities based on assumed mix ratios rather than actual batching data. In this context, reporting cement on the basis of invoiced cement (or assumed cement dosage) becomes possible, while reporting aggregates on the basis of separate procurement streams that may not correspond exclusively to structural concrete also becomes possible. The findings here are consistent with a specific pattern, where one scenario implies increased cement requirements and the other implies significantly greater aggregate needs, despite similar overall concrete volumes. These findings support a concrete, actionable recommendation for improving data credibility in similar studies and for the construction sector more broadly: concrete quantities should be reconciled through a minimum evidence chain that includes poured volumes by element or pour event (site logs), supplier batching tickets indicating actual mix IDs (CC′, CC″) and delivered volumes, and a consistent method to derive constituent quantities (cement and aggregate mass) either directly from supplier-provided mix proportions or from verified plant records. Where such documentation is not available, the study should explicitly treat constituent splits as “assumed” and classify the resulting A1–A3 estimates as screening-level. Within the Colombian context described previously—limited datasets, weak EPD integration, and the absence of a consolidated MRV framework for operational baselines—this type of traceability protocol assumes heightened methodological relevance because it is one of the few feasible mechanisms for enhancing reproducibility, inventory transparency, and data lineage robustness without altering the numerical configuration of the case study.
5. Limitations and Future Research
The findings of this study should be interpreted in light of several limitations. First, the assessment was intentionally framed as a screening-level WLCA and excluded modules B1–B5 and B7 because reproducible local datasets were not available for maintenance, replacement, refurbishment, and operational water use. Second, the study relies on a single residential case, which limits statistical generalization even though it remains valuable for analytical comparison. Third, the long-term B6 projection was constructed from observed consumption and regulatory baselines without incorporating future technological innovation, equipment replacement, or grid decarbonization pathways. Finally, although the comparison between scenarios functions as a sensitivity exercise, the available evidence did not support a full probabilistic uncertainty model. Future research should therefore expand the evidence base in four directions: multi-building comparisons across Colombian residential typologies; more complete monitoring records for maintenance, replacement, water use, and end-of-life processes; range-based or probabilistic uncertainty analysis for operational emissions and emission factors; and standardized data-governance and traceability protocols that allow inventories to be independently verified across the project life cycle.
6. Conclusions
When viewed against international case studies, the reported values appear plausible for a reinforced-concrete residential building, but they also confirm that cross-study comparisons must be interpreted with caution because building typology, system boundaries, service life assumptions, and operational profiles can change the magnitude and distribution of emissions substantially.
This study shows that whole-life carbon results for the same residential building can vary substantially depending on data provenance and inventory construction. Scenario A yielded 563.9 kg CO2e/m2, while Scenario B reached 784.4 kg CO2e/m2, a difference of 37.9%. The largest divergence occurred in operational energy use (246.2 vs. 426.2 kg CO2e/m2), while the product stage also increased from 298.1 to 332.6 kg CO2e/m2.
Across both scenarios, cement and steel were the main contributors to embodied emissions, confirming the importance of material optimization in reinforced concrete housing. Overall, the findings indicate that reporting gaps, inconsistent quantity take-offs, and baseline misuse can materially distort WLCA outcomes; therefore, more traceable data management and auditable calculation procedures are needed to support reliable carbon assessments in Colombia and similar data-constrained contexts. Future studies should extend this comparison with scenario-based sensitivity testing and, when data quality permits, formal uncertainty analysis for long-term operational emissions.
These conclusions should be read together with the study limitations described above, particularly the screening-level scope, excluded use-stage modules, single-case design, and the absence of probabilistic uncertainty modeling.
Author Contributions
Conceptualization, Formal Analysis, Writing Original Draft, N.P.; Formal Analysis, Writing Original Draft: J.Z. and A.M.; supervision K.Q., A.R. and L.Z. All authors have read and agreed to the published version of the manuscript.
Funding
This research received no external funding.
Institutional Review Board Statement
Not applicable.
Informed Consent Statement
Not applicable.
Data Availability Statement
The datasets generated during and/or analyzed during the current study are available from the corresponding author on reasonable request.
Acknowledgments
The authors would like to acknowledge the support received from the Civil Construction Program, Faculty of Architecture and Engineering and Camacol-Antioquia for collecting the data used in this work.
Conflicts of Interest
The authors declare no conflicts of interest.
Abbreviations
The following abbreviations are used in this manuscript:
| AMVA | Metropolitan Area of the Aburrá Valley (Colombia) |
| AP | Apartment |
| CAMACOL | Cámara Colombiana de la Construcción (Colombia) |
| CC | Concrete mix |
| CDW | Construction and demolition waste(s) |
| CFE | Carbon footprint emission |
| EPD | Environmental Product Declaration |
| FECOC | Emission Factors of Colombian Fuels (Colombia) |
| FP | Fixed Points |
| GDP | Gross domestic product |
| GHG | Greenhouse gas |
| ISO | International Organization for Standardization |
| LCA | Life cycle assessment |
| LCI | Life cycle inventory |
| Minenergia | Ministry of Mines and Energy (Colombia) |
| Minvivienda | Ministry of Housing, City and Territory (Colombia) |
| MRV | Monitoring, reporting and verification |
| NSR | Colombian Earthquake Resistant Construction Regulations |
| NZEB | Nearly zero-energy building |
| PL | Parking lot |
| RICS | Royal Institution of Chartered Surveyors |
| RSP | Reference study period |
| SBTi | Science-Based Targets initiative |
| SC | Staircase |
| SIN | National Interconnected System (Colombia) |
| SMMLV | Colombian statutory monthly minimum wages |
| ST | Staircase |
| UN | United Nations |
| UNDP | United Nations Development Programme |
| UNE-EN | Una Norma Española |
| UPME | Mining and Energy Planning Unit (Colombia) |
| UR | Utility room |
| VIS | Social interest housing (Colombia) |
| VIP | Priority interest housing (Colombia) |
| WLCA | Whole-life carbon assessment |
References
- Huang, Z.; Zhou, H.; Miao, Z.; Tang, H.; Lin, B.; Zhuang, W. Life-Cycle Carbon Emissions (LCCE) of Buildings: Implications, Calculations, and Reductions. Engineering 2024, 35, 115–139. [Google Scholar] [CrossRef] [Scilit]
- Yue, T.; Liu, H.; Long, R.; Chen, H.; Gan, X.; Liu, J. Research trends and hotspots related to global carbon footprint based on bibliometric analysis: 2007–2018. Environ. Sci. Pollut. Res. 2020, 27, 17671–17691. [Google Scholar] [CrossRef] [Scilit]
- Onat, N.C.; Kucukvar, M. Carbon footprint of construction industry: A global review and supply chain analysis. Renew. Sustain. Energy Rev. 2020, 124, 109783. [Google Scholar] [CrossRef] [Scilit]
- Cordoba, G.; Irassar, E.F. Carbon footprint of reinforced concrete columns with and without supplementary cementitious materials. Int. J. Life Cycle Assess. 2023, 28, 800–812. [Google Scholar] [CrossRef] [Scilit]
- Labaran, Y.H.; Mathur, V.S.; Muhammad, S.U.; Musa, A.A. Carbon footprint management: A review of construction industry. Clean. Eng. Technol. 2022, 9, 100531. [Google Scholar] [CrossRef] [Scilit]
- Sabour, M.R.; Amiri, E.A.; Akbari, M.; Sadeghi-Sheshdeh, A. A bibliometric analysis of research trends in life cycle assessment of fresh concrete and mortar during 1997–2021. Environ. Sci. Pollut. Res. 2022, 29, 71894–71910. [Google Scholar] [CrossRef] [Scilit] [PubMed]
- Hammad, H.; Elhakim, Y.; Hossam, Y.; Mahmoud, M.; Ismail, T.; Fahim, I.S. A proposed framework for measuring direct and indirect carbon emissions in the operational phase of a construction project: A case study. Int. J. Sustain. Eng. 2023, 16, 224–235. [Google Scholar] [CrossRef] [Scilit]
- Gursel, A.P.; Shehabi, A.; Horvath, A. Embodied energy and greenhouse gas emission trends from major construction materials of U.S. office buildings constructed after the mid-1940s. Build. Environ. 2023, 234, 110196. [Google Scholar] [CrossRef] [Scilit]
- Bilgili, L.; Çetinkaya, A.Y. Environmental impact assessment of earthquake-generated construction and demolition waste management: A life cycle perspective in Turkey. Environ. Syst. Decis. 2023, 44, 424–432. [Google Scholar] [CrossRef] [Scilit]
- Bigolin, M.; Danilevicz, Â.D.M.F.; Weiss, M.A.; Filho, L.C.P.S. Sustainable New Product Development: A decision-making tool for the construction industry. Int. J. Sustain. Eng. 2021, 14, 618–629. [Google Scholar] [CrossRef] [Scilit]
- Mistri, A.; Dhami, N.; Bhattacharyya, S.K.; Barai, S.V.; Mukherjee, A. Biocement treatment for upcycling construction and demolition wastes as concrete aggregates. Mater. Struct. Mater. Constr. 2022, 55, 152. [Google Scholar] [CrossRef] [Scilit]
- Ma, W.; Hao, J.L.; Zhang, C.; Guo, F.; Di Sarno, L. System Dynamics-Life Cycle Assessment Causal Loop Model for Evaluating the Carbon Emissions of Building Refurbishment Construction and Demolition Waste. Waste Biomass Valorization 2022, 13, 4099–4113. [Google Scholar] [CrossRef] [Scilit]
- Wu, H.J.; Yuan, Z.W.; Zhang, L.; Bi, J. Life cycle energy consumption and CO2 emission of an office building in China. Int. J. Life Cycle Assess. 2012, 17, 105–118. [Google Scholar] [CrossRef] [Scilit]
- RICS. Whole Life Carbon Assessment for the Built Environment, 2nd ed.; Royal Institution of Chartered Surveyors (RICS): London, UK, 2023; Volume 2, Available online: https://www.rics.org/profession-standards/rics-standards-and-guidance/sector-standards/construction-standards/whole-life-carbon-assessment (accessed on 2 July 2024).
- Science Based Targets Initiative (SBTi); PricewaterhouseCoopers (PwC). Buildings Sector Science-Based Target-Setting Guidance. 2023. Available online: https://sciencebasedtargets.org/resources/files/SBTi_Buildings_Guidance_Draft_for_Pilot_Testing.pdf (accessed on 14 July 2024).
- EN 15978:2011; Sustainability of Construction Works—Assessment of Environmental Performance of Buildings—Calculation Method. CEN European Committee for Standardization: Brussels, Belgium, 2011.
- EN 17472:2022; Sustainability of Construction Works—Sustainability Assessment of Civil Engineering Works—Calculation Methods. CEN European Committee for Standardization: Brussels, Belgium, 2022.
- EN 17610:2022; Building Hardware—Environmental Product Declarations—Product Category Rules Complementary to EN 15804 for Building Hardware. CEN European Committee for Standardization: Brussels, Belgium, 2022.
- EN 15643:2011; Sustainability of Construction Works—Assessment of Buildings. CEN European Committee for Standardization: Brussels, Belgium, 2011.
- ISO 21931-1:2022; Sustainability in Buildings and Civil Engineering Works—Framework for Methods of Assessment of the Environmental, Social and Economic Performance of Construction Works as a Basis for Sustainability Assessment—Part 1: Buildings. ISO International Organization for Standardization: Geneva, Switzerland, 2022.
- ISO 21931-2:2019; Sustainability in Buildings and Civil Engineering Works—Framework for Methods of Assessment of the Environmental, Social and Economic Performance of Construction Works as a Basis for Sustainability Assessment—Part 2: Civil Engineering Works. ISO International Organization for Standardization: Geneva, Switzerland, 2019.
- ISO 21930:2017; Sustainability in Building Construction—Environmental Declaration of Building Products. ISO International Organization for Standardization: Geneva, Switzerland, 2017.
- Vasishta, T.; Mehany, M.H.; Killingsworth, J. Comparative life cycle assesment (LCA) and life cycle cost analysis (LCCA) of precast and cast–in–place buildings in United States. J. Build. Eng. 2023, 67, 105921. [Google Scholar] [CrossRef] [Scilit]
- Rodríguez, L.; Martínez, L.; Panameño, R.; París, O.; Muros, A.; Rodríguez, R.; Javier, R.; González, C. LCA of the NZEB El Salvador building, a model to estimate the carbon footprint in a tropical country. J. Clean. Prod. 2023, 408, 137137. [Google Scholar] [CrossRef] [Scilit]
- Segovia-Hernández, J.G.; Hernández, S.; Cossío-Vargas, E.; Sánchez-Ramírez, E. Tackling sustainability challenges in Latin America and Caribbean from the chemical engineering perspective: A literature review in the last 25 years. Chem. Eng. Res. Des. 2022, 188, 483–527. [Google Scholar] [CrossRef] [Scilit]
- Arvizu-Piña, V.A.; López, J.F.A.; González, A.A.G.; Alarcón, I.G.B. An open access online tool for LCA in building’s early design stage in the Latin American context. A screening LCA case study for a bioclimatic building. Energy Build. 2023, 295, 113269. [Google Scholar] [CrossRef] [Scilit]
- Pardo, N.S.; Penagos, G.L.; Acevedo, H. Impactos ambientales asociados a la huella de carbono y la energía incorporada del ciclo de vida de una edificación en Medellín. Inf. Constr. 2022, 74, e436. [Google Scholar] [CrossRef] [Scilit]
- Posada, H.M.; García-Suaza, A.; Londoño, D. The external effects of public housing developments on informal housing: The case of Medellín, Colombia. Pap. Reg. Sci. 2024, 103, 100004. [Google Scholar] [CrossRef] [Scilit]
- Ministerio de Ambiente Vivienda y Desarrollo Territorial. Reglamento Colombiano de Construcción Sismo Resistente NSR-10. Bogotá, Mar. 2010. Available online: https://minvivienda.gov.co/sites/default/files/normativa/0926%20%20-%202010.pdf (accessed on 4 July 2024).
- ISO 14040:2006; Environmental Management—Life Cycle Assessment—Principles and Framework. ISO International Organization for Standardization: Geneva, Switzerland, 2006.
- ISO 14044:2006; Environmental Management—Life Cycle Assessment—Requirements and Guidelines. ISO International Organization for Standardization: Geneva, Switzerland, 2006.
- UPME; PNUD; Ecoingeniería. Determinación de Propiedades Físicas y Estimación del Consumo Energético en la Producción, de Acero, Concreto, Vidrio, Ladrillo y Otros Materiales, Entre Ellos los Alternativos y Otros de uso no Tradicional, Utilizados en la Construcción de Edificaciones. Santiago de Cali, Colombia. 2012. Available online: https://docs.upme.gov.co/DemandayEficiencia/Doc_Hemeroteca/Informe_final_contrato_UPME_PNUD_ECOINGENIERIA.pdf (accessed on 2 July 2024).
- INCOMBUSTION. Consultoría Técnica Para el Fortalecimiento y Mejora de la Base de Datos de Factores de Emisión de los Combustibles Colombianos-FECOC. Medellín, Colombia. 2016. Available online: http://www.upme.gov.co/Calculadora_Emisiones/aplicacion/Informe_Final_FECOC.pdf (accessed on 26 February 2024).
- UPME. Cálculo del Factor de Emisión de Co2 del SIN. Available online: https://www.upme.gov.co/transicion-energetica-justa/cambioclimatico/calculo-del-factor-de-emision-de-co2-del-sin/ (accessed on 24 June 2024).
- Ecoinvent; Bases de Datos Versión 3.01; Ecoinvent: Zurich, Switzerland, 2013.
- Ji, S.; Lee, B.; Yi, M.Y. Building life-span prediction for life cycle assessment and life cycle cost using machine learning: A big data approach. Build. Environ. 2021, 205, 108267. [Google Scholar] [CrossRef] [Scilit]
- Alexander, M.; Beushausen, H. Durability, service life prediction, and modelling for reinforced concrete structures—Review and critique. Cem. Concr. Res. 2019, 122, 17–29. [Google Scholar] [CrossRef] [Scilit]
- Ministerio de Minas y Energía. Escenarios de Mitigación de Emisiones de Gases de Efecto Invernadero a 2030 y Carbono Neutralidad a 2050. Colombia. 2021. Available online: https://pigccme.minenergia.gov.co/public/uploads/web_documentos/61b8b1308832d.pdf (accessed on 2 July 2024).
- Ministerio de Vivienda Ciudad y Territorio. Resolución 549 de 2015. 2015. Available online: https://camacol.co/sites/default/files/Resoluci%C3%B3n%20549%20de%202015%20con%20Anexos.pdf (accessed on 2 July 2024).
- Almulhim, M.S.; Taher, R. Environmental impact assessment of residential building structural systems: A case study in Saudi Arabia. J. Build. Eng. 2023, 72, 106644. [Google Scholar] [CrossRef] [Scilit]
- Torabi, M.; Evins, R. Towards net-zero carbon buildings: Investigating the impact of early-stage structure design on building embodied carbon. Int. J. Life Cycle Assess. 2024, 30, 2374–2389. [Google Scholar] [CrossRef] [Scilit]
- Adesina, A. Recent advances in the concrete industry to reduce its carbon dioxide emissions. Environ. Chall. 2020, 1, 100004. [Google Scholar] [CrossRef] [Scilit]
- Chen, Y.; Fang, Y.; Feng, W.; Zhang, Y.; Zhao, G.X. How to minimise the carbon emission of steel building products from a cradle-to-site perspective: A systematic review of recent global research. J. Clean. Prod. 2022, 368, 133156. [Google Scholar] [CrossRef] [Scilit]
- Supriya; Chaudhury, R.; Sharma, U.; Thapliyal, P.; Singh, L. Low-CO2 emission strategies to achieve net zero target in cement sector. J. Clean. Prod. 2023, 417, 137466. [Google Scholar] [CrossRef] [Scilit]
- Barbhuiya, S.; Kanavaris, F.; Das, B.B.; Idrees, M. Decarbonising cement and concrete production: Strategies, challenges and pathways for sustainable development. J. Build. Eng. 2024, 86, 108861. [Google Scholar] [CrossRef] [Scilit]
- Kim, J.; Sovacool, B.K.; Bazilian, M.; Griffiths, S.; Lee, J.; Yang, M.; Lee, J. Decarbonizing the iron and steel industry: A systematic review of sociotechnical systems, technological innovations, and policy options. Energy Res. Soc. Sci. 2022, 89, 102565. [Google Scholar] [CrossRef] [Scilit]
- Lagos Bayona, F.J. Evaluación de la Resolución 0549 del 10 de Julio de 2015 en la Edificación y las Consideraciones Ausentes Para un Diseño y Construcción Sostenible. Master’s Thesis, Universidad Católica de Colombia, Bogotá, Colombia, 2017. Available online: https://repository.ucatolica.edu.co/server/api/core/bitstreams/e66c29e4-6669-4169-84f4-7f9fdbd221e4/content (accessed on 3 July 2024).
- Luo, Z.; Yang, L.; Liu, J. Embodied carbon emissions of office building: A case study of China’s 78 office buildings. Build. Environ. 2016, 95, 365–371. [Google Scholar] [CrossRef] [Scilit]

Disclaimer/Publisher’s Note: The statements, opinions and data contained in all publications are solely those of the individual author(s) and contributor(s) and not of MDPI and/or the editor(s). MDPI and/or the editor(s) disclaim responsibility for any injury to people or property resulting from any ideas, methods, instructions or products referred to in the content. |
© 2026 by the authors. Licensee MDPI, Basel, Switzerland. This article is an open access article distributed under the terms and conditions of the Creative Commons Attribution (CC BY) license.