


Abstract
Maintaining road infrastructure in underground mines is critical for ensuring efficient transportation, reducing fuel consumption, extending the lifespan of machines, and providing operator safety and comfort. At the same time, the operation of heavy machinery on uneven roads, and the presence of loose rock fragments make it impossible to keep roads in consistently good condition, necessitating continuous condition monitoring and appropriate maintenance planning. This paper proposes a framework based on a single inertial sensor mounted on a mining vehicle for road quality assessment and vehicle speed estimation. The developed methods have a hybrid character, combining the physical interpretability of inertial data with unsupervised AI-based techniques. The integrated analytical system, combining road surface quality assessment with vehicle speed analysis, serves as a decision-supporting tool for pinpointing road segments that are critical for maintenance, safety, transport efficiency, and machine wear. The proposed approach was validated using data collected from haul trucks operating under real-world conditions. The system has the potential to support more efficient and sustainable management of mine road maintenance by reducing unnecessary interventions, resource consumption, and the negative environmental and safety impacts associated with haulage operations.
1. Introduction
Ore haulage operations in underground mines begin with road-based transport. Wheel loaders are used to load haul trucks and transport the material over short distances. The loaded haul trucks then travel through the mine workings to the designated unloading point. This means that transport roads play a key role in underground haulage systems, although their configuration and operational characteristics may vary between mines. The geometry and structure of an ore deposit directly determine the layout of development workings and the selected mining method, and thus the characteristics of the underground road infrastructure. In deposits with a tabular form and gentle dip, such as the copper ore deposit exploited by KGHM Polska Miedź S.A., a room-and-pillar mining system is commonly applied, which leads to the development of an extensive network of workings with relatively small longitudinal and transverse gradients, resembling a regular city street grid. At the Olympias mine in northern Greece, a complex polymetallic deposit with a more intricate, lens-like geometry is exploited, which favors the use of the cut-and-fill mining method; the main haulage route is a spiral ramp several kilometers long with a gradient of up to about 15%, providing the primary access road between the surface and the production faces. Such differences in deposit geometry and mining method translate into distinct operating conditions for haulage equipment and different requirements for road maintenance, ranging from relatively flat, grid-like road layouts in stratiform deposits to long, steep ramps in mines with an extensive system of ramp-type access workings [1]. In addition to ore haulage, these roads are also used for transporting personnel and other mining machines to their workplaces. For this reason, proper management, planning, and maintenance of road infrastructure are of paramount importance.
1.1. The Importance of Road Surface Quality
One of the most critical factors in road maintenance is surface quality. Under harsh underground conditions, haul roads are often unpaved and rarely have smooth surfaces. Typically, they are characterized by numerous potholes, ruts, mud, surface damage, and scattered rock fragments.
1.1.1. Impact on Machine Durability
Mining equipment manufacturers make significant efforts to ensure that machines are sufficiently adapted to such conditions. Nevertheless, continuous exposure of vehicles to high dynamic overloads, vibrations, and impacts associated with travel over uneven surfaces leads to accelerated wear, component degradation, and an increased risk of sudden failures. Road irregularities generate impact forces that are approximately proportional to vehicle mass. These forces are transmitted from the tires to other components, such as the suspension, frame, and drivetrain, resulting in reduced service life of both tires and other vehicle components [2]. Tire wear has been addressed in [3], where the impact of road quality and operating conditions on tire life was investigated based on a Bogatyr Komir coal mine in Northern Kazakhstan. The study demonstrated that monitoring road surface conditions and optimizing operating parameters can significantly extend tire lifetime. The authors emphasized the environmental implications of tire wear, noting that approximately 30% of mining dump truck tires do not reach the service life specified by manufacturers. In turn, Ref. [4] addressed the problem of frequent joint failures in haul trucks, which lead to sudden breakdowns and prolonged downtimes. The analysis of dynamic overloads demonstrated that increased dynamic loads have a clearly negative effect on the durability and reliability of structural joints in self-propelled mining machines, in particular the bucket arm and articulation joint in loaders, the central articulation joint in haul trucks, and the drilling arm in drills and roof bolters. The overload level was found to be strongly dependent on the operating location and, consequently, on road conditions. Therefore, maintaining haul roads in good condition directly contributes to extending the service life of machinery and its components, thereby improving both the environmental and economic performance of mining operations.
1.1.2. Impact on Operator Safety and Comfort
Road surface quality is also closely related to safety, health, and operator comfort. Increased vibrations caused by driving on uneven terrain are transmitted to the operators’ bodies and are referred to as whole-body vibration (WBV). Exposure to WBV can lead to irreversible adverse health effects, including musculoskeletal disorders (particularly lower back pain), neuropsychological and sensory symptoms, as well as increased fatigue and drowsiness [5,6,7]. The assessment of WBV and its impact on humans is standardized in ISO 2631-5 [8]. In extreme cases, poor road conditions may result in sudden failures or accidents, posing a direct threat to the health and lives of workers inside or near the vehicle.
1.1.3. Impact on Transport Efficiency and Vehicle Speed
Road quality is further associated with transport efficiency. Beyond extreme cases involving failures and sudden stoppages that block haul roads and disrupt transport, surface conditions can also influence driving speed. Poor-quality road sections may force speed reductions to maintain safety or operator comfort, thereby decreasing haulage performance and potentially creating bottlenecks along the route. This effect is strongly influenced by driving style, as some operators may not reduce speed on deteriorated road sections. However, such behavior also entails negative consequences, since impact forces associated with road quality are estimated to increase exponentially with driving speed [2]. Consequently, machines are significantly more exposed to damage if operators fail to adapt speed to road conditions.
Vehicle speed is also affected by factors other than surface quality. Road geometry, sharp curves, increased gradients, and limited visibility are among the parameters that may necessitate speed adjustments, potentially hindering transport efficiency or reducing safety. Such sections may also require maintenance interventions, such as road widening or curve correction. Although not all geometric constraints can be improved, their analysis can support better road planning in the future. In this context, vehicle speed can be regarded as an indirect indicator supporting road maintenance and infrastructure planning.
1.2. The Automated Road Quality Monitoring
Maintaining road infrastructure in mines in appropriate conditions is, however, challenging and costly. It is generally assumed that the best economic outcomes are not achieved by maintaining roads in “perfect condition,” but rather by finding an optimal balance between road maintenance costs and vehicle operating costs [9]. Road condition assessment often relies on manual procedures and visual inspections, which are inherently subjective. Moreover, the condition of unpaved haul roads used by heavy machinery and exposed to rock spillage can change dramatically over short time periods. Preventive repair actions without prior inspection may generate high costs without delivering the expected improvements. Therefore, automated monitoring and data analysis capable of identifying road sections requiring priority maintenance or rock removal become essential for effective maintenance planning.
Outside the mining industry, particularly for public roads, automated pavement condition monitoring is well established, and numerous studies, methods, and technologies have been developed. The most commonly used parameter for assessing asphalt and concrete road condition is the International Roughness Index (IRI), derived from longitudinal road profile measurements [10,11]. Increasingly, however, specialized vehicles and equipment such as longitudinal profile analyzers, profilometers, or automated pavement profilers are being replaced by approaches using sensors installed in public transport vehicles, private cars, or even smartphones [12,13]. These response-based methods enable indirect road condition assessment, typically using accelerometers and GPS. For example, Ref. [14] utilized accelerometers, microphones, GSM radios, and GPS sensors in mobile phones to detect potholes, road irregularities, braking events, and horn usage. Accelerometer and GPS data combined with machine learning were applied in [15] to develop a pothole and anomaly detector, implemented in seven taxis operating in Boston. Supervised machine learning methods were also used in [16] to classify smooth roads, potholes, and deep transverse cracks based on smartphone accelerometer, gyroscope, and GPS data. In [17], statistical analysis of accelerometer and GPS data enabled the definition of threshold values for road quality assessment. An experimental study using an accelerometer to measure the roughness of a selected asphalt road was presented in [18], confirming the validity of the method at a constant vehicle speed of approximately 60 km/h. In [19], an Android smartphone accelerometer was combined with IRI and GPS data, with experiments conducted using both a car and a motorcycle, demonstrating higher accuracy for the car.
Another category of studies involves the use of ground-penetrating radar (GPR) to assess physical and electromagnetic properties of road structures [20]. Image-based approaches have also been investigated. For instance, Ref. [21] applied a convolutional neural network to classify road images based on surface quality using datasets containing examples of good and damaged asphalt roads, as well as unpaved roads with and without potholes. Similarly, Ref. [22] employed convolutional neural networks with satellite imagery from the United States and Nigeria to perform three-level road quality classification. In [23], Street View images were analyzed using support vector machines (SVM) to identify the location and size of road cracks.
Far fewer studies address automated road quality assessment in underground mining environments, where specific operating conditions limit the direct applicability of methods developed for public roads. In [24], a method based on the dynamic equilibrium of the unsprung mass and haul truck response was tested for detecting road defects in terms of type and size, requiring detailed vehicle models, particularly of tires and suspension systems. A different approach was proposed in [25], where road condition identification relied exclusively on artificial neural networks and was tested in real mining conditions using a haul truck and a small utility vehicle. Vertical acceleration data combined with vehicle speed and payload information were used, and the results demonstrated effective detection of visible road defects, with higher accuracy achieved at higher vehicle speeds.
1.3. Motivation and Contribution of the Proposed Approach
As shown, inertial data can be effectively used to estimate road surface quality. However, underground mines typically feature unpaved roads, for which IRI does not fully apply, and no equivalent standardized indicator exists. Additionally, response-based methods must account for vehicle characteristics and driving speed, often resulting in approaches tailored to specific vehicle types or trained to detect particular road features. Such methods typically require accurate vehicle models or extensive training datasets containing examples of various road defects. The limited number of studies conducted in mining environments and the lack of standardized assessment methods indicate the need for further research. Moreover, response-based approaches require knowledge of vehicle speed or operation at constant, preferably high speeds, which is not feasible during standard mining operations. At the same time, direct access to reliable vehicle speed measurements is not always available. In many cases, it is implicitly assumed that speed information can be obtained from onboard monitoring systems or GPS; however, in underground conditions, GPS cannot be used, and mining vehicles are often not equipped with monitoring systems that provide consistent and easily accessible speed data. As a result, the primary source data required for speed-dependent analyses may simply be unavailable.
These considerations motivated the development of a universal decision-support system for mine road maintenance based on road quality assessment and vehicle speed estimation using only a low-cost IMU sensor [26]. The system first estimates vehicle speed using accelerometer and gyroscope data, applying a control-point-based correction to reduce noise and sensor drift. Road quality assessment aims to classify road segments into three categories—good, medium, and bad—using an unsupervised machine learning-based method and vertical acceleration data. The unsupervised approach ensures transferability to other locations and vehicles without the need for labeled training data. The method accounts for additional factors influencing vertical acceleration, such as the machine’s natural vibrations, driving speed, and payload.
Inertial data also enable the reconstruction of vehicle trajectories, thereby linking road quality assessment to specific physical road segments. Additionally, the data allow differentiation between loaded and unloaded vehicle states. As a result, the proposed system is fully independent of external measurement systems and relies solely on a single low-cost IMU sensor. Furthermore, the combined analysis of road quality and vehicle speed enables the detection of operationally inefficient or potentially hazardous road sections requiring priority maintenance. The relationship between road quality and vehicle speed was also analyzed to verify the hypothesis that poor-quality road sections may reduce haulage performance. The experiments, methods, and analyses presented in this study were conducted within the NetHelix project [27], which aims to promote sustainable and responsible mining through environmentally friendly machinery, innovative extraction technologies, and enhanced worker safety.
The paper is structured as follows. The section entitled Materials and Methods describes the measurement setup and experiments conducted to collect the data, followed by detailed descriptions of the vehicle speed estimation and road quality assessment methods. The section entitled Results presents representative outcomes visualized along three-dimensional vehicle trajectories and includes an analysis of critical road sections and observed data relationships. The Section entitled Discussion summarizes the findings and discusses the implications of the proposed methods for sustainable mining. At the end of the paper, there are conclusions and further directions of work.
2. Materials and Methods
To enable the monitoring and maintenance of haulage roads, two methods based exclusively on inertial data measured using an IMU sensor (x-io Technologies, Bristol, UK) mounted on operational vehicles were developed: a vehicle speed estimation method and a road quality assessment method. Road quality is a key parameter enabling predictive management of haulage road maintenance in mining operations. Vehicle speed serves a dual role: it supports accurate road-quality assessment from inertial data by accounting for speed-dependent vibrations, and it is an indirect indicator that enables the identification of road sections that influence haulage performance due to surface condition, geometry, or other factors.
The developed methods have a hybrid character, combining the physical properties of data with unsupervised machine learning–based methods. This combination is particularly important for inertial data, which have a clear physical interpretation but are simultaneously affected by errors arising from measurement noise and sensor drift. The application of AI-based methods enables adaptive modeling of complex, nonlinear relationships in the data and improves the robustness of the estimation against measurement disturbances that are difficult to describe explicitly using classical physical models.
2.1. Measurement Method
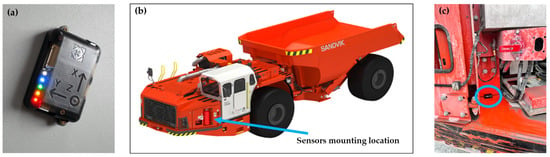
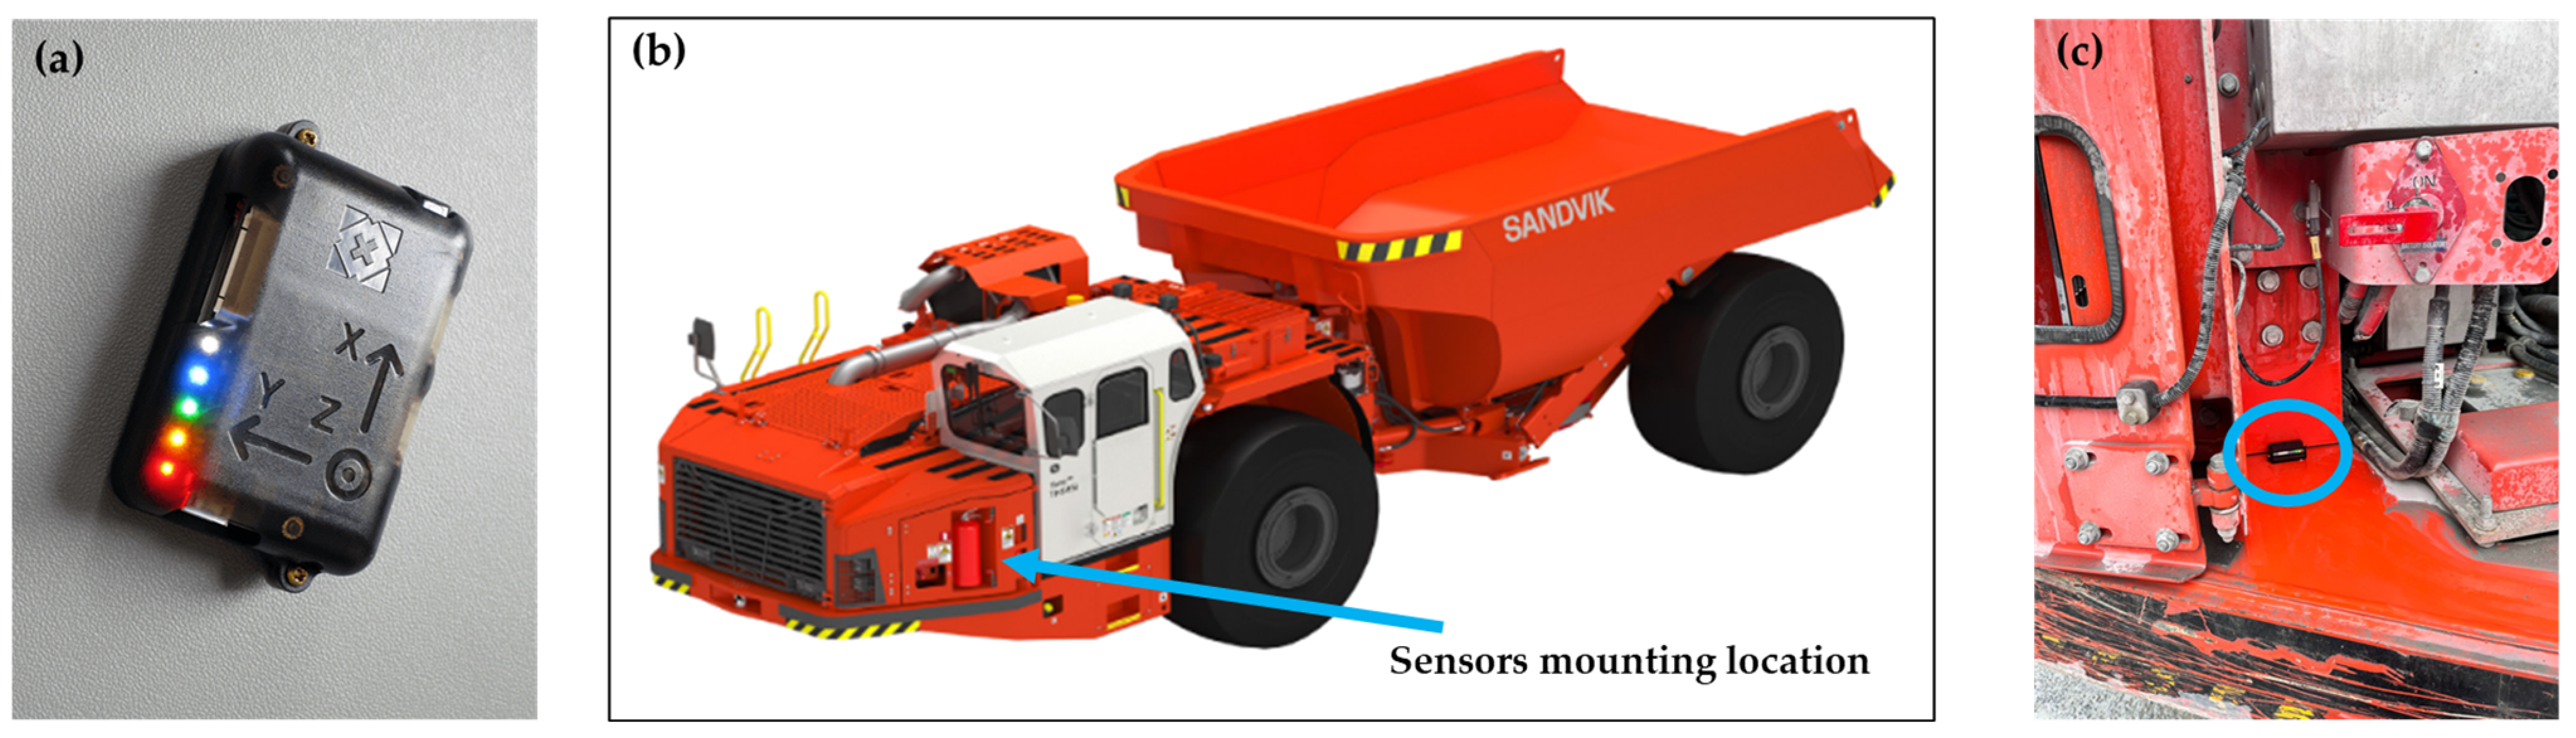
The data used for the development of the proposed methods and subsequent analyses were acquired using a non-invasive IMU sensor mounted on haul trucks. The sensor (Figure 1a) is equipped with a tri-axial accelerometer, gyroscope, and magnetometer, and enables measurements at a sampling frequency of 400 Hz. It includes an internal power supply and a Wi-Fi module, allowing for straightforward data transmission. The sensor was rigidly mounted on the machine, positioned on the front part of the vehicle frame in front of the operator’s cabin. (Figure 1c). Measurements were conducted using three different haul trucks (Figure 1b), operated by different drivers during their standard haulage operations. The experiment took place at the Olympias Mine, located in Northern Greece. At this site, the haulage route consists of a spiral ramp connecting the ore body with the surface, over 3 km long. Three, six, and eight complete operating cycles were recorded for each vehicle, respectively, including loading operation, travel with a full cargo box, unloading operation, and return trip with an empty cargo box. A total of 17.5 h of signal duration was recorded.
Figure 1.
(a) The IMU sensor, (b) illustration of the haul truck with the sensor mounting location indicated, and (c) photo of the sensor mounted on the machine.
2.2. Speed Estimation
In theory, vehicle speed can be estimated directly from accelerometer measurements acquired on the machine. The measured linear acceleration could be integrated to obtain velocity. In practice, the resulting estimate is affected by significant errors caused by measurement noise and sensor drift. Therefore, a method that reduces the influence of these factors on the estimation result is required. To address this issue, a correction method based on control points was adopted [28,29]. The underlying assumption of this approach is the identification of moments during vehicle operation at which speed can be estimated using an alternative, more accurate method. Using these control points, the initial speed estimated from the accelerometer can be rescaled and corrected. One of the primary control points used in this study is a vehicle stop, during which the speed is, by definition, equal to zero. During standard haul truck operation in a mine, the vehicle remains stationary for extended periods during loading and unloading. Shorter stops also occur during driving, for example, when two vehicles pass each other on narrow road sections. A second type of control point utilized in this work consists of vehicle turns, during which centripetal forces act on the machine, allowing speed to be estimated using gyroscope and accelerometer measurements.
2.2.1. Control Points
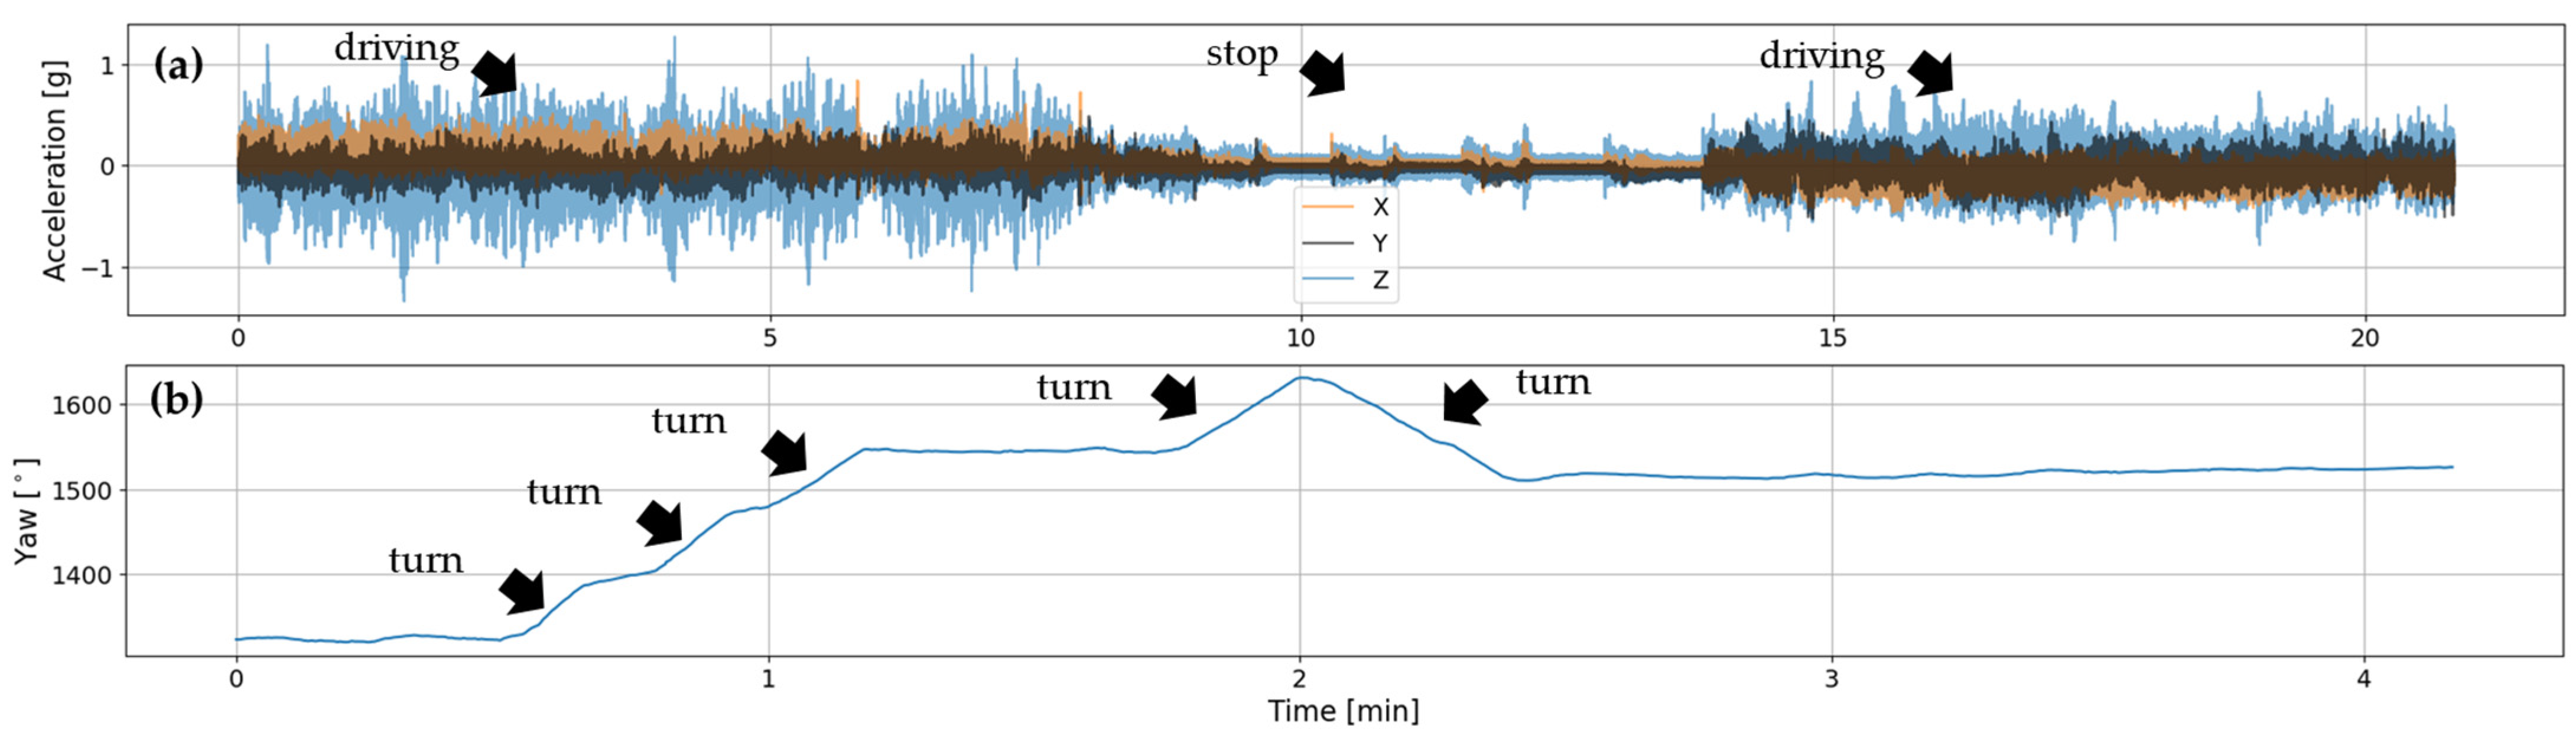
The application of the speed estimation method with correction requires, as a first step, the detection of control points. Both vehicle stops and turns can be identified using inertial data. During the stop, the machine exhibits significantly reduced vibrations, which is clearly visible in the accelerometer signals along all three axes as a decreased signal amplitude (Figure 2a). Therefore, the method requires dividing the signal into stop segments—characterized by lower vibration amplitude—and driving segments—characterized by higher amplitude.
Figure 2.
Fragments of signals enabling detection of (a) stops—acceleration and (b) turns—yaw.
Vehicle turns can be detected using gyroscope data. The angular velocity measured by the gyroscope in the axis perpendicular to the ground, when integrated over time, yields the vehicle’s yaw angle. A sudden and significant change in this value indicates a vehicle turning event (Figure 2b) [30].
Based on these assumptions, two analogous methods were developed for detecting vehicle stops and turns. Both methods first segment the signal into fragments with different characteristics. For this purpose, a change-point detection algorithm—Pruned Exact Linear Time (PELT) [31]—was applied. This method enables optimal segmentation of a signal into segments with differing statistical properties, such as mean value or standard deviation. The PELT algorithm was selected due to its computational efficiency and ability to provide an exact solution for multiple change-point detection with linear computational cost under mild assumptions. In contrast, methods such as Binary Segmentation are approximate and may fail to detect closely spaced change-points.
In the next step, the obtained segments must be grouped into stop/driving or turning/non-turning states. For this purpose, statistical features that best represent the assumed signal characteristics for each state were selected. The reduction in vibration amplitude measured by the accelerometer during stop is reflected in statistics such as the interquartile range (IQR), standard deviation (STD), and the 0.99 quantile. In contrast, sudden changes in the yaw signal during turning events are captured by statistics such as IQR, STD, and the max–min range.
Finally, an unsupervised AI-based clustering method (k-means) [32] was employed to group the signal segments based on the extracted statistical features. This approach allows the data to be divided into a chosen number of clusters (two in this study) without requiring reference information about the actual vehicle state (labels). The method is based on Euclidean distance and selects initial cluster centroids by sampling points according to a probability distribution reflecting their contribution to the total inertia. One cluster corresponds to segments in which the vehicle is stationary (or turning), while the other represents segments in which the vehicle is moving (or not turning).
The stop detection method can be described in the following steps:
- Compute the resultant acceleration:where are the linear acceleration values measured along the three sensor axes X, Y, and Z, respectively.
- Segment the obtained acceleration signal acc into fragments using the PELT method.
- For each signal fragment, compute statistical features: interquartile range (IQR), standard deviation (STD), and the 0.99 quantile.
- Standardize the computed statistical features.
- Cluster the signal fragments into two groups based on the extracted statistical features using the k-means method.
- Compute the mean IQR value for each cluster.
- Assign the label “stop” to the cluster with the lower mean IQR value and “driving” to the cluster with the higher mean IQR value.
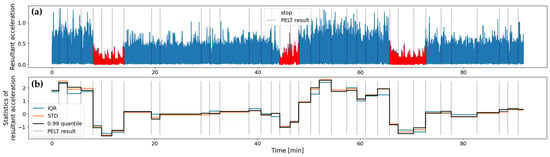
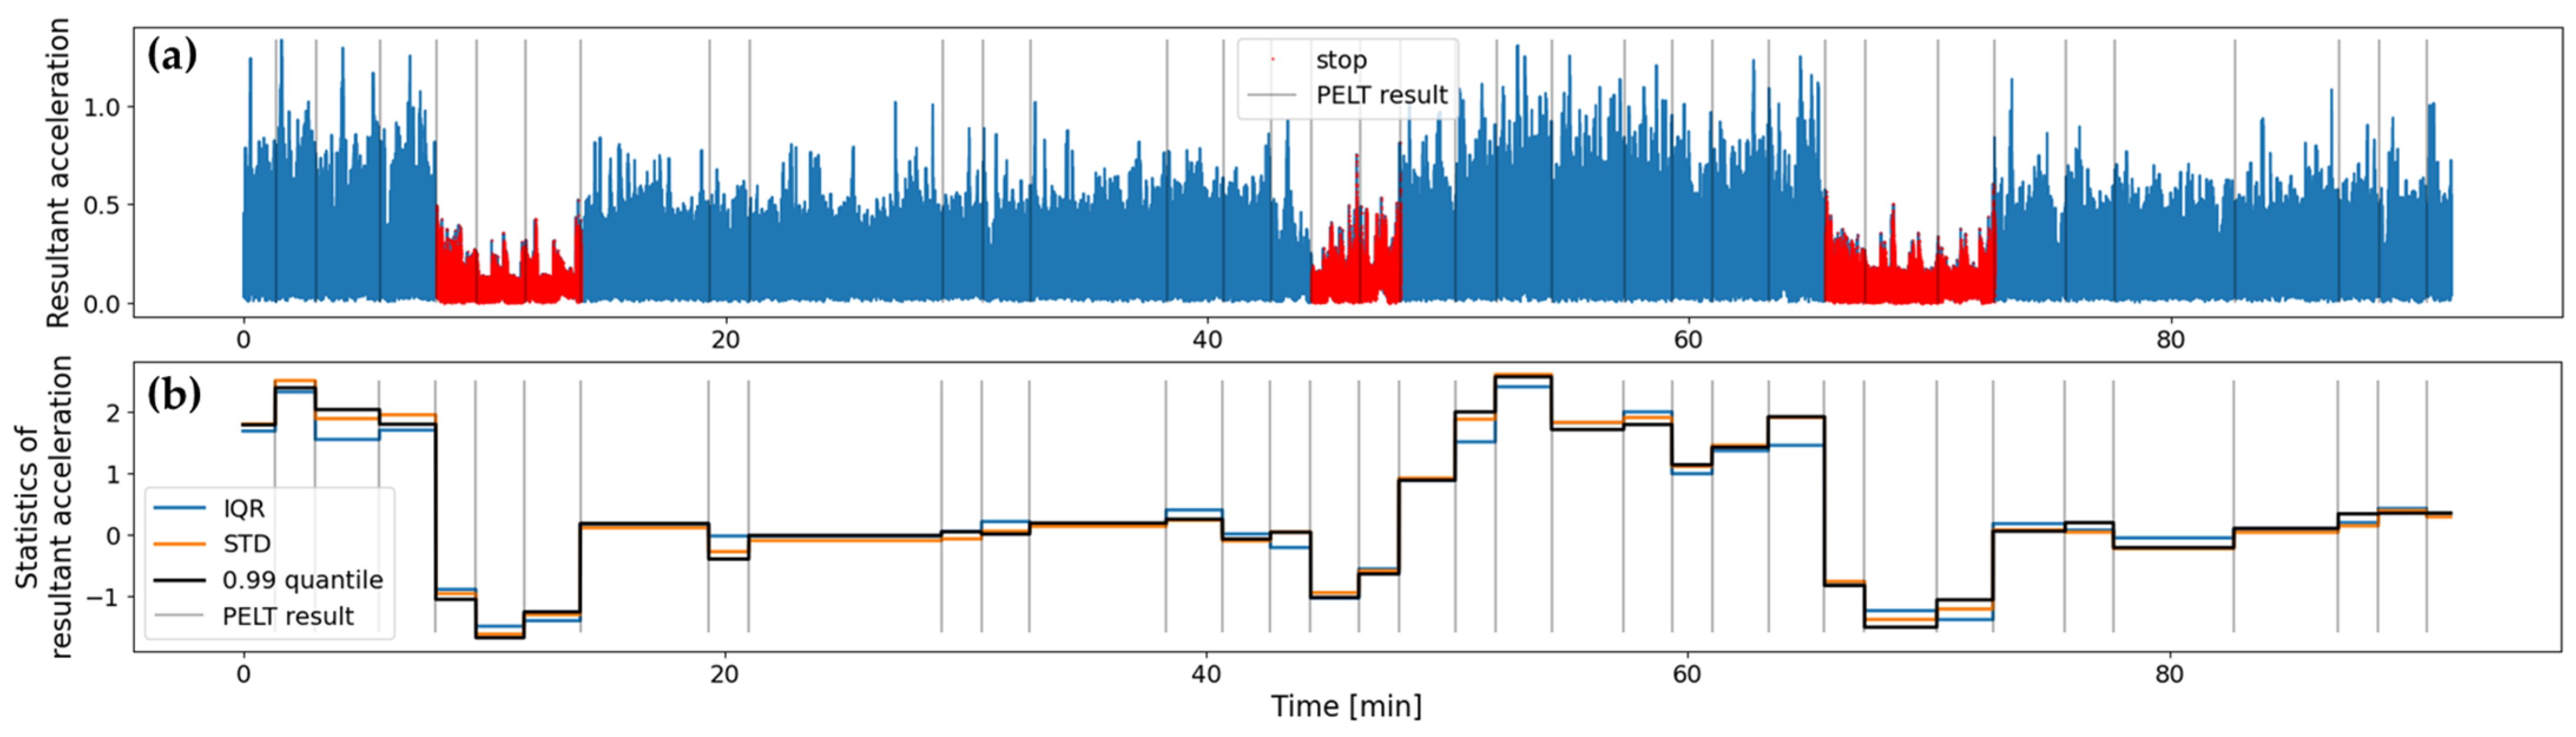
An example segment of the signal illustrating the individual stages of the proposed method is shown in Figure 3. The base signal of the resultant acceleration is presented in Figure 3a. The segmentation obtained using the PELT method is indicated by vertical gray lines, while the detected stop periods are highlighted in red. It can be observed that the signal is divided into shorter segments than those corresponding solely to transitions between stop and driving states; however, this does not adversely affect the correctness of the classification. All applied statistical features (Figure 3b) exhibit significantly lower values during vehicle stops, enabling these segments to be clearly distinguished from the remaining signal.
Figure 3.
An example signal fragment illustrating the stop detection method. (a) Resultant acceleration divided into fragments using the PELT method and with marked stops; (b) statistics for the resultant acceleration fragments.
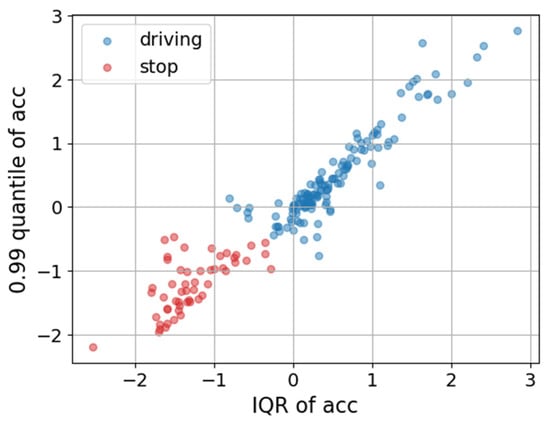
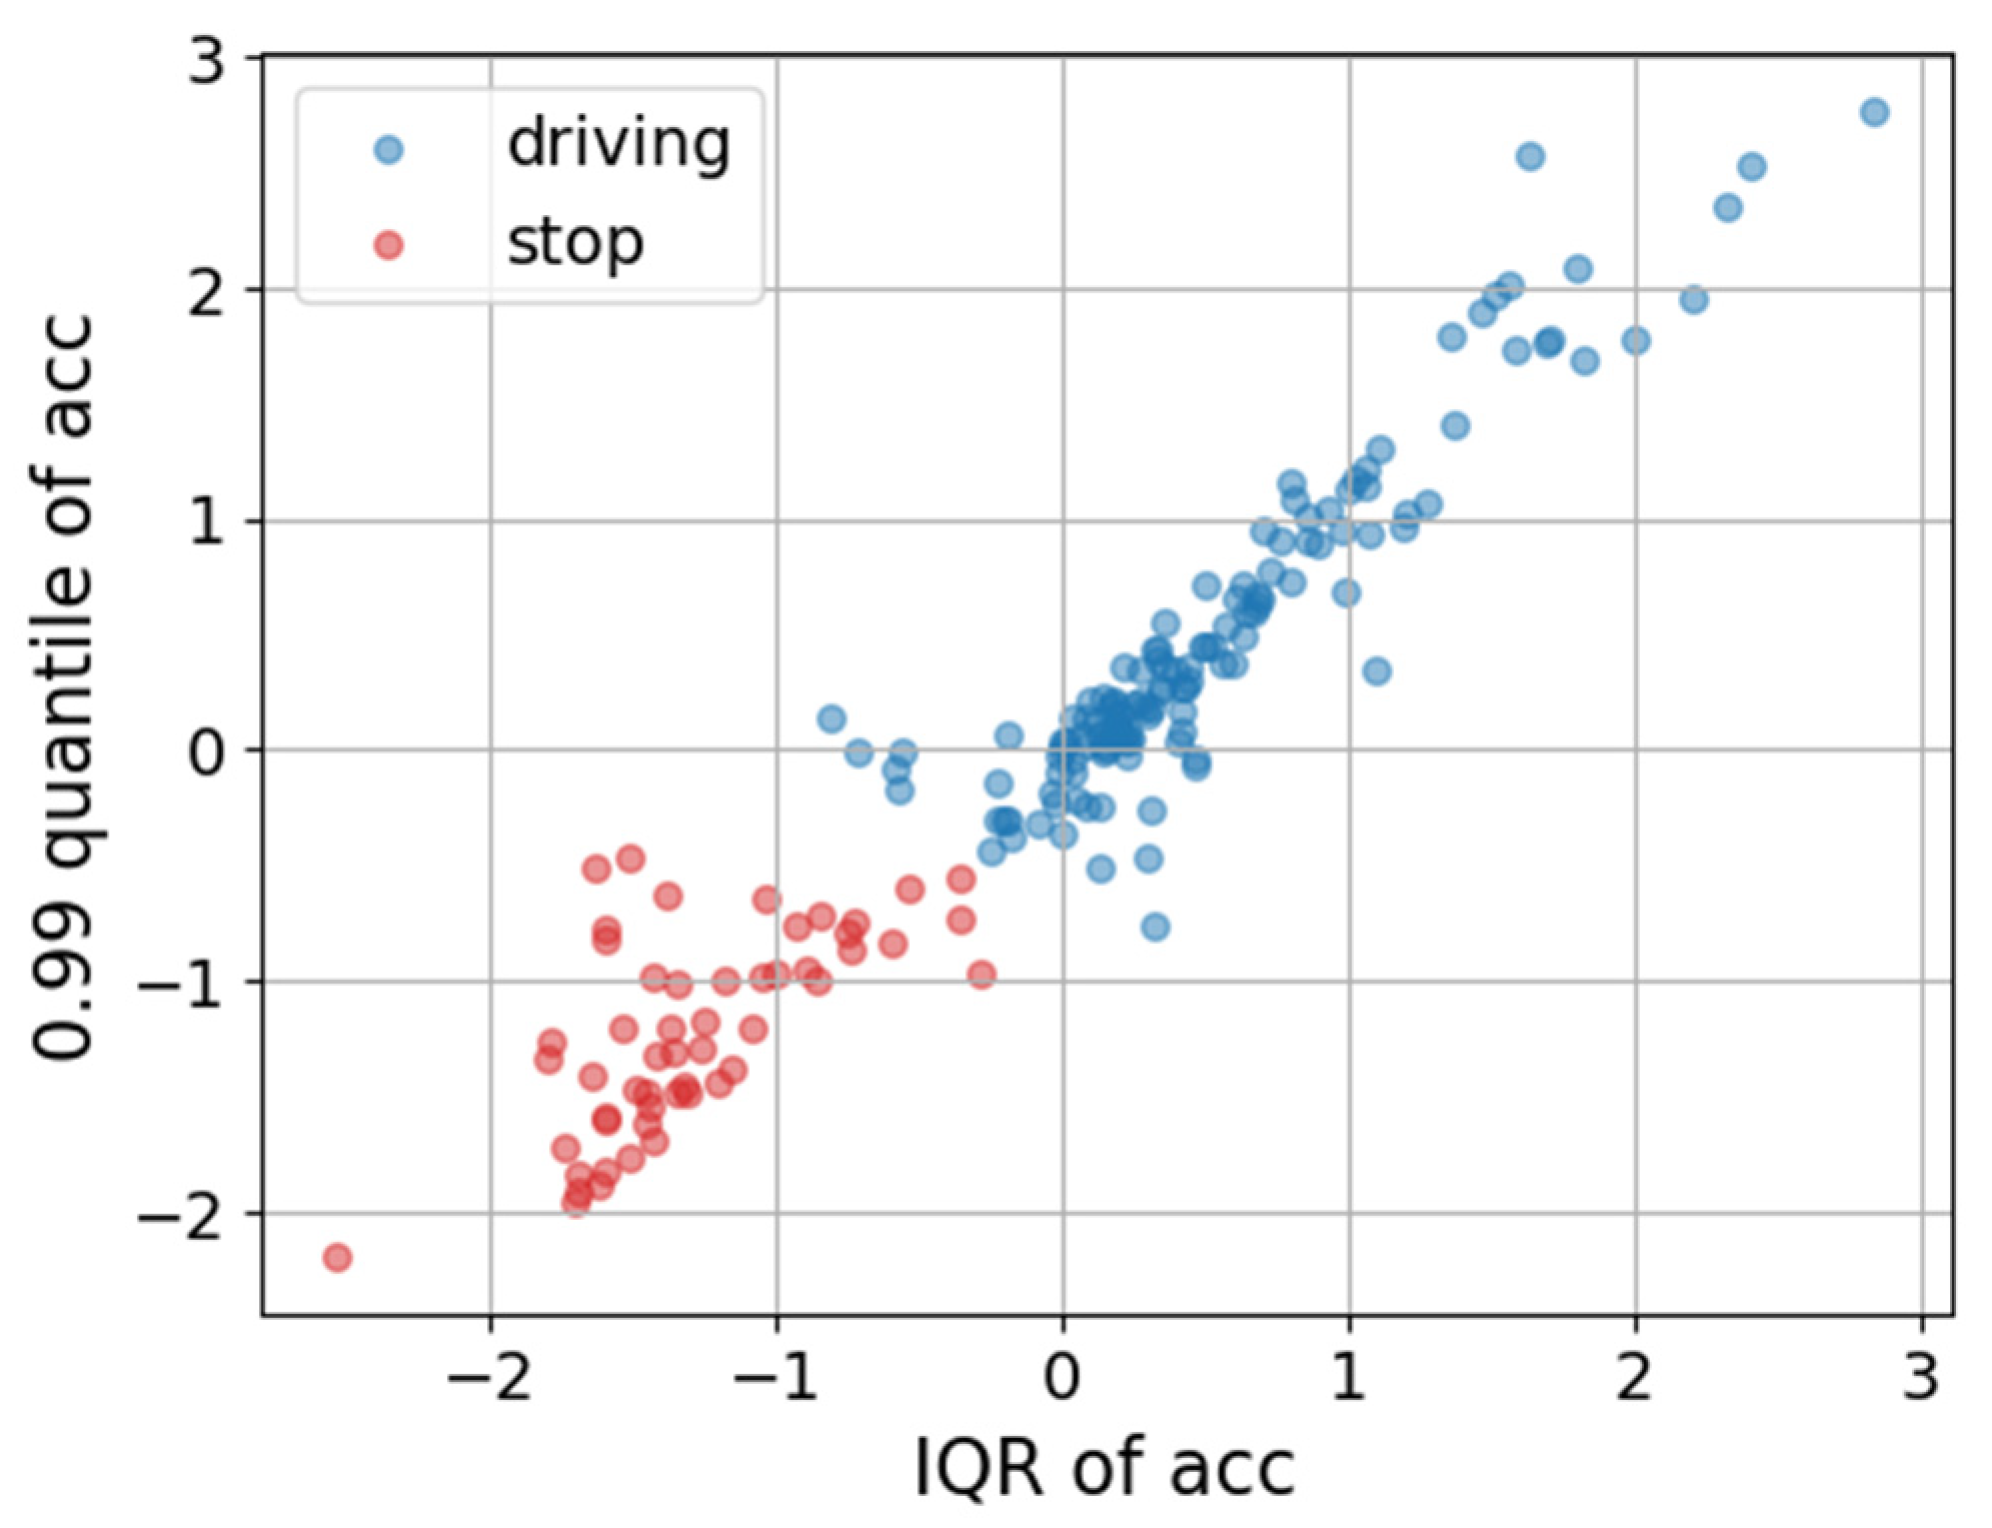
The result of k-means clustering for two sample statistics is presented in Figure 4. The boundary between the groups is not very clear, but distinct clusters of the most frequently occurring values of both groups are visible.
Figure 4.
Scatter plot for IQR statistics and 0.99 quantile of resultant acceleration divided into driving and stop, using the k-means method.
The turn detection method is described by the following steps:
- Using numerical integration with the trapezoidal method, determine the yaw signal:where is the yaw angle at time , is the gyroscope signal along the Z-axis, aligned with the vehicle’s vertical axis, is the sampling period.
- Segment the yaw signal into fragments using the PELT method.
- For each segment, calculate the IQR, STD, and max-min range statistical features.
- Standardize the values of these features.
- Based on the features, cluster the segments into two groups using the k-means method.
- For both groups, calculate the mean IQR value.
- Assign the label “turn” to segments in the group with the higher mean IQR, and the label “no turn” to segments in the group with the lower mean IQR.
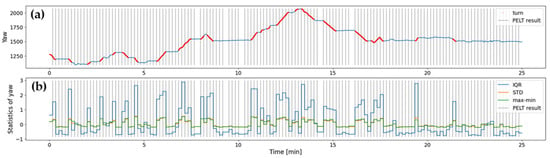
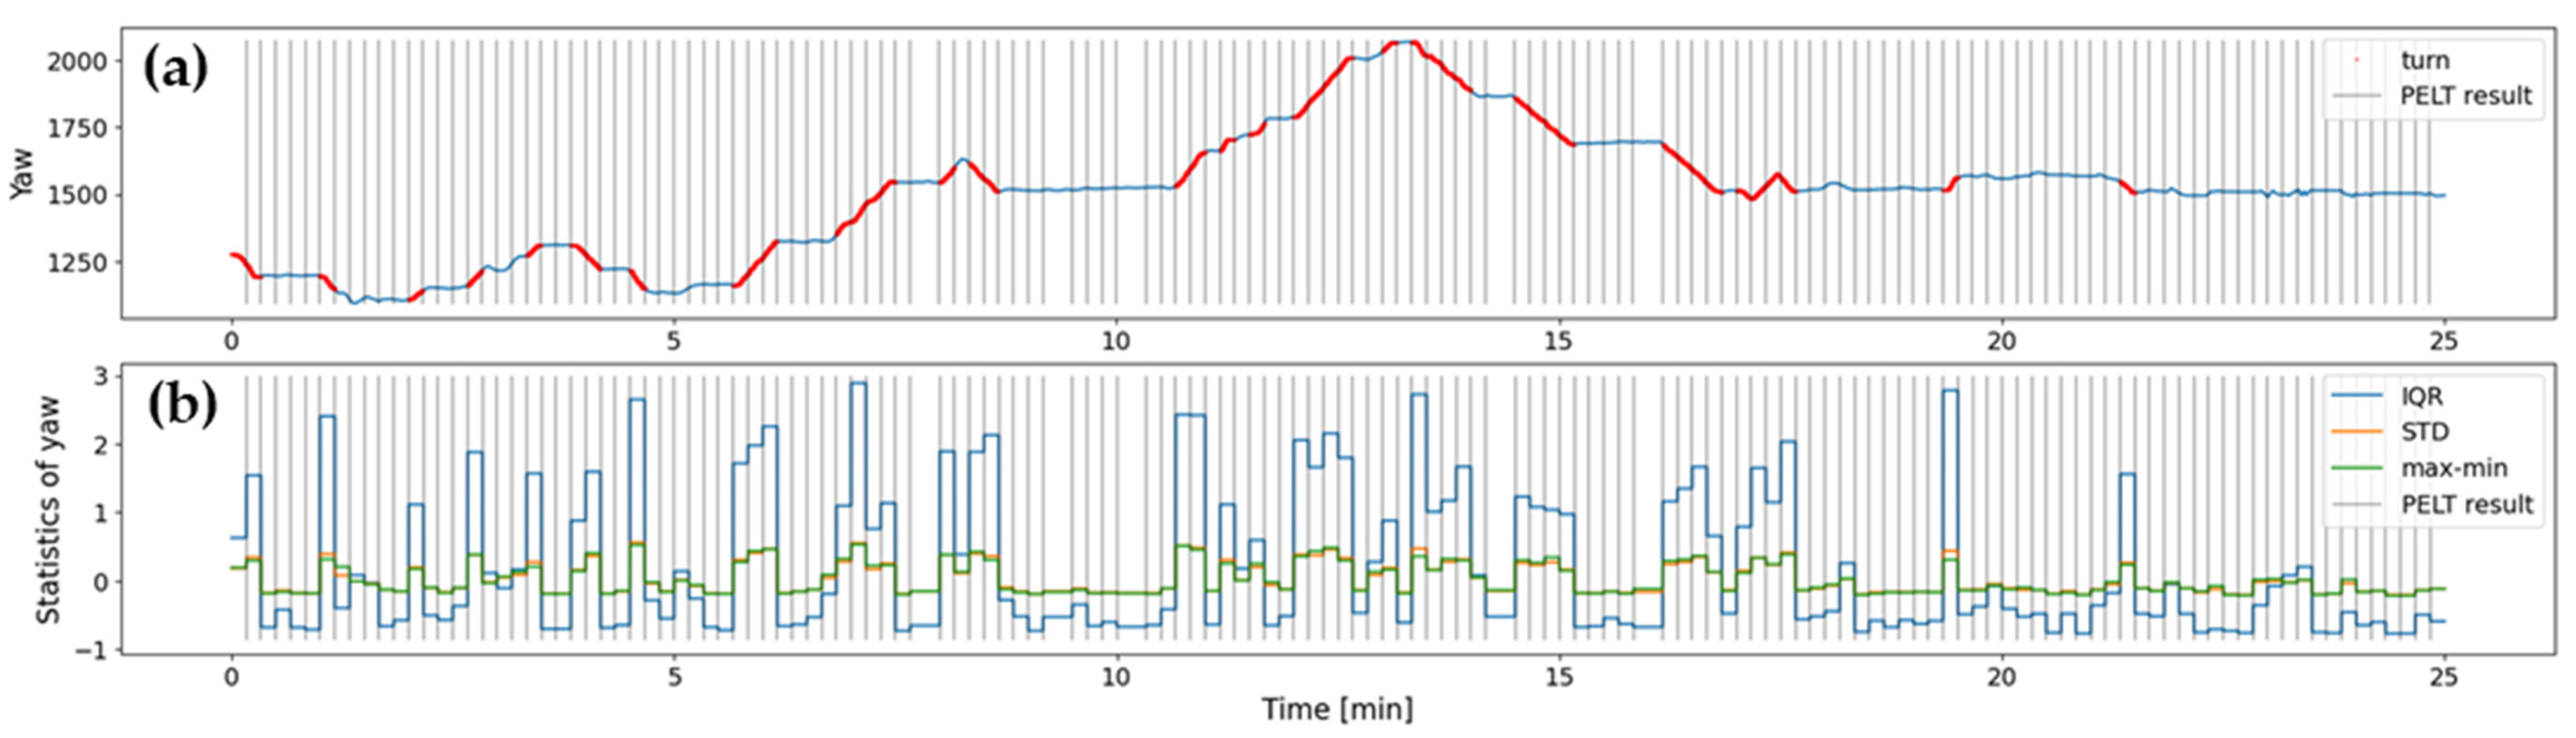
Figure 5 shows an example result and the individual stages of the turn detection method. The PELT method divided the signal (gray vertical lines) into many short segments, making it possible to detect even short-term turns. Segments containing a turn are characterized by significantly higher values of the statistics, particularly the IQR (Figure 5b).
Figure 5.
An example signal fragment illustrating the turn-detection method. (a) Yaw signal divided into segments using the PELT method and with turns marked, (b) statistics for yaw signal fragments.
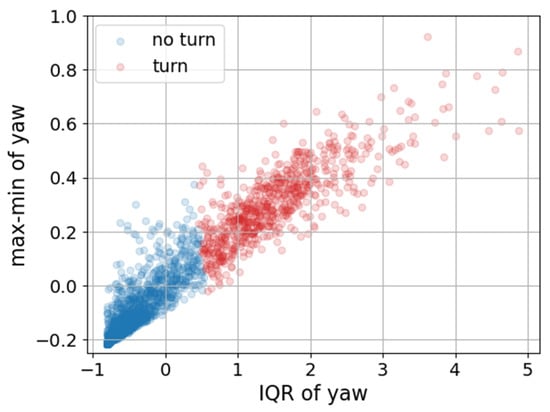
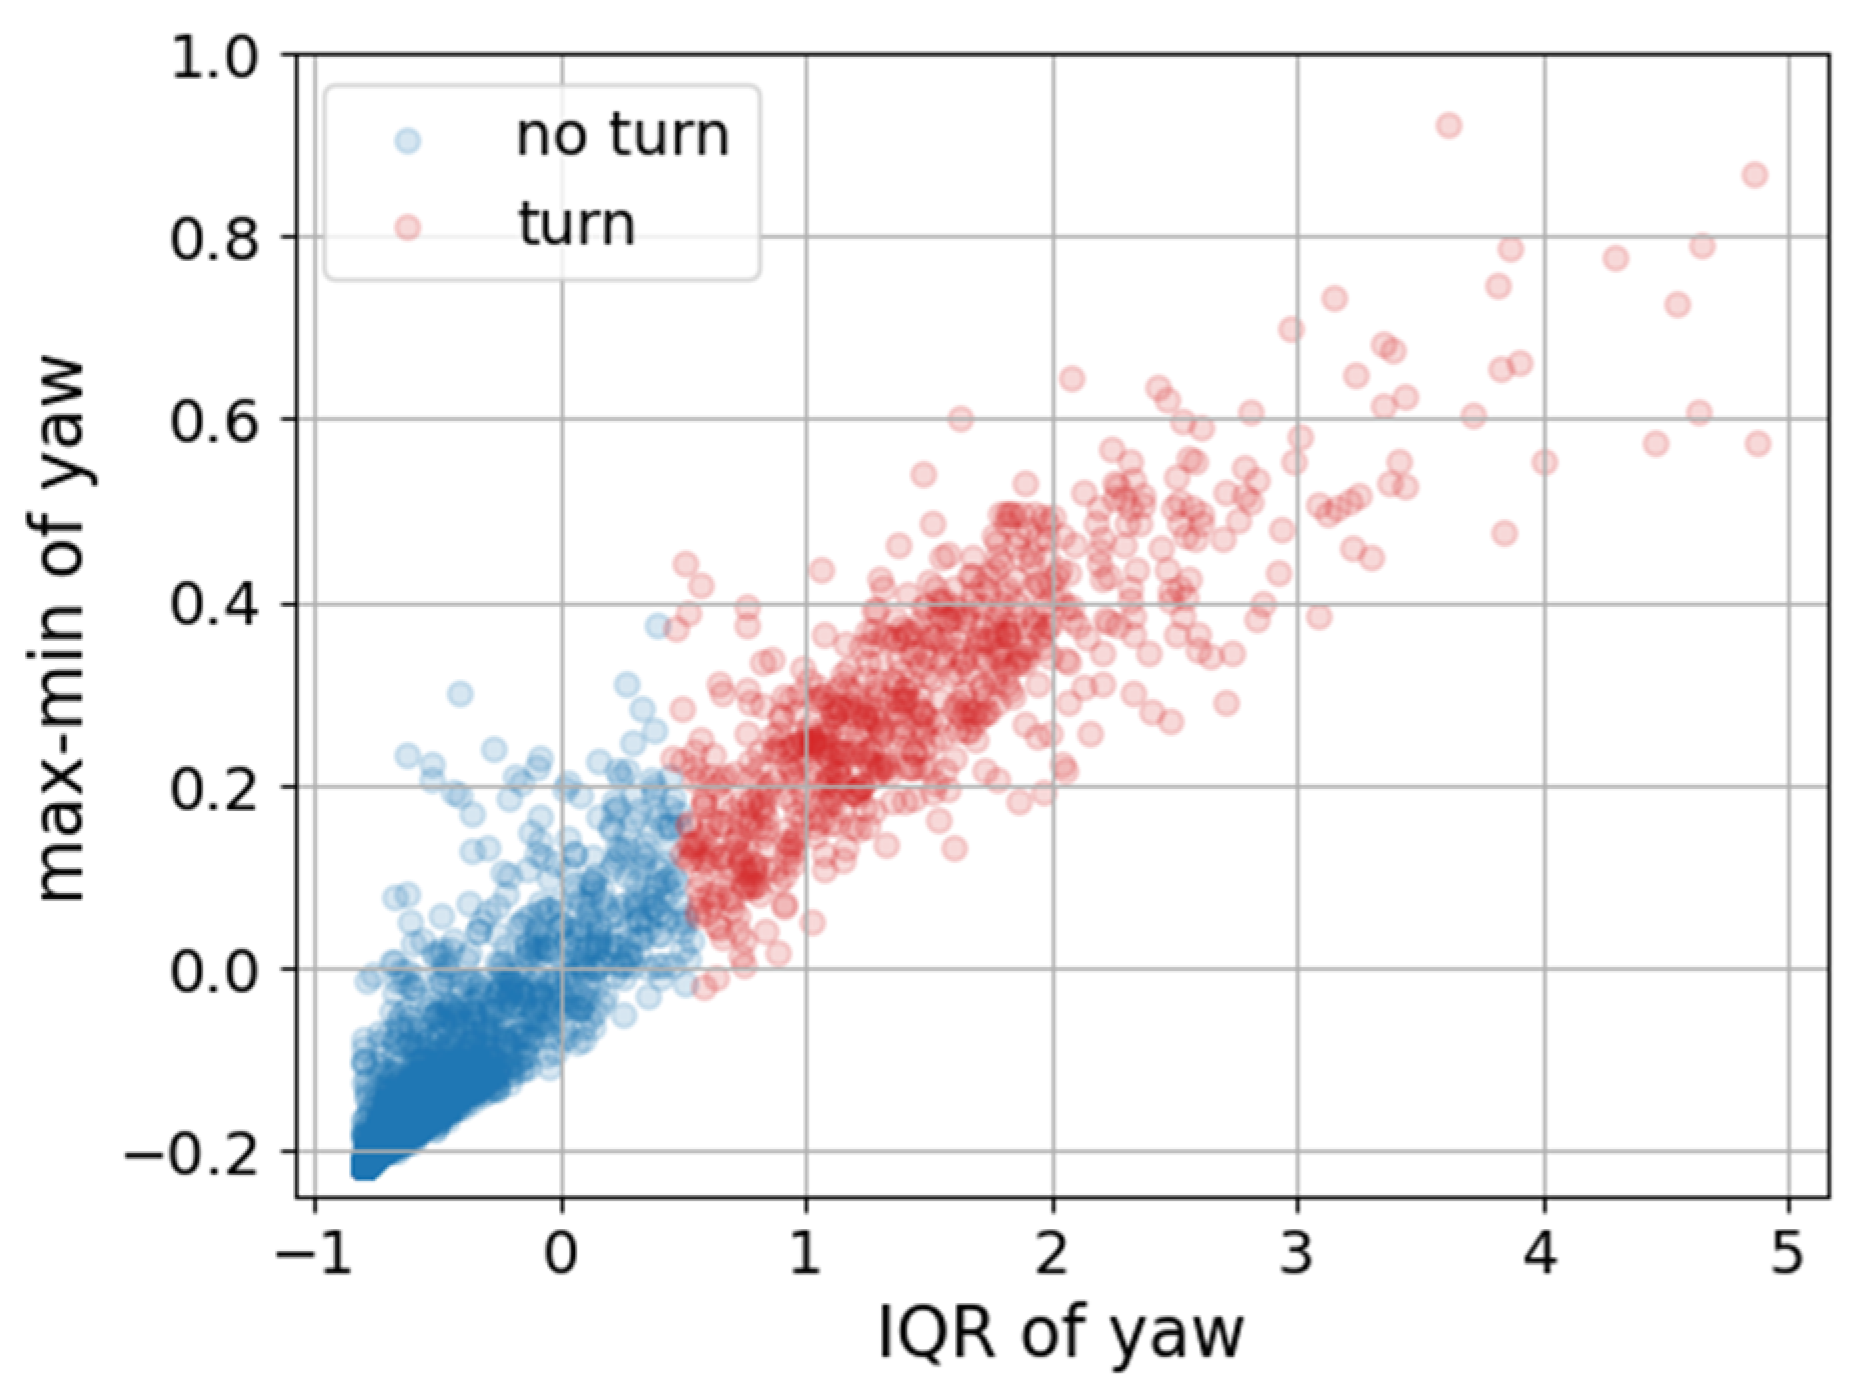
Figure 6 shows a scatterplot for two statistics, with the k-means result highlighted in color. It is clear that the division into groups was achieved primarily with respect to the IQR statistic.
Figure 6.
Scatter plot of IQR and max-min statistics of yaw divided into turn and no turn using the k-means method.
For control points, vehicle speed information is required. For stops, the corresponding value is zero. For turns, this value can be calculated from the following relationship:
where a is the centripetal acceleration (measured using an accelerometer), is the angular velocity (measured by a gyroscope) [28].
2.2.2. Main Alghorithm
The speed estimation method first involves determining an initial speed estimate from accelerometer measurements, which is subsequently corrected using control points. It was not possible to mount the IMU sensor on the vehicle aligned with its horizontal axes. As a result, the driving direction of the vehicle lies between the sensor X and Y axes, making it necessary to compute the resultant speed using both axes. The initial speed v at time step k is calculated as follows:
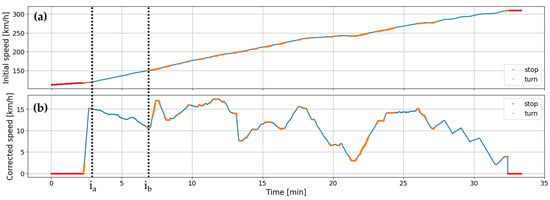
where to denote the linear acceleration values measured along the horizontal sensor axes X and Y, respectively, and represents the sampling period. The speed obtained in this way is subsequently corrected using control points, for which the start and end events are additionally determined. As a result, four types of control points are identified: turn start, turn end, stop start, and stop end. All control points are ordered hierarchically according to their time of occurrence. For each pair of consecutive control points occurring at time , where (Figure 7) the slope of the estimation error is determined [28]:
where denotes the difference between the initial speed estimate and the speed obtained using an alternative method at the control point. This value enables rescaling of the initial speed error according to the error slope computed separately for each signal segment between two control points. The corrected speed at time k (where is calculated as follows [28]:
Figure 7.
Fragment of the determined (a) initial speed and (b) corrected speed.
Finally, for all detected standstill periods, the corrected speed is set to zero. For turning events, the speed value computed using the gyroscope and accelerometer data is assigned. Figure 7 presents a comparison of the initial and corrected speed estimates together with the identified control points.
2.3. Road Quality Assessment
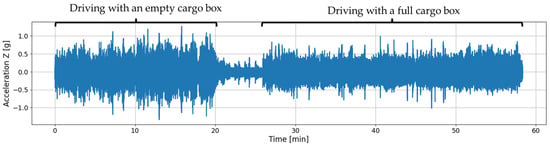
The quality of the road on which a vehicle operates influences both the level and characteristics of its vibrations. Traversing potholes, surface defects, or rougher terrain induces additional accelerations along the vehicle’s vertical axis, which are captured by the Z-axis accelerometer measurements. However, vibrations measured along this axis are not solely related to road quality. They are also affected by vehicle-specific factors such as the machine’s natural vibrations, tire pressure, driving speed, and payload. This dependency is particularly evident when the same road is traversed by the vehicle with an empty and a full cargo box (Figure 8). Driving with a full cargo box results in lower vibration amplitudes compared to driving with an empty box. This effect is further amplified by the fact that operators typically drive faster when the vehicle is empty than when it is full, which increases vibration levels during driving with an empty cargo box. For these reasons, developing a road quality assessment method based on vertical acceleration requires removing the influence of all other contributing factors from the data. The method described in this study extends the approach presented in [33].
Figure 8.
Z-axis accelerometer signal fragment covering empty and full cargo box.
2.3.1. Scaling the Vibration Data
The first step in minimizing the influence of factors unrelated to road quality is scaling the data with respect to payload condition (full and empty driving) and vehicle speed. Detection of driving with a full cargo box and returning with an empty cargo box was achieved using a neural network–based method relying on inertial data, as described in detail in [34]. In addition to the payload-based separation, the data are further grouped according to vehicle speed values rounded to integer units. The applied scaling is based on the Z-score method and is performed in two stages. The first stage aims to rescale empty driving cases to match the distribution of data corresponding to full driving. This procedure is carried out separately for each speed group. The rescaling is performed according to the following equation:
where denotes the Z-axis acceleration value for empty driving at time i, i are the mean Z-axis acceleration values for empty and full driving, respectively, and i are the corresponding standard deviations of the Z-axis acceleration.
The second scaling stage aims to rescale all speed groups to the distribution of a single selected target speed group during full driving. A speed of 3 km/h was selected as the optimal target group based on expert recommendation. This procedure is performed separately for each speed group according to the following equation:
where denotes the Z-axis acceleration signal for full driving and for full driving cases rescaled according to Equation (9), while and represent the mean value and standard deviation of this signal, respectively. Furthermore, and denote the mean value and standard deviation for the target cases (full driving at a speed of 3 km/h).
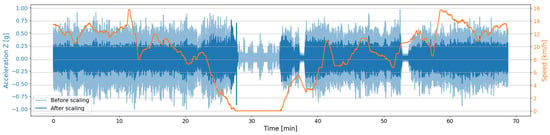
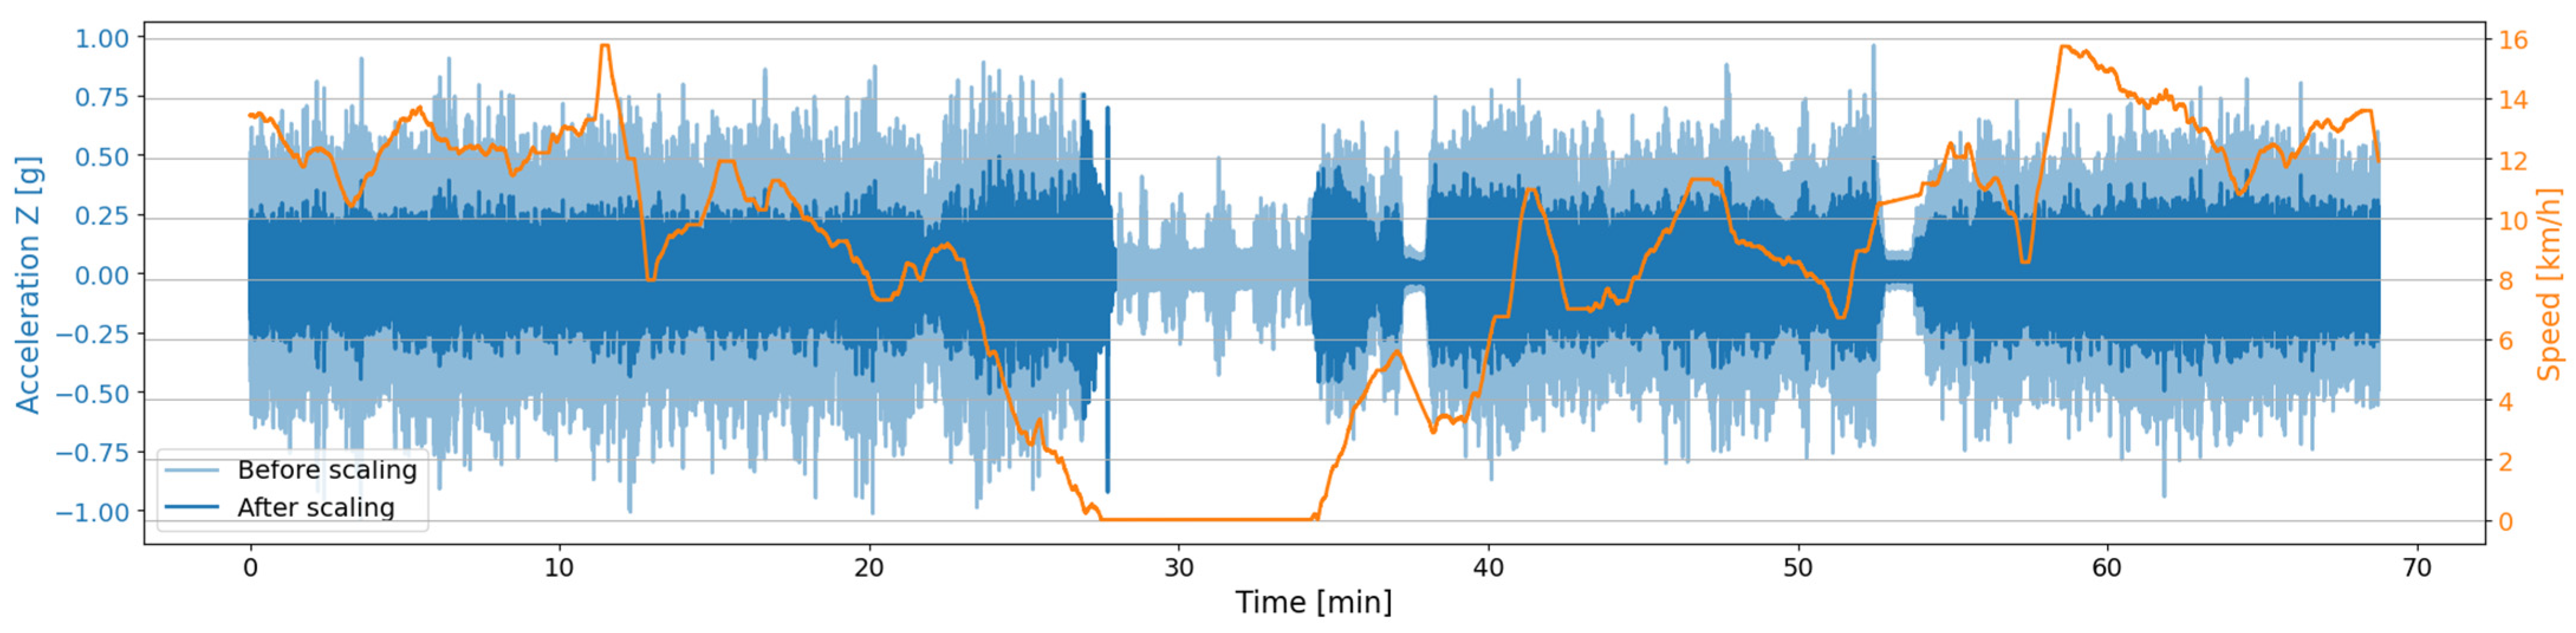
An example segment of the signal values before and after scaling, shown in relation to vehicle speed, is presented in Figure 9. The example includes a fragment of empty driving (left part before the standstill) and a fragment of full driving (right part after the standstill). It can be observed that, after scaling, the vibration amplitude is reduced and exhibits a similar mean level for both empty and full driving conditions. A particularly interesting segment is the final part of the empty driving signal. During this interval, the amplitude of the raw acceleration signal slightly increases while the vehicle speed decreases. As a result, after scaling, this change in signal characteristics becomes even more pronounced and probably indicates a road segment of poorer quality.
Figure 9.
Comparison of the acceleration values in the Z-axis before and after scaling.
2.3.2. Main Alghorithm
The rescaled Z-axis acceleration signal is subsequently used in the frequency domain to determine the quality of the road surface on which the vehicle is driving. The objective of the method is a three-level classification of road segments into good, medium, and bad quality. In the first step, the influence of the machine’s natural vibrations must be removed from the signal. This is achieved through spectral analysis of acceleration signals recorded during machine standstill periods. When the machine stops during operation and remains idling, the vertical accelerations mainly result from its natural vibrations. Determining their frequency spectrum and subtracting it from the spectrum recorded during driving allows the influence of natural vibrations on the signal shape to be eliminated. An example acceleration spectrum for one of the machines during idling, determined using the Fast Fourier Transform (FFT), is shown in Figure 10.
Figure 10.
Z-axis accelerometer signal spectrum during machine idle.
Although the signal amplitudes have already been scaled with respect to vehicle speed and payload condition, the influence of these factors may still be observable in the frequency domain. In addition, other machine-related dependencies remain, which are not visible in the idle spectrum, such as the influence of tire pressure. For these reasons, the data were divided into groups according to these factors, and road quality classification was performed separately for each group. The groups were defined based on the following criteria:
- Machine—each machine is analyzed separately.
- Payload condition—driving with a full cargo box is separated from driving with an empty cargo box.
- Driving speed—four speed ranges were applied: (0, 4.5], (4.5, 9.5], (9.5, 13.5], (13.5, ∞).
Analyzing each of these smaller groups independently allows road quality classification to be carried out without concern for the influence of these factors on the results. The classification was performed for signal segments with a duration of 2 s, with each segment assigned a road quality class (good, medium, or bad). For each segment, a statistical feature—used for road quality assessment—is computed according to the following steps:
- The frequency spectrum of the rescaled Z-axis accelerometer signal is computed using FFT.
- The spectrum obtained from the machine idle signal is subtracted from the computed spectrum.
- A weighted mean is calculated from the resulting spectrum, with weights from 1 to 5 assigned proportionally to the signal frequency. It is assumed that higher frequencies have greater importance in assessing road quality.
The resulting statistical feature is then used to classify signal segments according to road quality. For this purpose, the k-means method [32]—an unsupervised AI-based clustering technique—was applied. Using this method, the data were divided into three clusters. The analysis was repeated separately for each of the previously discussed groups with respect to machine, speed, and payload condition. The cluster with the lowest values corresponds to good road quality, the intermediate cluster to medium quality, and the cluster with the highest values to bad road quality.
3. Results
3.1. Speed Estimation
Speed estimation was performed for all haul trucks equipped with the monitoring system, which were carrying out their standard cyclic haulage operations during the measurement period. The estimated speed for one of the vehicles is shown in Figure 11. Periods where the speed equals zero correspond to vehicle standstills, mainly associated with loading and unloading operations. A repeating driving pattern can be observed, consisting of sections with a relatively higher average speed (approximately 10–15 km/h) and sections with a lower speed (approximately 5–10 km/h). The lower-speed segments correspond to driving with a full cargo box, while the higher-speed segments correspond to driving with an empty cargo box. Within these segments, a certain cyclicity and relatively regular speed variations can also be observed. In particular, a pronounced and sudden speed reduction is visible in the final part of the empty driving, which consistently repeats during the first two cycles.
Figure 11.
Estimated speed for one of the machines.
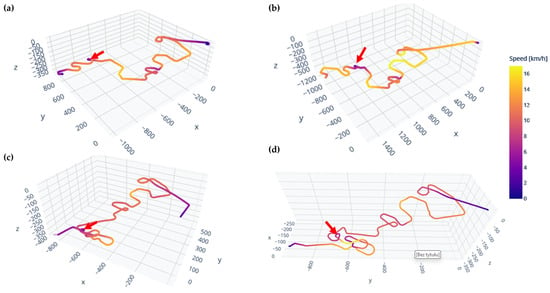
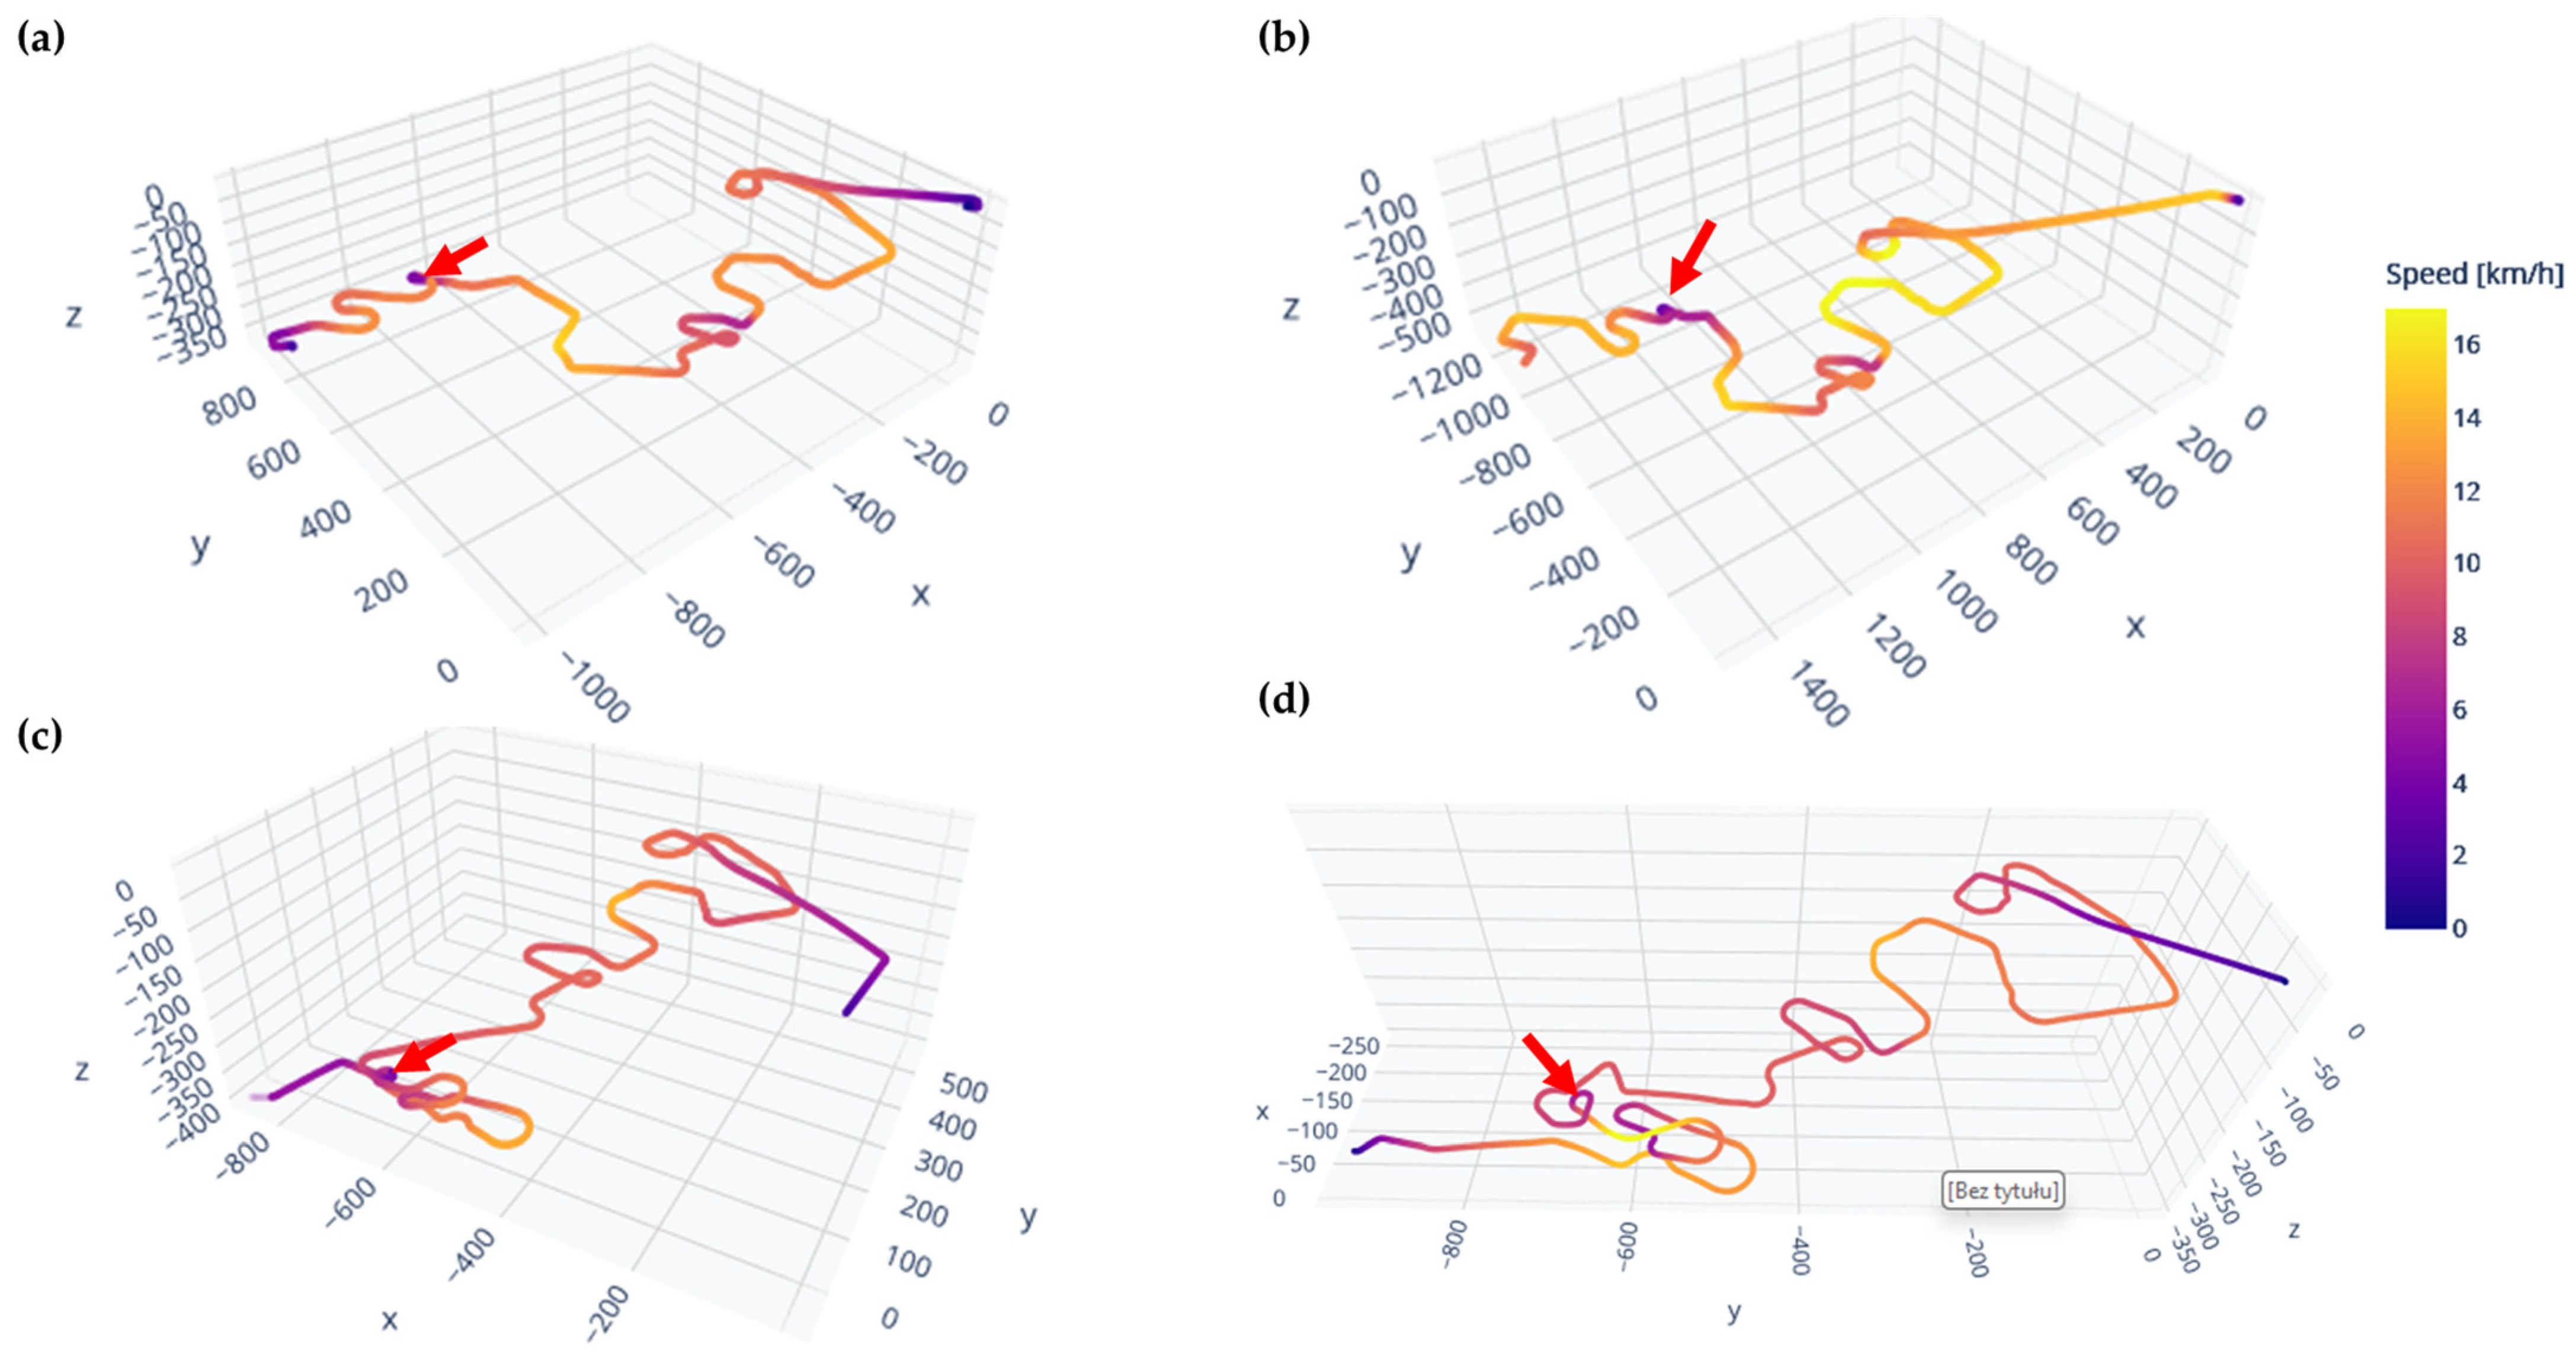
Combining vehicle speed with the road trajectory enables the identification of relationships between driving dynamics and road geometry. An approximate three-dimensional road trajectory can be reconstructed based on integrated gyroscope data and the estimated vehicle speed. Figure 12 presents four trajectories corresponding to passes with an empty cargo box, where Figure 12a,b refer to one vehicle and Figure 12c,d to another. The trajectories have a similar overall shape, although each is slightly distorted. This distortion results from sensor drift, which cannot be completely eliminated. Drift occurring in data from inertial sensors is a natural factor that cannot be completely eliminated despite the use of appropriate signal filters. Nevertheless, the reconstruction is sufficiently accurate to identify characteristic route segments and compare them in successive passes. The route traveled by the second vehicle is longer than that of the first; however, the initial segment has the same shape, indicating that both vehicles follow the same route to a certain point. The vehicle speed is color-coded along the trajectories. It is visible that certain road sections are associated with similar speeds, require speed reduction, or allow higher speeds. A particularly distinctive feature is a sharp curve indicated by arrows in the figures. Both vehicles cover this section at significantly lower speeds during every pass. This indicates that the road segment enforces speed reduction and therefore constitutes a potential haulage bottleneck. In addition to the curve radius, factors such as road gradient or limited visibility may also contribute to the repeated deceleration. Consequently, this section may require priority maintenance actions, such as road widening or curve realignment. The combined analysis of speed patterns and route geometry, therefore, provides valuable input for haul road maintenance planning.
Figure 12.
Speed on the road trajectory: (a,b) two passes with an empty cargo box for the first machine; (c,d) two passes with an empty cargo box for the second machine.
Apart from road geometry, road surface quality may also influence recurring speed patterns. In particular, segments where vehicles decelerate despite a straight road require special attention. It should be noted, however, that vehicle speed also depends on the individual driving style of the operator. For example, some operators may drive poor-quality road sections cautiously, while others may maintain higher speeds. For these reasons, vehicle speed can be treated as an indirect indicator supporting haul road condition assessment, but it must always be analyzed together with additional factors that help identify the underlying cause of speed changes along a given road segment.
3.2. Road Quality Assessment
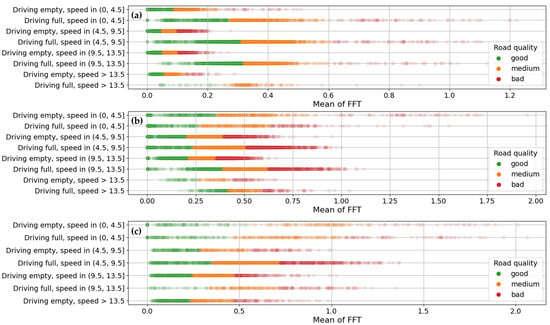
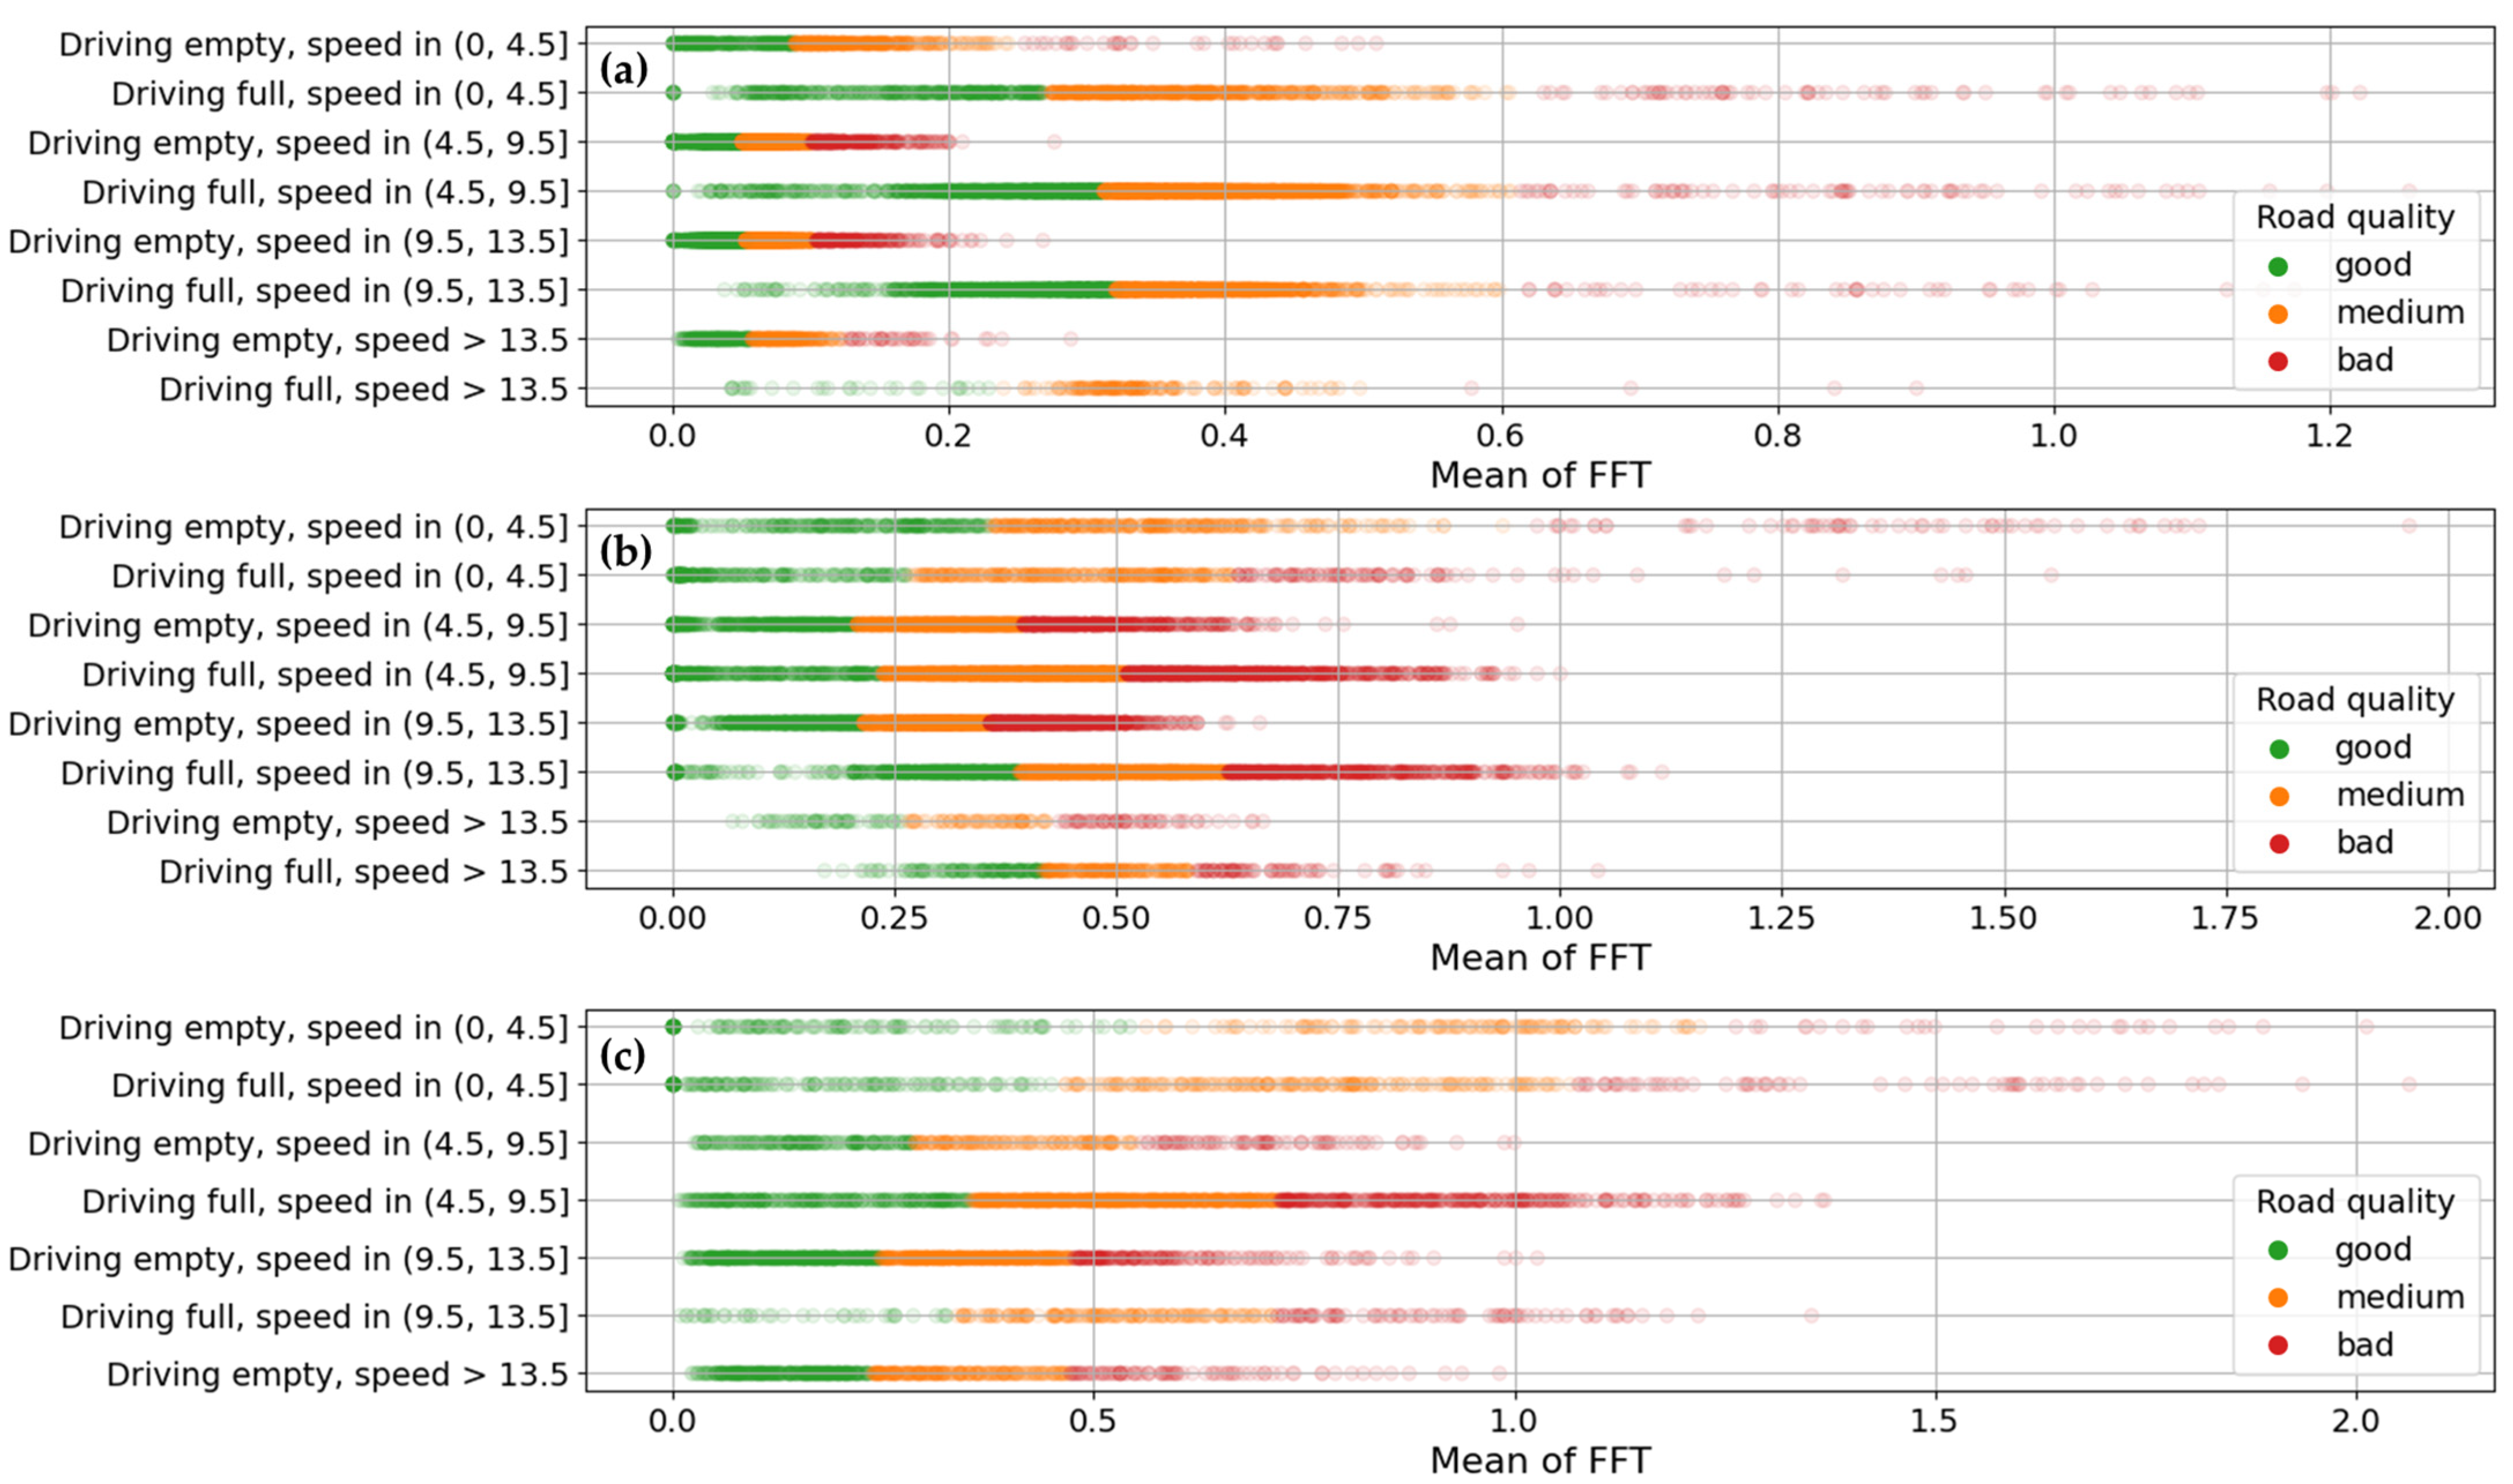
Road quality was evaluated for each pass of each vehicle using the proposed k-means-based method. Figure 13 presents the division of the mean FFT statistic used in the analysis for all vehicles, divided into groups according to driving speed and payload condition. It can be observed that the statistical distributions differ between groups, resulting in different k-means clustering outcomes. The difference between empty and full driving is particularly pronounced for the first vehicle (Figure 13a), where significantly lower statistical values are observed during empty driving. For the second vehicle (Figure 13b), a clear dependence on driving speed can be observed, with the statistical values increasing on average with speed. This confirms the strong influence of both vehicle speed and payload on the signal and justifies the grouping strategy adopted to minimize their impact.
Figure 13.
Clustering of the FFT mean values into road quality classes using the k-means method, with separate groups defined by vehicle speed and payload. (a)—result for the first machine, (b)—result for the second machine, (c)—result for the third machine.
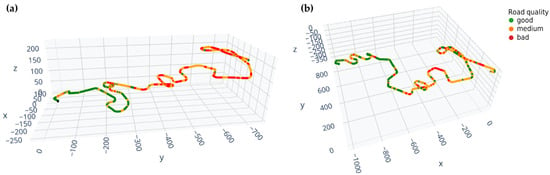
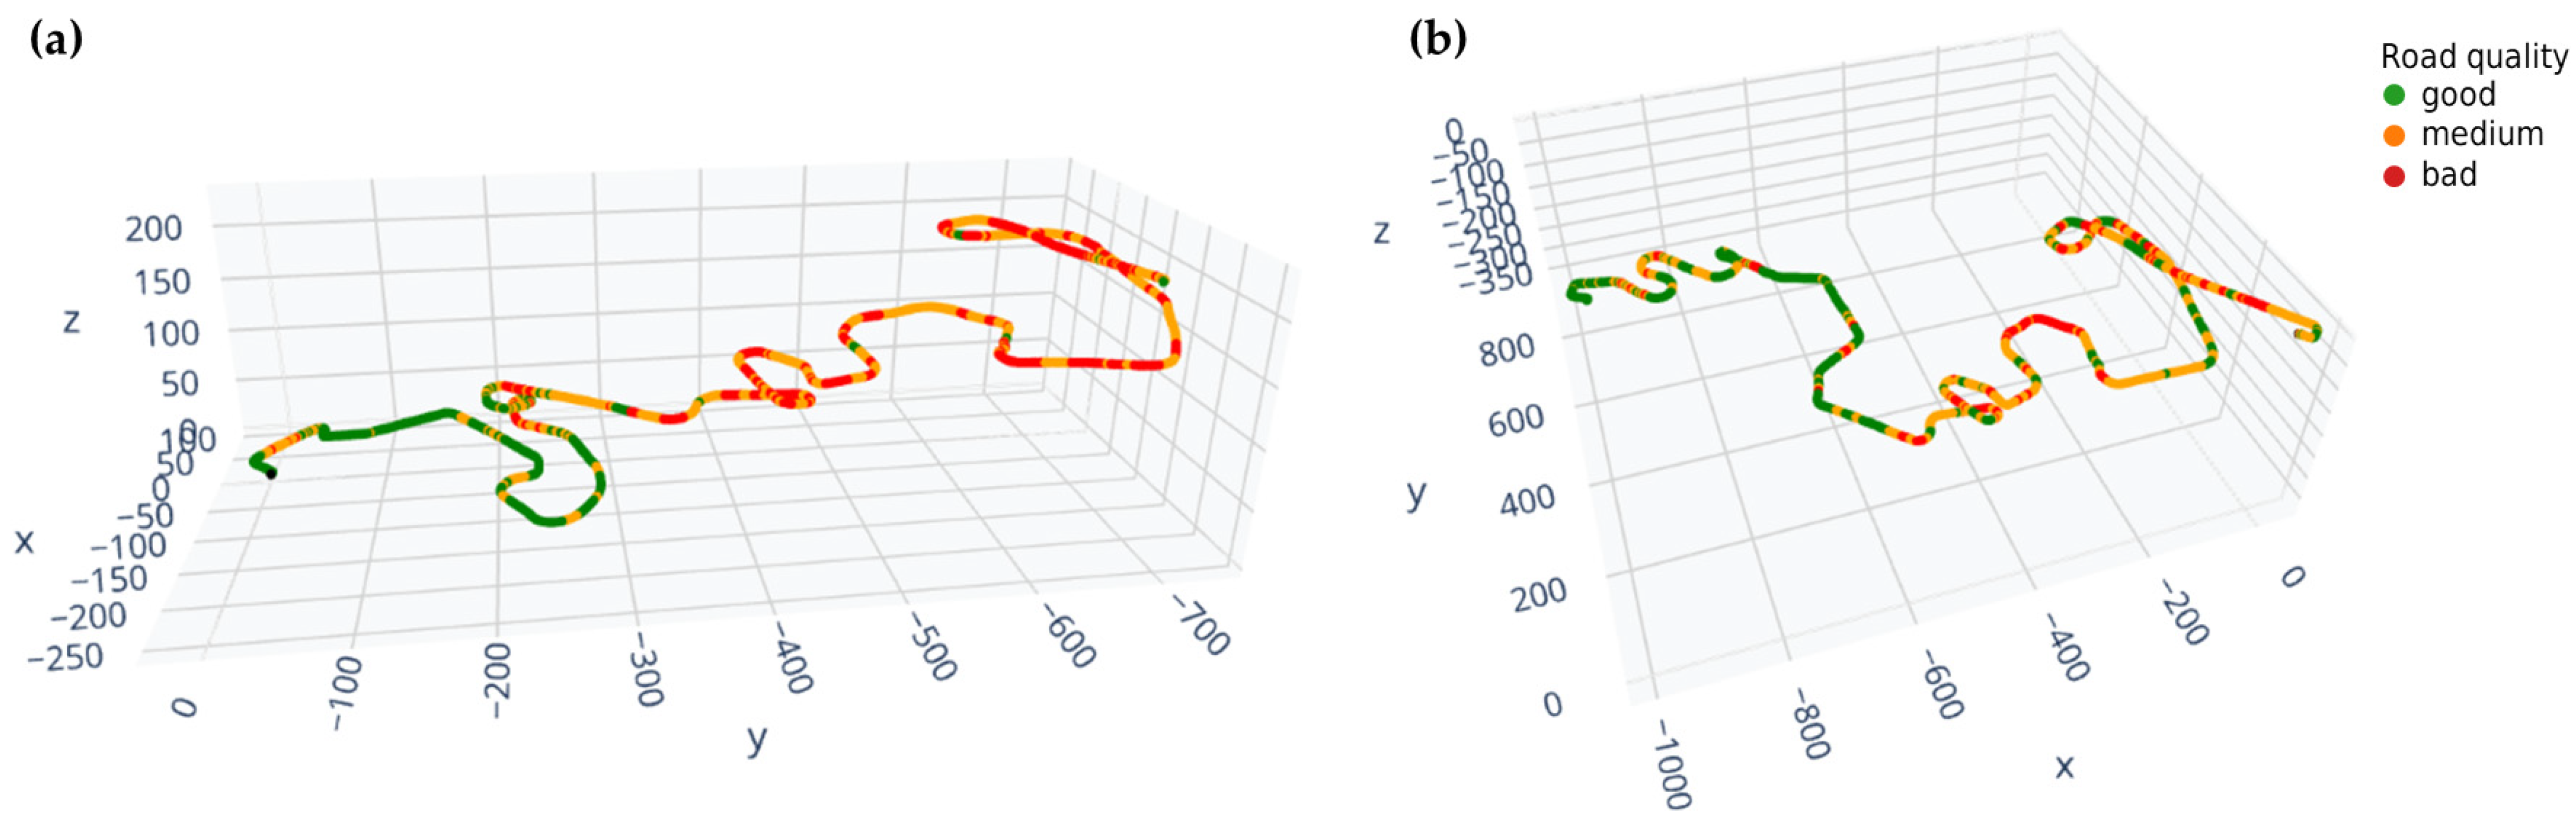
Road quality assessment was performed on the complete set of recorded vehicle signals collected during haulage operations along largely overlapping cyclical routes. This resulted in separate road quality assessments for each individual pass. To relate the results to the actual vehicle route, road quality was visualized along the three-dimensional trajectory. Figure 14 shows the road trajectory with color-coded road quality assessment for two trips of the same vehicle: Figure 14a corresponds to driving with a full cargo box, while Figure 14b represents the return pass with an empty cargo box. It is evident that the assessed road quality is not identical in both cases. Nevertheless, consistent patterns can be observed, most notably poorer road quality in the first half of the route (measured from the surface) and better quality in the second half. Differences in assessment may indicate that, despite taking into account factors such as vehicle natural vibrations, payload, and driving speed, some residual influences or additional factors still affect the result. On the other hand, the differences may also reflect temporary changes in road conditions, such as the formation of ruts or the presence of loose material that shifts over time. This demonstrates that road quality assessment can be interpreted in two complementary contexts: analysis of individual passes to detect short-term variations, and averaging results aligned with the route obtained during multiple passes of vehicles to obtain an overall assessment of pavement condition.
Figure 14.
Road quality assessment result for the same machine driving with (a) a full cargo box and (b) an empty cargo box.
3.3. Analysis of the Relationship Between Speed and Road Quality
Road quality may influence vehicle speed and necessitate speed reduction on deteriorated road sections. This, in turn, can lead to the formation of haulage bottlenecks, increased fuel consumption, and production losses. For this reason, the relationship between road quality and driving speed was further investigated.
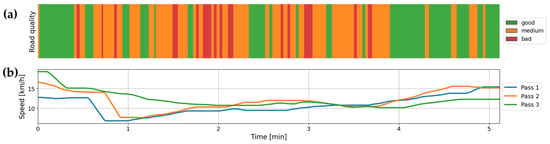
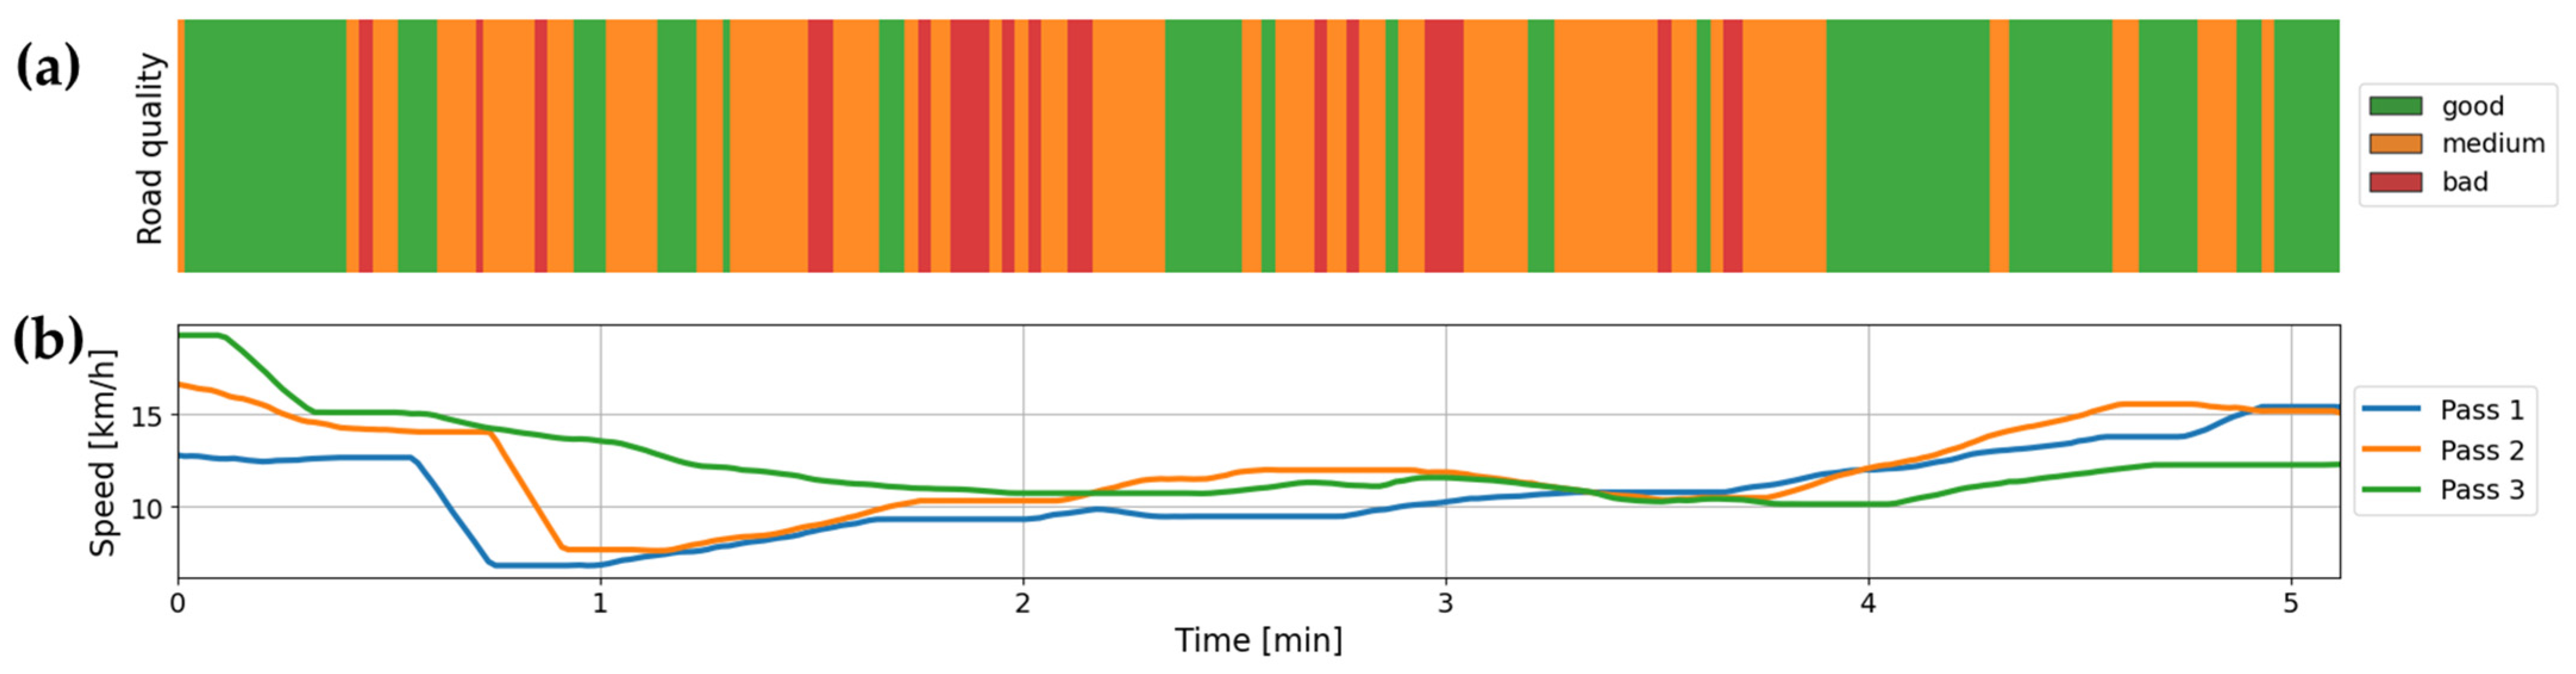
Figure 15 presents results for a road segment where a recurring correlation between speed and road quality was observed. During three passes with an empty cargo box, the vehicle consistently decelerates at the same location and subsequently accelerates again (Figure 15b). Comparing this behavior with the road quality assessment for one of the passes shows that the speed reduction coincides with a section of poorer road quality (Figure 15a). Conversely, segments where the vehicle drives at higher speed—at the beginning and end of the analyzed section—are characterized by better surface quality.
Figure 15.
Comparison of (a) road quality and (b) driving speed for a road section showing a repeatable relationship between poorer road quality and speed reduction.
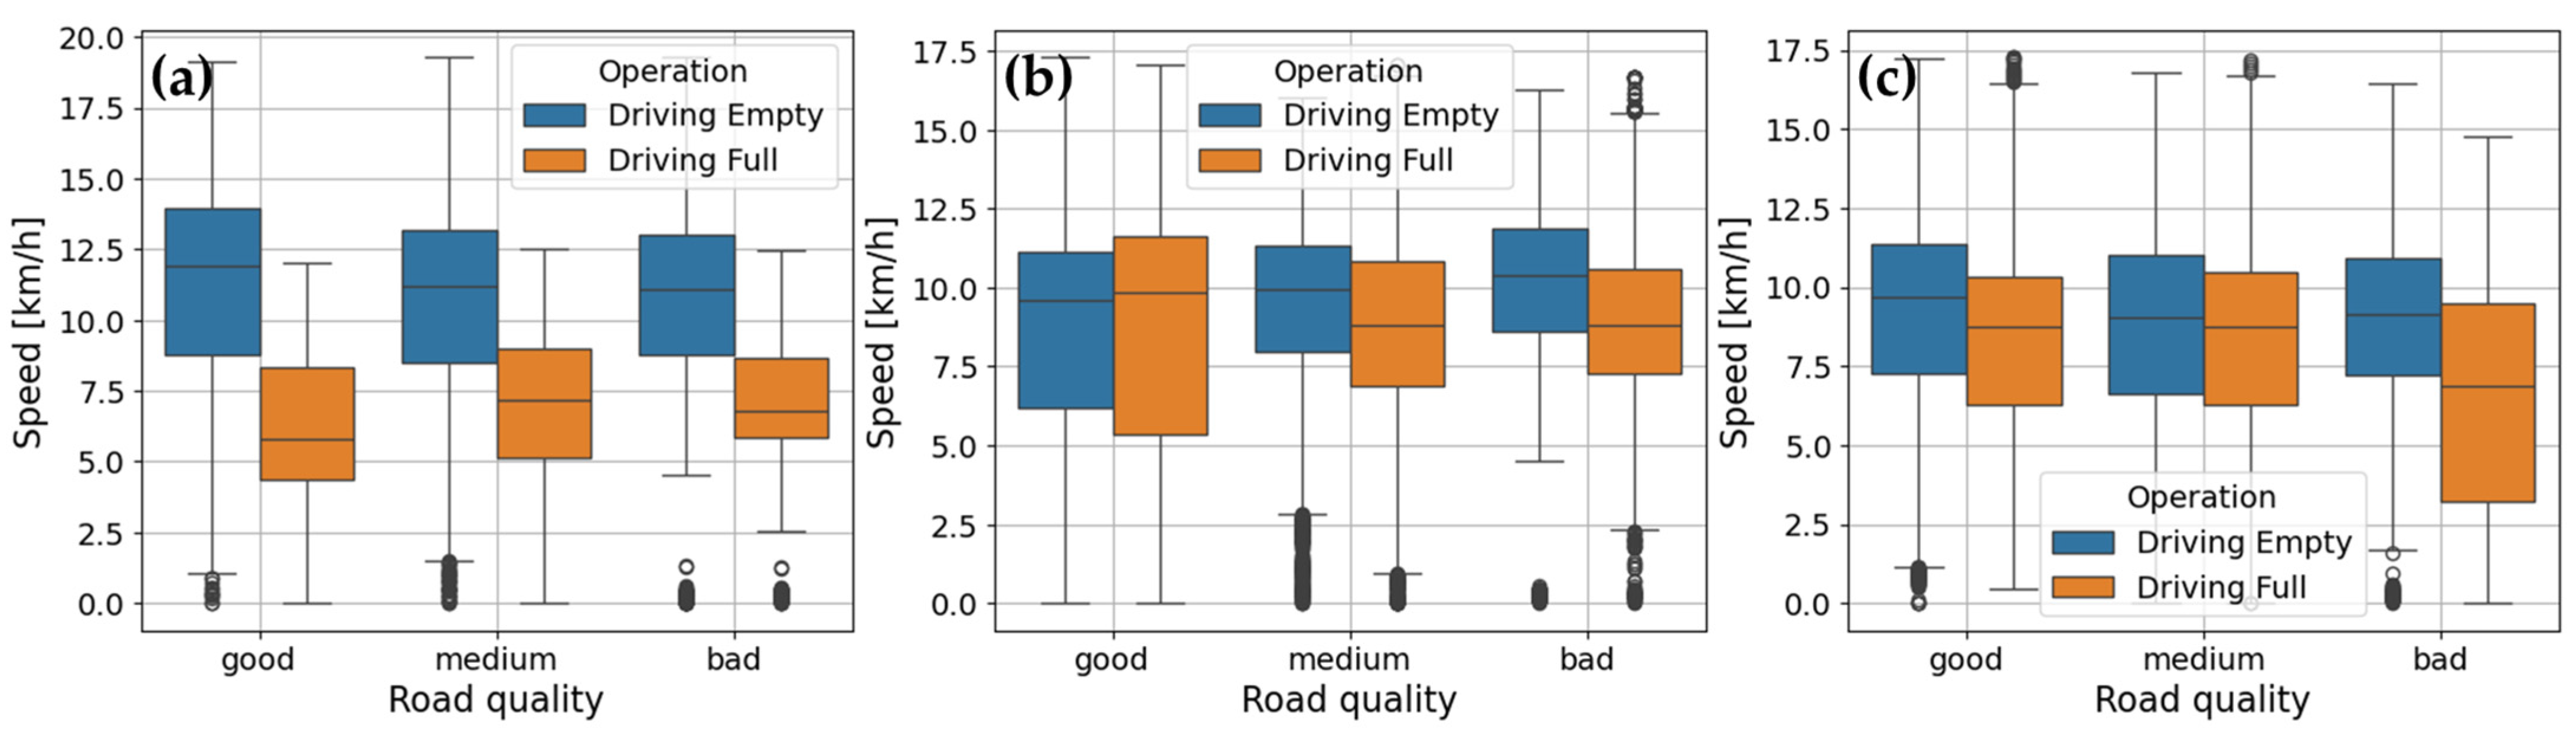
To examine whether the dependence of speed on road quality constitutes a general trend, speed distributions grouped by road quality were analyzed using boxplots (Figure 16). Figure 16a–c present results for three vehicles, with additional separation into full and empty driving. The relationship between decreasing speed and deteriorating road quality is not unambiguous and is visible only in some cases, most clearly for the third vehicle (Figure 16c). This indicates that road quality is not always the dominant factor influencing speed reduction, which is consistent with intuition, as speed is influenced by multiple factors. One of the primary factors is road geometry, including the presence of long straight sections, sharp curves, and varying gradients. Road width and limited visibility may also influence speed.
Figure 16.
Boxplots of vehicle speed versus road quality, shown separately for driving with a full and empty cargo box: (a)—first machine, (b)—second machine and (c)—third machine.
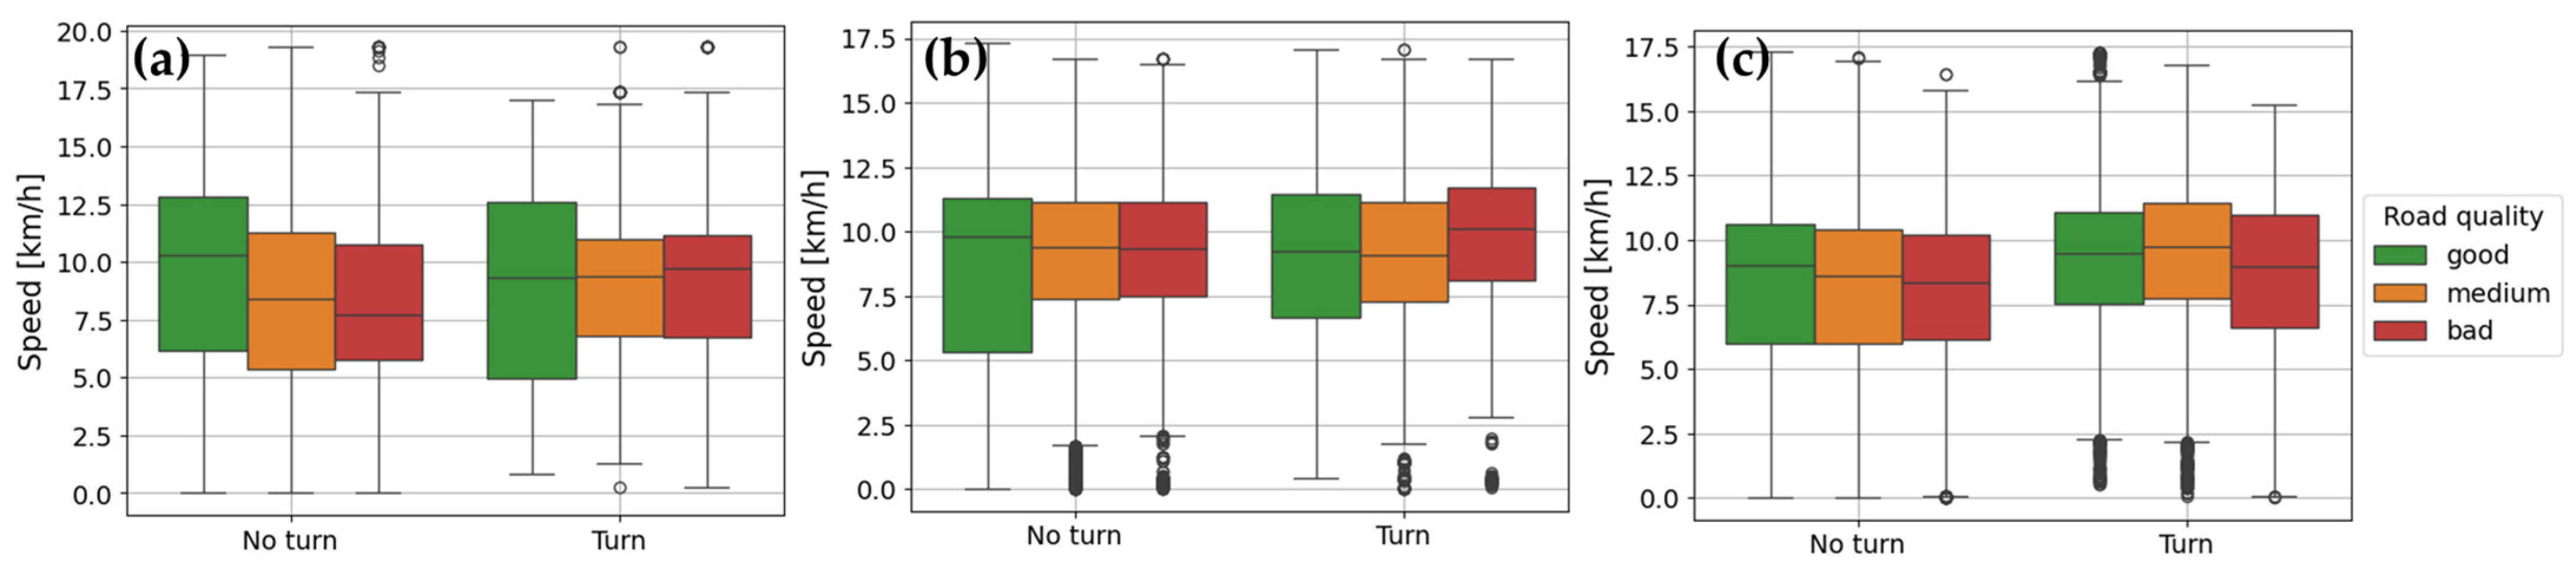
The analyzed haulage route is a spiral ramp containing numerous curves. As demonstrated earlier, the presence of curves—especially sharp ones—can necessitate speed reduction unrelated to road quality. Therefore, the relationship between speed and road quality was further examined by separating straight segments (no turn) from curved segments (turn)—Figure 17. Figure 17a–c present results for the three vehicles. For straight segments, a decreasing speed trend with worsening road quality is evident for all vehicles, particularly in the median values. This relationship is most pronounced for the first vehicle (Figure 17a), indicating that the operator driving this vehicle most strongly adapts speed to pavement condition. In contrast, no such trend is observed for curved segments, demonstrating that road quality is not the determining factor for speed in curves.
Figure 17.
Boxplots showing the distribution of speed versus road quality, separately for turns and no turns: (a)—first machine, (b)—second machine and (c)—third machine.
These analyses confirm that road quality has a significant influence on vehicle speed; however, speed is also affected by other factors, such as road geometry (e.g., sharp curves) and individual operator driving style. This further demonstrates that speed analysis alone is insufficient for unambiguous road condition assessment. In turn, only by combining vehicle speed information with road quality assessment results is it possible to identify route segments that systematically enforce speed reduction due to surface condition and may therefore require maintenance intervention. Moreover, analyzing data from multiple vehicles operated by different drivers helps reduce the influence of human factors and increases the reliability of conclusions regarding the actual condition of haul road infrastructure.
4. Discussion
The presented results demonstrate the potential of the proposed system to support haul road infrastructure maintenance in mining operations. The examples show that vehicle speed partially depends on road geometry. It is possible to identify road segments that are suboptimal in terms of transport efficiency. This is achieved by analyzing vehicle speed over repeated passes along the same route, which allows the identification of sections where vehicles systematically decelerate regardless of the operator’s driving style. The next step would require verification of the underlying causes of such issues and assessment of whether improvements are feasible. The problem may be related, for example, to excessively sharp curves, narrow road width, limited visibility, steep gradients, or poor surface conditions. It cannot be assumed that every such road segment can be improved; however, the analysis of these cases may also support more optimal and safer planning of new haul roads in the future.
One of the key factors that can be improved on haul roads is surface condition. As demonstrated in numerous studies, road surface quality has a direct impact on the service life of machines and their components [1,2]. However, striving to maintain haul roads in a perfectly smooth condition is not a justified approach, as the critical objective is to find an optimal balance between vehicle repair costs and road maintenance costs [9]. For this reason, identifying particularly critical road segments is essential. The proposed system, which combines road quality assessment with estimated vehicle speed, enables such identification. Detection of critical road segments can follow two directions. The first involves identifying sections where vehicles systematically decelerate due to deteriorated surface conditions, thereby creating transport bottlenecks. The conducted analyses confirmed that on straight road sections, average vehicle speed decreases as road surface quality worsens. Additionally, a specific segment was identified along the analyzed route where the vehicle consistently experiences strong deceleration due to poor surface conditions. Improving the pavement condition at these locations may contribute to increased transport efficiency and safety. The second direction involves identifying opposite cases, where operators do not reduce speed despite poor surface quality. In such segments, both vehicles and operators are exposed to increased risk, as impact forces acting on the vehicle increase exponentially with driving speed [2]. Consequently, improving surface condition on these sections may result in greater benefits in terms of vehicle service life and operator comfort than repairing road segments of similar degradation levels where vehicles already drive at lower speeds. This demonstrates that the proposed system can significantly improve haul road maintenance planning. While it cannot fully replace expert judgment, it can reduce the number of visual inspections and enable more efficient management of maintenance activities.
The proposed system is low-cost and requires only a single IMU sensor, which can be non-invasively mounted on any vehicle operating on mine roads. This ensures independence from other measurement systems and enables operation in harsh underground conditions, where GPS—commonly used in previous studies—is unavailable. The developed algorithms combine physics-based methods with unsupervised AI techniques and do not require training datasets or vehicle modeling, making the system highly universal.
Due to the lack of reference data from external sources, the accuracy of the speed estimation and road quality assessment results could not be quantitatively evaluated. However, several indications of result validity were demonstrated in the analysis. The estimated vehicle speed shows a logical relationship with road geometry and payload condition, such as reduced speed on curves and during uphill passes with a loaded cargo box. For road quality assessment, similarities were observed for consecutive passes along the same route. The results were not fully identical, which requires further investigation to identify the source of variability. These differences may indicate both method uncertainty and the influence of additional factors beyond surface condition, or they may result from short-term changes on the road between passes, such as loose material or rut formation.
The developed system directly addresses key challenges related to sustainable development in the mining industry in all three pillars:
Environmental impact:
- Extension of vehicle and component service life through identification and repair of critical road segments in terms of surface condition.
- Reduction in fuel consumption by detecting sections requiring speed reduction.
- Low environmental footprint of the monitoring system, based on a single inertial sensor.
- More efficient planning of road maintenance activities, resulting in fewer grader passes.
Economic impact:
- Increased transport efficiency and mitigation of bottlenecks through detection of road segments that enforce significant speed reductions.
- Reduction in operating costs related to fuel consumption and vehicle components such as tires and suspension systems.
- Decrease in downtime caused by sudden failures.
- Development of a system based on a low-cost sensor.
Social impact:
- Improved operator safety through the detection and repair of critical road segments requiring significant speed reduction.
- Reduced operator exposure to excessive vibrations affecting comfort and health through improved road surface quality.
- Support for management decisions based on objective, data-driven insights.
5. Conclusions
This paper presents a decision-support system for mine haul road maintenance based on road surface quality assessment and vehicle speed analysis. The proposed methods are based exclusively on a single IMU sensor, which was experimentally installed on three haul trucks operating in the Olympias Mine in Greece. Data collected during standard haulage operations, involving ore transport along a spiral ramp, enabled the development of methods for road condition monitoring, vehicle speed estimation, and route analysis. The analyzed haul route was over 3 km long, and three haul trucks performed a total of 17 haul cycles.
The described methods are based on a hybrid combination of the physical properties of inertial sensor measurements and unsupervised machine learning techniques. This approach allowed the development of a low-cost and universal system that can be transferred to other vehicles and mining sites. Analysis of the obtained results revealed a relationship in which average vehicle speed decreases as road quality deteriorates, provided that straight road sections are considered. This relationship is not the same for all operators, with speed decreasing on average from 1 km/h to 2.5 km/h. Selected route segments requiring priority intervention were also identified. These segments are characterized by a pronounced and repeatable reduction in driving speed (speed reduction by up to 7 km/h), associated in one case with a sharp curve and in another with poor road surface quality (speed reduction by up to 10 km/h).
The proposed system enables continuous monitoring of haul road conditions, thereby supporting predictive and data-driven maintenance strategies. By improving road condition and speed interpretation, the approach contributes to more sustainable mining operations through reduced energy consumption, lower maintenance costs, and improved safety and working conditions.
The work will be further developed primarily through testing on a larger dataset, including other types of machines such as wheel loaders. This will enable further refinement of the algorithms and facilitate the transfer of the solution to other machines, locations (different mines), and road surfaces.
Due to the lack of a reference source of data on vehicle speed and road quality, the performance of the proposed methods could only be evaluated indirectly, for example, through correlation with road geometry or repeatability of the results. Ultimately, the results should be compared with an independent data source to enable a quantitative assessment of the accuracy of the developed methods.
Future work also includes a detailed analysis of the impact of the proposed methods on various factors related to sustainable development. The assumptions of the method are consistent with the principles of sustainable development; however, a precise quantitative evaluation will only be possible after the system is implemented in the target environment and long-term data are collected. Comparative analyses of periods before and after implementation will then allow the determination of the quantitative impact of the method on economic, environmental, and social factors.
Author Contributions
Conceptualization, P.S., A.S., W.K., M.S. and D.J.; methodology, W.K. and A.S.; software, A.S. and W.K.; validation, M.S.; formal analysis, A.S. and W.K.; investigation, P.S. and A.S.; resources, P.S. and A.S.; data curation, W.K.; writing—original draft preparation, W.K. and P.S.; writing—review and editing A.S., M.S. and D.J.; visualization, W.K. and M.S.; supervision, P.S.; project administration, D.J. and P.S.; funding acquisition, D.J. and P.S. All authors have read and agreed to the published version of the manuscript.
Funding
This research was funded by European Union’s Horizon research and innovation programme, grant number 101092365.
Institutional Review Board Statement
Not applicable.
Informed Consent Statement
Not applicable.
Data Availability Statement
The data used in this study are confidential and were made available exclusively for the implementation of the NetHelix project. Therefore, they are not publicly available. The developed algorithms have been implemented in the decision support system (DSS) deployed at the Hellas Gold Olympias mine.
Conflicts of Interest
Authors Wioletta Koperska, Paweł Stefaniak, Artur Skoczylas and Maria Stachowiak were employed by the company KGHM Cuprum Ltd.—Research and Development Centre. Author Dariusz Janik was employed by the company EIT RawMaterials GmbH.
References
- Hartman, H.L.; Mutmansky, J.M. Introductory Mining Engineering; John Wiley & Sons: Hoboken, NJ, USA, 2002. [Google Scholar]
- Tannant, D.; Regensburg, B. Guidelines for Mine Haul Road Design; University of British Columbia Library: Vancouver, BC, Canada, 2001. [Google Scholar]
- Shakenov, A.; Sładkowski, A.; Stolpovskikh, I. Haul road condition impact on tire life of mining dump truck. Sci. Bull. Natl. Min. Univ. 2022, 6, 25–29. [Google Scholar] [CrossRef] [Scilit]
- Stefaniak, P.; Koperska, W.; Skoczylas, A.; Witulska, J.; Śliwiński, P. Methods of Optimization of Mining Operations in a Deep Mine—Tracking the Dynamic Overloads Using IoT Sensor. IEEE Access 2023, 11, 79384–79396. [Google Scholar] [CrossRef] [Scilit]
- Neghab, M.; Kasaeinasab, A.; Yousefi, Y.; Hassanzadeh, J.; Sarreshtedar, H.; Alighanbari, N. Health Effects of Long-Term Occupational Exposure to Whole Body Vibration: A Study on Drivers of Heavy Motor Vehicles in Iran; Shriaz University of Medical Sciences: Shiraz, Iran, 2016; pp. 76–82. [Google Scholar]
- Kim, J.H.; Zigman, M.; Aulck, L.S.; Ibbotson, J.A.; Dennerlein, J.T.; Johnson, P.W. Whole body vibration exposures and health status among professional truck drivers: A cross-sectional analysis. Ann. Occup. Hyg. 2016, 60, 936–948. [Google Scholar] [CrossRef] [Scilit]
- Bhuiyan, M.H.; Fard, M.; Robinson, S.R. Effects of whole-body vibration on driver drowsiness: A review. J. Saf. Res. 2022, 81, 175–189. [Google Scholar] [CrossRef] [Scilit] [PubMed]
- ISO 2631-5:2018; Mechanical Vibration and Shock—Evaluation of Human Exposure to Whole-Body Vibration Part 5: Method for Evaluation of Vibration Containing Multiple Shocks. ISO: Vernier, Switzerland, 2018.
- Thompson, R.J.; Visser, A. Mine haul road maintenance management systems. J. South. Afr. Inst. Min. Metall. 2003, 103, 303–312. [Google Scholar]
- Sayers, M.W.; Gillespie, T.D.; Queiroz, C.A. The International Road Roughness Experiment: Establishing Correlation and a Calibration Standard for Measurements; University of Michigan, Ann Arbor, Transportation Research Institute: Ann Arbor, MI, USA, 1986. [Google Scholar]
- Múčka, P. International Roughness Index specifications around the world. Road Mater. Pavement Des. 2017, 18, 929–965. [Google Scholar] [CrossRef] [Scilit]
- Nguyen, T.; Lechner, B.; Wong, Y.D. Response-based methods to measure road surface irregularity: A state-of-the-art review. Eur. Transp. Res. Rev. 2019, 11, 43. [Google Scholar] [CrossRef] [Scilit]
- Mednis, A.; Strazdins, G.; Zviedris, R.; Kanonirs, G.; Selavo, L. Real time pothole detection using android smartphones with accelerometers. In Proceedings of the 2011 International Conference on Distributed Computing in Sensor Systems and Workshops (DCOSS), Barcelona, Spain, 27–29 June 2011; pp. 1–6. [Google Scholar] [CrossRef] [Scilit]
- Mohan, P.; Padmanabhan, V.N.; Ramjee, R. Nericell: Rich monitoring of road and traffic conditions using mobile smartphones. In Proceedings of the 6th ACM Conference on Embedded Network Sensor Systems, Raleigh, NC, USA, 5–7 November 2008; pp. 323–336. [Google Scholar] [CrossRef] [Scilit]
- Eriksson, J.; Girod, L.; Hull, B.; Newton, R.; Madden, S.; Balakrishnan, H. The pothole patrol: Using a mobile sensor network for road surface monitoring. In Proceedings of the 6th International Conference on Mobile Systems, Applications, and Services, Breckenridge, CO, USA, 17–20 June 2008; pp. 29–39. [Google Scholar] [CrossRef] [Scilit]
- Basavaraju, A.; Du, J.; Zhou, F.; Ji, J. A machine learning approach to road surface anomaly assessment using smartphone sensors. IEEE Sens. J. 2019, 20, 2635–2647. [Google Scholar] [CrossRef] [Scilit]
- Vittorio, A.; Rosolino, V.; Teresa, I.; Vittoria, C.M.; Vincenzo, P.G.; Francesco, D.M. Automated sensing system for monitoring of road surface quality by mobile devices. Procedia-Soc. Behav. Sci. 2014, 111, 242–251. [Google Scholar] [CrossRef] [Scilit]
- Eshkabilov, S.; Yunusov, A. Measuring and assessing road profile by employing accelerometers and IRI assessment tools. Am. J. Traffic Transp. Eng. 2018, 3, 24–40. [Google Scholar] [CrossRef] [Scilit]
- Setiawan, E.B.; Nurdin, H. Road quality assessment using international roughness index method and accelerometer on android. Lontar Komput. J. Ilm. Teknol. Inf. 2019, 10, 62–73. [Google Scholar] [CrossRef] [Scilit]
- Mahmoudzadeh, M.R.; Got, J.B.; Lambot, S.; Grégoire, C. Road inspection using full-wave inversion of far-field ground-penetrating radar data. In Proceedings of the 2013 7th International Workshop on Advanced Ground Penetrating Radar, Nantes, France, 2–5 July 2013; pp. 1–6. [Google Scholar] [CrossRef] [Scilit]
- Rateke, T.; Justen, K.A.; Von Wangenheim, A. Road surface classification with images captured from low-cost camera-road traversing knowledge (rtk) dataset. Rev. Informática Teórica Apl. 2019, 26, 50–64. [Google Scholar] [CrossRef] [Scilit]
- Brewer, E.; Lin, J.; Kemper, P.; Hennin, J.; Runfola, D. Predicting road quality using high resolution satellite imagery: A transfer learning approach. PLoS ONE 2021, 16, e0253370. [Google Scholar] [CrossRef] [Scilit]
- Abou Chacra, D.B.; Zelek, J.S. Fully automated road defect detection using street view images. In Proceedings of the 2017 14th Conference on Computer and Robot Vision (CRV), Edmonton, AB, Canada, 16–19 May 2017; pp. 353–360. [Google Scholar] [CrossRef] [Scilit]
- Hugo, D.; Heyns, P.S.; Thompson, R.J.; Visser, A.T. Haul road defect identification using measured truck response. J. Terramech. 2008, 45, 79–88. [Google Scholar] [CrossRef] [Scilit]
- Ngwangwa, H.M.; Heyns, P.S. Application of an ANN-based methodology for road surface condition identification on mining vehicles and roads. J. Terramech. 2014, 53, 59–74. [Google Scholar] [CrossRef] [Scilit]
- Skoczylas, A.; Stefaniak, P.; Gryncewicz, W.; Rot, A. The Concept of an intelligent decision support system for ore transportation in underground mine. Procedia Comput. Sci. 2023, 225, 922–931. [Google Scholar] [CrossRef] [Scilit]
- NETHELIX. Intelligent Digital Toolbox Towards More Sustainable and Safer Extraction of Mineral Resources (Grant Agreement No. 101092365); European Commission Horizon: Attica, Greece, 2022. [Google Scholar]
- Yu, J.; Zhu, H.; Han, H.; Chen, Y.J.; Yang, J.; Zhu, Y.; Chen, Z.; Xue, G.; Li, M. Senspeed: Sensing driving conditions to estimate vehicle speed in urban environments. IEEE Trans. Mob. Comput. 2015, 15, 202–216. [Google Scholar] [CrossRef] [Scilit]
- Ustun, I.; Cetin, M. Speed estimation using smartphone accelerometer data. Transp. Res. Rec. 2019, 2673, 65–73. [Google Scholar] [CrossRef] [Scilit]
- Witulska, J.; Stefaniak, P.; Jachnik, B.; Skoczylas, A.; Śliwiński, P.; Dudzik, M. Recognition of LHD position and maneuvers in underground mining excavations—Identification and parametrization of turns. Appl. Sci. 2021, 11, 6075. [Google Scholar] [CrossRef] [Scilit]
- Killick, R.; Fearnhead, P.; Eckley, I.A. Optimal detection of changepoints with a linear computational cost. J. Am. Stat. Assoc. 2012, 107, 1590–1598. [Google Scholar] [CrossRef] [Scilit]
- MacQueen, J. Some methods for classification and analysis of multivariate observations. In Proceedings of the Fifth Berkeley Symposium on Mathematical Statistics and Probability; University of California Press: Berkeley, CA, USA, 1967. [Google Scholar]
- Skoczylas, A.; Stefaniak, P.; Anufriiev, S.; Jachnik, B. Road Quality Classification Adaptive to Vehicle Speed Based on Driving Data from Heavy Duty Mining Vehicles. In Proceedings of the International Conference on Intelligent Computing & Optimization, Koh Samui, Thailand, 17–18 December 2020; pp. 777–787. [Google Scholar] [CrossRef] [Scilit]
- Skoczylas, A.; Stefaniak, P.; Anufriiev, S.; Koperska, W. Deep Learning for Ore Haulage Monitoring: Vibrational Analysis Using a VGG16 Network. IEEE Access 2025, 13, 33138–33147. [Google Scholar] [CrossRef] [Scilit]




Disclaimer/Publisher’s Note: The statements, opinions and data contained in all publications are solely those of the individual author(s) and contributor(s) and not of MDPI and/or the editor(s). MDPI and/or the editor(s) disclaim responsibility for any injury to people or property resulting from any ideas, methods, instructions or products referred to in the content. |
© 2026 by the authors. Licensee MDPI, Basel, Switzerland. This article is an open access article distributed under the terms and conditions of the Creative Commons Attribution (CC BY) license.