


Abstract
This paper presents a detailed life cycle assessment (LCA) of a Dynamic Sand Filter continuous upflow sand filtration system used in municipal and industrial wastewater treatment. This study evaluates the environmental impacts associated with raw material extraction, manufacturing, transportation, operation, and end-of-life disposal. Using the TRACI methodology and following ISO 14040/44 standards, the results indicate that operational energy use, primarily electricity consumption, is the dominant environmental contributor, accounting for over 99% of total Global Warming Potential (GWP). Comparative analyses demonstrate that Dynamic Sand Filter outperforms conventional Dynamic Sand Filtration Methods (DSFMs) in both energy and emission efficiency across multiple wastewater treatment scenarios. The findings emphasize the environmental advantages of continuous filtration systems and highlight opportunities for further optimization through renewable energy integration and eco-design improvements, with the technology presenting savings of over 40 percent lower CO2 per cubic meter in operational emissions and over 25 percent lower overall energy consumption. Additionally, this research includes further comparison with conventional Rapid Sand Filters and simulated suggestions to enhance ecological footprint.
1. Introduction
Wastewater treatment processes are inherently energy-intensive and can contribute significantly to environmental burdens, particularly in terms of greenhouse gas emissions, water consumption, and material use [1,2]. With increasing global concern over climate change, resource depletion, and water scarcity, the sustainability of wastewater treatment technologies has become a critical issue. Regulatory agencies, environmental organizations, and decision makers are therefore placing greater emphasis on the adoption of treatment systems that can achieve technical performance while reducing environmental impacts.
Among the available technologies, Dynamic Sand Filters (DSFs) have emerged as a promising option for both municipal and industrial wastewater treatment applications. These systems offer several operational advantages, including compact design, reduced maintenance requirements, and continuous filtration without the need for frequent backwashing [3,4]. Unlike conventional filtration systems, which rely on intermittent cleaning cycles associated with higher water and energy consumption, DSF systems operate through a continuous upflow mechanism in which wastewater passes through a sand bed, allowing filtration and media regeneration to occur simultaneously. These features suggest that DSF may represent a more resource-efficient alternative to conventional filtration technologies.
A key tool for evaluating such environmental performance is life cycle assessment (LCA), which provides a systematic and internationally recognized framework for quantifying environmental impacts across the full life cycle of a system [5]. In wastewater treatment applications, LCA is widely used to assess important indicators such as Global Warming Potential (GWP), energy demand, and water use, thereby supporting evidence-based decision making and sustainable process design [6]. By considering all stages of a product or system, LCA enables a more complete understanding of the trade-offs associated with different technological options.
Despite the growing interest in resource-efficient filtration systems, the environmental performance of Dynamic Sand Filters has not yet been comprehensively quantified using a full life cycle perspective. Most previous studies have focused primarily on technical performance and treatment efficiency, with limited attention to the cradle-to-grave environmental implications of the system. A proper evaluation requires consideration of all relevant life cycle stages, including raw material extraction, manufacturing, transportation, installation, operation, maintenance, and end-of-life disposal [7]. Such an approach is necessary to determine whether the operational advantages of DSF translate into measurable environmental benefits when compared with other filtration technologies.
Accordingly, this study aims to evaluate the environmental performance of the Dynamic Sand Filter system using a life cycle assessment approach, with particular emphasis on Global Warming Potential as a key impact indicator. By adopting a cradle-to-grave methodology and comparing DSF with conventional filtration technologies, the study seeks to provide quantitative insight into energy use, emissions, and overall environmental performance in wastewater treatment applications [8]. The findings are intended to support designers, operators, and decision makers in selecting more sustainable wastewater treatment solutions.
Thus, accordingly, this research aims to evaluate the appropriateness of utilizing Dynamic Sand Filters through an LCA approach using the following steps:
- Quantitatively comparing the environmental performance of Dynamic Sand Filters with that of conventional filtration technologies;
- Evaluating the contribution of operational energy use, material consumption, and maintenance activities to overall environmental impact;
- Providing transparent and decision-relevant information to support the selection of sustainable wastewater treatment technologies.
2. Literature Review
2.1. LCA of Wastewater Treatment Plants
Life cycle assessment, or LCA, is now the standard approach to checking how wastewater treatment technologies impact the environment. Treating wastewater consumes significant energy and materials, so LCA enables comprehensive evaluation from start to finish, measuring things like Global Warming Potential and how fast resources are depleted.
Corominas et al. (2013) [1] set the standard for using LCA with wastewater treatment plants. They showed that in systems using activated sludge, it is usually the electricity used during operation that drives most of the global warming impact [1]. Pasqualino et al. (2009) confirmed this by indicating that if you tweak how the plant runs, you can cut down a lot on the environmental downsides, particularly those tied to energy use [2].
Hospido (2008) and Rodríguez-García (2011) compared different setups and plant sizes and agreed that how you design and scale a plant changes its environmental footprint, but the day-to-day running of the plant matters way more over time than the construction or which materials went into it [7,8].
Most of these studies follow ISO 14040/44 rules [5] and use environmental impact assessment tools such as The Tool for Reduction and Assessment of Chemicals and Other Environmental Impacts (TRACI) [9]. TRACI provides characterization factors for LCA, industrial ecology, and sustainability metrics. Sticking to these methods keeps things consistent and makes it easier to compare one technology to another [7,8].
In this research, three key issues emerge, detailed as follows.
The first is operational energy use consumption, which is the main environmental weakness within the assessed system.
The second is the source of electricity used (the “mix”), where the electricity supply mix significantly influences the overall Global Warming Potential.
The third is the selection of the most appropriate treatment technology, which requires a direct comparative assessment using LCA methodologies.
These three points establish the fundamental framework for evaluating the environmental performance of the Dynamic Sand Filter and other Dynamic Sand Filtration technologies.
2.2. Dynamic Sand Filter
The Dynamic Sand Filter technology used in this study is DynaSand, which is a continuous upflow sand filter designed by Parkson Corporation; it represents a significant advancement in tertiary wastewater filtration [3]. Its key distinguishing feature is its ability to operate continuously. In contrast to conventional Rapid Sand Filters, which require periodic shutdown for backwashing, the Dynamic Sand Filter performs filtration and sand cleaning simultaneously. This is achieved through an integrated system that employs airlift pumps and an internal sand washing process.
Nielsen and Petersen (2015) point out that these filters are more stable hydraulically, take up less space, and use less wash water than traditional systems [4]. Since the process does not need to pause for cleaning, one can obtain more consistent water quality, which is especially useful for municipal and industrial wastewater polishing.
From an environmental perspective, continuous operation offers several advantages, including reduced energy demand for backwashing, lower water consumption, and decreased reliance on pumps for cleaning. However, the energy required to operate the airlift and recirculation pumps remains a critical factor in evaluating the system’s overall sustainability performance.
Several studies have investigated the operational performance of Dynamic Sand Filters. However, comprehensive cradle-to-grave LCA studies are relatively limited. Much of the existing literature focuses primarily on operational efficiency and treatment performance, while giving less attention to upstream factors such as material production, electronic components, and manufacturing impacts. Consequently, recent LCA-based studies that track emissions and energy consumption across the entire life cycle are particularly valuable for providing a more complete understanding of the system’s environmental performance.
2.3. DSFM Technologies
Dynamic Sand Filtration Methods, or DSFM, cover a range of sand filtration systems that keep the sand moving and use mechanical or hydraulic cleaning. Most of these setups use large reinforced concrete tanks and include features such as built-in air scouring or hydraulic backwashing. Different types include
- Continuous upflow sand filters;
- Hydraulic washer systems;
- Airlift sand circulation units;
- Expanded clay aggregate filters.
Compared to systems like the Dynamic Sand Filter, DSFM setups are usually bigger and heavier. They use more concrete, ramp up the air scouring, and need more pumping power. In addition, they need more space to be installed.
Reviewing the literature on Dynamic Sand Filtration systems reveals that energy efficiency largely depends on the effectiveness of media circulation and the magnitude of hydraulic losses within the system. Systems that require intensive air scouring typically exhibit higher operational energy demands due to the additional energy required to maintain adequate media movement and overcome hydraulic resistance.
From an LCA perspective, DSFM technologies may exhibit slightly lower embodied carbon during the construction phase, primarily because concrete structures are commonly used instead of steel-intensive components. However, numerous wastewater treatment studies consistently demonstrate that the operational phase is the main contributor to overall environmental impact, largely due to electricity consumption during system operation.
In this context, it is important to clearly distinguish between embodied impacts—associated with materials production and construction activities—and operational impacts, which include electricity consumption, routine maintenance, and periodic replacement of filter media [1,7]. Over the system’s lifetime, improvements in energy efficiency and reduced maintenance requirements can offset the relatively higher emissions associated with the initial construction phase.
2.4. Rapid Sand Filters
Rapid Sand Filters, or RSFs, are reasonably common in city water and wastewater treatment plants. They differ from continuous filters that run continuously. They work in cycles and must be periodically shutdown for backwashing. This process increases use of water and interrupts system operation.
When comparing RSFs to other filters in life cycle assessments, a few things stand out. RSFs do not use very complicated materials to build, and their energy needs are average. However, they need more space, and they need more water time to wash the filters out.
Sometimes, depending on how they are set up, RSFs give off less carbon per cubic meter of water they clean. However, their overall environmental impact shows they often use more land because they are bigger.
This highlights an important trade-off in technology selection: compact systems such as Dynamic Sand Filters can reduce land requirements and may offer a smaller overall ecological footprint, even when their carbon emissions are slightly higher than some alternative technologies. This illustrates that a lower carbon footprint does not always correspond to a reduced overall environmental impact, particularly when land use and spatial constraints are considered.
Life cycle assessment (LCA) studies of filtration technologies, including Dynamic Sand Filters and Dynamic Sand Filtration Methods (DSFMs), consistently identify electricity consumption as one of the major contributors to environmental impact. Electricity use is the dominant driver of Global Warming Potential, largely because energy-intensive components such as pumps, compressors, and airlift systems are required to maintain continuous filtration processes. Corominas et al. (2013) emphasize that the electricity generation mix plays a critical role in determining the overall climate impact of wastewater treatment plant LCAs [1].
Material-related impacts also contribute significantly to the environmental profile of these systems. Steel production is associated with high embodied energy and carbon emissions, with Hammond et al. (2008) demonstrating the substantial consumption [10].
Recent advances in wastewater treatment have increasingly prioritized energy efficiency and reduced environmental impact, driven by mounting challenges like climate change, water scarcity, and tighter regulations. Life cycle assessment (LCA) has become the go-to method for evaluating the environmental performance of these systems, offering a thorough analysis from raw material extraction to end-of-life disposal [11,12,13].
A growing body of research confirms that operational energy use is the main driver of environmental impacts in wastewater treatment plants. For example, Lorenzo Corominas et al. found that electricity consumption during operation can account for over 70–90% of the total Global Warming Potential (GWP), depending on system design and regional energy sources [1,11]. Similarly, Rashid’s work underscores how optimizing operating conditions and implementing energy recovery can substantially lower environmental burdens [14].
Meanwhile, integrating renewable energy into treatment processes has gained traction [15]. Studies show that pairing treatment plants with solar or biogas systems can cut GWP by up to 40%, especially in energy-heavy stages like aeration and filtration [16,17]. This shift highlights the need to consider not just process efficiency but also the origin of energy in LCA evaluations [18].
In filtration technology, continuous systems such as Dynamic Sand Filters are drawing attention for their stable performance and reduced backwashing needs [19]. Recent comparisons suggest they lower water use and minimize operational downtime, boosting overall efficiency [3,12]. Improvements in filter media and hydraulic design have further enhanced pollutant removal while keeping energy demands low [20].
Conventional Dynamic Sand Filtration Methods (DSFMs) and Rapid Sand Filters remain popular due to their straightforward operation and reliability. However, LCA-based studies indicate they may lead to higher energy use, especially when frequent backwashing or air scouring is required [4,21]. Comparisons between membrane, sand, and hybrid filtration systems reveal no one-size-fits-all solution—environmental outcomes depend heavily on influent quality, treatment goals, and local operating conditions [12,22].
Another key trend is the move beyond carbon footprint alone. While GWP remains central, researchers are now including other impact categories—such as eutrophication potential, human toxicity, and resource depletion—to offer a more complete picture of environmental trade-offs [13,23]. This broader approach helps prevent shifting burdens from one category to another.
Still, several gaps persist. Few cradle-to-grave LCA studies focus specifically on continuous upflow sand filtration systems [24]. Comparative assessments between Dynamic Sand Filters and other dynamic filtration technologies often rely on inconsistent assumptions, reducing their reliability. Moreover, few studies simultaneously assess carbon emissions alongside ecological footprint or land-use impacts, which are critical factors for compact treatment solutions. Regional differences in electricity mix, local manufacturing, and waste management practices are also frequently overlooked, despite their major influence on LCA results [14,25].
This study addresses these gaps by delivering a detailed, scenario-based LCA of the Dynamic Sand Filter system, covering diverse operational conditions and focusing on system boundaries, energy use, and environmental performance, thereby providing a more robust foundation for future decision making.
2.5. Limitations in the Literature
Even though several LCA studies have been conducted on wastewater treatment plants, some gaps are evident:
- Not many peer-reviewed cradle-to-grave LCAs really focus on Dynamic Sand Filter technology;
- There is a real shortage of LCAs that compare the Dynamic Sand Filter with other DSFM systems using the same functional units;
- Hardly any studies look at ecological footprint together with carbon footprint;
- Few studies have been conducted to compare local manufacturing with imported system components;
- Egyptian datasets are lacking, as in the case of Egyptian electricity mix and grid system. Thus, the databases used are from other regions. Unifying usages for all technologies ensures proper and valid comparison;
- In detailed wastewater treatment life cycle assessments, sludge management—encompassing both treatment and disposal—is frequently recognized as a key factor in environmental impacts, especially regarding energy consumption and emissions. Yet, how significant it is depends on the assessment’s scope and defined system boundaries.
Filling these gaps helps decision makers to choose the most appropriate sustainable wastewater infrastructure systems while accounting for LCA, a factor that has previously been largely ignored. Accordingly, and based on the limitations highlighted, this paper aims to evaluate the use of the Dynamic Sand Filter through an LCA approach that compares this technology with a number of competing technologies to evaluate its application.
3. Materials and Methods
The LCA conducted follows ISO 14040/44 standards [5,26] and applies the TRACI impact assessment methodology. The functional unit is defined as the treatment of 1 cubic meter of wastewater to regulatory standards in order to help with the normalization process in the upcoming comparative sections. To ensure a fair and functionally equivalent comparison, all treatment systems in this study are assumed to meet the same effluent quality standards and regulatory discharge limits. As a result, variations in contaminant removal efficiencies are not explicitly modeled, since the functional unit is defined by treated water that satisfies identical performance requirements.
A cradle-to-grave system boundary includes raw material extraction, manufacturing, transportation, construction, operation, maintenance, and end-of-life disposal. Primary and secondary data were collected from technical data sheets, site metering, supplier consultations, and published databases such as OpenLCA, Ecoinvent, and OneClick [9,10].
The TRACI (Tool for the Reduction and Assessment of Chemical and Other Environmental Impacts) methodology was chosen for impact assessment because of its compatibility with OpenLCA databases and its strong performance in midpoint characterization. Widely used in environmental evaluations of wastewater treatment systems, TRACI delivers clear, consistent impact indicators.
While TRACI was primarily developed under North American conditions, this study focuses on comparative analysis within uniform system boundaries and assumptions. Therefore, using TRACI does not compromise the validity of relative comparisons between scenarios. The method remains well suited for pinpointing environmental hotspots and assessing differences in performance.
In its simplest form, this LCA study concentrates on the Dynamic Sand Filter filtration system, leaving out other phases of the wastewater treatment process i.e., pre-treatment or biological post-treatment. The cradle-to-grave approach to comparative analysis encompasses a number of scenarios covering all pertinent life cycle stages from the extraction of raw materials to the ultimate disposal or recycling of materials at the end of the system’s life.
It is crucial to remember that due to limitations in data availability, some assumptions have been made. For example, standard industry practices and supplier data were used to estimate transportation distances. When specific data from suppliers could not be obtained, proxy data from Open LCA, Ecoinvent, OneClick or other reliable databases were used in certain situations.
To improve transparency and reproducibility, it is important to note that all datasets were taken from the mentioned databases, since the data was derived and cross-verified from operation records and established literature benchmarks. This includes the operational electricity mix, which reflects the U.S. average grid composition unified for all technologies and scenarios.
The same approach was applied for the material production datasets. All material inputs such as concrete, steel, PVC, and auxiliary components were drawn from the OpenLCA, Ecoinvent and OneClick databases. These datasets were also used for any operational parameters like energy consumption, sand replacement frequency, and pumping needs. To enable a fair and consistent comparison with traditional wastewater treatment systems, all systems were modeled using the same functional unit of 1 cubic meter of treated water and were modeled within identical system boundaries. Key operational assumptions such as energy consumption, maintenance needs, material inputs, and expected lifespan were kept uniform across all scenarios and comparisons for all technologies.
Aligning these factors ensured that observed differences in GWP environmental impact truly represent variations in system performance, not inconsistencies in modeling approaches or data sources. This unified framework strengthens the reliability of comparisons and enhances the reproducibility of results.
For DynaSand, key materials include stainless steel, silica sand, HDPE, and PVC. Energy and operational data were gathered through real-time logging and site monitoring.
While end-of-life assumptions incorporated recycling and landfilling practices based on local waste management systems, we carried out simulations using material-specific disposal routes, including recycling, landfilling, and recovery options.
Key assumptions included that steel components had a 90% recycling rate as consistent with typical industrial practices. Recycled steel generates environmental benefits through the avoided burden approach, effectively offsetting emissions and resource use linked to producing virgin steel. Plastic materials (HDPE, PVC) recycling rates were set between 10% and 20%, with the remainder assumed to be landfilled due to current limitations in recycling infrastructure.
Additionally, electronic components were treated via specialized waste handling procedures, with about 20% of materials recovered and the rest managed as hazardous waste. Sand media were classified as inert, being assumed to be either reused on site or disposed of in landfill without significant environmental impact. Transport to disposal sites had standardized distances based on regional waste management norms and relied on established database proxies.
All EoL processes were modeled using data from Ecoinvent and OpenLCA databases. The avoided burden approach was specifically applied to recyclable materials—especially steel—to account for the environmental savings from recovering and reusing materials instead of extracting and processing new ones.
These assumptions align with widely reported industry standards and were unified for all technologies in comparisons.
Primary and secondary data were collected from various sources. The following Table 1 shows a summary of several activities and the sources of data:
Table 1.
Tasks and data sources.
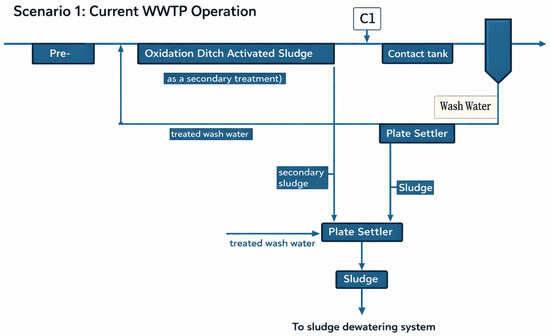
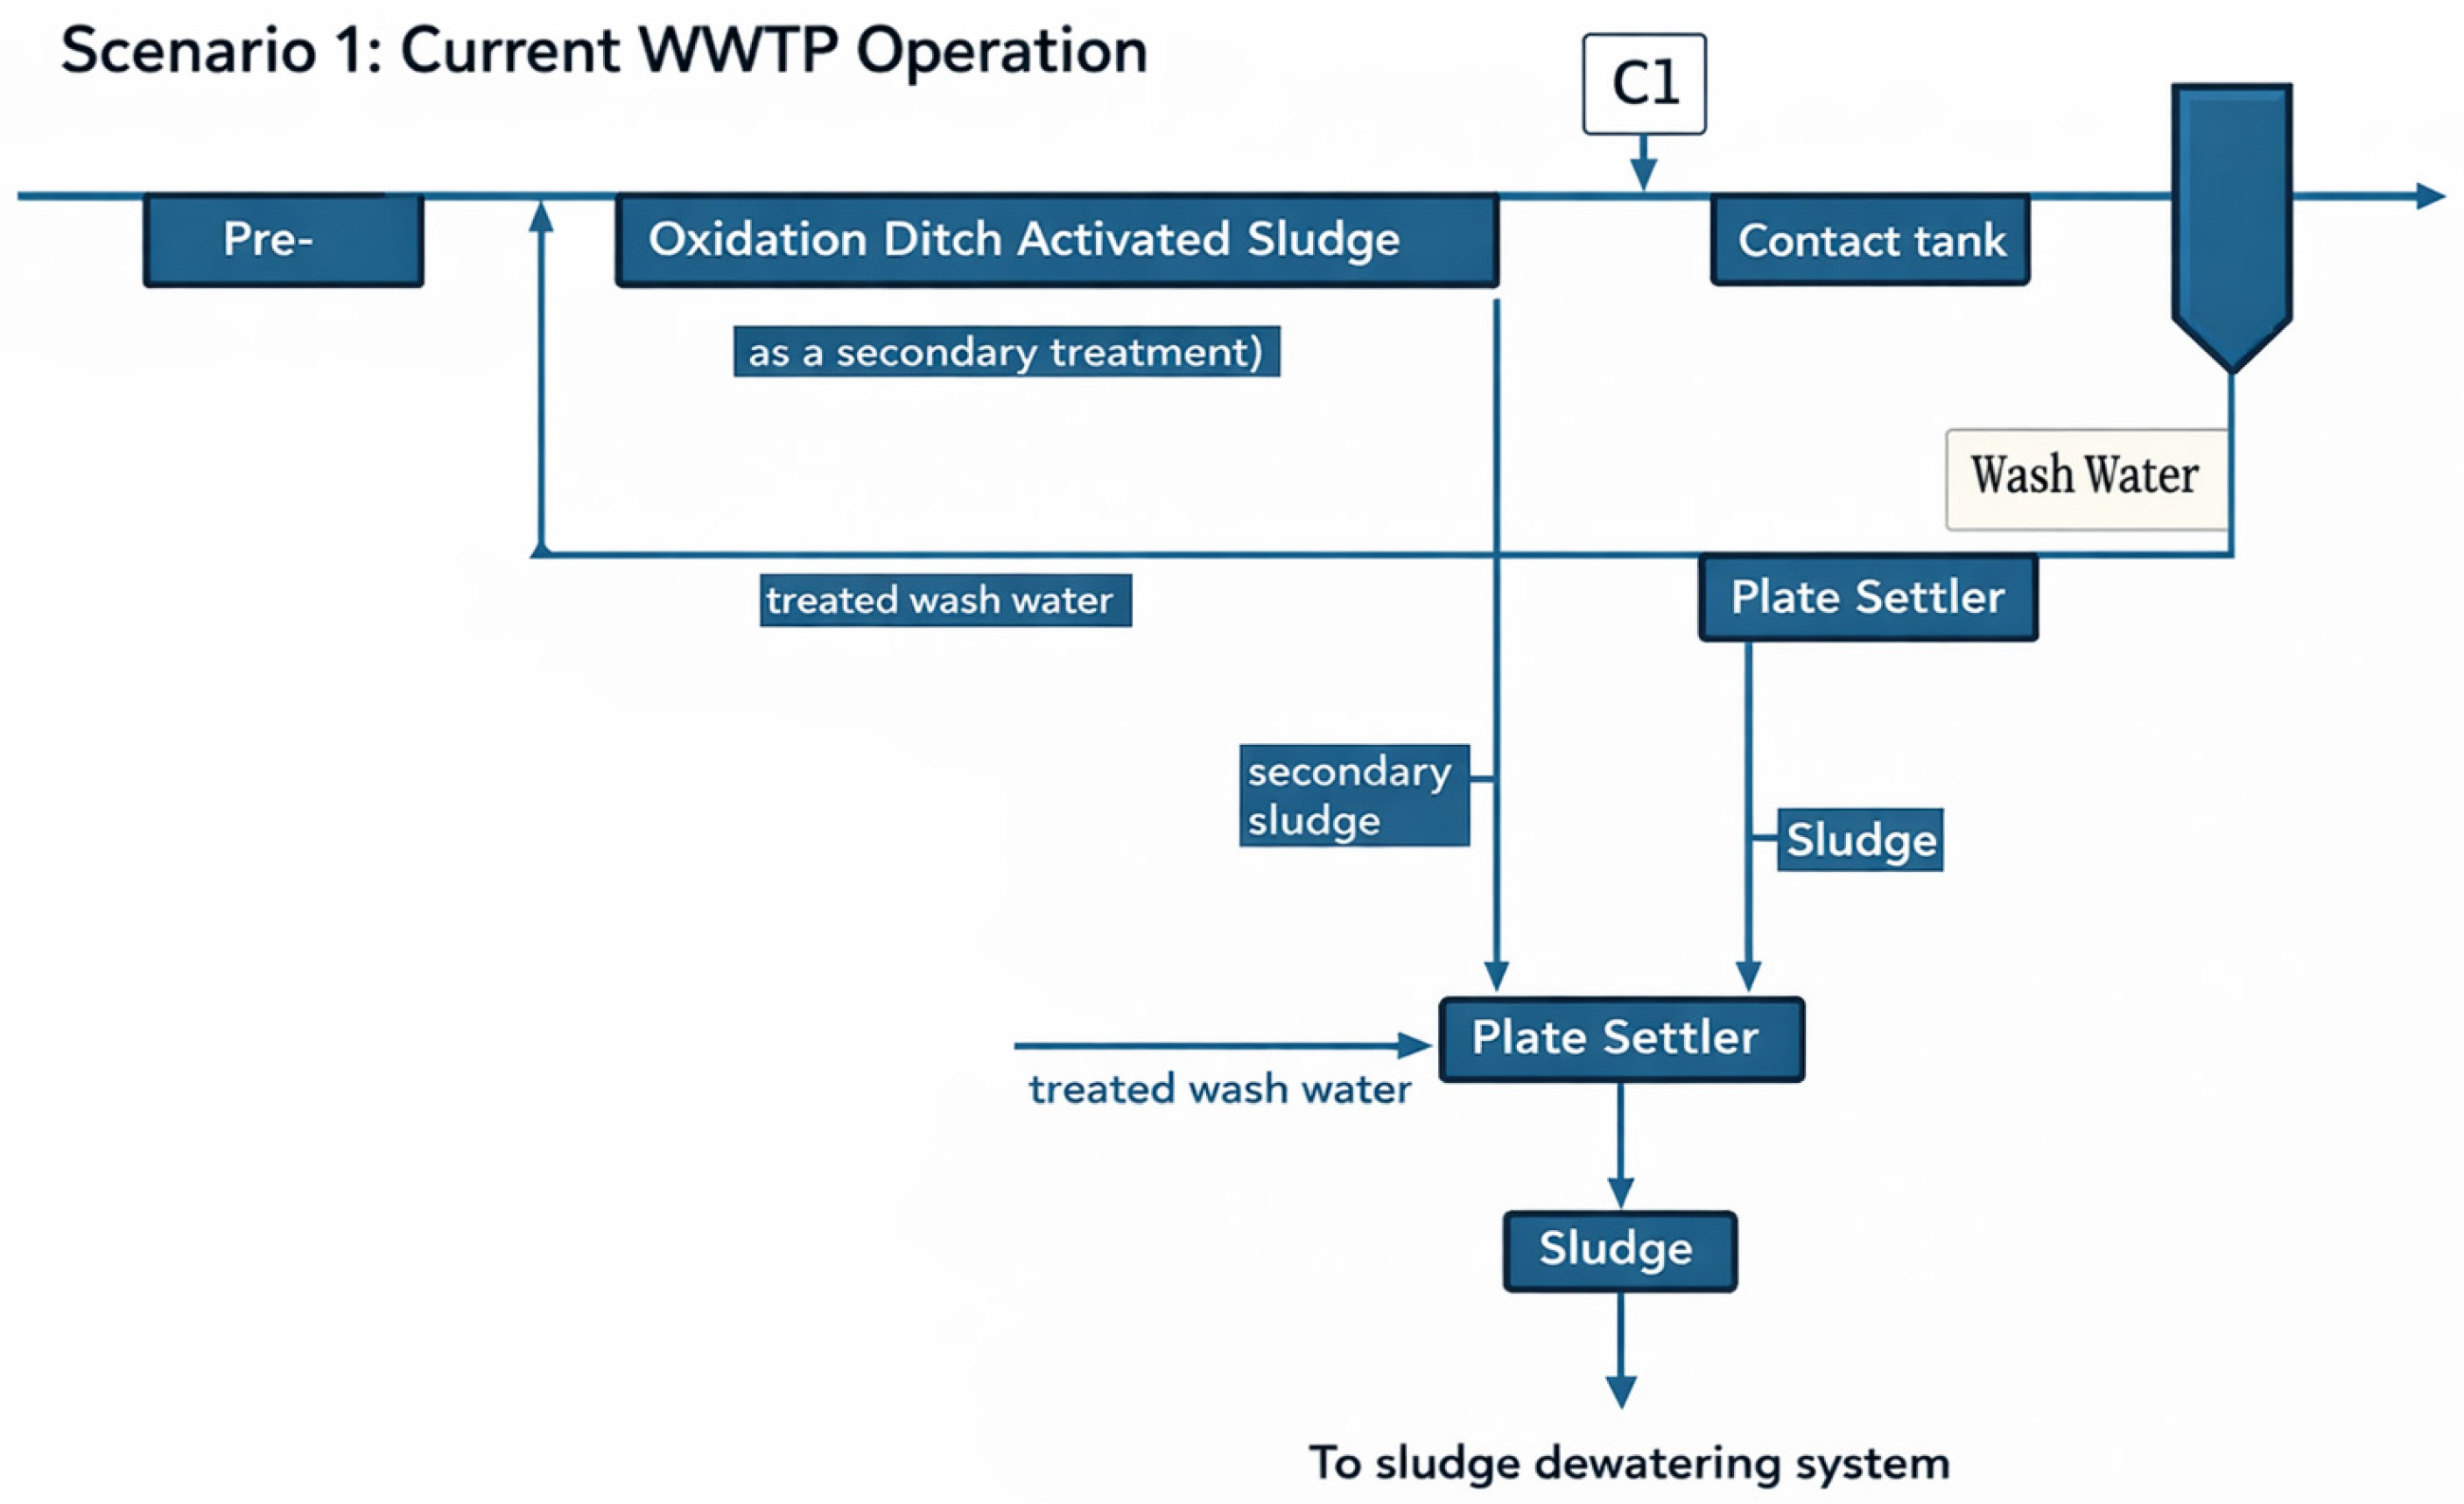
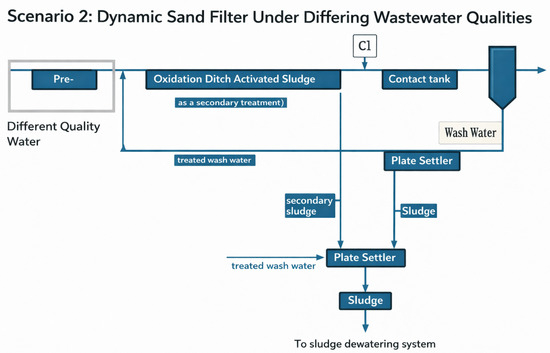
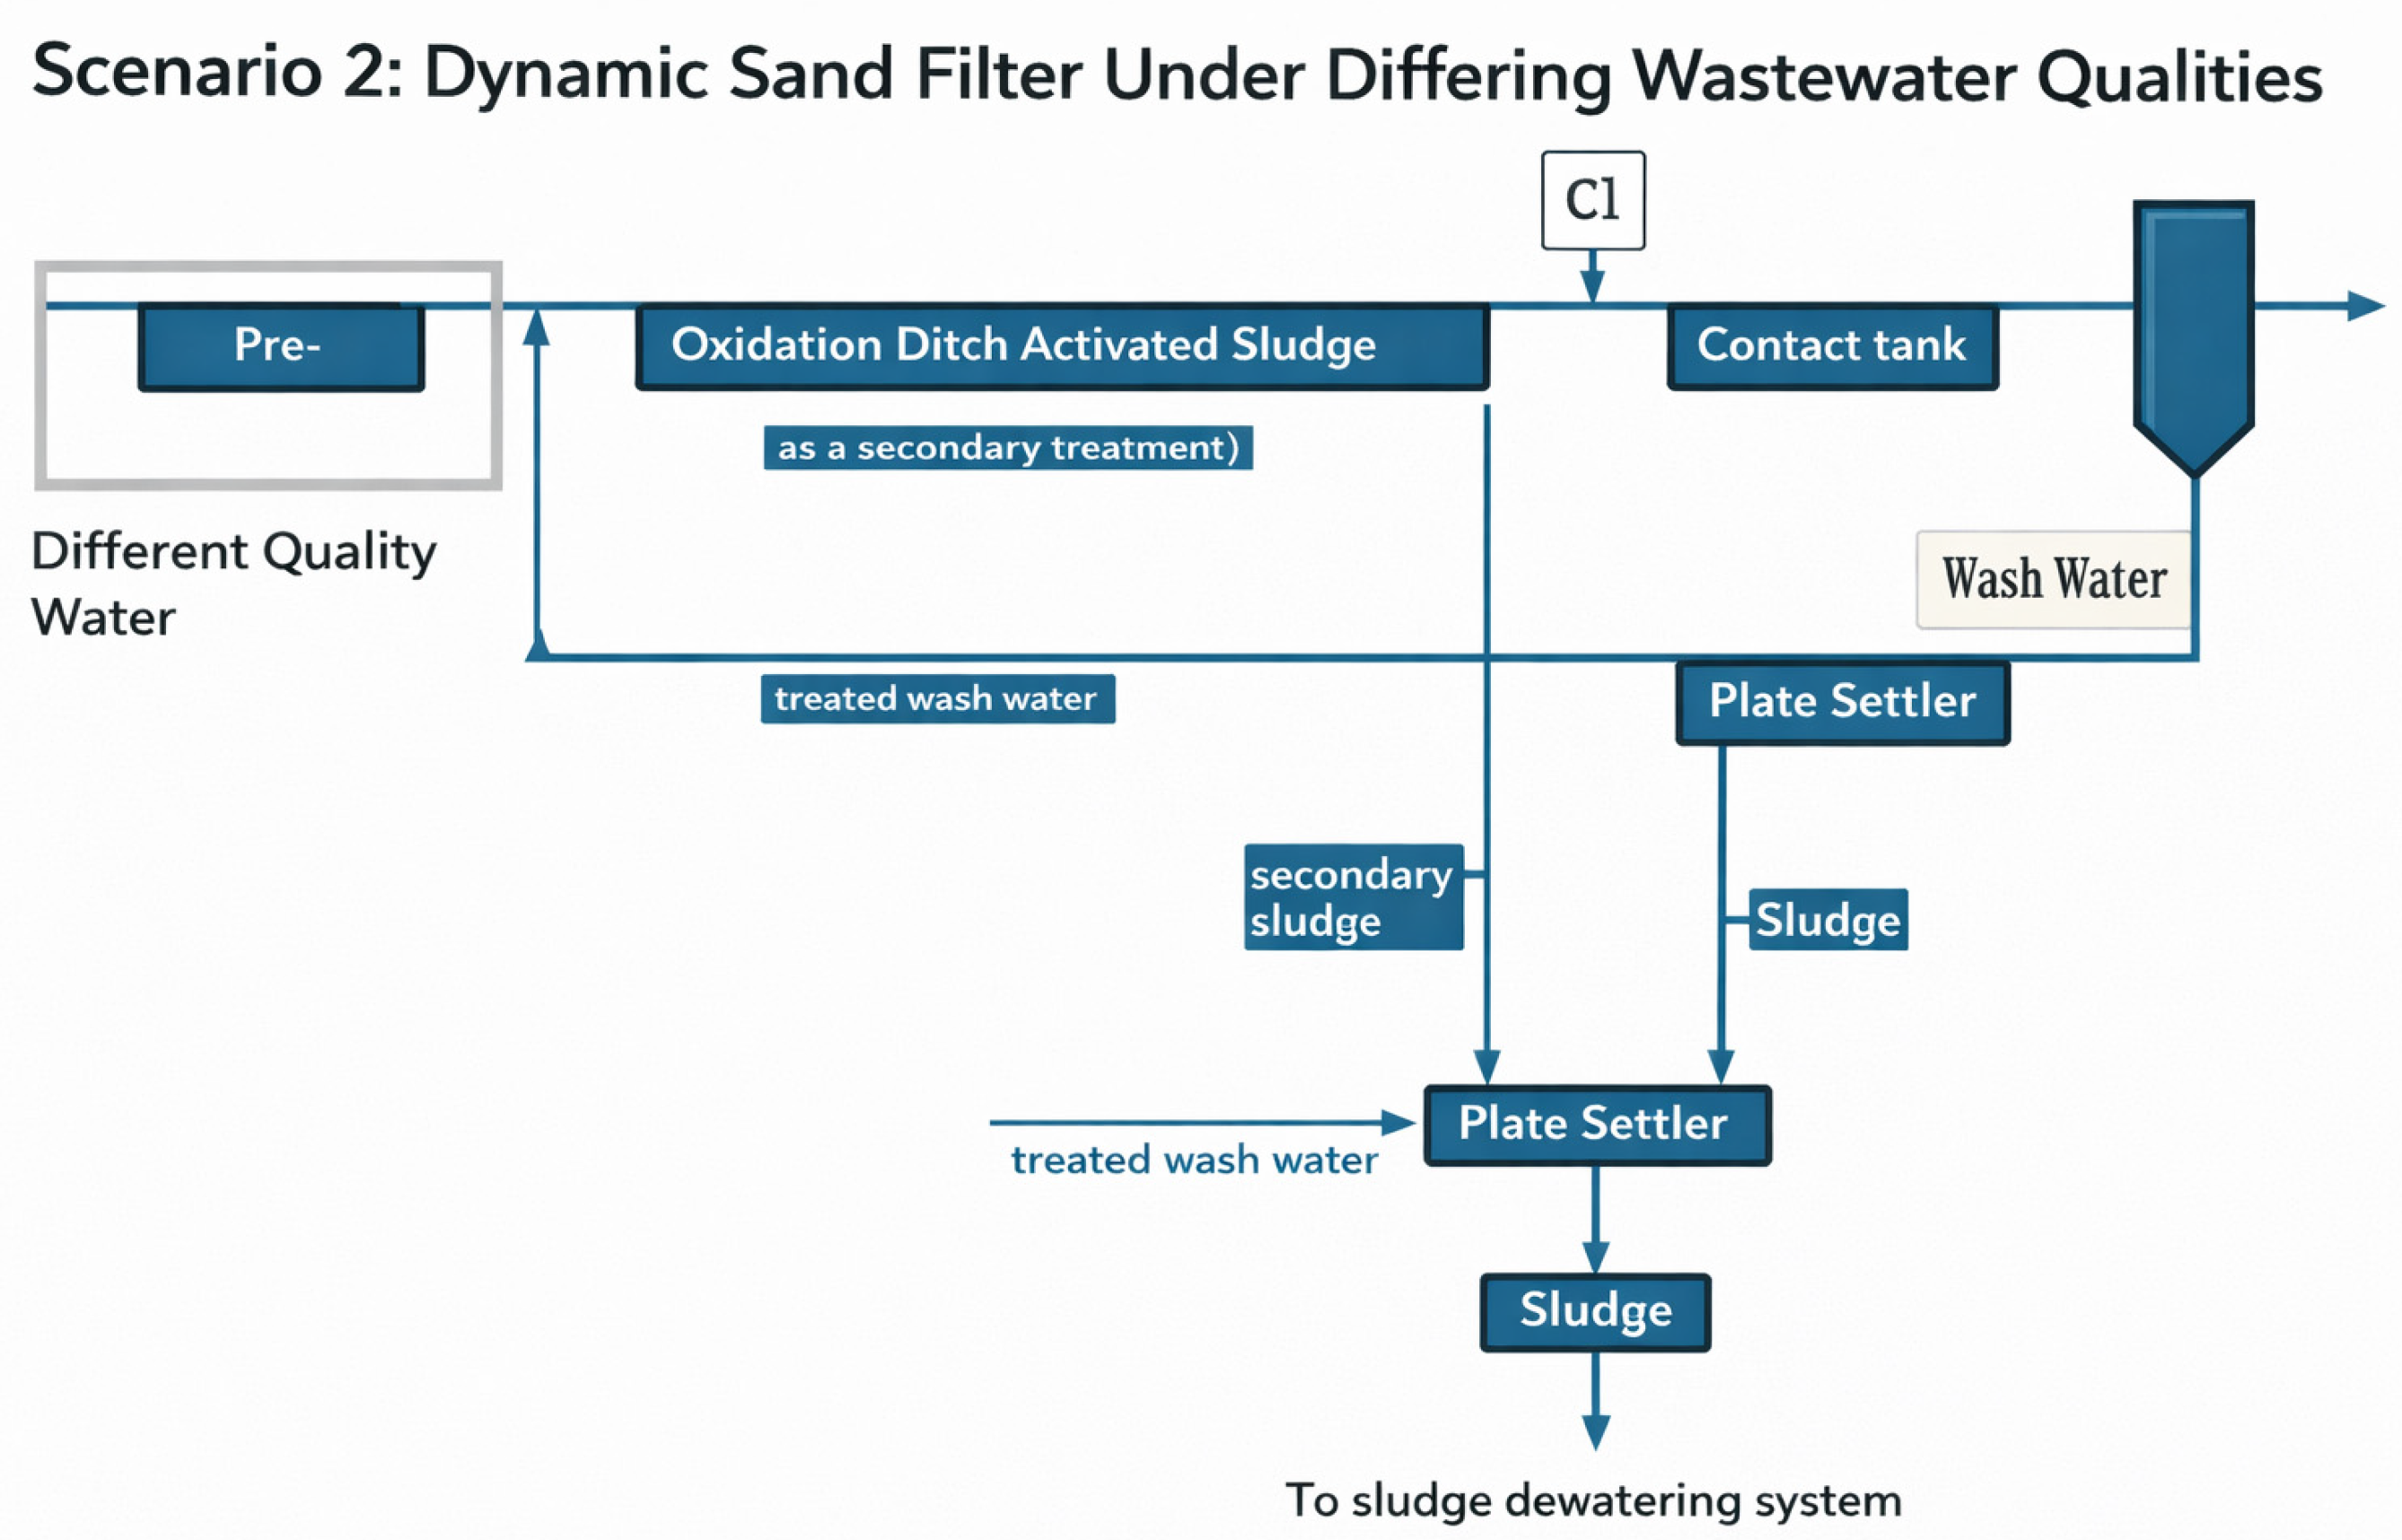
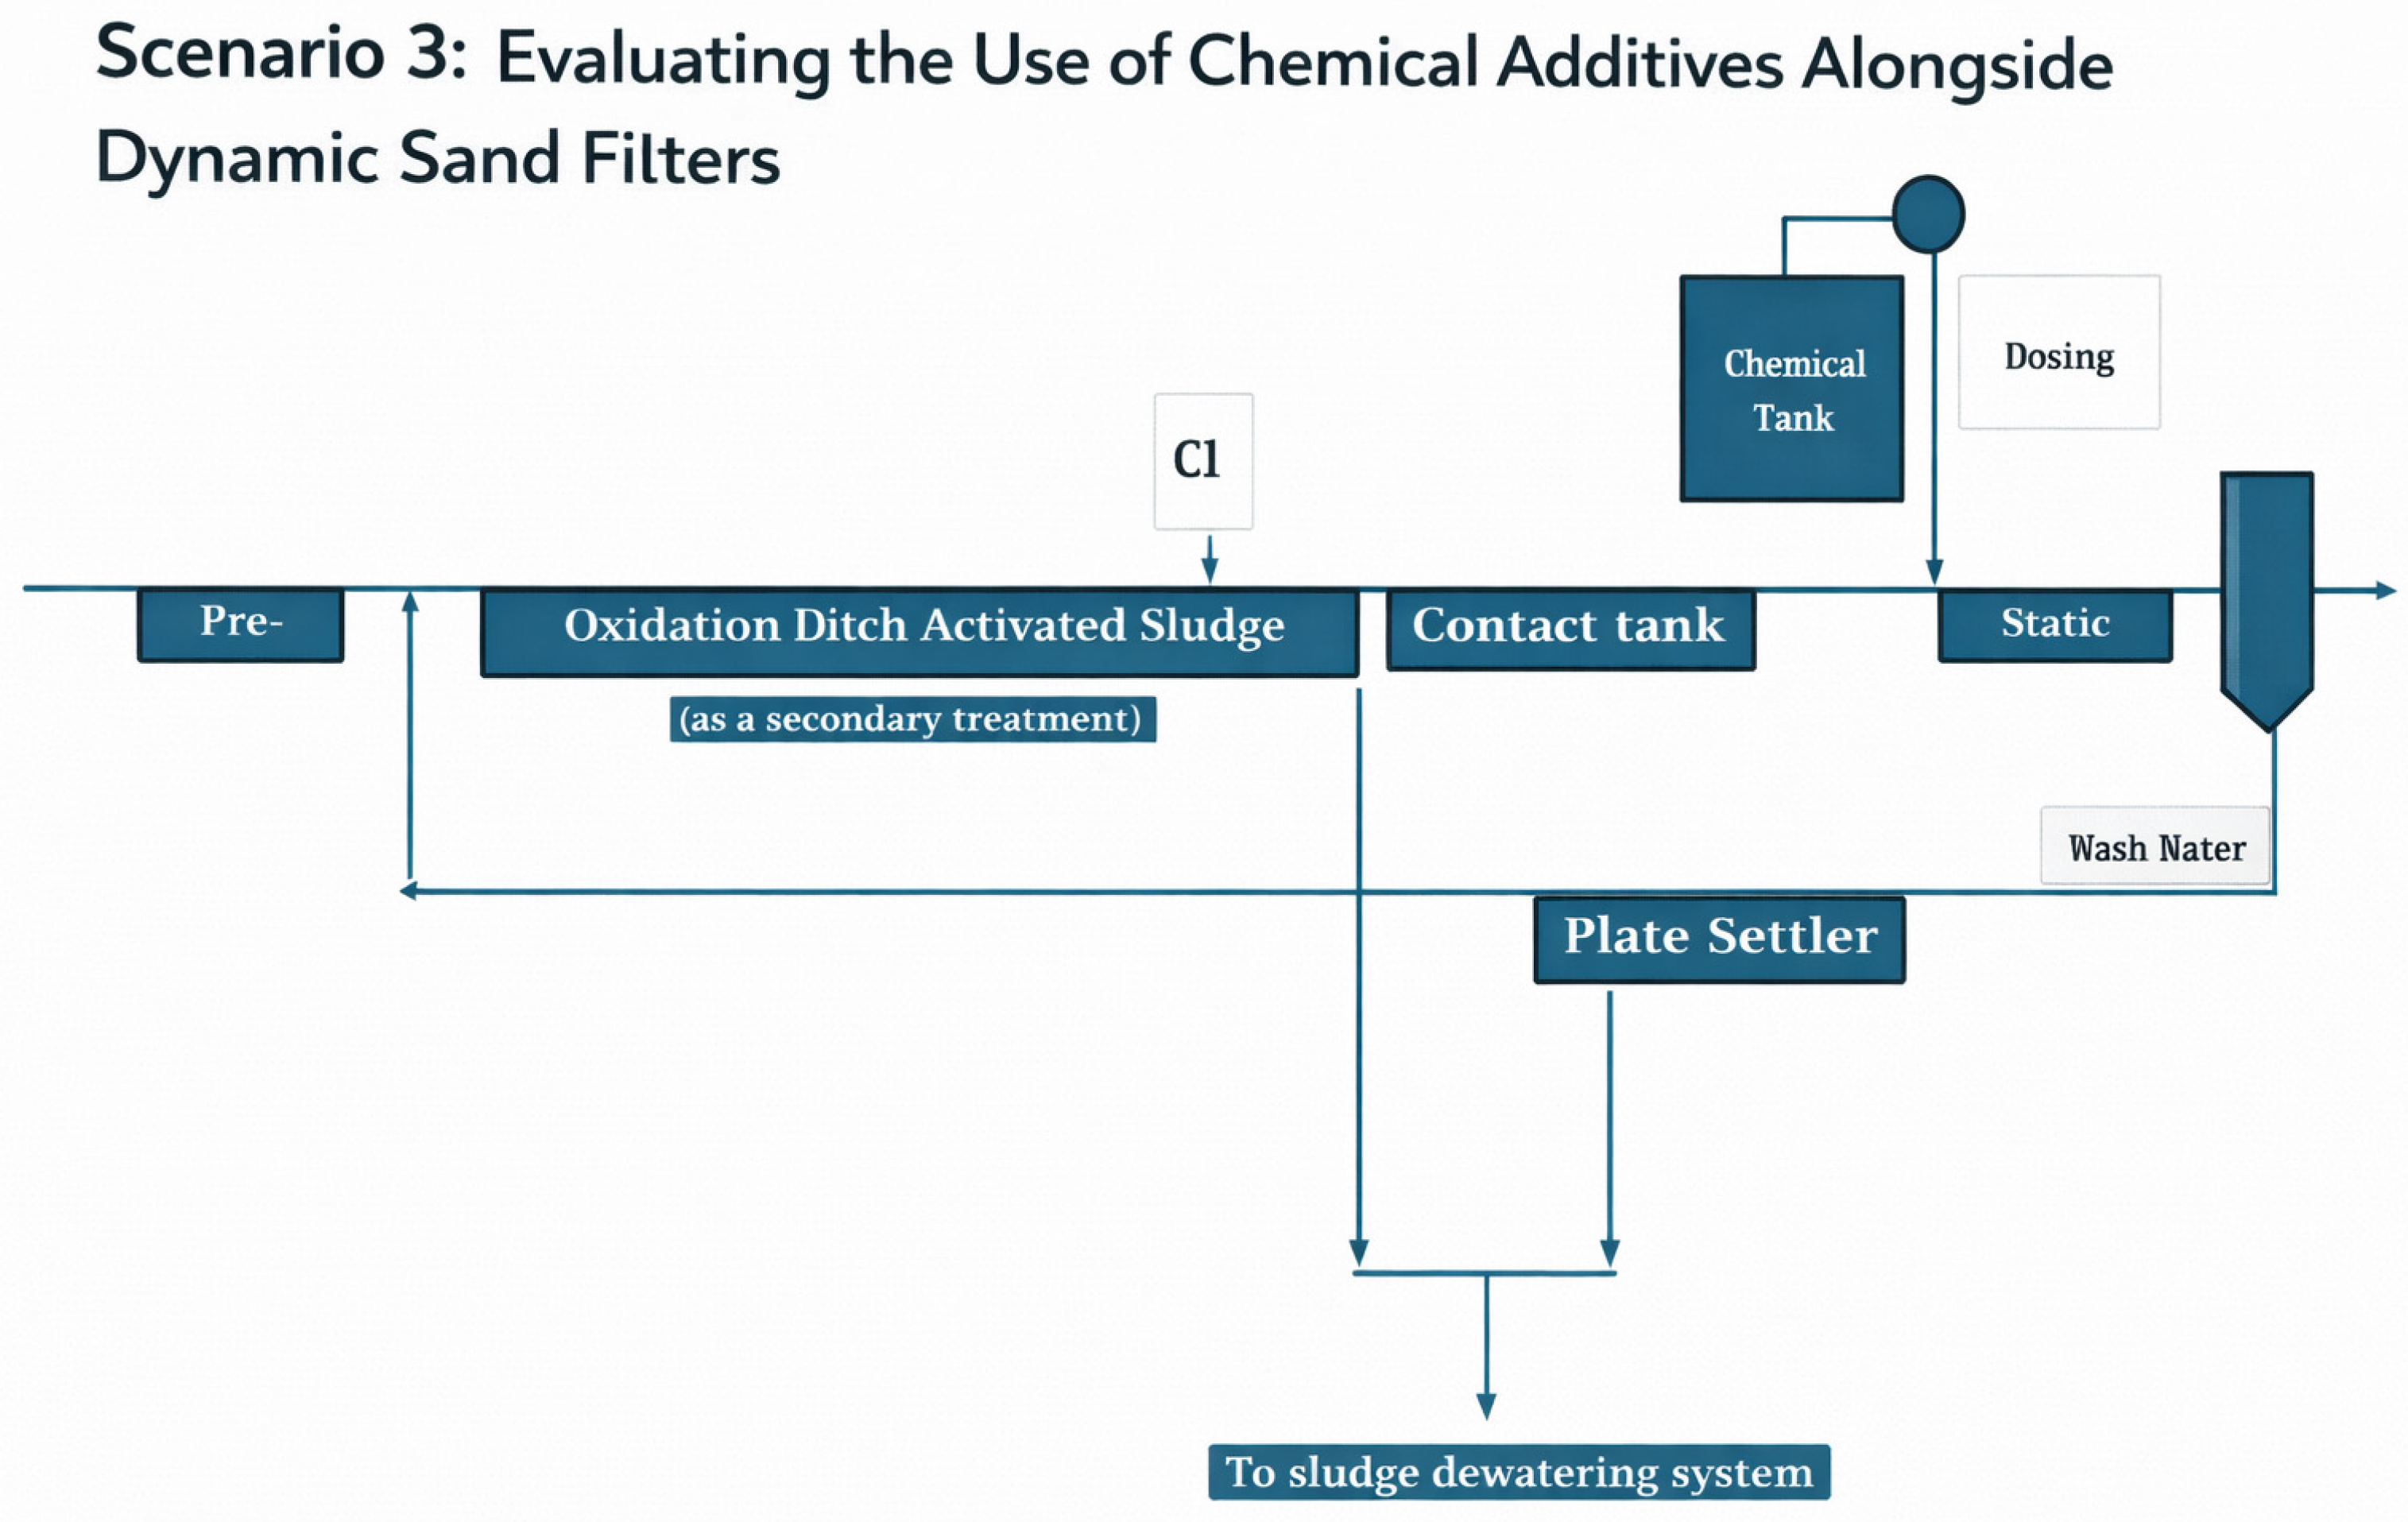
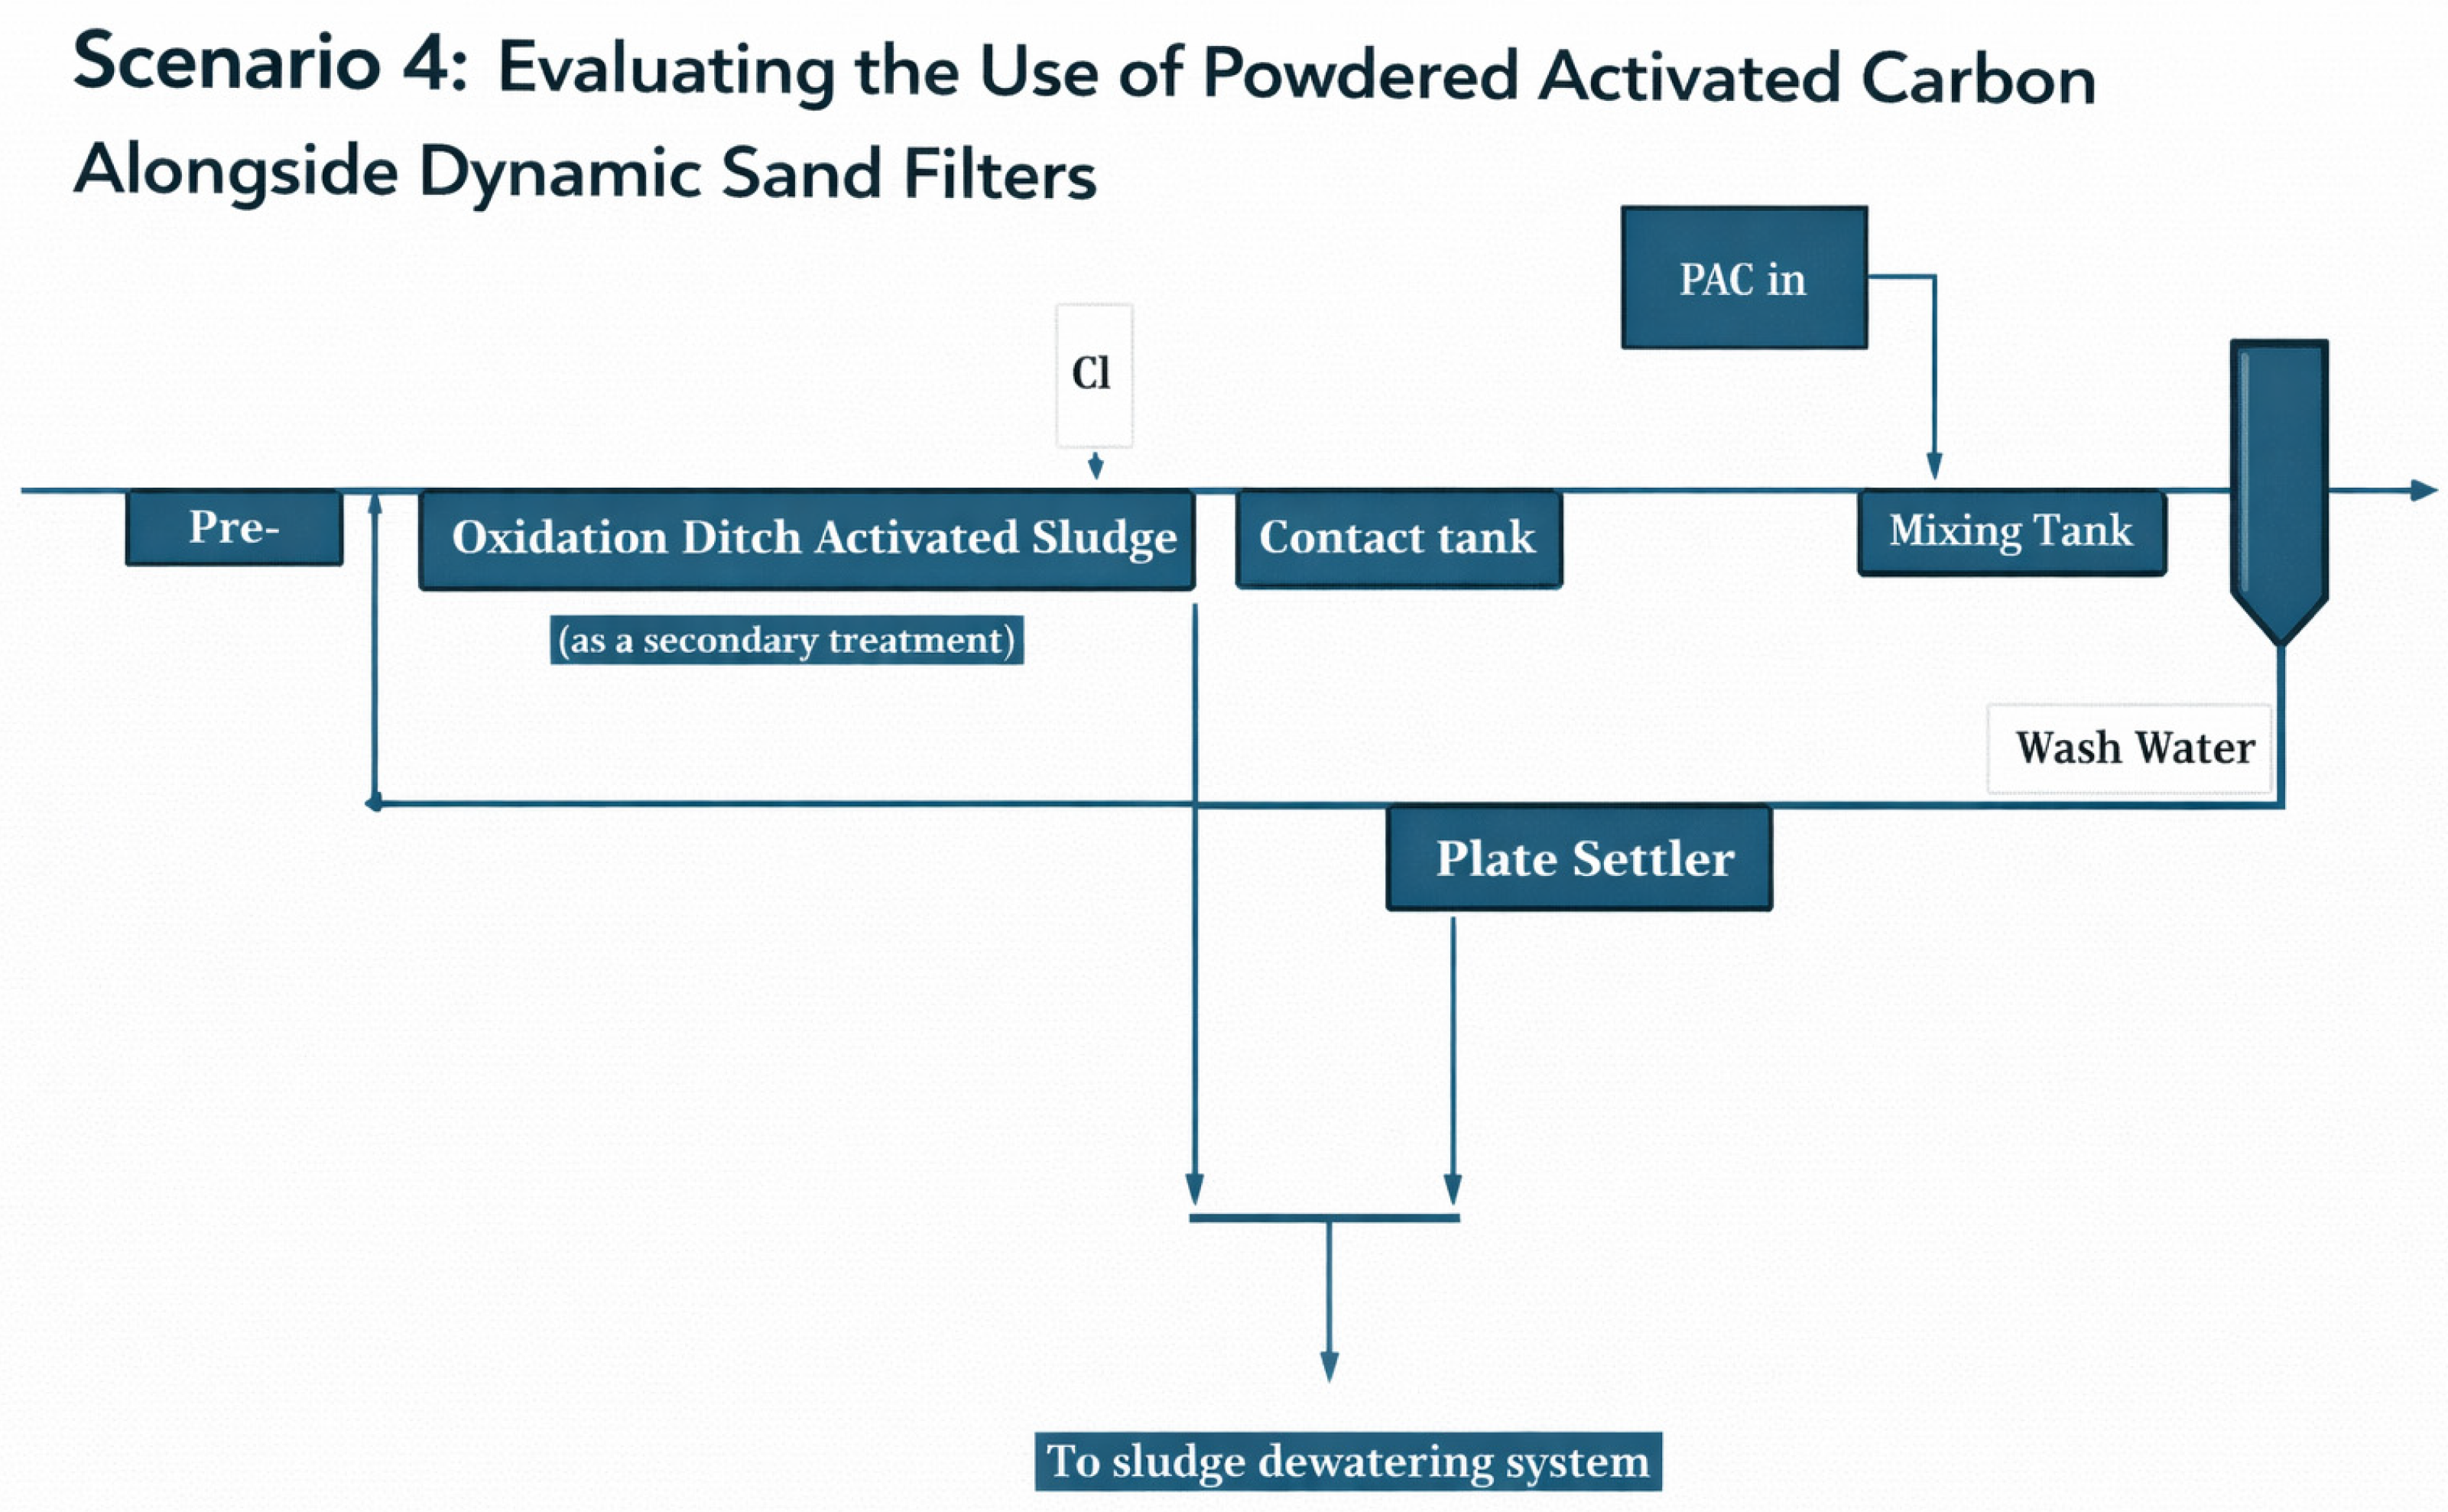
There are four scenarios for operation in WWTP. The intended assessment was made to cover the emissions of each scenario based on the suggested functional unit of treated 1 m3 of wastewater. Scenarios 1 to 4 had different layouts and as such are illustrated below (Figure 1, Figure 2, Figure 3 and Figure 4):
Figure 1.
Base Scenario 1: current WWTP operation.
Figure 2.
Scenario 2, using the Dynamic Sand Filter with differing wastewater qualities.
Figure 3.
Base Scenario 3, evaluating the use of chemical additives to the system.
Figure 4.
Base Scenario 4, using powdered activated carbon in the system.
Scenario 1
This is the current WWTP operation scenario. Raw water passes through pretreatment, followed by Primary (if needed), then secondary with Activated Sludge; after, Chlorine (C1) is used before the Dynamic Sand Filter unit, where both the Final Effluent is produced and wash water receives additional treatment or is redirected to the primary influent.
Scenario 2
This scenario simulates wastewater with different qualities to show the performance of the Dynamic Sand Filter.
Scenario 3
This scenario studies the performance with the use of chemicals added at different doses (based on wastewater quality).
Scenario 4
This scenario studies the performance of using Powdered Activated Carbon when added for treatment.
Additional scenarios were considered to depend on performing reiterations based on optimum conditions from previous runs in Scenarios 1 to 4 and are not scenarios per se.
As this life cycle assessment complies with the environmental management and life cycle assessment standards established by ISO 14040/44, the approach taken included a Goal Definition and Scoping with clearly defined system boundaries and functional unit (treating 1 cubic meter of wastewater).
Additionally, it included life cycle inventory for every stage of the life cycle with comprehensive data on material use, energy consumption, emissions, and waste generation, which were gathered by the life cycle inventory (LCI).
Later on, in the life cycle impact assessment stage, the TRACI impact assessment method was used to determine the impact. Results were examined for hotspot sensitivity and uncertainty analysis, offering suggestions for enhancement and practical advice.
As for sludge, its production in wastewater treatment plants mainly stems from primary and secondary processes—such as sedimentation and biological treatment—not from tertiary filtration. By excluding sludge-related activities, the analysis maintains a consistent and focused comparison between different filtration technologies under identical functional units.
That said, sludge management can significantly influence overall environmental impacts in full-scale wastewater treatment plant (WWTP) LCAs, especially regarding energy consumption, emissions, and disposal effects. Excluding these aspects reflects a limitation of the current system boundaries and should be addressed in future cradle-to-grave assessments of complete treatment systems.
Finally, a separate analysis was conducted to compare the Dynamic Sand Filter method to different more conventional Dynamic Sand Filter mechanisms, as well as a Rapid Sand Filter through simulated data using OpenLCA (2.5.0). These systems all share a fundamental idea about continuous filtration with simultaneous media cleaning, which removes the need to halt the process for backwashing. The reason for comparison is that there are other dynamic and continuous sand filtration techniques other than Dynamic Sand Filter, as well as other conventional filtration and treatment alternatives.
Some noteworthy substitutes for comparison include the following.
- Filtralite Systems: Rather than using regular sand, it uses expanded clay aggregate. It is frequently used in conjunction with hydraulic cleaning and continuous air scouring. Additionally, it provides a large surface area with little backwash, with some configurations allowing for adaptation for continuous filtration systems.
- ASTRASAND Sand Filter Continuous: This acts as the Dynamic Sand Filter, with the upflow continuous sand filtration principle being the same. After being drawn from the bottom and cleaned using a water washer and air lift, the sand is put back on top. This mechanism is applied to cooling water aquaculture and industrial and municipal wastewater.
- CONTRAFLO Sand Filter Continuous: This is predicated on internal sand circulation and upflow filtering. For sand cleaning, a hydraulic washer system and airlift pump are used. There are steel or concrete design choices that are available, and they are both efficient and compact.
- SuperSand Continuous Filter for Backwash: This operates using comparable concepts and is mainly made for large-scale treatment facilities. For operation, air and filtered water are continuously used to clean the media.
- Filter DynaDrum: Occasionally, these continuous sand filters are used in conjunction with a mechanical drum filter which is not a sand filter. They are mainly effective for separating solids in wastewater and aquaculture prior to biological treatment.
- Rapid Sand Filters: This popular filter acts as a final comparison element, since it is a traditional method for filtering water that has been used to get rid of turbidity and suspended particles for decades and in several countries. It is used particularly in municipal water treatment plants. This filter is efficient, quick, and scalable even though it is not as continuous or dynamic as the Dynamic Sand Filter. Thus, it is not a DSM mechanism.
As there are several other technologies and brands, the scope is based on average data from a regular DSM mechanism made of reinforced concrete in comparison, using the same scenarios for proper comparison scale.
Additionally, an ecological footprint comparison with sand filters is made to help in assessing the overall environmental performance. The system’s ecological footprint is determined using standardized LCA methods. This evaluation considers the land area needed to offset environmental impacts from material production, energy consumption, and waste generation across the entire life cycle.
The calculation process involves obtaining data sources and inventory data that are drawn from established LCA databases such as Ecoinvent and OpenLCA libraries, which are based on values sourced from the scientific literature for materials or processes.
The calculation method involves quantifying the overall ecological footprint in global hectares (gha) using the area-equivalence approach, which translates resource use and emissions into the equivalent biologically productive land area required to support them.
This method guarantees clarity, consistency, and alignment with other environmental indicators used in this study.
4. Results
4.1. Results Overview
This LCA analysis and research produced several outputs. The primary purpose of the research was to compare and evaluate the environmental impact of treating wastewater with Dynamic Sand Filter, in order to supply information to satisfy possible environmental regulations or requirements from environmental certification organizations such as ISO 14001 [27] or LEED and thereby support policy development and regulatory compliance.
First, a comprehensive environmental impact analysis that breaks down the carbon emissions, energy consumption and Global Warming Potential (as well as other important categories for each scenario) using the Dynamic Sand Filter was conducted in order to determine which life cycle stages have the highest emissions or the hottest spots.
Through calculating the environmental impact at every stage of the Dynamic Sand Filter life cycle, the results helped to indicate which life cycle environmental hotspots could benefit from impact reductions.
Several suggestions for enhancement were provided, determining methods through which to lessen environmental impact (for example, altering the design using energy-saving techniques or changing materials) and offer recommendations and data-driven insights for enhancing overall sustainability. These suggestions help to indicate how we might lessen environmental burdens and offer practical suggestions for streamlining the design and operation procedures.
A comparative analysis was also made with other filtration methods to compare the Dynamic Sand Filter’s environmental performance to that of other technologies, such as multimedia filtration systems or membrane filtration, with the aim of supporting decision makers in selecting the wastewater treatment technologies to be applied based on their sustainability credentials with transparency. Additionally, the results of the analysis may then serve as a foundational source for eco-design initiatives by locating chances for upcoming product improvements, i.e., innovations that save energy or replace materials.
4.2. Life Cycle Stage Emission Results
The life cycle inventory revealed that the operational phase dominates total emissions, contributing approximately 495,050 kg CO2e, which is equivalent to 99.4% of the total Global Warming Potential.
The life cycle inventory was verified to ensure the dominant role of electricity (responsible for over 99% of the Global Warming Potential (GWP), which aligns with findings from multiple LCA studies on wastewater and water treatment systems, where operational energy typically constitutes the primary environmental impact. The significant contribution of electricity accurately reflects the system’s true operational energy intensity over its lifetime.
All pertinent upstream processes were incorporated into the analysis, including material production and construction of the treatment system, replacement of sand media, pumping systems, and their associated components.
Raw material production contributes 0.6%, with steel and electronic components identified as key contributors. Manufacturing and transportation impacts are relatively minor, while recycling of steel components offsets a portion of end-of-life emissions.
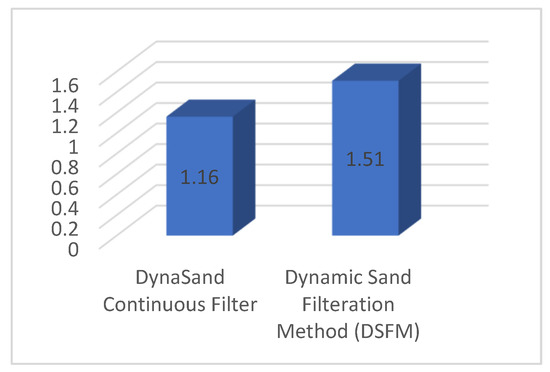
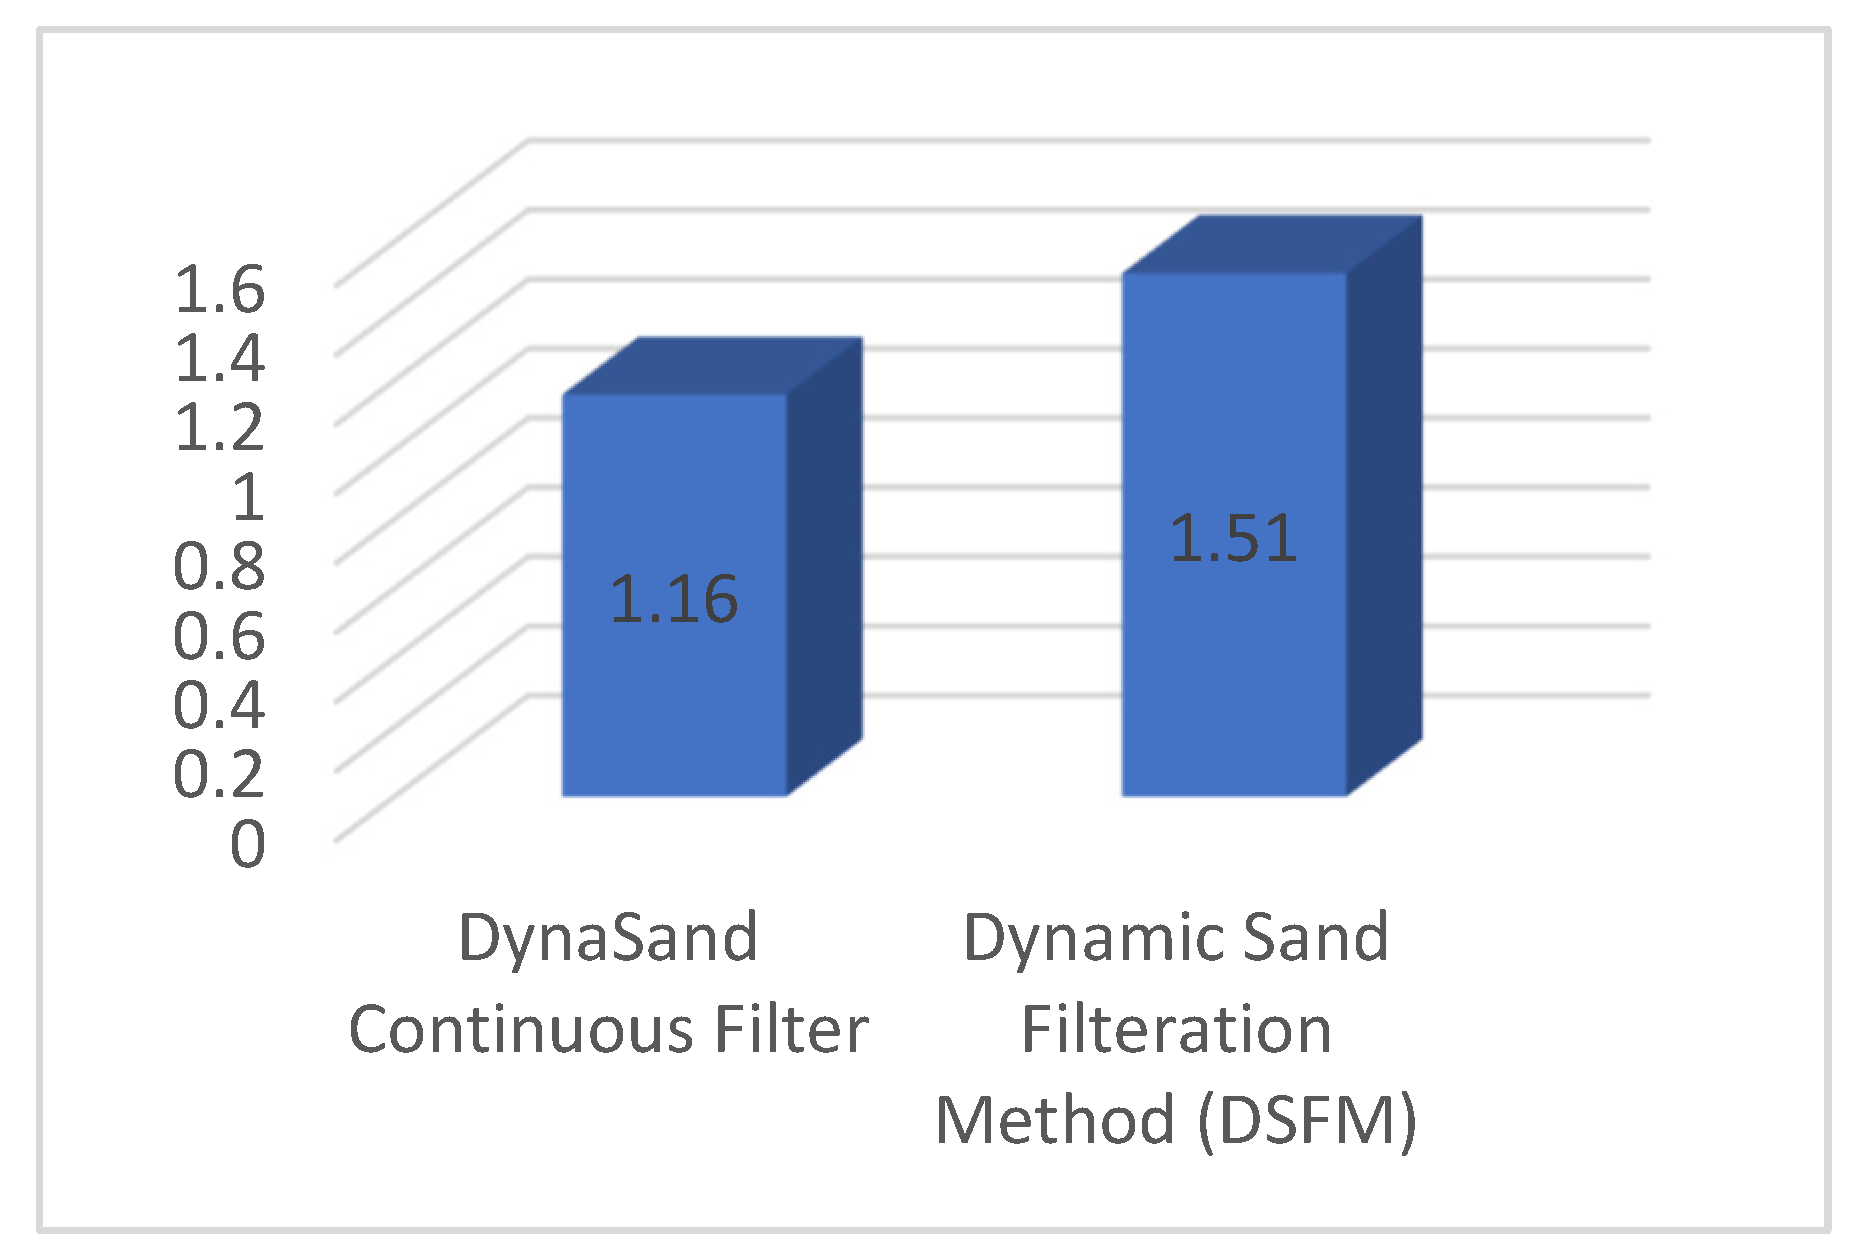
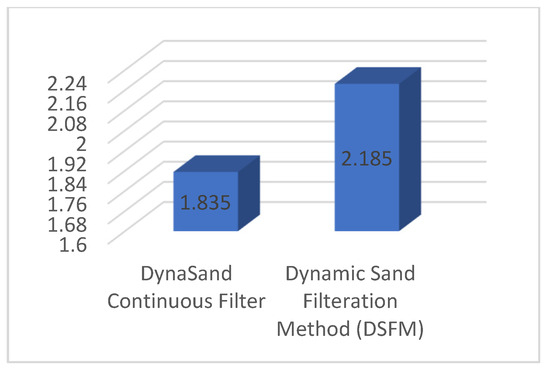
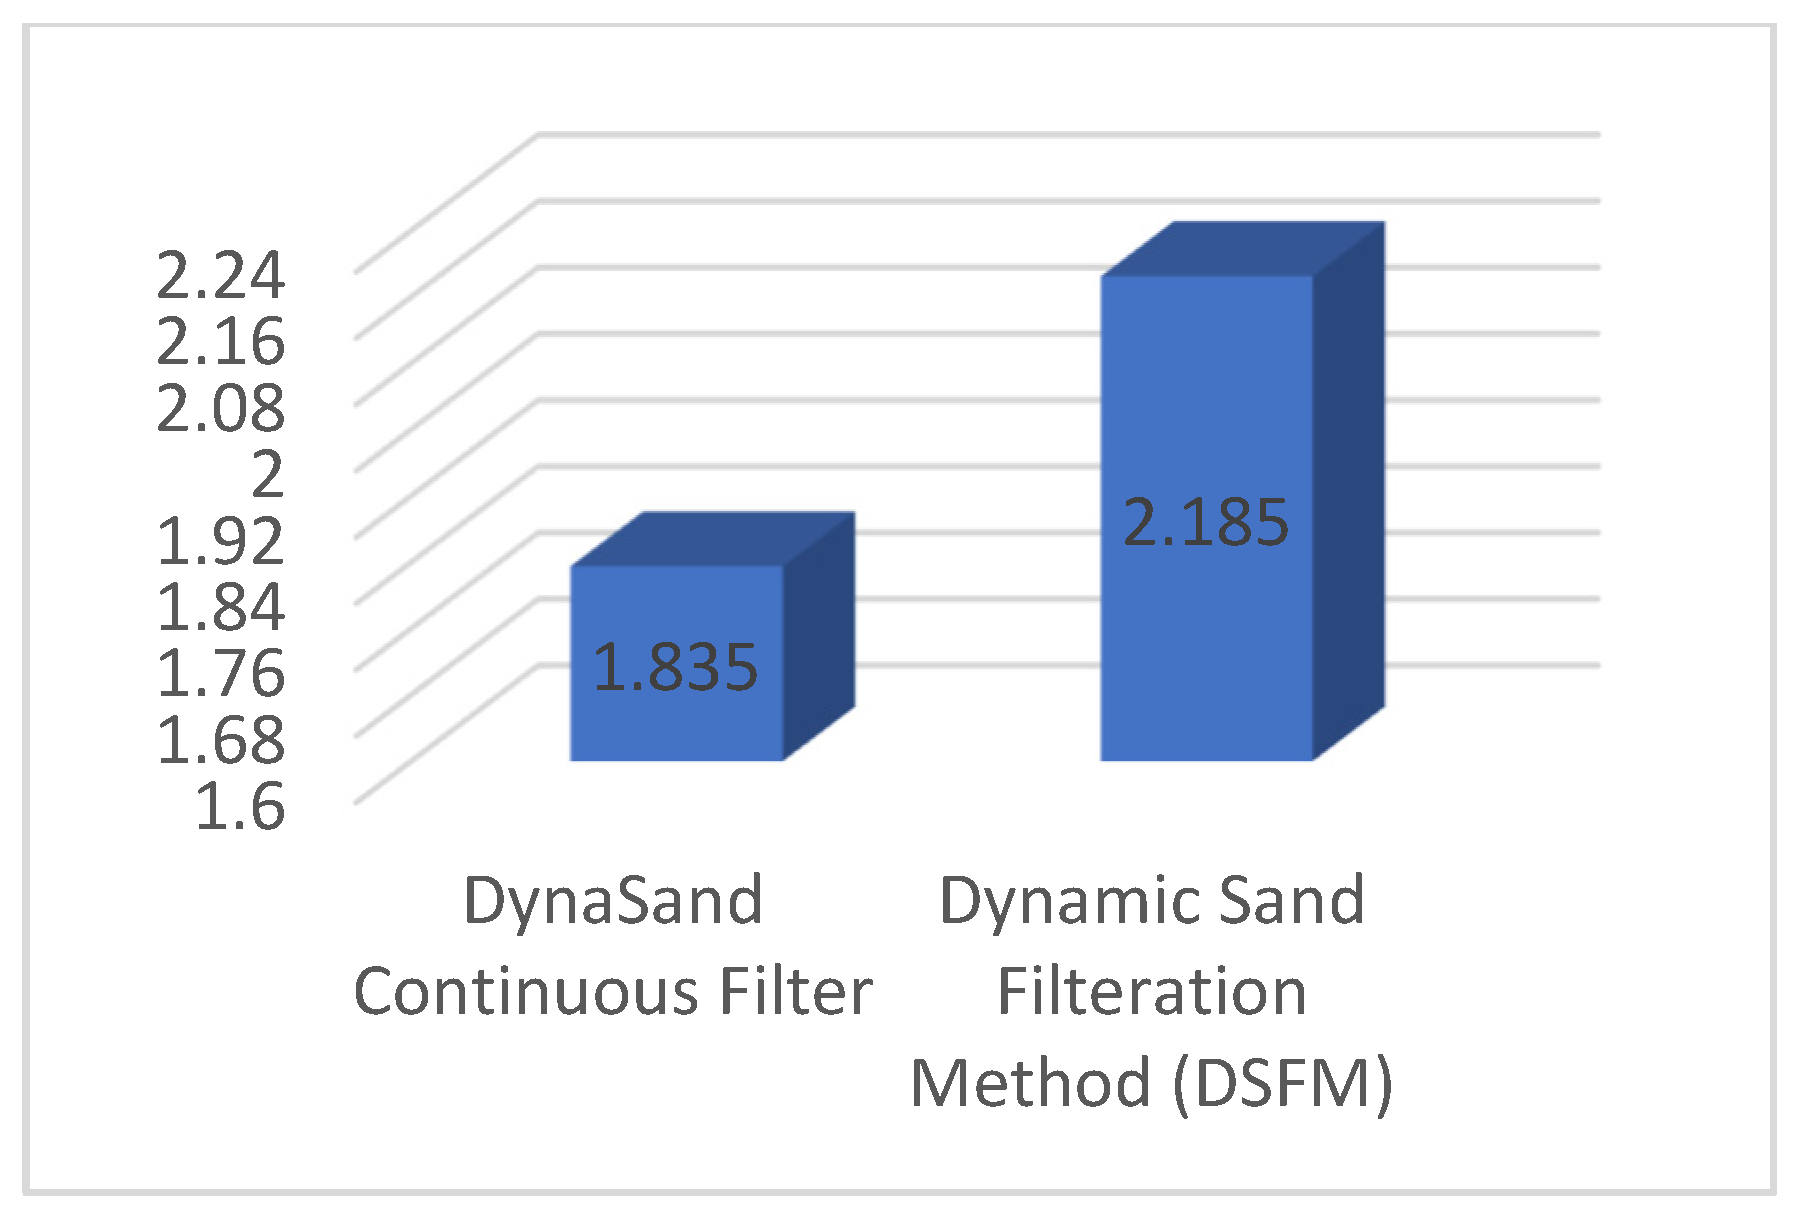
Across four modeled wastewater treatment plant (WWTP) scenarios, the Dynamic Sand Filter demonstrated lower emissions and energy use compared to Dynamic Sand Filtration Methods (DSFMs). For the baseline scenario, the Dynamic Sand Filter recorded emissions of 1.16 kg CO2e/m3 and energy consumption of 2.91 kWh/m3, compared to 1.51 kg CO2e/m3 and 4.06 kWh/m3 for DSFMs. The efficiency gap further increased when additional treatment processes such as mixing, chemical dosing, and powdered activated carbon (PAC) addition were incorporated.
4.3. LCA Summary for Each Stage
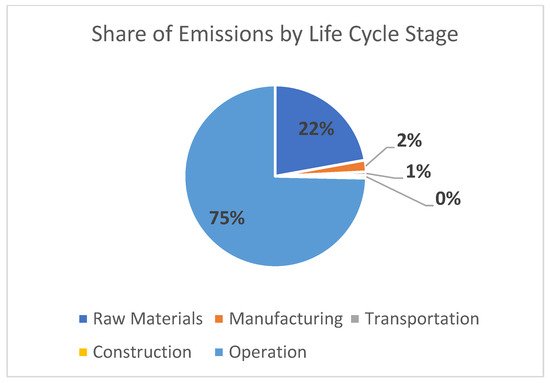
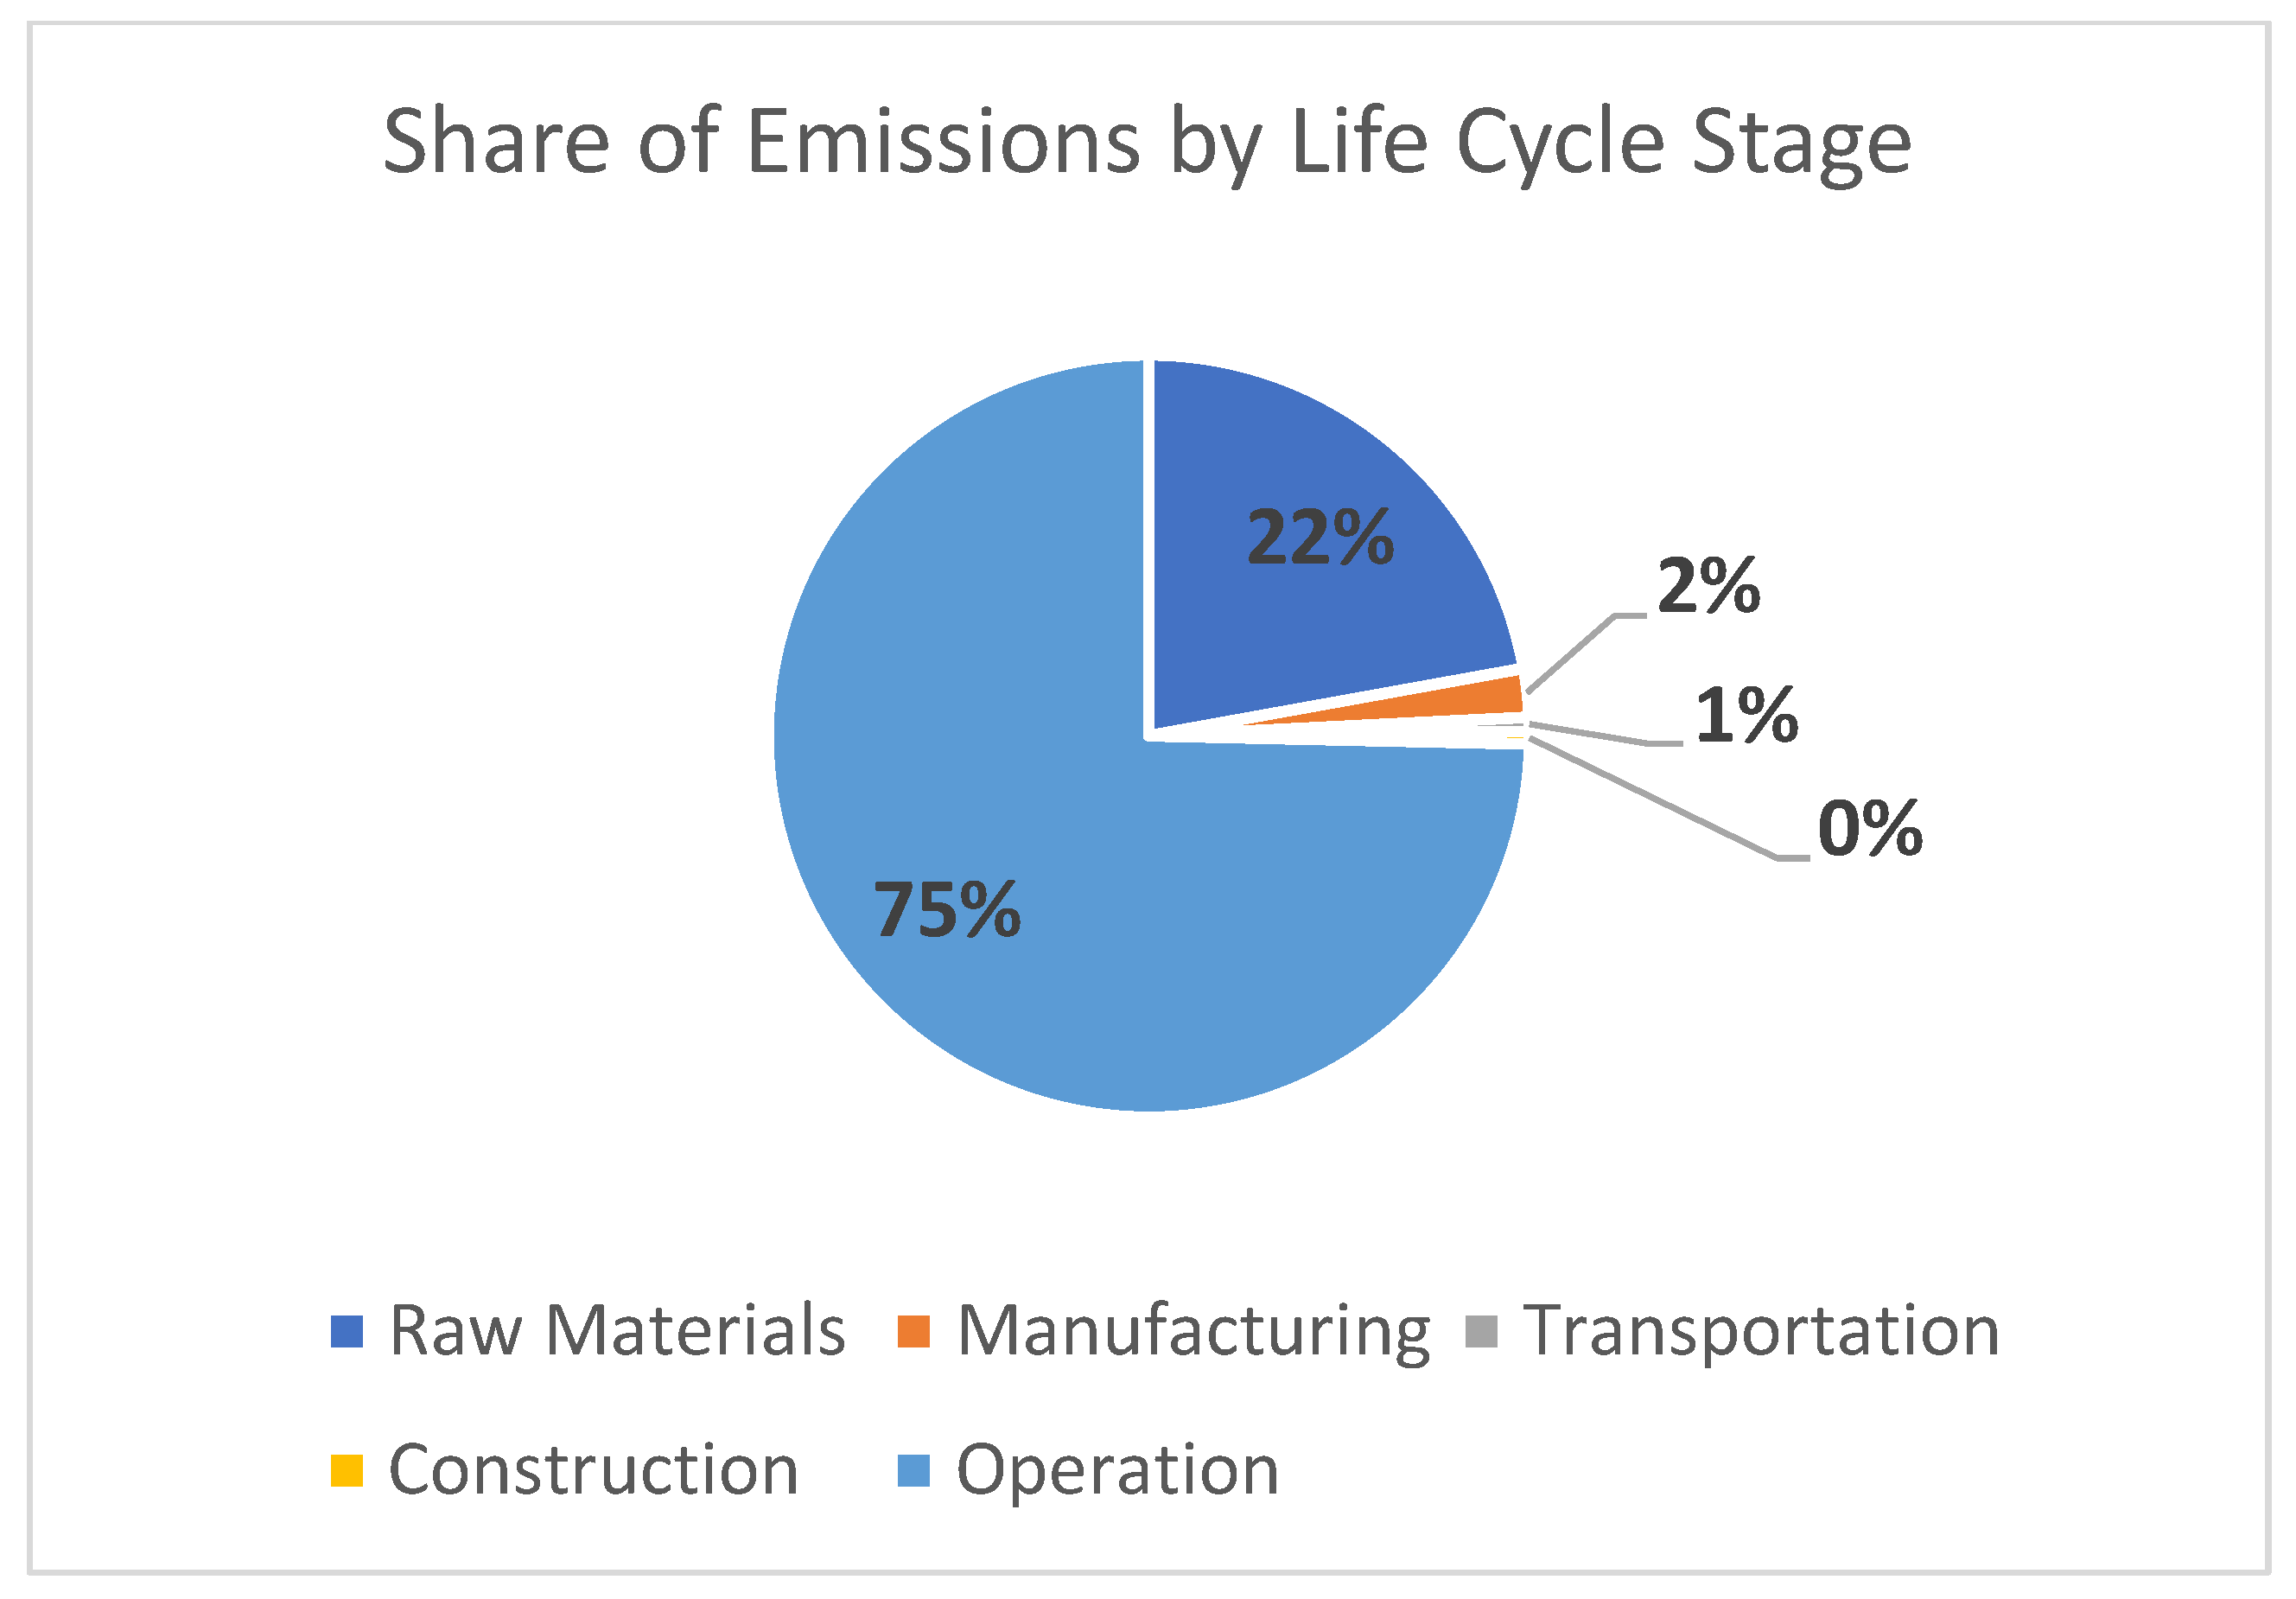
Table 2, Table 3, Table 4 and Table 5 present a summary of the results for the LCA of the raw materials, manufacturing, operation, and disposal stages, with Figure 5 presenting a summary of these results.
Table 2.
Dynamic Sand Filter LCA results for raw material extractions.
Table 3.
Dynamic Sand Filter LCA results for manufacturing.
Table 4.
Dynamic Sand Filter LCA results for construction.
Table 5.
Dynamic Sand Filter LCA results for operation and disposal.
Figure 5.
Share of emissions per life cycle stage for 1 year of operation.
Note that others/the margin include different miscellaneous materials with different emissions factors and quantities for each. In other words, this category includes auxiliary system components not individually listed in the inventory, such as valves, fittings, instrumentation, cabling, fasteners, finishes, carvings, labels on the body of the filter, and small mechanical parts. It also accounts for estimated material losses during fabrication and installation. This category was added to ensure a complete life cycle inventory and prevent the underestimation of material-related environmental impacts.
4.4. Summary of Emissions Results for Each Scenario
Major contributors when using Dynamic Sand Filter on its own before assessment of each scenario included electricity consumption during operation, steel production for the vessel, and transport emissions for sand and filter components. Accordingly, the emissions per treated cubic meter of wastewater (functional unit) for each scenario are shown in Table 6.
Table 6.
Embodied energy and carbon emissions of each scenario.
5. Discussion and Analysis
Analysis of the results highlights that operational electricity use is the principal environmental hotspot across all scenarios. The dominance of operational impacts underscores the importance of energy efficient motors, process control optimization, and the integration of renewable energy sources. Although material related impacts are minor, opportunities exist to substitute electronics and coatings with less carbon intensive alternatives.
The LCA interpretation phase was essential for combining and evaluating the results of the inventory (LCI) and impact assessment (LCIA) phases. This phase sought to guarantee that the findings are consistent with the initial objectives and parameters of the research and to offer concise, useful conclusions supported by empirical data and methodological openness. Within the framework of this research, the interpretation centered on the Dynamic Sand Filter continuous upflow sand filtration system’s environmental performance throughout its entire life cycle, before moving to comparative analysis.
In particular, it sought to determine the main environmental hotspots or impact contributors at different stages of the life cycle, including manufacturing, transportation, operation, and end of life. It also drew attention to important presumptions, uncertainties, and sensitivities that might have affected the outcome. The interpretation stage and its discussion were essential for turning unstructured environmental data into insightful knowledge that engineers, legislators, local government representatives and sustainability experts can use to guide their decisions.
5.1. Discussion of Dynamic Sand Filter Emissions
Regarding the analysis of the Dynamic Sand Filter on its own, important details about the environmental hotspots and possible areas for improvement were revealed through the interpretation of the Global Warming Potential (GWP) for the basic life cycle scenario of the Dynamic Sand Filter continuous upflow sand filtration system. Using data from TRACI impact assessment methods, this section summarizes findings from all life cycle stages. Emissions are expressed in kilograms of CO2 equivalents.
The operation phase throughout the whole life cycle accounted for approximately 99.4% of the total GWP. Electricity usage over the assumed lifespan of the Dynamic Sand Filter unit (with an estimated maximum of 50 years) contributed nearly half a million kg CO2e, making it the most significant contributor to environmental impact. This highlights the significance of the power source mix’s energy efficiency and the possible application of renewable energy sources as crucial levers for advancements in sustainability. To further validate these findings, a sensitivity analysis was conducted, as presented in Section 5.4.
The production of raw materials stage resulted in 0.6% of total GWP (assuming a full lifetime of operation). This makes it the biggest contributor, with several factors related to steel components (690 kg CO2e) and electronics (900 kg CO2e), despite having lower overall emissions.
Electronics have an extremely high GWP/unit, indicating a possible opportunity for material substitution or sourcing from lower-impact suppliers, even though they weigh only 10 kg.
The manufacturing stage had an emissions share of 0.05% (assuming a full lifetime of operation). The mix of metal and plastics in processes such as welding, forming, and electronics integration resulted in moderate emissions, with pumps accounting for the majority of these emissions. Although this is not a significant source of impact, overall costs and emissions could be slightly decreased by fabrication or modularity optimization.
As for the transportation stage, it produced 0.02% of emissions (taking into consideration a full lifetime of operation). This was largely because bulk transport was efficient, and the filter had a high volume-to-mass ratio, meaning the emissions from road and sea freight were negligible. Other geographic supply chains may experience a more varied impact.
The construction stage had a small share of emissions, with 0.01%, as on-site assembly, crane use, and crew transport emissions are minimal in comparison to overall emissions, though they might increase with larger systems or more units.
When recycling is taken into account, the disposal and end-of-life phase led to a net reduction in emissions of about −0.1% of total GWP. This was mainly due to the high recycling rate of steel components—assumed to be 90%—where environmental benefits were calculated using the avoided burden method.
Plastic materials were assumed to have minimal recyclability, with most ending up in landfills, while electronic components underwent partial recovery and were managed through specialized disposal routes. Sand media were regarded as inert, having a negligible environmental impact at the end of life.
These assumptions underscore the critical role of material recovery, especially for metals, in reducing overall life cycle emissions. Nonetheless, the outcomes remain highly dependent on recycling rates and regional waste management practices, which can vary considerably across locations.
The greatest sources of sensitivity in these results are the assumptions made about the electricity and operation emission factor and the variability of the sand replacement rate. Differences in grid emissions by region (for example, when comparing Egypt with EU averages) might considerably change operational GWP values. Moreover, data proxies (as in the case of electronics manufacturing components) were employed in the absence of supplier-specific data, which could have introduced minor uncertainties.
Throughout the system’s lifetime, electricity consumption is almost the only factor driving the Dynamic Sand Filter system’s operation phase, which is the highest contributor to environmental impact. Although the effects of manufacturing and raw materials are minimal, there are ways to reduce the GWP through design optimization, energy efficiency, and clean energy sourcing. Stakeholders aiming to lower carbon emissions from industrial and municipal wastewater treatment systems will find these insights useful.
5.2. Discussion of Different Scenarios’ Emissions
This section explains how four distinct wastewater treatment plant (WWTP) configurations that incorporate the Dynamic Sand Filter continuous upflow sand filter affect the environment. A total of 1 m3 of wastewater was processed as the functional unit in each scenario. The main objectives of this analysis were to identify the effects of process variations on energy consumption and carbon emissions and highlight performance trade-offs across these operational strategies.
5.2.1. Scenario 1: Baseline Configuration
The environmental baseline for comparison is this scenario, since it produces the lowest emissions and energy consumption. Because of its continuous operation and pump-driven recirculation, the Dynamic Sand Filter continues to be the single largest contributor to energy (2.18 kWh) and CO2 emissions (0.65 kg CO2e) per m3. When the influent quality is stable and does not need to be improved chemically, this setup is the most environmentally friendly.
5.2.2. Scenario 2: Variable Influent Quality (Mixing System Added)
Compared to Scenario 1, energy consumption rises by 51% and emissions by 58%. The majority of the increase is attributable to the mixing system, which produces 0.675 kg CO2e and 1.5 kWh. This design adds significant operational burdens, but it is better suited for plants that deal with an inconsistent or variable influent.
5.2.3. Scenario 3: Chemical Dosing + Static Mixer
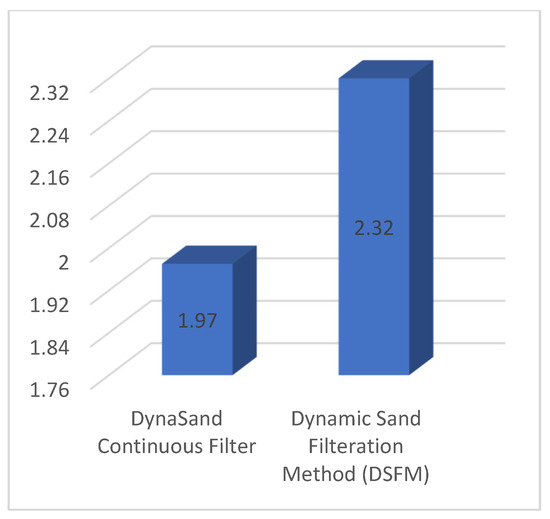
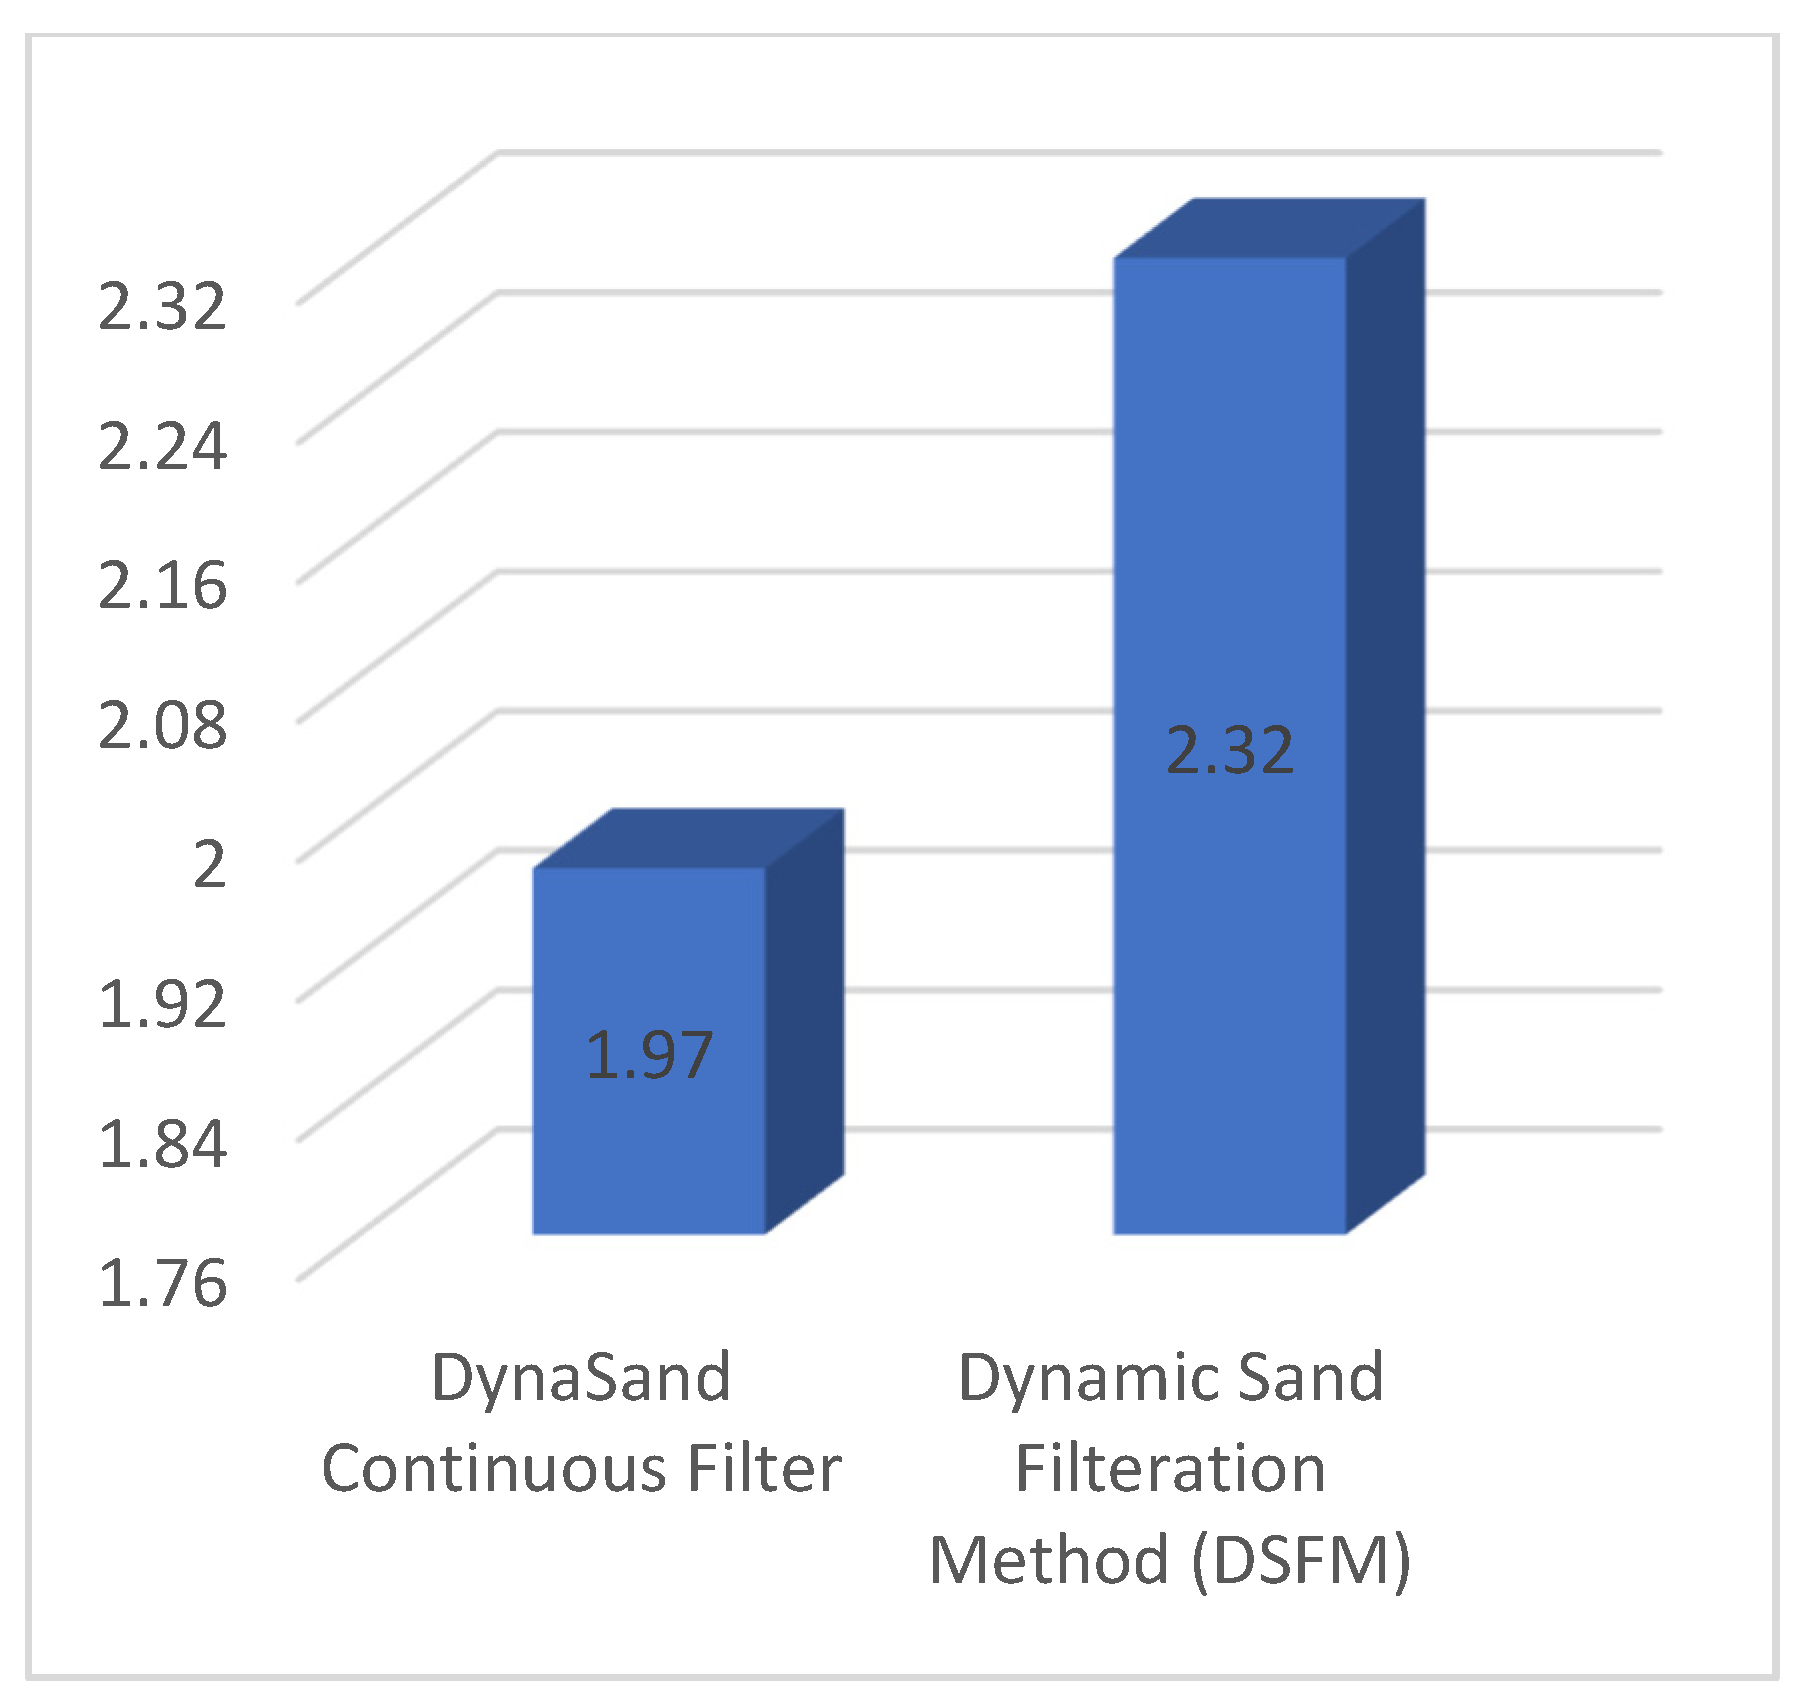
This is the least environmentally friendly scenario, with emissions peaking at 1.97 kg CO2e/m3. Static mixing and chemical dosing add 0.07 kWh and 0.135 kg CO2e, respectively. This configuration has the highest environmental cost even though it might guarantee better effluent quality, particularly for the removal of nutrients and heavy metals.
5.2.4. Scenario 4: Powdered Activated Carbon (PAC) Integration
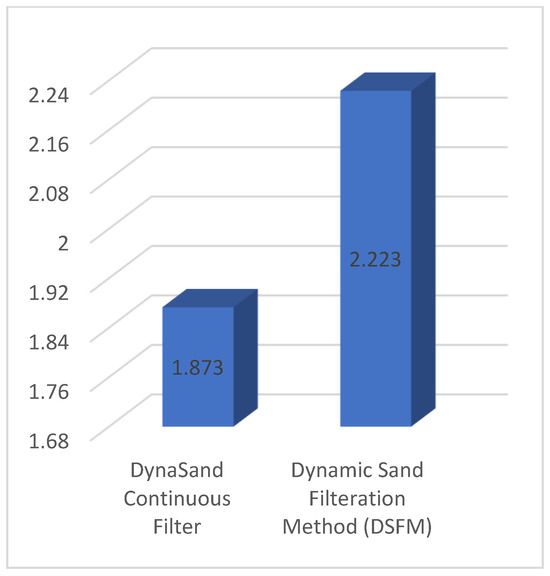
With lower energy consumption and overall emissions (1.873 kg CO2e/m3), this scenario marginally outperforms Scenario 3. The PAC is an effective enhancement strategy for particular pollutant targets because it adds very little in terms of emissions (0.003 kg CO2e). It mainly targets micro-pollutants and smell. In situations where effluent quality regulations are strict, PAC might be a better option than chemicals.
Overall, and because of the additional pumping needs, chemical production, and mechanical mixing involved in pre-filtration or chemical dosing systems, there are noticeable increases in emissions and energy consumption.
In every scenario, the Dynamic Sand Filter unit consistently has an impact, highlighting the necessity of optimizing its operational parameters (i.e., pumps that use less energy and intelligent controls). Scenario 1 is still the most resource-efficient scenario when considering climate change and energy use, though it might be less reliable in situations with complex or variable influences.
A compromise is provided by Scenario 4, which has somewhat greater effects than the baseline but may result in better effluent quality and a lower emissions increase than complete chemical treatment.
5.3. Analysis of Environmental Performance
A full comparative analysis of the environmental performance of the Dynamic Sand Filter continuous sand filtration system and conventional Dynamic Sand Filtration Methods (DSFMs) under comparable WWTP configurations and circumstances is presented in this section. TRACI-based CO2-equivalent emissions and energy use per 1 m3 of treated wastewater were used to analyze four typical treatment scenarios in accordance with the study’s functional unit.
Comparative analysis reveals that Dynamic Sand Filter systems consistently outperform average Dynamic Sand Filtration Methods (DSFMs) in both GWP and energy use, achieving 40–50% lower emissions and 25–30% lower energy consumption across all configurations. This advantage is attributed to the Dynamic Sand Filter’s continuous filtration mechanism, which eliminates frequent backwashing and reduces operational downtime.
Figure 6, Figure 7, Figure 8 and Figure 9 show the total emissions when using the Dynamic Sand Filter in the four stated scenarios in comparison with using regular Dynamic Sand Filtration.
Figure 6.
Comparison between emissions of the Dynamic Sand Filter and DSFM for Scenario 1.
Figure 7.
Comparison between emissions of the Dynamic Sand Filter and DSFM for Scenario 2.
Figure 8.
Comparison between emissions of the Dynamic Sand Filter and DSFM for Scenario 3.
Figure 9.
Comparison between emissions of the Dynamic Sand Filter and DSFM for Scenario 4.
5.4. Sesnstivity Analysis
To assess the reliability of the life cycle assessment (LCA) results and reinforce the prominence of the operational phase, a sensitivity analysis was carried out. This evaluation explores how key parameters affect Global Warming Potential (GWP), focusing on electricity emission factors, operational energy use, and treated flow rates.
5.4.1. Sensitivity to Electricity Emission Factor
Environmental impact is heavily influenced by the electricity generation mix. The base case uses an emission factor of 0.55 kg CO2e/kWh. To reflect regional differences, variations of ±30% were applied. Thus, the low-carbon scenario has 0.38 kg CO2e/kWh, while the high-carbon scenario has 0.72 kg CO2e/kWh.
The results show that total GWP shifts in line with the emission factor, producing a reduction of about 30% in total GWP when using low-carbon electricity, and there is an increase of roughly 31% when using high-carbon electricity.
Even with these changes, the operational phase continues to account for over 95% of total GWP across all scenarios, confirming the stability of the original conclusions.
5.4.2. Sensitivity to Flow Rate and Functional Unit
To examine the influence of system load, the treated flow rate was varied by ±25%, representing different plant capacities and hydraulic operating conditions. Higher flow rates enhance energy efficiency per cubic meter, while lower flow rates raise energy intensity per unit treated.
The results show that GWP per m3 fluctuates by around ±15%. The relative contribution of each life cycle stage stays consistent. This confirms that while scaling affects absolute emissions, it does not alter the overall environmental profile.
5.4.3. Sensitivity to Treatment Efficiency and Process Configuration
Additional scenarios were tested involving chemical dosing and powdered activated carbon (PAC). Chemical dosing raises GWP by up to 8–10%, while PAC addition increases GWP by less than 2%. These outcomes confirm that auxiliary treatment steps do contribute to emissions, but their effect remains small compared to electricity use during operations.
5.4.4. Overall Sensitivity Findings
Across all evaluated parameters, operational electricity consumption consistently dominates the environmental burden. In other words, total GWP is most responsive to changes in electricity emission factors and energy use.
On the other hand, variations in flow rate and process configuration have only secondary effects. Thus, the conclusion that the operational phase accounts for over 99% of GWP holds strong across a broad range of realistic conditions.
5.5. Discussion of Embodied Carbon and Energy
Additionally, the following data in Table 7 and Table 8 cover the comparison of the life cycles stages, starting with embodied carbon then embodied energy for treating 1 cubic meter of wastewater using both technologies.
Table 7.
Comparison between emissions needed to treat 1 m3 in kg CO2 eq (kg/m3).
Table 8.
Comparison between energy needed to treat 1 m3 in (kWh/m3).
Across all scenarios, the Dynamic Sand Filter consistently outperforms DSFM in both emissions and energy usage. This performance gap becomes more significant in complex scenarios where auxiliary systems are added (e.g., mixing, chemicals).
Excessive backwashing by more energy-intensive dynamic filters exerts additional energy consumption. As for pressure filters, they consume additional energy for filtering. The Dynamic Sand Filter resides in the lower portion of these technologies with regard to energy and, in return, emissions.
When checking the raw material extraction stage, it is obvious that the average emissions of DSFMs are marginally lower (0.08 in contrast to 0.1 kg CO2e/m3), which is most likely a result of the use of a reinforced concrete design, as opposed to the Dynamic Sand Filter, which is more steel- and plastic-intensive. Its higher operating emissions, however, outweigh this slight advantage.
For the manufacturing stage, the emissions from DSFMs are marginally higher (0.22 in contrast to 0.18 kg CO2e/m3) as a result of heavier material components and less effective fabrication techniques. This rise is a result of energy-intensive procedures such as casting, fitting, and forming in DSFM systems.
In the transportation stage, given that logistics profiles are thought to be comparable, emissions and energy are equal for both systems (0.02 kg CO2e/m3).
In the construction stage, DSFMs use more energy and produce more emissions (0.08 kg CO2e and 0.3 kWh in contrast to 0.05 kg CO2e and 0.15 kWh) mostly as a result of their stronger lifting needs for formwork and concrete pouring.
As for operation and maintenance, we found that the most important distinction is that comparative average solutions use twice as much energy and produce twice as many carbon emissions as the Dynamic Sand Filter.
The reason for this discrepancy in DSFM systems is continuous air scouring and/or backwashing, resulting in ineffective sand circulation and reduced hydraulic efficiency.
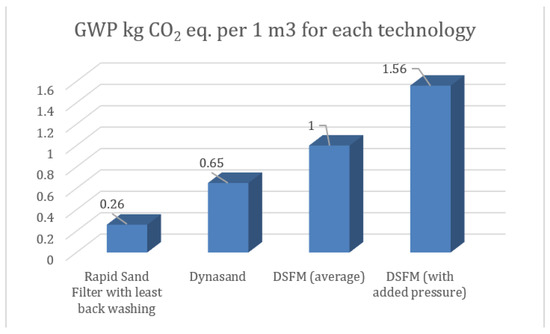
Figure 10 shows a direct comparison using simulated data through OpenLCA for treatment of the same functional unit using different filtration technologies. As illustrated earlier, the Dynamic Sand Filter has less environmental impact with regards to Global Warming Potential when compared to average DSFM techniques. Moreover, with added pressure from pressure filters, emissions can reach 2.4 times those of the Dynamic Sand Filter.
Figure 10.
Comparison between emissions of the Dynamic Sand Filter and other technologies for the same functional unit.
5.6. Discussion of Ecological Footprint
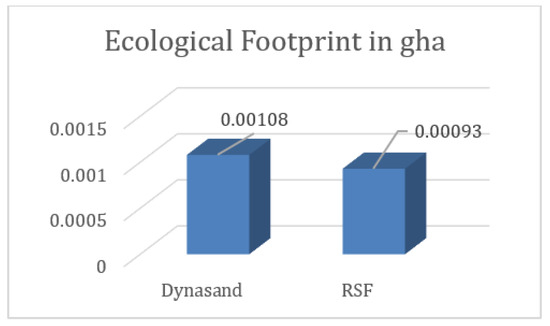
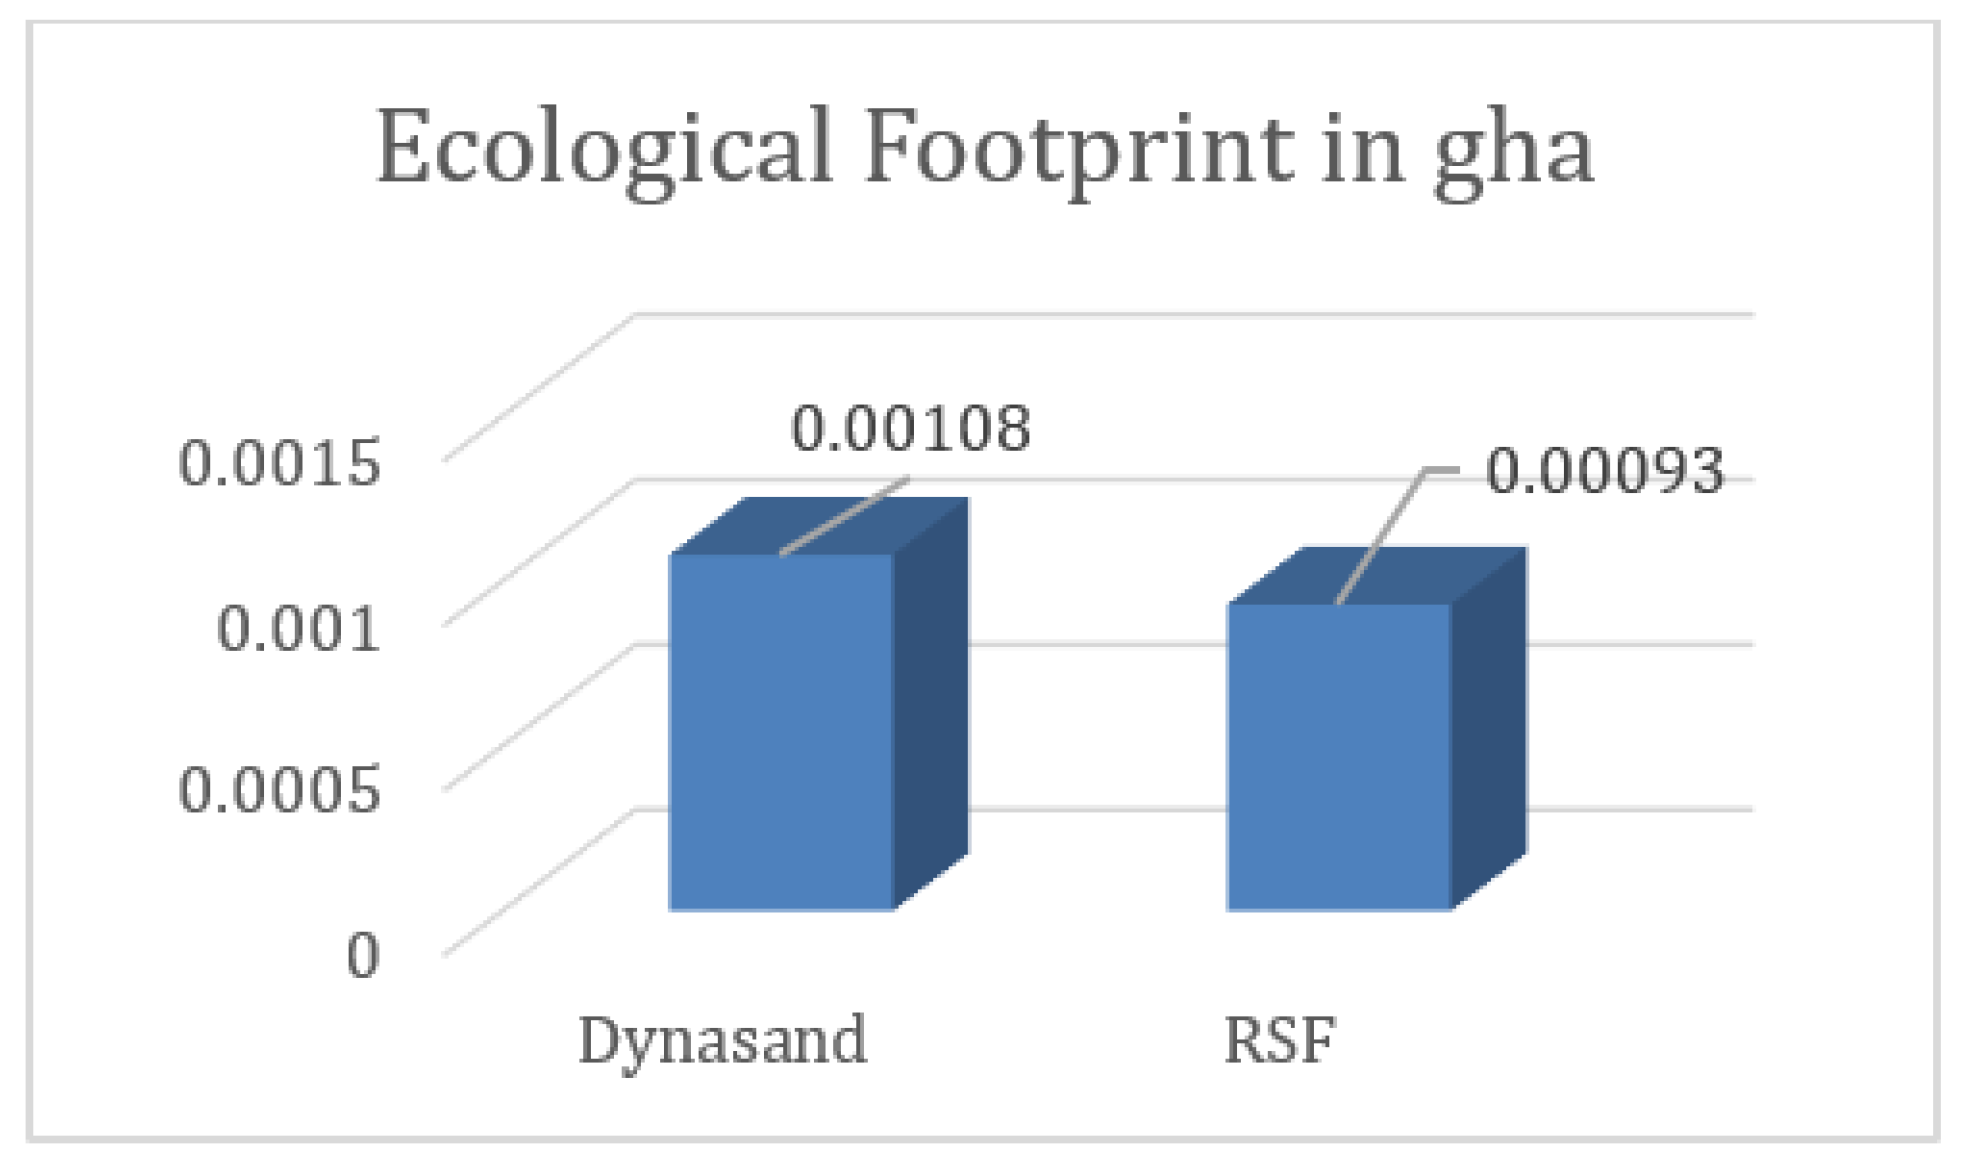
However, when using regular Rapid Sand Filters (RSFs), emissions are decreased by nearly 40% compared with those of the Dynamic Sand Filter. This is largely due to energy consumption, transportation emissions, and materials used. Ecological footprint decreases the gap between the Dynamic Sand Filter and RSF, since the regular sand filters need more space for installation, requiring bigger land use. However, the RSF still has a lower ecological footprint per functional unit in global hectares, producing nearly 86% of that from the Dynamic Sand Filter, as shown in Figure 11.
Figure 11.
Comparison between ecological footprints of the Dynamic Sand Filter and RSF technologies for the same functional unit in gha.
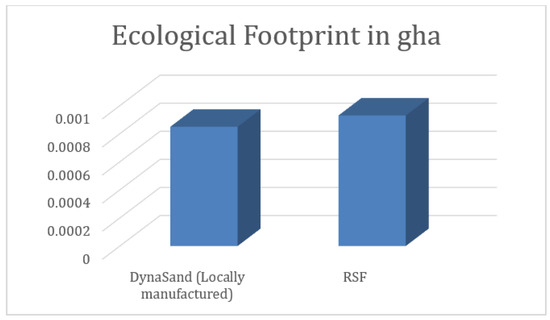
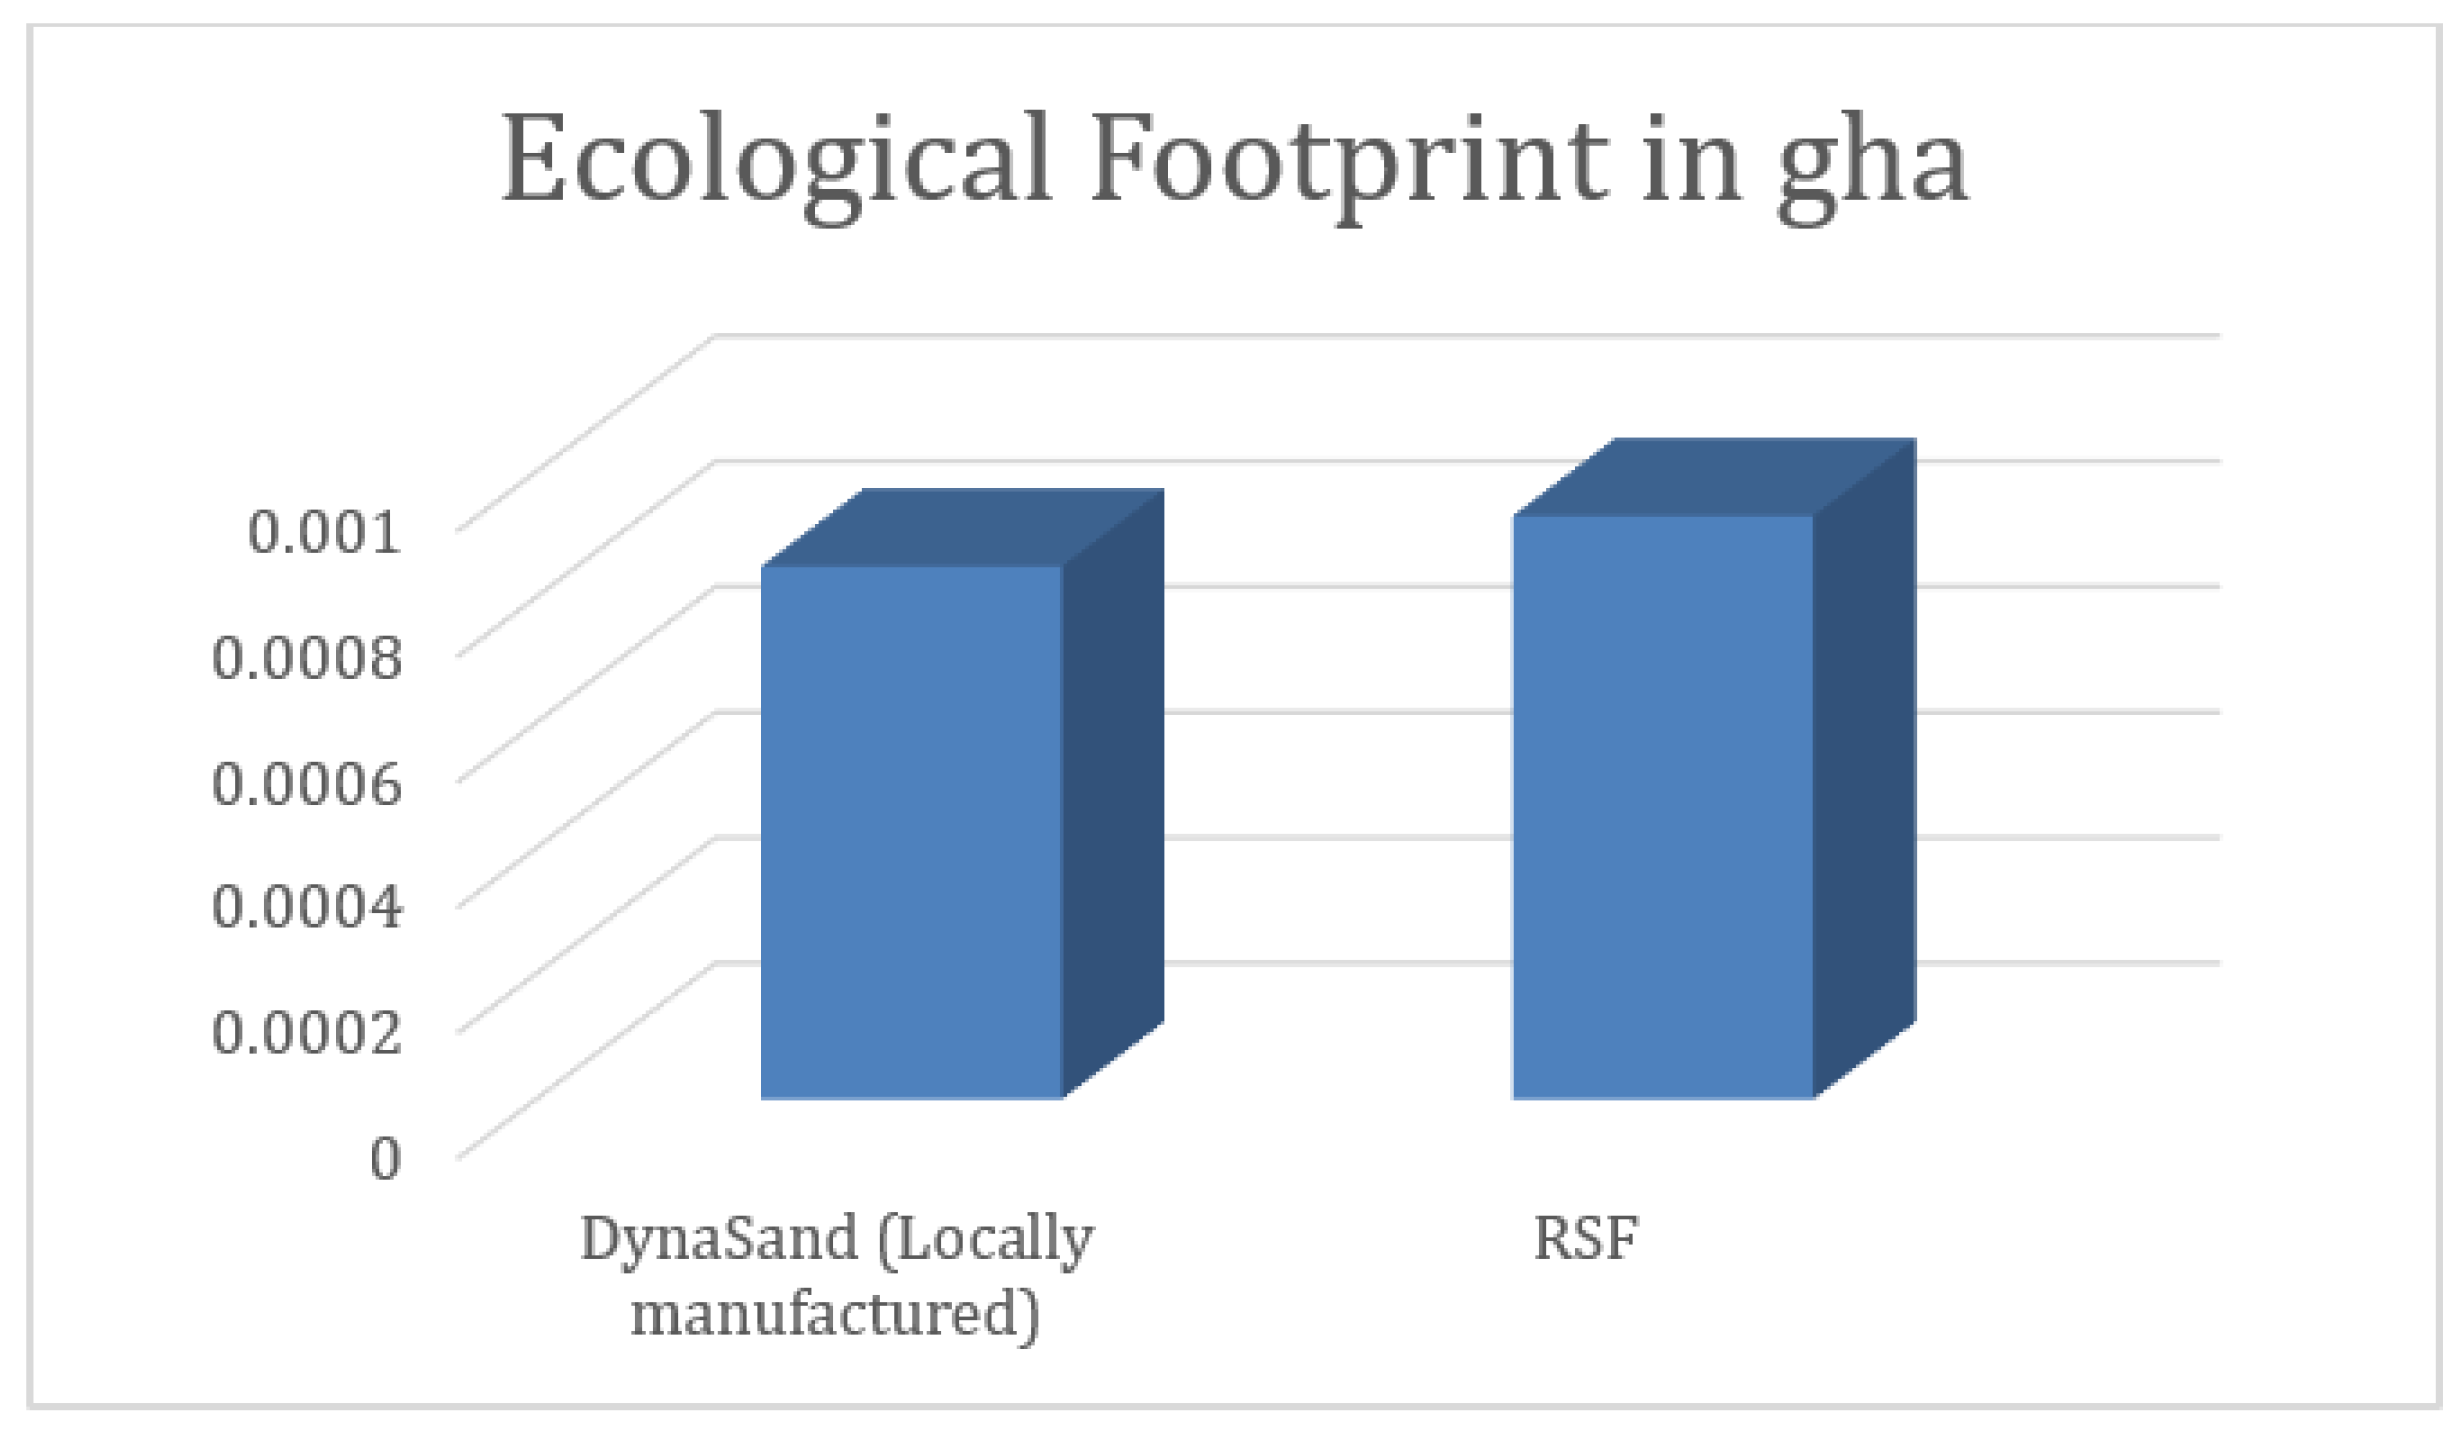
If manufacturing the Dynamic Sand Filter’s body locally, it can be made with concrete instead of steel. This will decrease the amount of emissions and reduce ecological footprint as well. The manufacturing process was simulated for reference and will be taken into consideration in future work and research opportunities.
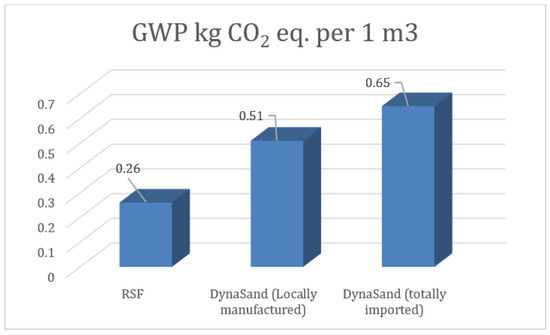
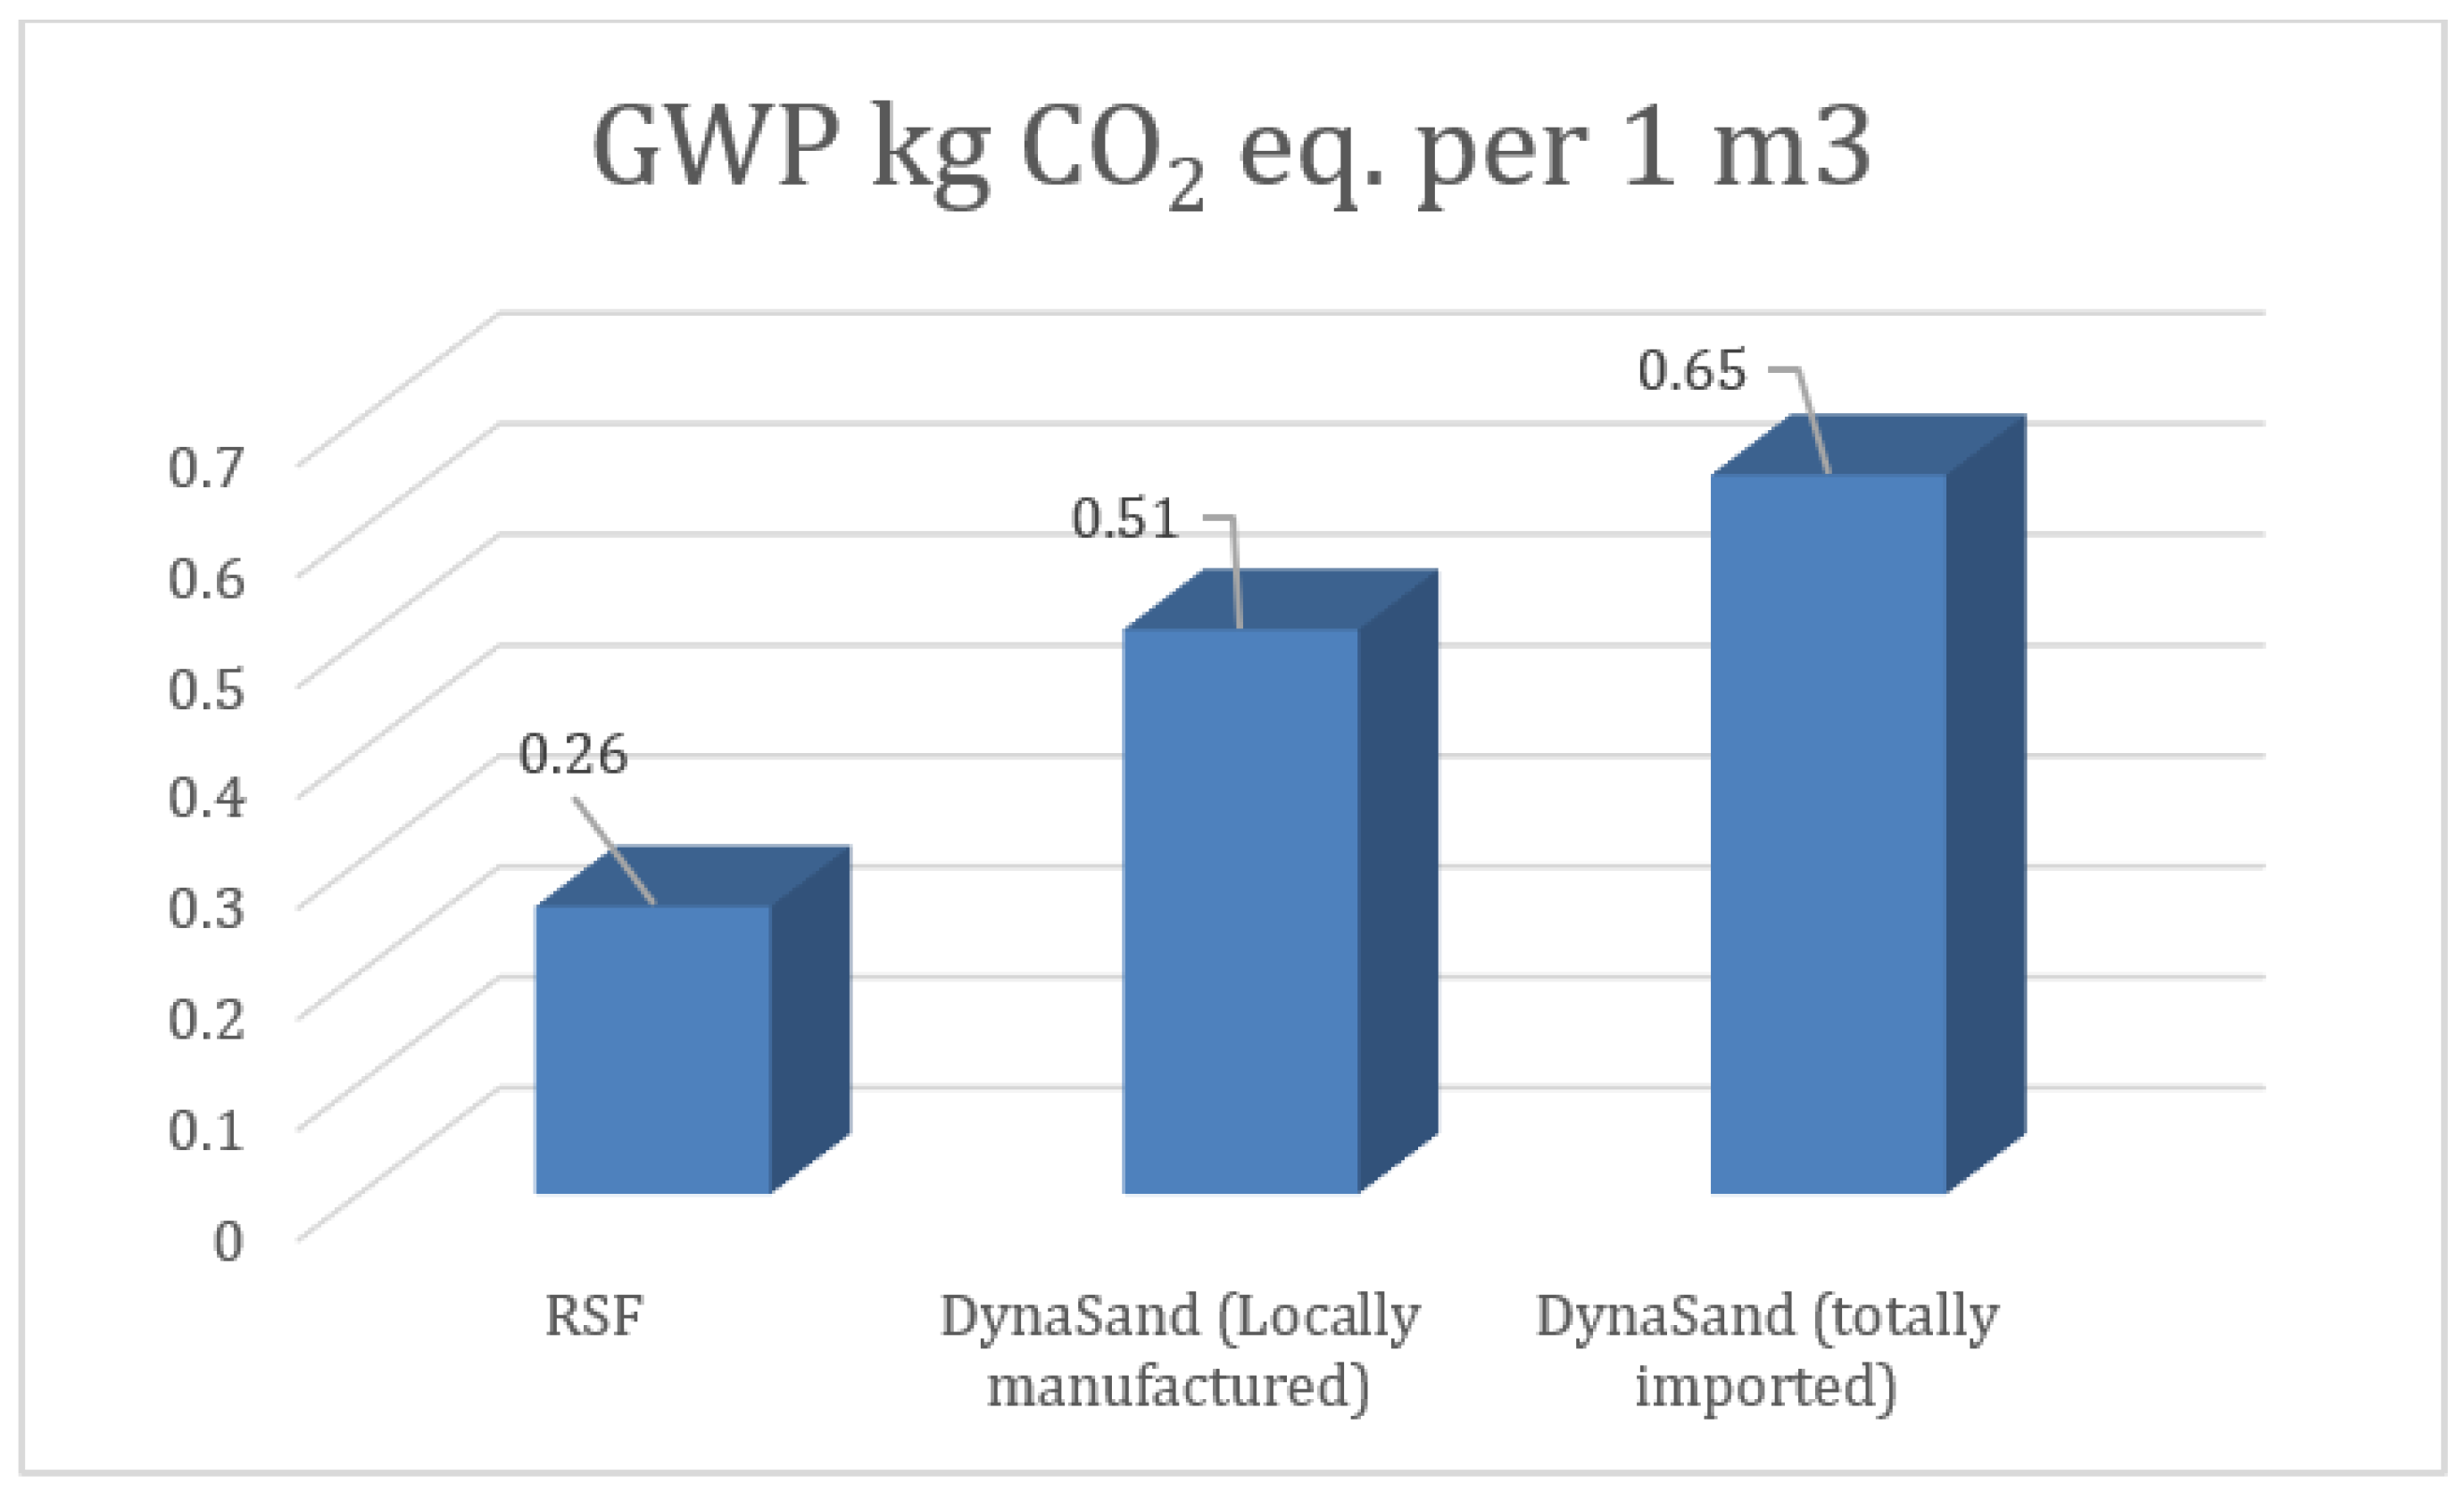
Subtracting the transportation and replacing the extraction of raw material and manufacturing life cycle stages resulted in a total reduction of 21.34% of total emissions for the Dynamic Sand Filter (Figure 12).
Figure 12.
Comparison between GWP for RSF and the Dynamic Sand Filter when its exterior body is locally manufactured and when it is totally imported.
This shows an additional advantage for the locally manufactured Dynamic Sand Filter’s exterior body, even when its core is still imported. Even though the RSF would still have a better and lower carbon footprint, the local Dynamic Sand Filter would have a smaller ecological footprint. Figure 13 shows that this change in parameters will give an advantage to the Dynamic Sand Filter, which has a lower ecological footprint than the RSF.
Figure 13.
Comparison between the ecological footprints of the Dynamic Sand Filter that is locally manufactured and RSF technologies for the same functional unit in gha.
6. Conclusions
The life cycle assessment (LCA) demonstrated that the Dynamic Sand Filter (DSF) is a more environmentally efficient alternative to conventional dynamic filtration technologies, particularly in reducing energy consumption and greenhouse gas emissions. Across all evaluated scenarios and configurations, the DSF consistently showed measurable environmental advantages, with operational emissions reduced by approximately 40–50% (kg CO2 per m3 treated water) and energy consumption lowered by 25–30% compared to conventional DSFM systems.
Three primary contributors to environmental impact were consistently identified. The first and most significant factor is electricity consumption during operation. Energy use associated with sand circulation systems, compressors, and pumps accounts for over 80% of total emissions during long-term operation, making it the dominant source of Global Warming Potential (GWP). The second factor relates to material use, particularly coated steel vessels and electronic control units, which contribute significantly to emissions, fossil resource depletion, and the potential impacts of human toxicity. The third factor involves maintenance activities, including sand replacement and auxiliary processes. While the DSF reduces the need for backwashing, additional systems such as chemical dosing or mixing units can marginally increase long-term energy demand.
Operational energy clearly dominates the environmental footprint, reinforcing the importance of energy-efficient system design and renewable energy integration. In general, simpler treatment configurations provide more sustainable outcomes. Scenario analysis indicates that Scenario 1 is optimal for stable influent conditions, offering the lowest energy demand, while Scenario 4 (PAC addition) provides a relatively low-impact and cost-effective option for removing organics and trace pollutants. In contrast, Scenario 3 (full chemical and mechanical treatment) significantly increases environmental burdens and should only be implemented when strictly required.
Compared to conventional DSFM systems, the Dynamic Sand Filter consistently achieves lower environmental impacts across all life cycle stages. In addition to the operational reductions, DSF systems demonstrate lower total life cycle emissions and improved material efficiency, despite slightly higher embodied emissions during construction. These initial impacts are rapidly offset during operation due to reduced energy requirements. Furthermore, when compared with Rapid Sand Filters (RSFs), DSFs show substantial ecological benefits, including up to 91% lower ecological footprint (gha per m3), although RSF may exhibit a 51% lower carbon footprint in specific configurations.
The continuous operation of DSF eliminates the need for frequent backwashing, significantly reducing energy consumption per unit of treated water. In contrast, DSFM systems require more intensive air and hydraulic cleaning, particularly under variable influent conditions, leading to higher operational energy demand. These findings support the LCA principle that long-term operational performance outweighs construction-phase impacts in determining overall sustainability.
However, several limitations should be noted. Sludge generation and handling were excluded from the system boundaries, which may influence total environmental impact in full-scale applications. Additionally, this study does not directly assess contaminant removal efficiency, potentially overlooking performance variations under different influent conditions.
Future research should focus on pilot-scale validation, hybrid system optimization, and eco-design improvements to reduce embodied emissions. Expanding assessments to include full plant-level LCAs, sludge management processes, and combined environmental–performance metrics will provide a more comprehensive evaluation.
Overall, the Dynamic Sand Filter represents a robust and sustainable solution for wastewater treatment, delivering significant reductions in energy use, carbon emissions, and ecological footprint while maintaining effective treatment performance.
Author Contributions
Conceptualization, O.H. and A.E.G.; methodology, O.E. and E.K.D.; software, O.E.; validation, O.E., E.K.D. and I.A.; formal analysis, O.H.; investigation, O.E.; resources, O.H.; data curation, K.N.; writing—original draft preparation, O.E. and E.K.D.; writing—review and editing, E.K.D.; visualization, O.H.; supervision, O.H. and A.E.G.; project administration, O.H. and A.E.G.; funding acquisition, O.H., A.E.G. and K.N. All authors have read and agreed to the published version of the manuscript.
Funding
This research was funded by the Science, Technology and Innovation Funding Authority (STDF), grant number 47368, and the APC was funded by the American University in Cairo.
Institutional Review Board Statement
Not applicable.
Informed Consent Statement
Not applicable.
Data Availability Statement
The original contributions presented in this study are included in the article. Further inquiries can be directed to the corresponding author.
Acknowledgments
We would like to thank the Science and Technology Development Fund (STDF) for funding and supporting our research.
Conflicts of Interest
The authors declare no conflicts of interest.
References
- Corominas, L.; Foley, J.; Guest, J.S.; Hospido, A.; Larsen, H.F.; Morera, S.; Shaw, A. Life cycle assessment applied to wastewater treatment: State of the art. Water Res. 2013, 47, 5480–5492. [Google Scholar] [CrossRef] [Scilit]
- Pasqualino, J.C.; Meneses, M.; Abella, M.; Castells, F. LCA as a tool for the environmental improvement of the operation of a municipal wastewater treatment plant. Environ. Sci. Technol. 2009, 43, 3300–3307. [Google Scholar] [CrossRef] [Scilit]
- Parkson Corporation. Dynamic Sand Filter® Continuous Sand Filter: Technical Brochure. Parkson Corporation. 2020. Available online: https://www.parkson.com (accessed on 1 January 2025).
- Nielsen, P.H.; Petersen, G. Continuous sand filters in wastewater treatment: Performance and operational experience. Water Pract. Technol. 2015, 10, 689–696. [Google Scholar] [CrossRef] [Scilit]
- ISO 14040:2006; Environmental Management—Life Cycle Assessment—Principles and Framework. International Organization for Standardization: Geneva, Switzerland, 2006.
- Guinée, J.B. (Ed.) Handbook on Life Cycle Assessment: Operational Guide to the ISO Standards; Springer: Berlin/Heidelberg, Germany, 2002. [Google Scholar]
- Hospido, A.; Moreira, M.T.; Feijoo, G. A comparison of municipal wastewater treatment plants for big centres of population in Galicia (Spain). Int. J. Life Cycle Assess. 2008, 13, 57–64. [Google Scholar] [CrossRef]
- Rodríguez-García, G.; Molinos-Senante, M.; Hospido, A.; Hernández-Sancho, F.; Moreira, M.T.; Feijoo, G. Environmental and economic profile of six typologies of wastewater treatment plants. Water Res. 2011, 45, 5997–6010. [Google Scholar] [CrossRef] [Scilit]
- Bare, J.C. TRACI 2.0: The tool for the reduction and assessment of chemical and other environmental impacts 2.0. J. Ind. Ecol. 2011, 15, 687–696. [Google Scholar] [CrossRef] [Scilit]
- Hammond, G.P.; Jones, C.I. Embodied energy and carbon in construction materials. Proc. Inst. Civ. Eng. Energy 2008, 161, 87–98. [Google Scholar] [CrossRef] [Scilit]
- Corominas, L.; Foley, J.; Guest, J.S.; Hospido, A.; Larsen, H.F.; Morera, S.; Shaw, A. The application of life cycle assessment (LCA) to wastewater treatment: A best practice guide and critical review. Water Res. 2020, 184, 116058. [Google Scholar] [CrossRef] [Scilit]
- Rashid, M.M.; Liu, Y. Assessing environmental impacts of large centralized wastewater treatment plants with combined or separate sewer systems in dry/wet seasons by using LCA. Environ. Sci. Pollut. Res. 2020, 27, 33097–33112. [Google Scholar] [CrossRef] [Scilit] [PubMed]
- Morsy, M.; Mostafa, K.; Galal, M.; Abdalla, Z. Life Cycle Assessment of Upgrading Primary Wastewater Treatment Plants to Secondary Treatment Including a Circular Economy Approach. Air Soil Water Res. 2020, 14, 1178622120935857. [Google Scholar] [CrossRef] [Scilit]
- Rashid, S.S.; Harun, S.N.; Hanafiah, M.M.; Razman, K.K.; Liu, Y.-Q.; Tholibon, D.A. Life Cycle Assessment and Its Application in Wastewater Treatment: A Brief Overview. Processes 2023, 11, 208. [Google Scholar] [CrossRef] [Scilit]
- Hosseini, P.B.; Anya, B.; Mohammadpourfard, M.; Akkurt, G.G.; Breyer, C.; Mohammadi-Ivatloo, B. Renewable energy integration in wastewater treatment plants: A review of pathways to energy self-sufficiency and sustainability. J. Environ. Manag. 2026, 403, 129147. [Google Scholar] [CrossRef] [Scilit] [PubMed]
- Tsangas, M.; Papamichael, I.; Banti, D.; Samaras, P.; Zorpas, A.A. LCA of municipal wastewater treatment. Chemosphere 2023, 341, 139952. [Google Scholar] [CrossRef] [Scilit]
- Raghuvanshi, S.; Bhakar, V.; Sowmya, C.; Sangwan, K.S. Waste Water Treatment Plant Life Cycle Assessment: Treatment Process to Reuse of Water. Procedia CIRP 2017, 61, 761–766. [Google Scholar] [CrossRef] [Scilit]
- Qiu, Y.; Li, B.; Shi, H. Life cycle assessment of energy saving techniques for wastewater treatment processes. In Proceedings of the 2011 International Conference on Electrical and Control Engineering, Yichang, China, 16–18 September 2011; pp. 4557–4560. [Google Scholar] [CrossRef] [Scilit]
- Abuelkhair, N.Y.; El Nadi, M.H.; Fouad, H.A.; Hefny, R.M. Dynamic Sand Filter Performance against High Solids Loads in Raw Water. Benha J. Appl. Sci. 2022, 7, 97–101. [Google Scholar] [CrossRef] [Scilit]
- Laouane, H.; El Joumri, L.; Halhaly, A.; Arid, Y.; Labjar, N.; El Hajjaji, S. Life-Cycle Assessment of Wastewater Treatment: Enhancing Sustainability Through Process Optimization. Sustainability 2026, 18, 605. [Google Scholar] [CrossRef] [Scilit]
- di Celso, G.M.; Cecchini, F.; Innocenzi, V.; Ayedi, K.; Prisciandaro, M. Life Cycle Assessment of a Municipal Wastewater Treatment Plant Using Simapro 9 Software Tool—Preliminary Results. Chem. Eng. Trans. 2025, 117, 469–474. [Google Scholar]
- Niero, M.; Pizzol, M.; Bruun, H.G.; Thomsen, M. Comparative life cycle assessment of wastewater treatment in Denmark including sensitivity and uncertainty analysis. J. Clean. Prod. 2014, 68, 25–35. [Google Scholar] [CrossRef] [Scilit]
- Ogbu, C.A.; Alexiou Ivanova, T.; Ewemoje, T.A.; Alabi, H.A.; Roubik, H. Towards environmentally sustainable water management in Africa: A comprehensive review of life cycle assessment studies in water and wastewater treatment. Int. J. Life Cycle Assess. 2025, 30, 956–979. [Google Scholar] [CrossRef] [Scilit]
- Lui, J.; Lee, S.; Sloan, W.T.; You, S. Life cycle assessment of drinking water and wastewater treatment works in mainland Scotland. Sci. Total Environ. 2025, 958, 177989. [Google Scholar] [CrossRef] [Scilit] [PubMed]
- de Medeiros Souza, B.; de Oliveira, R.; do Nascimento, R.S.; de Brito Medeiros, K.T. Comparative life cycle assessment in wastewater treatment plants: Scenario analysis with OpenLCA. Rev. Bras. Cienc. Ambient. 2025, 60, e2330. [Google Scholar] [CrossRef] [Scilit]
- ISO 14044; Environmental Management—Life Cycle Assessment—Requirements and Guidelines. International Organization for Standardization: Geneva, Switzerland, 2006.
- ISO 14001; Environmental Management Systems—Requirements with Guidance for Use. International Organization for Standardization: Geneva, Switzerland, 2015.

Disclaimer/Publisher’s Note: The statements, opinions and data contained in all publications are solely those of the individual author(s) and contributor(s) and not of MDPI and/or the editor(s). MDPI and/or the editor(s) disclaim responsibility for any injury to people or property resulting from any ideas, methods, instructions or products referred to in the content. |
© 2026 by the authors. Licensee MDPI, Basel, Switzerland. This article is an open access article distributed under the terms and conditions of the Creative Commons Attribution (CC BY) license.