


Abstract
The aggregation of flexible resources contributes to sustainability because it impacts on CO2 emissions, enables renewable energy integration, improves network efficiency and makes the electric power system more resilient. The research project DEMAND has tested the potential of bottom-up aggregation of smart prosumers with no intermediation by a third-party balancing service provider. The present work analyzes the electrical and environmental effects of this new type of aggregation in different scenarios, taking into account both simulated data and data obtained from four pilot sites where the DEMAND system has been implemented. The effectiveness of the proposed aggregation method is evaluated through the calculation of some KPIs: power peaks, grid losses, voltage drops and CO2 emissions.
1. Introduction
1.1. Literature Review
It is now well-established that to achieve a transition towards renewables, a major role must be played by final end-users [1,2]. Consumers’ flexibility is required to solve problems such as those posed by unpredictable and variable generation from solar and wind systems [3] and peak loads [4], contributing to the sustainability of the electric power system. Flexibility is referred to as the ability to modify the power profile in response to a signal coming from outside, which may be a change in the price of electricity or a request from a network operator or an “aggregator” [2,5,6]. In this context, many companies are playing a major role in this transformation. Among these, it is worth citing the experience of EnerNOC, Boston, US (now integrated into Enel X, Rome, Italy), a market leader in behind-the-meter storage, with more than 1000 MW of aggregated power from commercial and industrial end-users which started operating in 2001 [7]. Comverge, Rome, Italy (now integrated into Itron, Cinisello Balsamo, Italy) handles 4.5 million devices in the US installed at residential, commercial and industrial end-users, implementing “pay-for-performance” programs for reducing grid losses, CO2 emissions and improving system’s reliability [8,9]. Cpower, Baltimore, US manages end-users’ flexibility for reducing the load with a cost reduction for the participant and, at the same time, improvements in the network operation [10].
The European Commission pushed the Member States to roll-out smart metering systems in order to promote energy efficiency and enable DR schemes for final customers [11,12]. In Italy, the interest in prosumers’ aggregation is bound to the addition of new resources to the ancillary services market [13]. Since the issue of the first deliberation of the Italian Regulatory Authority for Energy, Networks and Environment (ARERA) in 2017 [14], over 220 Virtually Aggregated Mixed Units with a power of approximately 1280 MW and 17 different aggregators responsible for the ancillary services have already been assigned a capacity contract and are responsible for providing flexibility traded on the ancillary services market [15,16].
1.2. Research Gap and Contribution of the Paper
In this scenario, the Italian Research Project DEMAND (DistributEd MANagement logics and Devices for electricity savings in active users installations), proposed a new way to exploit the distributed flexibility envisaging the replacement of the aggregator with a Virtual Aggregation Environment (VAE), where end-users receive requests from the Distribution System Operator (DSO) and offer their flexibility by exploiting the installed flexible devices (loads, generators, storage systems), according to collaborative or competitive logics [17]. The proposed one is a bottom-up-type aggregation process, that takes place without the coordination of a third-party agent that could belong to a larger corporate group that includes a DSO or an energy retailer. The main advantages of this aggregation process are greater impartiality and transparency, because of the elimination of potential conflicts of interest. According to the business model developed for the project, aggregators are private companies that can decide to provide their services to certain agents, excluding others, and their value grows higher the more flexible power they manage because, in that case, they can exhibit certain network effects [17]. In this decision, prosumers, who are the real flexibility owners, have no right to participate and can only modulate their power according to commands or price signals coming from the aggregator [18]. Finally, the absence of an aggregator increases the revenue for the end-users, considering that, usually, the revenue for the aggregator is between 10% and 40% of the offered flexibility price [19].
A preliminary concept of DEMAND was proposed in ref. [20], while in ref. [17] and [21] the main steps of the bottom-up aggregation process and of the algorithm carried out for implementing the prosumers’ flexibility have been proposed. During the project, four pilot sites, where the energy gateway developed for the bottom-up aggregation process has been installed, have been monitored in Italy: a house, a data center, an assisted nursing home and a factory. Starting from the data collected from these sites and from others obtained by simulations, this article investigates the impacts of the bottom-up aggregation on the utility grid and, in general, on the power system.
In particular, the following two representative models of Low Voltage (LV) and Medium Voltage (MV) networks are defined to assess the potential effects that can be obtained with the DEMAND system in different scenarios, in terms of reduction in power peak, grid losses and voltage drops. To assess the sustainability impact of the project, the reductions in CO2 emissions are ultimately calculated in various scenarios.
Other studies in the literature have faced the problem of assessing the impact of DR and aggregation on the electrical power system. A few examples are reported below. In ref. [22], the authors analyze various demand end-uses and grid flexibility options and their impact for different levels of photovoltaic (PV) systems penetration in Florida. The simulations show how DR can reduce production costs, the number of low-load hours for traditional generators, and curtailment. In ref. [23], the influence of DR programs in emergency situations on improve reliability in the case of generation unit failure was investigated with the aim of assisting DSOs in scheduling day-ahead generating units in a more reliable manner. In ref. [24], the impact of DR with direct load control on system stability is examined. In ref. [25], the authors show the impact on the power grid of the SIRRCE system for managing the flexibility of air-conditioning units at the end-users’ facility, in the presence and in the absence of PV systems and for various DR logics. In ref. [26] the authors propose a phased multi-contract collaborative scheduling that, through intelligent algorithms, dynamically optimizes decisions across the day-ahead and intraday phases of the electricity market.
Finally, several articles present assessments of the effects of DR actions operated by battery storage systems [27,28,29,30] and electric vehicles [31,32,33,34] in buildings, in terms of improved power quality and reliability, reduction in the number of interruptions, and enhancement in the generators’ utilization.
In this framework, the novelty of the paper lies in the presentation of results based on an innovative and unique system for aggregating distributed resources, looking to the impacts on the power grid and the environment. The main novelty of the DEMAND system is that it allows the synchronous management of distributed resources and a bottom-up aggregation without the inclusion of a third-party agent and without necessarily relying to a blockchain-based platform, as many other studies did in the last few years [35,36,37]. The main advantage with respect to blockchain-based aggregation algorithms is that the technological content, and thus the final cost of the energy management system, is lower. Furthermore, prosumers might somehow be scared by the adoption of a system based on advanced IT technologies without knowing exactly where their data are shared, although blockchain is well-known for its data security insurance. Finally, blockchain technology does not always prove to be the best solution for some typical applications in electrical power systems, and its use must be carefully evaluated in relation to various factors such as:
- Scalability and performance, since blockchain may struggle with high transaction volumes in large P2P networks;
- Transaction costs that can make frequent micro-transactions from small end-users economically inefficient;
- Technical complexity due to the need of advanced expertise in smart contracts, cybersecurity, and node management;
- Latency due to the need for transaction validation, that can introduce delays, which is problematic for real-time energy balancing;
- High energy consumption of the system (as an example, proof-of-work blockchains are highly energy-intensive).
In summary, the main contributions of the proposed architecture are as follows:
- Distributed bottom-up multi-user aggregation framework enabling coordinated flexibility among multiple entities, overcoming the single-user/microgrid paradigm of existing solutions and avoiding the limitation of the blockchain-based programs;
- Unlocking small-scale flexibility by integrating residential and low-capacity users, thus extending market participation beyond traditionally relevant industrial and tertiary actors;
- Decentralized coordination architecture eliminating the need for an aggregator operating a centralized control, ensuring enhanced scalability, resilience, and adaptability.
1.3. Structure of the Paper
The rest of the paper is organized as follows: Section 2 briefly presents the architecture and operation of the DEMAND System; Section 3 describes the methodology applied for the study and the data for the simulations; Section 4 presents the case study with the text networks and the prosumers’ power profile; Section 5 illustrates the results of the simulations; and Section 6 ultimately reports the conclusions of the paper.
2. Architecture and Operation of the DEMAND System
2.1. System Architecture
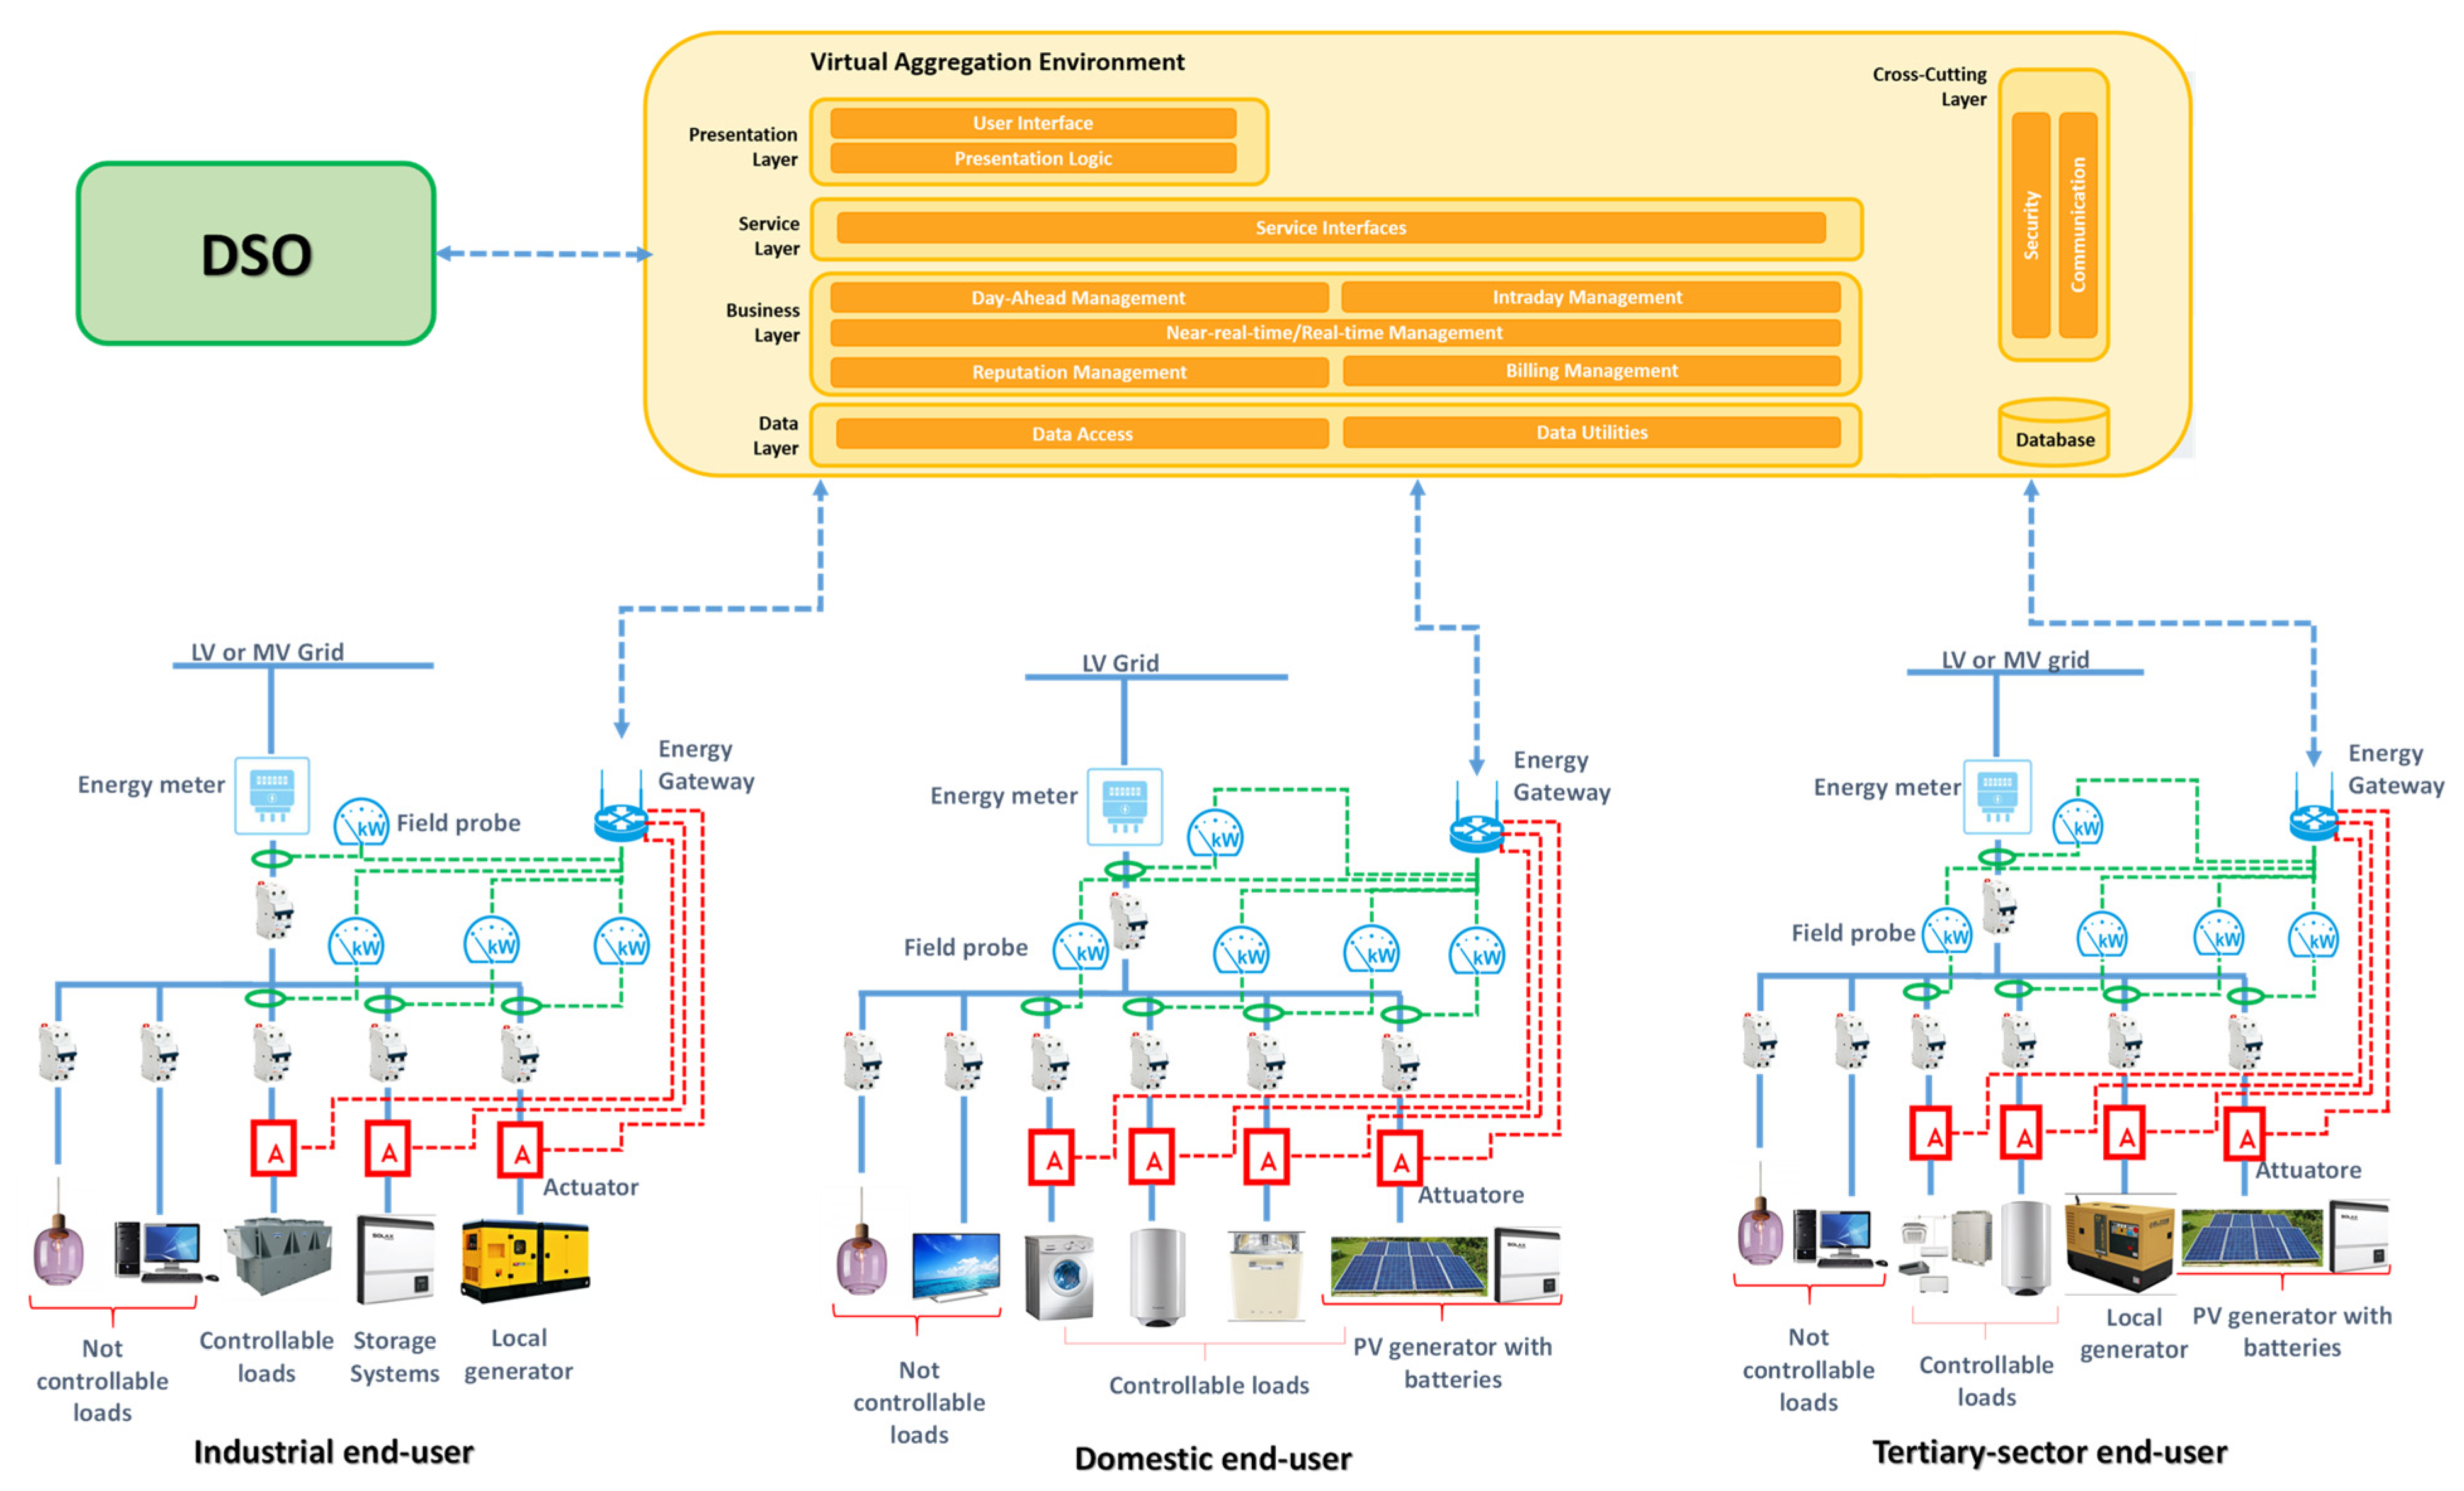
The DEMAND project proposes a new framework for enabling a bottom-up aggregation of smart prosumers in a cooperative, collaborative, but also competitive way. The competition is based on the fact that each prosumer can bid an amount of energy, but the final aggregate, indicated as “winning aggregate”, is made up only from the best combination of bids. The main aim of the aggregation process is to assist the utility (DSO) in regulating the power profile at one or more defined buses of the distribution grid. Therefore, the DSO sends to the VAE a request of variation of the power profile in a defined time interval of the following day (with a tolerance) together with a list of point of delivery (POD) codes of the end-users that are in the area where the congestion could occur.
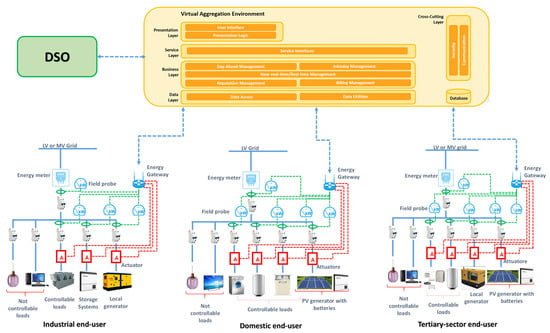
Figure 1 represents the conceptual map of the DEMAND system. The main device of the system, developed by the industrial partners of the project consortium (Engineering S.p.a., Algorab S.r.l. and Cupersafety S.r.l.), is the energy gateway, connecting the end-users to remote computing resources in the VAE that run the energy management system (EMS) of the prosumer. The energy gateway has a local EMS implementing basic functions such as collecting data from end-users, providing a communication interface with the VAE with a display for the exchanged messages, and excluding an end-user from the community if it does not want to take part in a specific load shifting action.
Figure 1.
Conceptual Map of the DEMAND system.
In addition, to record the power profile of the prosumer and to manage the controllable loads and the other flexible devices (generators and batteries), the following devices must be installed at every node of the aggregated community: a smart meter to measure the electricity exchanged with the main grid, a smart meter for each flexible device, an actuator for each controlled flexible device, and other components for ensuring the information exchange between the gateway and all the smart meters and actuators.
2.2. Bottom-Up Aggregation Algorithm
The algorithm for the management of prosumers’ flexibility has been described in detail in ref. [21] and is based on a process consisting of two different phases.
In Phase 1, the optimal cost of the flexibility bid is calculated. The cost corresponds to the minimum economic compensation that the user is willing to accept to modify their consumption and is mainly related to the cost of dissatisfaction, i.e., the cost that the user attributes to their discomfort, as well as the cost of the energy associated with the flexibility bid. With reference to the cost of discomfort, it should be noted that no standardized value can be found in the literature. This parameter is inherently user-dependent and may also vary over time for the same user. Indeed, some users may be more willing than others to respond to DSO requests and therefore assign a lower cost to their perceived discomfort. Furthermore, the same user may attribute different discomfort costs on different days depending on factors such as work commitments, health conditions, or personal obligations. In some cases, the discomfort cost may be set to relatively high values to signal a limited willingness to modify consumption patterns.
Users can offer different flexibility values in each moment, resulting from different combinations of the available controllable devices; therefore, it is necessary to calculate the combinations of the flexibility values achievable in each time interval, the cost as a combination of the flexibility bids, and the combinations of the devices involved, each of which is identified by a numerical code. The output of this optimization process is a matrix containing, in each line, the value of a possible flexibility offer, the cost of the flexibility offer, and the identification numbers of the devices involved in the offer, respectively. Finally, these results are sent to the VAE.
Regarding the performance of this process, in ref. [21] several simulations were carried out to assess the performance of the proposed aggregation algorithm. The results show computation times lower than 30 min and are dependent on the requested power variation. These times are compatible with power system operational requirements, as the aggregation process is carried out the day before the flexibility is needed.
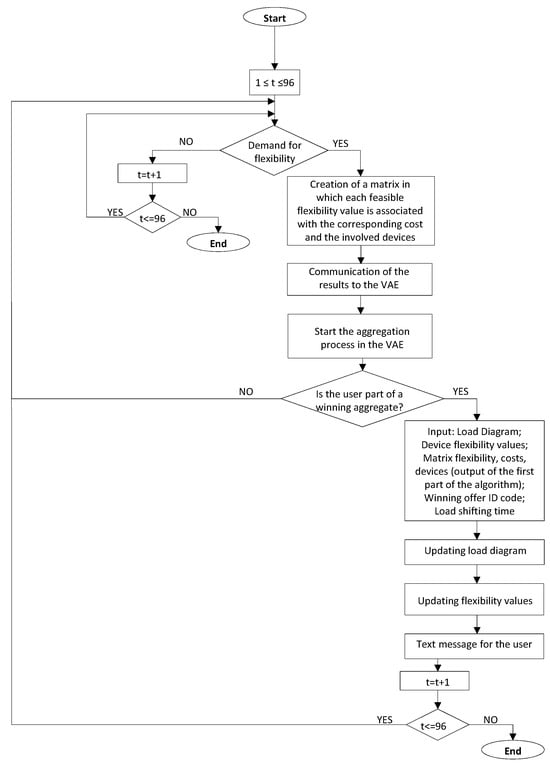
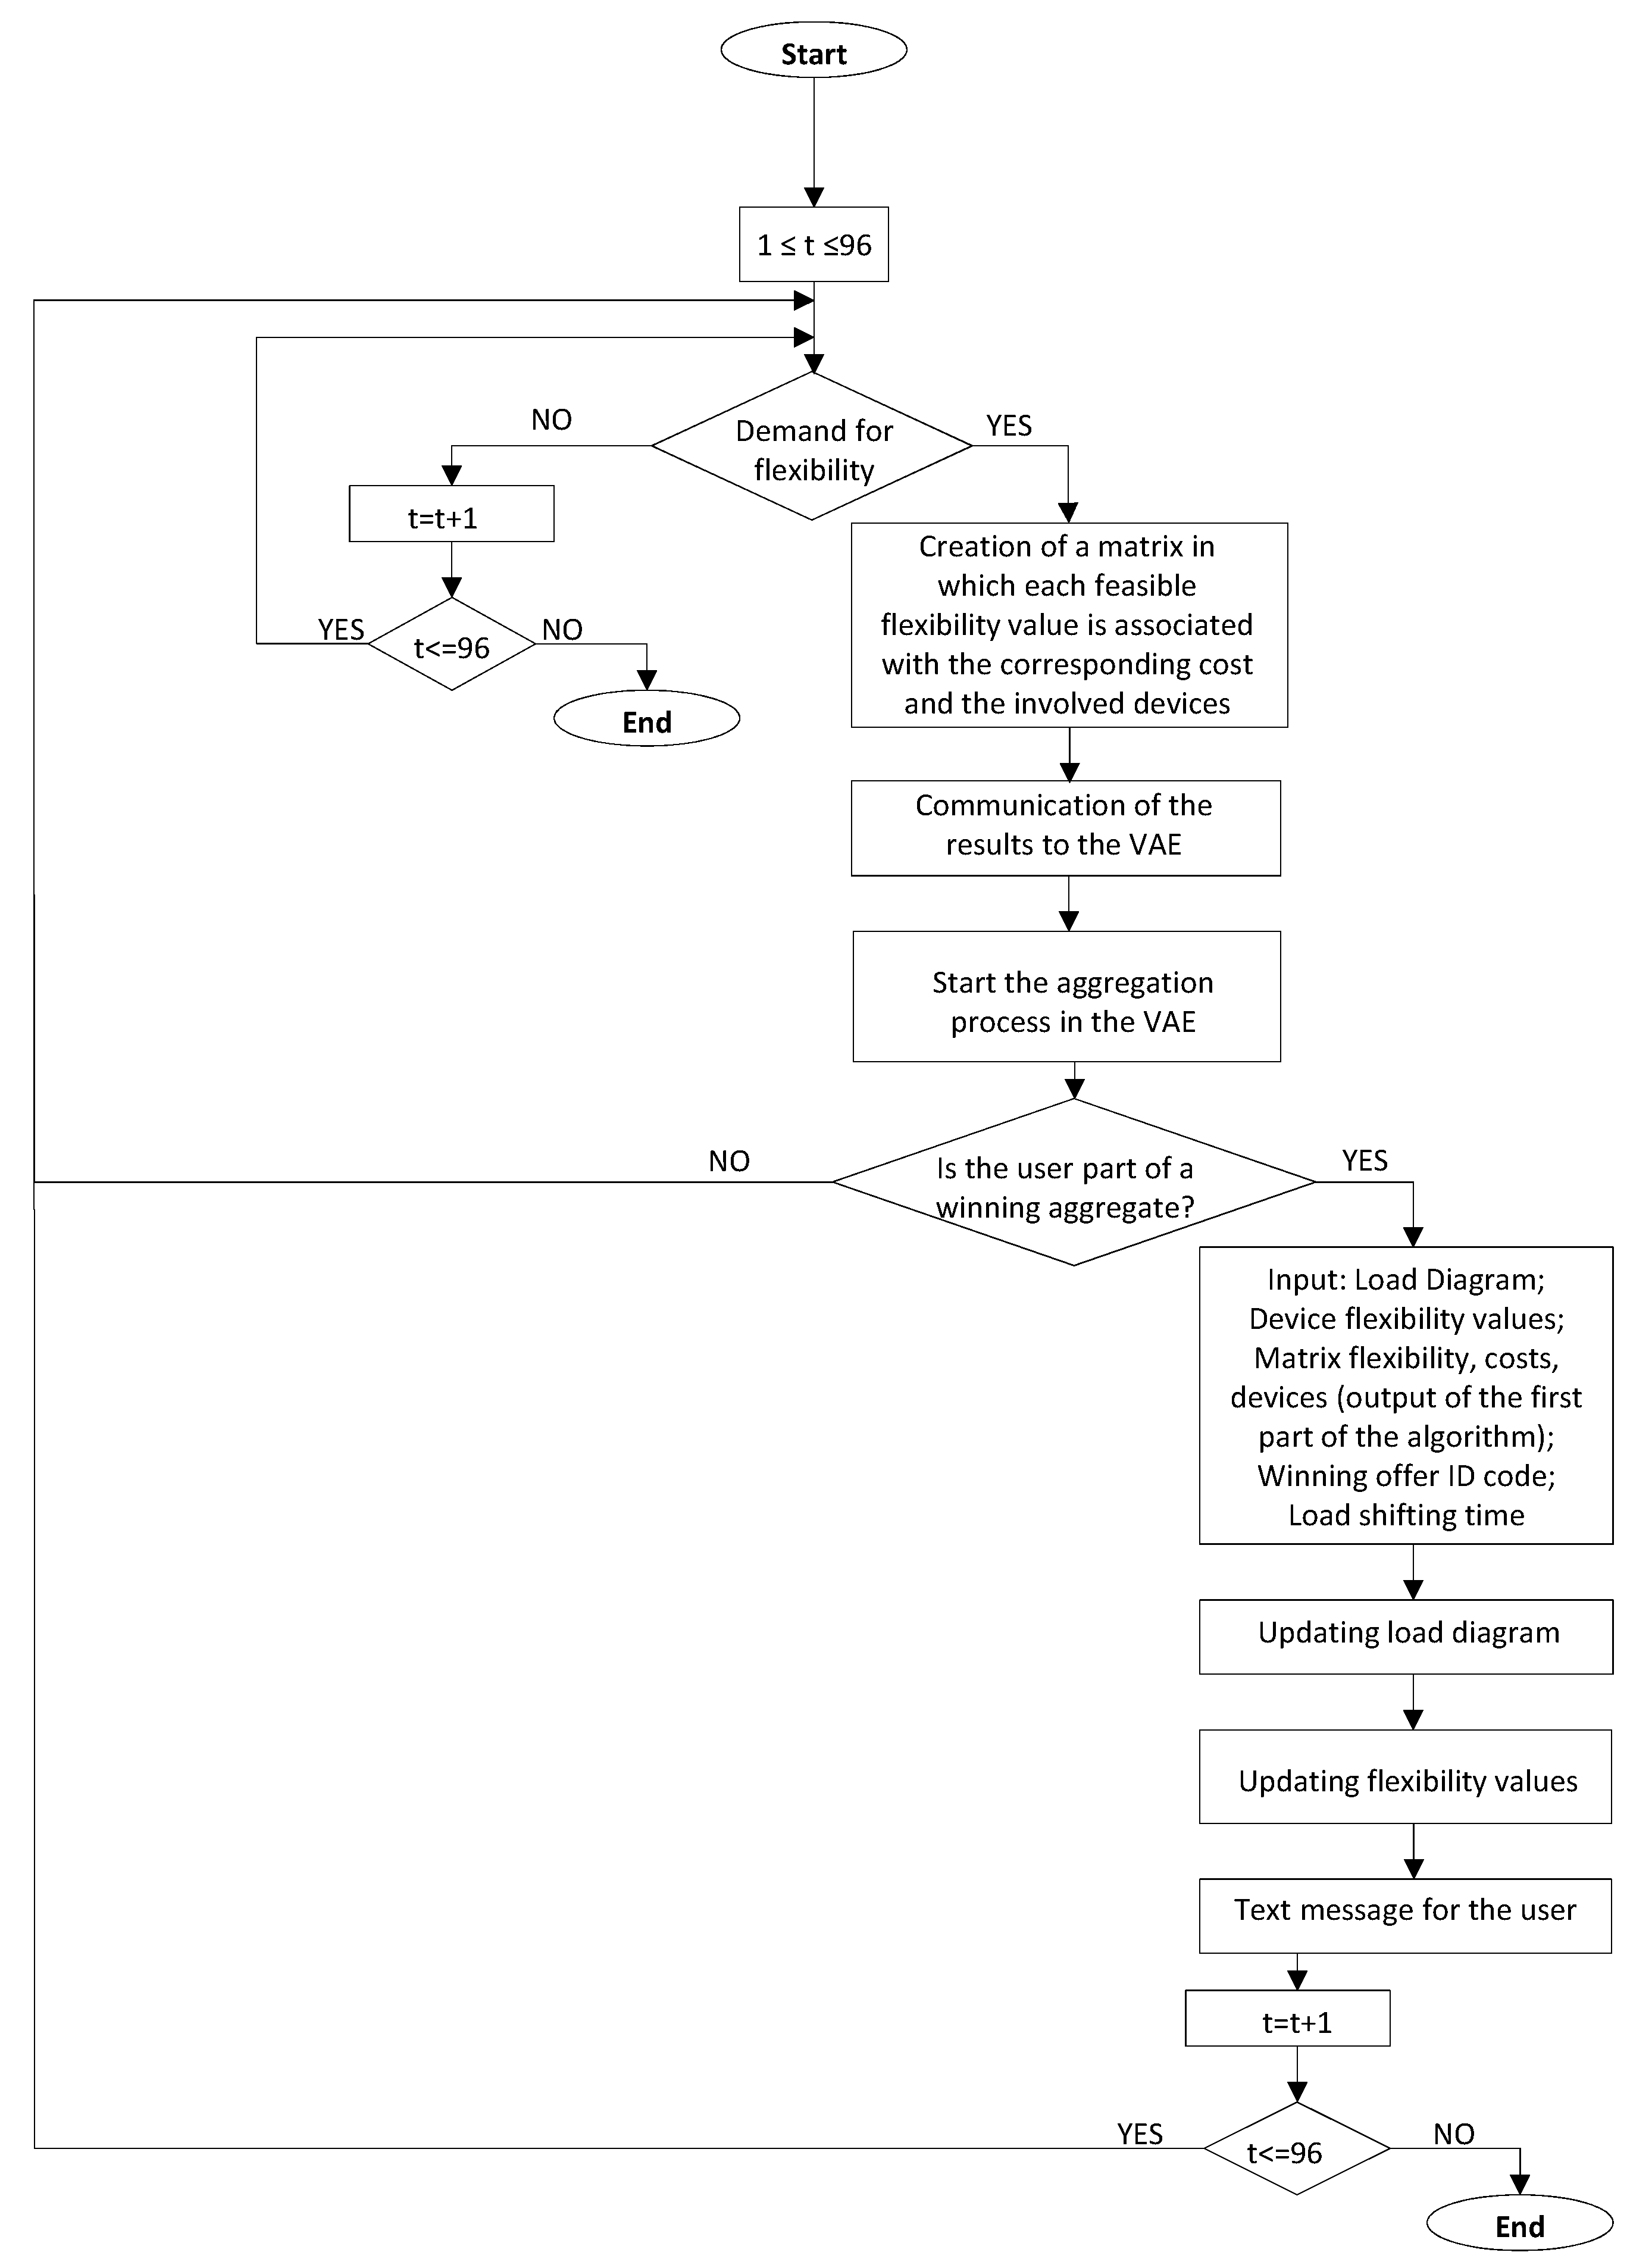
Phase 2 occurs only if the user becomes part of a winning aggregate and the VAE sends a signal to the EMS of the prosumer, after which the power profile and the flexibility values that the user can offer in the following hours of the day are updated. When the user is asked to change their power in a given time interval, they experience some discomfort, which they are willing to accept only if they receive adequate remuneration. In order to keep the discomfort hours within a limited time interval, keeping the energy consumption for the whole day unchanged, the use of a certain device has been moved to a different time interval than the one desired (load shifting). The load shifting instant can be communicated by the user during the configuration phase, while, in lack of sufficient information, it is assumed that the load shifting takes place at a random time of the day under consideration, or based on statistical data. Regarding the updating of flexibility values, the aim is to return to a power profile as close as possible to the desired profile in the shortest possible time, minimizing deviations from the expected profile from the moment when the user has provided flexibility. To achieve this target, an algorithm has been specifically designed primarily for application with a prevalence of residential prosumers, having the advantage of being less computationally expensive. The criterion on which this algorithm is based is to consider that each device can provide flexibility only once during the day, limiting the discomfort caused to the user, since providing flexibility always with the same device would prevent the user from using it for a long time. The update of the load diagram and of the flexibility values offered is followed by the second phase, which consists of the elaboration of a text message to be sent to the user warning if they will be part of a winning aggregate. The flowchart in Figure 2 illustrates the operations occurring during Phases 1 and 2 of the process described above, under the hypothesis of dividing a day into 96 time intervals, each lasting 15 min.
Figure 2.
DEMAND algorithm flowchart.
The algorithm for the bottom-up aggregation implements a mechanism based on the collaboration–competition between electricity prosumers which, interacting with each other, form aggregates able to formulate bids for meeting the request of power variation from the DSO. Each prosumer is associated with a reliability coefficient, i.e., a score taking into account all the times the prosumer has failed to meet their duty of flexibility provision and the times they have actually fulfilled their commitments.
The aggregation process relies on calculating several indicators to aid prosumers in the decision-making process.
- The first indicator, the power reduction coefficient , is the ratio between the power variation bid from a prosumer acting as the leader of an aggregate and the maximum technically feasible power variation of the aggregate.
- The second indicator, the minimum power contribution threshold , determines the minimum power variation a prosumer is willing to contribute. This indicator influences the minimum value of according to the following relation:
- The last indicator, the maximum waiting time , is the time a prosumer leader is willing to wait before considering another prosumer if a merging request is not accepted.
Bids are ordered based on their score, which considers factors like price and reliability. Reliability is determined by the reliability coefficients of all prosumers in an aggregate.
3. Methodology and Data
The methodology applied in this study is based on the following steps:
- The 24 h typical power profile and flexibility of prosumers is assessed;
- The DSO requests a modification of the power profile for the following day;
- Phase 1 starts and the optimization algorithm for evaluating the optimal bid of each prosumer is run;
- A given percentage of prosumers is assumed to be part of the winning aggregate;
- A load flow analysis is performed in NEPLAN 360 environment (V.10.9.8.4);
- Power losses, voltage drops, power peak and CO2 emissions are evaluated in the presence of aggregation and compared to their homologs before the aggregation in order to obtain numerical indicators of the DR action.
The adopted approach, based on power flow simulations with daily load steps, is commonly used in distribution network studies carried out by DSOs to assess the impact of emerging technologies, such as distributed generation and demand-side management, on their networks. Typically, DSOs evaluate network performance under worst-case scenarios or under the most probable operating conditions, calculating key performance indicators (KPIs) such as peak power, maximum voltage drop, and power losses.
This type of approach presents obvious limitations, such as the difficulty in quantifying how the uncertainty (variability) of electrical loads affects the calculation of the above-mentioned KPIs.
Nevertheless, for the purposes of this study—aimed at providing qualitative and quantitative insights into the network impacts resulting from the deployment of the DEMAND project technology—this approach offers DSOs information that is clear and straightforward to interpret.
3.1. Test Networks
For the present study, an LV and an MV test network were modeled and simulated in NEPLAN as a benchmark in order to perform simulations to assess the impact of the DEMAND project on the grid.
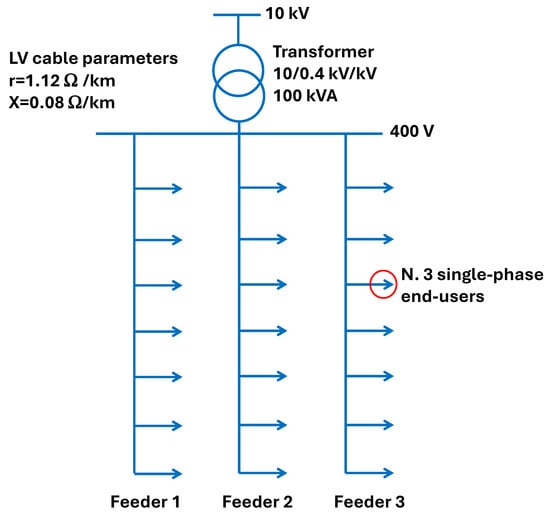
The LV test network (Figure 3) supplies 21 houses and originates from a 10/0.4 kV/kV substation.
Figure 3.
LV test network.
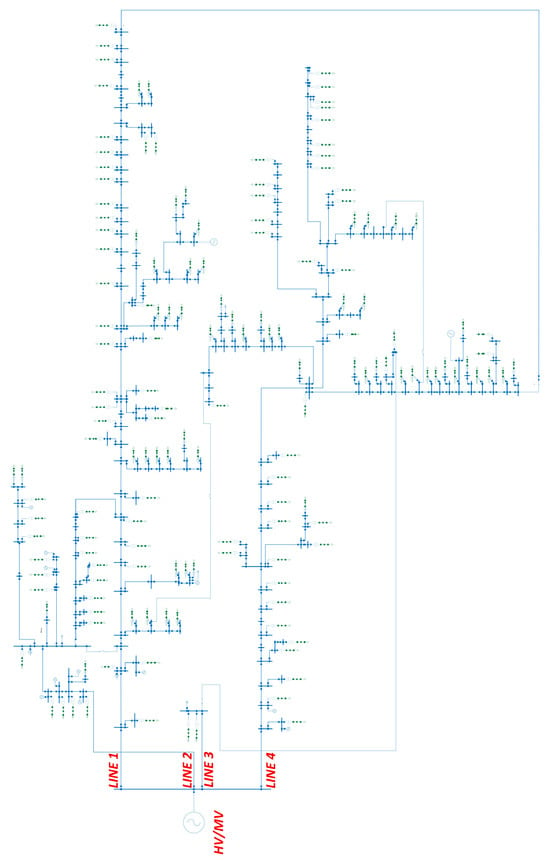
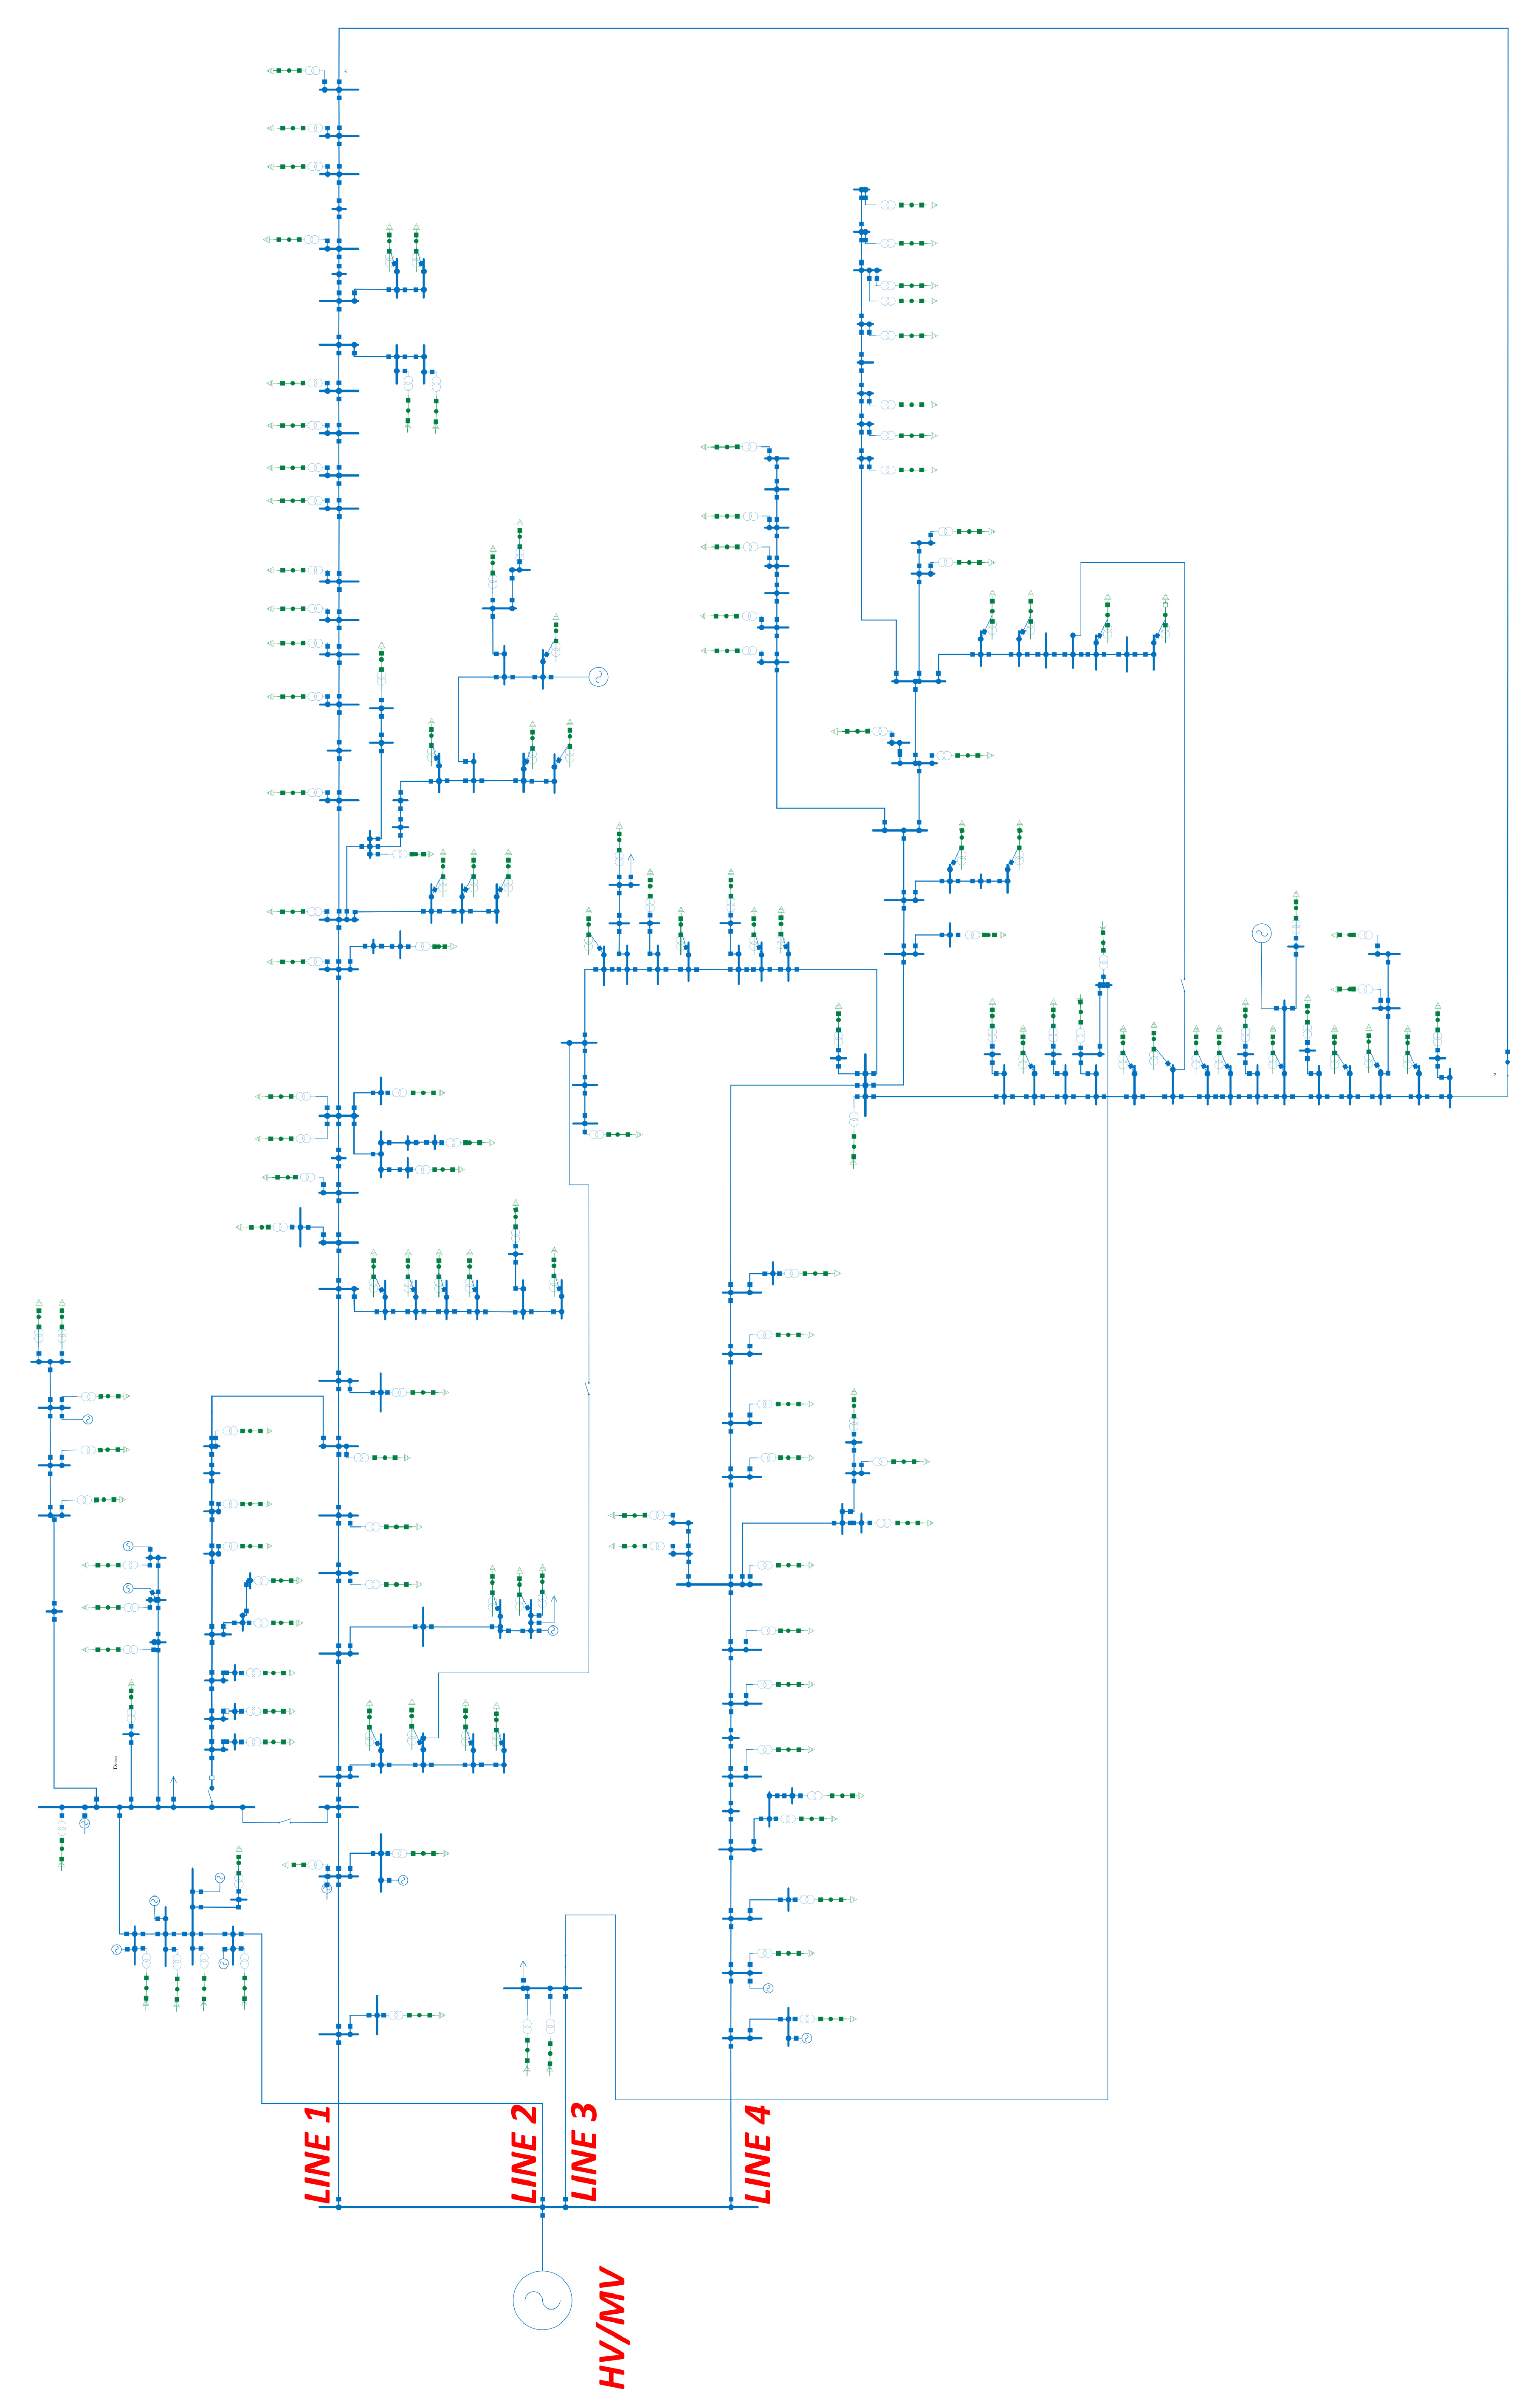
The MV network, shown in Figure 4, consists of a 150/10 kV/kV primary station that supplies four 10 kV lines. In the test network, there are 209 nodes: line 1 (L1) is a mixed aerial/cable line serving 66 MV/LV substations, lines 2 and 3 (L2 and L3) are cable lines serving 71 and 15 MV/LV substations respectively. Each substation can supply residential, industrial or tertiary-sector end-users. Line 4 (L4) is a cable line supplying two data centers. The network also includes two generators at nodes 129 and 169 with equal rated power, respectively, of 0.4 MVA and 2.78 MVA.
Figure 4.
MV test network.
The main features of the MV test network are reported in Table 1.
Table 1.
Data of the MV test network.
The adoption in simulation of two different network models is motivated by the need to represent operating conditions that, while both realistic, differ significantly in terms of network characteristics and operating behavior.
For this reason, the scenarios considered for the following two networks will be identical. They differ with respect to the type and magnitude of the loads, the load shifting strategies applied, and the assumed penetration levels of the DEMAND technology.
This distinction makes it possible to analyze the effects under conditions that are consistent with the typical operational features of LV and MV systems.
3.2. Power Profiles
The end-users’ power profiles have been obtained as a combination of both simulated and measured data from the four pilot sites where the energy gateway has been installed: a private house in Lavis, an assisted nursing home in Trento, the data center of Engineering S.p.a. in Pont-Saint-Martin, the production site of Cupersafety S.r.l. in Conversano.
3.2.1. Private House in Lavis
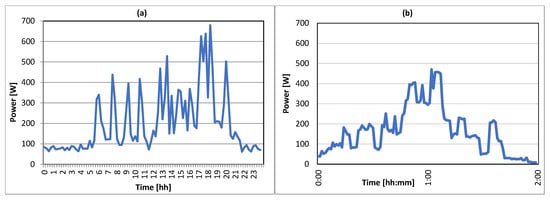
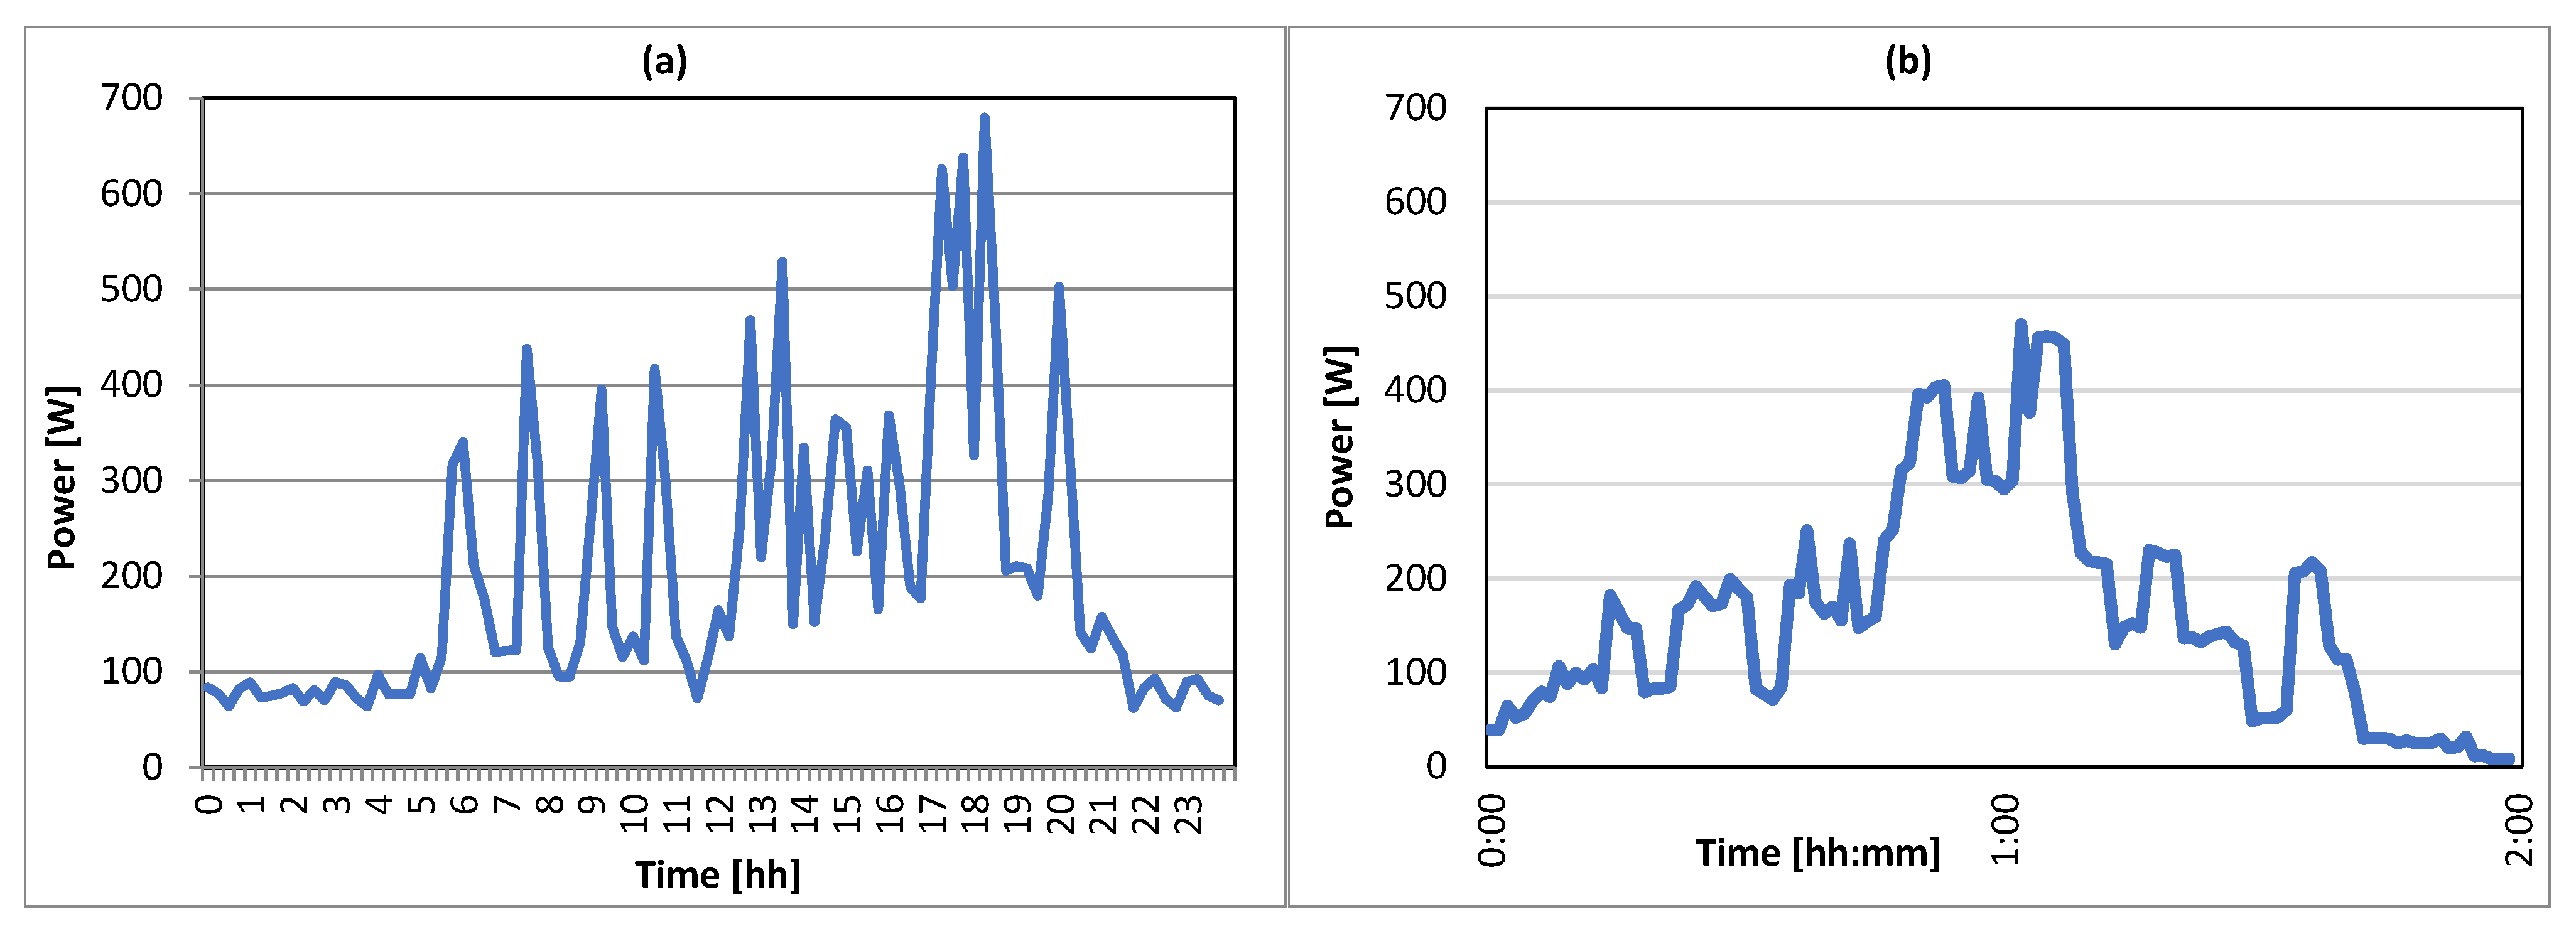
The energy gateway installed in the house can control, by choice of the dwellers, only the washing machine (WM), which, as a consequence, is the only flexible load of the pilot site. After a preliminary observation period, it has been concluded that the probability that the dwellers use the WM in a day is 56% (because it is used on 56% of the days in a month) and that it is usually activated at 5:00 a.m. in order to obtain a working cycle that starts and ends in the period of the day when the time-of-use price is lower and before the dwellers go working. Figure 5a shows the average daily load profile of the house and of the WM. The power profile in Figure 5b can be shifted during the day or to the day after to provide flexibility to the grid.
Figure 5.
(a) Daily average power profile of the test house; (b) average power profile the WM (working cycle 2 h).
3.2.2. Assisted Nursing Home in Trento
The second residential test pilot is an assisted nursing home in Trento able to satisfy the needs of about 70 users and equipped with a 5 kW photovoltaic system. The flexible load of the building is provided by the WMs and dryers installed in the laundry whose working cycle starts at 4:00 a.m. and ends at 12:00 p.m. All the devices can be stopped at any time and their operation can be shifted to the afternoon, considering the presence of the workers assigned to the laundry service. Figure 6a shows the daily power profile of the whole building and Figure 6b that of the laundry obtained as an average of the power profile measured for one month during an intermediate season.
Figure 6.
(a) Daily average power profile of the assisted nursing home; (b) average power profile of the laundry.
3.2.3. Tertiary-Sector End-User
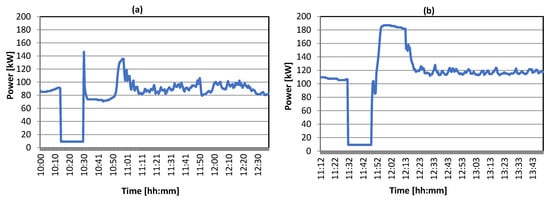
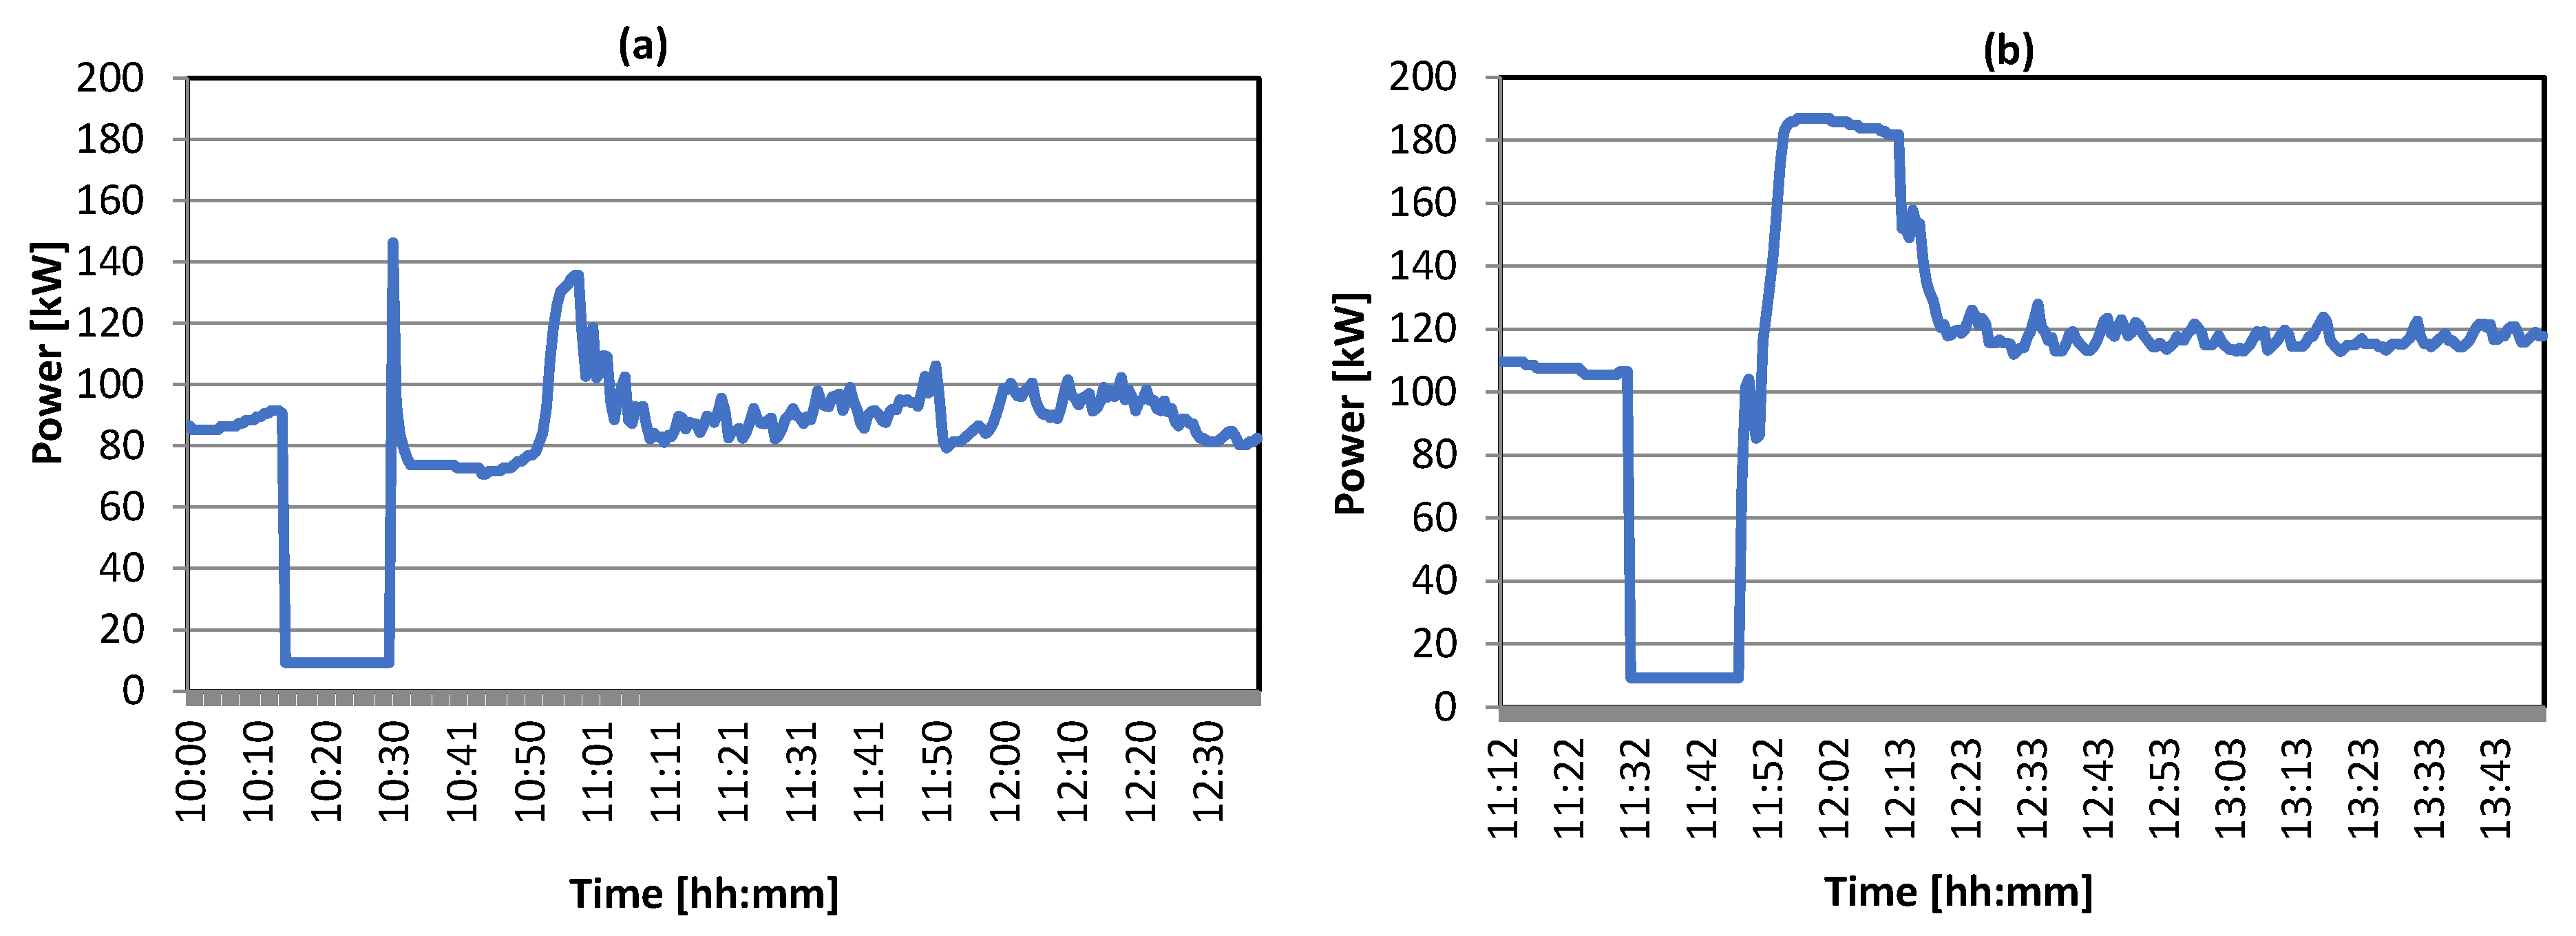
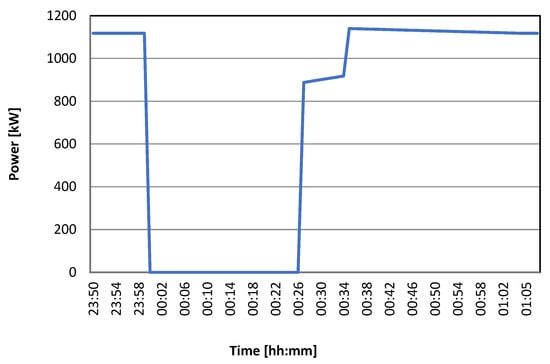
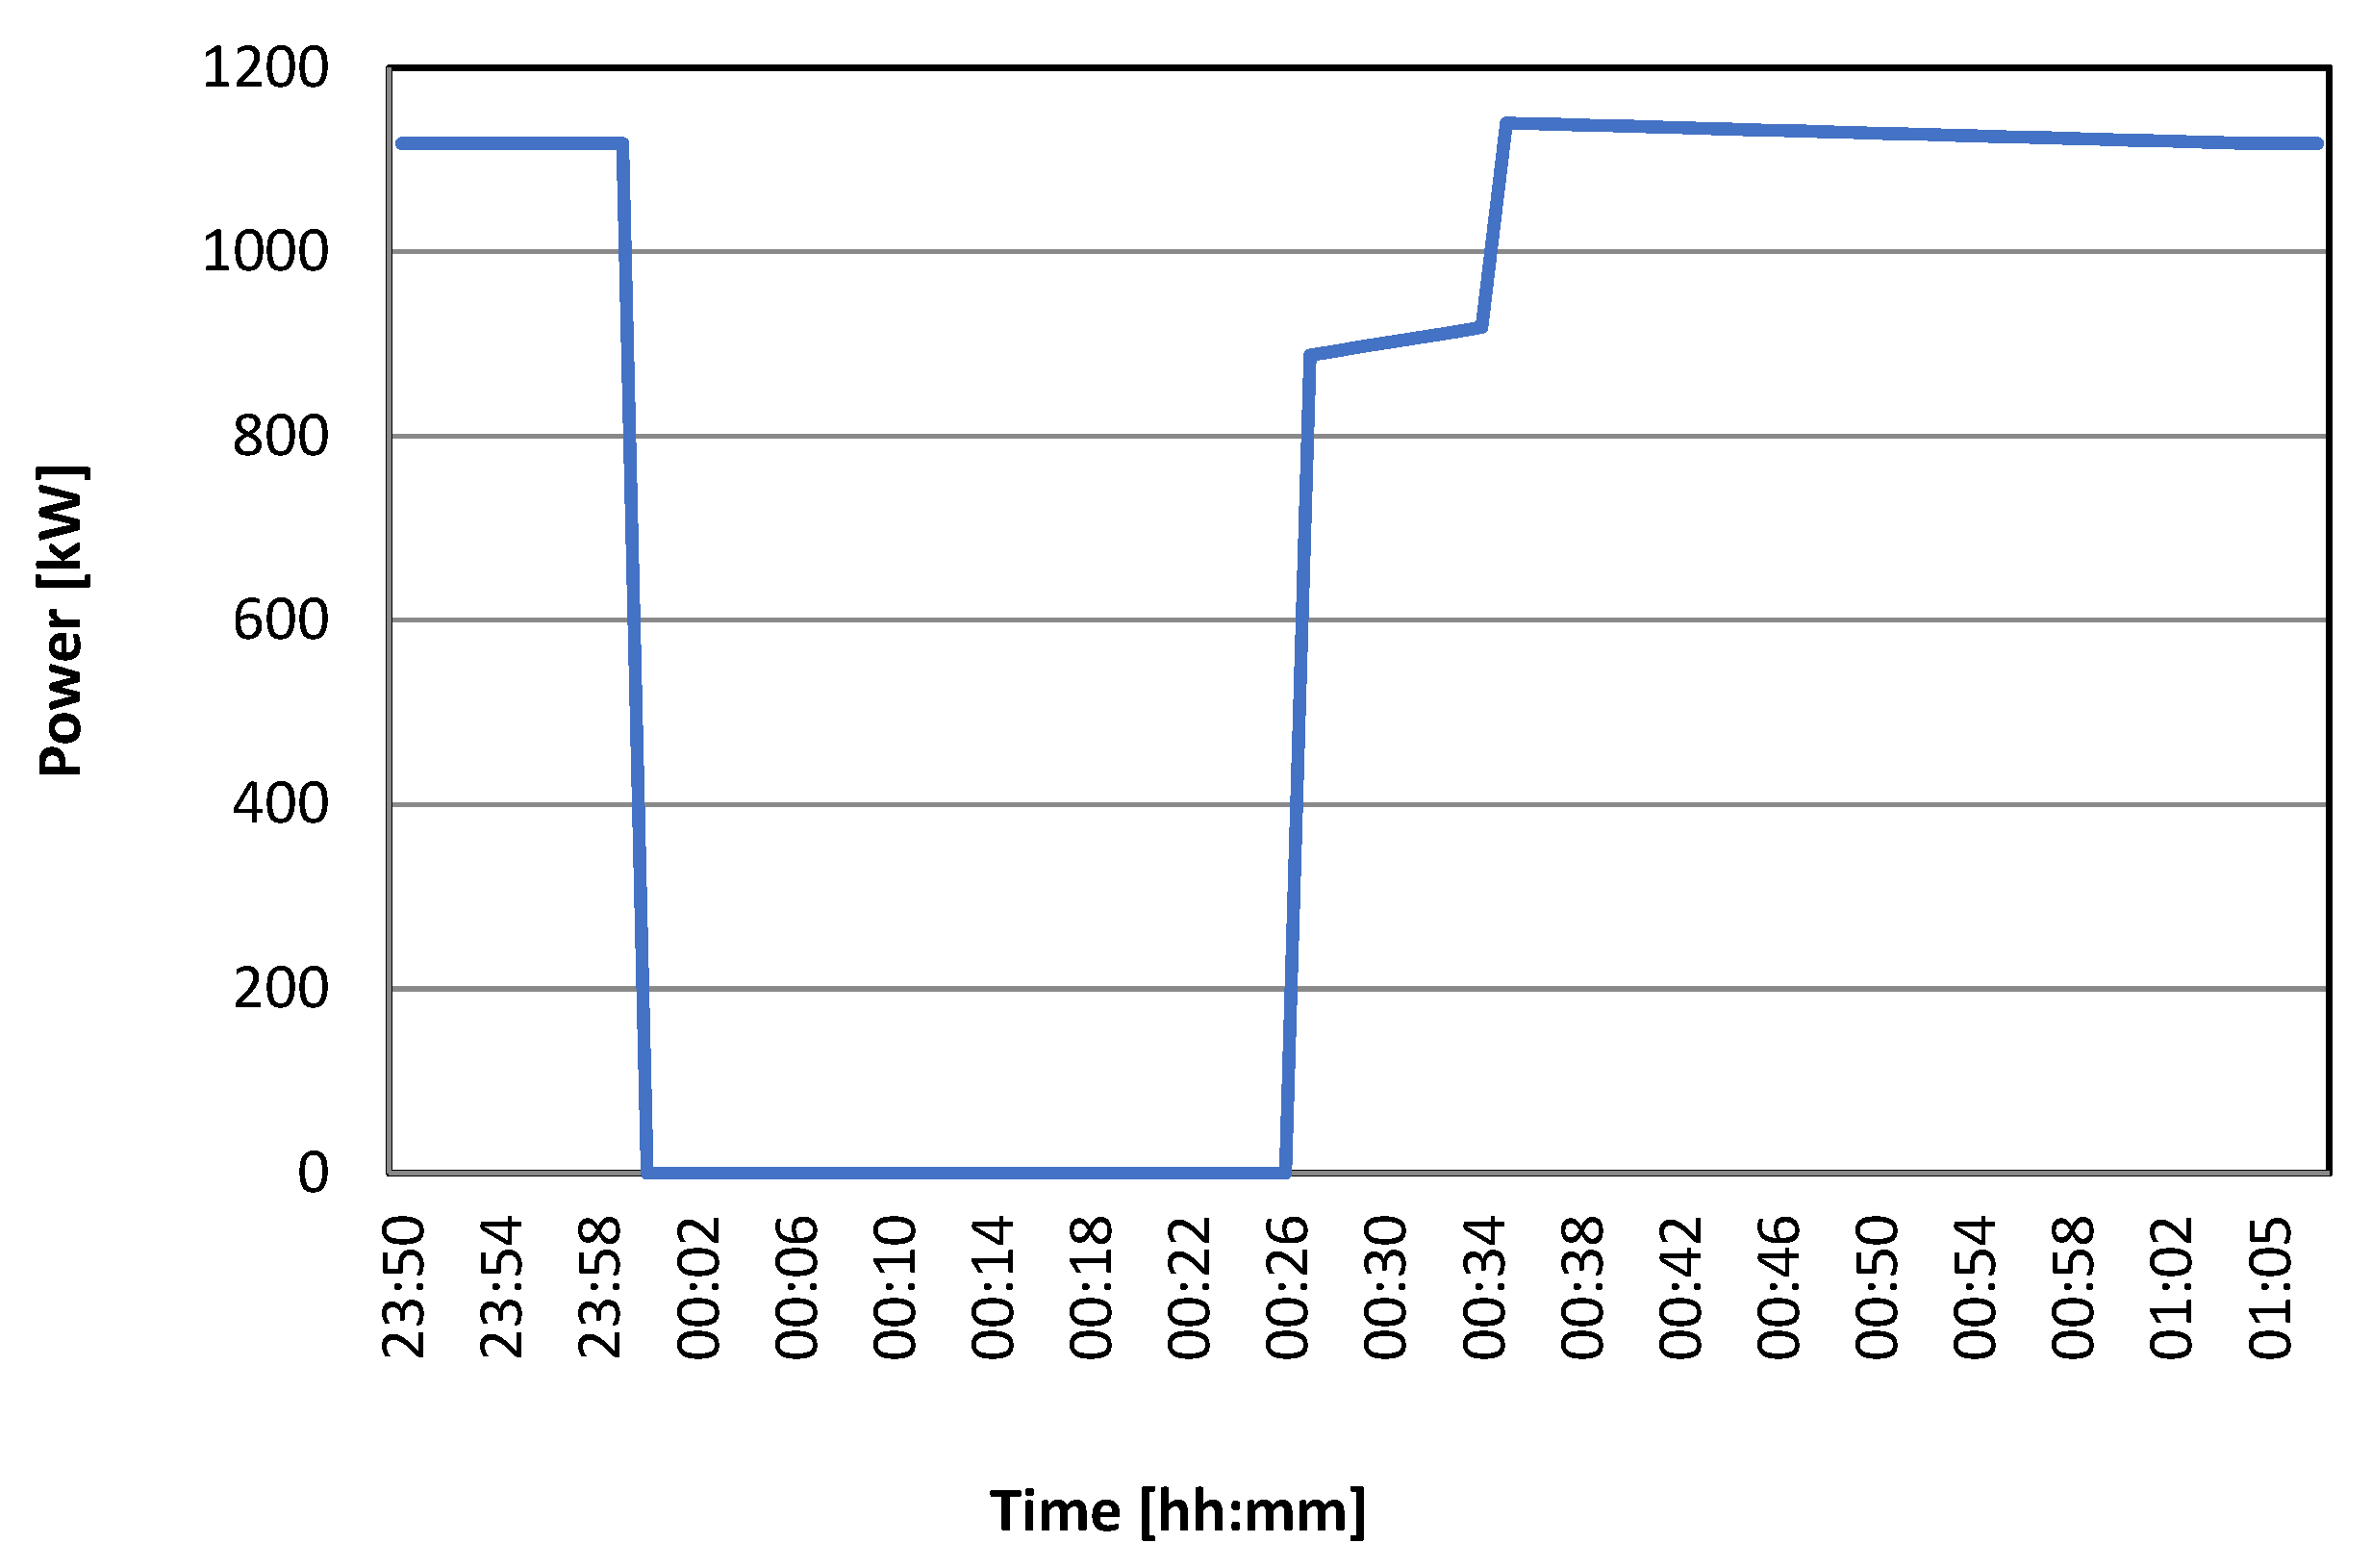
The data center is located in Pont-Saint Martin (Val D’Aosta, Italy). The pilot site is equipped with the latest generation geothermal cooling technology exploiting the water at 13 °C available in the underlying waterbed for the cooling system. In this way, electricity savings of 20% and an increase in the refrigerating capacity are obtained [38]. In this paper, we considered the power profiles experimentally measured during three test sessions. The data center comprises a cooling system consisting of three water-cooled refrigeration units, which allow the cooling of bunkers and, in the summer period, also of the office building. The cooling system has been identified as the flexible load of the pilot site. During a field test, two refrigeration groups were switched off at 10:15 a.m. and then switched on again at 10:30 a.m. when the bunker temperature rose above the maximum allowed working temperature of 21 °C. The same test was repeated the following July. In that case, refrigeration units 1 and 2 were switched off at 11:31 a.m. and then switched on again at 11:48 a.m. when the bunker temperature rose above 21 °C. Figure 7 shows the different behavior of the system in May (intermediate season) and July (Summer). The diagram demonstrates how switching off the refrigeration unit leads to almost the same power reduction in the two months. A last test was conducted at the Pont-Saint Martin data center on the night between the 14th and the 15th of June 2019. At midnight, the data center was disconnected for 25 min from the utility grid and supplied by its diesel emergency generators. The power consumption of the data center from 11:50 p.m. to 1:10 a.m. is shown in Figure 8. The figure shows that, using the diesel generators, the data center can provide a power reduction of 1150 kW to the grid to participate in the aggregation process.
Figure 7.
Power consumption of refrigeration unit 1 during the test carried out in May (a) and in July (b) 2019.
Figure 8.
Power profile of the data center during the test carried out in June 2019.
3.2.4. Industrial End-User
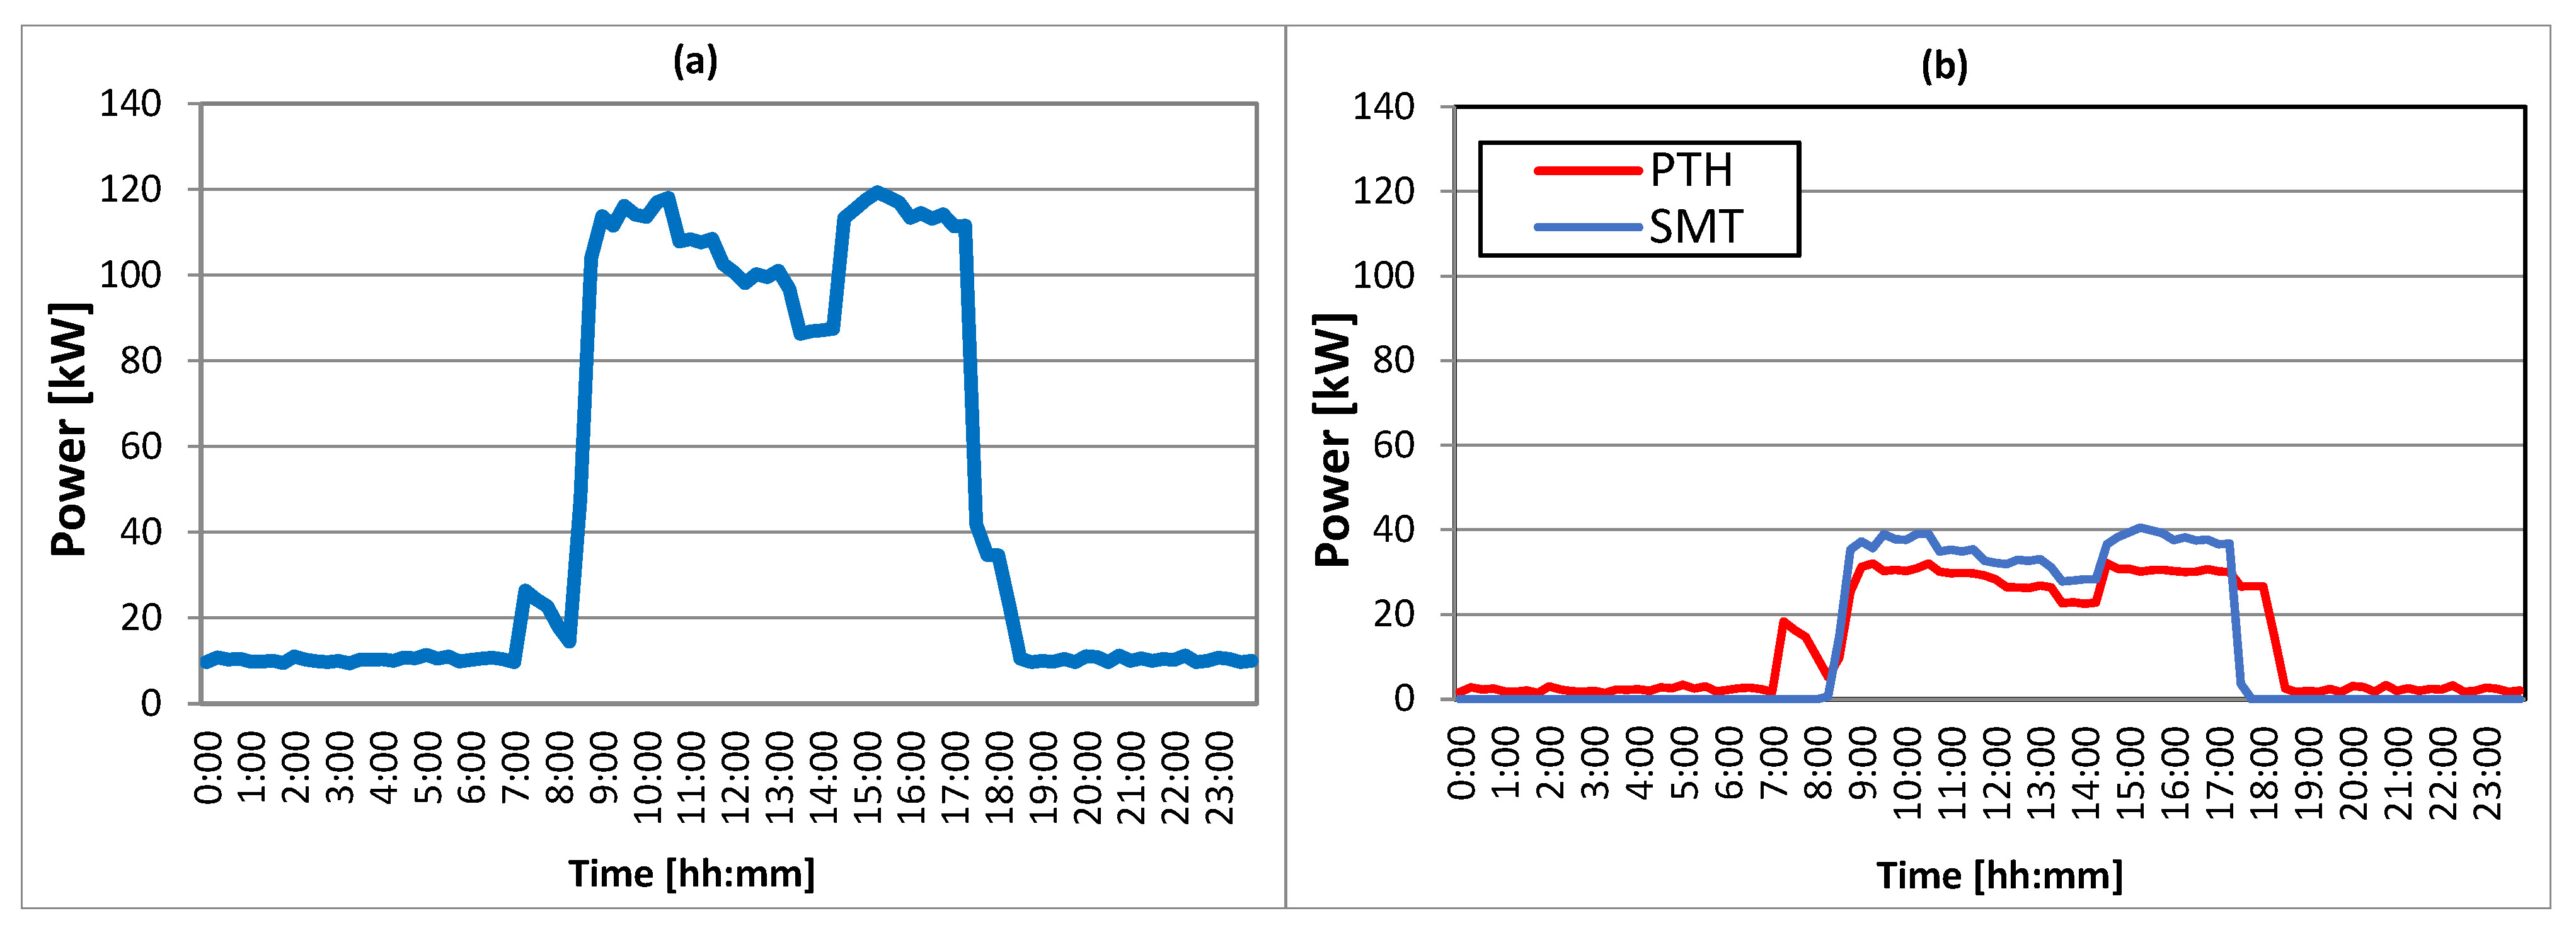
The industrial end-users have been characterized by using the electric power measurements from the Cupersafety production site in Conversano (Italy) where electronic boards and equipment are designed, produced and tested. Both the line producing pin-through-hole (PTH) and the two lines for surface mount technology (SMT) can be managed as flexible loads. Figure 9 represents the average daily load profile of the industrial site and of the PTH and SMT production lines acquired by field measurements.
Figure 9.
Average daily power profile of the industrial pilot site (a) and of the PTH and SMT production lines (b).
3.2.5. Simulated Small Residential End-User
In order to enrich the population of end-users supplied by the two test networks, the aggregated load curve of an apartment with a three-member family has been obtained by simulating the behavior of the latter using the Monte Carlo method described in [39,40], after having hypothesized all the installed loads considering the typical appliance equipment of an Italian flat.
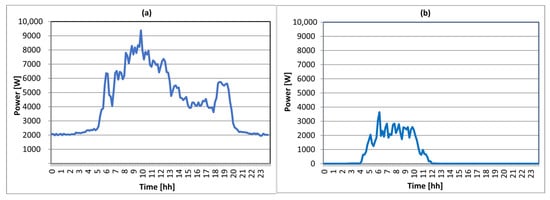
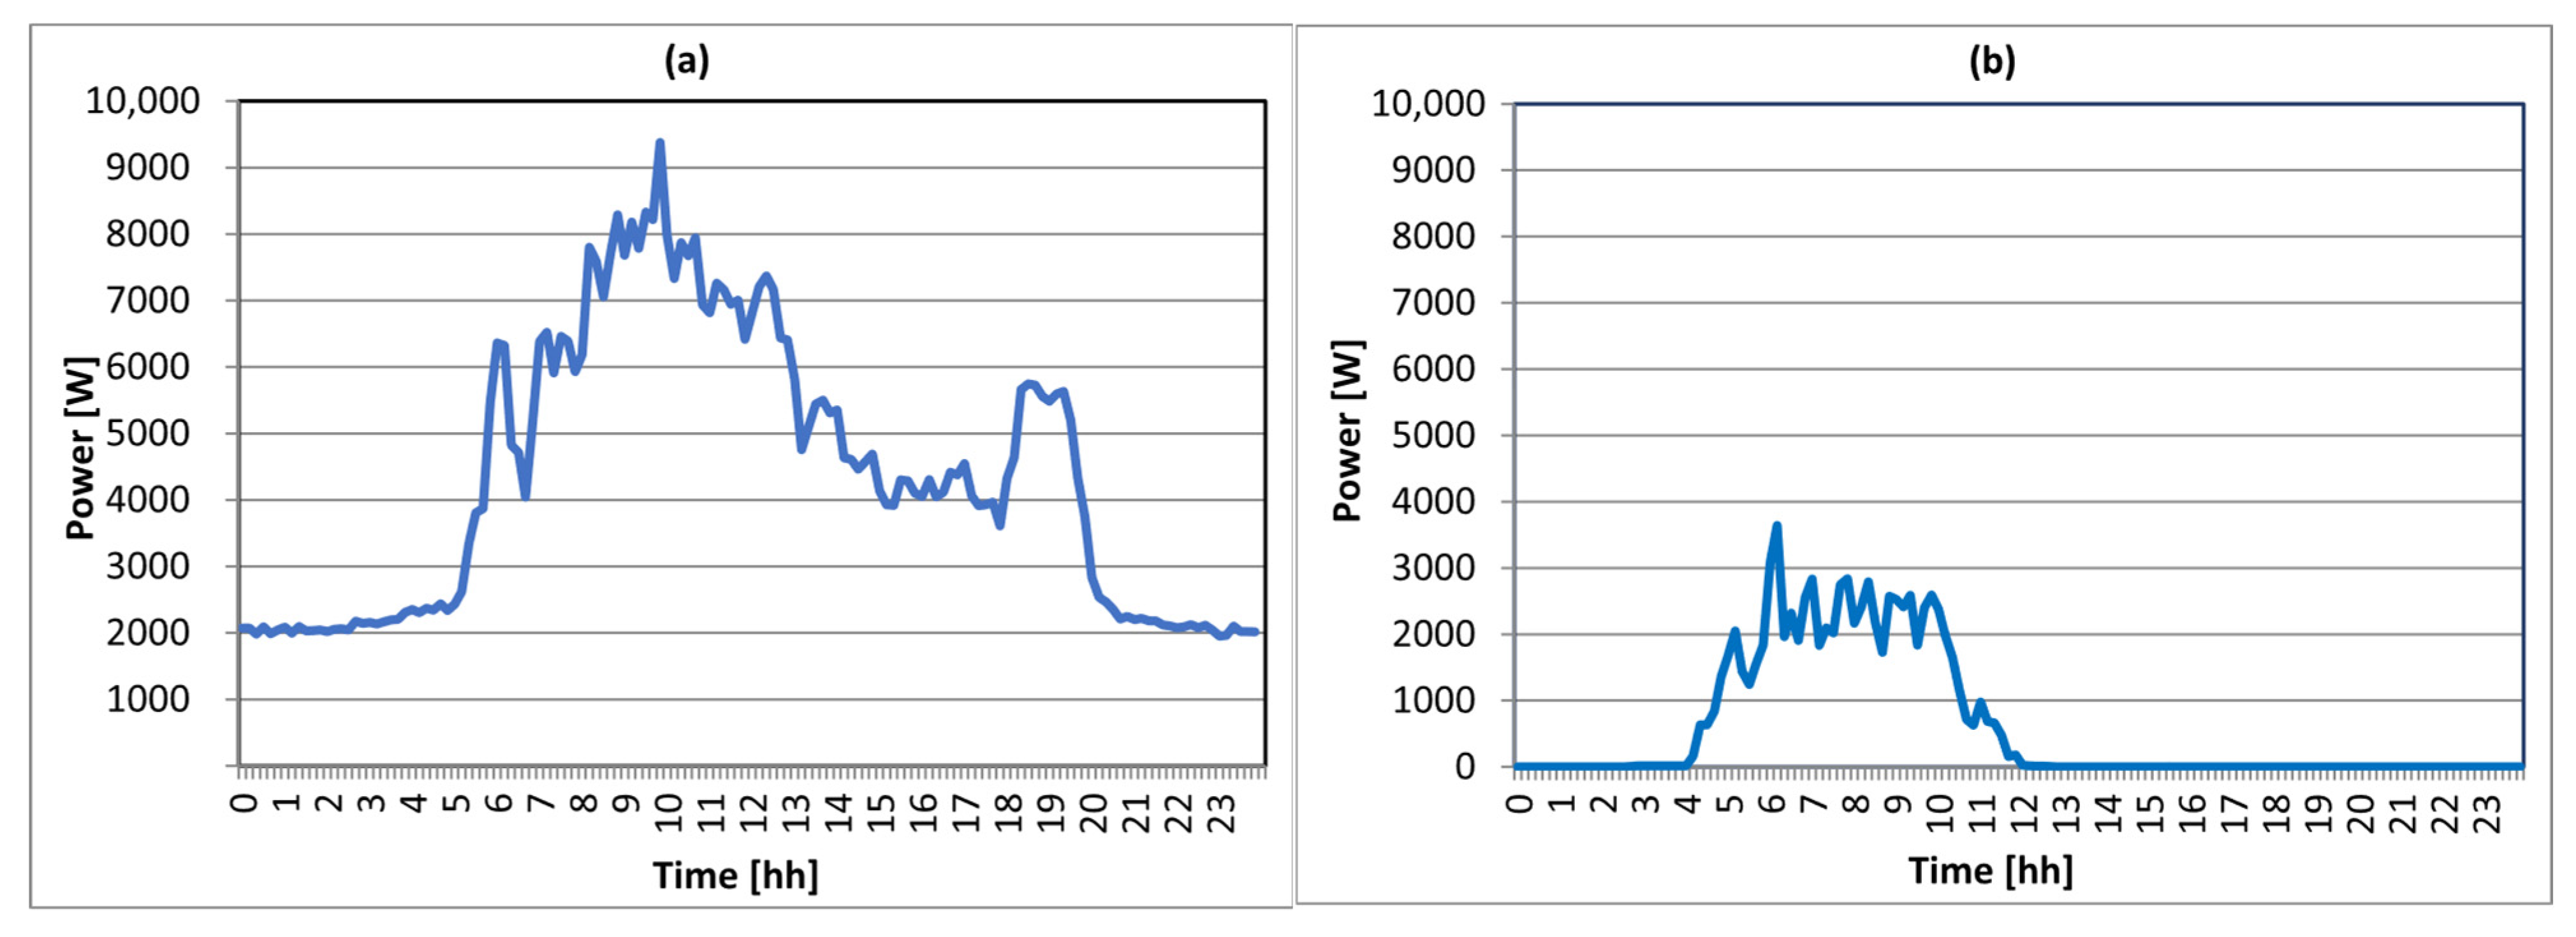
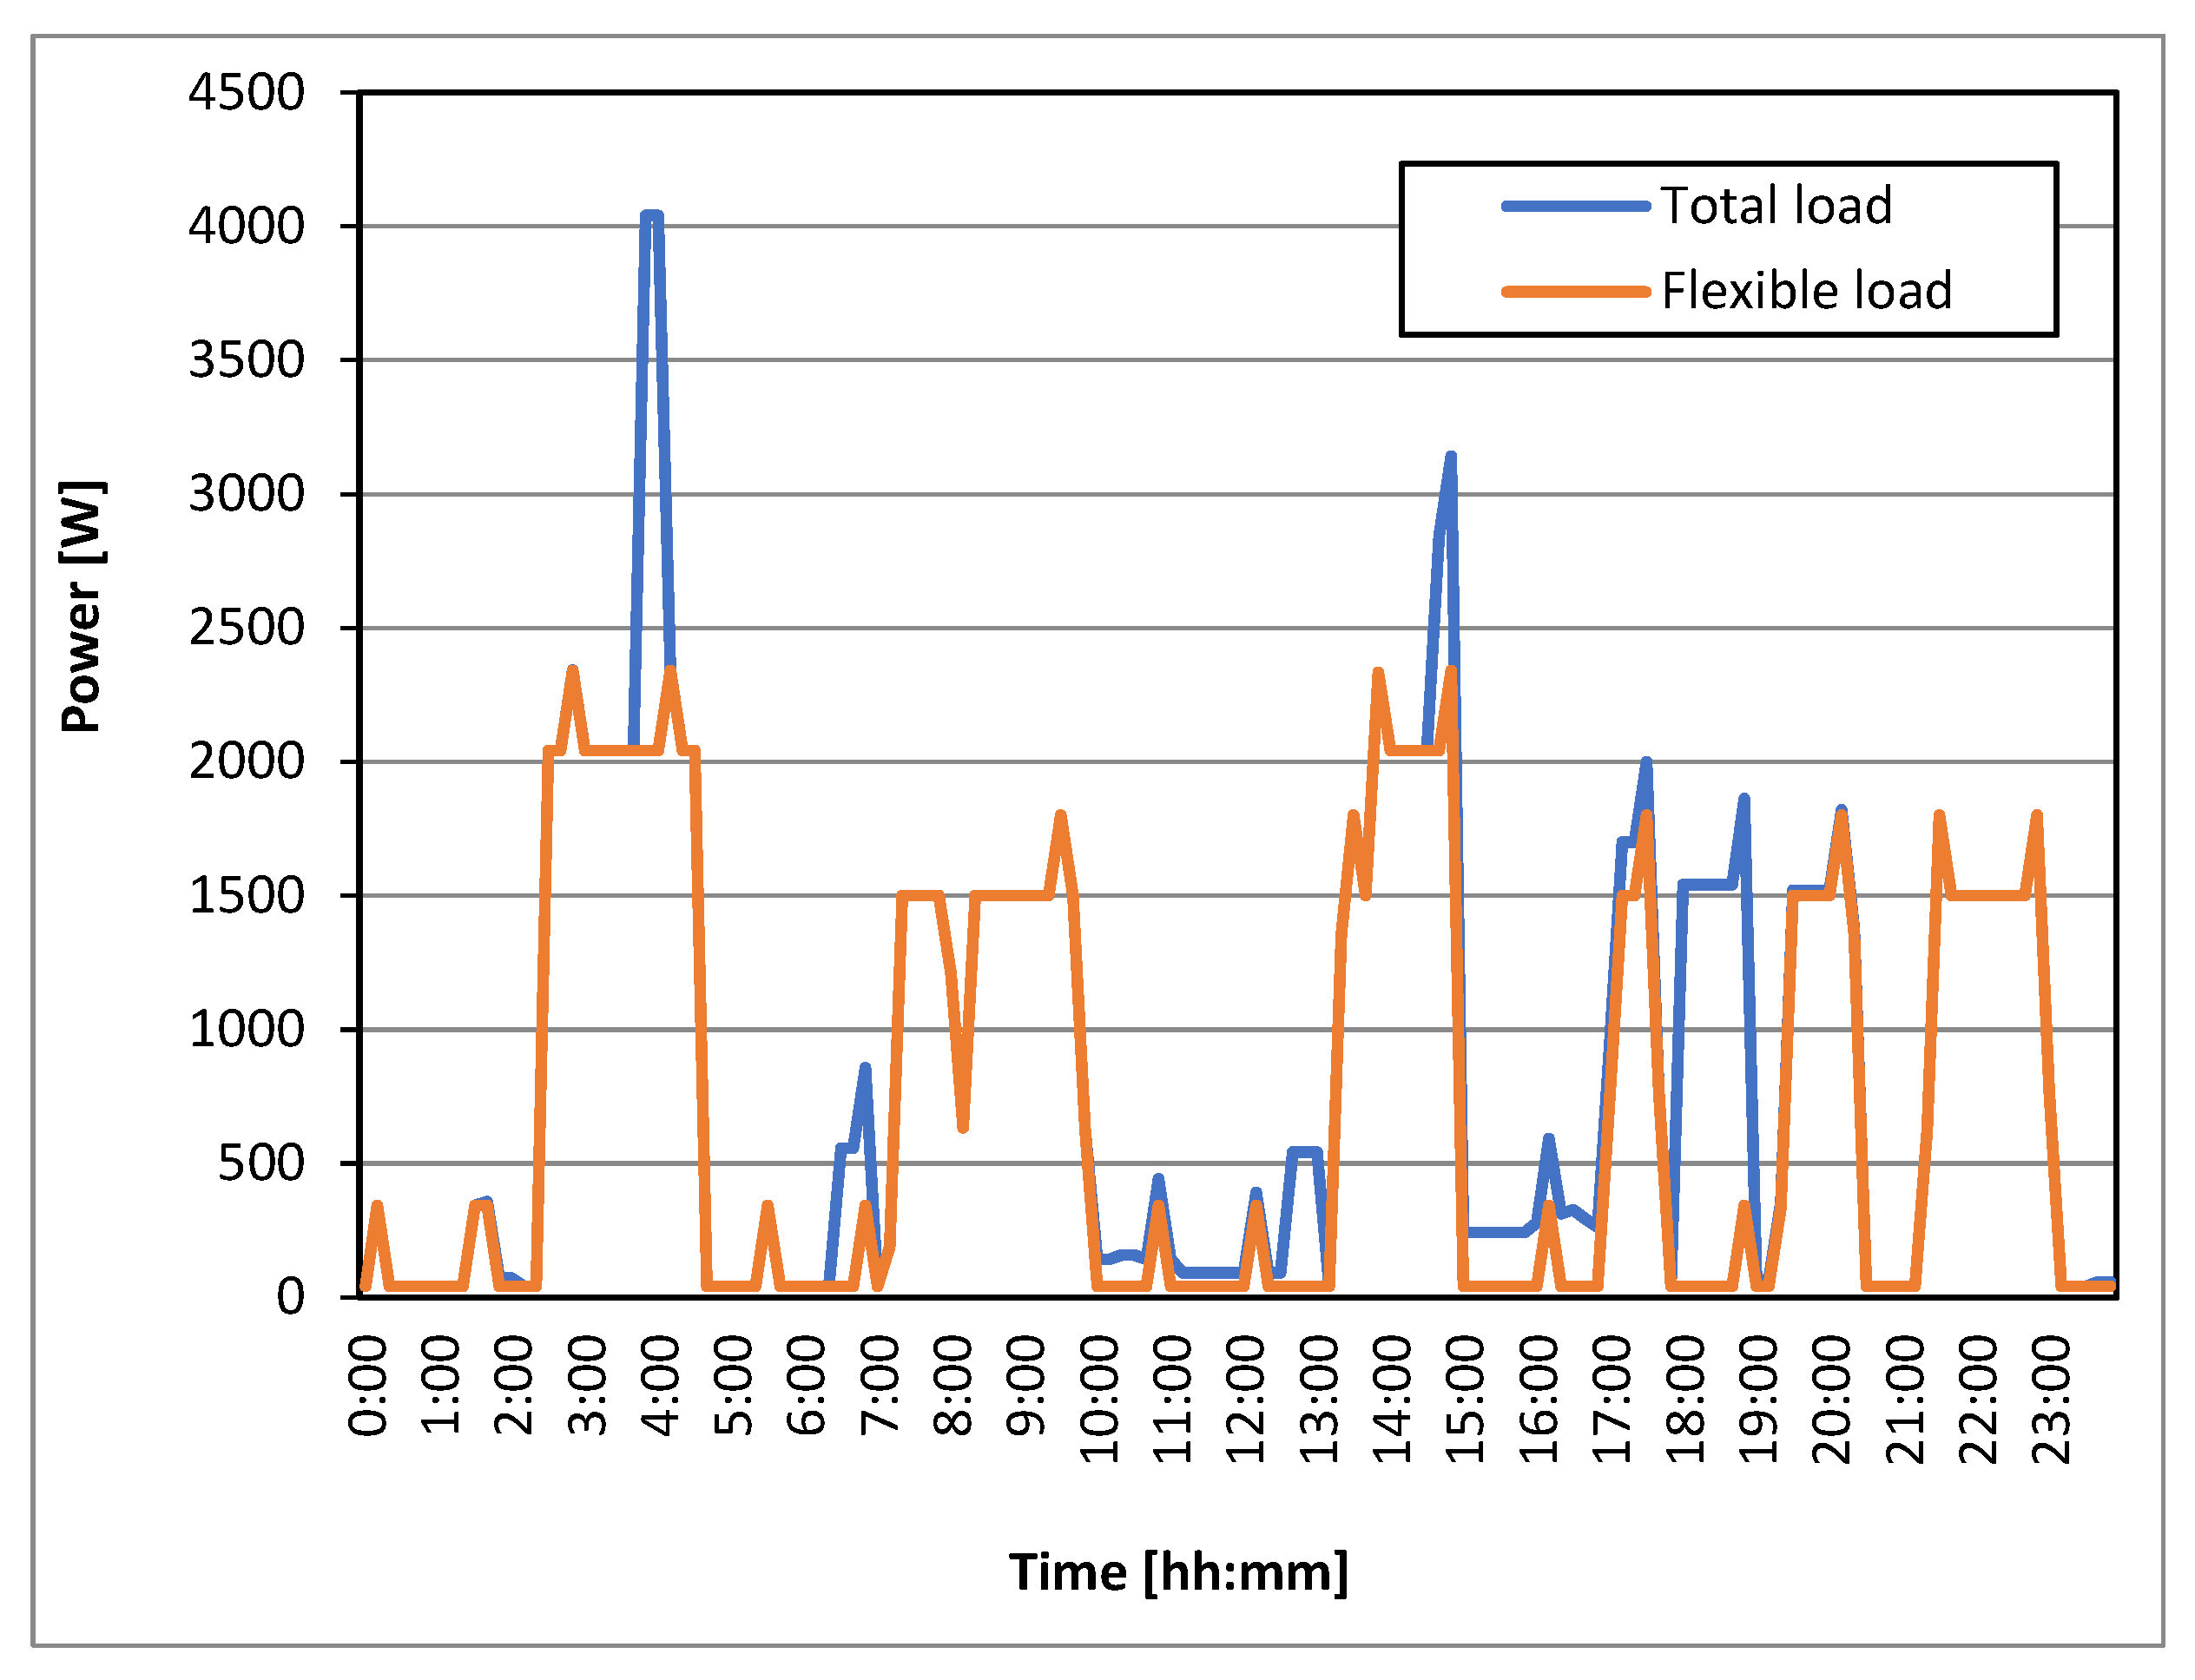
The flexible loads in the apartment are: electric storage water heater (ESWH), dishwasher (DW), washing machine (WM) and refrigerator, although other loads can be used for providing flexibility to the grid in a domestic application [41]. As an example, the electric oven, the microwave oven and the induction hob were not considered as controllable loads, as in the context of the project DEMAND it has been chosen not to include the loads used for food preparation among the flexible loads, for reasons related to excessive discomfort for the end-user. The ESWH and the refrigerator are modular loads, since it is possible to act on the set-point temperature to reduce their instantaneous power demand and daily consumption. DW and WM are instead interruptible and shiftable loads. It should be noted that interruptible loads, once stopped during normal operation, can be restarted by resuming the work cycle from the point where it was interrupted, but with additional energy consumption. For example, a DW that is interrupted during the rinsing phase, will resume operation by restarting this phase from the beginning. For the purposes of this study, it is assumed that interruptible loads can be interrupted and restarted according to an optimal management strategy that minimizes discomfort for the user and maximizes profit at the same time. The usage probabilities for the application of the Monte Carlo approach are those provided by CECED for Italian domestic appliances [42]. To simulate the behavior of the ESWH and of the refrigerator, the Monte Carlo approach is formulated as reported in ref. [43]. Figure 10 shows the daily power profiles of an apartment and of the flexible loads only, obtained using the Monte Carlo simulation.
Figure 10.
Daily load profiles of the apartment and of its flexible loads.
The Monte Carlo approach applied to the specific case for creating a dataset of 2000 daily load profiles shows that the apartments exhibit peak power values ranging from 2000 W to 5920 W, with a mean peak of approximately 2687.5 W and a standard deviation of 703.8 W, indicating a moderate level of variability among individual profiles.
The total daily energy consumption derived from the 2000 simulated profiles shows an average of approximately 7699.5 Wh, ranging from 3144.2 Wh to 13,277.5 Wh. The high standard deviation (2619.2 Wh) and the large distance between minimum and maximum values indicate a considerable heterogeneity in energy use among profiles. Although the 95% confidence interval for the mean (7584.7–7814.4 Wh) is relatively narrow, it reflects the precision of the mean estimate rather than a low variability in the data distribution.
4. Simulations
In order to determine the impacts of DR actions on the distribution grid in different scenarios, the following Key Performance Indicators (KPIs) have been evaluated: variation in power peaks, energy losses and voltage drop.
4.1. Case Study 1
The evaluation of the KPIs was first of all carried out in Scenario 0.1, assuming that there was no aggregation and that DR logics were not adopted and considering the LV network in Figure 3 with 63 residential end-users distributed equally across the three LV lines. All the end-users have been assumed with the characteristics described in Section 3.2.5.
In this scenario, the MV/LV transformer is charged to almost 70% of its rated power during the peak of the load demand, as shown in Figure 11; therefore, it is assumed that the DSO asks the VAE for a reduction in the peak during the night. Table 2 reports the technical parameters of the system in scenario 0.1.
Figure 11.
Daily load profiles of the MV/LV transformer in scenario 0.1.
Table 2.
Technical parameters of the system in scenario 0.1.
Four different scenarios were then examined:
Scenario 1.1: all 63 end-users of the test network participate in the aggregation process in two different time intervals of the day, at 03:50 a.m. and 2:30 p.m. on the basis of the DSO request, respectively through the use of the WM and DW. The use of the WM has been shifted to the valley period between 11:10 a.m. and 11:50 a.m., while the use of the DW has been shifted to the time interval between 8:30 p.m. and 8:50 p.m.
Scenario 2.1: only 33 end-users participate in the aggregation process at two different time intervals of the day, at 03:50 a.m. and 2:30 p.m., according to the DSO’s request, again through the use of the DW and WM as for Scenario 1.1.
Scenario 3.1: all the 63 end-users participate in the aggregation process and the DSO requests a reduction in the power peak at 03:50 a.m. The end-user can participate in the aggregation process by shifting in time the use of the WM between 11:10 a.m. and 11:50 a.m.
Scenario 4.1: 33 end-users participate in the aggregation process to provide the requested reduction in power at 03:50 a.m. using their WMs as for scenario 3.1.
The results of the simulations are presented in Figure 12 showing a significant reduction in the maximum power peak at the transformer, which corresponds to a significant reduction in the voltage drop in the supplied cable lines. What is less significant, however, is the reduction in energy losses in the distribution network. Table 3 summarizes the percentage reductions compared to scenario 0.1.
Figure 12.
Daily load profiles of the MV/LV transformer in scenarios 1.1–4.1.
Table 3.
Percentage reductions in the technical parameters compared to Scenario 0.1 in the LV test network.
4.2. Case Study 2
Considering the test LV network again, the second case study presents two lines supplying the end-users described in Section 3.2.5 (21 end-users per line) and one line supplying 18 end-users with the characteristics described in Section 3.2.1 (private house in Larvis) and one assisted nursing home with the daily load profile in Figure 7. The daily load profile in this scenario, named scenario 0.2, is represented in Figure 13, while power peak, power losses and voltage drop are reported in Table 4.
Figure 13.
Daily load profiles of the MV/LV transformer in scenario 0.2.
Table 4.
Technical parameters of the system in scenario 0.2.
In this case, it is assumed that the DSO asks the VAE to decrease the power peak occurring by night and, at the same time, to increase the power consumption in the period ranging from 9:00 a.m. to 1:00 p.m. in order to increase the load demand when the production from photovoltaic plants is higher.
Also, in this case, four different case studies were then examined:
Scenario 1.2: all 63 end-users of the test network participate in the aggregation process. All domestic end-users of lines 1 to 3 shift their flexible load from the night to another time interval in the period with the maximum production from photovoltaics. The assisted nursing home shifts the beginning of the working period of the laundry from 4:00 a.m. to 8:00 a.m.
Scenario 2.2: like in Scenario 1.2 but without the participation of the assisted nursing home.
Scenario 3.2: only 30 domestic end-users and the assisted nursing home participate in the aggregation process and flexible loads are managed as described for Scenario 1.2.
Scenario 4.2: like in Scenario 3.2 but without the participation of the assisted nursing home.
The results of the simulations are presented through the MV/LV transformer load in Figure 14. The trends in Figure 14 show that, after the application of DR logics in the different scenarios, there is a less evident reduction in the night power peak at the transformer (in the range of 14.75–25.72%, lower than in Case Study 1). The increase in energy consumption at the same time as the photovoltaic generation is in the range of 12.68–29.40%.
Figure 14.
Daily load profiles of the MV/LV transformer in scenarios 1.2–4.2.
Table 5 summarizes the potential reductions, in percentage terms, of the maximum power peak, the energy losses in the network and, finally, the maximum voltage drop compared to scenario 0.2 and the increase in energy demand between 9:00 a.m. and 1:00 p.m.
Table 5.
Percentage variations in the technical parameters compared to Scenario 0.2 in the LV test network.
4.3. Case Study 3
The third case study considers the impact of DR on the MV network. First of all, the MV network is simulated in the absence of aggregation and without the application of DR logic, thus defining scenario 0.3, taken as reference for the evaluation of subsequent scenarios. In scenario 0.3, the test network is characterized by the technical parameters reported in Table 6.
Table 6.
Technical parameters of the system in scenario 0.3.
The MV test network consists of 154 loads, of which 152 represent aggregates of residential end-users, with the characteristics defined in Section 3.2.5, and the remaining represent the tertiary-sector and the industrial end-users described in the previous Section 3. Four scenarios are examined:
Scenario 1.3: the data center provides flexibility by modulating the operation of the air conditioning systems from 03:50 a.m. to 04:10 a.m., simulating separately the real data of the tests carried out in May and July by Engineering on the Pont-Saint-Martin data center.
Scenario 2.3: only 50% of the residential users of the MV network provide flexibility in a single interval of the day. In this case, the industrial and the tertiary-sector end-users do not take part in the aggregation process.
Scenario 3.3: flexibility is provided both by the data center and the industrial end-users, and by 50% of the residential end-users.
Scenario 4.3: the data center provides flexibility through disconnection from the distribution network from 03:50 a.m. to 04:20 a.m., using the real data of the test carried out in June by Engineering on the Pont-Saint-Martin data center; 50% of residential users in the MV network provide flexibility in the same time interval.
Table 7 shows the reductions in percentage terms of the maximum peak power and energy losses in the grid, obtained in the different scenarios defined for the MV test network compared to scenario 0.3. Being the voltage drop in scenario 0.3 very far from its admittable value, the voltage drop reduction in the other Scenarios are not reported.
Table 7.
Percentage reductions in the technical parameters in the different scenarios of the MV test network compared to scenario 0.3.
4.4. Case Study 4
The last case study considers the MV network again but with a different population of end-users assumed according to the Annual Relation of the Italian Authority for Energy, Grids and the Environment [44].
The relation reports that the number of PODs of the Italian LV and MV grids is currently 37 million distributed among 29.5 million domestic end-users and 7.3 million other users (residential not-domestic, industrial and tertiary sector end-users). Concerning the electricity consumption, about 35% is due to industrial end-users, 44% is due to residential end-users and 21% is due to the other end-users (excluded the transportation sector). Starting from these data and assuming the consumption reported in Section 2 for each type of end-user, in this case study the distribution of end-users in Table 8 has been imposed. The distribution in the table approximates the official data on electricity consumption and the number of users quite well, even considering that such data refer to an annual reference horizon while, at this stage, we are only analyzing a typical day.
Table 8.
End-user distribution in the network.
In the absence of aggregation and without the application of DR logic, scenario 0.4, taken as reference for the evaluation of subsequent scenarios, is assessed. In this scenario, the test network is characterized by the technical parameters reported in Table 9.
Table 9.
Technical parameters of the system in scenario 0.4.
Scenario 0.4 is characterized by a concentration of energy consumption between 7:00 a.m. and 8:00 p.m.; therefore, the following scenarios are defined:
Scenario 1.4: 50% of residential end-users and the data center use their flexibility to reduce the night-time power peak. The residential end-users shift the use of their WMs to a different time after 10:00 a.m. so as to concentrate the electricity demand in the period characterized by the maximum PV production. The data center modulates the consumption of its air-conditioning system while the other end-users cannot take part in the aggregation process because their flexible loads are only active during day-time;
Scenario 2.4: like in Scenario 1.4 but without the participation of the data center;
Scenario 3.4: it is supposed that the DSO requests the reduction in the power peak between 8:30 a.m. and 10:00 a.m. to increase the energy consumption in the immediately following time period characterized by higher PV production. The DR action involves only 50% of the large residential end-users, that participate shifting the load due to the laundry, and 50% of the tertiary sector end-users, that modulate the consumption of their air-conditioning systems;
Scenario 4.4: 50% of the simulated residential end-users, 25% of the industrial end-users and the data center use their flexibility to reduce the power peak at 2:45 p.m. The residential end-users shift the use of their dishwashers, the industrial end-users shift the use of the machinery of one production line and the data center uses its diesel generator to disconnect from the grid.
Scenario 5.4: like in Scenario 4.4 but without the participation of the data center;
Table 10 shows the reductions in percentage terms of the maximum peak power and energy losses in the grid and the increase in energy consumption between 10:00 a.m. and 6:00 p.m. (average time period of PV production), obtained in the different scenarios defined for the MV test network compared to scenario 0.4.
Table 10.
Percentage variations in the technical parameters in the different scenarios of the MV test network compared to scenario 0.4.
In Scenario 1.4, the night-time peak power is reduced from 12.23 MW to 9.91 MW considering the data center behaves like in May and to 9.88 MW considering the data center behaving like in July. Scenario 2.4 is quite similar to Scenario 1.4 with a night-time peak power reduced to 9.98 MW without the contribution of the data center. In Scenario 3.4 the day-time peak power decreases from 21.75 MW to 20.94 MW. Simulating this scenario, it was assumed that the electric load due to the air-conditioning systems of the tertiary sector end-users was 30% of the total load.
Scenario 4.4 shows a good reduction in the peak power from 22.7 MW to 20.75 MW. This is achieved thanks to DaCe’s contribution of just over 1 MW. In fact, Scenario 5.4, completely identical to the previous one except for DaCe’s participation in the aggregation, shows a reduction in the peak to 21.87 MW. As far as losses are concerned, it can be seen that in Scenarios 1.4 and 2.4 the reduction in daily energy losses is negative. This implies that there is an increase in grid losses, albeit modest. The shift in part of the consumption between 10:00 and 18:00 is also modest in scenarios 1.4 to 3.4 and even negative in scenarios 4.4 and 5.4. Table 11 shows a summary of the changes in losses and energy in the maximum PV production range compared to scenario 0.4 for scenarios 1.4–3.4.
Table 11.
Changes in energy losses and energy in the maximum photovoltaic production range in absolute terms.
5. Sustainability Impact Evaluation
The use of DR can contribute to sustainability fostering the reduction of CO2 emissions through peak shaving, valley filling or load shifting actions in general. Assuming to carry out a load shifting action in order to increase the load in a time interval when photovoltaic systems produce more energy than that required by loads, it is possible to exploit the power produced in excess to supply the flexible devices. In this way, a double effect is obtained: avoiding the curtailment of photovoltaic generation in correspondence to the hours of maximum production reducing CO2 emissions with respect to the original situation where flexible devices are supplied by traditional power plants.
In the various case studies, a request from the DSO to reduce the consumption in one time interval of the day was hypothesized. In all the case studies, it was assumed that the flexible loads activated for accomplishing to the DSO’s request were shifted from the night to a different time interval in the morning. To provide an estimation of the CO2 emission reduction due to the load shifting action, it was assumed that during the night the loads were supplied only by traditional power plants, while in the new usage time interval, they were powered by photovoltaics systems.
Therefore, for calculating the reduction in CO2 emission, the amount of energy shifted Eshift is multiplied for the average CO2 emission factor EF that would have been considered in the calculation of the CO2 emission before the DR action, as shown in the following formula:
The proposed approach is simplified, as an accurate assessment of emission reductions would require precise knowledge of the actual national generation mix for the specific day on which the load shifting action is requested and for the exact time interval in which it occurs. However, the proposed calculation is commonly adopted in the literature to estimate the potential reduction in emissions.
CO2 emissions before and after the load shifting action are evaluated considering the average CO2 emission factors provided by ISPRA for Italy in 2023 [45] and reported in Table 12.
Table 12.
Average CO2 emission factors for Italy in 2023.
The power required to operate the washing machine would be supplied by natural gas-fired power stations, except in the case of the small island not supplied by the national electricity grid. For the small island, it was assumed that the power in this time interval would be supplied by non-cogenerative diesel-fired power stations. Assuming that photovoltaic curtailment is carried out, it is possible to exploit the power produced by the photovoltaic systems to allow the washing machine to operate from 11:10 a.m. to 11:50 a.m., with a consequent reduction in CO2 emissions.
Considering the emission factors for natural gas-fired power plants and non-cogenerative diesel power plants, the daily reductions in CO2 emissions, shown in Table 13, have been obtained.
Table 13.
Estimated CO2 emissions reduction.
6. Practical Implementation Aspects
The approach proposed by DEMAND raises practical implementation issues that are discussed in more detail below.
6.1. Compliance with Current Regulation on DR
One of the main obstacles to P2P aggregation models, such as the bottom-up model proposed by DEMAND, is the current Italian regulation on demand response (DR) and aggregators [46,47]. The resolutions of the Authority for Energy, Networks, and the Environment (ARERA), as well as the technical specifications of the Italian TSO Terna SpA—which over the years has proposed several pilot projects for the aggregated use of distributed flexibility—set stringent requirements regarding response times, compliance with the DSO’s requests, and the presence of a third party acting as a balancing service provider. Therefore, the first hurdle to overcome for the actual implementation of DEMAND is the acceptance within current regulations of an aggregation model without an aggregator. This can only happen if the effectiveness and reliability of the bottom-up aggregation model can be demonstrated to be at least equal to that of the traditional model.
6.2. Communication Latency
To ensure that the system is competitive and can be implemented in compliance with Italian regulations, the response time for load shifting via the VAE must not exceed 15 min. If the system is used to participate in the balancing market, individual users must send monitoring data to the DSO within 4 s, as specified by Terna SpA. This requirement may be difficult to meet with standard metering and monitoring equipment at user sites, and using a dedicated monitoring peripheral unit—typically employed by aggregators—for every single user participating in the DEMAND program would be excessively costly.
6.3. Cybersecurity Issues
Cybersecurity plays a fundamental role in ensuring the stability and reliability of modern smart grids within DR frameworks. As these programs progressively depend on bidirectional communication, Internet of Things (IoT) devices, and aggregators to manage and balance energy consumption, they inherently broaden the cyber-attack surface. This increased exposure introduces vulnerabilities that may result in severe consequences, including large-scale power outages, economic losses, and damage to electrical infrastructure [48]. However, the DEMAND system relies on real-time readings of end-user power consumption/production via electricity meters installed by the DSO itself, which utilize security protocols to ensure the reliability of the public metering service. However, given the absence of an aggregator, the DSO should take responsibility for implementing additional security measures (such as anti-attack secure distributed systems [49] or similar) to ensure greater protection against cyberattacks.
7. Conclusions
This article shows how consumers can contribute to make electrical systems more flexible and sustainable by changing the way they consume energy—by shifting the load and reducing energy demand. To do this, it has been seen that the use of smart technologies and the adoption of energy efficiency measures by consumers are necessary. From a technical point of view, a significant reduction in peak and voltage drop has been achieved, particularly for scenarios concerning the LV test network where the adoption of DEMAND technology by 100% of users has been assumed. For the MV test network scenarios, a significant reduction in the maximum voltage drop was also achieved, but less significant than for the LV network, since only 50% of users were assumed to participate in the DEMAND program. Regarding the reduction in overall energy losses, it can be argued that there was a greater reduction in the LV test network than in the MV network. It was noted, particularly in the LV test network, that although in some scenarios there was a significant reduction in peak and voltage drop, the reduction in losses was smaller than in other scenarios where DEMAND technology penetration was lower. Analyzing the results of the simulations, it was noted that this is linked to the fact that, by solving the technical problem relating to the peak, due to the shifting of the electrical load at different times of the day (rebound effect), it is not possible to obtain the maximum reduction in losses, thus causing a loss of system efficiency. Indeed, due to the temporal shifting of part of the electrical demand to different hours of the day, the overall Joule losses in the network’s cables can increase. In fact, cable losses are proportional to the square of the current flowing through the conductors. When demand is redistributed across different hours, the current profile changes over time. Even if the total daily energy consumption remains the same, the resulting current levels during multiple periods may increase the cumulative sum of the power loss terms. Therefore, shifting part of the electrical load to different hours may increase the total Joule losses in the network, since the quadratic dependence on current causes the aggregated loss term to grow when currents are redistributed over time.
In addition, the assessment of environmental impacts shows that the use of more flexible measures also makes it possible to encourage the use of renewable energy sources and avoid the curtailment of photovoltaic generation at peak production times, improving sustainability.
It should be emphasized that, although KPI values have been calculated for different scenarios and for both networks, these values should not be interpreted as a reference for an absolute quantification of the benefits of the proposed technology. Indeed, the calculation results strongly depend on the initial load profile (baseline) as well as on the type and proportion of users participating in the DR action. Moreover, the followed approach, based on the analysis of a typical day with a deterministic load flow calculation, does not allow us to assess the real impact of the application of the DEMAND approach over a long period (for example one year). Nevertheless, it must be noted that DR actions solicited from the DSO for solving network issues are not daily operations and, as a consequence, this approach can be considered a valid method for offering DSOs information that is clear and straightforward to interpret.
However, it should be highlighted that the flexibility of the electricity system is a complex problem that affects many different disciplines. It is complicated, in fact, to encourage consumers to provide flexibility and in order to do it so that several aspects must be taken into account, not only in engineering and information technology, but also in marketing, economics, anthropology and psychology. It can be concluded that, on the one hand, consumers need to understand that such more-flexible measures can provide future generations with a safe, reliable and affordable electricity system. On the other hand, it is also necessary for those involved in the design of electricity systems to take into account the wishes and needs of consumers and society today and in the future. This is the only way to make the transition from a technology-centered electrical system to a user-centered electrical system.
In a future work, to complete the assessment of the impacts of the DEMAND project, a study on the Italian balancing market will be presented, showing how the same technology can generate different profits for users depending on the market zone in which it is deployed.
Author Contributions
Conceptualization, M.G.I. and G.Z.; methodology, S.F., M.G.I. and G.Z.; software, G.M., L.M. and G.Z.; validation, S.F., G.M., and L.M.; formal analysis, M.G.I., G.M., L.M. and G.Z.; data curation, L.M. and G.Z.; writing—original draft preparation, S.F., M.G.I., G.M., L.M. and G.Z. supervision, S.F., and M.G.I.; project administration, M.G.I.; funding acquisition, M.G.I. All authors have read and agreed to the published version of the manuscript.
Funding
This research was funded by the National Research Project DEMAND (DistributEd MANagemen logics and Devices for electricity savings in active users installations) supported by the Italian Ministry for the Economic Development MISE—identification code: CCSEB_00093.
Institutional Review Board Statement
Not applicable.
Informed Consent Statement
Not applicable.
Data Availability Statement
The original contrbutions presented in this study are included in the article.
Conflicts of Interest
The authors declare no conflicts of interest.
References
- Kuznetsova, E.; Anjos, M.F. Challenges in energy policies for the economic integration of prosumers in electric energy systems: A critical survey with a focus on Ontario (Canada). Energy Policy 2020, 142, 111429. [Google Scholar] [CrossRef] [Scilit]
- Aravena, C.; Ryan, L.; Schuitema, G. The consumer’s Role in Flexible Energy Systems. IEEE Power Energy Mag. 2017, 15, 53–60. [Google Scholar]
- Fitzgerald, N.; Foley, A.M.; McKeogh, E. Integrating wind power using intelligent electric water heating. Energy 2012, 48, 135–143. [Google Scholar] [CrossRef] [Scilit]
- Yilmaz, S.; Rinaldi, A.; Patel, M.K. DSM interactions: What is the impact of appliance energy efficiency measures on the demand response (peak load management)? Energy Policy 2020, 139, 111323. [Google Scholar] [CrossRef] [Scilit]
- Wang, X.; Liua, Y.; Liu, J.; Jia, Y.; Xiang, Y. Thermally controllable demand response with multiple load aggregators. Electr. Power Syst. Res. 2020, 179, 106102. [Google Scholar] [CrossRef] [Scilit]
- Moura, R.; Brito, M.C. Prosumer aggregation policies, country experience and business models. Energy Policy 2019, 139, 820–830. [Google Scholar] [CrossRef] [Scilit]
- Schisler, K.; Sick, T.; Brief, K. The role of demand response in ancillary services markets. In Proceedings of the 2008 IEEE/PES Transmission and Distribution Conference and Exposition, Chicago, IL, USA, 21–24 April 2008. [Google Scholar]
- Vos, A. Effective business models for demand response under the Smart Grid paradigm. In Proceedings of the 2009 IEEE/PES Power Systems Conference and Exposition, Seattle, WA, USA, 15–18 March 2009. [Google Scholar]
- Itron Poised to Drive New Grid and Customer Experience Solutions with Comverge Acquisition. Available online: https://www.itron.com/na/company/newsroom/2016/11/02/itron-poised-to-drive-new-grid-and-customer-experience-solutions-with-comverge-acquisition (accessed on 8 April 2024).
- CPower Website. Available online: https://cpowerenergy.com/ (accessed on 8 April 2024).
- European Commission. EUROPEAN COMMISSION RECOMMENDATION of 9 March 2012 on Preparations for the Roll-Out of Smart Metering Systems (2012/148/EU); European Commission: Brussels, Belgium, 2012. [Google Scholar]
- Pitì, A.; Verticale, G.; Rottondi, C.; Capone, A.; Lo Schiavo, L. The Role of Smart Meters in Enabling Real-Time Energy Services for Households: The Italian Case. Energies 2017, 10, 199. [Google Scholar] [CrossRef] [Scilit]
- Carreiro, A.M.; Jorge, H.M.; Henggeler Antunes, C. Energy management systems aggregators: A literature survey. Renew. Sustain. Energy Rev. 2017, 73, 1160–1172. [Google Scholar] [CrossRef] [Scilit]
- ARERA. Prima apertura del mercato per il servizio di dispacciamento (MSD) alla domanda elettrica e alle unità di produzione anche da fonti rinnovabili non già abilitate nonché ai sistemi di accumulo. Istituzione di progetti pilota in vista della costituzione del testo integrato dispacciamento elettrico (TIDE) coerente con il balancing code europeo. In Deliberation 05 May 2017 300/2017/R/eel; Italian Regulatory Authority for Energy, Networks and the Environment: Milano, Italy, 2017. Available online: https://www.arera.it/atti-e-provvedimenti/dettaglio/17/300-17 (accessed on 8 April 2024).
- Things You Need to Know About UVAM, Lightbox. Available online: https://lightbox.terna.it/en/insight/distributed-resources-uvam (accessed on 8 April 2024).
- ARERA. Approvazione del Testo Integrato del Dispacciamento Elettrico (TIDE). In Deliberation 25 July 2023 345/2023/R/eel; Italian Regulatory Authority for Energy, Networks and the Environment: Milano, Italy, 2023. Available online: https://www.arera.it/atti-e-provvedimenti/dettaglio/23/345-23 (accessed on 8 April 2024).
- Arnone, D.; Mammina, M.; Favuzza, S.; Ippolito, M.G.; Riva Sanseverino, E.; Telaretti, E.; Zizzo, G. DEMAND Project: Bottom-Up Aggregation of Prosumers in Distribution Networks. In Proceedings of the 2018 AEIT International Annual Conference, Bari, Italy, 3–5 October 2018. [Google Scholar]
- Burger, S.; Chaves-Ávila, J.P.; Batlle, C.; Pérez-Arriaga, I.J. A review of the value of aggregators in electricity systems. Renew. Sustain. Energy Rev. 2017, 77, 395–405. [Google Scholar] [CrossRef] [Scilit]
- Venizelou, V.; Tsolakis, A.C.; Evagorou, D.; Patsonakis, C.; Koskinas, I.; Therapontos, P.; Zyglakis, L.; Ioannidis, D.; Makrides, G.; Georghiou, G.E. DSO-Aggregator Demand Response Cooperation Framework towards Reliable, Fair and Secure Flexibility Dispatch. Energies 2023, 16, 2815. [Google Scholar] [CrossRef] [Scilit]
- Croce, D.; Giuliano, F.; Tinnirello, I.; Galatioto, A.; Bonomolo, M.; Beccali, M.; Zizzo, G. Overgrid: A Fully Distributed Demand Response Architecture Based on Overlay Networks. IEEE Trans. Autom. Sci. Eng. 2017, 14, 471–481. [Google Scholar] [CrossRef] [Scilit]
- Arnone, D.; Cacioppo, M.; Ippolito, M.G.; Mammina, M.; Mineo, L.; Musca, R.; Zizzo, G. A Methodology for Exploiting Smart Prosumers’ Flexibility in a Bottom-Up Aggregation Process. Appl. Sci. 2022, 12, 430. [Google Scholar] [CrossRef] [Scilit]
- Stoll, B.; Buechler, E.; Hale, E. The value of demand response in Florida. Electr. J. 2017, 30, 57–64. [Google Scholar] [CrossRef] [Scilit]
- Aghaei, J.; Alizadeh, M.; Siano, P.; Heidari, A. Contribution of emergency demand response programs in power system reliability. Energy 2016, 103, 688–696. [Google Scholar] [CrossRef] [Scilit]
- Aryandoust, A.; Lilliestam, J. The potential and usefulness of demand response to provide electricity system services. Appl. Energy 2017, 204, 749–766. [Google Scholar] [CrossRef] [Scilit]
- Favuzza, S.; Ippolito, M.G.; Massaro, F.; Musca, R.; Riva Sanseverino, E.; Schillaci, G.; Zizzo, G. Building Automation and Control Systems and Electrical Distribution Grids: A Study on the Effects of Loads Control Logics on Power Losses and Peaks. Energies 2018, 11, 667. [Google Scholar] [CrossRef] [Scilit]
- Su, L.; Feng, W.; Kan, C.; Wei, M.; Su, R.; Yu, P.; Zhang, N. A Two-Stage Sustainable Optimal Scheduling Strategy for Multi-Contract Collaborative Distributed Resource Aggregators. Sustainability 2025, 17, 6767. [Google Scholar] [CrossRef] [Scilit]
- Faessler, B.; Schuler, M.; Preißinger, M.; Kepplinger, P. Battery Storage Systems as Grid-Balancing Measure in Low-Voltage Distribution Grids with Distributed Generation. Energies 2017, 10, 2161. [Google Scholar] [CrossRef] [Scilit]
- Lawder, M.T.; Suthar, B.; Northrop, P.W.C.; De, S.; Hoff, C.M.; Leitermann, O.; Crow, M.L.; Santhanagopalan, S.; Subramanian, V.R. Battery Energy Storage System (BESS) and Battery Management System (BMS) for Grid-Scale Applications. Proc. IEEE 2014, 102, 1014–1030. [Google Scholar] [CrossRef] [Scilit]
- Chen, H.; Cong, T.N.; Yang, W.; Tan, C.; Li, Y.; Ding, Y. Progress in electrical energy storage system: A critical review. Prog. Nat. Sci. 2009, 19, 291–312. [Google Scholar] [CrossRef] [Scilit]
- Fäßler, B.; Kepplinger, P.; Kolhe, M.L.; Petrasch, J. Decentralized on-Site Optimization of a Battery Storage System Using One-Way Communication; Institution of Engineering and Technology: Stevenage, UK, 2015; pp. 1–7. [Google Scholar]
- Qian, B.; Hu, H.; Tang, J.; Xiao, Y.; Lin, X.; Chen, Z. Low-Carbon Optimization Scheduling for Systems Considering Carbon Responsibility Allocation and Electric Vehicle Demand Response. Sustainability 2025, 17, 4299. [Google Scholar] [CrossRef] [Scilit]
- Sun, W.; Xie, E.; Yang, W. Bi-Level Decision-Making for Commercial Charging Stations in Demand Response Considering Nonlinear User Satisfaction. Sustainability 2026, 18, 907. [Google Scholar] [CrossRef] [Scilit]
- Jiang, H.; Liu, X. Research on Multi-Timescale Optimization Scheduling of Integrated Energy Systems Considering Sustainability and Low-Carbon Characteristics. Sustainability 2025, 17, 8899. [Google Scholar] [CrossRef] [Scilit]
- Faessler, B.; Kepplinger, P.; Petrasch, J. Decentralized price-driven grid balancing via repurposed electric vehicle batteries. Energy 2017, 118, 446–455. [Google Scholar] [CrossRef] [Scilit]
- Hua, W.; Chen, Y.; Qadrdan, M.; Jiang, J.; Sun, H.; Wu, J. Applications of blockchain and artificial intelligence technologies for enabling prosumers in smart grids: A review. Renew. Sustain. Energy Rev. 2022, 161, 112308. [Google Scholar] [CrossRef] [Scilit]
- Chiarini, A.; Compagniucci, L. Blockchain, Data Protection and P2P Energy Trading: A Review on Legal and Economic Challenges. Sustainability 2022, 14, 16305. [Google Scholar] [CrossRef] [Scilit]
- Balamurugan, J.N.; Poojitha, D.; Bindu, R.J.; Pallakonda, A.; Raj, R.D.A.; Yanamala, R.M.R.; Napoli, C.; Randieri, C. Blockchain-Enabled Secure Energy Transactions for Scalable and Decentralized Peer-to-Peer Solar Energy Trading with Dynamic Pricing. Technologies 2025, 13, 459. [Google Scholar] [CrossRef] [Scilit]
- Engineering D.HUB—The New Vision and Evolution Towards New Service Platforms Supporting the Digital Transformation. Available online: https://www.eng.it/en/who-we-are/engineering-group/engineering-dhub.ù (accessed on 5 June 2020).
- Capasso, A.; Grattieri, W.; Lamedica, R.; Prudenzi, A. A Bottom-Up approach to residential load modelling. IEEE Trans. Power Syst. 1994, 9, 957–965. [Google Scholar] [CrossRef] [Scilit]
- Capasso, A.; Invernizzi, A.; Lamedica, R.; Prudenzi, A. Probabilistic processing of survey collected data in residential load data for hourly demand profile extimation. In Proceedings of the IEEE/TUA Athens Power Conference: Planning, Operation and Control of Today’s Electric Power Systems, Athens, Greece, 5–8 September 1993; pp. 866–870. [Google Scholar]
- Beccali, M.; Bellia, L.; Fragliasso, F.; Bonomolo, M.; Zizzo, G.; Spada, G. Assessing the lighting systems flexibility for reducing and managing the power peaks in smart grids. Appl. Energy 2020, 268, 144924. [Google Scholar] [CrossRef] [Scilit]
- Ala, G.; Cosentino, V.; Di Stefano, A.; Fiscelli, G.; Genduso, F.; Giaconia, G.C.; Ippolito, M.G.; La Cascia, D.; Massaro, F.; Miceli, R.; et al. Energy Management via Connected Household Appliances; McGraw-Hill: Milan, Italy, 2008; pp. 1–158. [Google Scholar]
- Dolan, P.S.; Nehrir, M.H.; Gerez, V. Development of a Monte Carlo based aggregated model for residential electrical water heater loads. Electr. Power Syst. Res. 1996, 36, 29–35. [Google Scholar] [CrossRef] [Scilit]
- ARERA. Synthesis Annual Relation 2019 (In Italian: Sintesi Relazione Annuale 2019); Italian Regulatory Authority for Energy, Networks and the Environment: Milano, Italy, 2020.
- ISPRA. Italian Greenhouse Gas Inventory 1990–2023. National Inventory Document 2025; Report 411/2025; Istituto Superiore per la Protezione e la Ricerca Ambientale: Rome, Italy, 2025. [Google Scholar]
- Raimondi, G.; Spazzafumo, G. Integrating renewable energy communities and Italian UVAM project through renewable hydrogen chain. e-Prime-Advances in Electrical Engineering. Electron. Energy 2024, 10, 100819. [Google Scholar] [CrossRef] [Scilit]
- Ercoli, P.; Mugnini, A.; Arteconi, A. Demand response for renewable energy communities: Exploring coordination of prosumer-generated PV and flexible aggregated demand in the Italian framework. Energy Build. 2025, 340, 115814. [Google Scholar] [CrossRef] [Scilit]
- Alhelou, H.H.; Bahrani, B. Demand response cybersecurity for power systems with high renewable power share. In Industrial Demand Response: Methods, Best Practices, Case Studies, and Applications; Institution of Engineering and Technology: Stevenage Hertfordshire, UK, 2024; Chapter 2. [Google Scholar]
- Yang, S.; Lao, K.; Hui, H.; Chen, Y. Secure Distributed Control for Demand Response in Power Systems Against Deception Cyber-Attacks with Arbitrary Patterns. IEEE Trans. Power Syst. 2024, 39, 7277–7290. [Google Scholar] [CrossRef] [Scilit]

Disclaimer/Publisher’s Note: The statements, opinions and data contained in all publications are solely those of the individual author(s) and contributor(s) and not of MDPI and/or the editor(s). MDPI and/or the editor(s) disclaim responsibility for any injury to people or property resulting from any ideas, methods, instructions or products referred to in the content. |
© 2026 by the authors. Licensee MDPI, Basel, Switzerland. This article is an open access article distributed under the terms and conditions of the Creative Commons Attribution (CC BY) license.