


Abstract
This study investigates the ternary co-pyrolysis behavior of Soma lignite (SL), sugar beet pulp (SBP), and hazelnut husk (HH) at four blending ratios (80:10:10, 60:20:20, 40:30:30, and 20:40:40 wt.%) using thermogravimetric analysis under a nitrogen atmosphere. Synergistic interactions were quantified through mass-based () and rate-based () deviation indices, and the contributions of individual pseudo-components were resolved by Gaussian deconvolution of DTG curves. Among the blends investigated, the 40:30:30 (SL:SBP:HH) composition exhibited the most consistent and intense synergistic effect across all temperature zones, with the strongest promotion concentrated in the high-temperature region associated with CaCO3 mineral decomposition. Deconvolution analysis revealed that increasing the biomass fraction systematically shifted coal-related pseudo-component peaks to lower temperatures and enhanced the hemicellulose/pectin contribution, confirming that biomass-derived volatiles accelerate lignite devolatilization. These findings demonstrate that ternary co-pyrolysis of low-rank coal with two complementary agricultural by-products is a viable and sustainable strategy to enhance pyrolysis performance, valorize agro-industrial waste, and reduce the environmental footprint of lignite utilization, providing fundamental thermochemical data for the design of integrated lignite–biomass co-processing systems.
1. Introduction
The increasing global energy demand, coupled with the urgent need to mitigate greenhouse gas emissions and reduce dependence on imported fossil fuels, has driven extensive research into alternative and sustainable thermochemical conversion technologies [1,2,3]. Among these, co-pyrolysis—the simultaneous thermal decomposition of two or more feedstocks in an inert atmosphere—has emerged as a promising strategy that can exploit synergistic interactions between the blended materials, potentially improving volatile yields, altering char properties, and reducing the environmental footprint of conventional pyrolysis processes [1,2]. While binary co-pyrolysis of coal and a single biomass have been widely investigated, ternary blending systems involving one coal and two distinct biomass types remain considerably underexplored, despite their potential to combine complementary lignocellulosic compositions and generate multi-directional synergistic effects [1,2,4]. However, the magnitude and even the direction of synergistic interactions are highly system-specific; recent studies have reported negligible or antagonistic effects depending on coal rank, biomass type, heating rate and blending ratio [5,6]. At a more fundamental level, individual lignocellulosic constituents (cellulose, hemicellulose and lignin) exhibit markedly different interaction patterns with coal: hemicellulose and cellulose tend to promote devolatilization through enhanced volatile release, whereas lignin can either promote or inhibit decomposition depending on temperature and contact mode [6]. These findings underscore the importance of feedstock-specific synergy assessment, particularly for ternary systems where complementary biomass compositions may generate multi-directional interaction pathways.
Türkiye possesses approximately 17.5 billion tonnes of lignite reserves, making it one of the most significant low-rank coal holders in the world [7]. Lignite constitutes the largest domestic energy resource of the country, and its strategic utilization has been central to Türkiye’s energy policy aimed at reducing foreign dependency and diversifying the energy supply mix [7,8]. Among the various lignite deposits, Soma lignite from the Manisa province represents one of the most extensively exploited reserves, characterized by relatively high ash and mineral matter content—particularly CaCO3—and a calorific value that positions it within the typical range of Turkish brown coals [9]. Despite its abundance, the high ash content and low calorific value of Soma lignite pose challenges for direct combustion and conventional thermal utilization, motivating the exploration of co-processing strategies that can enhance its thermochemical performance [7,9].
Sugar beet pulp (SBP) is a major agro-industrial by-product generated during the extraction of sugar from sugar beets. SBP consists primarily of pectin (15–25%), hemicellulose (20–30%), and cellulose (20–25%), with a relatively low lignin content (∼1–5%) [10]. This pectin-dominant composition results in a thermal degradation profile that differs markedly from conventional lignocellulosic biomasses [11]. Although SBP is partially utilized as animal feed supplement, significant quantities remain underutilized and are disposed of as waste, causing environmental pollution through uncontrolled fermentation and leachate generation [12,13]. The high volatile matter content and unique pectin-rich composition of SBP make it an attractive candidate for thermochemical valorization, and its co-pyrolysis with lignite has been previously demonstrated to enhance conversion efficiency and modify activation energy profiles [14,15]. However, these earlier studies were limited to binary SBP–lignite blends and did not incorporate a second biomass component.
Türkiye is the world’s leading hazelnut producer, contributing approximately 60–70% of global output with an annual production of around 650,000–765,000 tonnes [16]. Hazelnut processing generates substantial quantities of agricultural waste, including the hard shell (kabuk) and the green leafy husk (zuruf/çotanak), each with distinct physicochemical characteristics. Hazelnut husk (HH), which is separated during post-harvest processing, has been identified as a biomass with high energy potential; Balcı-Kuru and Ertuğrul [17] calculated the biomass energy potential of hazelnut residues in Ordu province alone at 2321 GWh, significantly exceeding the province’s total electricity consumption of 1375 GWh. Proximate analysis of hazelnut husk reveals a volatile matter content of 64.45%, fixed carbon of 22.89%, and ash content of 8.70% [18]. Ceylan and Topçu [19] investigated the pyrolysis kinetics of hazelnut husk using thermogravimetric analysis at multiple heating rates and reported high reactivity with a main devolatilization peak in the 250–350 °C range, along with favorable calorimetric properties. Despite this promising profile, hazelnut husk has not been studied in ternary co-pyrolysis systems with lignite and a second biomass.
Thermogravimetric analysis (TGA) is the most widely employed technique for characterizing the thermal decomposition behavior of solid fuels and their blends under controlled atmospheres and heating conditions [2,20]. Beyond conventional TG/DTG curve interpretation and characteristic temperature determination, advanced analytical approaches such as mass-based () and rate-based () deviation analysis enable the quantification of synergistic or antagonistic interactions between blend components by comparing experimental results with theoretically calculated additive profiles [2]. Furthermore, Gaussian deconvolution of DTG curves into pseudo-components—representing hemicellulose, cellulose, lignin, and coal fractions—provides mechanistic insight into the relative contributions of individual chemical constituents to the overall thermal degradation profile [21]. The independent parallel reaction (IPR) framework underlying this deconvolution approach has been successfully applied to biomass and coal–biomass systems [22,23].
In parallel, volatile–char interaction studies using decoupling reactors and sequential pyrolysis configurations have demonstrated that biomass-derived volatiles can modify coal char microstructure, surface functionality and reactivity through radical transfer and condensation mechanisms [24,25], while the migration of alkali and alkaline earth metals (AAEMs) from biomass to coal char has been identified as a secondary pathway that can either catalyse or inhibit subsequent thermal conversion [26,27,28,29].
This gap is significant because the two biomasses possess fundamentally different lignocellulosic compositions that may generate complementary synergistic pathways during co-pyrolysis; pectin-derived volatiles from SBP interacting with the coal matrix at lower temperatures [11], while cellulose/lignin-derived radicals from HH may influence devolatilization at intermediate temperatures [30,31]. Guo et al. [32] showed that the extent of synergy in lignite systems correlates with the amount of volatiles released by each biomass component, supporting the hypothesis that combining compositionally distinct biomasses may yield complementary promotion effects across different temperature windows. The present study aims to fill this gap by comprehensively investigating the co-pyrolysis behavior of Soma lignite, sugar beet pulp, and hazelnut husk in ternary blends at four mixing ratios (80:10:10, 60:20:20, 40:30:30, and 20:40:40 wt.%) using non-isothermal TGA at 10 °C/min under nitrogen atmosphere. Within this framework, the study focuses on macro-thermal co-pyrolysis behavior characterised through TG/DTG analysis, mass- and rate-based synergy indices (, ), and Gaussian DTG deconvolution into pseudo-components. The specific objectives are defined as follows: (i) to characterize the thermal decomposition profiles of individual feedstocks and their ternary blends through TG/DTG analysis; (ii) to quantify synergistic and antagonistic interactions using mass-based deviation () and rate-based () synergy indices across defined temperature regions; and (iii) to resolve the contributions of individual pseudo-components (hemicellulose/pectin, cellulose, lignin/early coal, and main coal) through Gaussian deconvolution of DTG curves. The findings are expected to provide fundamental thermochemical data for the design and optimization of ternary co-pyrolysis systems utilizing low-rank coal and agro-industrial wastes indigenous to Türkiye.
2. Materials and Methods
2.1. Materials
Soma lignite (SL) was obtained from the Soma coal basin located in Manisa province, western Türkiye. The sample was dried in open air, crushed and ground in a laboratory mill, then sieved to a size of less than 150 μm [33] and stored in airtight polyethylene bags to prevent moisture re-absorption and oxidation prior to analysis. The sugar beet pulp (SBP) was kindly supplied from Ankara Sugar Factory (Türkşeker, Türkiye). Hazelnut husk (zuruf/çotanak, HH), the green leafy involucre that envelops the hard shell of the hazelnut fruit, samples which have been taken from Giresun (Türkiye) were also used as the raw material for the pyrolysis experiments. Prior to use, both SBP and HH were dried in a laboratory oven at 70 °C for 48 h. The dried samples were then ground and sieved using a Retsch sieve shaker (Retsch GmbH, Haan, Germany) to obtain a particle size of less than 150 μm.
2.2. Blend Preparation
Ternary blends of SL, SBP, and HH were prepared at four mixing ratios on a dry weight basis, as summarized in Table 1. The biomass fractions (SBP and HH) were added in equal proportions at each blending level to isolate the effect of the total biomass-to-coal ratio while maintaining a constant SBP:HH ratio of 1:1. The individual components were weighed using an analytical balance and mixed thoroughly to ensure homogeneity before TGA experiments.
Table 1.
Blend sample designation and their composition 1.
2.3. Proximate and Elemental Analysis
Proximate and elemental analyses of SL were based on previously reported data [33,34]. Proximate analysis (moisture, volatiles, and ash contents) of SBP and HH were determined according to the ASTM standards: E1756-01 [35], E872-82 [36], and E1755-01 [37]. The fixed carbon was determined by difference. The analyses were performed in triplicate and the mean results were reported. The elemental analysis was performed using a Thermo Flash 2000 CHNS/O analyzer (Thermo Fisher Scientific, Waltham, MA, USA). Chemical composition of SBP and HH in terms of carbon (C), hydrogen (H), nitrogen (N), and sulfur (S) was determined using an elemental analyzer, operating at 950–1000 °C in an atmosphere of pure oxygen, with oxygen content determined by difference. The higher heating value (HHV, kJ/kg, dry basis) of samples was evaluated based on ultimate analyses data by using the experimental correlation proposed by Channiwala and Parikh [38].
2.4. Thermogravimetric Analysis (TGA)
Non-isothermal pyrolysis experiments were performed using a thermogravimetric analyzer (SII EX STAR6000, TG/DTA 6300, Seiko Instruments Inc., Tokyo, Japan). For each experiment, sample weights were approximately 10 ± 1 mg. The samples were heated from ambient temperature (∼25 °C) to 900 °C at a constant heating rate of 10 °C/min under a nitrogen atmosphere to ensure inert pyrolysis conditions. The nitrogen flow rate was maintained at 100 mL/min throughout each experiment to continuously purge the evolved volatiles and prevent secondary gas-phase reactions within the furnace. Each experiment was performed as a single run. The high intrinsic reproducibility of TGA is well established: an international interlaboratory comparison involving 12 laboratories confirmed ≥90% statistical conformity with standard deviations below 5% for mass-loss determinations [39,40], while Bensharada et al. [41] reported repeatability with SD ≤ 0.55% for compositional analysis. On this basis, single-run TGA data are considered reliable for the comparative trend analysis pursued herein, as further supported by the internal consistency of trends across seven compositions and high deconvolution R2 values (0.90–0.99). The temperature, sample mass (TG), and derivative thermogravimetric (DTG) data were recorded continuously as a function of temperature and time. Prior to the experiments, the thermal analyzer was calibrated for temperature readings, using indium as a reference material. The balance was calibrated for the buoyancy effect, allowing the quantitative estimation of weight changes.
2.5. Synergy Analysis
2.5.1. Mass-Based Deviation ()
To evaluate the synergistic or antagonistic interactions between the blend components during co-pyrolysis, the deviation between the experimental TG curves and the theoretically calculated additive TG curves was quantified using the mass-based deviation parameter [2,42,43]. The calculated (theoretical) TG curve for each blend was obtained by the weighted linear superposition of the individual component TG curves according to their mass fractions in the blend, assuming no interaction between the components:
where is the calculated mass percentage at temperature T, is the mass fraction of component i in the blend, is the experimental mass percentage of pure component i at temperature T, and n is the number of components ( for the present ternary system) [2,42,43].
The mass-based deviation was then calculated as:
where is the experimentally measured mass percentage of the blend at temperature T. A negative value () indicates that the experimental residual mass is lower than the theoretical prediction, meaning that more volatiles were released than expected from simple additive behavior—this is defined as a synergistic effect (enhanced devolatilization). Conversely, a positive value () indicates that less volatile matter was released than predicted, representing an antagonistic effect (suppressed devolatilization) [42,44].
2.5.2. Rate-Based Deviation ()
In addition to the mass-based deviation, a rate-based synergy parameter was calculated from the DTG curves to capture the instantaneous reaction rate differences between experimental and theoretical behavior:
where is the experimental DTG value at temperature T, and is the calculated DTG value obtained from the weighted sum of individual component DTG curves [42]. A positive value indicates that the experimental mass loss rate exceeds the theoretical rate (synergistic effect on reaction rate), while a negative value indicates the opposite (antagonistic effect on reaction rate).
2.5.3. Regional Synergy Indices
To provide a quantitative comparison of synergistic effects across different temperature zones, the average was calculated for three characteristic temperature regions:
- Region I (250–350 °C): Corresponding primarily to the biomass devolatilization zone (hemicellulose/pectin and cellulose decomposition).
- Region II (350–500 °C): Corresponding to lignin decomposition and early coal devolatilization.
- Region III (500–650 °C): Corresponding to the late coal devolatilization and transition to the mineral decomposition zone.
These regional indices enable the identification of the temperature ranges where synergistic or antagonistic interactions are most pronounced, and facilitate comparison across different blend ratios [1].
2.6. DTG Deconvolution
2.6.1. Independent Parallel Reaction (IPR) Model
The DTG curves of individual feedstocks and their blends were deconvolved into pseudo-component peaks using the independent parallel reaction (IPR) model framework. The IPR model assumes that the overall thermal decomposition of a heterogeneous solid fuel can be described as the sum of independent, parallel reactions, each corresponding to the degradation of a distinct pseudo-component [21,23,45]. This approach has been widely employed to resolve the overlapping decomposition profiles of lignocellulosic biomasses and coal–biomass blends [1,21,23].
2.6.2. Gaussian Peak Fitting
Each DTG curve was deconvolved into four Gaussian pseudo-component peaks using nonlinear least-squares curve fitting via the Levenberg–Marquardt algorithm [22,42]. The four pseudo-components were assigned based on the known thermal degradation behavior of lignocellulosic biomass and coal constituents:
- P1 (Hemicellulose/Pectin + low-temperature coal volatiles): Represents the decomposition of hemicellulose and pectin from biomass, noting that Soma lignite as a low-rank coal also contributes low-temperature volatiles in the 200–350 °C range. In the blends, P1 therefore represents a composite pseudo-component that cannot be attributed exclusively to biomass.
- P2 (Cellulose): Represents cellulose decomposition, characterized by a relatively sharp peak in the 250–380 °C range [46].
- P3 (Lignin/Early Coal): Represents the broad decomposition of lignin and the main devolatilization stage of coal. Lignin decomposes over a wide temperature range but is most significant near 400 °C [46], while the primary devolatilization of lignite typically spans the 380–600 °C interval [9]. In coal–biomass blends, these components overlap significantly.
- P4 (Main Coal/Mineral): Represents the late-stage high-temperature devolatilization and mineral matter cracking (primarily the decomposition of CaCO3 to CaO and CO2), explicitly observed in the 650–850 °C range for high-ash lignites [9].
The overall DTG profile was reconstructed as the sum of the four Gaussian functions:
where , , and are the amplitude (peak height), center temperature (peak position), and standard deviation (peak width) of the j-th Gaussian pseudo-component, respectively [22,42].
2.6.3. Fitting Quality Assessment
The quality of the deconvolution fit was evaluated using the coefficient of determination ():
where is the experimental DTG value at data point k, is the fitted (reconstructed) DTG value, is the mean of the experimental DTG values, and N is the total number of data points [22]. An value approaching 1.00 indicates an excellent fit between the deconvolved profile and the experimental DTG curve. The relative area percentage of each pseudo-component was calculated as:
where the integral of each Gaussian peak represents the total mass loss contribution of the corresponding pseudo-component to the overall decomposition process [46,47].
3. Results and Discussion
3.1. Physicochemical Characteristics of the SL/SBP/HH System
Proximate and Ultimate Analysis
The proximate and ultimate analyses of the three feedstocks—Soma lignite (SL), sugar beet pulp (SBP), and hazelnut husk (HH)—are summarized in Table 2. These properties define the thermal reactivity, energy density, and environmental footprint of each component and their blends.
Table 2.
Proximate and ultimate analyses of the Soma lignite (SL), sugar beet pulp (SBP) and hazelnut husk (HH) samples (on air dried basis) 1.
The proximate and ultimate analysis values obtained in this study show good overall agreement with the previously published literature for all three feedstocks (Table 2). SL displayed the highest ash content (39.34%) and the lowest volatile matter content (36.26%) among the three feedstocks. This exceptionally high ash content is characteristic of the Soma basin, where the mineral matter—predominantly calcium carbonate (CaCO3) and associated clay minerals—constitutes a substantial fraction of the coal matrix. Soma lignite ash contents in the range of 10–42% depending on the seam, confirming the present value falls within the expected variability [9,48,49,50,51,52]. The VM content (36.26%) is also consistent with previously reported values for Soma lignites (34–38% on an air-dried basis) and reflects the moderate devolatilization potential of this low-rank coal [9,48,49,50,51,52].
The ultimate analysis reveals a remarkably low carbon content (32.80%) and hydrogen content (2.20%), yielding an H/C molar ratio of 0.80 and an O/C molar ratio of 0.45. These values position SL firmly in the low-rank coal zone of the van Krevelen diagram, distant from the high-energy bituminous coal region. The sulfur content (0.57%) is moderate and constitutes the only sulfur source in the ternary blending system, since both SBP and HH are sulfur-free. The fuel ratio (FC/VM) was calculated as 0.55, well below the threshold of 2.5 recommended for adequate pulverized fuel combustion, indicating satisfactory ignitability despite the high ash burden. Using the Channiwala and Parikh [38] correlation, the higher heating value (HHV) of SL was estimated at approximately 11.21 MJ/kg. This is at the lower end of the typical range for Turkish lignites (10–20 MJ/kg) and is substantially below the values reported for bituminous coals (25–35 MJ/kg), primarily due to the high ash and moderate oxygen contents that dilute the combustible organic fraction. The low HHV underscores the necessity of co-processing SL with higher-energy feedstocks to improve the overall fuel quality of the blended system [53].
Sugar beet pulp exhibited a strikingly different compositional profile. The VM content (73.20%) was approximately twice that of SL, while the ash content (5.01%) was nearly eight times lower (Table 2). The physicochemical properties of the SBP sample are highly comparable to previously reported results for sugar beet residues in the literature [10,11]. The high VM is directly attributable to the pectin–hemicellulose–cellulose-rich composition of SBP, which contains 15–25% pectin, 20–30% hemicellulose, and 20–25% cellulose with a very low lignin content (∼1–4%). This compositional makeup favors rapid devolatilization at relatively low temperatures (200–400 °C), consistent with the high DTG peaks observed for SBP in the thermogravimetric experiments [11,12].
The ultimate analysis showed substantially higher C (40.39%), H (5.65%), N (1.37%), and O (40.86%) contents compared to SL, in agreement with typical lignocellulosic agro-residues reported by Yogalakshmi et al. [54]. The resulting H/C molar ratio of 1.67 and O/C molar ratio of 0.76 place SBP in the biomass cluster of the van Krevelen diagram, well separated from the coal zone. The absence of sulfur is a notable environmental advantage, completely eliminating SOx emissions from the SBP fraction during thermochemical conversion. The estimated HHV of SBP was 16.41 MJ/kg, which aligns well with the range of 14.0–17.2 MJ/kg reported in the literature for sugar beet pulp depending on moisture basis and sugar extraction conditions [55].
The fuel ratio (FC/VM) of SBP was only 0.21, indicating extremely high reactivity and ease of ignition. However, this also means that SBP releases the vast majority of its mass as volatiles, leaving minimal char for sustained high-temperature reactions—a characteristic that makes it an excellent complementary fuel to the slower-reacting lignite [53].
Hazelnut husk presented an intermediate compositional profile between SL and SBP for most parameters. The VM content (66.61%) was lower than SBP but nearly twice that of SL, while the ash content (7.01%) was slightly higher than SBP but dramatically lower than SL. These values are broadly consistent with the hazelnut husk proximate analysis reported by Sezer and Özveren [18], who found VM = 64.45%, FC = 22.89%, and ash = 8.70%. The slight differences (e.g., VM: 66.61% vs. 64.45%; ash: 7.01% vs. 8.70%) are within the natural variability expected for agricultural residues depending on harvest year, geographic location, and post-harvest processing conditions. The FC content of HH (20.41%) was notably higher than that of SBP (15.07%) and comparable to SL (19.93%). This relatively high FC reflects the higher lignin content of hazelnut husk (approximately 25–35%) compared to the near-absent lignin in SBP [19]. Lignin, with its complex aromatic structure, is the primary contributor to fixed carbon in lignocellulosic biomasses, and its presence in HH means that this feedstock will produce more char during pyrolysis than SBP.
The ultimate analysis revealed the highest carbon content (47.94%) and hydrogen content (5.86%) among the three feedstocks, with an oxygen content of 44.75%. The C content of HH is somewhat higher than the 39.75% reported by Sezer and Özveren [18], which may reflect varietal differences in hazelnut cultivars and/or different post-harvest processing conditions in the Black Sea region. Kamar and Acar Bozkurt [56] reported similar elemental compositions for hazelnut husk with C as 48.79% depending on the variety and growing conditions. Both sulfur and nitrogen contents were 0.00% and 1.45%, respectively—the sulfur-free character being a significant advantage for clean energy applications [57]. The nitrogen content across the three feedstocks ranges from 0.79% (SL) to 1.45% (HH). The resulting H/C molar ratio of 1.46 and O/C molar ratio of 0.70 position HH slightly closer to the coal zone on the van Krevelen diagram compared to SBP, again reflecting the higher lignin content that contributes more aromatic carbon. The estimated HHV of HH was 18.84 MJ/kg, the highest among the three feedstocks. This value is consistent with the HHV range of 17.0–19.7 MJ/kg reported for hazelnut husk and shell biomasses in the literature [56,58]. The fuel ratio (FC/VM) was 0.31, positioning HH between SBP (0.21) and SL (0.55) in terms of reactivity and indicating that HH offers a balanced combination of volatile release for ignition and char formation for sustained combustion.
On the van Krevelen diagram, SL occupies the low-H/C, moderate-O/C zone characteristic of low-rank coals, while SBP and HH cluster in the biomass region with higher H/C ratios. The distinction between SBP (H/C = 1.67) and HH (H/C = 1.46) reflects their fundamentally different lignocellulosic compositions: SBP is dominated by pectin and polysaccharides (high H/C), whereas HH contains substantially more lignin (aromatic, lower H/C). As the biomass fraction increases in the blends, the mixture composition shifts from the coal zone toward the biomass zone, corresponding to a higher hydrogen content and improved thermal conversion potential [59].
All three feedstocks have fuel ratios well below 2.5, confirming that ignitability is not a limitation for any composition. The key insight lies in the complementary volatile–char balance: SBP provides rapid, low-temperature volatile release (pectin and hemicellulose degradation at 200–350 °C) but leaves minimal char; HH offers a balanced profile with substantial volatile release plus significant char formation due to its lignin content; SL contributes the high-temperature char backbone and mineral-phase reactivity (CaCO3 decomposition at 650–750 °C). This three-way complementarity means that in the ternary blends, the devolatilization process spans a wider temperature range and the char formation is more balanced than in any individual feedstock, providing a thermochemical rationale for the synergistic effects observed in the TG/DTG analysis [18].
On the other hand, the calculated HHV values illustrate the clear energy density hierarchy: HH (18.84 MJ/kg) > SBP (16.41 MJ/kg) > SL (11.21 MJ/kg) (Table 3). The low HHV of SL is a direct consequence of its extreme ash content diluting the combustible fraction. Co-blending with SBP and HH progressively improves the energy density of the mixture. The theoretical weighted-average HHV for the ternary blends can be estimated as follows:
Table 3.
The theoretical weighted-average HHV for the ternary blends.
The 40SL + 30SBP + 30HH blend achieves a theoretical HHV of 15.06 MJ/kg, representing a 34.3% improvement over pure SL. The 20SL + 40SBP + 40HH blend approaches 16.34 MJ/kg, which is comparable to or exceeds many lignite fuels available commercially. This “fuel upgrading” through biomass co-blending is one of the key practical motivations for the co-pyrolysis strategy [2].
According to Table 4, the ash content decreases progressively with an increasing biomass fraction.
Table 4.
Ash, S and Ash Reduction vs. SL values for the ternary blends.
The 40SL + 30SBP + 30HH blend reduces the ash content by more than half (from 39.34% to 19.34%), which has direct practical implications: lower slagging and fouling tendency, reduced ash disposal volumes and costs, and improved heat transfer efficiency in combustion and gasification systems. The sulfur content likewise drops from 0.57% to 0.23% at the 40/30/30 ratio and to only 0.11% at 20/40/40, since both SBP and HH are sulfur-free feedstocks. These reductions have direct implications for sustainable energy production. The progressive decrease in ash content from 39.34% (pure SL) to 19.34% (40:30:30 blend) alleviates slagging, fouling, and ash disposal challenges that are among the primary environmental and economic barriers to lignite utilization [9]. Simultaneously, the 60–80% reduction in sulfur content substantially mitigates SOx emission potential, contributing to compliance with increasingly stringent air quality regulations. The improvement in HHV from 11.21 to 15.06 MJ/kg at the 40:30:30 ratio enhances the energy return per unit of fuel processed, reducing the volume of feedstock required and the associated transportation and handling costs. Collectively, these improvements demonstrate that ternary co-blending with agricultural wastes can simultaneously address fuel quality, emission control, and waste valorization objectives—three pillars of sustainable solid fuel management. This translates to a 60–80% reduction in potential SOx emissions, a significant environmental benefit for regions where lignite-fired power plants face increasingly stringent emission regulations [53].
3.2. Interpretation of TG and DTG Curves
3.2.1. Thermal Behavior of Pure Components
The TG and DTG curves of pure Soma lignite (SL), sugar beet pulp (SBP), hazelnut husk (HH), and their ternary blends are illustrated in Figure 1 and characteristic temperatures and mass loss parameters of the pure samples and their blends are presented in Table 5.
Figure 1.
TG and DTG curves of (a) pure Soma lignite (SL), (b) sugar beet pulp (SBP), (c) hazelnut husk (HH), and (d) their ternary blends (80SL + 10SBP + 10HH, 60SL + 20SBP + 20HH, 40SL + 30SBP + 30HH, 20SL + 40SBP + 40HH) obtained at 10 K/min under nitrogen atmosphere. Characteristic temperatures (onset, peak, and end temperatures) and total mass losses are consistent with the values summarized in Table 5.
Table 5.
Characteristic temperatures and mass loss parameters of the pure samples and their blends.
Soma Lignite (100% SL): Soma lignite exhibits the highest thermal stability among the pure components. The main devolatilization peak is observed at 451.5 °C, which is consistent with the 420–500 °C range reported for Turkish lignites [9]. A second peak appears at 719.4 °C; this high-temperature peak is attributed to the thermal decomposition of calcium carbonate (CaCO3 CaO + CO2) present in the high-CaO ash structure of Soma lignite [9]. The total mass loss is only 39.24%, leaving a residue of 60.76%; this high char yield is directly related to the elevated ash and mineral matter content of the lignite. The limited volatile release in the pyrolysis environment compared to combustion explains the observed 39% mass loss [9]. Similarly, Kojić et al. [60] reported a residue of 64.69% for the pyrolysis of a lignite at 900 °C, attributing this high char yield to its substantial mineral/ash content. The maximum DTG value is 0.235 mg/min, the lowest among all samples, indicating that the lignite possesses a relatively slow decomposition kinetics spread over a broad temperature range (Figure 1a).
Sugar Beet Pulp (100% SBP): SBP has the highest maximum DTG value (0.652 mg/min) and the largest total mass loss (79.79%) among all samples. Two distinct DTG peaks are observed: 285.3 °C and 339.4 °C. This dual-peak structure is intrinsically linked to the lignocellulosic composition of SBP. Sidi-Yacoub et al. [11] reported that during the thermal pyrolysis of sugar beet pulp, pectin decomposition occurs at ∼233 °C, hemicellulose at ∼269 °C, and cellulose at ∼341 °C. In the present study, the 285.3 °C peak corresponds to the overlapping decomposition of pectin and hemicellulose, while the 339.4 °C peak is assigned to cellulose decomposition. The SBP pyrolysis concludes at 493.3 °C; this early offset temperature reflects the low lignin content of SBP. Slezak et al. [61] observed similar offset temperatures in the co-pyrolysis of beet pulp and defecation lime. The residue amount of 20.21% is consistent with the mineral and ash content of SBP (Figure 1b).
Hazelnut Husk (100% HH): In the DTG profile of hazelnut husk, an initial peak is observed at 70.5 °C, which can be attributed to moisture loss and the devolatilization of extractives at very low temperatures (Figure 1c). The main devolatilization peak occurs at 312.9 °C, corresponding to the overlapping region of hemicellulose and cellulose decomposition. Ceylan and Topçu [19] identified high volatile matter content and calorimetric value in hazelnut husk pyrolysis, reporting that the main decomposition peak lies in the 250–350 °C range based on DTG profiles obtained at heating rates of 5, 10, and 20 °C/min. Sezer and Özveren [18] reported a volatile region peak temperature of 285.9 °C and an ignition temperature of 216.8 °C for hazelnut husk combustion at 10 °C/min. The slight shift of this peak to a higher temperature (312.9 °C) under pyrolysis conditions is an expected behavior, as the absence of oxidative effects in a nitrogen atmosphere delays thermal degradation. The total mass loss of HH is 71.64% with a residue of 28.36%; the higher char yield under pyrolysis conditions compared to combustion is an anticipated outcome [19].
3.2.2. Thermal Behavior of the Blends
High Lignite Ratio (80SL + 10SBP + 10HH): In this blend, the TG curve closely resembles the profile of pure Soma lignite (Figure 1). The first DTG peak is located at 335.2 °C, which is higher than the pure SBP (285.3 °C) and pure HH (312.9 °C) peaks; it is suggested that the lignite matrix suppresses biomass devolatilization at low biomass blending ratios. The second peak is at 713.8 °C, overlapping with the CaCO3 decomposition region of the Soma lignite [9]. The total mass loss is 45.48%, which is higher than the 39.14% of pure lignite. The maximum DTG is 0.186 mg/min, the lowest value among all samples.
Medium Lignite Ratio (60SL + 20SBP + 20HH): As the biomass ratio increases to 40%, the low-temperature biomass decomposition shoulder becomes more pronounced (Figure 1). The second peak drops to 704.4 °C, indicating that the increased biomass proportion affects the CaCO3 decomposition kinetics [9]. The total mass loss increased to 52.71%, and the residue decreased to 47.29%. Liu et al. [2] highlighted that in a similar coal–biomass system, alkali and alkaline earth metals (AAEMs) from the biomass can exert a catalytic effect, improving the pyrolysis product distribution.
Low–Medium Lignite Ratio (40SL + 30SBP + 30HH): A significant shift is observed in the DTG profile for this blend: the first peak drops to 245.0 °C, and the second peak emerges at 335.8 °C (Figure 1). This indicates that as the biomass fraction becomes dominant, the distinct pectin/hemicellulose peak and the cellulose peak can be clearly resolved [11]. The total mass loss reaches 60.88%, and the maximum DTG is 0.300 mg/min. Zhang et al. [43] reported that in the co-pyrolysis of coal and pine sawdust, the addition of biomass lowered and values by approximately 100 °C.
High Biomass Ratio (20SL + 40SBP + 40HH): In the blend with the highest biomass ratio, the TG curve behaves very similarly to the pure biomass components (Figure 1). The first peak is at 246.7 °C, and the second is at 336.3 °C. The total mass loss is 68.37%, with a residue of 31.63%. Liu et al. [2] noted that at high biomass blending ratios (50% and above), a negative synergy might be observed due to increased tar production and decreased total carbon conversion.
3.2.3. General Trends
As the biomass ratio increases, the total mass loss systematically rises (39.14% → 68.37%), while the residue amount decreases (60.76% → 31.63%). Sezer and Özveren [18] determined the volatile matter ratio of hazelnut husk to be 64.45%, well above the typical 25–40% range for lignites. Characteristic temperatures shift to lower values as the biomass proportion increases; the single broad peak at high lignite ratios (∼335 °C) resolves into two distinct peaks (∼245 °C and ∼336 °C) when biomass dominates. This behavior is a frequently observed trend in coal–biomass co-pyrolysis studies [62].
3.3. Investigation of Synergistic Effects
3.3.1. Deviation Between Experimental and Theoretical TG Curves ()
Synergy analysis was performed by examining the temperature-dependent difference () between the experimental TG curve and the mass-weighted theoretical sum of the components. A value of denotes a synergistic effect (accelerated decomposition, enhanced volatile release), whereas signifies an antagonistic effect (inhibited decomposition, higher char retention) [2].
When analyzing the deviation curves, the strongest negative deviation (synergistic effect) for all blends is concentrated around 650–720 °C. This region corresponds to the CaCO3 mineral decomposition interval of Soma lignite; the acceleration of calcite decomposition by CO2 and H2O released from biomass pyrolysis likely explains this robust synergy [9,60] (Figure 2). Similarly, for the 40SL + 30SBP + 30HH blend, the value drops to as low as –2.5 wt.% in this region, exhibiting the most severe synergistic interaction. This high-temperature synergy is therefore interpreted as a specific manifestation of the general radical/AAEM-driven mechanisms reported for coal–biomass systems, in which biomass-derived radicals facilitate release while AAEM-rich mineral phases modulate char gasification and pore development, rather than as a fundamentally new reaction pathway [27,28,29].
Figure 2.
Proposed mechanistic pathways for the enhanced synergistic interactions observed in the high-temperature region (Region III, 650–720 °C). The schematic illustrates two parallel promotional effects: (1) Biomass-derived volatiles actively attack and destabilize the rigid carbon matrix of Soma lignite, facilitating the escape of internally trapped from decomposition. (2) and molecules released from biomass promote char gasification ( and ), which further accelerates mass loss in this temperature range. These combined effects resolve the strong negative values observed in ternary blends. The conceptual schematic was developed with the assistance of the Gemini 3 Flash AI model (Google) and verified against experimental findings.
The schematic demonstrates that the intense synergy in Region III is not solely due to accelerated decomposition, but rather a result of two parallel pathways: first, biomass volatiles physically weaken the coal matrix, facilitating escape; second, the high concentration of and released from biomass triggers active char gasification (), providing a clear causal link to the sharp negative values and confirming that biomass acts as a chemical promoter rather than a mere inert diluent.
3.3.2. Mass-Based and Rate-Based Synergy Curves
Evaluating the (mass-based) and (rate-based) synergy curves simultaneously reveals a complex interaction framework (Figure 3). In the rate-based synergy () curves, strong negative values are observed around ∼700 °C for all blends; this demonstrates that the experimental decomposition rate significantly exceeds its theoretical sum, implying an unexpected acceleration in pyrolysis kinetics within the mineral decomposition zone.
Figure 3.
Synergy analysis of ternary blends of Soma lignite (SL), sugar beet pulp (SBP), and hazelnut husk (HH): (a) mass-based deviation profiles between experimental and theoretical TG curves and (b) rate-based synergy index obtained from DTG curves. Negative values indicate synergistic promotion of mass loss or decomposition rate, whereas positive values correspond to antagonistic or inhibiting effects.
Region I (250–350 °C)—Biomass Devolatilization:
Positive values are observed at low and medium lignite ratios (80SL, 60SL, 20SL), indicating that the experimental residual mass is higher than the theoretical prediction in this zone, thereby partially suppressing biomass devolatilization (antagonistic effect). Liu et al. [2] reported that the coal matrix can absorb biomass volatiles in the 250–380 °C range, creating a low-temperature antagonistic effect. Conversely, the negative (–0.264) observed in Region I for the 40SL + 30SBP + 30HH blend is noteworthy; this suggests that the biomass fraction is sufficiently high to overcome the radical-scavenging matrix effect of the coal (Table 6). This antagonistic behavior at low biomass fractions is consistent with findings from volatile–char interaction studies. An et al. [63] isolated secondary pyrolysis reactions using a two-stage reactor and demonstrated that biomass volatiles undergo catalytic cracking over lignite char, confirming that volatile–char contact governs a significant portion of the observed synergy or antagonism. Similarly, Zhang et al. [64] reported that at low biomass fractions (≤20 wt%), the experimental TG curve closely followed the theoretical additive curve, whereas synergy became detectable only above a critical biomass threshold. In our system, the transition from antagonistic to synergistic behavior in Region I at the 40:30:30 ratio suggests that the combined volatile output of SBP and HH crosses this threshold, generating a sufficient radical pool to overcome the coal-matrix suppression effect.
Table 6.
Average regional mass-based synergy indices () for the ternary blends.
Region II (350–500 °C)—Lignin and Early Coal Devolatilization:
The 40SL + 30SBP + 30HH blend continues to exhibit a prominent synergistic effect in this region, with the strongest negative (–0.597). It is postulated that hydrogen radicals and volatile short-chain hydrocarbons released from the biomass accelerate the coal pyrolysis reactions and inhibit cross-linking [2]. Quan and Gao [62] also emphasized that the synergistic effect in co-pyrolysis is most pronounced between 400 and 600 °C. The positive observed in the 80SL and 60SL blends in this region can be correlated with an insufficient radical pool due to the low biomass proportion (Table 6). The composition-dependent nature of this synergy is well documented in the literature. Haykiri-Açma and Yaman [65] observed significant synergy between 400 and 600 K during co-pyrolysis of Elbistan lignite and hazelnut shell, whereas additive behavior dominated above 600 K. Wang et al. [66] reviewed that AAEM species—particularly potassium and calcium—catalyze cracking and deoxygenation during co-pyrolysis, but their effectiveness depends on the biomass fraction and the contact mode between fuel particles. In the present ternary system, the pectin/hemicellulose-rich SBP releases light oxygenates and hydrogen radicals at lower temperatures, while the more lignin-rich HH contributes radicals at intermediate temperatures; together they may sustain a broader radical supply window than a single biomass, which is consistent with the observation that the 40:30:30 blend exhibits negative across all three regions.
Region III (500–650 °C)—Late Devolatilization:
In this zone, 40SL + 30SBP + 30HH displays the strongest negative (–0.746), while 20SL + 40SBP + 40HH shows a more moderate synergy (–0.225). Brat et al. [1] reported transitions between synergistic and antagonistic effects depending on the mixing ratios in lignite–biomass co-pyrolysis, highlighting the heating rate as a controlling parameter for this transition. In addition to CaCO3 decomposition, char gasification reactions (C + CO2→ 2CO; C + H2O → CO + H2) are thermodynamically favorable in this temperature range and may contribute to the observed mass loss. Yuan et al. [67] showed that CaCO3 introduces an additional high-temperature DTG peak at 650–700 °C during biomass pyrolysis, simultaneously modifying CO2 and CO release profiles through a carbonation–calcination cycle. Fei et al. [68] further demonstrated, through acid-washing experiments, that calcium in lignite catalytically facilitates tar cracking, sulfur retention as CaS, and char gasification during co-pyrolysis—effects that were eliminated upon removal of calcium, confirming the central role of Ca-based mineral species. The transition from antagonistic to synergistic behavior with increasing temperature has been linked to the temperature-dependent transformation of AAEM species: at lower temperatures, Ca can form thermally stable CaCO3 layers that partially hinder devolatilization [69], whereas at higher temperatures these species decompose to catalytically active CaO that promotes char gasification [67,70]. This interpretation is consistent with the present data, where negative values intensify progressively from Region I to Region III for the 40:30:30 blend.
3.3.3. Discussion on Synergy Mechanism
Before discussing the specific synergy patterns observed in this study, it is useful to place them within the broader mechanistic framework established for coal–biomass co-pyrolysis. Comprehensive reviews [66] indicate that synergistic interactions in such systems originate from two coupled routes: (i) hydrogen-donor and free-radical transfer from biomass volatiles, which suppress cross-linking and promote secondary cracking of coal-derived macromolecular fragments, and (ii) catalytic or inhibitory effects of alkali and alkaline earth metals (AAEMs) on char structure and gasification reactivity. Importantly, the magnitude and even the direction of these interactions are highly system-specific; negligible or antagonistic effects have been reported depending on coal rank, biomass type, heating rate, blending ratio, and reactor configuration [63,71,72]. This variability is particularly relevant for Ca-rich systems, where calcium can both enhance reactivity through catalytic promotion and suppress it through the formation of inert Ca–Al–Si phases when interacting with aluminosilicate minerals in coal ash [66,73]. Recent co-pyrolysis studies consistently report that synergy in coal–biomass systems originates from two coupled mechanisms: (i) hydrogen-donor and free-radical transfer from biomass volatiles, which suppress cross-linking and promote secondary cracking of coal-derived macromolecular fragments, and (ii) catalytic or inhibiting effects of alkali and alkaline earth metals (AAEMs) on char structure and gasification reactivity [26,27,28,29,74]. In particular, under high heating rates and particle-separated conditions, wire-mesh reactor experiments have shown that the contribution of biomass volatiles to synergy can become more important than AAEM catalysis around intermediate biomass fractions (∼10 wt%), whereas TG–FTIR studies highlight that AAEM-rich biochars may either enhance or partially suppress coal devolatilization depending on temperature and blending ratio [26,27,29,74].
Overall, the primary mechanism of co-pyrolysis synergy can be viewed as the combined action of biomass-derived radicals and AAEMs: low-temperature –rich volatiles inhibit the cross-linking of the coal macromolecular network and drag coal devolatilization to lower temperatures, while AAEM species originating from biomass or coal ash alter surface oxygen functionalities and char porosity, thereby tuning the extent and temperature window of synergy [26,27,28,29].
Volatile–char interaction studies provide additional mechanistic support. An et al. [63] demonstrated using a two-stage microwave reactor that secondary pyrolysis reactions—specifically decarbonylation, decarboxylation, and demethylation of tar over char surfaces—are the primary drivers of synergy during lignite–biomass co-pyrolysis, rather than hydrogen donation during primary reactions. Ma et al. [75] and Gao et al. [25] further showed, using staged fixed-bed decoupling reactors combined with XPS, FTIR, and Raman analyses, that biomass-derived volatiles can significantly alter the oxygen-containing functional groups and carbon microstructure of coal-derived chars. For Ca-rich systems specifically, Zhao et al. [70] showed via in-situ FTIR and XPS that calcium interacts with carboxyl groups in Shengli lignite during co-pyrolysis to form active Ca–C sites and intermediate Ca–O–C structures, which increase the defect density of char and lower the onset temperature of subsequent gasification by approximately 150 °C. Wang et al. [73] further demonstrated through demineralization experiments that catalytically active K and Ca species from corncob can interact with aluminosilicate minerals in coal to form inert phases such as Ca2SiO4, attenuating the overall catalytic effect. These observations suggest that the extent of Ca-mediated synergy depends on the balance between catalytic promotion and mineral-induced deactivation—a consideration directly relevant to our high-ash, CaCO3-rich Soma lignite system. In ternary systems, this interplay may be further modulated by the presence of two compositionally distinct biomasses. Puig-Gamero et al. [76] reported that ternary co-gasification of coal, petcoke, and olive pomace exhibited synergy patterns that differed from binary pairs, with dolomite (CaCO3MgCO3) enhancing both reactivity and H2/CO ratio. In our system, the combination of a pectin/hemicellulose-rich biomass (SBP) with a cellulose/lignin-rich biomass (HH) may generate complementary radical pools across a broader temperature range, sustaining synergistic volatile–char interactions that a single biomass cannot maintain alone. However, this hypothesis remains qualitative in the absence of direct gas-phase analysis in the present study.
In summary, the 40SL + 30SBP + 30HH blend consistently yields negative values across all investigated temperature zones (Region I: –0.264; Region II: –0.597; Region III: –0.746), demonstrating the most robust and broad-spectrum synergistic effect. Liu et al. [2] reported that their Coal75–Bio25 blend showed the most pronounced synergy; the difference observed here is attributed to the ternary blending dynamics (the combined contribution of SBP and HH) and structural variations in the feedstocks. The primary mechanism of co-pyrolysis synergy is widely accepted to be the generation of free radicals (H•, OH•) from low-temperature biomass volatiles, which inhibit the cross-linking of the macromolecular coal structure, thereby promoting further volatile release [2,62]. It should be noted, however, that the synergy reported here is specific to the present experimental conditions (10 K/min, N2 atmosphere, TGA scale). Haykiri-Açma and Yaman [71] observed synergistic effects on reactivity-related parameters (Rmax, HFmax) but essentially additive behavior for characteristic temperatures during co-combustion of biochar and lignite, illustrating that synergy is parameter-specific rather than universal. Merdun and Laougé [72] quantified synergy through the deviation between experimental and calculated activation energies during co-pyrolysis of lignite and sewage sludge using FWO, Starink, and Vyazovkin models, demonstrating that multi-rate iso-conversional analysis provides a more robust criterion for synergy identification. Furthermore, the mechanistic statements regarding radical transfer, AAEM catalysis, and Ca–organic interactions presented here are inferred from TG/DTG trends and supporting literature; direct confirmation would require complementary gas-phase analysis (e.g., TG–MS or TG–FTIR) and detailed kinetic modelling at multiple heating rates, which are identified as priorities for future work.
Beyond the fundamental thermochemical insights, the practical sustainability implications of the present findings merit emphasis. Türkiye generates approximately 5–6 million tonnes of sugar beet pulp annually [10], and hazelnut processing residues exceed 500,000 tonnes per year in the Black Sea region alone [17]. These biomass streams are currently underutilized and often disposed of through open burning or uncontrolled landfilling, both of which contribute to greenhouse gas emissions and soil/water contamination [12]. Redirecting even a fraction of these residues into co-pyrolysis with domestically mined Soma lignite would simultaneously (i) reduce the demand for imported fossil fuels, (ii) divert agricultural waste from environmentally harmful disposal routes, and (iii) lower the carbon intensity of lignite-based energy systems by displacing a portion of the fossil carbon with biogenic carbon. The 40:30:30 blend identified as optimal in this study would require roughly equal masses of the two biomass types, which is logistically feasible given their overlapping harvest and processing seasons in central and northern Anatolia. These considerations position ternary co-pyrolysis as a tangible contribution to circular bioeconomy strategies for coal-dependent regions.
3.4. DTG Deconvolution and Pseudo-Component Analysis
DTG deconvolution parameters for the pure samples and their blends are presented in Table 7. The DTG curves were deconvolved into four pseudo-component Gaussian functions within the framework of the Independent Parallel Reaction (IPR) model. The parallel reaction model assumes that the lignocellulosic components of biomass decompose independently, and DTG deconvolution is extensively utilized to resolve the relative contributions of these components [21,23]. The four pseudo-components are defined as follows:
Table 7.
DTG Deconvolution parameters for the pure samples and their blends.
- P1 (Hemicellulose-like): Low-temperature peak corresponding to pectin and hemicellulose decomposition.
- P2 (Cellulose-like): Sharp intermediate-temperature peak corresponding to cellulose decomposition.
- P3 (Lignin/Early Coal): Broad peak representing overlapping lignin decomposition and early-stage coal devolatilization.
- P4 (Main Coal): High-temperature coal devolatilization and mineral (CaCO3) decomposition peak.
This four-peak model selection is essential to distinguish both the lignocellulosic fractions and the coal phase in a ternary (biomass + biomass + coal) blend. Manyà et al. [45] utilized 3 pseudo-components for sugarcane bagasse pyrolysis and demonstrated that a third-order reaction model for lignin provided a better fit than a first-order approach. Introducing a “coal phase” as a fourth pseudo-component is a standard approach for coal+biomass systems.
3.5. Deconvolution Parameters
3.5.1. Deconvolution Interpretation of Pure Components
Soma Lignite: The dominant pseudo-components in the DTG deconvolution of the lignite are P3 (Lignin/Early Coal; = 446 °C, area = 50.54%) and P4 (Main Coal; = 700 °C, area = 44.18%), which together account for 94.72% of the total area. The contributions of P1 and P2 are negligible (5.23% and 0.05%), consistent with the absence of lignocellulosic fractions in lignite. The lower fit quality ( = 0.84) reflects the challenge of accurately describing the complex organic/inorganic structure and the broad decomposition range of lignite with four simple Gaussian functions (Table 7 and Figure 4a).
Figure 4.
Gaussian deconvolution of DTG curves for pure samples and ternary blends. Panels (a–c) represent individual feedstocks, while (d–g) illustrate the transition across various blending ratios. The results highlight the systematic downward shift of coal-related pseudo-components ( and ) in the presence of biomass, providing visual evidence of synergistic acceleration.
Sugar Beet Pulp: In SBP (Figure 4b), the dominant pseudo-component is P1 (Hemicellulose-like; = 283.1 °C, area = 67.13%), strongly aligning with SBP’s high pectin and hemicellulose content. P2 (Cellulose; = 339.0 °C, area = 15.72%) follows as expected (Table 7). A near-perfect fit with = 0.99 was achieved. Sidi-Yacoub et al. [11] similarly identified three distinct decomposition regions at analogous temperatures in their TG/FTIR analysis of SBP.
Hazelnut Husk: In HH (Figure 4c), P1 ( = 253.7 °C, area = 42.07%), P2 ( = 320.0 °C, area = 26.12%), and P3 ( = 391.5 °C, area = 25.89%) contribute almost equally. This distribution reveals that hazelnut husk has higher cellulose and lignin contents compared to SBP. The 25.89% contribution of P3 confirms a substantial lignin fraction in the hazelnut husk [19]. An excellent fit of = 1.00 was achieved (Table 7).
3.5.2. Pseudo-Component Shifts in Blends
80SL + 10SBP + 10HH: P3 (Lignin/Early Coal) remains dominant (Figure 4d) with an area of 46.67% and = 431.6 °C. P4 (Main Coal; area = 27.23%) ranks second. These two coal-centric pseudo-components account for 73.90% of the total area, confirming that the lignite still dictates the thermal behavior. While the fit quality improved relative to pure lignite ( = 0.90), it remains comparatively low, likely because the biomass peaks are buried within the lignite matrix at this low blending ratio, hindering the deconvolution process.
60SL + 20SBP + 20HH: As the biomass ratio increases, the contributions of P1 (area = 33.15%) and P2 (area = 10.52%) rise markedly. Although P3 ( = 420.0 °C, area = 39.13%) is still the largest pseudo-component (Figure 4e), the strengthening of P1 indicates a more pronounced biomass devolatilization. The P4 peak temperature drops to 693.3 °C; this shift correlates with the strong negative observed in the 650–720 °C region during the synergy analysis. improves to 0.97 (Table 7).
40SL + 30SBP + 30HH: In this blend, P1 (area = 43.80%) becomes the most dominant pseudo-component (Figure 4f), validating the growing dominance of the biomass fraction. P3 (area = 32.90%, = 411.7 °C) falls to the second position, and its value shifts from 446 °C in pure lignite to 411.7 °C (Table 7 and Figure 4f). This shift (–34.3 °C) suggests that the volatiles emitted from the biomass drag coal devolatilization to lower temperatures, an explicit indicator of synergistic interactions [2,43]. The P4 peak temperature also declines to 685.2 °C. A near-perfect fit is achieved ( = 0.99).
20SL + 40SBP + 40HH: At the highest biomass ratio, P1 (area = 52.59%) is unambiguously the dominant pseudo-component (Figure 4g). P2 (area = 15.32%) approaches the levels observed in pure SBP. P3 (area = 25.66%, = 410.3 °C) and P4 (area = 6.42%, = 672.5 °C) diminish to their minimum values. The decline of the total coal phase (P3 + P4) contribution to 32.08% demonstrates that the blend’s thermal behavior is almost entirely driven by the biomass. is 0.99. Chen et al. [77] similarly demonstrated that at high biomass blending ratios, Gaussian deconvolution is dominated by biomass pseudo-components (Table 7).
3.5.3. Pseudo-Component Area and Peak Shift Trends
Evaluating all blends collectively reveals the following systematic trends (Figure 5):
Figure 5.
Evolution of pseudo-component properties as a function of biomass blending ratio. Panel (a) illustrates the quantitative transition in area fractions, whereas Panel (b) highlights a key indicator of synergistic interactions: the monotonic downward shift in for the and peaks as biomass fraction increases. This trend suggests that biomass-derived volatiles promote earlier devolatilization of coal-related pseudo-components and mineral-phase decomposition, consistent with a chemical promotion effect rather than purely physical dilution.
- P1 (Hemicellulose-like) area: Increases linearly with the biomass blending ratio (20.23% → 52.59%). The value remains relatively constant within the 271–277 °C range, indicating that the hemicellulose/pectin decomposition temperature is independent of the blend ratio.
- P2 (Cellulose-like) area: Similarly increases (5.87% → 15.32%). The value remains stable around ∼329–333 °C, closely aligning with the ∼341 °C cellulose peak reported by Sidi-Yacoub et al. [11].
- P3 (Lignin/Early Coal) area: Decreases (46.67% → 25.66%); more importantly, the value drops from 431.6 °C to 410.3 °C. This –21.3 °C shift is compelling evidence that biomass shifts coal devolatilization to lower temperatures, robustly supporting the synergy findings [43].
- P4 (Main Coal) area: Drops sharply (27.23% → 6.42%); the value also shifts from 700 °C to 672.5 °C. This shift is consistent with the powerful synergistic effect observed in the CaCO3 decomposition zone.
To strengthen the logical correlation between peak shifts and synergistic effects, Figure 5b demonstrates a systematic reduction in the center temperatures () of the coal-related pseudo-components ( and ) as the biomass fraction increases. This downward shift is not merely a numerical artifact of the deconvolution procedure but is consistent with a modified reaction environment in which early release of volatiles from (hemicellulose/pectin) and (cellulose) creates a radical-rich atmosphere that facilitates the decomposition of the rigid lignite matrix at lower temperatures. The close correspondence between these shifts and the temperature windows where negative values are observed (Figure 3) supports a plausible mechanistic link, namely that the acceleration of coal devolatilization is driven by chemical interactions with biomass-derived degradation products rather than by simple additive behavior. It should be noted that the P1 pseudo-component in the blends includes contributions from both biomass-derived hemicellulose/pectin and low-temperature volatile release from Soma lignite, as evidenced by the non-zero P1 area (5.23%) observed for pure SL (Table 7). The P1 area values reported for the blends therefore represent upper-bound estimates of the biomass contribution in this temperature window.
3.5.4. Goodness of Fit and Model Adequacy
The goodness of fit () ranges between 0.90 and 1.00 for all samples (excluding pure lignite at 0.84), confirming that the four-Gaussian IPR model provides an adequate description of this co-pyrolysis system. Comparison of key thermal and kinetic parameters with the literature are presented in Table 8. Kim et al. [23] successfully reproduced the DTG curves of four types of woody biomass with an n-th order TPRM approach, achieving a deviation of only 1.78%. Lei et al. [22] achieved by separating peanut shell pyrolysis into three pseudo-components using Gaussian deconvolution. The lower value for pure lignite highlights that the heterogeneous organic/inorganic matrix and continuous multiphase decomposition between 200–750 °C cannot be perfectly captured by simple Gaussian functions; improvements might be achieved using asymmetric functions (e.g., Fraser–Suzuki, bi-Gaussian) [78].
Table 8.
Comparison of key thermal and kinetic parameters with the literature.
The present work is intentionally limited to macro-thermal behavior and synergy assessment at a single heating rate (10 °C/min). While multi-rate, iso-conversional kinetic analysis would provide detailed activation energy distributions, such an extension requires additional experiments and is therefore beyond the scope of this study. We instead focus on TG/DTG trends, / indices, and pseudo-component deconvolution as comparative indicators of reactivity and synergy. Future research could expand upon these findings by incorporating multi-heating rate experiments to derive global kinetic parameters and employing evolved gas analysis (TG-FTIR/MS) to further elucidate the chemical pathways of ternary interactions.
4. Conclusions
This study systematically investigated the ternary co-pyrolysis behavior of Soma lignite (SL), sugar beet pulp (SBP), and hazelnut husk (HH) blends using thermogravimetric analysis, deviation-based synergy metrics, and Gaussian pseudo-component deconvolution. The results showed that increasing the biomass fraction from 20 wt.% to 80 wt.% shifted the onset of major devolatilization from 335.2 °C to 246.7 °C and increased the overall mass loss from 45.48% to 68.37%, confirming that SBP and HH significantly enhance the reactivity of Soma lignite. Synergy analysis based on mass-based deviation () and the rate-based index () revealed that the 40:30:30 SL:SBP:HH blend exhibits the most persistent and pronounced synergistic effects across all temperature regions, with the strongest promotion occurring in the 650–720 °C interval associated with CaCO3 decomposition.
Gaussian deconvolution of DTG curves into four pseudo-components (P1–P4) further clarified the mechanistic basis of these interactions. As the biomass share increased, the hemicellulose/pectin-like contribution (P1) rose from 20.23% to 52.59%, while the combined coal-related fraction (P3+P4) decreased from 73.90% to 32.08%, indicating a progressive transition from coal-dominated to biomass-dominated thermal behavior. Concurrently, the characteristic temperatures of the lignin/early-coal pseudo-component (P3) and the main coal pseudo-component (P4) shifted downward by 21.3 °C and 27.5 °C, respectively, demonstrating that biomass-derived volatiles drag coal devolatilization to lower temperatures in line with the synergy trends. The four-Gaussian IPR framework achieved values between 0.90 and 0.99 for all blends, confirming its adequacy for describing complex ternary co-pyrolysis systems.
Overall, the findings demonstrate that co-pyrolyzing Soma lignite with sugar beet pulp and hazelnut husk is an effective route to enhance devolatilization intensity, lower characteristic reaction temperatures, and exploit favorable synergistic interactions, particularly at intermediate blending levels such as 40:30:30. These insights provide a quantitative basis for designing lignite–biomass co-processing strategies that couple domestic low-rank coal resources with regionally abundant agricultural by-products to improve thermochemical performance and support more sustainable fuel utilization pathways.
From a broader sustainability standpoint, the demonstrated ability of ternary co-pyrolysis to enhance fuel quality, reduce pollutant precursors, and valorize regionally abundant agricultural residues underscores its potential as a transitional strategy for coal-dependent economies seeking to reconcile energy security with environmental responsibility.
Future work will extend this ternary system to multi-rate TGA and iso-conversional kinetic analysis to quantitatively resolve the activation energy landscape of the synergistic interactions.
Funding
This research received no external funding.
Institutional Review Board Statement
Not applicable.
Informed Consent Statement
Not applicable.
Data Availability Statement
The raw data will be made available by the authors on request.
Acknowledgments
During the preparation of this manuscript, the author used Gemini 3.1 Pro (Google) to assist in generating the graphical abstract and the conceptual mechanism illustrated in Figure 2. The author has independently reviewed, verified, and edited all AI-generated suggestions and takes full responsibility for the final content and integrity of this publication.
Conflicts of Interest
The authors declare no conflicts of interest.
References
- Brat, Z.; Janković, B.; Stojiljković, D.; Radojević, M.; Manić, N. Assessment of synergistic effect on performing the co-pyrolysis process of coal and waste blends based on thermal analysis. Therm. Sci. 2022, 26, 2211–2224. [Google Scholar] [CrossRef] [Scilit]
- Liu, N.; Huang, H.; Huang, X.; Li, R.; Feng, J.; Wu, Y. Co-pyrolysis behavior of coal and biomass: Synergistic effect and kinetic analysis. ACS Omega 2024, 9, 31803–31813. [Google Scholar] [CrossRef] [Scilit]
- Güleç, F.; Parthiban, A.; Umenweke, G.C.; Musa, U.; Williams, O.; Mortezaei, Y.; Suk-Oh, H.; Lester, E.; Ogbaga, C.C.; Gunes, B.; et al. Progress in lignocellulosic biomass valorization for biofuels and value-added chemical production in the EU: A focus on thermochemical conversion processes. Biofuels Bioprod. Biorefining 2024, 18, 755–781. [Google Scholar] [CrossRef] [Scilit]
- Alobaid, F.; Ströhle, J. Special Issue “Thermochemical Conversion Processes for Solid Fuels and Renewable Energies”. Appl. Sci. 2021, 11, 1907. [Google Scholar] [CrossRef] [Scilit]
- Panwar, N.L.; Paul, A.S. An overview of recent development in bio-oil upgrading and separation techniques. Environ. Eng. Res. 2021, 26, 200382. [Google Scholar] [CrossRef] [Scilit]
- Wu, Z.; Wang, S.; Zhao, J.; Chen, L.; Meng, H. Synergistic effect on thermal behavior during co-pyrolysis of lignocellulosic model components blend with bituminous coal. Bioresour. Technol. 2014, 169, 220–228. [Google Scholar] [CrossRef] [Scilit] [PubMed]
- İnal, S.; Yasar, Ö.; Aydıner, K. Importance of Domestic Coal (Lignite) Reserves on Turkey’s Energy Independency. MT Bilimsel 2021, 19, 11–32. [Google Scholar]
- Oskay, R.G.; Inaner, H.; Karayigit, A.I.; Christanis, K. Coal deposits of Turkey: Properties and importance on energy demand. Bull. Geol. Soc. Greece 2013, 47, 2111–2120. [Google Scholar] [CrossRef] [Scilit]
- Magalhães, D.; Kazanç, F.; Riaza, J.; Erensoy, S.; Kabaklı, Ö.; Chalmers, H. Combustion of Turkish lignites and olive residue: Experiments and kinetic modelling. Fuel 2017, 203, 868–876. [Google Scholar] [CrossRef] [Scilit]
- Usmani, Z.; Sharma, M.; Diwan, D.; Tripathi, M.; Whale, E.; Jayakody, L.N.; Moreau, B.; Kumar Thakur, V.; Tuohy, M.; Kumar Gupta, V. Valorization of sugar beet pulp to value-added products: A review. Bioresour. Technol. 2022, 346, 126580. [Google Scholar] [CrossRef] [Scilit] [PubMed]
- Sidi-Yacoub, B.; Oudghir, F.; Belkadi, M.; Rodríguez Barroso, M.d.R. Characterization of lignocellulosic components in exhausted sugar beet pulp waste by TG/FTIR analysis. J. Therm. Anal. Calorim. 2019, 138, 1801–1809. [Google Scholar] [CrossRef] [Scilit]
- Makambai Kyzy, A.; Mazhitova, A. Biotechnological valorization of sugar beet wastes into value-added products. MANAS J. Eng. 2023, 11, 136–144. [Google Scholar] [CrossRef] [Scilit]
- Ozbas, K.E.; Ozboy Ozbas, O. Sugar beet pulp as biomass. Sugar Ind./Zuckerind. 2017, 142, 29–32. [Google Scholar] [CrossRef] [Scilit]
- Yılgın, M.; Deveci-Duranay, N.; Pehlivan, D. Co-pyrolysis of lignite and sugar beet pulp. Energy Convers. Manag. 2010, 51, 1060–1064. [Google Scholar] [CrossRef] [Scilit]
- Devrim, Y.G. Pyrolysis Kinetics of Blends of Yeni Çeltek Lignite and Sugar Beet Pulp. Energy Sources Part A Recovery Util. Environ. Eff. 2007, 30, 238–246. [Google Scholar] [CrossRef] [Scilit]
- Helgi Library. Hazelnut Production in Turkey. 2023. Available online: https://www.helgilibrary.com/indicators/hazelnut-production/turkey/ (accessed on 11 March 2026).
- Balcı-Kuru, E.; Ertuğrul, Ö. Determination of the energy potential of hazelnut residues in Ordu, Türkiye. GU J. Sci. Part A 2024, 11, 767–780. [Google Scholar] [CrossRef] [Scilit]
- Sezer, S.; Özveren, U. Investigation of hazelnut husk combustion by using a novel non-linear kinetic model through thermogravimetric analysis. Sak. Univ. J. Sci. 2021, 25, 326–338. [Google Scholar] [CrossRef] [Scilit]
- Ceylan, S.; Topçu, Y. Pyrolysis kinetics of hazelnut husk using thermogravimetric analysis. Bioresour. Technol. 2014, 156, 182–188. [Google Scholar] [CrossRef] [Scilit]
- Chen, X.; Liu, L.; Zhang, L.; Zhao, Y.; Qiu, P. Pyrolysis Characteristics and Kinetics of Coal–Biomass Blends during Co-Pyrolysis. Energy Fuels 2019, 33, 1267–1278. [Google Scholar] [CrossRef] [Scilit]
- Anca-Couce, A.; Berger, A.; Zobel, N. How to determine consistent biomass pyrolysis kinetics in a parallel reaction scheme. Fuel 2014, 123, 230–240. [Google Scholar] [CrossRef] [Scilit]
- Lei, J.; Yang, L.; Wang, Y.; Zhao, D. Pyrolysis kinetics, mechanism and thermodynamics of peanut shell based on Gaussian function deconvolution. Heliyon 2025, 11, e42800. [Google Scholar] [CrossRef] [Scilit]
- Kim, H.; Yu, S.; Kim, M.; Ryu, C. Progressive deconvolution of biomass thermogram to derive lignocellulosic composition and pyrolysis kinetics for parallel reaction model. Energy 2022, 254, 124446. [Google Scholar] [CrossRef] [Scilit]
- Hu, J.; Si, Y.; Yang, H.; Shao, J.; Wang, X.; Lei, T.; Agblevor, F.A.; Chen, H. Influence of volatiles-char interactions between coal and biomass on the volatiles released, resulting char structure and reactivity during co-pyrolysis. Energy Convers. Manag. 2017, 152, 229–238. [Google Scholar] [CrossRef] [Scilit]
- Gao, Y.; Xu, C.; Cui, D.; Rout, L.; Ding, K.; Shi, L.; Zhang, S.; Lv, P.; Li, B.; Yu, G.; et al. Decoupling study on the influence of the interaction between biomass hydrochar and coal during co-pyrolysis on the char structure evolution. Renew. Energy 2024, 231, 120938. [Google Scholar] [CrossRef] [Scilit]
- Lin, B.; Zhou, J.; Qin, Q.; Song, X.; Luo, Z. Thermal behavior and gas evolution characteristics during co-pyrolysis of lignocellulosic biomass and coal: A TG-FTIR investigation. J. Anal. Appl. Pyrolysis 2019, 144, 104718. [Google Scholar] [CrossRef] [Scilit]
- Tian, B.; Zhao, W.; Guo, Q.; Tian, Y. A comprehensive understanding of synergetic effect and volatile interaction mechanisms during co-pyrolysis of rice husk and different rank coals. Energy 2022, 254, 124388. [Google Scholar] [CrossRef] [Scilit]
- Ma, M.; Wang, J.; Bai, Y.; Lv, P.; Song, X.; Su, W.; Ding, L.; Wei, J.; Yu, G. Deactivation mechanism of coal char gasification reactivity induced by cow manure biomass volatile–coal char interactions. Fuel 2021, 301, 121064. [Google Scholar] [CrossRef] [Scilit]
- Cao, Z.; Xu, Q.; Kang, H.; Shi, J.; Lu, X.; Chen, B.; Guo, L. Synergistic interactions between lignite and biomass during co-pyrolysis from volatile release, kinetics, and char structure. J. Energy Inst. 2024, 114, 101662. [Google Scholar] [CrossRef] [Scilit]
- Niksa, S. Simulating the Rapid Devolatilization of Mineral-Free Lignins. Polymers 2023, 15, 4043. [Google Scholar] [CrossRef] [Scilit]
- Haykiri-Acma, H.; Yaman, S.; Kucukbayrak, S. Comparison of the thermal reactivities of isolated lignin and holocellulose during pyrolysis. Fuel Process. Technol. 2010, 91, 759–764. [Google Scholar] [CrossRef] [Scilit]
- Guo, Z.; Bai, Z.; Bai, J.; Wang, Z.; Li, W. Synergistic effects during co-pyrolysis and liquefaction of biomass and lignite under syngas. J. Therm. Anal. Calorim. 2015, 119, 2133–2140. [Google Scholar] [CrossRef] [Scilit]
- Özbaş, K.E. Combustion Characterization of Cleaned and Raw Coals by Thermal Methods. Ph.D. Thesis, Middle East Technical University, Ankara, Türkiye, 2000. [Google Scholar]
- Özbaş, K.E.; Kök, M.V.; Hiçyılmaz, C. DSC study of the combustion properties of Turkish coals. J. Therm. Anal. Calorim. 2003, 71, 849–856. [Google Scholar] [CrossRef] [Scilit]
- ASTM E1756-01; Standard Test Method for Determination of Total Solids in Biomass. ASTM International: West Conshohocken, PA, USA, 2001.
- ASTM E872-82; Standard Test Method for Volatile Matter in the Analysis of Particulate Wood Fuels. ASTM International: West Conshohocken, PA, USA, 2006.
- ASTM E1755-01; Standard Test Method for Ash in Biomass. ASTM International: West Conshohocken, PA, USA, 2007.
- Channiwala, S.A.; Parikh, P.P. A unified correlation for estimating HHV of solid, liquid and gaseous fuels. Fuel 2002, 81, 1051–1063. [Google Scholar] [CrossRef] [Scilit]
- Yap, P.L.; Farivar, F.; Jämting, Å.K.; Coleman, V.A.; Gnaniah, S.; Mansfield, E.; Pu, C.; Landi, S.M.; David, M.V.; Flahaut, E.; et al. International Interlaboratory Comparison of Thermogravimetric Analysis of Graphene-Related Two-Dimensional Materials. Anal. Chem. 2023, 95, 5176–5186. [Google Scholar] [CrossRef] [Scilit]
- Losic, D.; Farivar, F.; Yap, P.L. Refining and Validating Thermogravimetric Analysis (TGA) for Robust Characterization and Quality Assurance of Graphene-Related Two-Dimensional Materials. C—J. Carbon Res. 2024, 10, 30. [Google Scholar] [CrossRef] [Scilit]
- Bensharada, M.; Telford, R.; Stern, B.; Gaffney, V. Loss on ignition versus thermogravimetric analysis: A comparative study to determine organic matter and carbonate content in sediments. J. Paleolimnol. 2022, 67, 191–197. [Google Scholar] [CrossRef] [Scilit]
- Chen, Z.; Zhao, M.; Liu, Y.; Lv, Y.; Khan, S.N.; Tariq, G.; Lu, J.; Dong, W.; Ji, G. Comprehensive pyrolysis characteristic and kinetic analysis of industrial-sludge and rice straw: Blending and pellet. J. Clean. Prod. 2024, 440, 140887. [Google Scholar] [CrossRef] [Scilit]
- Zhang, P.; Chen, Z.; Zhang, Q.; Zhang, S.; Ning, X.; Zhou, J. Co-pyrolysis characteristics and kinetics of low metamorphic coal and pine sawdust. RSC Adv. 2022, 12, 21725–21735. [Google Scholar] [CrossRef] [Scilit]
- Luo, G.; Wang, W.; Xie, W.; Tang, Y.; Xu, Y.; Wang, K. Co-pyrolysis of corn stover and waste tire: Pyrolysis behavior and kinetic study based on Fraser-Suzuki deconvolution procedure. J. Anal. Appl. Pyrolysis 2022, 168, 105743. [Google Scholar] [CrossRef] [Scilit]
- Manyà, J.J.; Velo, E.; Puigjaner, L. Kinetics of Biomass Pyrolysis: A Reformulated Three-Parallel-Reactions Model. Ind. Eng. Chem. Res. 2003, 42, 434–441. [Google Scholar] [CrossRef] [Scilit]
- Díez, D.; Urueña, A.; Piñero, R.; Barrio, A.; Tamminen, T. Determination of Hemicellulose, Cellulose, and Lignin Content in Different Types of Biomasses by Thermogravimetric Analysis and Pseudocomponent Kinetic Model (TGA-PKM Method). Processes 2020, 8, 1048. [Google Scholar] [CrossRef] [Scilit]
- TA Instruments. Deconvolution of Thermal Analysis Data Using Commonly Cited Mathematical Models; Application Note TA431; TA Instruments: New Castle, DE, USA, 2020. [Google Scholar]
- Ballice, L. Solvent swelling studies of Soma lignite (Turkey). Oil Shale 2004, 12, 115–123. [Google Scholar] [CrossRef] [Scilit]
- Karaca, F.; Bolat, E. Coprocessing of a Turkish lignite with a cellulosic waste material: 2. The effect of coprocessing on liquefaction yields at different reaction pressures and sawdust/lignite ratios. Fuel Process. Technol. 2002, 75, 109–116. [Google Scholar] [CrossRef] [Scilit]
- Barzegar, R.; Yozgatligil, A.; Atimtay, A.T. Combustion characteristics of Turkish lignites at oxygen-enriched and oxy-fuel combustion conditions. J. Energy Inst. 2019, 92, 1440–1450. [Google Scholar] [CrossRef] [Scilit]
- Barzegar, R.; Avsaroglu, S.; Yozgatligil, A.; Atimtay, A.T. Pyrolysis characteristics of Turkish lignites in N2 and CO2 environments. Energy Sources Part A Recovery Util. Environ. Eff. 2018, 40, 2467–2475. [Google Scholar] [CrossRef] [Scilit]
- Sınag, A. The Influence of Pyrolysis Conditions on the Reactivity of Soma-Işıklar Lignite (Turkey). Energy Sources 2004, 26, 127–134. [Google Scholar] [CrossRef] [Scilit]
- Sahu, S.G.; Sarkar, P.; Chakraborty, N.; Adak, A.K. Thermogravimetric assessment of combustion characteristics of blends of a coal with different biomass chars. Fuel Process. Technol. 2010, 91, 369–378. [Google Scholar] [CrossRef] [Scilit]
- Yogalakshmi, K.N.; Devi, T.P.; Sivashanmugam, P.; Kavitha, S.; Kannah, R.Y.; Varjani, S.; AdishKumar, S.; Kumar, G.; Rajesh Banu, J. Lignocellulosic biomass-based pyrolysis: A comprehensive review. Chemosphere 2022, 286, 131824. [Google Scholar] [CrossRef] [Scilit] [PubMed]
- García, R.; Pizarro, C.; Lavín, A.G.; Bueno, J.L. Characterization of Spanish biomass wastes for energy use. Bioresour. Technol. 2012, 103, 249–258. [Google Scholar] [CrossRef] [Scilit]
- Kamar, V.; Acar-Bozkurt, P. Co-pyrolysis of Different Coal Types with Biomass: Performance and Efficiency Evaluation by Thermogravimetric Analysis. Celal Bayar Univ. J. Sci. 2025, 21, 134–146. [Google Scholar] [CrossRef] [Scilit]
- Maj, G.; Borkowska, A.; Klimek, K.E.; Kordali, S.; Yılmaz, F. Comparative Analysis of Energy and Emission Properties of Hazelnut Shell Biomass from Temperate and Subtropical Climates. Energies 2025, 18, 5055. [Google Scholar] [CrossRef] [Scilit]
- Noszczyk, T.; Dyjakon, A.; Koziel, J.A. Kinetic parameters of nut shells pyrolysis. Energies 2021, 14, 1420. [Google Scholar] [CrossRef] [Scilit]
- Pfersich, J.; Arauzo, P.J.; Lucian, M.; Modu, P. Hydrothermal Conversion of Spent Sugar Beets into High-Value Platform Molecules. Molecules 2020, 25, 3914. [Google Scholar] [CrossRef] [Scilit] [PubMed]
- Kojić, I.; Achim, B.; Aleksić, N.; Životić, D.; Trifunović, S.; Gajica, G.; Stojanović, K. Study of the synergetic effect of co-pyrolysis of lignite and high-density polyethylene. Polymers 2021, 13, 759. [Google Scholar] [CrossRef] [Scilit]
- Slezak, R.; Krzystek, L.; Dziugan, P.; Ledakowicz, S. Co-pyrolysis of beet pulp and defecation lime in TG-MS system. Energies 2020, 13, 2304. [Google Scholar] [CrossRef] [Scilit]
- Quan, C.; Gao, N. Copyrolysis of biomass and coal: A review of effects of copyrolysis parameters, product properties, and synergistic mechanisms. BioMed Res. Int. 2016, 2016, 6197867. [Google Scholar] [CrossRef] [Scilit]
- An, Y.; Tahmasebi, A.; Yu, J. Mechanism of synergy effect during microwave co-pyrolysis of biomass and lignite. J. Anal. Appl. Pyrolysis 2017, 128, 75–82. [Google Scholar] [CrossRef] [Scilit]
- Zhang, C.; Li, S.; Ouyang, S.; Tsang, C.W.; Xiong, D.; Yang, K.; Zhou, Y.; Xiao, Y. Co-pyrolysis characteristics of camellia oleifera shell and coal in a TGA and a fixed-bed reactor. J. Anal. Appl. Pyrolysis 2021, 155, 105035. [Google Scholar] [CrossRef] [Scilit]
- Haykiri-Acma, H.; Yaman, S. Synergy in devolatilization characteristics of lignite and hazelnut shell during co-pyrolysis. Fuel 2007, 86, 373–380. [Google Scholar] [CrossRef] [Scilit]
- Wang, W.; Lemaire, R.; Bensakhria, A.; Luart, D. Review on the catalytic effects of alkali and alkaline earth metals (AAEMs) including sodium, potassium, calcium and magnesium on the pyrolysis of lignocellulosic biomass and on the co-pyrolysis of coal with biomass. J. Anal. Appl. Pyrolysis 2022, 163, 105479. [Google Scholar] [CrossRef] [Scilit]
- Yuan, R.; Yu, S.; Shen, Y. Pyrolysis and combustion kinetics of lignocellulosic biomass pellets with calcium-rich wastes from agro-forestry residues. Waste Manag. 2019, 87, 86–96. [Google Scholar] [CrossRef] [Scilit]
- Fei, J.; Zhang, J.; Wang, F.; Wang, J. Synergistic effects on co-pyrolysis of lignite and high-sulfur swelling coal. J. Anal. Appl. Pyrolysis 2012, 95, 61–67. [Google Scholar] [CrossRef] [Scilit]
- Arenas Castiblanco, E.; Henao Montoya, J.; Valencia Rincon, G.; Zapata-Benabithe, Z.; Gomez-Vasquez, R.; Camargo-Trillos, D.A. A new approach to obtain kinetic parameters of corn cob pyrolysis catalyzed with CaO and CaCO3. Heliyon 2022, 8, e10195. [Google Scholar] [CrossRef] [Scilit]
- Zhao, B.; Liu, L.; Liu, Q.; Li, N.; Zhou, H.; Ban, Y. Novel insight into calcium-catalyzed steam gasification behaviors of lignite. Fuel 2024, 377, 132773. [Google Scholar] [CrossRef] [Scilit]
- Haykiri-Acma, H.; Yaman, S. Synergistic investigation for co-combustion of biochars and lignite: Thermogravimetric analysis approach. J. Therm. Sci. Eng. Appl. 2018, 10, 061011. [Google Scholar] [CrossRef] [Scilit]
- Merdun, H.; Laougé, Z.B.; Çığgın, A.S. Synergistic effects on co-pyrolysis and co-combustion of sludge and coal investigated by thermogravimetric analysis. J. Therm. Anal. Calorim. 2021, 146, 2623–2637. [Google Scholar] [CrossRef] [Scilit]
- Wang, M.; Liang, F.; Tian, J.; Chang, L. Effects of mineral matters on the interactions between lignite and corncob during temperature-programmed co-pyrolysis. J. Therm. Anal. Calorim. 2019, 138, 1477–1486. [Google Scholar] [CrossRef] [Scilit]
- Wang, L.; Feng, J.; Song, Y.; Li, W.Y. Synergistic effects and its influencing factors during co-processing of coal and biomass in a wire-mesh reactor. J. Energy Inst. 2023, 108, 101261. [Google Scholar] [CrossRef] [Scilit]
- Ma, M.; Wang, J.; Bai, Y.; Lv, P.; Song, X.; Su, W.; Wei, J.; Yu, G. Decoupling of volatile–char interaction in co-pyrolysis of cow manure and bituminous coal and deactivation mechanism of coal char reactivity. Energy 2022, 251, 123891. [Google Scholar] [CrossRef] [Scilit]
- Puig-Gamero, M.; Lara-Díaz, J.; Valverde, J.L.; Sanchez-Silva, L.; Sánchez, P. Dolomite effect on steam co-gasification of olive pomace, coal and petcoke: TGA-MS analysis, reactivity and synergistic effect. Fuel 2018, 234, 142–150. [Google Scholar] [CrossRef] [Scilit]
- Chen, D.; Zhu, X.; Liu, Y.; Yuan, X.; Liu, Y.; Xu, Y.; Yu, F.; Niu, W.; Li, Z.; Hao, Y.; et al. Analysis of kinetics, thermodynamics and synergistic effect of pyrolysis products of corn stalk and polystyrene co-pyrolysis based on Gaussian deconvolution. SSRN Electron. J. 2024. [Google Scholar] [CrossRef] [Scilit]
- Li, W.; Huang, Y.; Liu, H.; Zhang, Y.; Jiang, Y.; Wang, Y.; Wan, J.; Yin, X. Kinetic and thermodynamic studies of biomass pseudo-components under thermo-oxidative degradation conditions using asymmetric function of Bi-Gaussian as deconvolution technique. Renew. Energy 2022, 188, 491–503. [Google Scholar] [CrossRef] [Scilit]
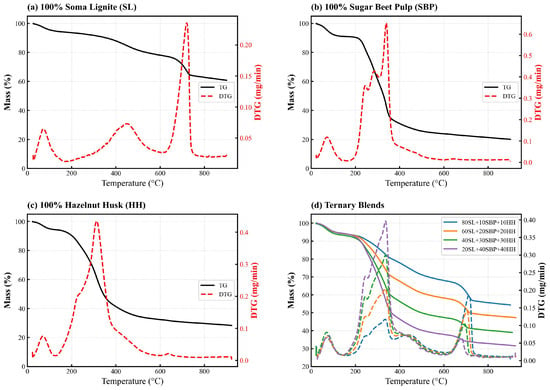
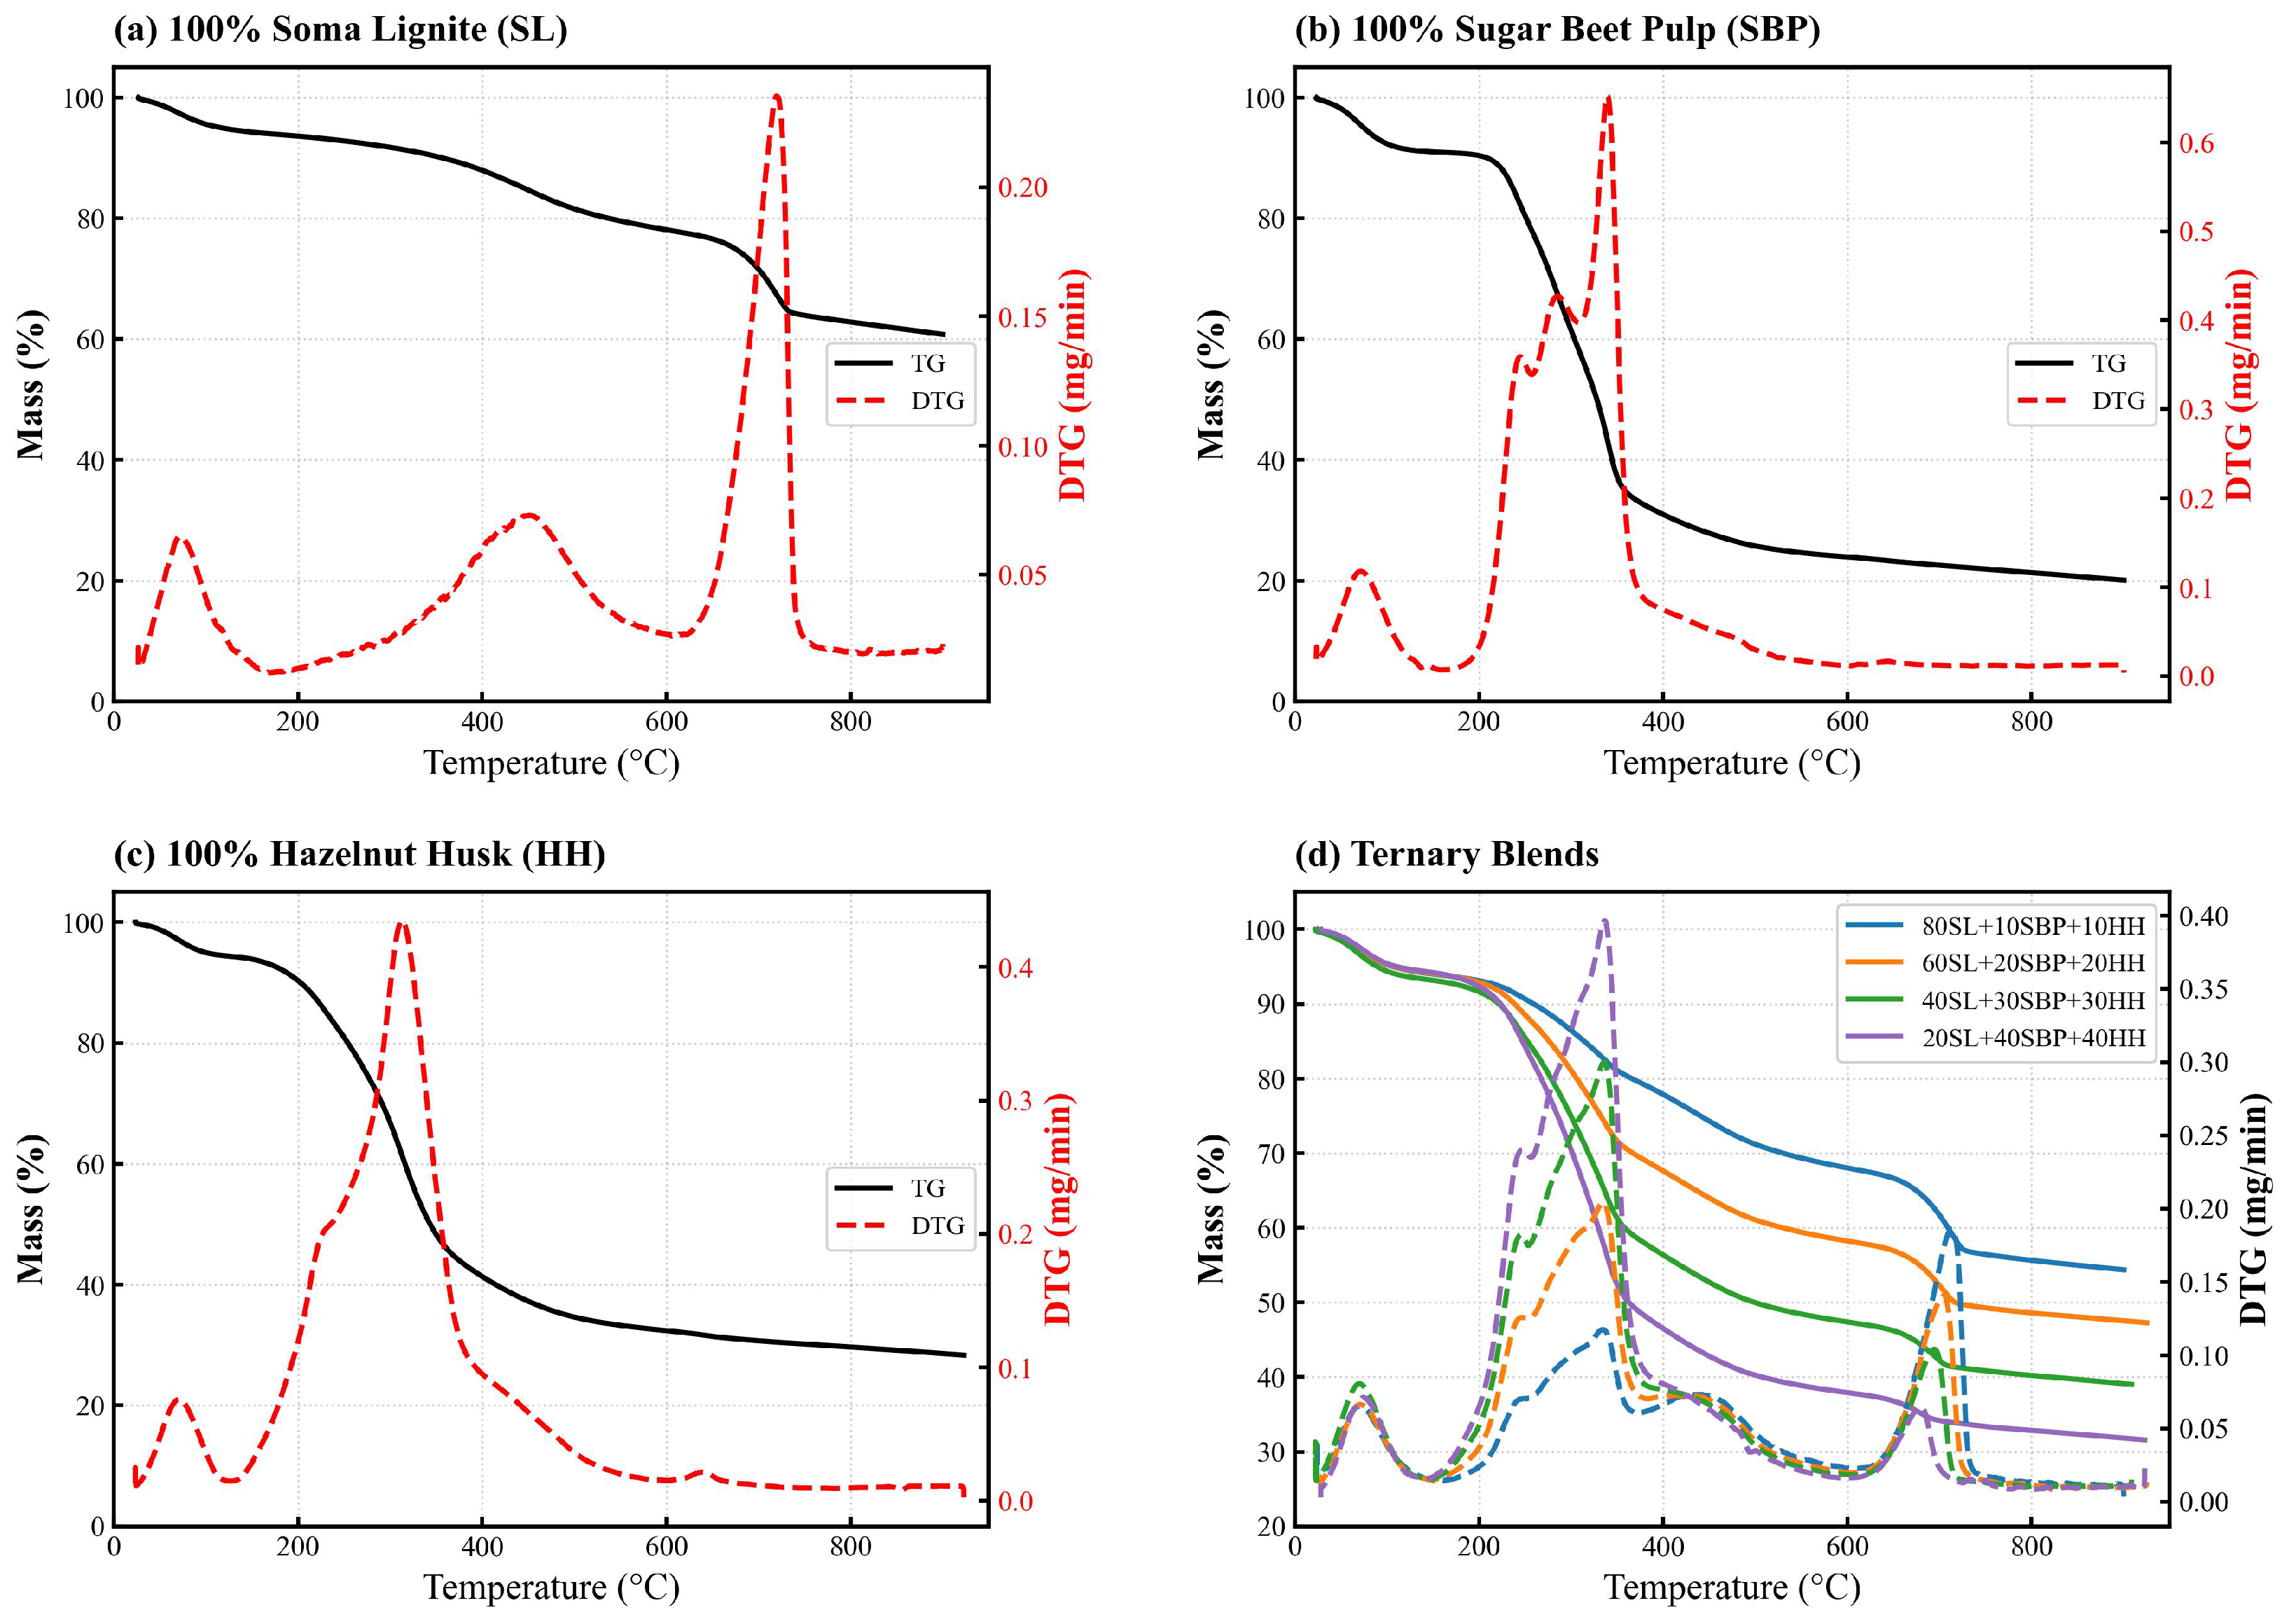
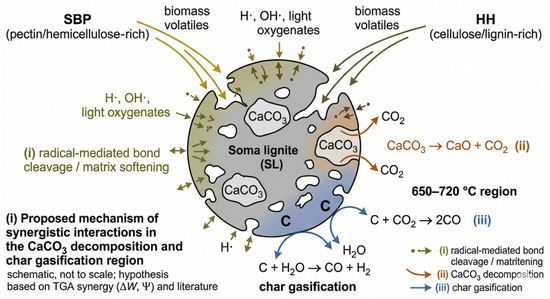
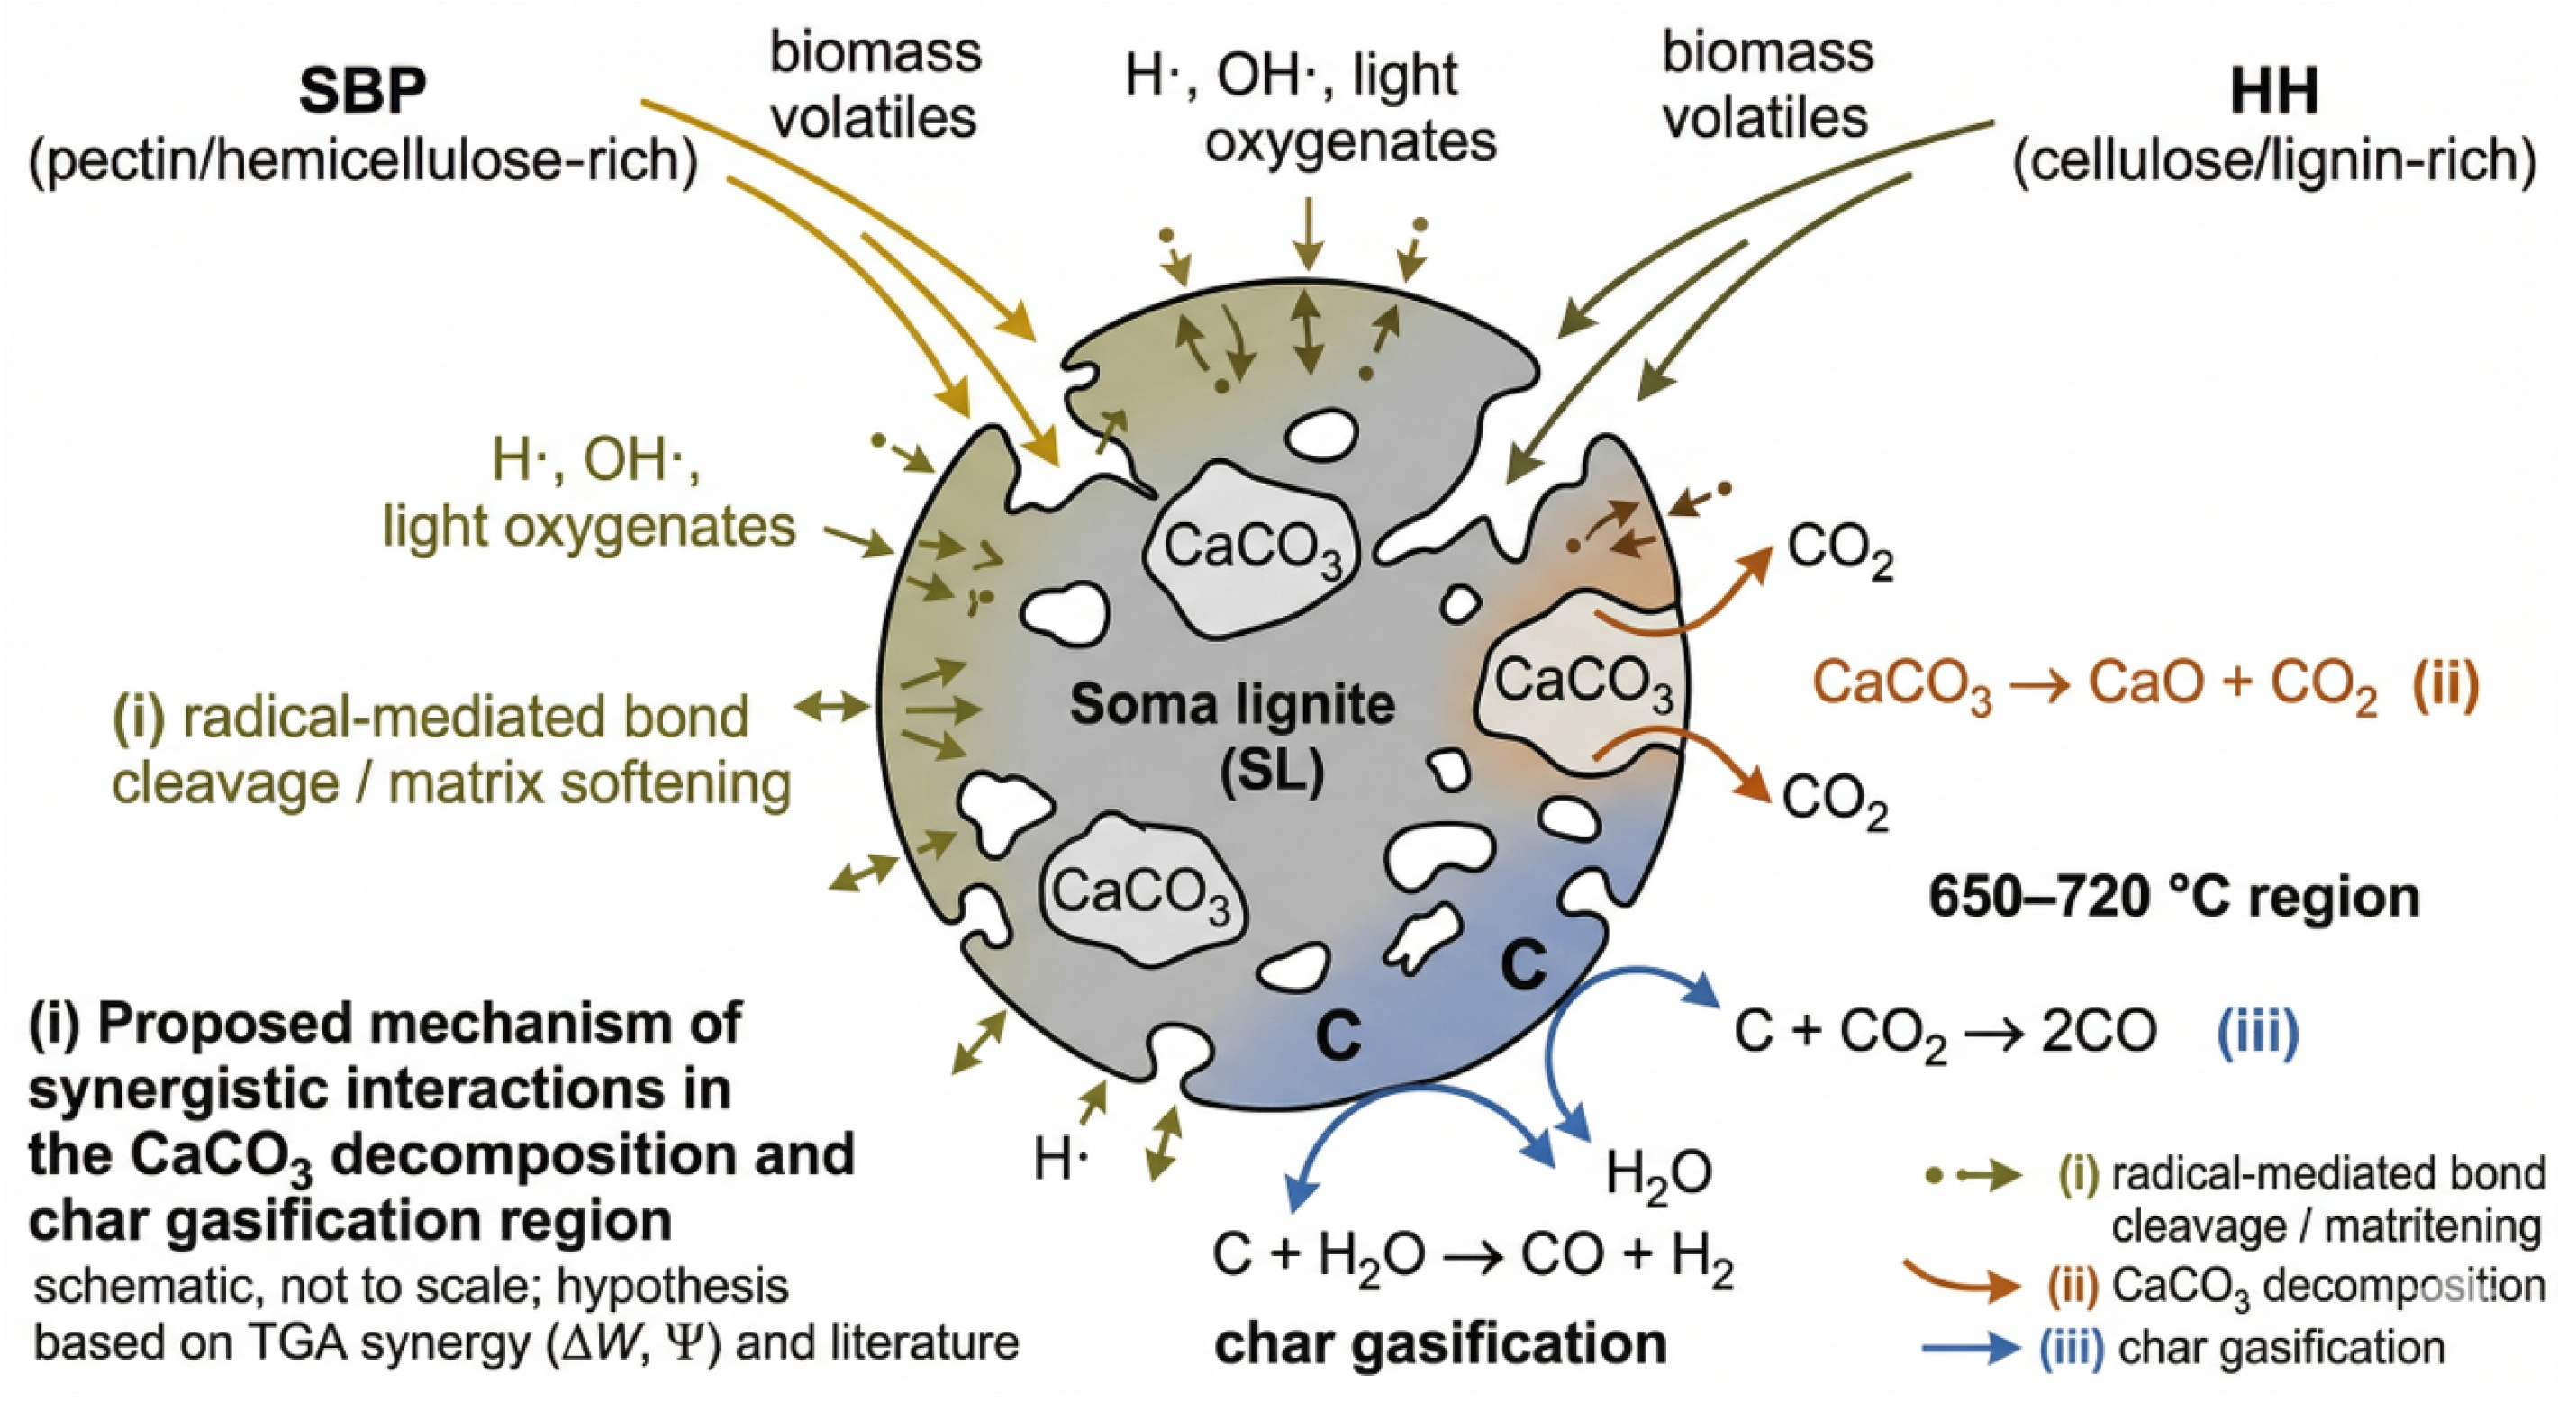
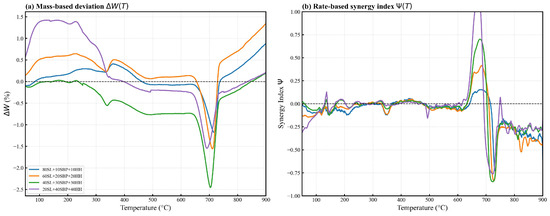
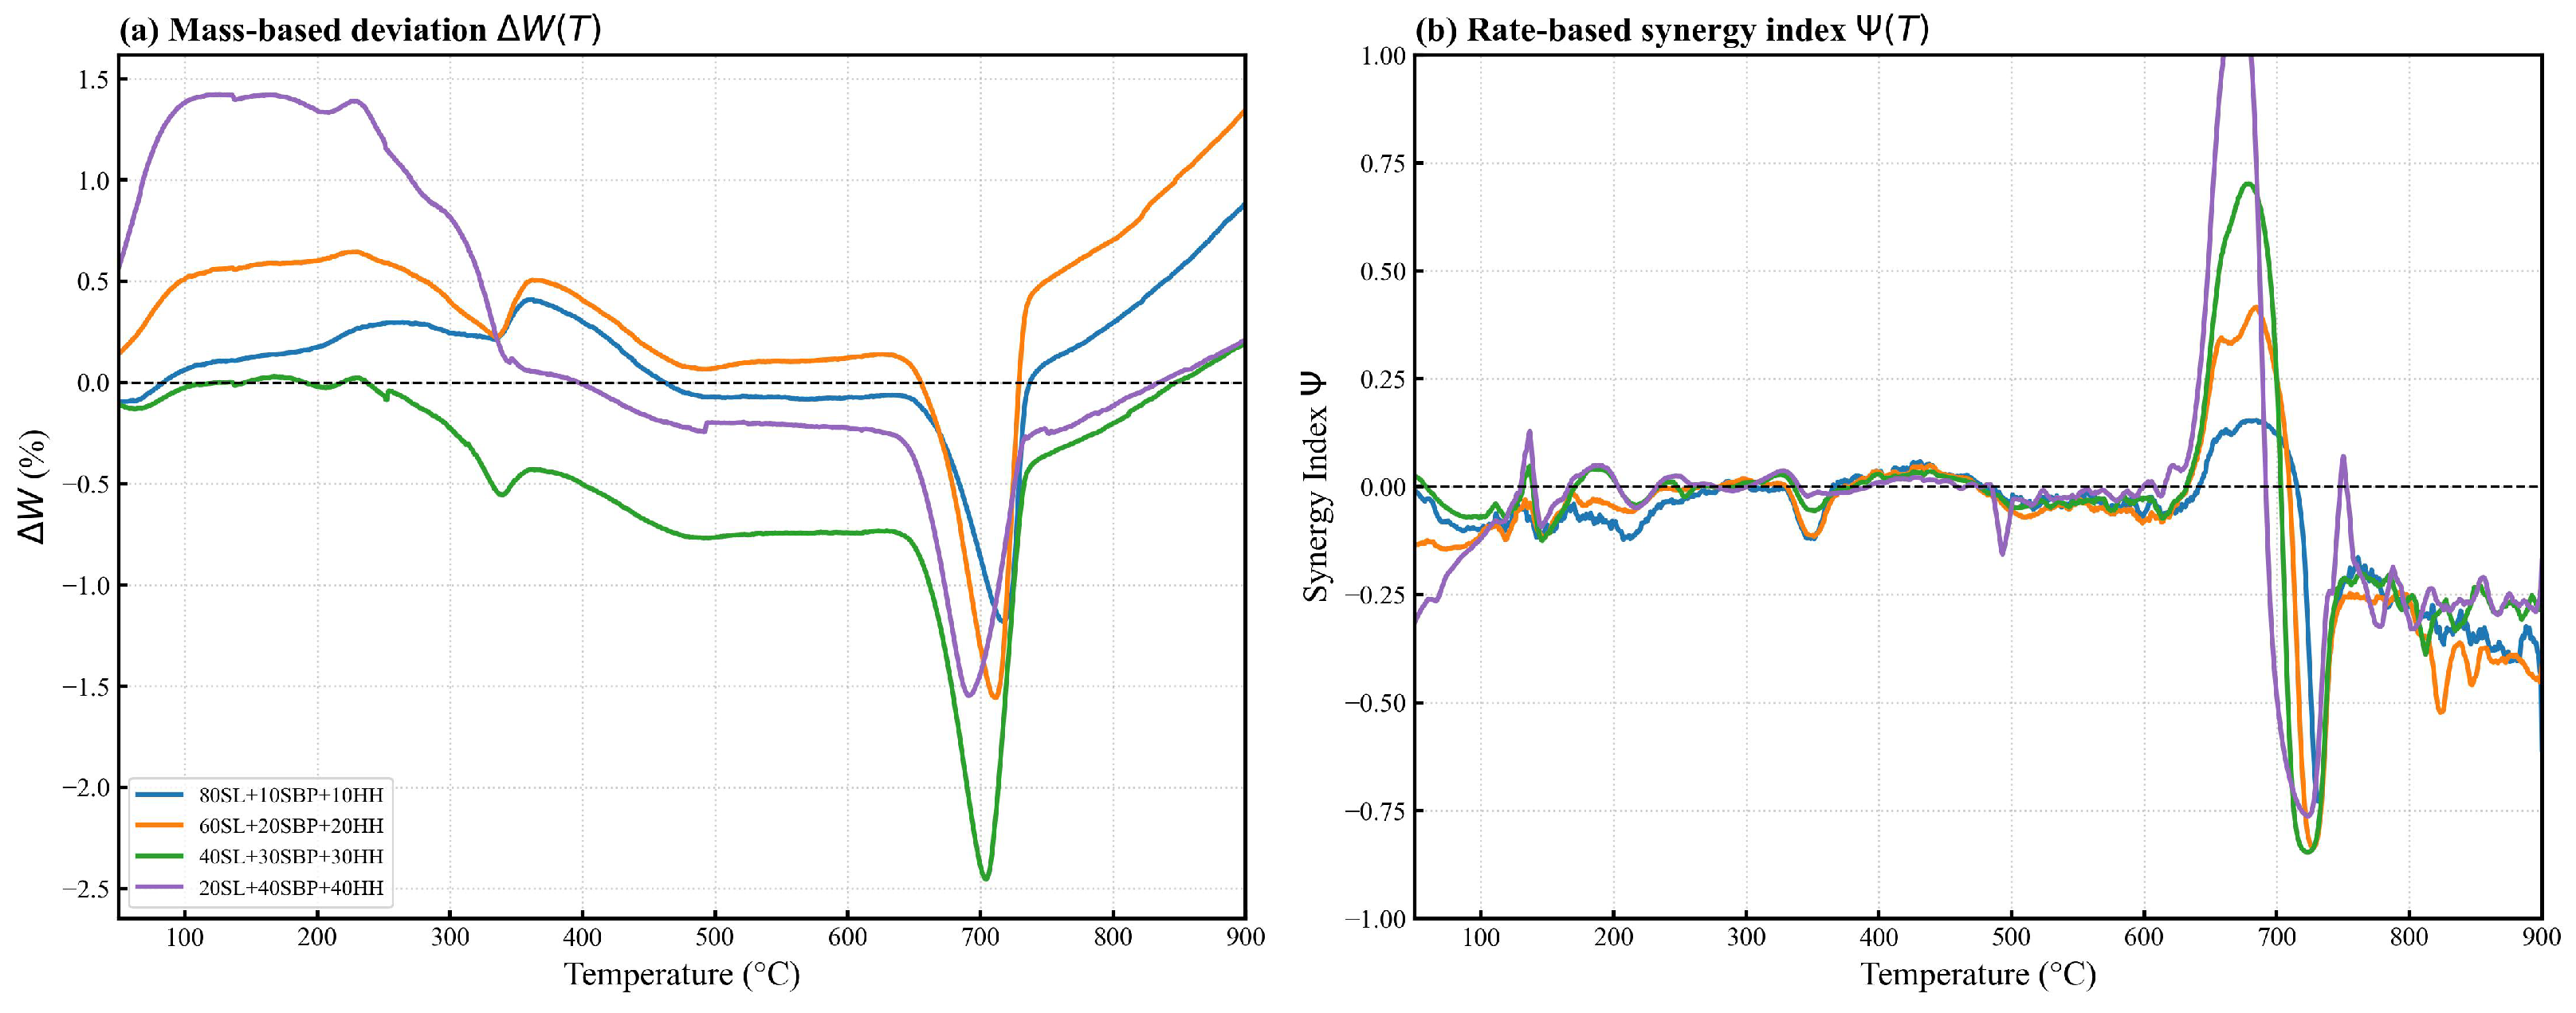
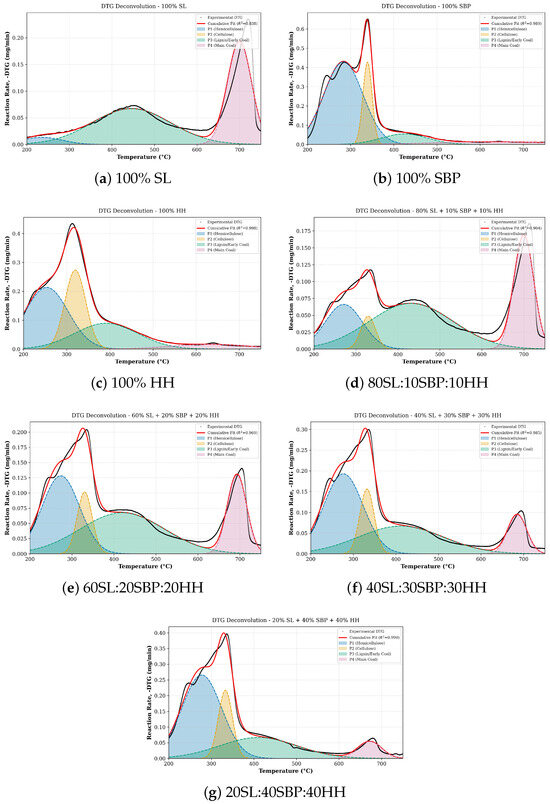
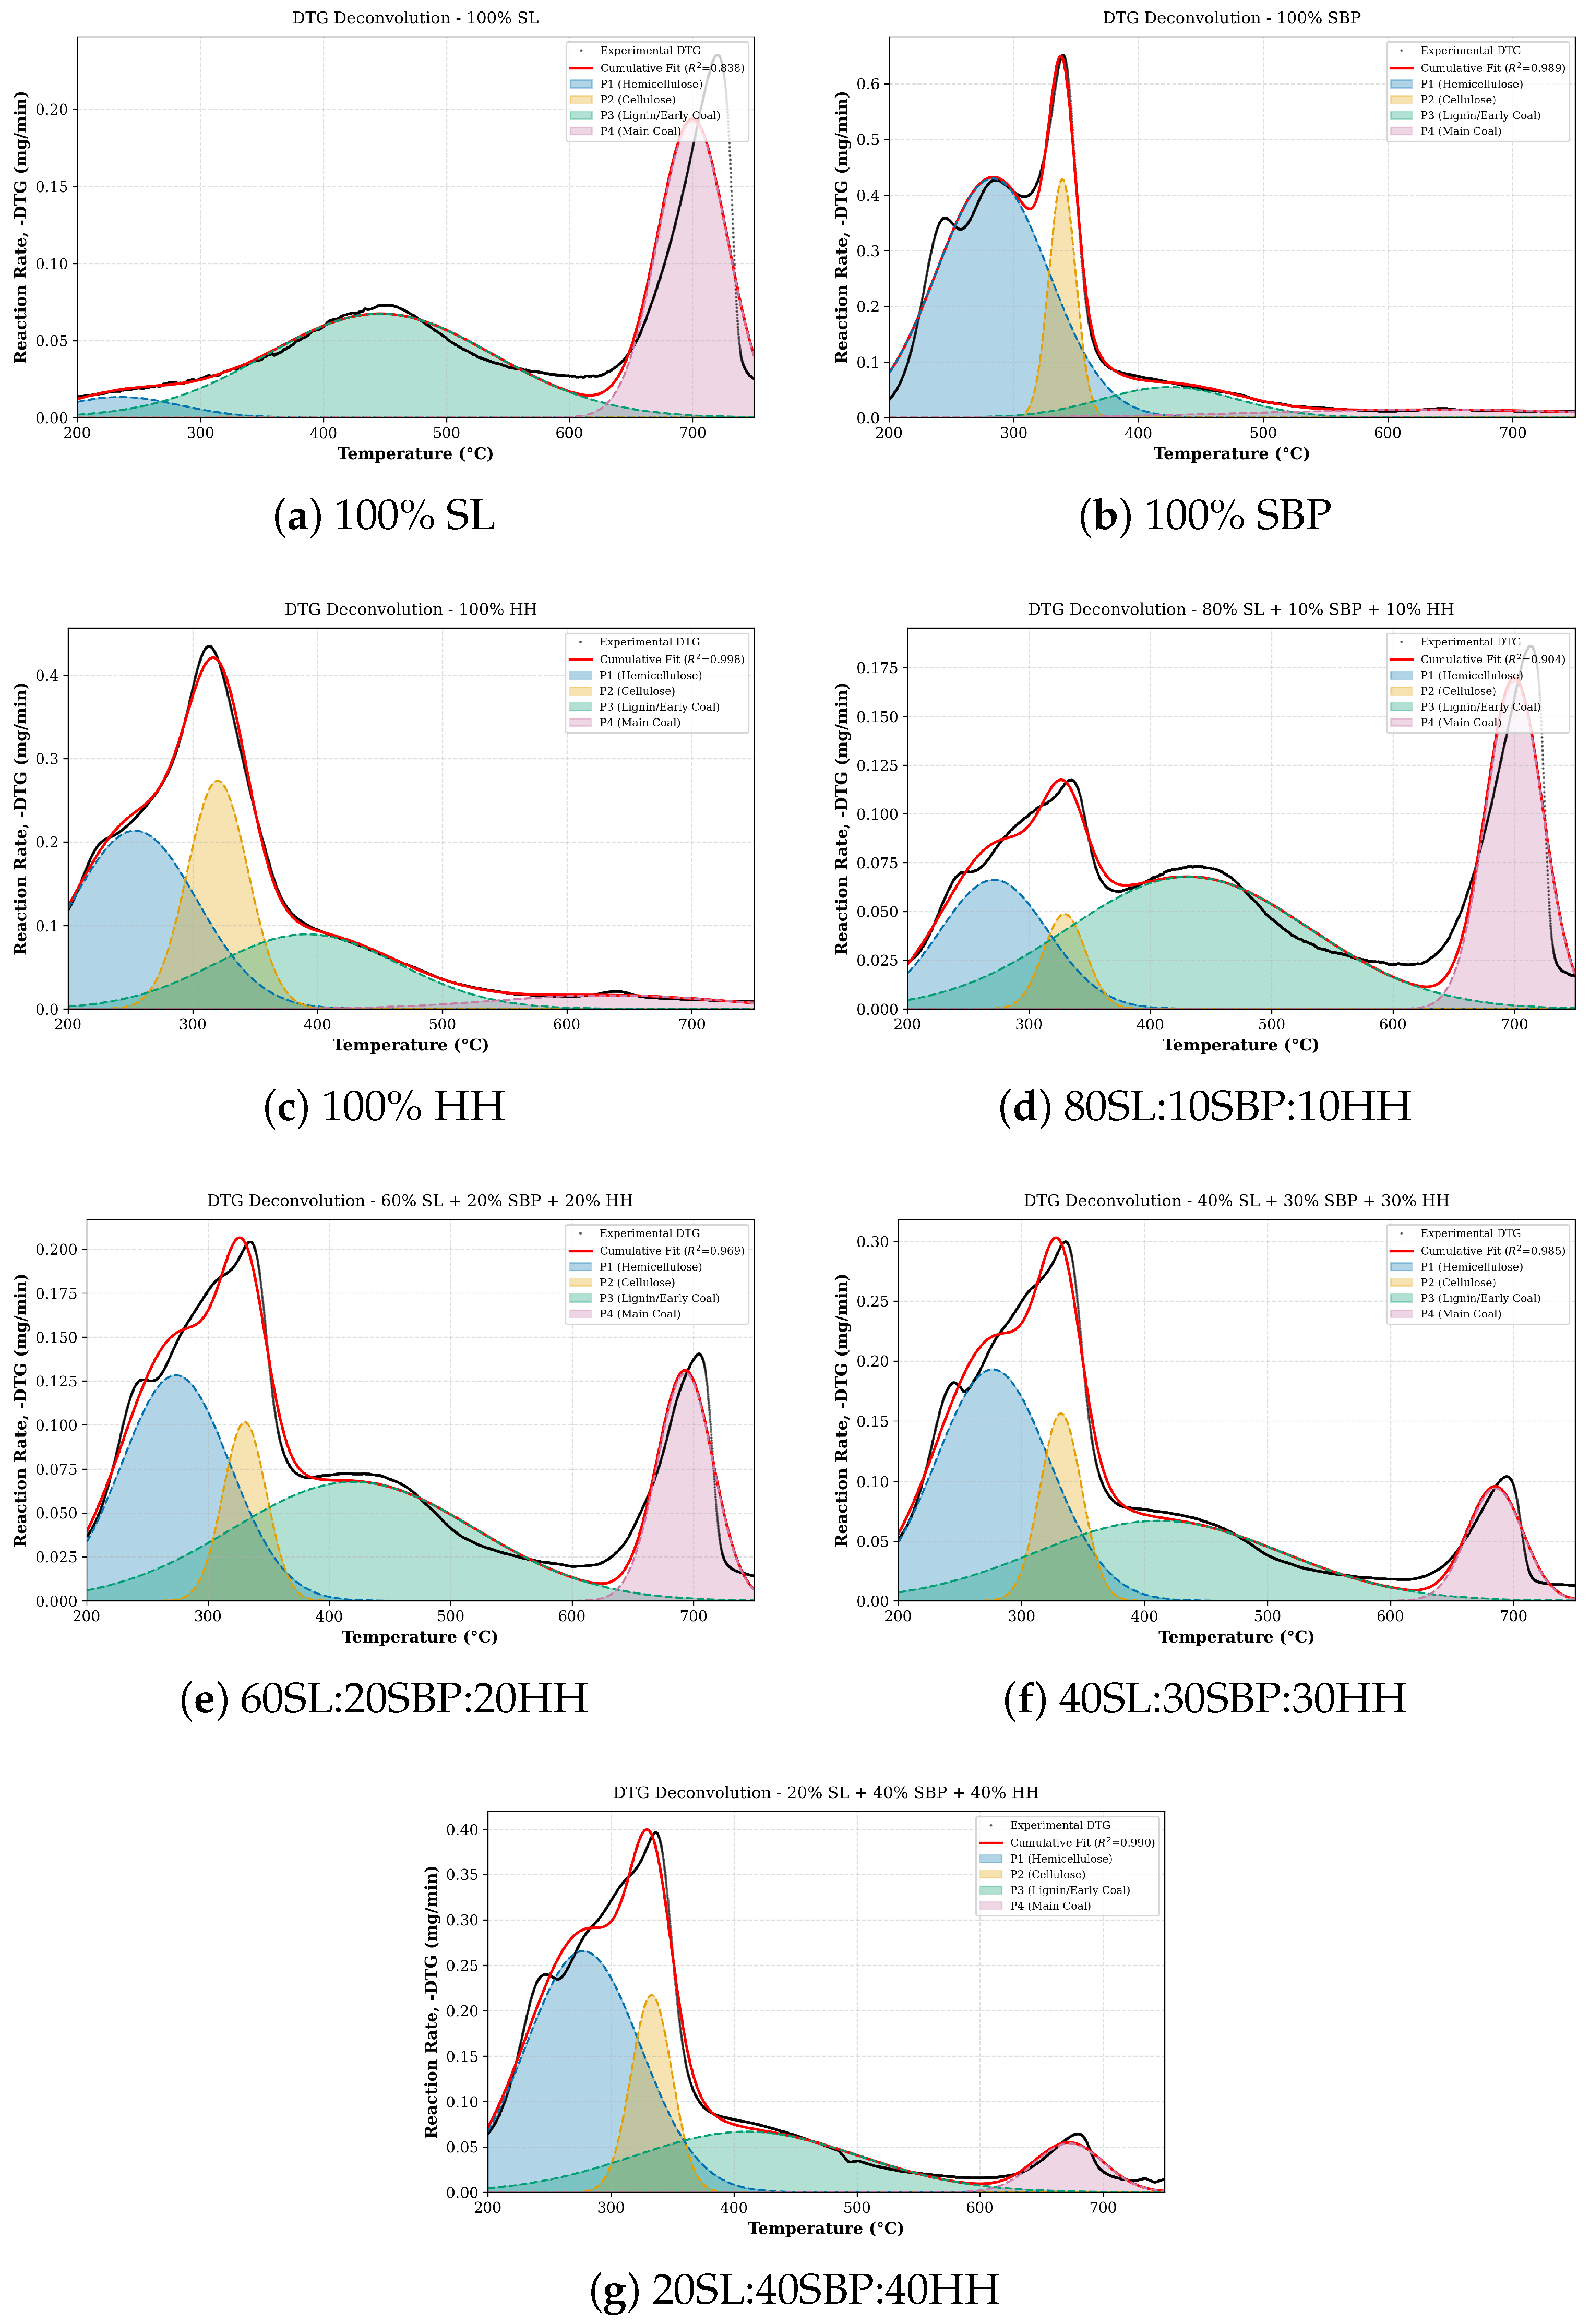
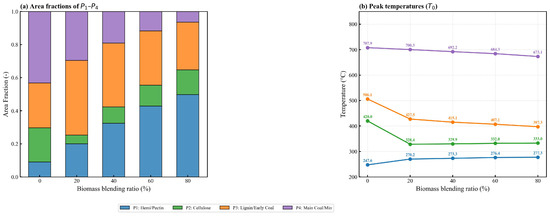
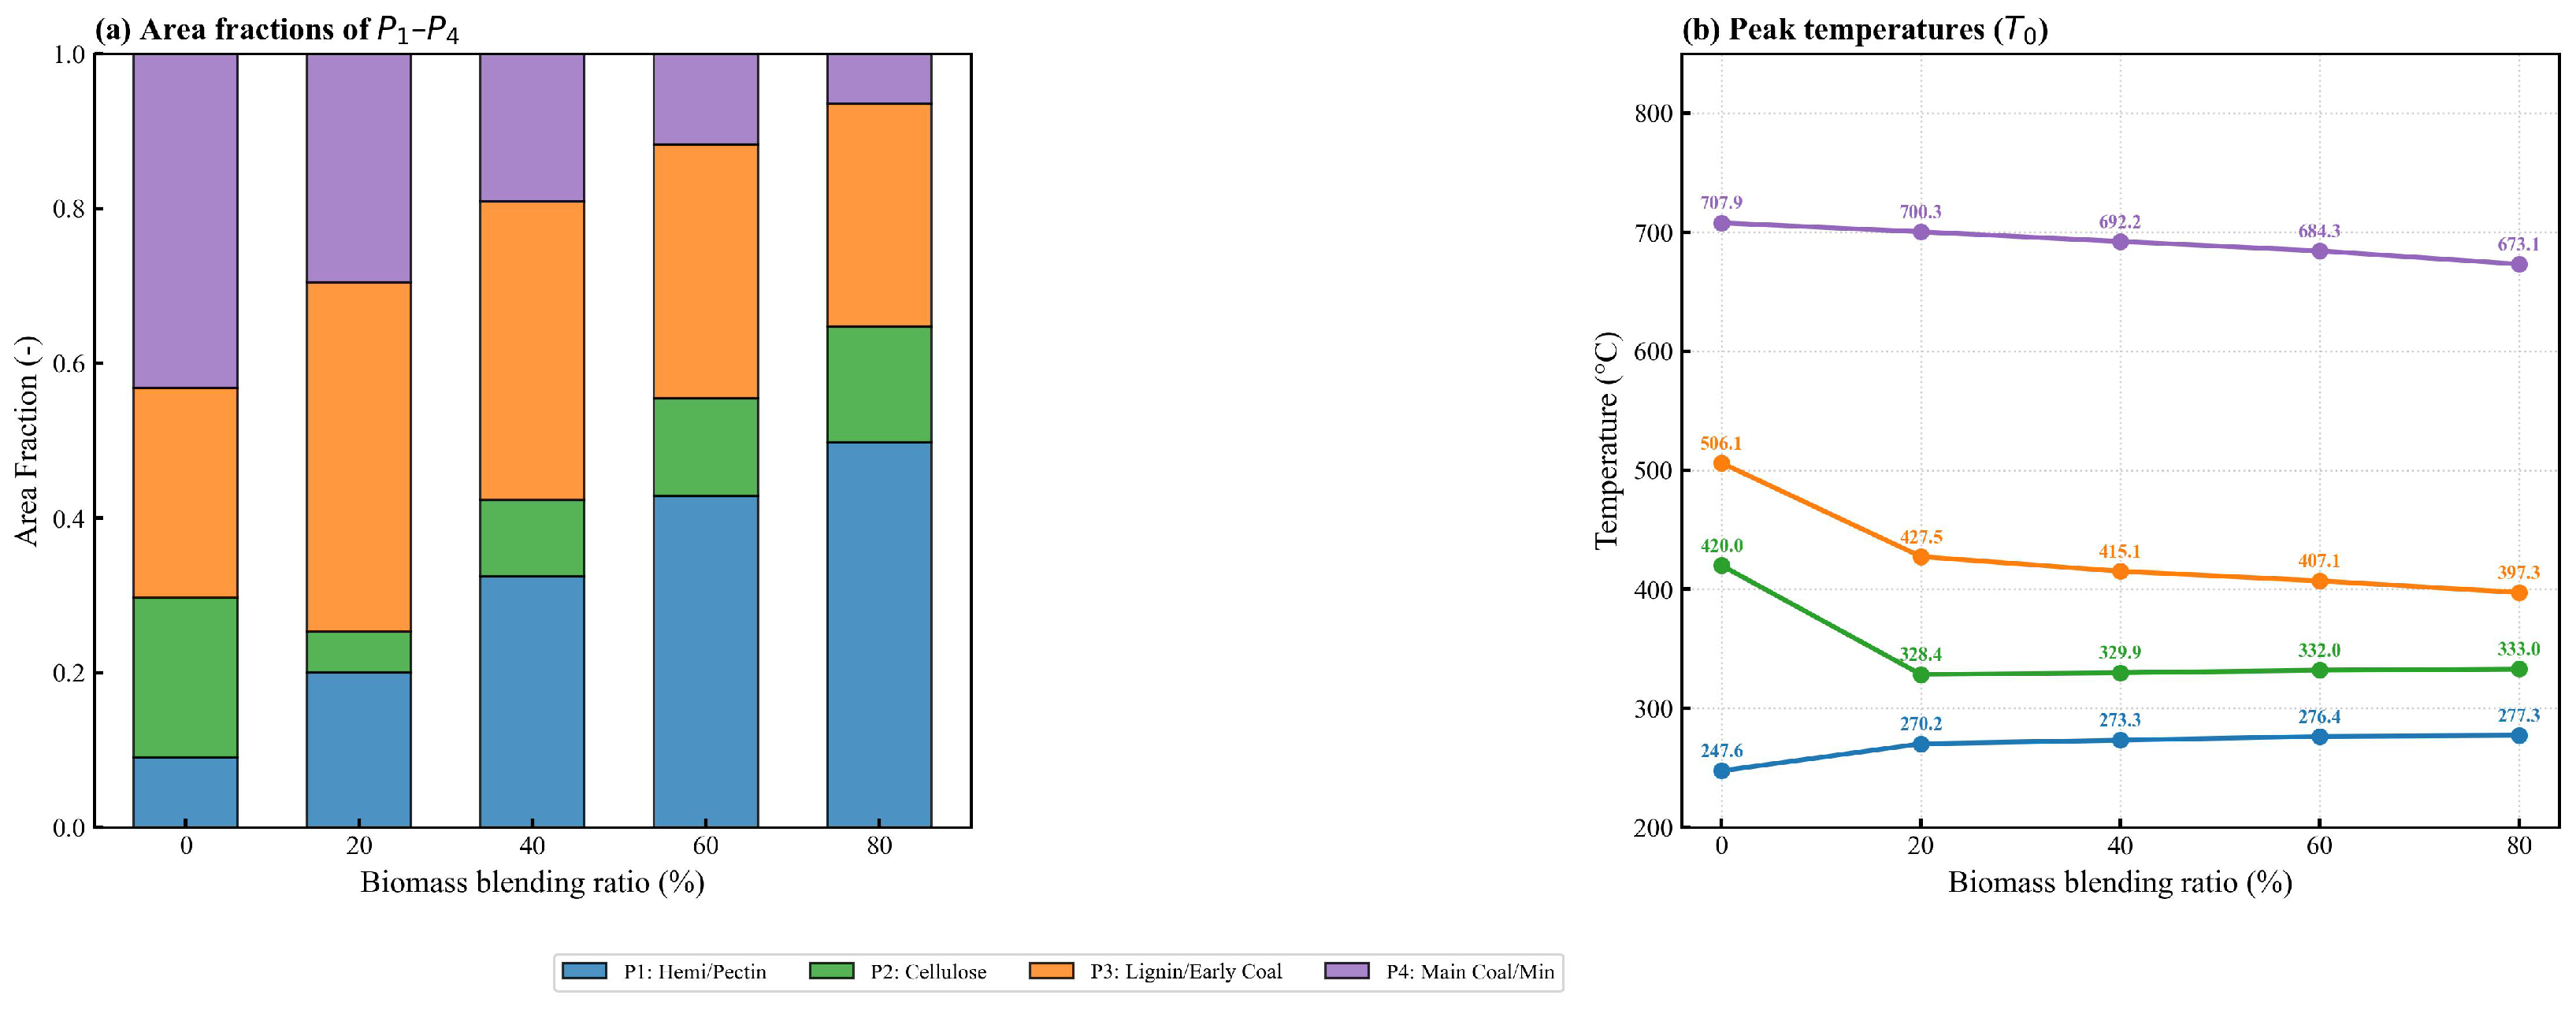

Disclaimer/Publisher’s Note: The statements, opinions and data contained in all publications are solely those of the individual author(s) and contributor(s) and not of MDPI and/or the editor(s). MDPI and/or the editor(s) disclaim responsibility for any injury to people or property resulting from any ideas, methods, instructions or products referred to in the content. |
© 2026 by the author. Licensee MDPI, Basel, Switzerland. This article is an open access article distributed under the terms and conditions of the Creative Commons Attribution (CC BY) license.