Article

Air Quality and Climate Co-Benefits of Pakistan’s Transport Sector: A Multi-Pollutant Scenario Assessment
1
Global Climate-Change Impact Studies Centre (GCISC), Ministry of Climate Change and Environmental Coordination (MoCC&EC), Government of Pakistan, Islamabad 44000, Pakistan
2
Pollution Management Group, Energy, Climate, and Environment (ECE) Program, International Institute for Applied Systems Analysis (IIASA), Schlossplatz 1, A-2361 Laxenburg, Austria
*
Author to whom correspondence should be addressed.
Sustainability 2026, 18(8), 3954; https://doi.org/10.3390/su18083954
Submission received: 19 February 2026 / Revised: 13 April 2026 / Accepted: 14 April 2026 / Published: 16 April 2026
(This article belongs to the Special Issue Air Pollution and Sustainability)

Abstract

The transport sector is a major contributor to urban air pollution and greenhouse gas emissions in Pakistan, posing significant challenges to sustainable development and climate commitments. This study develops the first technology-resolved, high-resolution, multi-pollutant emission inventory and scenario analysis for Pakistan’s transport sector, addressing key gaps in previous studies that lacked integrated multi-pollutant assessments, comprehensive coverage of non-road sources, and long-term scenario comparisons. The analysis integrates road and non-road transport sources within the Greenhouse Gas–Air Pollution Interactions and Synergies (GAINS) modeling framework. Emissions are projected for 2024–2050 under a business-as-usual (BAU) scenario and three mitigation pathways: an Electric Vehicle Transition (EVT) emphasizing transport electrification, a Euro-VI scenario focusing on stringent fuel and vehicle emission standards, and an integrated nationally determined contribution strategy (NDC+) scenario combining electrification, regulatory improvements, and structural transport reforms. In 2024, transport-related emissions are estimated at approximately 22 kt of fine particulate matter (PM2.5), over 300 kt of nitrogen oxides (NOx), and nearly 39 Mt of carbon dioxide (CO2), alongside substantial emissions of other gaseous pollutants and short-lived climate forcers. By 2050, the NDC+ scenario achieves the largest reductions relative to business-as-usual, demonstrating that coordinated electrification and emission control strategies can simultaneously reduce air pollution and greenhouse gas emissions. The results demonstrate strong synergies between climate mitigation and air quality improvement, showing that integrated strategies combining electrification with stringent emission standards can simultaneously reduce greenhouse gas emissions and major air pollutants while advancing cleaner and more sustainable mobility. This analysis provides a consistent and policy-relevant evidence base derived from best-available data and modeling tools to support Pakistan’s NDC implementation, sustainable mobility planning, and integrated air quality and climate strategies, with lessons transferable to other rapidly developing economies.

1. Introduction

Transport-related emissions represent one of the most persistent challenges for coun-tries striving to reconcile economic growth with environmental sustainability [1,2,3]. Rapid urbanization, rising incomes, expanding industrial activity, and growing mobility demand have driven sustained growth in transport activity across developing economies [4,5,6], making it increasingly difficult to decouple emissions from economic expansion [7,8,9]. Consequently, the transport sector has emerged as a critical pressure point for both local air quality and global climate change [10,11,12], with far-reaching implications for public health [13,14,15], energy security [16,17,18], and long-term sustainable development [19]. Globally, the transport sector is a major source of fine particulate matter, ground-level ozone, and greenhouse gas (GHG) emissions, accounting for approximately 14–16% of total global GHG emissions, primarily from road transport [20]. These emissions disproportionately affect urban populations [21] and low- and middle-income countries [22], where rapid motorization often outpaces regulatory capacity and infrastructure development [7,8]. Addressing transport emissions is therefore central to achieving multiple Sustainable Development Goals (SDGs), including those related to health, sustainable cities, clean energy, and climate action.
Pakistan exemplifies these interconnected challenges. As one of South Asia’s fastest urbanizing countries, its transport sector plays a central role in economic and social development, contributing approximately 10.5% to gross domestic product (GDP) and providing employment to nearly 5.8% of the national workforce [23]. However, rapid urbanization, population growth, and rising vehicle ownership—combined with continued dependence on fossil fuels—have led to a sharp increase in transport-related emissions [24,25,26]. At the national scale, transport fuel consumption has grown steadily, making the sector responsible for roughly one-quarter of Pakistan’s energy-related GHG emissions [27,28]. Empirical and scenario-based studies consistently show that road transport dominates energy use and emissions, driven by high reliance on private vehicles, freight trucking, and motorcycles, alongside limited modal share for rail and public transport [29,30,31,32].
Decomposition and decoupling analyses further indicate that Pakistan has largely failed to decouple transport-sector emissions from economic growth. CO2 emissions remain strongly coupled with GDP, with only short periods of weak decoupling observed historically [33,34,35,36]. Infrastructure-led growth strategies, particularly road expansion, have reinforced this coupling, raising concerns regarding long-term environmental sustainability [37,38].

1.1. Urban Air Pollution and Transport Sector Contributions

Urban air pollution represents one of Pakistan’s most severe environmental challenges. Major cities—including Lahore, Karachi, Islamabad, Rawalpindi, Faisalabad, and Quetta—regularly experience concentrations of PM2.5, PM10, SO2, NOx, and other pollutants far exceeding national and World Health Organization (WHO) guidelines [39,40,41,42,43,44]. Recent studies have also highlighted the role of integrated urban transport planning, accessibility, and environmental co-benefits in shaping sustainable mobility transitions [45,46]. Transport emissions are widely recognized as major contributors to these exceedances, particularly along congested traffic corridors. Road transport contributes substantially to emissions of particulate matter, nitrogen oxides, carbon monoxide, volatile organic compounds, black carbon, and carbon dioxide [31,39,47]. These pollutants play a key role in smog formation, secondary aerosol production, and ground-level ozone, especially during winter stagnation episodes in cities such as Lahore [48,49,50,51]. However, the precise contribution of transport to urban air pollution remains uncertain. Source apportionment and sectoral inventory studies attribute anywhere from less than 10% to more than 80% of urban pollution to vehicular sources, depending on methodology, pollutant coverage, and spatial resolution [26]. This uncertainty has direct implications for policy design, complicating prioritization of transport-focused interventions relative to other sectors such as residential combustion and industry.
The health consequences of transport-related air pollution in Pakistan are substantial and well documented. Exposure to fine particulate matter and black carbon is associated with increased risks of respiratory and cardiovascular diseases, adverse pregnancy outcomes, and premature mortality [52,53,54]. Systematic reviews and city-specific studies report elevated disease burdens linked to traffic emissions, particularly among vulnerable urban populations [43,55,56].
Beyond air pollution, transport systems also contribute to noise exposure, road traffic injuries, and reduced physical activity, further compounding public health challenges [55]. These impacts undermine progress toward multiple SDGs, notably SDG 3 (Good Health and Well-Being), SDG 7 (Affordable and Clean Energy), SDG 11 (Sustainable Cities and Communities), and SDG 13 (Climate Action) [57,58]. Reducing emissions from the transport sector is therefore not only an environmental priority but also a critical component of inclusive and sustainable development.

1.2. Transport Policies and Implementation Challenges

In response to rising emissions and deteriorating air quality, Pakistan has introduced several policy instruments aimed at promoting cleaner transport. These include commitments under its nationally determined contribution (NDC), the New Energy Vehicle Policy 2025, and the National Clean Air Policy 2023 [59,60,61]. These frameworks emphasize vehicle electrification, improved fuel quality, tighter emission standards, and expansion of cleaner transport technologies.
Modeling studies suggest that such measures could deliver substantial reductions in both GHG emissions and local air pollutants if implemented effectively [30,62,63,64,65]. However, implementation has been uneven. Electric vehicle uptake remains limited despite fiscal incentives [60,66,67], inspection and maintenance systems suffer from weak enforcement [68,69], and nationwide availability of low-sulfur fuels remains incomplete. Institutional fragmentation and limited coordination between transport, energy, and environmental authorities further constrain progress [64].
Experience from neighboring countries illustrates the potential benefits of coordinated action. India’s phased adoption of Bharat Stage emission standards, supported by fuel quality upgrades, has resulted in measurable improvements in urban air quality and health outcomes [70,71,72]. In Bangladesh, interventions such as cleaner bus fleets and compressed natural gas programs have reduced selected local pollutants, although long-term climate benefits depend on system-level integration [73,74,75]. Recent studies on hybrid energy systems and sustainable energy optimization further highlight the importance of integrated approaches for reducing emissions while enhancing system efficiency and resilience, particularly in resource-constrained environments [76,77]. These experiences underscore the importance of integrated, multi-pollutant transport strategies.

1.3. Research Gaps and Objectives

Despite growing scholarly attention, research on transport emissions in Pakistan remains fragmented. Existing studies have developed city-level assessments [41,78,79,80], national emission inventories and projections [23,24,31], or evaluated individual policies and technologies [26,62,64,81]. Others focus on specific pollutants, modes, or health outcomes [49,65,81].
However, few studies employ integrated, technology-resolved, multi-pollutant frameworks capable of simultaneously capturing interactions among electrification, advanced emission standards, fuel quality improvements, and non-road sources within a single consistent assessment [26,59,82,83]. This gap limits policymakers’ ability to assess combined and potentially synergistic air quality and climate co-benefits of integrated transport strategies. In developing country contexts such as Pakistan—characterized by rapid motorization, data constraints, and enforcement challenges—there is a pressing need for comprehensive, policy-relevant assessments that explicitly quantify multi-pollutant outcomes over long-term horizons [64].
To address this need, the present study applies the Greenhouse Gas–Air Pollution Interactions and Synergies (GAINS) model to develop Pakistan’s first technology-resolved, multi-pollutant emission inventory and scenario analysis for the entire transport sector. The assessment covers both road and non-road sources and quantifies emissions of particulate matter, black carbon, organic carbon, nitrogen oxides, sulfur dioxide, carbon monoxide, volatile organic compounds, and key GHGs including carbon dioxide, methane, and nitrous oxide. Informal transport activities in Pakistan present a key source of uncertainty in emissions modeling. Within the GAINS framework, such activities are primarily captured through aggregate fuel consumption statistics [27], which inherently include fuel use from both registered and unregistered vehicles. As a result, emissions from informal transport are not entirely omitted, even though individual vehicle categories are not explicitly represented in the stock database. For instance, unregistered loaders and tractors used for urban freight are likely reflected within non-road sectors depending on fuel allocation, while modified three-wheelers (e.g., Chingchi rickshaws) are implicitly included in the two- and three-wheeler category through gasoline and CNG consumption. However, the allocation of fuel use across sectors and vehicle types remains uncertain, particularly in cases of cross-sectoral or informal usage, which may affect the accuracy of sub-sectoral emission estimates. Emissions are estimated for the 2024 base year and projected through 2050 under four policy scenarios: Business-as-Usual (BAU), Electric Vehicle Transition (EVT), Euro VI emission standards (Euro-VI), and an integrated NDC+ pathway.
This study makes three principal contributions. First, it provides a high-resolution, vehicle-class-disaggregated emission inventory for Pakistan’s transport sector, addressing critical data gaps for both road and non-road sources. Second, it quantifies air quality and climate co-benefits of alternative policy pathways within a unified multi-pollutant framework, enabling direct comparison of electrification, emission standards, and integrated strategies. Third, it delivers policy-relevant insights to support implementation of Pakistan’s climate and clean air commitments while offering a transferable analytical approach for other rapidly motorizing developing economies.
The remainder of the paper is structured as follows. Section 2 describes the methodology, data sources, and scenario design. Section 3 presents the baseline emission inventory and projected pathways to 2050. Section 4 discusses the implications for policy, sustainability, and co-benefits, along with key limitations. Section 5 concludes with the main findings and recommendations for future research and decision making.

2. Materials and Methods

This study applies the GAINS (available online: https://gains.iiasa.ac.at/gains/, accessed on 28 December 2025) model to develop a comprehensive emissions inventory and to assess mitigation pathways for Pakistan’s transport sector. GAINS is an integrated modeling framework that quantifies emissions of key air pollutants and GHGs by explicitly linking transport activity, fuel consumption, vehicle technologies, and emission control measures within a consistent scenario-based structure [84,85,86].
The regional GAINS framework for South Asia, originally developed for large scale assessments of air pollution and climate interactions [12,87,88,89], was substantially adapted and refined to reflect Pakistan specific transport system characteristics. Model updates incorporated country level data on vehicle fleet composition, fuel consumption, technology penetration, and regulatory conditions, drawing on recent GAINS applications for Pakistan [12,26,64,86]. These refinements allow for a detailed and policy relevant representation of both road and non-road transport sources.
Emission factors were adapted to Pakistan-specific conditions using regionally calibrated parameters within the GAINS framework, further refined with country-specific fleet composition and activity data (Supplementary Tables S2 and S3). Adjustments incorporate age-dependent deterioration functions to account for engine wear, degraded after-treatment systems, and poor maintenance, which typically increase emissions from older vehicles. Fuel quality characteristics were also considered through sulfur-dependent correction factors influencing emission control efficiencies and fuel-type emission patterns. These approaches are consistent with established regional studies. However, due to limited availability of local Portable Emissions Measurement Systems (PEMS) or dynamometer measurements—particularly for VOC and CO emissions from two- and three-wheelers—these estimates should be interpreted as best-available approximations rather than direct measurements.
The analysis adopts 2024 as the base year, reflecting the most recent availability of comprehensive national data on vehicle activity, fuel use, and technology distribution. Emissions are projected annually through 2050 under a set of contrasting policy scenarios that reflect alternative development pathways for Pakistan’s transport sector.

2.1. Transport Sector Representation in GAINS

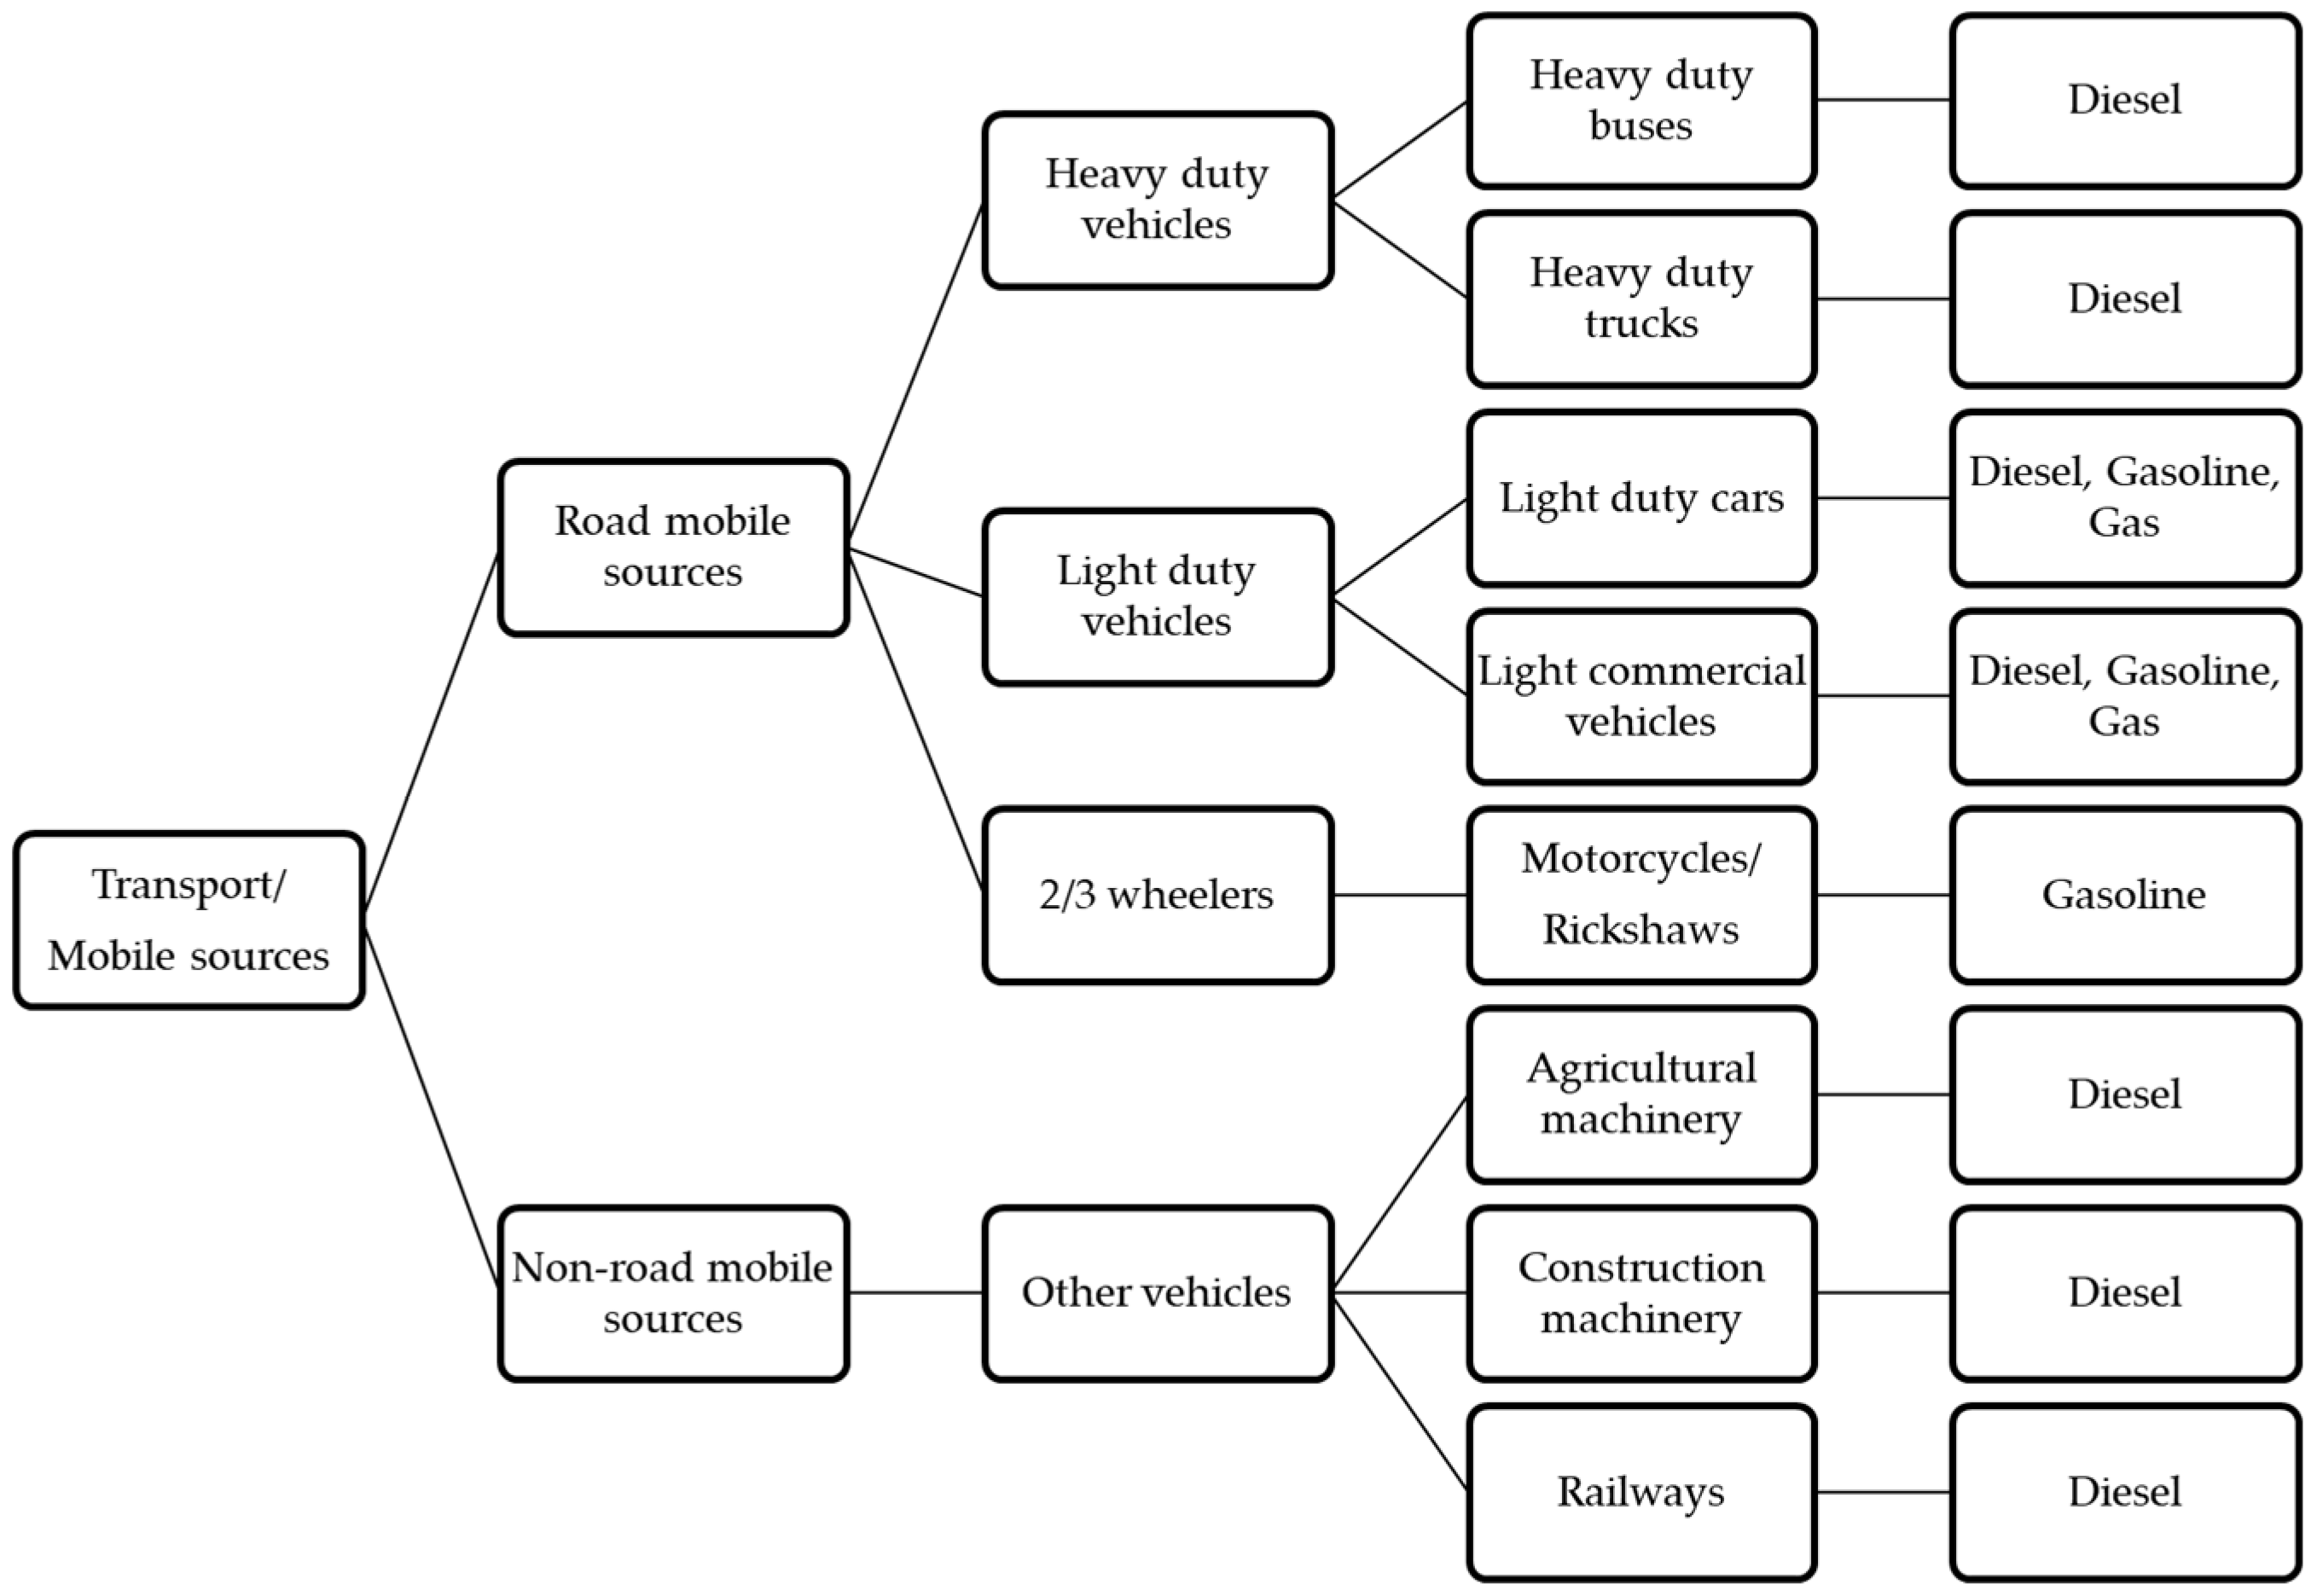
The GAINS model employs a bottom up, technology explicit approach in which transport emissions are calculated as a function of activity levels, fuel consumption, pollutant specific emission factors, and the effectiveness of emission control technologies [64,86,90]. The transport sector is disaggregated into detailed vehicle categories, fuel types, and technology vintages, allowing emissions to be quantified for heavy-duty trucks, buses, light-duty vehicles, motorcycles, three-wheelers, agricultural machinery, construction equipment, and railway systems.
Emissions of particulate matter (PM) with aerodynamic diameters below 2.5 µm (PM2.5) and 10 µm (PM10), nitrogen oxides (NOx), sulfur dioxide (SO2), carbon monoxide (CO), volatile organic compounds (VOCs), black carbon (BC), and organic carbon (OC) are estimated using the GAINS Tier 2 methodology, which explicitly accounts for real-world fleet composition, emission factors, and the penetration of emission control technologies across different sectors and regions [90]. Carbon dioxide (CO2) emissions are calculated following the IPCC 2006 Tier 1 approach, considering fuel consumption and carbon content. Methane (CH4) and nitrous oxide (N2O) emissions are quantified based on sector-specific emission factors, including contributions from combustion processes, agricultural activities, and other technology-specific parameters embedded within the GAINS modeling framework [91,92]. This comprehensive approach allows for a consistent assessment of the technical mitigation potential and associated costs of reducing air pollutants and GHGs globally.
Figure 1 illustrates the structure of Pakistan’s transport sector as represented in the GAINS model, including the segmentation of road and non-road sources and the associated fuel and technology pathways.

2.2. Data Sources and Activity Projections

Model calibration relies on a combination of national statistical data, sectoral reports, and integrated energy modeling outputs. Fuel consumption data for road and non-road transport were obtained from the Pakistan Energy Yearbook 2024 published by the Hydrocarbon Development Institute of Pakistan [27]. Vehicle stock data, including fleet size, vehicle categories, and technology classifications, were sourced from the Pakistan Economic Survey 2025 [23].
The baseline vehicle fleet structure was derived from national transport statistics, vehicle registration data, and energy balance reports. The dataset includes the total number of vehicles and their distribution across major categories, including passenger cars, light commercial vehicles, buses, trucks, and motorcycles/three-wheelers. In addition, the fleet was disaggregated by emission standard categories (e.g., Euro I–III for baseline conditions), with detailed distributions of vehicle categories by emission standard over time (2025–2050), expressed as shares of fuel use/activity. This classification allows the GAINS model to represent technology-specific emission factors and control measures. Detailed summary tables on activity data, fleet composition assumptions, emission factor parameters used, and distribution of vehicle categories by emission standard application rates in the modeling framework are provided in the Supplementary Material (Tables S1–S4) to facilitate reproducibility of the analysis.
Transport activity indicators and long-term projections of vehicle kilometers traveled, modal distribution, and efficiency improvements were derived from the EnerNEO (available online: https://www.enerdata.net/solutions/national-energy-outlook-model.html, accessed on 28 December 2025) Pakistan energy system model [93]. EnerNEO provides internally consistent projections of energy demand that are aligned with national macroeconomic and demographic assumptions used in climate planning exercises. Vehicle activity (VKT) is treated as an exogenous input derived from EnerNEO projections and is applied consistently across all scenarios; potential rebound effects associated with lower operating costs of electric vehicles are not explicitly modeled. The integration between EnerNEO and GAINS follows a soft-linking approach, whereby activity and energy demand projections from EnerNEO are used to initialize and update the GAINS model through a unidirectional data transfer. No iterative feedback loop is implemented between the two models.
Default emission factors, technology parameters, and control efficiencies were drawn from the GAINS regional database [94] and subsequently adjusted to reflect Pakistan specific fuel quality standards, regulatory documents, and peer reviewed literature [62,68,95]. Future transport energy demand trajectories for the period 2024 to 2050 were harmonized between EnerNEO and GAINS following established mapping procedures used in previous Pakistan focused studies [65].
Table 1 summarizes the key datasets used for model calibration and scenario development, including base year information and principal data sources.

2.3. Emission Estimation Methodology

The GAINS model estimates pollutant emissions using the following equation that integrates activity levels, uncontrolled emission factors, efficiencies of control technologies, and their application rates. The emissions for a given pollutant are calculated as:
E M i , p =   k   m   A i , k   E F i , k , m , p   X i , k , m , p
where i represents the country, k the type of activity, m the abatement or control measure, and p the specific pollutant. Here, EMi,p is the total emission of pollutant p in country i, Ai,k is the level of activity k, EFi,k,m,p is the emission factor for pollutant p after applying measure m, and Xi,k,m,p represents the fraction of activity k to which control measure m is applied.
Air pollutant emissions were estimated using pollutant and technology specific emission factors embedded within GAINS, which reflect both uncontrolled emissions and reductions achieved through emission control technologies such as diesel particulate filters, selective catalytic reduction systems, exhaust gas recirculation, and three-way catalytic converters. The fleet is classified according to Euro equivalent emission standards, enabling explicit representation of technology turnover and regulatory progression over time. Emission factors in GAINS are technology-specific and represent average performance under regionally representative operating conditions; however, the model does not explicitly incorporate functional adjustments for fuel sulfur content, operating temperature effects, or degradation of emission control technologies with vehicle age.
Fuel quality assumptions incorporate sulfur content limits consistent with national regulations and policy targets [59]. Annual shares of emission control technologies and cleaner vehicle standards evolve dynamically in the model based on scenario specific assumptions regarding regulatory enforcement, fleet renewal, and technology adoption.
GHG emissions of methane and nitrous oxide are calculated using GAINS default parameters, which capture the influence of fuel type, combustion technology, and emission controls. This integrated treatment ensures consistency across air pollutants and GHG estimates and allows for direct assessment of co benefits across policy scenarios.
The modeling framework does not explicitly account for fuel consumption penalties associated with advanced emission control technologies (e.g., DPF and SCR systems). As a result, small increases in fuel use associated with these technologies are not reflected in the CO2 emission estimates.

2.4. Policy and Regulatory Context

Scenario development was grounded in Pakistan’s existing transport and climate policy framework, including national strategies, regulatory instruments, and recent policy reforms related to vehicle emission standards, fuel quality, and electrification. Key policy documents informing the analysis include the National Transport Policy 2018, the New Energy Vehicle Policy 2025, the National Clean Air Policy 2023, and Pakistan’s Third Nationally Determined Contribution submitted under the UNFCCC [59,60,61,96].
These instruments provide the basis for assumptions regarding vehicle technology transitions, electrification rates, fuel quality improvements, and emission control adoption across the four scenarios examined in this study. Table 2 presents an overview of the relevant policy instruments, their objectives, and their role in informing model assumptions.

2.5. Scenario Design and Model Integration

Four internally consistent scenarios were developed to evaluate alternative mitigation pathways for Pakistan’s transport sector. The BAU scenario reflects continuation of existing policies with limited enforcement and gradual fleet modernization based on historical trends. The Electric Vehicle Transition scenario assumes progressive electrification of major gasoline powered vehicle categories, while internal combustion engine technologies evolve in line with the BAU trajectory.
The Euro-VI scenario assumes accelerated implementation of Euro VI equivalent emission standards supported by nationwide availability of ultra-low sulfur fuels and widespread adoption of advanced after treatment technologies, particularly for heavy-duty diesel vehicles. Electric vehicle uptake in this scenario remains consistent with baseline assumptions.
The NDC+ scenario combines accelerated electrification with the introduction of stringent vehicle emission standards. Electrification primarily affects passenger vehicles and two- and three-wheelers, while heavy-duty vehicles increasingly adopt Euro-VI equivalent emission standards. By 2050, electric vehicles represent approximately 85–90% of the light-duty vehicle fleet, while conventional internal combustion vehicles that remain in operation comply with advanced emission control technologies. The NDC+ scenario represents an ambitious, policy-driven pathway assuming accelerated electrification and regulatory implementation. It is designed as a technically feasible transition and does not explicitly account for macroeconomic constraints, fiscal limitations, or infrastructure investment requirements such as grid reinforcement and charging deployment. This scenario is designed to align with Pakistan’s long term climate mitigation ambitions.
In the BAU scenario, fleet modernization refers to the gradual replacement of older vehicles with newer models in line with historical fleet turnover trends and currently implemented emission standards. The analysis assumes a continuation of recent vehicle growth trends and an average fleet renewal rate consistent with national vehicle registration statistics. Under this assumption, newer vehicles gradually replace older high-emitting vehicles, resulting in modest improvements in fleet emission performance over time without the introduction of additional policy measures.
A key methodological feature of this study is the integration of EnerNEO and GAINS. EnerNEO provides projections of transport activity, fleet evolution, modal shares, and fuel demand, which are mapped into GAINS to update activity levels, technology shares, and emission control penetration under each scenario. This integrated workflow ensures internal consistency between energy demand, technology transitions, and emissions outcomes. Figure 2 illustrates the interaction between the two modeling frameworks.
All scenarios are initialized using identical base year assumptions for fleet composition, fuel use, and technology distribution to ensure comparability of results across policy pathways. Table 3 summarizes the main assumptions and timelines associated with each scenario through 2050.

3. Results

3.1. Baseline Emission Inventory

3.1.1. Overall Emission Profile

The Pakistan transport sector represents a major source of air pollutants and GHGs, with road transport overwhelmingly dominating total emissions. The 2024 national emission inventory quantifies emissions for eleven pollutants and climate-relevant gases including PM10, PM2.5, BC, OC, NOx, SO2, CO, VOCs, CO2, CH4, and N2O. Results indicate that road mobile sources account for more than 97 percent of total emissions for nearly all pollutants, as summarized in Table 4. In contrast, non-road mobile sources, including agricultural machinery, construction equipment, and railways contribute a relatively minor share, remaining below 3 percent for all pollutants, with their largest contribution observed for CO2 at approximately 2 percent.
These results reflect structural characteristics of Pakistan’s transport system, where heavy-duty diesel vehicles operate with higher fuel consumption rates and often older engine technologies, leading to disproportionate contributions to particulate matter and nitrogen oxide emissions. In contrast, gasoline-powered passenger vehicles and two- and three-wheelers dominate emissions of carbon monoxide and volatile organic compounds due to incomplete combustion in spark-ignition engines.

3.1.2. Pollutant-Specific Patterns

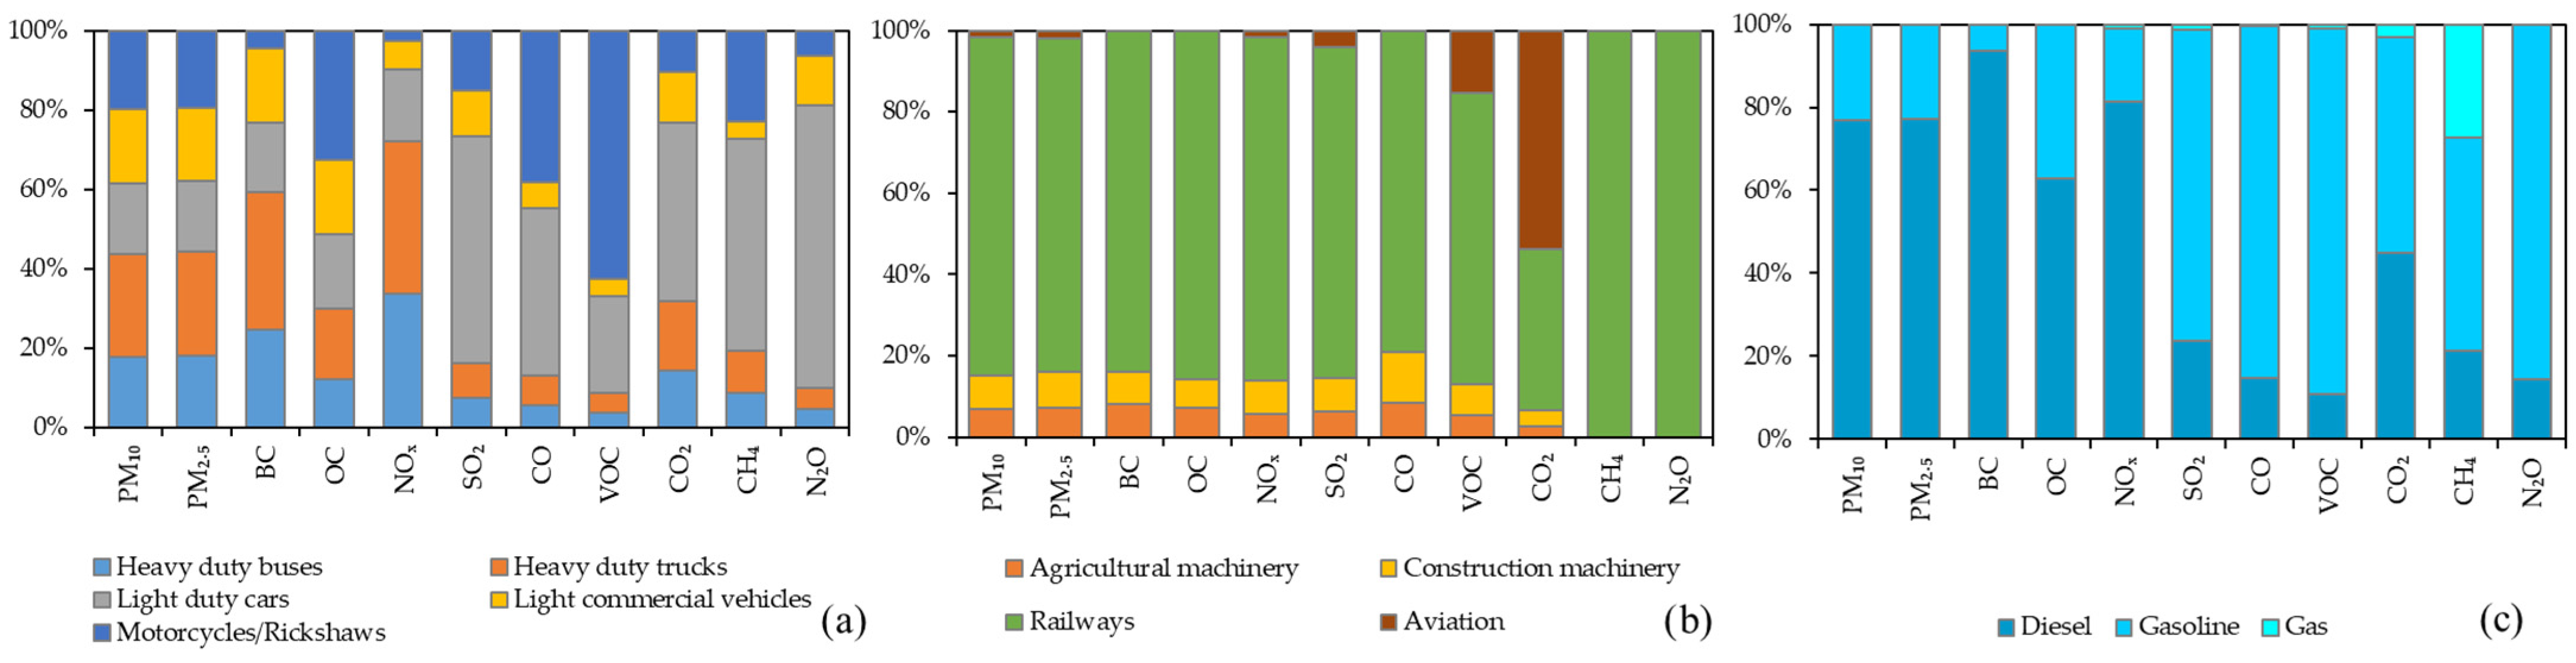
Particulate matter emissions constitute a critical component of the transport sector’s air quality burden. Total PM2.5 and PM10 emissions in 2024 are estimated at 22.07 kt and 22.85 kt, respectively, with road transport responsible for over 97 percent of both totals. Heavy-duty diesel vehicles dominate emissions of black carbon, with trucks contributing 35 percent and buses contributing 25 percent of the national total of 12.03 kt. This pattern reflects the widespread use of diesel engines with limited emission control technologies [65]. In contrast, organic carbon emissions amounting to 8.09 kt are largely driven by motorcycles and three-wheelers, which together account for 33 percent of the total. This reflects incomplete combustion associated with small gasoline engines and limited regulatory oversight in these vehicle categories. It should be noted that the reported PM10 and PM2.5 emissions represent exhaust emissions only and do not include non-exhaust sources such as brake wear, tire wear, and road dust resuspension, which can be substantial in urban environments.
Gaseous air pollutant emissions exhibit distinct source profiles across vehicle types. National NOx emissions in 2024 reach 301.64 kt, with heavy-duty trucks and buses accounting for 38 percent and 34 percent, respectively. SO2 emissions total 98.13 kt and originate almost entirely from road transport, reflecting the continued use of sulfur-containing fuels. Passenger cars alone contribute 57 percent of SO2 emissions, followed by light commercial trucks with 11 percent. Carbon monoxide and VOC emissions are dominated by two- and three-wheelers, which together account for 38 percent of CO emissions and 63 percent of VOC emissions. These high shares are driven by inefficient combustion, aging vehicle fleets, and the limited penetration of emission control technologies in this segment [95].
Transport-related GHG emissions display similar patterns. Total CO2 emissions from the transport sector in 2024 are estimated at 38.70 Mt, with road transport accounting for 98.2 percent of the total. Passenger cars represent the largest contributing category at 45 percent, followed by trucks at 18 percent and buses at 14 percent. From a fuel perspective, gasoline and diesel together account for more than 97 percent of transport CO2 emissions, while compressed natural gas contributes approximately 3 percent. Emissions of CH4 and N2O amount to 14.06 kt and 3.12 kt, respectively. Passenger cars dominate emissions of both gases, contributing 53 percent of CH4 and 71 percent of N2O emissions. Non-road sources contribute marginally to GHG emissions, with railways representing the largest share among these sources, although absolute emissions remain very small. Figure 2 illustrates the percentage contributions of road transport categories, non-road transport categories, and fuel types to multi pollutant emissions in 2024.

3.1.3. Vehicle Category Contributions

The vehicle specific contributions summarized in Table 5 highlight pronounced heterogeneity across vehicle categories. Heavy-duty diesel vehicles dominate PM2.5, PM10, black carbon, and NOx emissions. Motorcycles and three-wheelers are the primary sources of VOC and CO emissions, while passenger cars contribute the largest shares of CO2, CH4, N2O, and SO2. These patterns highlight the necessity of differentiated, vehicle-specific mitigation strategies rather than uniform regulatory approaches.
The dominance of heavy-duty trucks and buses in particulate matter and NOx emissions is primarily driven by their reliance on diesel engines, higher engine loads, and longer annual travel distances compared to other vehicle categories. Diesel combustion typically generates higher levels of nitrogen oxides and particulate matter, particularly in fleets with limited penetration of advanced emission control technologies. Conversely, the relatively high contribution of passenger cars to SO2 emissions reflects the sulfur content in gasoline and the large share of gasoline-powered vehicles in the national fleet. Non-road sources such as railways and construction machinery contribute comparatively small shares to total emissions due to their limited fleet size and overall lower activity levels relative to road transport.
Overall, the baseline inventory demonstrates that road transport overwhelmingly drives Pakistan transport emissions, with diesel powered trucks and buses responsible for most particulate and NOx emissions, while gasoline powered passenger cars and two- and three-wheelers dominate emissions of GHGs and incomplete combustion pollutants. The relatively low contribution of non-road sources reflects currently available activity data and fuel consumption statistics; however, given limited monitoring and potential underreporting of informal activities—particularly in construction and agricultural sectors—these estimates may represent a lower-bound of actual emissions. These findings underscore the need for targeted mitigation strategies that address specific vehicle categories and fuel types rather than relying on uniform policy approaches. The 2024 baseline inventory provides a robust foundation for evaluating future emission trajectories under alternative policy scenarios. Details of sector- and category-wise emissions for road (Table S5) and non-road transport (Table S6), along with fuel-type–wise emissions across both sectors (Table S7), for the baseline year 2024 are provided in the Supplementary Materials.
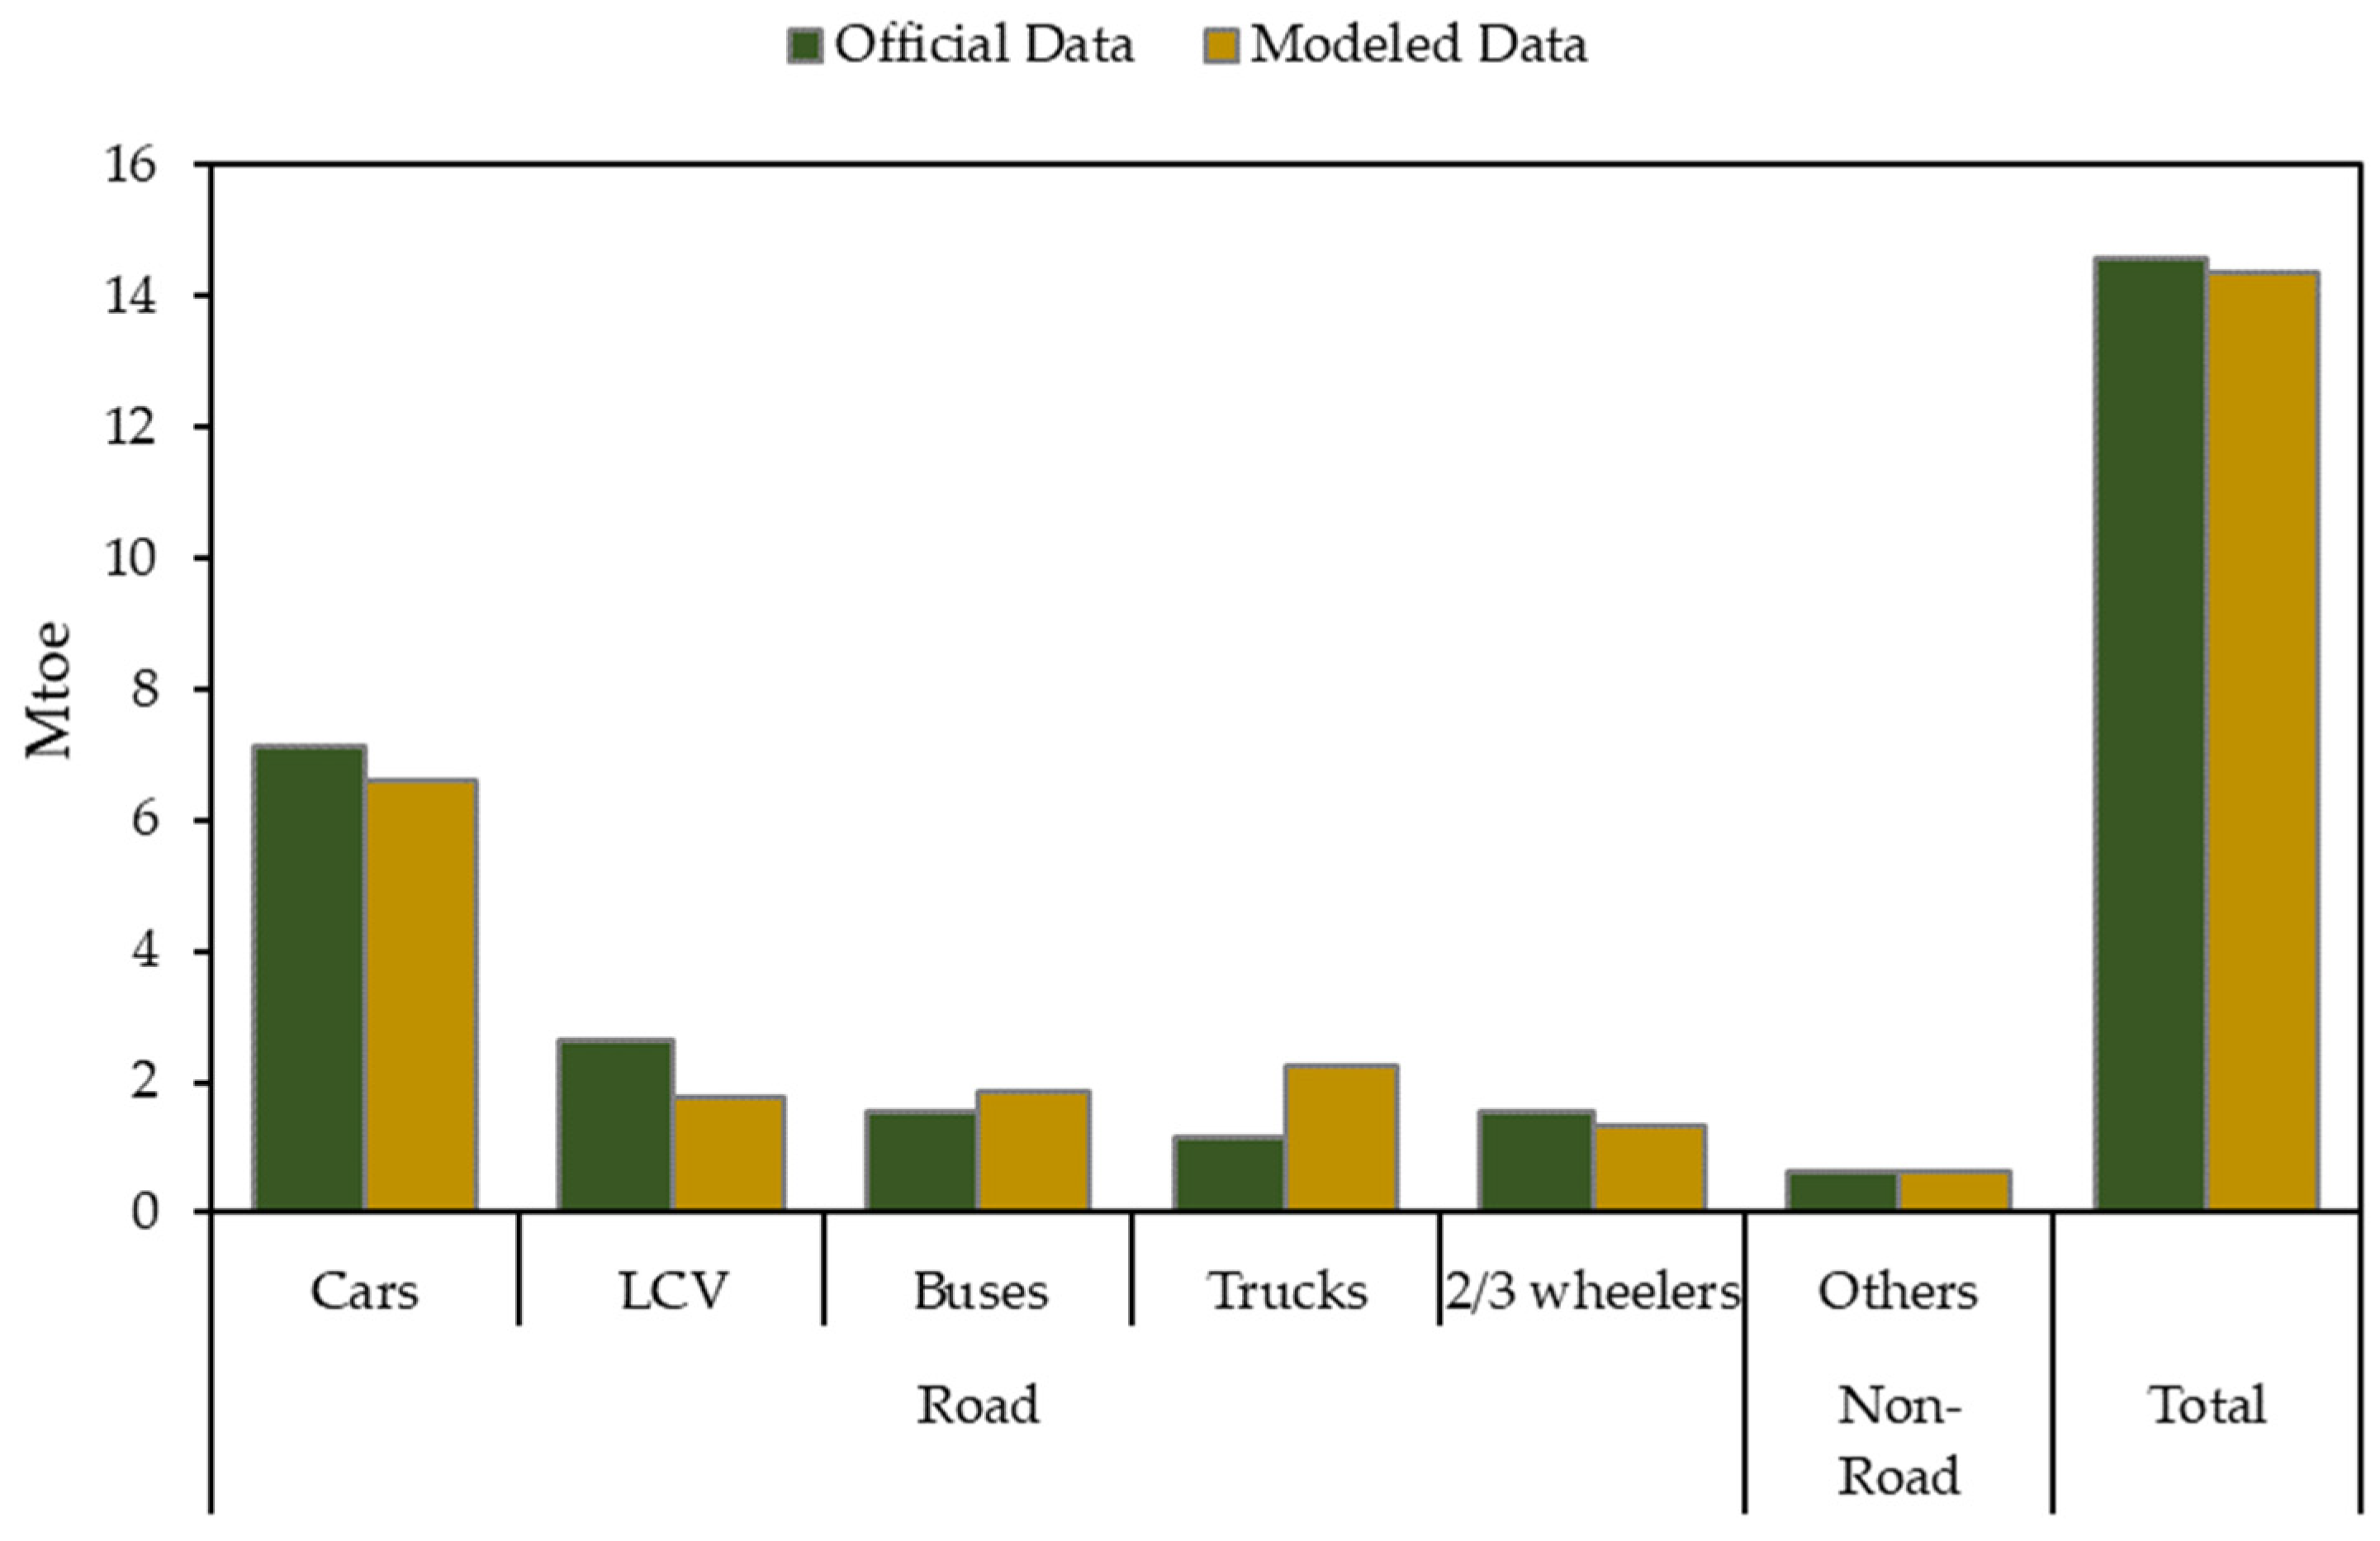
To assess the robustness of the baseline inventory, modeled estimates of vehicle activity, fleet composition, and fuel consumption were systematically compared with official national datasets, including vehicle registration statistics and energy consumption records. As shown in Figure A1 (Appendix A) and Table S1, total transport-sector energy consumption (in Mtoe) from the GAINS model closely aligns with official estimates, with differences remaining within a narrow margin. Consistent agreement is also observed across major fuel types, including diesel and gasoline, and, where data are available, for vehicle stock in key categories. These comparisons indicate that both the aggregate energy balance and the distribution of activity across fuels and vehicle types are well captured by the model.
Minor discrepancies are primarily associated with underreported or informal segments, particularly motorcycles and three-wheelers, as well as fuel use that is not fully captured in official reporting systems. Such differences are characteristic of transport-sector datasets in developing-country contexts and reflect structural data limitations rather than model inconsistencies. Overall, the close agreement across multiple validation dimensions supports the internal consistency and empirical grounding of the inventory, indicating that it provides a credible and policy-relevant representation of real-world transport emissions for subsequent scenario analysis.
Uncertainties remain due to limited monitoring of non-road activity, variability in vehicle maintenance practices, fuel adulteration, and incomplete coverage of informal transport modes. These uncertainties reflect structural data constraints common in developing country contexts rather than methodological shortcomings. Although a quantitative uncertainty analysis is beyond the scope of this study, explicitly acknowledging these limitations provides important context for interpreting the results and highlights priorities for future data improvement. Building on this validated baseline, the following section evaluates how alternative policy strategies influence future emission pathways.

3.2. Emission Pathways and Mitigation Potential for 2024 to 2050

Future emission pathways for Pakistan transport sector were assessed through 2050 under four policy scenarios using the integrated EnerNEO and GAINS modeling framework. Between 2024 and 2050, Pakistan is projected to undergo significant demographic and economic change. Population growth of approximately 42 percent, nearly threefold growth in gross domestic product, and continued urbanization are expected to substantially increase transport demand. Urban population is projected to rise from 94 million in 2024 to 122 million by 2050, while per capita income increases from EUR 1629 to EUR 3060. These structural drivers form the basis for evaluating emission outcomes under alternative policy pathways.
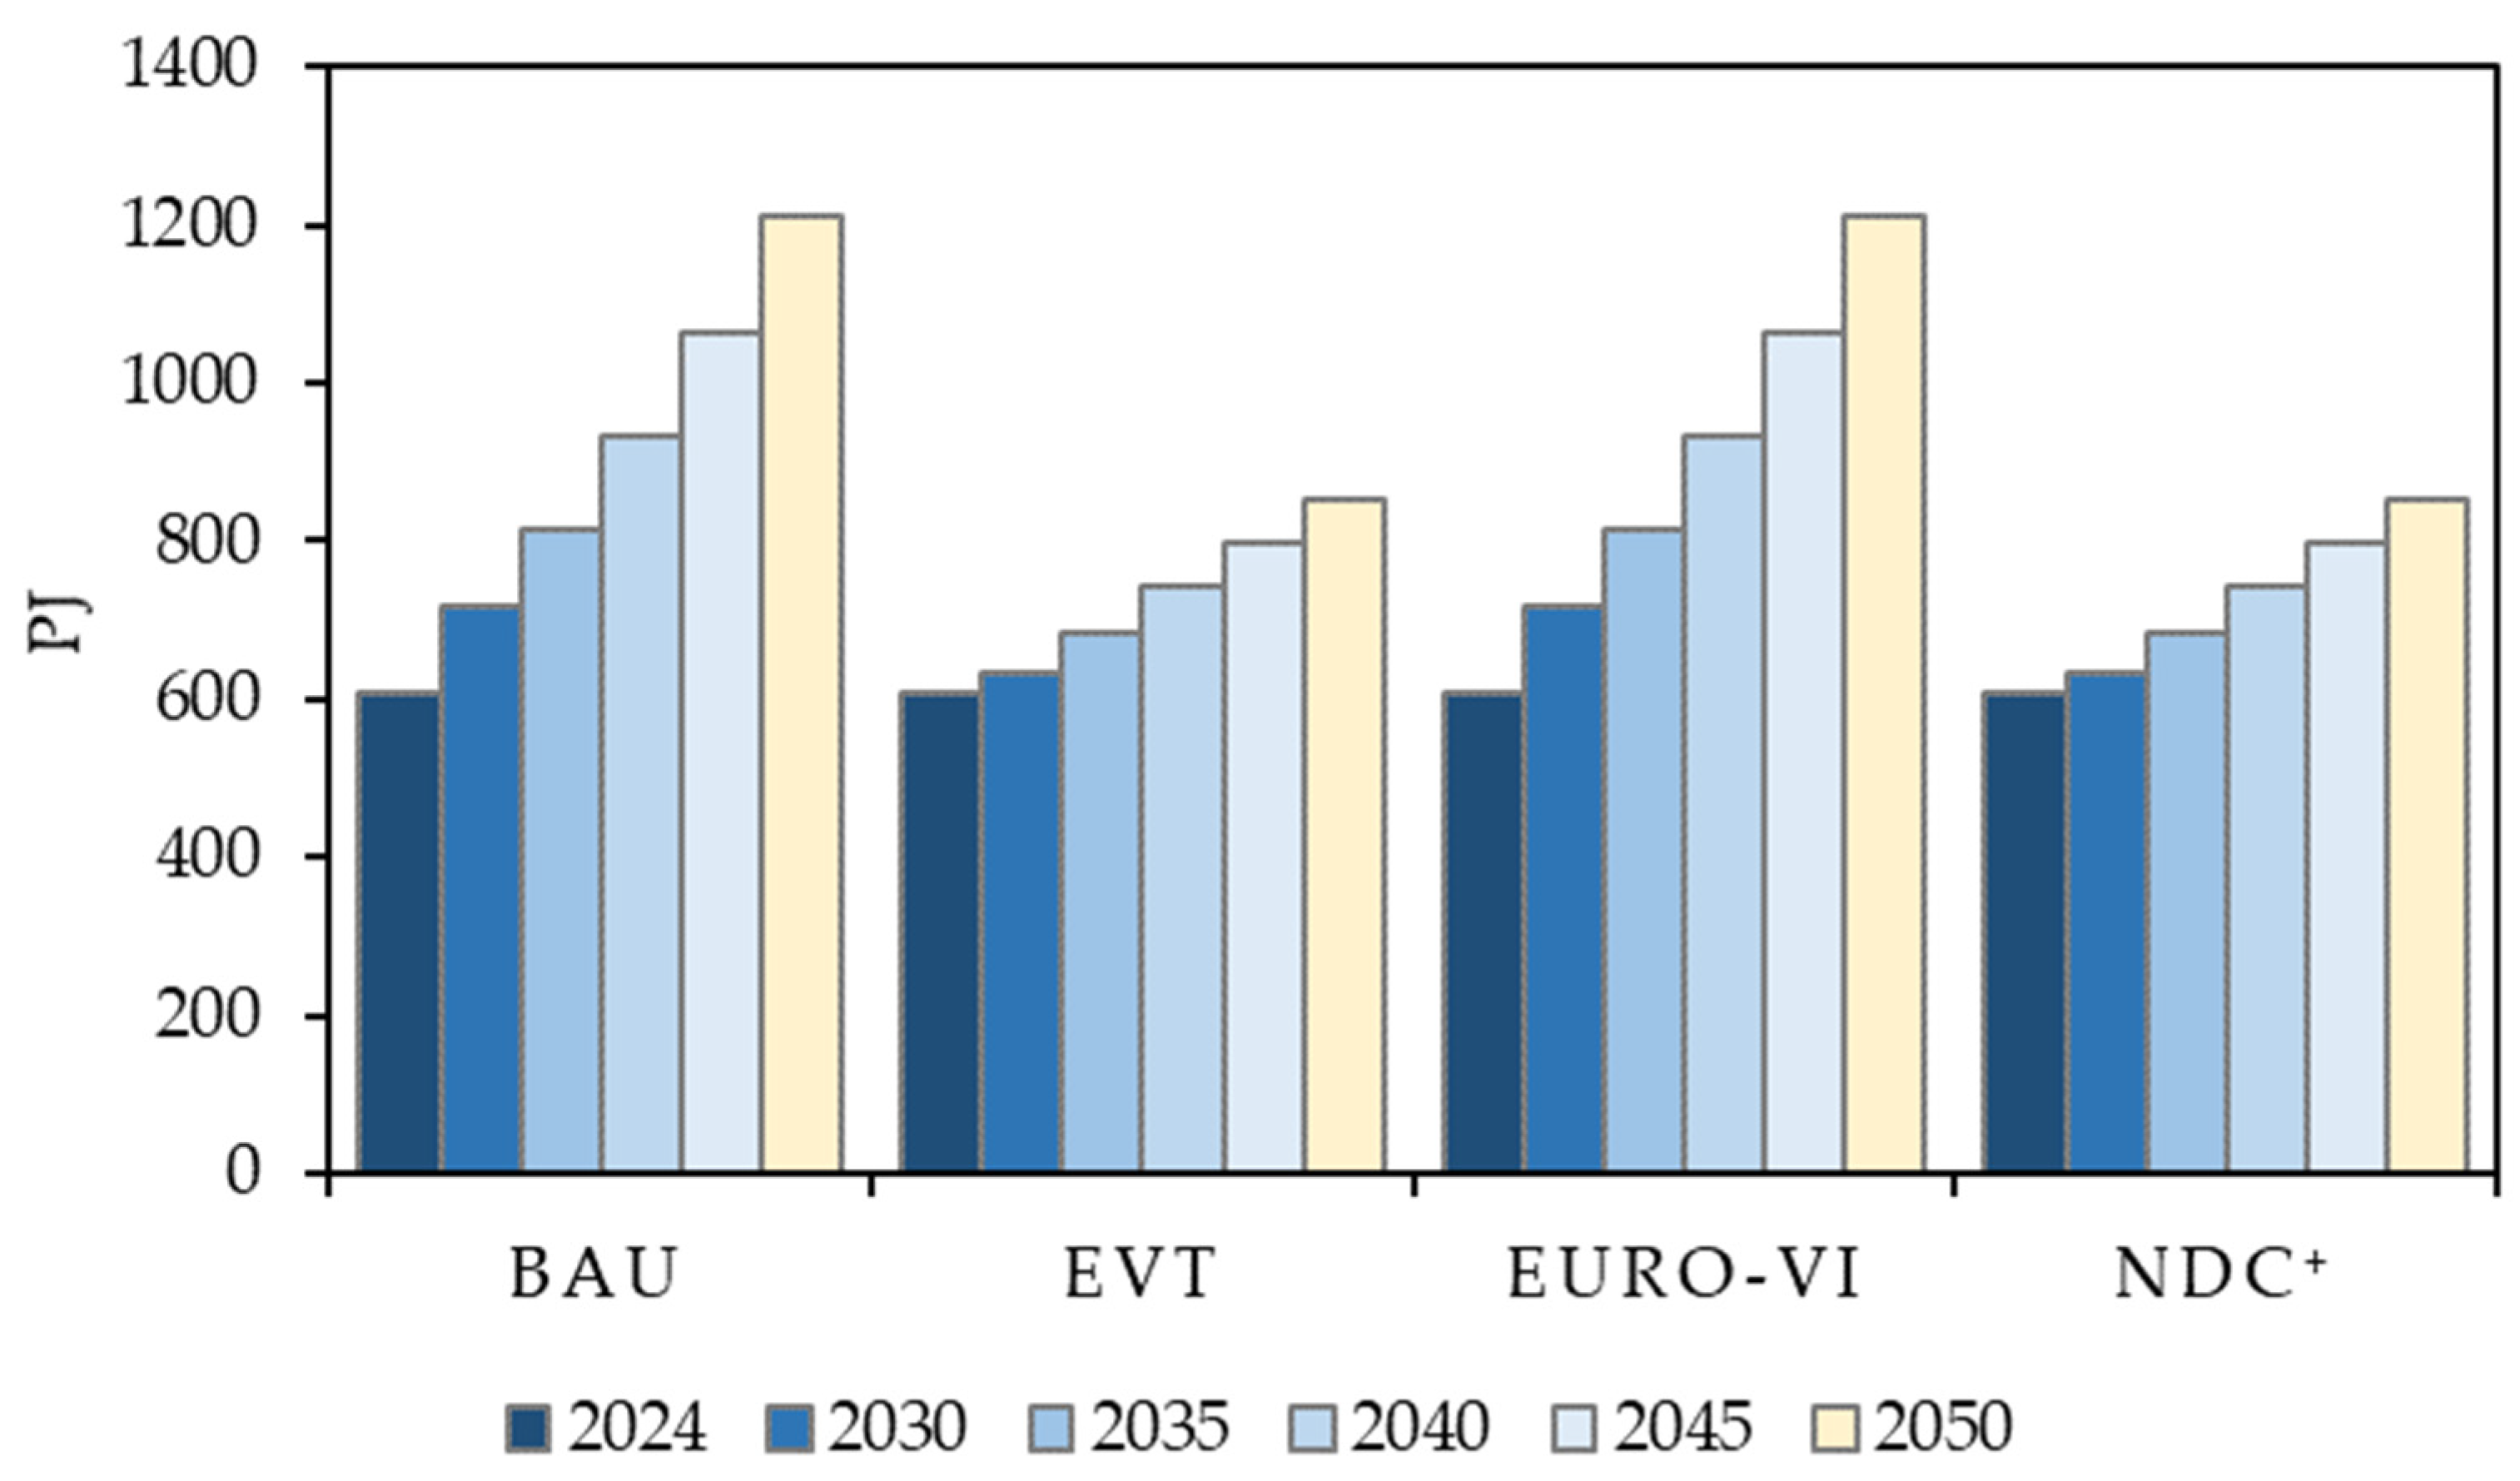
Energy demand projections reveal substantial divergence across scenarios, as shown in Figure 3. Under the Business as Usual and Euro VI scenarios, final transport energy demand nearly doubles from 609.6 PJ in 2024 to approximately 1211.6 PJ by 2050. This increase reflects continued reliance on fossil fuels and illustrates the limitations of end of pipe emission control measures that do not address underlying growth in transport activity. In contrast, the Electric Vehicle Transition and NDC+ scenarios significantly moderate energy demand growth, limiting final energy consumption to approximately 852.3 PJ by 2050. These reductions result from higher vehicle efficiency, electrification, and fuel diversification. Relative to Business as Usual, this represents nearly a 50 percent reduction in projected energy demand by mid-century.
Changes in energy demand directly influence emission trajectories because fuel consumption is the primary determinant of both greenhouse gas emissions and many air pollutants. Electrification scenarios reduce energy demand due to the substantially higher efficiency of electric drivetrains compared to internal combustion engines. In contrast, the Euro-VI scenario primarily targets pollutant emissions through improved after-treatment technologies but does not substantially alter total energy demand, as vehicle propulsion systems remain largely unchanged.
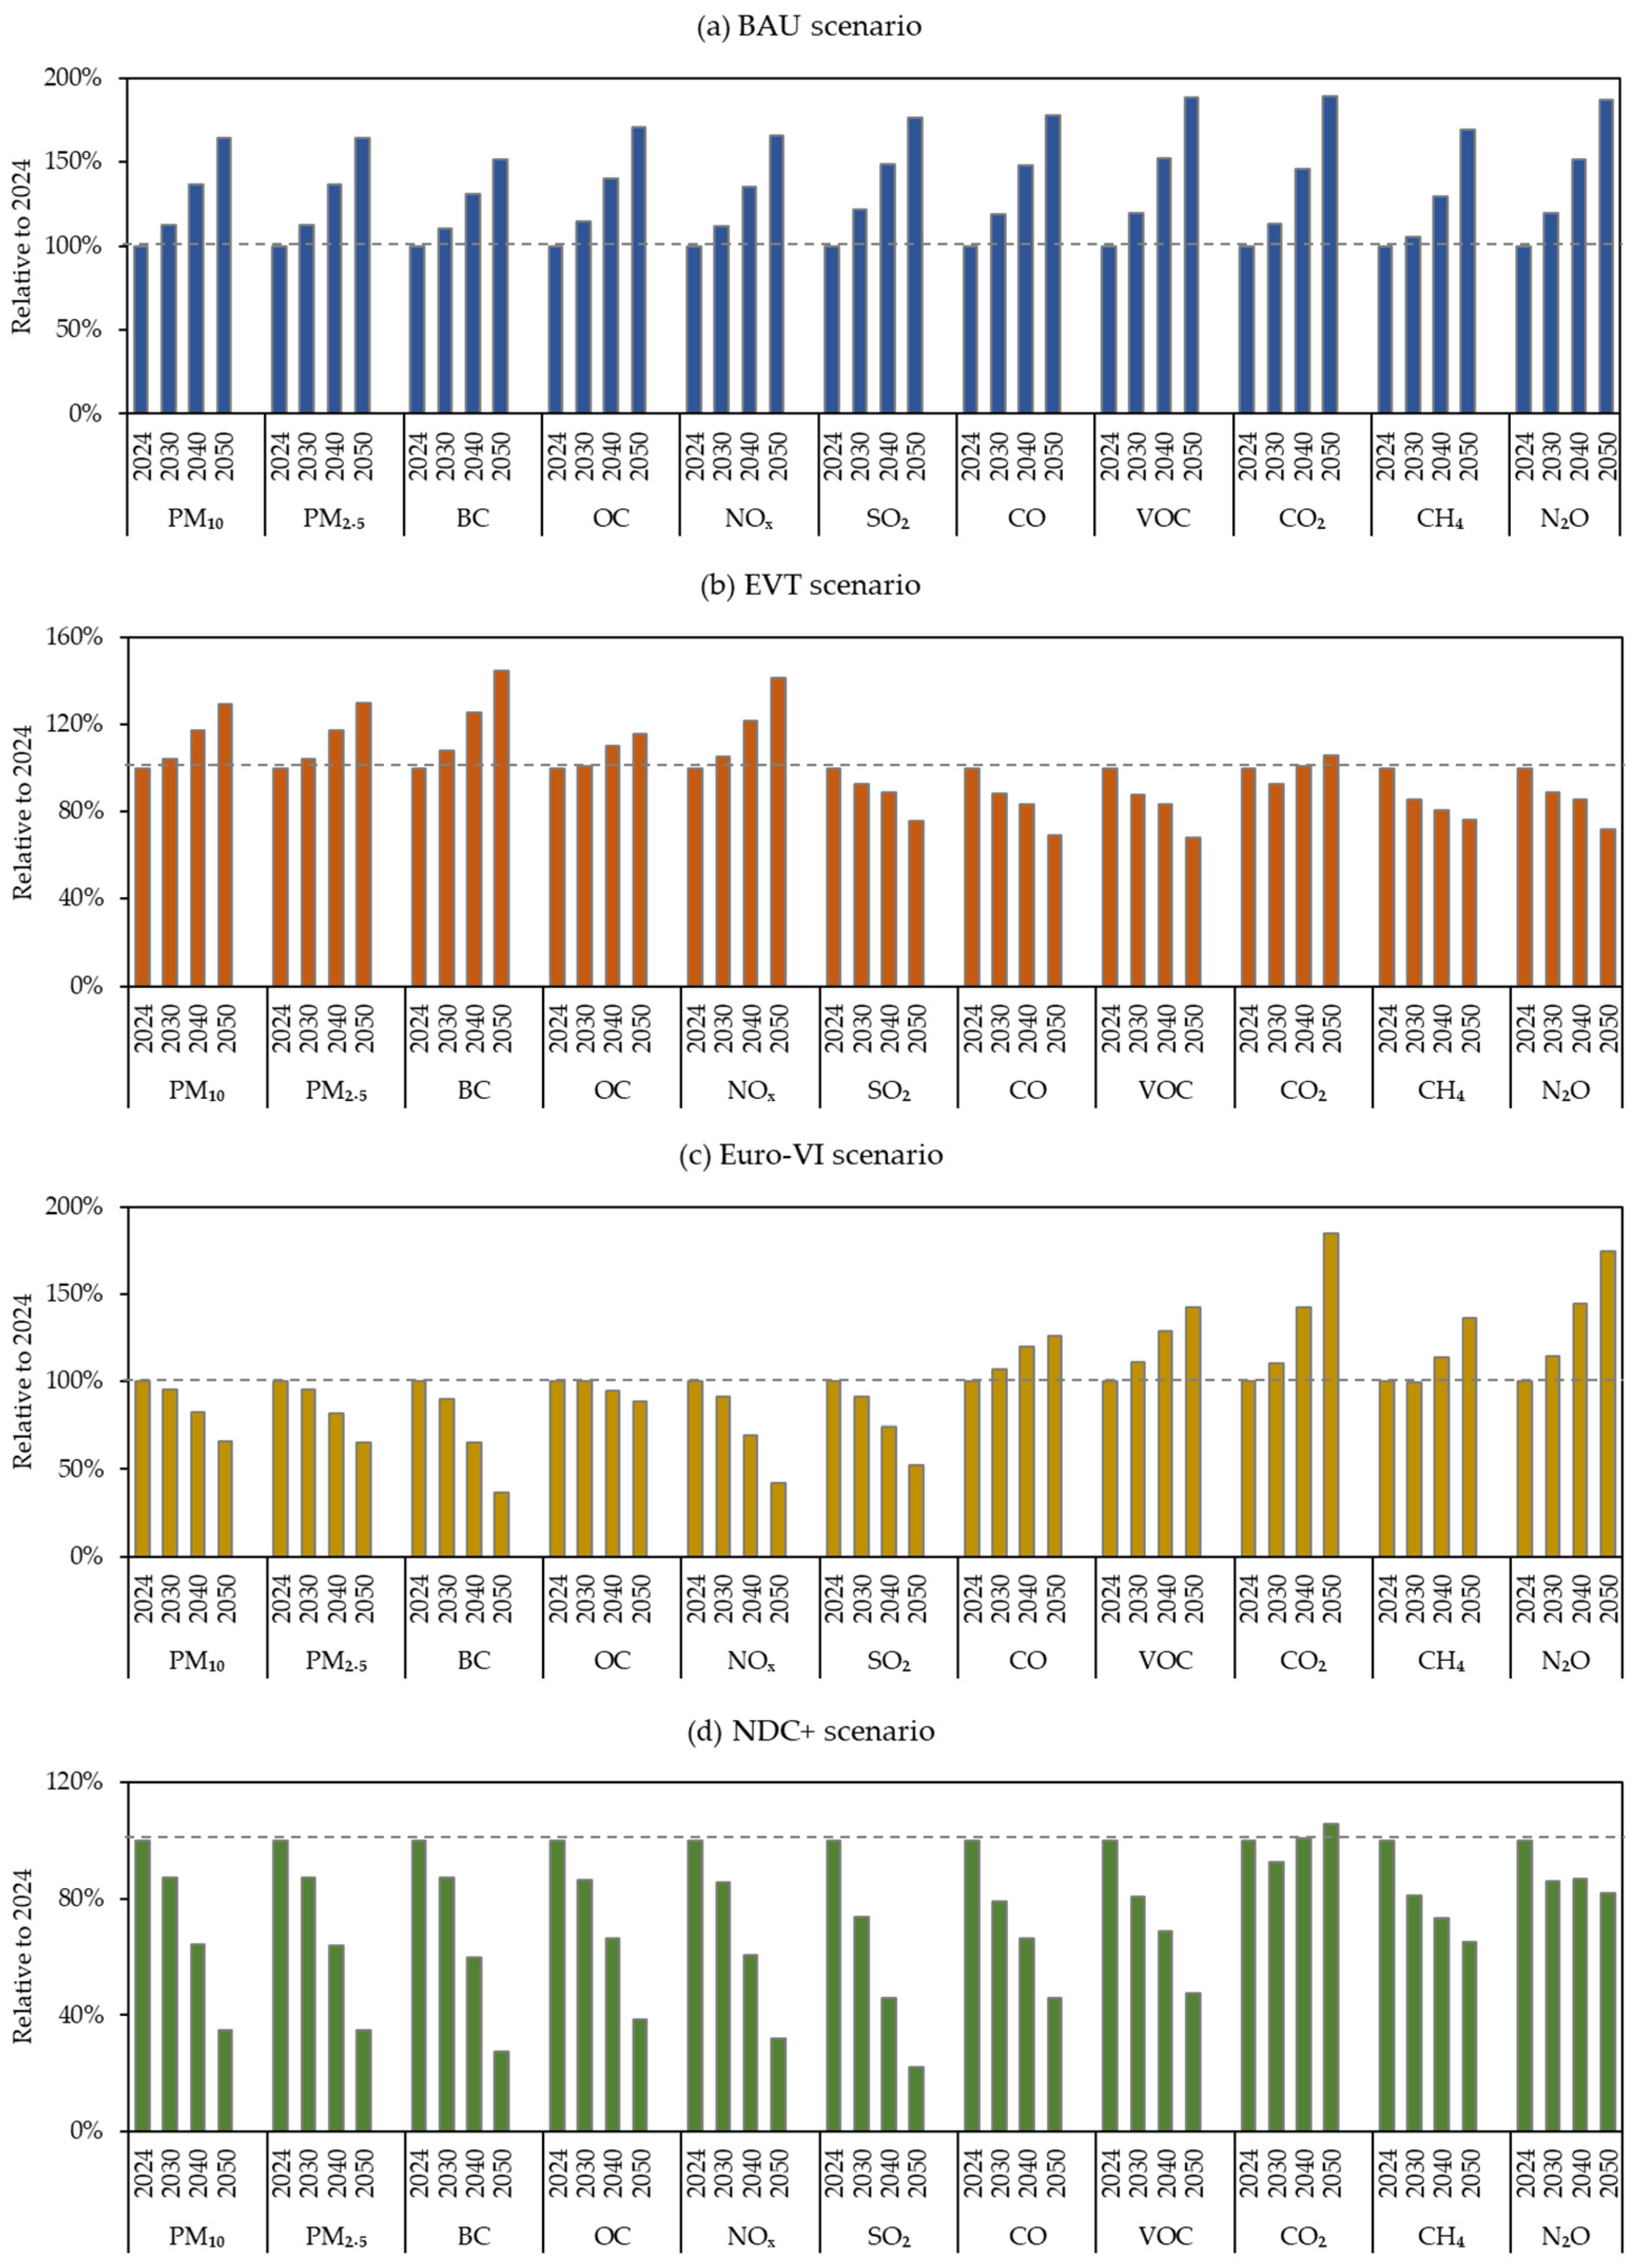
The divergence in energy demand translates directly into differences in air pollutant emissions, as illustrated in Figure 4. Under the BAU scenario, emissions of nearly all pollutants increase steadily through 2050. PM2.5 emissions rise from 22.1 kt in 2024 to 36.2 kt by 2050, representing an increase of 64 percent, while NOx emissions increase from 302 kt to 500 kt. Black carbon emissions increase by nearly 50 percent, reaching 18.2 kt by 2050, driven by sustained diesel fuel use in the absence of stringent emission controls. Further, under the BAU scenario, total emissions increase over time primarily due to continued growth in transport demand and expansion of the vehicle fleet. Although gradual fleet modernization introduces newer vehicles with improved emission performance, these improvements are insufficient to offset the overall increase in activity levels. As a result, aggregate emissions of several pollutants continue to rise despite modest technological progress.
Mitigation oriented scenarios yield substantially different outcomes. The Electric Vehicle Transition scenario delivers moderate improvements in air quality by reducing PM2.5 emissions to 28.7 kt by 2050, approximately 20 percent lower than Business as Usual levels. Carbonaceous emissions also decline due to reduced combustion-based vehicle activity. The Euro VI scenario produces the largest reductions in conventional air pollutants, reducing PM2.5 emissions by approximately 60 percent and NOx emissions by approximately 75 percent relative to Business as Usual by 2050, resulting in emissions of 14.5 kt and 127 kt, respectively. These reductions reflect the effectiveness of stringent emission standards supported by low sulfur fuels and advanced exhaust after treatment technologies [93].
The integrated NDC+ scenario delivers the most comprehensive emission reductions across all pollutants. By 2050, PM2.5 emissions decline to 7.7 kt, black carbon emissions to 3.3 kt, and NOx emissions to 97 kt. Substantial reductions are also observed for SO2, CO, and VOC emissions. These results demonstrate the strong synergies that arise when electrification, emission standards, and structural transport reforms are implemented together.
GHG emission trajectories show distinct scenario dependent patterns. Under Business as Usual, CO2 emissions increase from 38.7 Mt in 2024 to 72.9 Mt by 2050, reflecting rising fossil fuel consumption. The Euro VI scenario achieves only marginal reductions in CO2 emissions relative to Business as Usual, highlighting the limited climate mitigation potential of emission control technologies that do not involve fuel switching [64]. In contrast, the EVT and NDC+ scenarios stabilize CO2 emissions at approximately 41 to 42 Mt by 2050 despite continued growth in transport activity. Methane and nitrous oxide emissions follow similar trends, with the NDC+ scenario achieving nearly 60 percent reductions relative to Business as Usual by 2050.
A comparison of the mitigation scenarios indicates that the Euro-VI pathway delivers the largest reductions in conventional air pollutants due to stringent emission control technologies, while the EVT scenario achieves the most substantial reductions in carbon dioxide emissions through electrification. The integrated NDC+ scenario combines these approaches and therefore provides the most balanced outcome, delivering substantial improvements in both air quality and climate mitigation relative to the business-as-usual trajectory.
The most important insight from Figure 4 is the magnitude of emission reductions achievable through integrated mitigation strategies, particularly under the NDC+ scenario, which demonstrates the largest simultaneous decline across both air pollutants and greenhouse gases.
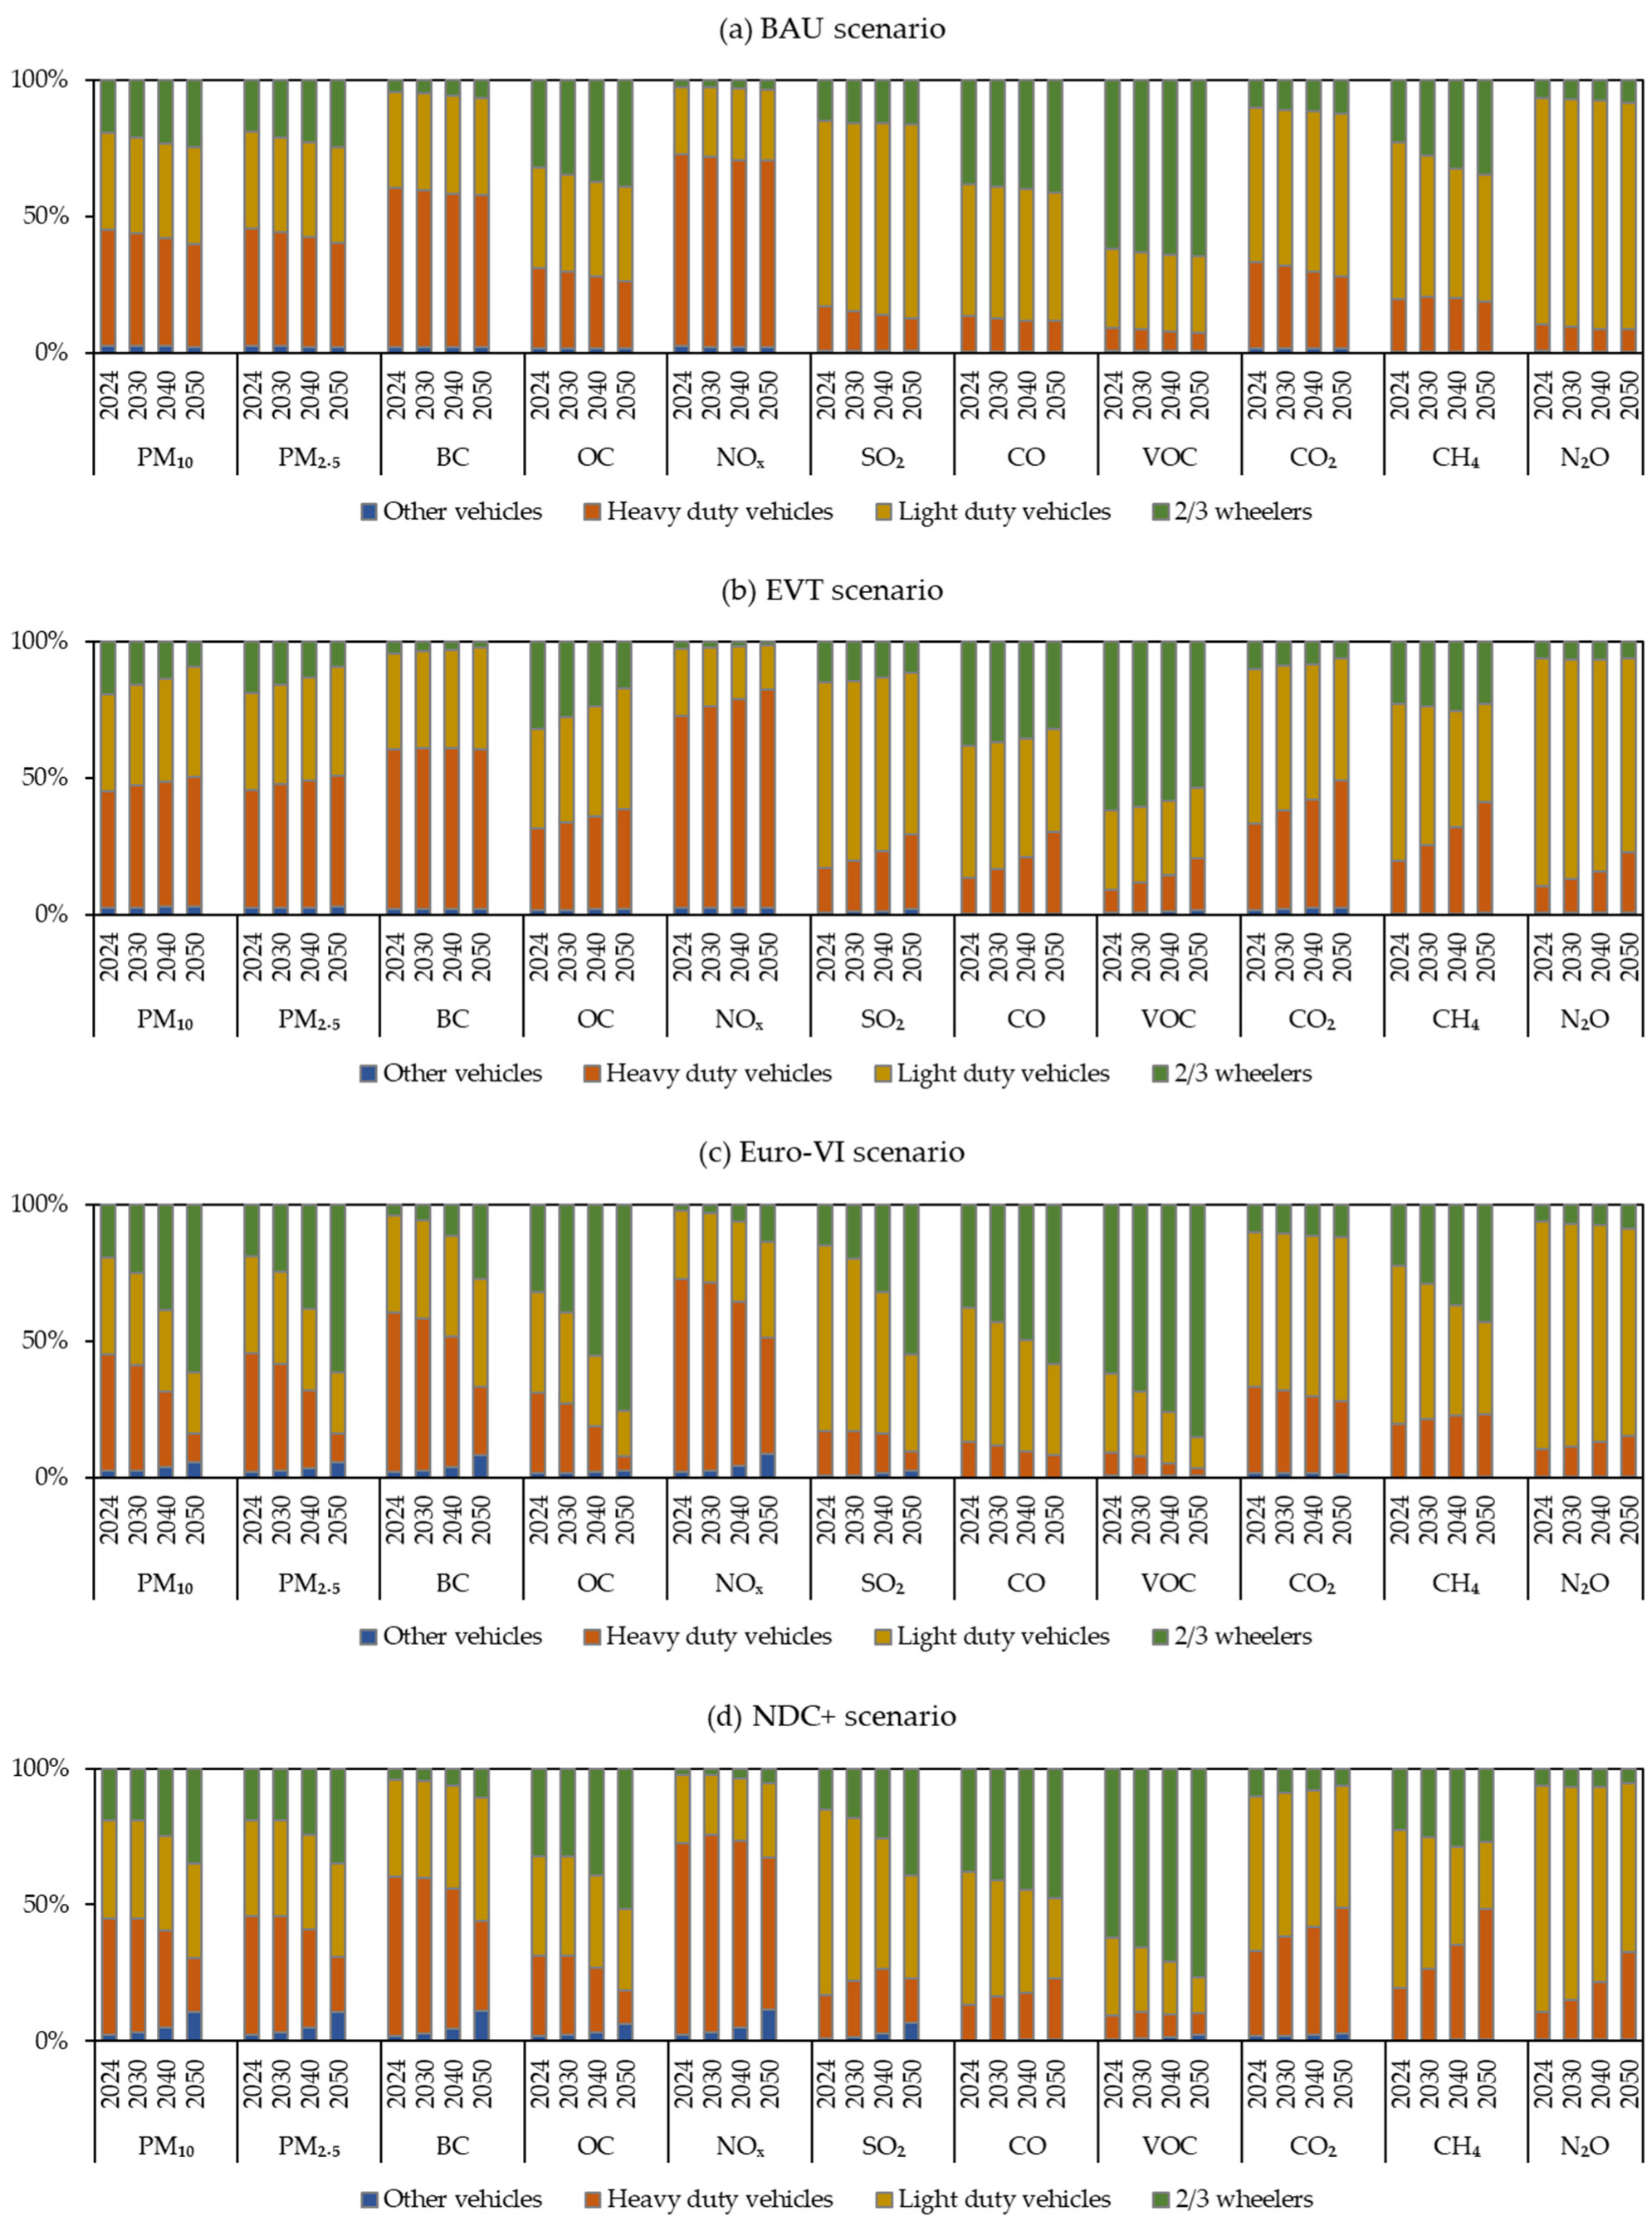
Category specific emission dynamics further inform policy priorities, as shown in Figure 5. Heavy-duty vehicles remain the dominant contributors to PM2.5, black carbon, and NOx emissions throughout the projection period, particularly under BAU conditions. Two- and three-wheelers continue to dominate VOC and CO emissions due to persistent incomplete combustion and limited technology upgrades. Passenger cars remain the largest source of CO2 emissions, although their contribution declines substantially under electrification focused scenarios.
Figure 5 illustrates a structural shift in the composition of transport emissions over time, with electrification and stricter emission standards gradually reducing the contribution of high-emitting vehicle categories. However, residual emissions remain even under ambitious mitigation scenarios, indicating the continued importance of complementary policy measures.
Overall, the scenario analysis demonstrates that continuation of current policies leads to unsustainable growth in emissions and energy demand. Electrification focused pathways are effective in reducing GHG emissions, while stringent emission standards are essential for improving air quality. The integrated NDC+ scenario achieves the most balanced and robust outcomes across both air quality and climate objectives, highlighting the importance of comprehensive policy packages that combine electrification, emission standards, and broader structural reforms. Despite significant reductions under the NDC+ scenario, some emissions persist due to remaining internal combustion vehicles, heavy-duty transport segments that are more difficult to electrify, and continued growth in transport demand. These findings provide strong empirical support for integrated transport strategies aligned with Pakistan long term sustainability goals. Detailed projections of air pollutant and greenhouse gas (GHG) emissions under different policy scenarios for 2024–2050 are provided in the Supplementary Materials, including total transport sector emissions (Table S8) and disaggregated emissions by source categories (road and non-road) (Table S9).

4. Discussion

The results of this study demonstrate that emissions from Pakistan’s transport sector are highly sensitive to the design and coherence of policy interventions. Under the BAU pathway, emissions of both air pollutants and GHGs rise substantially through 2050 due to sustained growth in vehicle activity, energy consumption, and continued reliance on fossil fuels. These trajectories conflict with Pakistan’s climate commitments and national air quality objectives, exacerbating public health, environmental, and economic challenges. In contrast, mitigation-oriented scenarios, EVT, Euro VI, and the integrated NDC+ pathway, significantly alter emission trajectories through cleaner technologies, improved fuel quality, and structural reforms. These results highlight that long-term sustainability outcomes are determined primarily by policy direction rather than incremental technological change [81].
Distinct differences in mitigation performance emerge across scenarios. The Euro VI scenario achieves the largest reductions in conventional air pollutants, particularly particulate matter, nitrogen oxides, and black carbon, driven by advanced exhaust after-treatment technologies and ultra-low sulfur fuels. These reductions demonstrate the effectiveness of stringent emission standards in reducing urban exposure to harmful pollutants. However, carbon dioxide reductions remain limited, underscoring that end-of-pipe controls alone are insufficient for deep decarbonization in the transport sector [64]. This implies that CO2 emissions under the Euro-VI scenario may be slightly underestimated; however, the magnitude of this effect is expected to be small relative to overall energy demand trends.
The Electric Vehicle Transition scenario delivers the most pronounced climate benefits, reducing carbon dioxide, methane, and nitrous oxide emissions through large-scale displacement of internal combustion engines and reduced reliance on petroleum fuels. While this scenario improves tailpipe emissions moderately, particularly for particulate matter and nitrogen oxides, legacy vehicle fleets and non-electrified segments continue to operate under weak emission standards. These results emphasize that electrification, while essential for climate mitigation, must be paired with stringent emission controls to deliver comprehensive air quality improvements. The integrated NDC+ scenario consistently outperforms single policy approaches, combining accelerated electrification, Euro VI implementation, fuel quality improvements, vehicle efficiency gains, modal shift, and strengthened inspection and maintenance programs. This coordinated approach achieves the largest cumulative reductions in both air pollutants and GHGs by mid-century, demonstrating strong synergies between climate and air quality objectives [64]. This scenario aligns closely with Pakistan’s third Nationally Determined Contribution, which emphasizes maximizing cross-sectoral co-benefits first rather than pursuing isolated mitigation actions.
It should be noted that the present analysis focuses on exhaust emissions and does not explicitly account for non-exhaust particulate matter sources such as tire and brake wear or road dust resuspension. As electric vehicles tend to be heavier than conventional vehicles, non-exhaust emissions may increase, implying that the reported reductions in particulate matter represent exhaust emission reductions and may therefore be somewhat overestimated in terms of total PM impacts.
Vehicle-category disaggregation further identifies priority intervention areas. Heavy-duty diesel vehicles remain the dominant contributors to black carbon and nitrogen oxide emissions, reflecting high activity levels, fuel consumption, and emission intensity [65]. They are therefore critical targets for stringent emission standards, fuel quality enforcement, and maintenance programs. Passenger cars contribute the largest share of carbon dioxide emissions, highlighting the importance of accelerating electrification and efficiency improvements in this segment. Two- and three-wheelers persist as major sources of volatile organic compounds and carbon monoxide due to incomplete combustion, aging fleets, and limited regulatory oversight. Addressing emissions from these largely informal segments requires tailored policy instruments, including fleet renewal incentives, compliance support, and improved monitoring, rather than uniform regulations. Transport energy demand projections reinforce the broader development implications of policy choices. Under BAU, energy demand nearly doubles by 2050, increasing dependence on imported fuels and exposure to international price volatility. Electrification-driven pathways moderate energy demand growth due to the higher efficiency of electric drivetrains. This reduction not only lowers emissions but also enhances energy security, reduces pressure on foreign exchange reserves and strengthens macroeconomic resilience, highlighting the dual environmental and economic benefits of transport electrification [97,98].
Several sources of uncertainty should be noted. Emission estimates for VOCs and carbon monoxide are particularly sensitive to variability in driving conditions, fleet maintenance, and fuel sulfur content. Two- and three-wheelers, as well as informal transport fleets, carry additional uncertainty due to limited activity and composition data. Limitations in policy implementation, including availability of charging infrastructure, enforcement capacity, and investment access, further affect outcomes [69]. The absence of local Portable Emissions Measurement Systems (PEMS) or dynamometer data represents a further key uncertainty in this study. While the GAINS framework uses regionally calibrated emission factors and multiple data constraints (including national fuel consumption statistics and vehicle registration records) to ensure consistency, direct validation against real-world driving conditions in Pakistan is not possible with currently available data. This limitation is particularly relevant for pollutants such as VOCs and CO, which are highly sensitive to driving conditions and maintenance practices. Future research incorporating local PEMS measurements would substantially improve the accuracy of emission estimates.
Furthermore, the NDC+ scenario assumes high compliance with inspection and maintenance (I&M) programs, reflecting an idealized implementation of regulatory measures. In practice, compliance rates may be lower due to institutional and enforcement constraints, which could reduce the magnitude of projected emission reductions. As compliance leakage is not explicitly modeled, the estimated mitigation—particularly for particulate matter—should be interpreted as an upper-bound outcome under effective policy enforcement.
This study adopts a tank-to-wheel (TTW) perspective, meaning that upstream emissions from electricity generation and fuel refining are not included in the transport-sector emission estimates. The net GHG reductions from electrification reported here therefore reflect tailpipe emissions only. A well-to-wheel (WTW) analysis would likely yield lower net reductions under current conditions, given Pakistan’s relatively carbon-intensive electricity grid (approximately 0.45–0.55 kg CO2/kWh) and transmission losses (on the order of 15–20%) [99,100,101]. The net climate benefits of transport electrification thus depend critically on the emissions intensity of the electricity supply. With a generation mix that currently relies heavily on thermal sources (natural gas, furnace oil, and coal), the life-cycle GHG reductions from EV adoption may be lower than the tailpipe reductions reported here. However, under national energy transition plans, grid carbon intensity is expected to decline substantially by 2050, improving the life-cycle benefits of EVs over time.
Furthermore, electrification may shift air pollutant emissions from urban traffic corridors to power plant locations, with implications for population exposure and health impacts. While total emissions depend on the power sector, reductions in tailpipe emissions (e.g., NOx, PM2.5, and VOCs) provide clear air quality benefits in urban areas, particularly along traffic corridors, and represent an important co-benefit of electrification. Future research integrating well-to-wheel analysis with spatially resolved power sector modeling would provide a more comprehensive assessment of the climate and air quality implications of transport electrification in Pakistan. Overall, achieving sustained improvements in air quality and climate outcomes in Pakistan’s transport sector requires comprehensive, integrated policy packages rather than isolated interventions. Coordinated deployment of electrification, stringent emission standards, fuel quality upgrades, and structural transport reforms is essential for meeting national climate and clean air goals. Future research should build on this framework by incorporating health impact assessments, cost benefit analysis, financing mechanisms, and equity considerations to support evidence-based policy design and implementation.

5. Conclusions

This study develops the first comprehensive and technology detailed emission inventory and scenario-based assessment of Pakistan’s transport sector, covering both air pollutants and GHGs for the 2024 base year with projections through 2050. The analysis confirms that road transport overwhelmingly dominates sectoral emissions, contributing more than ninety-seven percent of total emissions for most pollutants. At the same time, pronounced differences in emission profiles across vehicle categories and fuel types highlight the structural complexity of Pakistan’s transport system and the need for differentiated mitigation strategies. Heavy-duty diesel vehicles are identified as the principal sources of black carbon and nitrogen oxides, while gasoline powered passenger cars and two- and three-wheelers dominate emissions of carbon dioxide, sulfur dioxide, volatile organic compounds, and carbon monoxide. These findings demonstrate that uniform policy approaches are unlikely to deliver optimal outcomes and that targeted interventions aligned with vehicle type and fuel use are essential.
The scenario analysis illustrates that continuation of current trends under a BAU pathway would result in substantial growth in both air pollutants and GHG emissions by mid-century, driven by rising transport activity and sustained dependence on fossil fuels. Such trajectories are incompatible with Pakistan’s climate commitments and clean air objectives. In contrast, mitigation-oriented pathways show that strategic policy choices can fundamentally alter future emission outcomes. The electric vehicle transition scenario delivers substantial reductions in carbon dioxide emissions by displacing fossil fuel consumption and improving overall energy efficiency. The Euro VI scenario achieves the strongest reductions in conventional air pollutants, particularly fine particulate matter, nitrogen oxides, and black carbon, through the deployment of advanced emission control technologies and improved fuel quality. Most importantly, the integrated NDC+ scenario consistently outperforms individual policy pathways by combining electrification, stringent emission standards, and broader structural reforms. This integrated approach delivers the largest simultaneous reductions in air pollutants and GHGs, confirming the presence of strong air quality and climate co benefits.
Energy demand projections further reinforce the strategic value of integrated transport mitigation. Under BAU conditions, transport energy demand nearly doubles by 2050, increasing reliance on imported petroleum fuels and heightening energy security risks. Electrification focused pathways significantly moderate this growth due to the higher efficiency of electric drivetrains, thereby reducing fuel import dependence and exposure to international price volatility. These results demonstrate that transport decarbonization offers not only environmental benefits but also important economic and energy security advantages, strengthening the case for its prioritization within national development planning.
Several limitations should be acknowledged. Despite the use of extensive national datasets and technology explicit modeling, uncertainties remain related to informal vehicle fleets, non-road mobile sources, future fuel quality improvements, and assumptions regarding electricity sector decarbonization. In addition, this study does not explicitly quantify implementation costs, financing requirements, behavioral responses, or monetized health benefits. Given the magnitude of projected reductions in fine particulate matter and other pollutants, the associated public health and economic gains are likely to be substantial and warrant dedicated analysis in future research. Further extensions of this framework could incorporate health impact assessment, cost benefit analysis, and equity considerations to strengthen policy relevance and support implementation.
Overall, this study demonstrates that ambitious yet technically feasible interventions in the transport sector can deliver substantial improvements in air quality, climate mitigation, and energy system performance in Pakistan. The results provide robust evidence in support of integrated policy packages that align electrification, emission standards, and structural reforms with national climate commitments. By adopting such coordinated strategies, Pakistan can advance cleaner mobility, reduce public health risks, and enhance long term economic and environmental resilience. The analytical approach and insights presented here are also applicable to other rapidly motorizing developing economies facing similar challenges, reinforcing the broader relevance of integrated transport planning for sustainable development.

Supplementary Materials

The following supporting information can be downloaded at https://www.mdpi.com/article/10.3390/su18083954/s1, Table S1: Transport sector fuel consumption by vehicle category (2024), GAINS vs. official statistics; Table S2: Baseline fleet composition used in the modeling framework (unit: 1000 vehicles); Table S3: Energy consumption by transport categories under different scenarios for 2024–2050 (unit: PJ); Table S4: Baseline distribution of vehicle categories by emission standard application rates (units: % of fuel use/activity); Table S5: Sector- and category-wise air pollutant and greenhouse gas (GHG) emissions from Pakistan’s road transport sources in 2024 (units: kt; CO2 in Mt); Table S6: Sector- and category-wise air pollutant and greenhouse gas (GHG) emissions from Pakistan’s non-road transport sources in 2024 (units: kt; CO2 in Mt); Table S7: Fuel-type–wise air pollutant and greenhouse gas (GHG) emissions from Pakistan’s road and non-road transport sources in 2024 (units: kt; CO2 in Mt); Table S8: Air pollutant and greenhouse gas (GHG) emissions from Pakistan’s transport sector under different policy scenarios for 2024–2050 (units: kt; CO2 in Mt); Table S9: Air pollutant and greenhouse gas (GHG) emissions from Pakistan’s transport sector source categories (road and non-road) under different policy scenarios for 2024–2050 (units: kt; CO2 in Mt).

Author Contributions

Conceptualization, K.A.M. and P.P.; methodology, K.A.M. and P.P.; software, K.A.M.; validation, K.A.M. and P.P.; formal analysis, K.A.M.; investigation, K.A.M. and P.P.; data curation, K.A.M.; writing—original draft preparation, K.A.M.; writing—review and editing, P.P., S.M. and A.G.; visualization, K.A.M. and P.P. All authors have read and agreed to the published version of the manuscript.

Funding

This research received no external funding.

Institutional Review Board Statement

Not applicable.

Informed Consent Statement

Not applicable.

Data Availability Statement

The datasets generated and analyzed during the current study are available from the corresponding author upon reasonable request.

Acknowledgments

The first author would like to express sincere gratitude to the International Institute for Applied Systems Analysis (IIASA) for generously providing access to the GAINS model. The authors also acknowledge the use of the EnerNEO Pakistan model framework for supporting transport energy demand projections. Special thanks to the Global Climate–Change Impact Studies Centre (GCISC) for providing support and resources.

Conflicts of Interest

The authors declare no conflicts of interest.

Abbreviations

The following abbreviations are used in this manuscript:
BAUBusiness-as-Usual
BCBlack Carbon
CH4Methane
COCarbon Monoxide
CO2Carbon Dioxide
DPFDiesel Particulate Filter
EFEmission Factor
EnerNEOEnergy–New Economic Outlook
Euro-VIEuro VI Vehicle Emission Standards
EVElectric Vehicle
EVTElectric Vehicle Transition
GAINSGreenhouse Gas–Air Pollution Interactions and Synergies
GCISCGlobal Climate Change Impact Studies Centre
GDPGross Domestic Product
GHGGreenhouse Gas
HDIPHydrocarbon Development Institute of Pakistan
HEIHealth Effects Institute
ICEInternal Combustion Engine
IEAInternational Energy Agency
IIASAInternational Institute for Applied Systems Analysis
IPCCIntergovernmental Panel on Climate Change
MoCCMinistry of Climate Change
MoCC&ECMinistry of Climate Change and Environmental Coordination
MoFMinistry of Finance
MoIPMinistry of Industries and Production
MtMegaton
N2ONitrous Oxide
NDCNationally Determined Contribution
NOxNitrogen Oxides
OCOrganic Carbon
Pak-EPAPakistan Environmental Protection Agency
PJPetajoule
PMParticulate Matter
PM2.5Fine Particulate Matter
SCRSelective Catalytic Reduction
SDGsSustainable Development Goals
SO2Sulfur Dioxide
UNEPUnited Nations Environment Programme
UNFCCCUnited Nations Framework Convention on Climate Change
VKTVehicle Kilometers Traveled
VOCsVolatile Organic Compounds
WHOWorld Health Organization

Appendix A

The energy demand of road transport is estimated using a bottom-up modeling approach, which explicitly accounts for vehicle fleet composition, vehicle activity levels, fuel efficiency, and technology-specific parameters. This approach enables the estimation of both baseline fuel consumption and potential reductions under alternative technological or policy scenarios.
Total annual fuel consumption (AFC) in year (t) is estimated by aggregating fuel use across all vehicle categories (k) and fuel types (f). Fuel consumption is calculated as the product of the number of vehicles, annual vehicle activity, and fuel-specific energy intensity, expressed as:
A F C = f , k N f , k V K M f , k S F C f , k
where Nf,k denotes the number of active vehicles in category k operating on fuel f; VKMf,k represents the average annual vehicle kilometers traveled per vehicle, averaged across vehicle sizes and age cohorts; and SFCf,k is the specific fuel consumption, accounting for variations in vehicle technology, age, and driving conditions.
Vehicle stock data were obtained from official national statistics published by the Ministry of Finance [23]. Estimates of annual vehicle mileage were derived from the GAINS model, which incorporates national vehicle usage surveys, while specific fuel consumption values were obtained from established technical assessments and transport emission models [88,96].
Figure A1. Comparison of transport sector fuel consumption by vehicle category in the base year 2024 as estimated by the GAINS model and reported in official national statistics (Energy Yearbook/EnerNEO).
Sustainability 18 03954 g0a1
Figure A1 compares road and non-road transport fuel consumption by vehicle category for the base year 2024, as estimated by the GAINS model and as reported in official national statistics derived from the Energy Yearbook [27] and the EnerNEO energy model. The comparison shows a high level of consistency in total transport fuel use, indicating that the bottom-up modeling framework successfully reproduces aggregate national energy balances. At the category level, the relative ordering and magnitude of fuel consumption across major vehicle groups are broadly aligned between the two datasets, supporting the representativeness of the modeled fleet structure and activity assumptions. Moderate category-specific differences reflect known uncertainties in registered vehicle data, variations in real-world vehicle usage, and challenges in allocating fuel consumption across heterogeneous vehicle classes, particularly for light commercial vehicles and heavy-duty trucks. Overall, the close agreement at the aggregate level and reasonable correspondence across vehicle categories provide confidence that the GAINS-based baseline inventory captures Pakistan’s transport fuel consumption patterns with sufficient accuracy for scenario-based emission analysis.

References

  1. International Energy Agency (IEA). Transport, Energy and Carbon Dioxide: Moving Toward Sustainability; IEA: Paris, France, 2009. [Google Scholar]
  2. International Council on Clean Transportation (ICCT). Vision 2050: A Strategy to Decarbonize the Global Transport Sector by Mid Century; ICCT: Washington, DC, USA, 2020. [Google Scholar]
  3. Correia, G.H.d.A.R. Increasing transport sustainability through the integration between power grids and electric mobility systems. NPJ Sustain. Mobil. Transp. 2025, 2, 17. [Google Scholar] [CrossRef]
  4. Detter, H. Satisfying transportation needs in fast-growing metropolitan areas: Mobility solutions for mega-cities in developing countries. OPEC Energy Rev. 2015, 39, 418–444. [Google Scholar] [CrossRef]
  5. Venter, C.; Mahendra, A.; Hidalgo, D. From Mobility to Access for All: Expanding Urban Transportation Choices in the Global South; World Resources Institute: Washington, DC, USA, 2019; Available online: https://www.sipotra.it/wp-content/uploads/2019/05/From-Mobility-to-Access-for-All-Expanding-Urban-Transportation-Choices-in-the-Global-South.pdf (accessed on 25 December 2025).
  6. Winkler, L.; Pearce, D.; Nelson, J.; Babacan, O. The effect of sustainable mobility transition policies on cumulative urban transport emissions and energy demand. Nat. Commun. 2023, 14, 2357. [Google Scholar] [CrossRef]
  7. Wang, Q.; Su, M. The effects of urbanization and industrialization on decoupling economic growth from carbon emission—A case study of China. Sustain. Cities Soc. 2019, 51, 101758. [Google Scholar] [CrossRef]
  8. Foster, V.; Dim, J.U.; Vollmer, S.; Zhang, F. Understanding the challenge of decoupling transport-related CO2 emissions from economic growth in developing countries. World Dev. Sustain. 2023, 3, 100111. [Google Scholar] [CrossRef]
  9. Benitez, D.; Bisbey, J. Financing Climate Action for Transportation in Developing Countries; World Bank: Washington, DC, USA, 2025; Available online: https://www.worldbank.org/en/topic/transport/publication/financing-climate-action-for-transportation-in-developing-countries (accessed on 25 December 2025).
  10. Creutzig, F.; Jochem, P.; Edelenbosch, O.Y.; Mattauch, L.; van Vuuren, D.P.; McCollum, D.; Minx, J. Transport: A roadblock to climate change mitigation? Science 2015, 350, 911–912. [Google Scholar] [CrossRef] [PubMed]
  11. International Energy Agency (IEA). The Future of Trucks: Implications for Energy and the Environment; IEA: Paris, France, 2017; Available online: https://www.iea.org/reports/the-future-of-trucks (accessed on 25 December 2025).
  12. World Bank. Striving for Clean Air: Air Pollution and Public Health in South Asia; World Bank: Washington, DC, USA, 2023. [Google Scholar]
  13. Anenberg, S.; Miller, J.; Henze, D.; Minjares, R. A Global Snapshot of the Air Pollution Related Health Impacts of Transportation Sector Emissions in 2010 and 2015; International Council on Clean Transportation (ICCT): Washington, DC, USA, 2019. [Google Scholar]
  14. World Health Organization. Transport, Health and Environment; WHO Fact Sheet; WHO: Geneva, Switzerland, 2023. [Google Scholar]
  15. Bandara, S.J.H.; Thilakarathne, N. Economic and public health impacts of transportation-driven air pollution in South Asia. Sustainability 2025, 17, 2306. [Google Scholar] [CrossRef]
  16. Singh, B.K. South Asia energy security: Challenges and opportunities. Energy Policy 2013, 63, 458–468. [Google Scholar] [CrossRef]
  17. Malik, S.; Qasim, M.; Saeed, H.; Chang, Y.; Taghizadeh Hesary, F. Energy security in Pakistan: Perspectives and policy implications from a quantitative analysis. Energy Policy 2020, 144, 111552. [Google Scholar] [CrossRef]
  18. Jelti, F.; Allouhi, A.; Tabet Aoul, K.A. Transition paths towards a sustainable transportation system: A literature review. Sustainability 2023, 15, 15457. [Google Scholar] [CrossRef]
  19. United Nations. Sustainable Transport, Sustainable Development: Interagency Report for Second Global Sustainable Transport Conference; United Nations Department of Economic and Social Affairs: New York, NY, USA, 2021. [Google Scholar]
  20. IPCC. Climate Change 2022: Mitigation of Climate Change. Contribution of Working Group III to the Sixth Assessment Report; IPCC: Geneva, Switzerland, 2022. [Google Scholar]
  21. Kim, S.-Y.; Kerr, G.H.; van Donkelaar, A.; Martin, R.V.; West, J.J.; Anenberg, S.C. Tracking air pollution and CO2 emissions in 13,189 urban areas worldwide using large geospatial datasets. Commun. Earth Environ. 2025, 6, 311. [Google Scholar] [CrossRef]
  22. Rentschler, J.; Leonova, N. Global air pollution exposure and poverty. Nat. Commun. 2023, 14, 4432. [Google Scholar] [CrossRef]
  23. Ministry of Finance (MoF). Pakistan Economic Survey 2024–25; Government of Pakistan: Islamabad, Pakistan, 2025.
  24. Hussain, M.; Butt, A.R.; Uzma, F.; Ahmed, R.; Islam, T.; Yousaf, D.A. Comprehensive review of sectoral contribution towards greenhouse gas emissions and progress in carbon capture and storage in Pakistan. Greenh. Gases Sci. Technol. 2019, 9, 617–636. [Google Scholar] [CrossRef]
  25. Mir, K.A.; Park, C.; Purohit, P.; Kim, S. Comparative analysis of greenhouse gas emission inventory for Pakistan: Part I energy and industrial processes. Adv. Clim. Change Res. 2020, 11, 40–51. [Google Scholar] [CrossRef]
  26. Bajwa, A.U.; Sheikh, H.A. Contribution of road transport to Pakistan’s air pollution in the urban environment. Air 2023, 1, 237–257. [Google Scholar] [CrossRef]
  27. HDIP. Pakistan Energy Yearbook 2024; Hydrocarbon Development Institute of Pakistan: Islamabad, Pakistan, 2025.
  28. GCISC. Greenhouse Gas Emission Inventory of Pakistan for the Year 2023–2024; Global Climate-Change Impact Studies Centre: Islamabad, Pakistan, 2025. [Google Scholar]
  29. Rasool, Y.; Zaidi, S.A.H.; Zafar, M.W. Determinants of carbon emissions in Pakistan’s transport sector. Environ. Sci. Pollut. Res. 2019, 26, 22907–22921. [Google Scholar] [CrossRef] [PubMed]
  30. Asim, M.; Usman, M.; Abbasi, M.S.; Ahmad, S.; Mujtaba, M.A.; Soudagar, M.E.M.; Mohamed, A. Estimating the long term effects of national and international sustainable transport policies on energy consumption and emissions of road transport sector of Pakistan. Sustainability 2022, 14, 5732. [Google Scholar] [CrossRef]
  31. Abbas, S.; Yousaf, H.; Khan, S.; Rehman, M.Z.; Blueschke, D. Analysis and projection of transport sector demand for energy and carbon emission: An application of the grey model in Pakistan. Mathematics 2023, 11, 1443. [Google Scholar] [CrossRef]
  32. Raza, M.Y.; Lin, B. Coal efficiency, carbon reduction, and future policy perspective in Pakistan’s economic growth: A decomposition and decoupling approach. Front. Energy Res. 2023, 11, 1275221. [Google Scholar] [CrossRef]
  33. Khan, S.; Majeed, M.T. Decomposition and decoupling analysis of carbon emissions from economic growth: A case study of Pakistan. Pak. J. Commer. Soc. Sci. 2019, 13, 868–891. [Google Scholar]
  34. Yasmeen, H.; Tan, Q. Assessing Pakistan’s energy use, environmental degradation, and economic progress based on Tapio decoupling model. Environ. Sci. Pollut. Res. 2021, 28, 68364–68378. [Google Scholar] [CrossRef]
  35. Raza, M.Y.; Lin, B. Decoupling and mitigation potential analysis of CO2 emissions from Pakistan’s transport sector. Sci. Total Environ. 2020, 730, 139000. [Google Scholar] [CrossRef] [PubMed]
  36. Qin, H.; Raza, M.Y.; Lin, B. Decoupling effect and driving factors of transport CO2 emissions: Evidence from Pakistan’s transport sector. Energy Strategy Rev. 2025, 59, 101750. [Google Scholar] [CrossRef]
  37. Adeel, M.; Wang, B.; Ke, J.; Mvitu, I.M. The nonlinear dynamics of CO2 emissions in Pakistan: A comprehensive analysis of transportation, electricity consumption, and foreign direct investment. Sustainability 2025, 17, 189. [Google Scholar] [CrossRef]
  38. Ahmed, K. Carbon footprints across transport infrastructure development and industrial output in Pakistan. Environ. Sci. Pollut. Res. 2023, 30, 71296–71321. [Google Scholar] [CrossRef] [PubMed]
  39. Ilyas, S. A review of transport and urban air pollution in Pakistan. J. Appl. Sci. Environ. Manag. 2010, 11, 2. [Google Scholar] [CrossRef]
  40. Mehmood, T.; Zhu, T.; Ahmad, I.; Li, X. Ambient PM2.5 and PM10 bound PAHs in Islamabad, Pakistan: Concentration, source and health risk assessment. Chemosphere 2020, 257, 127187. [Google Scholar] [CrossRef]
  41. Bilal, M.; Mhawish, A.; Nichol, J.E.; Qiu, Z.; Nazeer, M.; Ali, M.A.; de Leeuw, G.; Levy, R.C.; Wang, Y.; Chen, Y.; et al. Air pollution scenario over Pakistan: Characterization and ranking of extremely polluted cities using long-term concentrations of aerosols and trace gases. Remote Sens. Environ. 2021, 264, 112617. [Google Scholar] [CrossRef]
  42. Zeeshan, N.; Murtaza, G.; Ahmad, H.R.; Awan, A.N.; Shahbaz, M.; Freer Smith, P. Particulate and gaseous air pollutants exceed WHO guideline values and have the potential to damage human health in Faisalabad, Metropolitan, Pakistan. Environ. Monit. Assess. 2024, 196, 659. [Google Scholar] [CrossRef]
  43. Iram, S.; Qaisar, I.; Shabbir, R.; Pomee, M.S.; Schmidt, M.; Hertig, E. Impact of air pollution and smog on human health in Pakistan: A systematic review. Environments 2025, 12, 46. [Google Scholar] [CrossRef]
  44. Zeb, B.; Nasir, J.; Alam, K.; Ditta, A.; Aman, M.A.; Shafiq, M. PM2.5 pollution and its correlation with meteorological parameters over the four capital cities of Pakistan. Environ. Monit. Assess. 2025, 197, 1237. [Google Scholar] [CrossRef]
  45. Song, M.; Zhang, Y.; Li, M.; Zhang, Y. Accessibility of Transit Stops with Multiple Feeder Modes: Walking and Private-Bike Cycling. Sustainability 2021, 13, 3522. [Google Scholar] [CrossRef]
  46. Wang, Y.; Zhang, Y.; Zhang, Y.; Ma, J. Dynamic real-time high-capacity ride-sharing model with subsequent information. IET Intell. Transp. Syst. 2020, 14, 742–752. [Google Scholar] [CrossRef]
  47. Colbeck, I.; Nasir, Z.A.; Ali, Z. The state of ambient air quality in Pakistan—A review. Environ. Sci. Pollut. Res. Int. 2010, 17, 49–63. [Google Scholar] [CrossRef]
  48. Alam, K.; Mukhtar, A.; Shahid, I.; Blaschke, T.; Majid, H.; Rahman, S.; Khan, R.; Rahman, N. Source apportionment and characterization of particulate matter (PM10) in urban environment of Lahore. Aerosol Air Qual. Res. 2014, 14, 1851–1861. [Google Scholar] [CrossRef]
  49. Shahid, M.Z.; Liao, H.; Li, J.; Shahid, I.; Lodhi, A.; Mansha, M. Seasonal variations of aerosols in Pakistan: Contributions of domestic anthropogenic emissions and transboundary transport. Aerosol Air Qual. Res. 2015, 15, 1580–1600. [Google Scholar] [CrossRef]
  50. Health Effects Institute (HEI). State of Global Air 2019; HEI: Boston, MA, USA, 2019. [Google Scholar]
  51. Razzaq, A.; Zafar, M.M.; Tuz Zahra, L.; Qadir, F.; Qiao, F.; Ullah, M.H.; Shehzad, S.; Rasool, G.; Jiang, X. Smog: Lahore needs global attention to fix it. Environ. Chall. 2024, 16, 100999. [Google Scholar] [CrossRef]
  52. Lelieveld, J.; Evans, J.S.; Fnais, M.; Giannadaki, D.; Pozzer, A. The contribution of outdoor air pollution sources to premature mortality on a global scale. Nature 2015, 525, 367–371. [Google Scholar] [CrossRef] [PubMed]
  53. Malashock, D.; Khwaja, H.A.; Fatmi, Z.; Siddique, A.; Lu, Y.; Lin, S.; Carpenter, D. Short-term association between black carbon exposure and cardiovascular diseases in Pakistan’s largest megacity. Atmosphere 2018, 9, 420. [Google Scholar] [CrossRef]
  54. Moyebi, O.D.; Fatmi, Z.; Carpenter, D.O.; Santoso, M.; Siddique, A.; Khan, K.; Zeb, J.; Hussain, M.M.; Khwaja, H.A. Fine particulate matter and its chemical constituents’ levels: A troubling environmental and human health situation in Karachi, Pakistan. Sci. Total Environ. 2023, 868, 161474. [Google Scholar] [CrossRef]
  55. Hyder, A.A.; Ghaffar, A.A.; Sugerman, D.E.; Masood, T.I.; Ali, L. Health and road transport in Pakistan. Public Health 2006, 120, 132–141. [Google Scholar] [CrossRef] [PubMed]
  56. Lu, Y.; Lin, S.; Fatmi, Z.; Malashock, D.; Hussain, M.M.; Siddique, A.; Carpenter, D.O.; Lin, Z.; Khwaja, H.A. Assessing the association between fine particulate matter (PM2.5) constituents and cardiovascular diseases in a mega city of Pakistan. Environ. Pollut. 2019, 252, 1412–1422. [Google Scholar] [CrossRef]
  57. Soergel, B.; Kriegler, E.; Weindl, I.; Rauner, S.; Dirnaichner, A.; Ruhe, C.; Hofmann, M.; Bauer, N.; Bertram, C.; Bodirsky, B.L.; et al. A sustainable development pathway for climate action within the UN 2030 Agenda. Nat. Clim. Change 2021, 11, 656–664. [Google Scholar] [CrossRef]
  58. Furszyfer Del Rio, D.D.; Sovacool, B.K.; Griffiths, S.; Foley, A.M.; Furszyfer Del Rio, J. A cross country analysis of sustainability, transport and energy poverty. NPJ Urban Sustain. 2023, 3, 41. [Google Scholar] [CrossRef]
  59. Ministry of Climate Change (MoCC). National Clean Air Policy (NCAP); Government of Pakistan: Islamabad, Pakistan, 2023. Available online: https://www.mocc.gov.pk/Policies (accessed on 28 December 2025).
  60. Ministry of Industries & Production (MoIP). New Energy Vehicles (NEV) Policy 2025–2030; Government of Pakistan: Islamabad, Pakistan, 2025. Available online: https://moip.gov.pk/Policies (accessed on 28 December 2025).
  61. UNFCCC. Pakistan’s Third Nationally Determined Contribution; United Nations Framework Convention on Climate Change: Bonn, Germany, 2025. [Google Scholar]
  62. Purohit, P.; Munir, T.; Rafaj, P. Scenario analysis of strategies to control air pollution in Pakistan. J. Integr. Environ. Sci. 2013, 10, 77–91. [Google Scholar] [CrossRef]
  63. Mir, K.A.; Purohit, P.; Goldstein, G.A.; Balasubramanian, R. Analysis of baseline and alternative air quality scenarios for Pakistan: An integrated approach. Environ. Sci. Pollut. Res. 2016, 23, 21780–21793. [Google Scholar] [CrossRef]
  64. Mir, K.A.; Purohit, P.; Cail, S.; Kim, S. Co-benefits of air pollution control and climate change mitigation strategies in Pakistan. Environ. Sci. Policy 2022, 133, 31–43. [Google Scholar] [CrossRef]
  65. Mir, K.A.; Purohit, P.; Ijaz, M.; Babar, Z.B.; Mehmood, S. Black carbon emissions inventory and scenario analysis for Pakistan. Environ. Pollut. 2023, 340, 122745. [Google Scholar] [CrossRef]
  66. Arshad, N. Electric Vehicles in Pakistan; Centre for Peace and Development Initiatives (CPDI): Islamabad, Pakistan, 2023. [Google Scholar]
  67. Zia, S.; Qureshi, S.; Zulfiqar, M.; Ijaz, A. Assessing the feasibility of electric vehicle adoption in Pakistan: Affordability, preferences, and market readiness. Eng. Proc. 2025, 111, 42. [Google Scholar] [CrossRef]
  68. Pakistan Environmental Protection Agency (Pak-EPA). National Environmental Quality Standards for Motor Vehicle Exhaust; Government of Pakistan: Islamabad, Pakistan, 2009. Available online: https://environment.gov.pk/SiteImage/Misc/files/Rules/SRO72KE2009vehicle.pdf (accessed on 28 December 2025).
  69. Zulfiqar, M.; Farooq, A.; Usmani, Z.; Zia, U.U.R.; Ullah, S.; Babar, Z.B. Pakistan’s Electric Vehicle Market: Challenges, Opportunities, and Future Pathways. Eng. Proc. 2024, 75, 15. [Google Scholar] [CrossRef]
  70. Guttikunda, S.K.; Nishadh, K.A.; Gota, S.; Singh, P.; Chanda, A.; Jawahar, P.; Asundi, J. Air quality, emissions, and source contributions analysis for the Greater Bengaluru region of India. Atmos. Pollut. Res. 2019, 10, 941–953. [Google Scholar] [CrossRef]
  71. Peng, W.; Dai, H.; Guo, H.; Purohit, P.; Urpelainen, J.; Wagner, F.; Wu, Y.; Zhang, H. The critical role of policy enforcement in achieving health, air quality, and climate benefits from India’s clean electricity transition. Environ. Sci. Technol. 2020, 54, 11720–11731. [Google Scholar] [CrossRef]
  72. Gajbhiye, M.D.; Lakshmanan, S.; Kumar, N.; Bhattacharya, S.; Nishad, S. Effectiveness of India’s Bharat Stage mitigation measures in reducing vehicular emissions. Transp. Res. Part D Transp. Environ. 2023, 115, 103603. [Google Scholar] [CrossRef]
  73. Wadud, Z.; Khan, T. Air quality and climate impacts due to CNG conversion of motor vehicles in Dhaka, Bangladesh. Environ. Sci. Technol. 2013, 47, 13907–13916. [Google Scholar] [CrossRef]
  74. Iqbal, A.; Afroze, S.; Rahman, M.M. Vehicular PM emissions and urban public health sustainability: A probabilistic analysis for Dhaka City. Sustainability 2020, 12, 6284. [Google Scholar] [CrossRef]
  75. Chowdhury, H.; Chowdhury, T.; Rashedi, A.; Banik, S.C.; Khanam, T.; Saidur, R.; Sait, S.M.; Rosen, M.A. Energy and exergy assessment with updated Reistad estimates: A case study in the transportation sector of Bangladesh. Energy Sci. Eng. 2021, 9, 1349–1358. [Google Scholar] [CrossRef]
  76. Soleimani, A.; Roghanian, P.; Heidari, M.; Heidari, M.; Pinnarelli, A.; Vizza, P.; Mahdavi, M.; Mousavi, S.F. Refining hybrid energy systems: Elevating PV sustainability, cutting emissions, and maximizing battery cost efficiency in remote areas. Energy Nexus 2025, 18, 100452. [Google Scholar] [CrossRef]
  77. Hosseini Dolatabadi, S.H.; Soleimani, A.; Maghanaki, M.; Ilinca, A. Enhancing photovoltaic farm capacity estimation: A comprehensive analysis with a novel approach. Energy Technol. 2024, 12, 2301294. [Google Scholar] [CrossRef]
  78. Shabbir, R.; Ahmad, S.S. Monitoring urban transport air pollution and energy demand in Rawalpindi and Islamabad using LEAP model. Energy 2010, 35, 2323–2332. [Google Scholar] [CrossRef]
  79. Khokhar, M.F.; Mehdi, H.; Abbas, Z.; Javed, Z. Temporal assessment of NO2 pollution levels in urban centers of Pakistan by employing ground-based and satellite observations. Aerosol Air Qual. Res. 2016, 16, 1854–1867. [Google Scholar] [CrossRef]
  80. Idrees, M.; Nergis, Y.; Irfan, M. Industrial emission monitoring and assessment of air quality in Karachi coastal city, Pakistan. Atmosphere 2023, 14, 1515. [Google Scholar] [CrossRef]
  81. Slater, J.; Aftab, L.; Jamshaid, H.; Amjad, M.; Bashir, S.; Shafique, S.; Bathan, G.; Espita Casanova, D.; Malley, C.S. Modeling air pollutant emission reductions from implementation of Pakistan’s Clean Air Policy. ACS EST Air 2024, 1, 815–836. [Google Scholar] [CrossRef]
  82. Sánchez Triana, E.; Enriquez, S.; Afzal, J.; Nakagawa, A.; Khan, A.S. Cleaning Pakistan’s Air: Policy Options to Address the Cost of Outdoor Air Pollution; World Bank: Washington, DC, USA, 2014. [Google Scholar] [CrossRef]
  83. Habib, A.; Nasim, S.; Shahab, A. Charting Pakistan’s Air Quality Policy Landscape; International Growth Centre (IGC) Evidence Paper on Energy & Environment: London, UK, 2021. [Google Scholar]
  84. Amann, M.; Bertok, I.; Borken Kleefeld, J.; Cofala, J.; Heyes, C.; Höglund Isaksson, L.; Klimont, Z.; Nguyen, B.; Posch, M.; Rafaj, P.; et al. Cost effective control of air quality and greenhouse gases in Europe: Modeling and policy applications. Environ. Model. Softw. 2011, 26, 1489–1501. [Google Scholar] [CrossRef]
  85. Amann, M.; Kiesewetter, G.; Schöpp, W.; Klimont, Z.; Winiwarter, W.; Cofala, J.; Rafaj, P.; Höglund Isaksson, L.; Gomez Sanabria, A.; Heyes, C.; et al. Reducing global air pollution: The scope for further policy interventions. Philos. Trans. R. Soc. A 2020, 378, 20190331. [Google Scholar] [CrossRef]
  86. Purohit, P.; Amann, M.; Kiesewetter, G.; Schöpp, W.; Wagner, F.; Klimont, Z.; Heyes, C.; Gomez-Sanabria, A.; Srivastava, P.; Borken-Kleefeld, J. Cost-effective control of air pollution in South Asia: Modeling and policy applications. Environ. Res. Commun. 2024, 6, 125017. [Google Scholar] [CrossRef]
  87. Amann, M.; Bertok, I.; Borken, J.; Chambers, A.; Cofala, J.; Dentener, F.; Heyes, C.; Hoglund, L.; Klimont, Z.; Purohit, P.; et al. GAINS Asia: A Tool to Combat Air Pollution and Climate Change Simultaneously Methodology Report; International Institute for Applied Systems Analysis: Laxenburg, Austria, 2008. [Google Scholar]
  88. Purohit, P.; Amann, M.; Mathur, R.; Gupta, I.; Marwah, S.; Verma, V.; Bertok, I.; Borken-Kleefeld, J.; Chambers, A.; Cofala, J.; et al. GAINS ASIA: Scenarios for Cost-Effective Control of Air Pollution and Greenhouse Gases in India; IIASA: Laxenburg, Austria, 2010. [Google Scholar]
  89. UNEP. Air Pollution in Asia and the Pacific: Science-Based Solutions; United Nations Environment Programme (UNEP) and Climate and Clean Air Coalition (CCAC): Paris, France, 2019. [Google Scholar]
  90. Klimont, Z.; Kupiainen, K.; Heyes, C.; Purohit, P.; Cofala, J.; Rafaj, P.; Borken Kleefeld, J.; Schöpp, W. Global anthropogenic emissions of particulate matter including black carbon. Atmos. Chem. Phys. 2017, 17, 8681–8723. [Google Scholar] [CrossRef]
  91. Winiwarter, W.; Höglund Isaksson, L.; Klimont, Z.; Schöpp, W.; Amann, M. Technical opportunities to reduce global anthropogenic emissions of nitrous oxide. Environ. Res. Lett. 2018, 13, 014011. [Google Scholar] [CrossRef]
  92. Höglund Isaksson, L.; Gómez Sanabria, A.; Klimont, Z.; Rafaj, P.; Schöpp, W. Technical potentials and costs for reducing global anthropogenic methane emissions in the 2050 timeframe—Results from the GAINS model. Environ. Res. Commun. 2020, 2, 025004. [Google Scholar] [CrossRef]
  93. EnerNEO Pakistan. EnerNEO Model National Energy Outlook; Enerdata: Grenoble, France, 2018. [Google Scholar]
  94. IIASA. GAINS South Asia; International Institute for Applied Systems Analysis (IIASA): Laxenburg, Austria, 2025; Available online: https://gains.iiasa.ac.at/gains/INN/index.login?logout=1 (accessed on 25 December 2025).
  95. Taimoor, A.A.; Rabbani, J.; Nawaz, F. Effect of fuel quality, vehicle maintenance and advanced emission control technology on Pakistan in-use light vehicle emissions. J. KAU Eng. Sci. 2023, 33, 95–112. [Google Scholar] [CrossRef]
  96. Ministry of Planning, Development & Reform (MoPDR). New Transport Policy of Pakistan 2018; Government of Pakistan: Islamabad, Pakistan, 2018. Available online: https://pc.gov.pk/web/downloads (accessed on 28 December 2025).
  97. Kumar, R.; Kanwal, A.; Asim, M.; Pervez, M.; Mujtaba, M.A.; Fouad, Y.; Kalam, M.A. Transforming the Transportation Sector: Mitigating Greenhouse Gas Emissions through Electric Vehicles (EVs) and Exploring Sustainable Pathways. AIP Adv. 2024, 14, 035320. [Google Scholar] [CrossRef]
  98. Borken-Kleefeld, J.; Cofala, J.; Rafaj, P. GHG Mitigation Potentials and Costs in the Transport Sector of Annex I Countries: Methodology, Version 2; IIASA Interim Report IR-09-039; International Institute for Applied Systems Analysis (IIASA): Laxenburg, Austria, 2009. [Google Scholar]
  99. Ankathi, S.; Gan, Y.; Lu, Z.; Littlefield, J.A.; Jing, L.; Ramadan, F.O.; Monfort, J.-C.; Badahdah, A.; El-Houjeiri, H.; Wang, M. Well-to-wheels analysis of greenhouse gas emissions for passenger vehicles in Middle East and North Africa. J. Ind. Ecol. 2024, 28, 800–812. [Google Scholar] [CrossRef]
  100. Ali, S.A.; Bangash, I.A.; Sajjad, H.; Karim, M.A.; Ahmad, F.; Ahmad, M.; Mushtaq, A.; Habib, K.; Shah, S.N.; Sami, A.; et al. Review on the Role of Electrofuels in Decarbonizing Hard to Abate Transportation Sectors: Advances, Challenges, and Future Directions. Energy Fuels 2025, 39, 5051–5098. [Google Scholar] [CrossRef]
  101. World Bank. Pakistan Least-Cost Electrification Study; The World Bank: Washington, DC, USA, 2024. [Google Scholar]
Figure 1. Transport sector structure for Pakistan in the GAINS model.
Sustainability 18 03954 g001
Figure 2. Percentage contributions of (a) road transport categories, (b) non-road transport categories, and (c) fuel types to multi-pollutant emissions in Pakistan’s transport sector, 2024.
Sustainability 18 03954 g002
Figure 3. Projected energy demand in Pakistan’s transport sector under four policy scenarios (BAU, EVT, Euro-VI, and NDC+) for the period 2024–2050, expressed in petajoules (PJ).
Sustainability 18 03954 g003
Figure 4. Projected trajectories of multi-pollutant emissions (PM2.5, BC, NOx, SO2, CO, VOC, CO2, CH4, and N2O) from Pakistan’s transport sector under four policy scenarios: (a) BAU, (b) EVT, (c) Euro-VI, and (d) NDC+ for the period 2024–2050. The horizontal dashed line at 100% represents the baseline emission level for the year 2024, against which all scenario projections are expressed.
Sustainability 18 03954 g004
Figure 5. Relative contributions of transport sector source categories (road and non-road) to selected air pollutants and GHGs in Pakistan, 2024–2050, under different policy scenarios.
Sustainability 18 03954 g005
Table 1. Key datasets used for GAINS model calibration and transport-sector projections.
Data CategoryDescriptionBase YearMain Sources
Vehicle fleet stockNumber of vehicles by mode, class, technology type, and vintage2024[23]
Fuel consumptionFinal energy use by fuel type for road and non-road transport2024[27]
Activity dataAnnual vehicle-km traveled (VKT), occupancy/load factors, freight/passenger shares2024[93]
Emission factors (EFs)Pollutant- and technology-specific EFs for tailpipe emissionsRegional defaults updated for Pakistan[62,94]
Control technology coveragePenetration of standards (Euro classes), after-treatment devices2024[62,94]
Non-road mobile sourcesActivity and fuel consumption for agriculture, construction, and rail2024[27]
Macro drivers for projectionsGDP growth, population, urbanization, modal shift2024–2050[93]
Table 2. Key transport and climate policy instruments in Pakistan relevant for emissions and mitigation strategies.
PolicyDescriptionRelevance to Emissions ModelingImplementation Status (as of 2024–2025)
National Transport Policy (2018) [96]Provides a long-term framework for multimodal transport, road safety, public transit expansion, and infrastructure development.Offers baseline assumptions for modal distribution, vehicle growth, and non-road infrastructure expansion.Partly implemented; major infrastructure projects underway, but modal shift and public transit targets lagging.
New Energy Vehicle Policy (2025) [60]Targets electrification of new light-duty vehicle sales, supports EV incentives, charging infrastructure development, and cleaner mobility.Basis for EVT and NDC+ scenarios’ electrification assumptions; shifts part of fuel demand from liquid fuels to electricity.Recently introduced; EV market penetration remains limited; incentives under early implementation.
National Clean Air Policy 2023 [59]Aims to improve ambient air quality, tighten fuel and vehicle emission standards, and regulate key pollution sources including mobile emissions.Provides support for Euro-VI scenario assumptions, fuel sulfur reductions, and enhanced emission control standards.Adopted in 2023; regulatory enforcement and fuel-quality upgrades still in initial phases.
Pakistan’s Third NDC 2025 [61]Commits to economy-wide GHG mitigation, including transport sector as a key contributor, targets emissions reductions, modal shift, and clean mobility.Serves as overarching mitigation ambition guiding the NDC+ scenario; frames long-term emission reduction goals.Submitted in 2025; formal endorsement in progress; sectoral sub-targets under consultation.
Fuel Quality and Emission Standards Regulations [94,95]Regulates fuel sulfur content and vehicle Euro-equivalent emission standards for new sales, with timeline for phasing out older vehicles and upgrading fuel quality.Underpin control technology mapping and fuel-quality assumptions in all scenarios (particularly Euro-VI and NDC+).Regulations in place; low-sulfur fuel supply limited; enforcement uneven across regions.
Non-road Mobile Source RegulationsCovers emission controls for construction, agricultural, and rail machinery; includes fuel standards and retrofit requirements.Supports inclusion of non-road sources in emission inventory and prospects for mitigation under policy scenarios.Regulatory draft exists; implementation and monitoring remain weak, source data uncertain.
Table 3. Summary of policy scenarios and key assumptions for Pakistan’s transport sector.
ScenarioDescription and Key Assumptions
Business-as-Usual (BAU)Continuation of the existing policy framework with limited enforcement of emission standards and gradual fleet modernization following historical trends. Advanced emission control technologies achieve minimal market penetration by 2050. Vehicle technology shares and fuel quality specifications remain largely static, reflecting a baseline regulatory environment and market-driven adoption rates.
Electric Vehicle Transition (EVT)Progressive electrification of gasoline-powered vehicle categories, with EV market shares increasing from 1% in 2025 to 30% by 2035 and 90% by 2050 [60]. Internal combustion engine (ICE) fleet evolution and emission control adoption follow the BAU trajectory for non-electrified segments. Electricity demand projections account for EV efficiency advantages (3–4× higher energy efficiency) and anticipated grid decarbonization.
Euro-VIMandatory implementation of Euro-VI equivalent emission standards from 2026, supported by nationwide provision of ultra-low-sulfur fuels (<10 ppm). Heavy-duty vehicles adopt diesel particulate filters (DPF) and selective catalytic reduction (SCR) systems by 2035. Gasoline vehicles employ durable three-way catalytic converters. EV penetration remains at BAU levels.
Nationally Determined Contribution Plus (NDC+)Comprehensive policy package combining accelerated electrification (EVT timeline advanced by five years) with Euro VI implementation and broad structural reforms. Measures include vehicle efficiency improvements, modal shift toward public and non-motorized transport, expansion of compressed natural gas use in heavy-duty segments, and strengthened vehicle inspection and maintenance programs. The scenario is designed to achieve Pakistan’s 50% GHG reduction target by 2035.
Table 4. Multi-pollutant emissions from road and non-road sources in Pakistan’s transport sector, 2024, with percentage contributions. Units: kt; CO2 in Mt.
PollutantsRoad Mobile SourcesNon-Road Mobile SourcesTotal (kt)
Emission (kt)ContributionEmission (kt)Contribution
PM1022.2797.5%0.582.5%22.85
PM2.521.5297.5%0.552.5%22.07
BC11.7897.9%0.252.1%12.03
OC7.9598.3%0.141.7%8.09
NOx294.5397.6%7.112.4%301.64
SO297.2099.1%0.930.9%98.13
CO986.1899.8%2.340.2%988.52
VOC142.3299.2%1.110.8%143.43
CO238.0098.2%0.701.8%38.70
CH414.0299.7%0.040.3%14.06
N2O3.1099.4%0.020.6%3.12
Table 5. Contribution of major transport categories to multi-pollutant emissions in Pakistan’s transport sector, 2024.
PollutantTop Contributing CategoryShare of Total Emissions (%)Second Major ContributorShare of Total Emissions (%)
PM10Heavy-duty trucks26%Heavy-duty buses18%
PM2.5Heavy-duty trucks26%Heavy-duty buses18%
BCHeavy-duty trucks35%Heavy-duty buses25%
OCMotorcycles/Rickshaws33%Light-duty Cars19%
NOxHeavy-duty trucks38%Heavy-duty buses34%
SO2Light-duty Cars57%Light commercial trucks11%
COLight-duty Cars42%Motorcycles/Rickshaws38%
VOCMotorcycles/Rickshaws63%Light-duty Cars25%
CO2Light-duty Cars45%Heavy-duty trucks18%
CH4Light-duty Cars53%Motorcycles/Rickshaws23%
N2OLight-duty Cars71%Light commercial vehicles12%
Disclaimer/Publisher’s Note: The statements, opinions and data contained in all publications are solely those of the individual author(s) and contributor(s) and not of MDPI and/or the editor(s). MDPI and/or the editor(s) disclaim responsibility for any injury to people or property resulting from any ideas, methods, instructions or products referred to in the content.