


Abstract
Understanding individuals’ connection to nature is crucial for promoting sustainable attitudes and behaviors. The environmental identity (EID) scale, widely used to assess this connection, plays a key role in environmental research; however, its cross-cultural application requires rigorous psychometric validation. Although the revised 14-item EID scale has demonstrated good reliability, questions remain regarding its dimensionality and the potential influence of acquiescence due to exclusively positive worded items. This study examined both issues in Portuguese samples. In Study 1, exploratory and confirmatory factor analyses were conducted to test the factorial structure. Results supported a two-factor model with correlated dimensions: Restorative Connection to Nature (RCN) and Ecological Identity (EI), rather than a strictly unidimensional solution. In Study 2 acquiescence was assessed by comparing the original version with a balanced version that included partially reverse-worded items. Item distributions, factor loadings, and reliability were analyzed. The balanced version did not improve control of acquiescence; instead, reversed-worded items showed weaker loadings, lower explanation variance, and method effects, suggesting increased measurement bias. Overall, the findings support the robustness of the revised 14-item EID scale in Portugal while indicating that environmental identity is better conceptualized as a bidimensional construct portraying both reflective connection and identity-based engagement with nature. The results also highlight the limitations of reverse-worded items as a strategy for reducing response bias in value-laden constructs.
1. Introduction
Environmental identity (EID), defined as the part of the self-concept that incorporates cognitions, emotions, and values about the role of nature in the self [1], is widely recognized as one of the determinants of pro-environmental attitudes and behaviors [2,3,4,5]. However, reproducing a pattern already observed in the literature on place attachment, place identity, and sense of place, there is no clear consensus regarding its conceptual articulation with closely related constructs such as “connectedness to nature” [6].
For some authors, EID is the broader (umbrella) construct, of which connection to nature represents the experiential and emotional component (for example, [1,2,7,8]). Other authors such as Mayer and Frantz [9], or more recently Salazar et al. [10], defend the opposite relationship, considering EID to be a specific form of psychological connection to nature [9]. Others conceptualize these constructs as related but distinct, with the connection more emotional–experiential and the identity more cognitive and definitional, belonging to the same conceptual family of human–nature relationships (see [11]), similar to other identity constructs [12]. Some authors have also distinguished between “environmental identity” and “ecological identity”, with the latter emphasizing a more explicit identification with nature [13]. Finally, given the high correlations between these constructs, some scholars suggest revisiting instruments assessing human–nature relatedness in order to maximize the unique variance associated with each construct [6,10,14,15].
This construct has been primarily measured by original and revised versions of Clayton’s EID scale, which captures: self-identification (how individuals think about their relationship with nature); ideology (support for environmentally friendly lifestyle choices); and, positive emotions towards nature (e.g., comfort and enjoyment obtained in nature) [10].
Since its development, the EID scale has undergone several refinements and has been widely used in cross-cultural research to explore various aspects of environmental identity [16]. Across its different versions, the EID scale has consistently shown high internal consistency (Cronbach’s α typically > 0.80) and has been associated with a range of environmentally relevant outcomes, including environmental concern, pro-environmental behaviors, and biospheric or altruistic value orientations [1,2,3,5,17,18].
The revised 14-item EID [2] was developed to address limitations in existing measures of environmental identity, which often emphasize wilderness or unaltered nature experiences and may not adequately capture more common, everyday interactions with nature (e.g., trees or gardens) typical of urban and suburban contexts. The revised version was designed to better reflect these experiences and has demonstrated strong reliability and validity across diverse international samples, supporting its cross-cultural applicability [2].
Despite this strong evidence of reliability and predictive validity, the dimensionality or structural validity of the EID construct remains debated. Several studies have examined the psychometric structure of the scale, but findings are not entirely consistent [16]. While Clayton and colleagues originally conceptualized environmental identity as a multidimensional construct integrating cognitive, affective, and behavioral components [1,2], empirical studies have supported unidimensional, two-factor, and more complex structures [5,19,20]. Some studies suggest a dominant general factor, supporting the use of a total EID score, whereas other studies identify meaningful subdimensions related to connection with nature and environmental protection [5,19,20]. These inconsistencies may partly reflect methodological differences, including the use of principal component analysis (PCA or PC) versus exploratory factor analysis (EFA or FA), as well as different estimators (e.g., ML vs. WLSMV) and assumptions regarding data distribution [16]. Importantly, estimators should be selected based on the psychometric properties of the data, particularly normality and scale characteristics.
Independently of the dimensionality issue, the cross-cultural validation of the revised EID scale also requires further research, given its relatively recent development. In Portugal, a validation study of the revised 14-item EID scale reported good psychometric properties [21]. That study relied on a multicultural sample of residents in Portugal originating from several Lusophone countries, which limits conclusions regarding the functioning of the scale in a culturally homogeneous Portuguese sample. Therefore, a new validation using an exclusively Portuguese sample is needed to assess whether cultural diversity influenced the observed factor structure and measurement properties.
In addition to dimensionality and cultural validity, another important psychometric concern involves response bias. The revised 14-item EID scale presents an unbalanced wording structure, as all items are positively phrased and measure the dimension of interest in the same direction. For example, items such as “I think of myself as a part of nature, not separate from it” and “My relationship to nature is an important part of who I am” [2] consistently frame environmental identity in a positive light. The absence of reverse-worded items (i.e., those requiring disagreement to indicate a positive environmental identity) may introduce response biases such as acquiescence bias, whereby respondents agree with statements regardless of their true feelings [22]. Response bias poses a significant challenge in psychometric assessment, as it may introduce systematic error and can distort the validity and reliability of self-report measures [23]. In fact, homogeneous item wording can artificially inflate internal consistency estimates, as high alpha values may reflect response patterns rather than true construct coherence [24].
Acquiescence bias is particularly problematic in Likert-type scales and is often detected when individuals respond inconsistently to reversed items [25,26]. Such bias can inflate scores, mask true individual differences, and distort the factor structure of a scale [27,28]. To mitigate this problem, researchers frequently use balanced item wording or reverse-scored items. Balanced scales include items phrased in opposite directions, and reverse scoring involves recoding negatively worded items so that higher scores reflect higher levels of the construct [27,28].
However, the effectiveness of these strategies remains debated. Some studies suggest that reverse-worded items promote careful reading and reduce monotonous responding [26,29], whereas others argue that they increase cognitive load and confusion, particularly for respondents with lower linguistic or cognitive resources, potentially introducing measurement error and spurious factors [30,31].
Thus, although reverse-worded items are intended to improve scale quality, they may also reduce readability, reliability and distort the factor structure [30,31]. There is currently no consensus regarding the optimal wording strategy for self-report scales, especially in relation to controlling acquiescence bias [25,27,30,31].
Although the limitations of reverse-worded items have been widely discussed in psychometric research, empirical tests of their impact within environmental identity measures remain limited. Moreover, it cannot be assumed that the commonly reported disadvantages of reverse-worded items generalize to identity-based constructs such as environmental identity or to scales originally composed exclusively of positively worded items. This issue is particularly relevant for the revised 14-item EID scale, which consists exclusively of positively worded items. While such wording may simplify interpretation, it also raises the possibility that responses may be influenced by acquiescence bias. Consequently, it remains unclear whether introducing reverse-worded items would improve measurement quality by reducing response bias or instead introduce additional method effects. Examining this issue empirically may therefore contribute to a more precise understanding of how item wording strategies affect the measurement of environmental identity.
Despite its widespread use, there remains no clear consensus regarding the dimensionality of the EID scale, either in the revised 14-item version [1,21,32] or in earlier versions of the instrument (see review [16]). In particular, inconsistencies in factorial findings and methodological approaches have left the unidimensional versus multidimensional structure of the scale unresolved. This gap between the theoretical complexity of environmental identity construct and the ability of existing instruments to capture it has been highlighted in a recent systematic review by Pagano et al. [16].
This study aims to address these issues by examining the construct validity of the revised 14-item EID scale using both exploratory and confirmatory factor analyses. In addition, the study investigates the potential influence of acquiescence bias associated with the scale’s exclusively positive item wording.
To this end, two complementary studies were conducted. Study 1, evaluates the factorial structure of the revised EID in a native Portuguese sample, allowing comparison with prior findings obtained from non-native Portuguese speakers [21]. It addresses the following research question: What is the underlying factor structure of the revised 14-item EID scale in a Portuguese sample, and does it support a unidimensional or multidimensional representation of environmental identity?
Study 2 examines the extent to which acquiescence affects responses by testing a balanced version of the 14-item revised EID scale that includes partially reverse-worded items. It addresses the following research question: How does the inclusion of reverse-worded items affect the factorial structure and response patterns of the revised 14-item EID scale?
Together, these studies to provide an integrated evaluation of the EID scale’s dimensionality and susceptibility to acquiescence, strengthening its psychometric foundation in the Portuguese context. Beyond this setting, this research seeks to contribute to the broader methodological discussion on the use of balanced versus uniformly worded scales, offering empirical insight into the potential trade-offs involved in using reverse-worded items to control response bias in identity-based and sustainability-related constructs.
2. Study 1—Discussing the EID Construct Dimensionality
Study 1 examined the latent structure of the revised 14-item EID scale [2] in a native Portuguese sample, culturally more homogeneous than in Ferrajão et al. [21]. To clarify ongoing inconsistencies regarding its dimensionality [16,18,32] both exploratory and confirmatory factor analyses were conducted. This approach allowed for a systematic evaluation of whether the scale is best represented as a unidimensional construct or as a multidimensional structure comprising correlated factors.
2.1. Participants
Study 1 included 232 participants who completed the 14-item revised EID scale (version A). Most participants were employed (66.2%), followed by students (12.8%), unemployed individuals (9.4%), pensioners (4.9%), working students (4.4%), and homemakers (1.9%). The sample was predominantly female (61%), with 39% male participants. Participants were most frequently aged 23–35 years (34.2%), followed by 36–48 years (30.7%), 49–81 years (25.2%), and 16–22 years (9.9%). In terms of academic background, the majority reported higher education, with 40.1% holding a bachelor’s degree, 13.4% a master’s or postgraduate degree, and 4.5% a doctoral degree. Additionally, 37.6% had completed secondary education, while only a small proportion reported education below this level. Among higher education students, Health Sciences was the most represented academic field (9.9%). Professionally, the largest group consisted of specialists in intellectual and scientific activities (31.6%), followed by administrative personnel (22.7%) and service, protection, and sales workers (15.5%). The technicians and associate professionals, agricultural and industrial workers, non-qualified workers, managers, and armed forces personnel were less represented.
2.2. Methods
This research was conducted as part of the national project “Sense and Sensibility in Interactivity (SSi)” to enhance human–nature connectedness through an iterative approach to prototype and design test of sensory, experiential and aesthetic experiences in natural contexts.
2.2.1. Instruments and Procedures
Data were collected in the summer of 2023 using a self-administered questionnaire, which was distributed both online and in person in university classes. The questionnaire included the EID 14-item revised scale [2], the nature relatedness scale (NR-6; [11]), the nature exposure scale (NES; [33]), the Portrait Values Questionnaire (PVQ; [34]), and a sociodemographic questionnaire to capture the demographic data such as age, gender, education, occupation, and place of residence. Validated Portuguese versions or previously tested Portuguese applications of these instruments were used whenever available, and relevant psychometric evidence from Portuguese samples is reported below. Participants were informed about the study’s objectives, the voluntary nature of participation, and the confidentiality and anonymity of responses, in accordance with the ethical principles of the Declaration of Helsinki and European data protection regulations. Ethical approval was obtained from the Ethics Committee of the University of the Azores (No. 37/2023).
Connection to nature was assessed using the nature relatedness scale—short form (NR-6; [11]), a six-item instrument that captures affective and cognitive aspects of individuals’ connection with the natural world, including emotional affiliation, sense of belonging, and the integration of nature into one’s self-concept. The NR-6 has demonstrated good psychometric properties across different cultural contexts, including adequate internal consistency and temporal stability [11,35]. Previous studies using Portuguese samples report good reliability (α = 0.87) and a stable factorial structure, supporting the scale’s suitability for use in Portugal [35].
Contact with nature was assessed using the nature exposure scale (NES; [33]), which assesses how often individuals engage with natural settings, such as parks, forests, and coastal areas, capturing the behavioral dimension of human–nature interactions. The NES has shown adequate psychometric properties, including good internal consistency and construct validity [33,36]. Although the NES was originally developed in an international context, recent studies using Portuguese samples confirmed adequate reliability (α = 0.76) and evidence of convergent validity through associations with nature relatedness and subjective well-being [37].
Personal values were assessed using the Portrait Values Questionnaire (PVQ; [34]), in the version adapted and validated for the Portuguese population by Granjo and Peixoto [38]. The PVQ measures ten basic human values (e.g., universalism, benevolence, power, achievement), organized into four higher-order dimensions: openness to change, conservation, self-transcendence, and self-enhancement. The Portuguese version of the PVQ presents good psychometric properties, including satisfactory internal consistency (Cronbach alpha ranging from 0.69 to 0.74), associated with the conservation and openness to change dimensions, respectively, and a factorial structure (four factors) consistent with Schwartz’s theoretical model.
These instruments were used exclusively to assess convergent and divergent validity of the EID. The patterns of correlations were interpreted based on theoretical expectations, with strong or moderate positive associations supporting convergent validity and weak or non-significant associations indicating divergent validity. Together, these analyses may provide evidence for the construct validity of the revised 14-item EID scale within Study 1.
The 14-item revised EID scale [8] with all items rated on a 7-point Likert scale (1 = not at all true to 7 = completely true) was translated into European Portuguese by two independent bilingual researchers, a Portuguese-native speaker and an English-native speaker. A back-translation was then performed by the native English-speaking researcher and compared with the original version. Both researchers reviewed for cultural and linguistic accuracy following the guidelines of the International Test Commission Guidelines for Translating and Adapting Tests [39]. We verified a posteriori that our version was a full equivalent [21] (see Appendix A for Portuguese version of the revised 14-item EID), finding that our translation of the scale is practically identical to theirs. Almost no differences were observed, except for one adjective observed in item 11 and the wording of item 9 (“Uma parte importante da minha vida estaria em falta se eu não fosse capaz de sair e desfrutar da natureza de tempos a tempos” vs. “Se não pudesse sair de vez em quando para desfrutar da natureza, faltaria uma parte importante à minha vida”), although the two formulations are semantically equivalent.
2.2.2. Data Analysis
Data analysis was conducted using IBM SPSS Statistics 29 and the R statistical environment v.4.3.2 [40]. The analytic approach integrated general descriptive analyses with specific psychometric procedures aligned with the aims of the study.
Descriptive statistics were computed for the total, mean EID score (as described in [10]) and individual items, including means, standard deviations, skewness, and kurtosis to examine response distributions, variability, and potential departures from normality. Skewness and kurtosis values were interpreted according to the criteria proposed by West, Finch, and Curran [41], allowing for the identification of clustering effects and distributional asymmetries across items.
Psychometric procedures included:
- Reliability Analysis.
Internal consistency reliability of the revised 14-item EID scale was assessed. Cronbach’s alpha was calculated as a measure of overall internal consistency, alongside corrected item–total correlations and alpha-if-item-deleted statistics to evaluate the contribution of each item to the scale. In addition, McDonald’s omega total was computed as a model-based reliability estimate that does not assume tau-equivalence and is therefore considered a more robust indicator of internal consistency for multidimensional or congeneric measures.
- Exploratory factor analysis
Exploratory factor analyses (EFA) were conducted to examine the latent structure of the revised 14-item EID scale. Prior to factor extraction, data suitability was assessed using the Kaiser–Meyer–Olkin (KMO) measure of sampling adequacy and Bartlett’s Test of Sphericity and factor retention was guided by parallel analysis (PA), comparing eigenvalues derived from the observed data with those obtained from randomly generated datasets.
To ensure robustness of the factorial solution given the observed deviations from normality at the item level, EFA was performed using multiple extraction methods, including Maximum Likelihood (ML), Generalized Least Squares (GLS), Principal Axis Factoring (PAF), and minimum residual (minres). Oblimin rotation was applied to allow for correlated factors. Model fit was evaluated using standard indices, including the Root Mean Square Residual (RMSR), Tucker–Lewis Index (TLI), and Root Mean Square Error of Approximation (RMSEA) with 90% confidence intervals. Additionally, explained common variance (ECV) was calculated to assess the degree of essential unidimensionality of the scale.
- Confirmatory factor analysis
Confirmatory factor analysis (CFA) was conducted to test theoretical models of the revised 14-item EID scale, including a unidimensional model, a correlated two-factor model, and a second-order factor model. CFA was estimated using diagonally weighted least squares (DWLS), which is recommended for ordinal data and for handling deviations from normality at the item level, providing robust standard errors and corrected chi-square statistics [42].
Model fit was evaluated using multiple goodness-of-fit indices, including the CFI, TLI, RMSEA, and standardized residual-based indices, following commonly accepted cutoff criteria. The standardized factor loadings were inspected for statistical significance [42].
To further assess the stability of the factor solutions and reduce the risk of capitalization on chance, a robustness check was conducted by randomly dividing the sample into two halves and repeating the analyses. The resulting solutions were highly similar to those obtained using the full sample, indicating that the factor structure was stable [43].
- Convergent and Divergent Validity
Evidence of convergent and divergent validity was examined through nonparametric correlation analyses. Spearman’s rho correlations were computed between the mean EID score and theoretically related constructs, including NR-6 [11] and NES [33], to assess convergent validity. The divergent validity was evaluated through associations with value dimensions derived from the PVQ [34], including self-transcendence, conservation, openness to change, and self-enhancement.
2.3. Results
2.3.1. Descriptive and Reliability Analysis
Overall, participants reported relatively high levels of environmental identity with total mean scores ranging from 27 (10.9) and 98 (10.9). Correspondingly, the majority of the items contributed to these levels of environmental identity with means ranging from 4.68 to 6.39 on a 7-point scale.
The item with the highest mean was item 7 (“Aprender sobre o mundo natural deve fazer parte da educação de toda a gente”/“Learning about the natural world should be part of everyone’s upbringing”), with a mean of 6.39 (SD = 0.79), followed closely by item 1 (M = 6.33, SD = 0.97) and item 13 (M = 6.27, SD = 0.94). The item with the lowest mean was 5 (“Sinto que tenho muito em comum com os animais selvagens”/“I feel that I have a lot in common with wild animals”) (M = 4.68, SD = 1.67), indicating comparatively lower agreement with that particular statement. The distribution of item responses showed notable skewness for most items, with values ranging from −0.49 (Item 5) to −1.87 (item 1 and item 9), indicating that participants generally endorsed higher response options across items. Half of the items also exhibited substantial kurtosis (±2), indicating deviations from normality (items 1, 4, 7, 8, 9, 13 and 14), according to West, Finch & Curran criteria [40]. These results suggest that responses to many items were clustered toward the upper end of the scale, with a concentration of high scores for items 1, 4, 7, 8, 9, 13 and 14) and relatively low variability for several items. In particular, items 1, 7, 9, 11 and 13 showed standard deviation below 1, indicating limited dispersion of responses. This pattern suggests that participants tended to strongly endorse several environmental identity statements (see Table 1).
Table 1.
Item-level descriptive statistics for the 14-item revised environmental identity (EID; [8]) scale for Sample A (N = 232).
The reliability value was excellent, with Cronbach’s alpha = 0.92, indicating strong internal consistency. On the other hand, corrected item–total correlations ranged from 0.49 (Item 5) to 0.78 (Item 13), and the removal of any single item did not substantially improve reliability, as alpha remained within a narrow range (0.915–0.929), showing that all the items contributed meaningfully to the construct (Table 2). Additional model-based reliability indices confirmed these findings. McDonald’s omega total was 0.94. The average inter-item correlation was 0.49, and the median was 0.51 (±0.78), which are within the recommended range for psychometric instruments (Table 2).
Table 2.
Item-level and scale-level reliability statistics for the revised 14-item environmental identity scale with sample A (N = 232).
2.3.2. Exploratory Factor Analysis
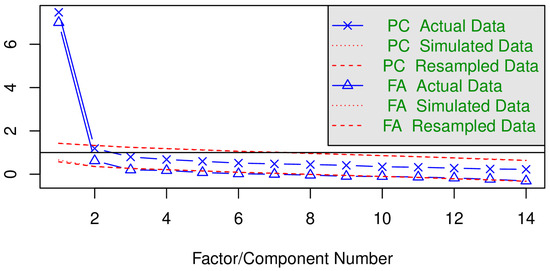
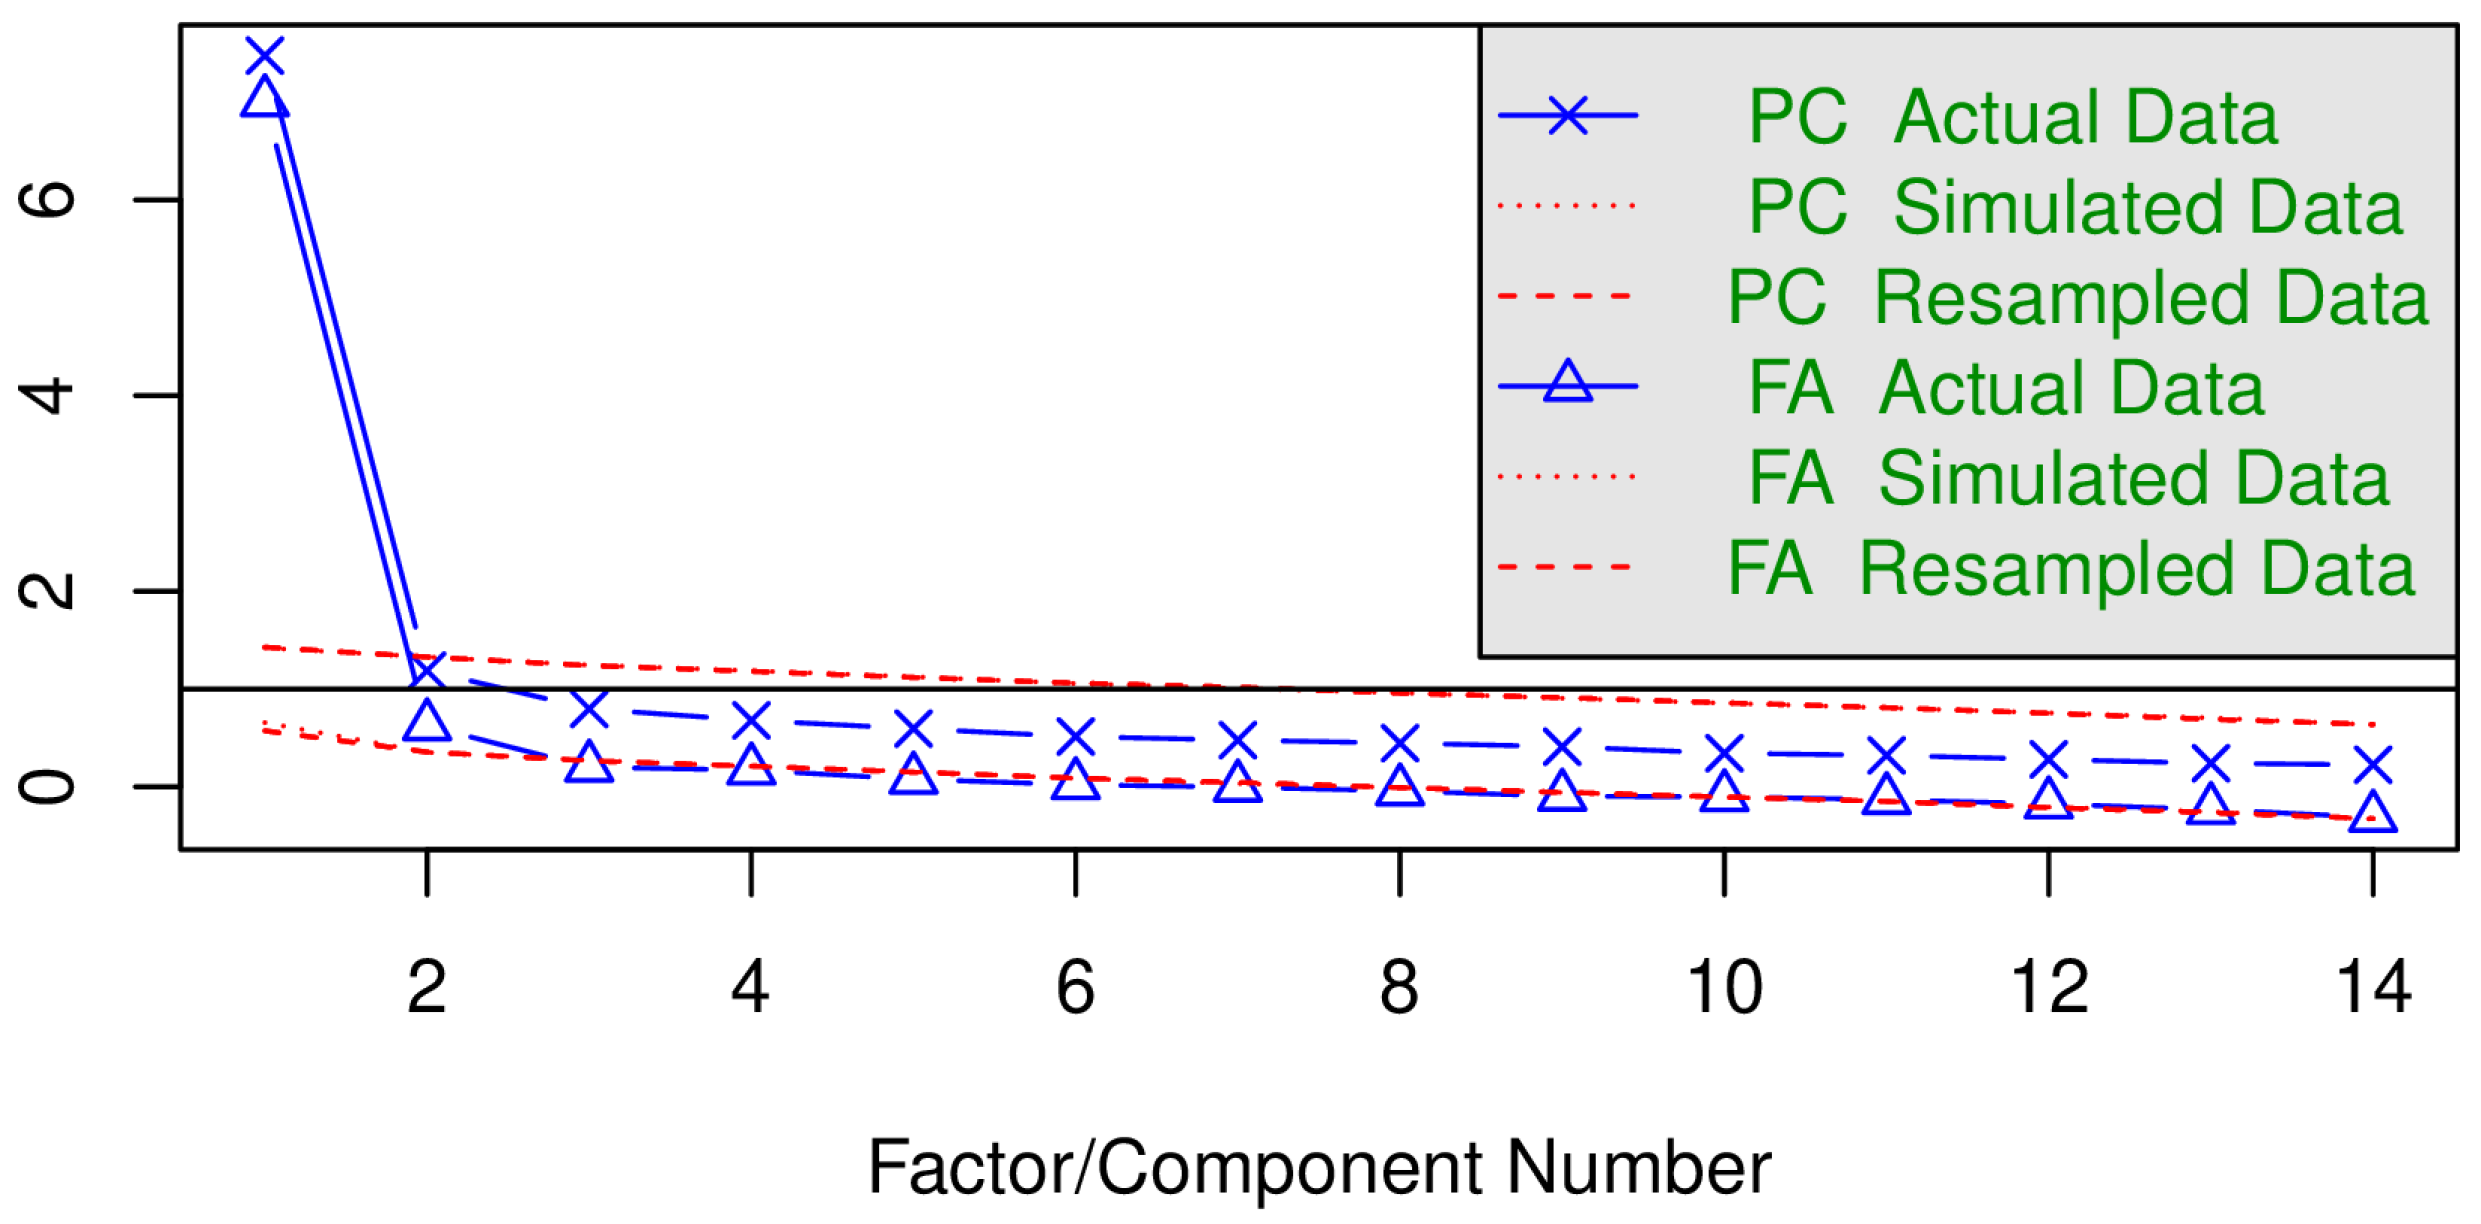
Sampling adequacy was confirmed with a Kaiser–Meyer–Olkin (KMO) value of 0.937 and Bartlett’s Test of Sphericity was significant, χ2(91) = 1901.02, p < 0.001, indicating that the data were suitable for factor analysis. We first conducted a PA comparing principal components (PC) with factors (FA) (Figure 1). This analysis revealed a dominant first factor/component, which explained the majority of the variance (eigenvalue ≈ 7.5, well above the simulated data line), and a weak or borderline second factor (eigenvalue = 1.2, slightly above the simulated data line). Specifically, the first two eigenvalues from the actual data (7.00 and 0.62) exceeded those from the simulated random data (0.59 and 0.36), suggesting a potential two-factor structure.
Figure 1.
Scree plot showing eigenvalues for principal components (PC) and factors (FA) across the 14 items in Sample A (N = 232). Solid lines with symbols represent actual data, dotted lines represent simulated data, and dashed lines represent resampled data. Abbreviations: PC = principal component; FA = factor analysis.
Following the PA results (Figure 1), exploratory factor analyses (EFA) of the 14-item revised EID scale [8] were conducted using different methods to ensure robustness: Maximum Likelihood (ML), Generalized Least Squares (GLS), Principal Axis Factoring (PAF), and minimum residual (minres). All methods converged on a two-factor structure, consistent with the PA.
For clarity, we present the comparison between one and two-factor solutions using the minimum residual (minres) method with oblimin rotation, which produced interpretable and robust factor loadings (Table 1). The one-factor model accounted for 50% of the total variance (sum of squared loadings = 7.0), with all items loading strongly (λ = 0.49–0.81). Factor score correlations were high (r = 0.97), indicating a coherent underlying construct. Model fit indices were acceptable (RMSR = 0.06, TLI = 0.88, RMSEA = 0.10, 90% CI [0.087, 0.115]), though the RMSEA indicated a modest lack of fit (Table 3).
Table 3.
Item coefficients of the one and two-factor structure of the scale—Factor 1 labeled Restorative Connection with Nature and Factor 2 labeled Ecological Identity of the environmental identity scale with sample A (N = 232).
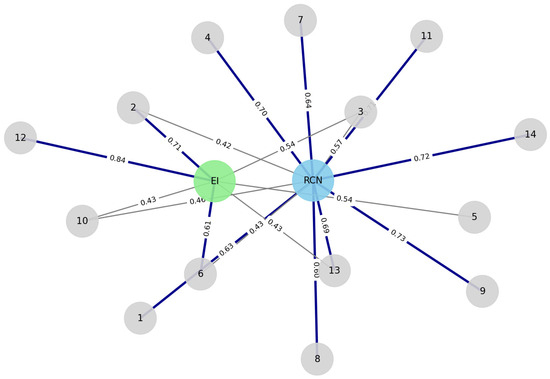
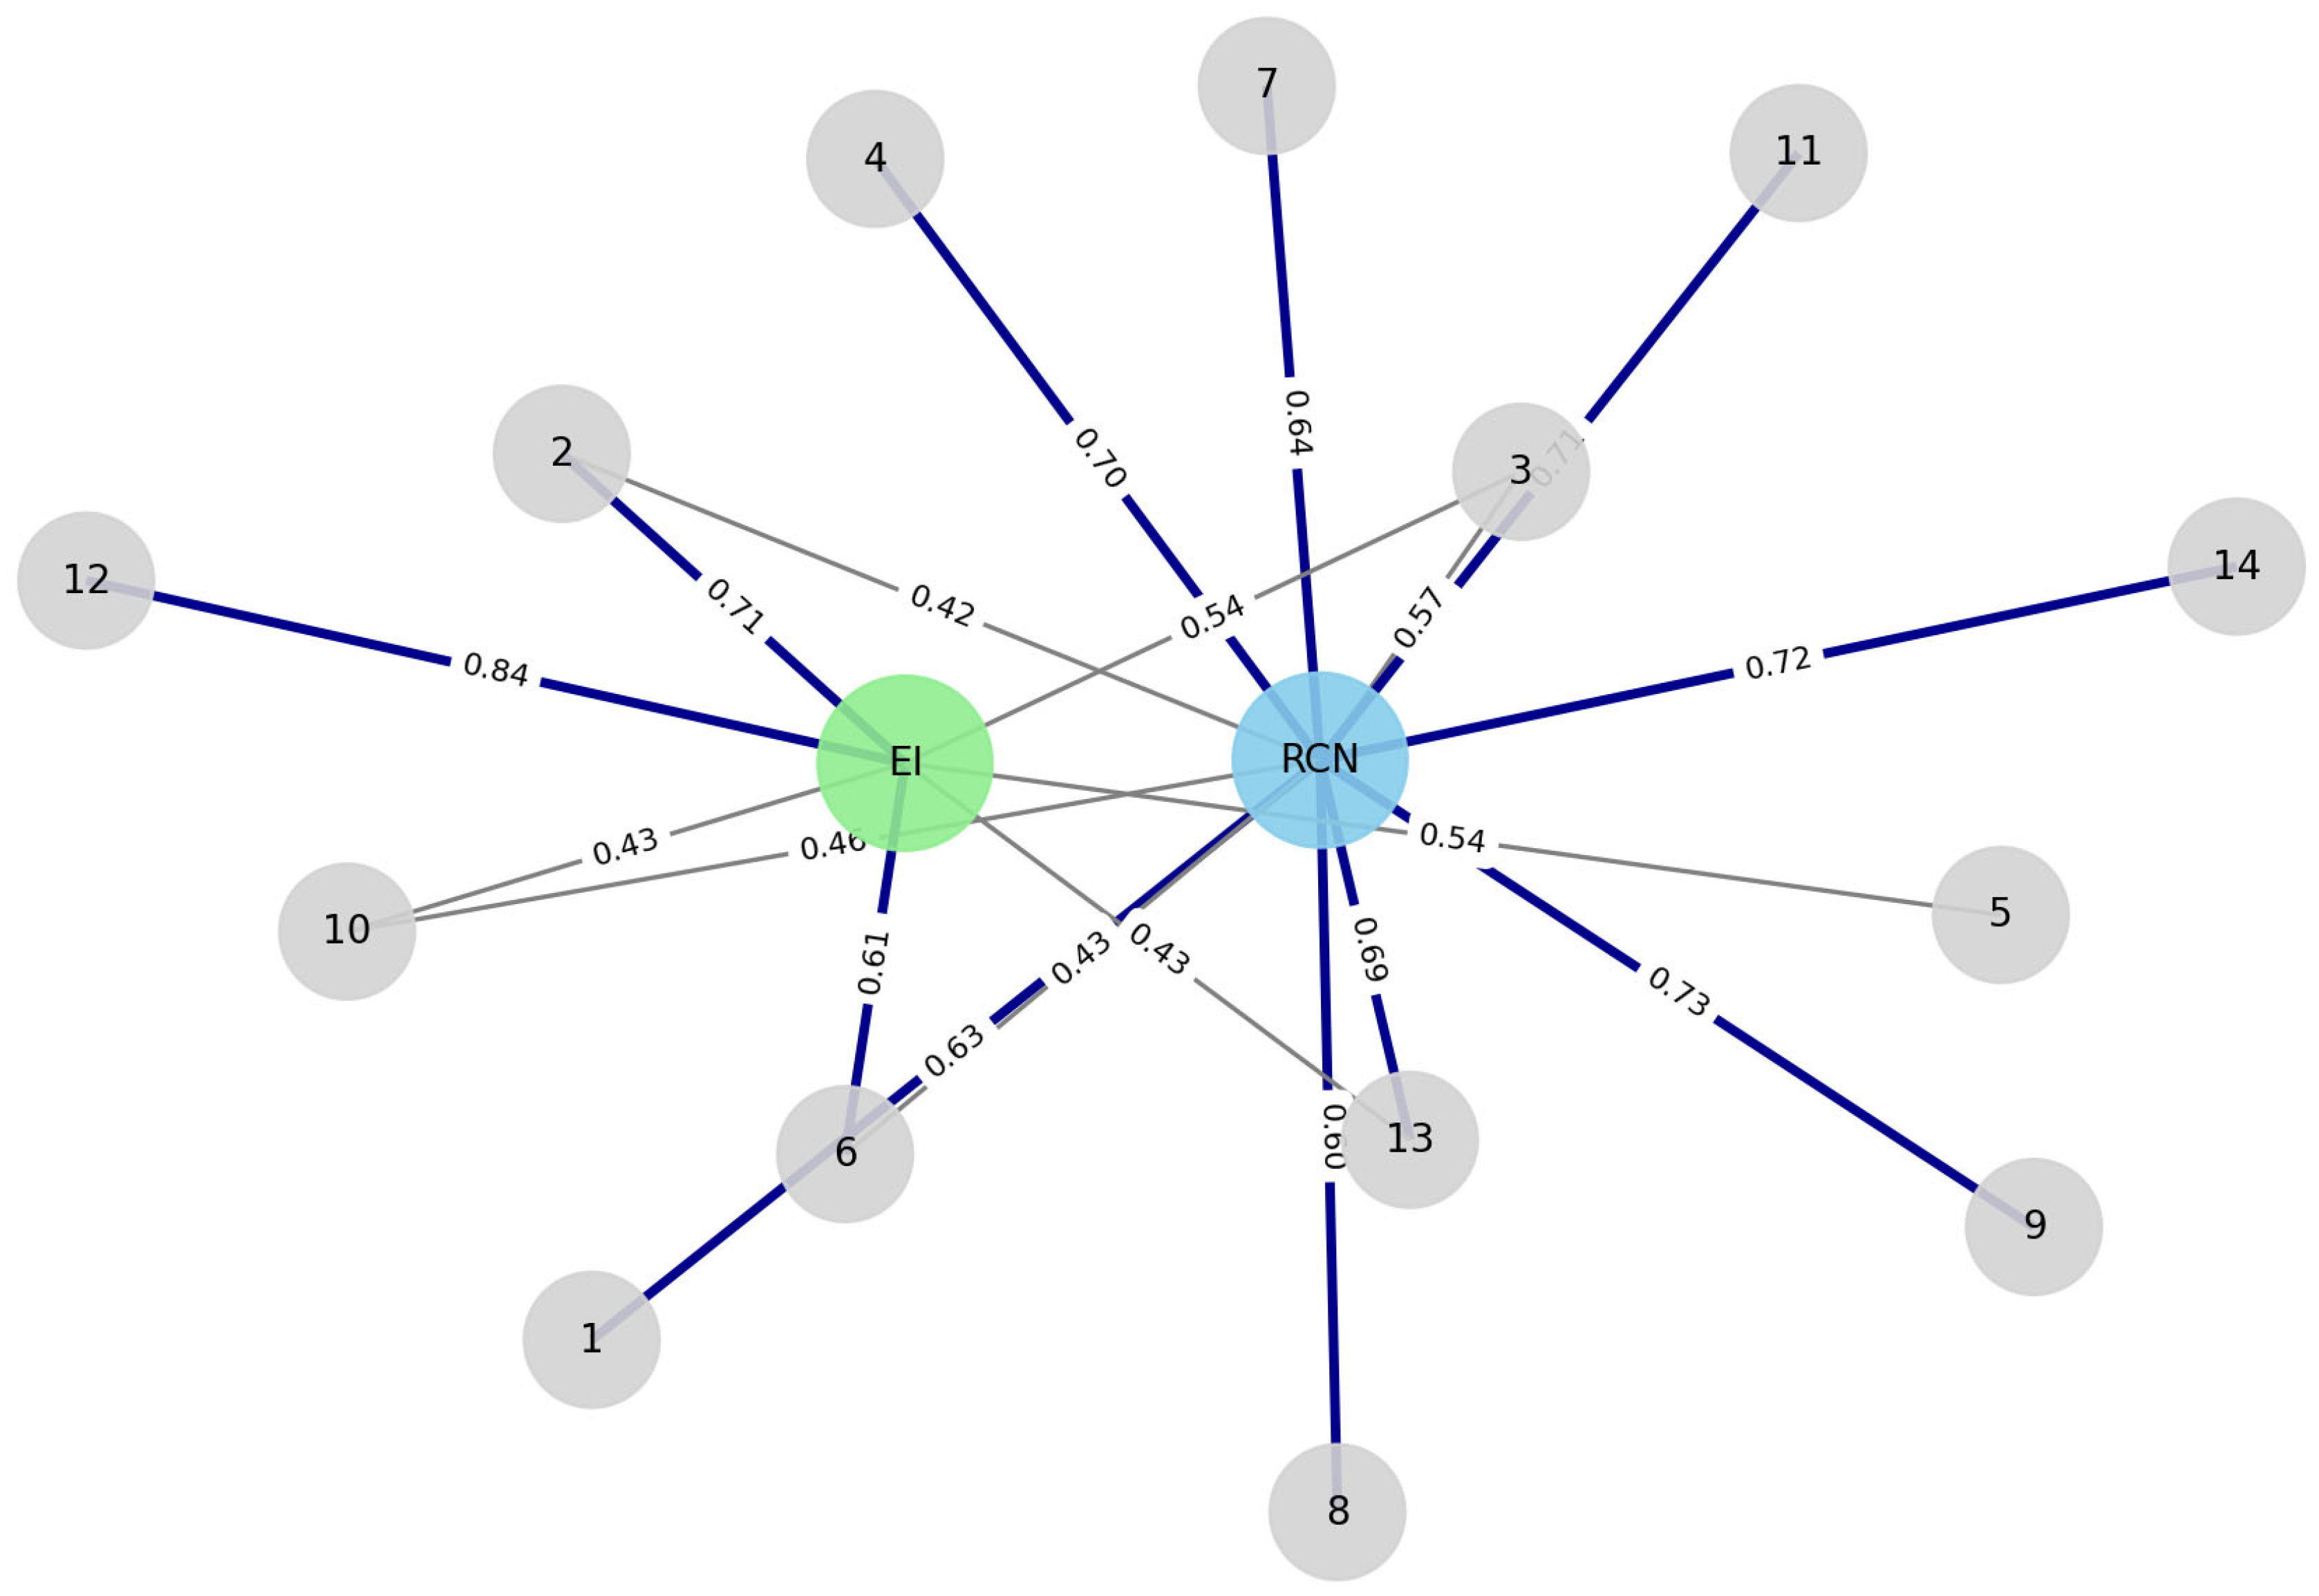
The two-factor solution explained 56% of the total variance, with Factor 1 accounting for 39% and Factor 2 for 17% (Table 3). Factor 1, labeled Restorative Connection with Nature (RCN; reflecting connectedness to nature and well-being promotion), included items 1, 4, 7, 8, 9, 11, 13 and 14, representing experiential engagement and personal bonds with nature. Factor 2, labeled Ecological Identity (EI; reflecting identity and moral connection with nature), comprised items 2, 5, 6, and 12 (Figure 2). Both factors were moderately correlated (r = 0.67), and the model fit improved relative to the one-factor solution (RMSR = 0.03, TLI = 0.95, RMSEA = 0.068, 90% CI [0.051, 0.084]) (Table 3).
Figure 2.
Path diagram of the exploratory factor analysis (EFA) with oblimin rotation for the EID scale in Sample A (N = 232). RCN = Restorative Connection with Nature; EI = Ecological Identity. All items with standardized loadings ≥ 0.40 are shown. Thick blue lines indicate loadings ≥0.60. Note. Factors moderately correlated (r = 0.67).
The ECV was 0.70, indicating that 70% of the common variance was attributable to the general factor. Taken together, the high inter-factor correlation and the strong, consistent item loadings, support the interpreting the scale as essentially unidimensional, despite the presence of a secondary factor suggested by the PA.
2.3.3. Model Adjustment Using Confirmatory Factor Analysis
Confirmatory factor analysis (CFA) was conducted to evaluate the dimensional structure of the revised 14-item EID scale. Three theoretical models were tested: (a) a unidimensional model, (b) a correlated two-factor model, and (c) a second-order factor model. Estimation was performed using diagonally weighted least squares (DWLS), which is appropriate for ordinal data, with robust standard errors and chi-square corrections.
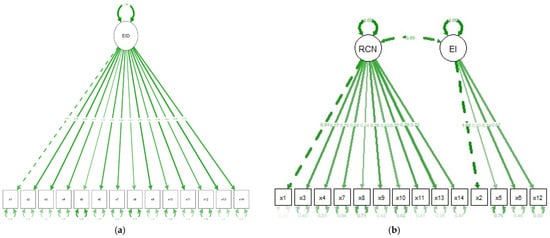
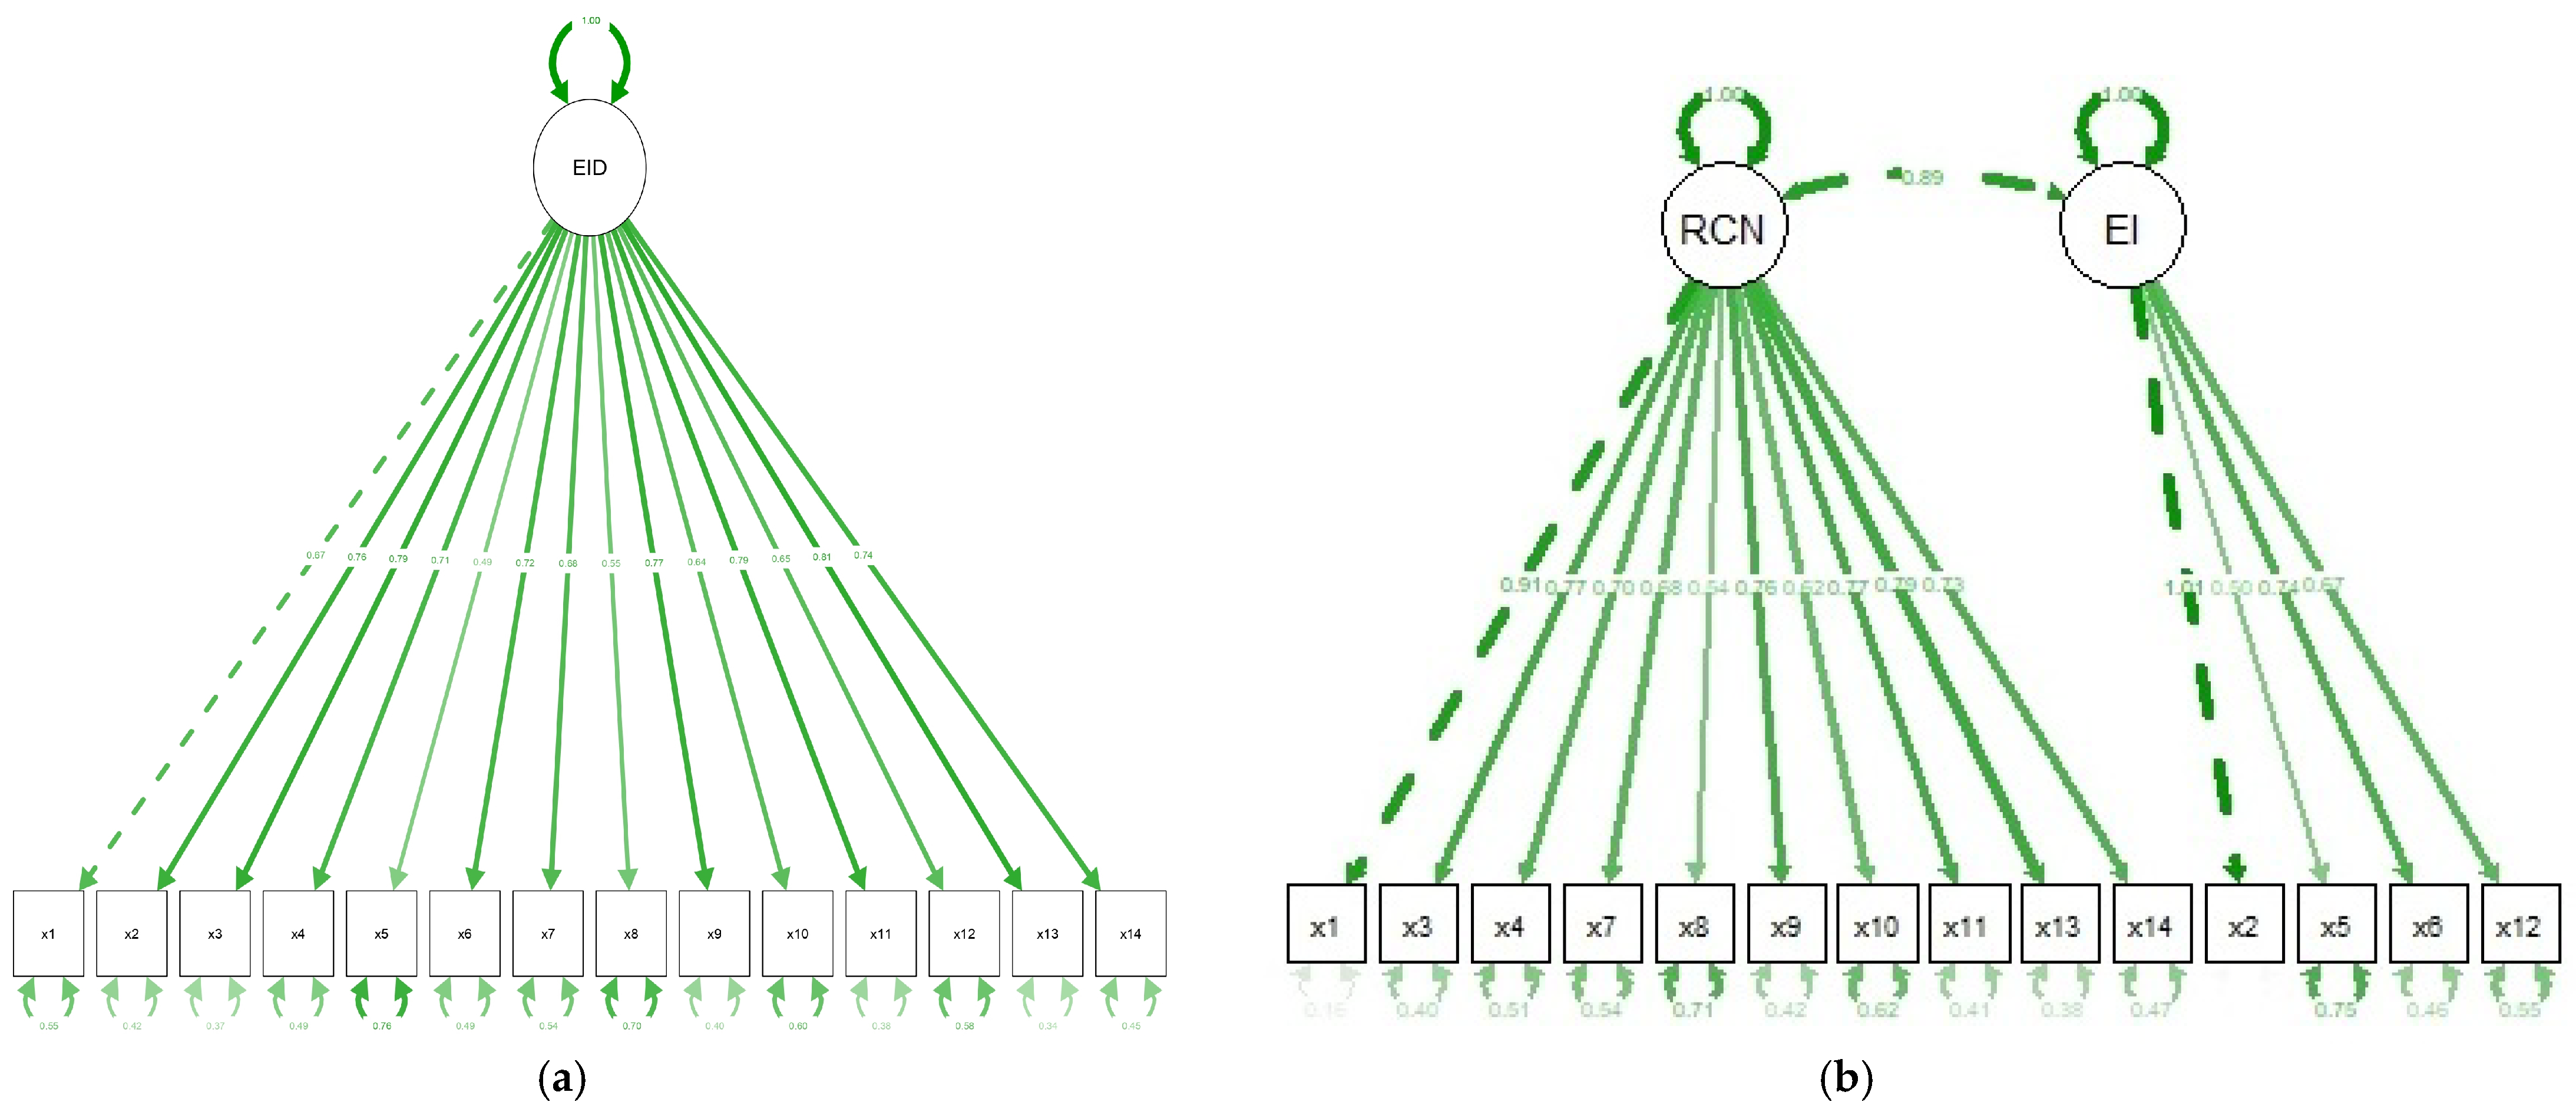
In both the unidimensional (Model 1; Table 4; Figure 3a) and the first-order correlated two-factor model (Model 2; Table 4; Figure 3b), all items loaded significantly on their respective factors (p < 0.001). Standardized loadings ranged from moderate to high, and overall model fit was acceptable. The two-factor model (Model 2) showed a strong correlation between the latent factors (RCN and EI), r = 0.891, and demonstrated slightly better fit indices than the unidimensional model (e.g., SRMR = 0.086; Table 4).
Table 4.
Indices of the confirmatory factor analysis models tested to assess the factorial structure of the 14-item revised environmental identity scale for sample A (N = 232).
Figure 3.
Confirmatory factor analysis of the 14-item revised EID scale in Sample A (N = 232): (a) unidimensional factor model (Model 1) and (b) first-order correlated two-factor model (Model 2). RCN = Restorative Connection with Nature; EI = Ecological Identity.
The second-order factor model (Model 3; Table 4) exhibited estimation issues, including negative residual variances for items 1 and 2, and poor overall fit, indicating that this model was not an appropriate representation of the data.
2.3.4. Convergent and Divergent Validity
Convergent validity of the 14-item revised EID scale was examined through its associations with two related constructs: the NR-6 and NES. Spearman’s rho correlations revealed a moderate positive correlation between the mean EID score and the NR-6, rs = 0.597, p < 0.001, supporting the expected convergence between these measures. A weaker, but still significant, positive correlation was observed between the mean EID score and mean nature exposure, rs = 0.448, p < 0.001. These findings provide evidence of convergent validity, indicating that higher environmental identity is associated with stronger connectedness to nature and greater levels of nature exposure (Table 5).
Table 5.
Spearman’s rho correlation examining convergent and divergent validity between the mean score of 14-item revised EID scale, NR6, NES, PVQ value dimensions in sample A (N = 232).
Divergent validity of the EID scale was assessed through its correlations with value dimensions from the PVQ. The mean EID score showed a small, non-significant correlation with self-enhancement values (rs = −0.061, p = 0.385), supporting divergent validity for this theoretically unrelated construct. Weak positive correlations were observed with conservation values (rs = 0.190, p = 0.006), and moderate positive correlations were found with self-transcendence (rs = 0.359, p < 0.001) and openness to change (rs = 0.247, p < 0.001), as theoretically expected to align more closely with environmental identity (Table 5).
These results indicate that the EID scale is largely distinct from self-enhancement values but shows meaningful associations with value dimensions reflecting concern for others and openness to new experiences (Table 5). In particular, environmental identity demonstrates clear convergence with self-transcendence and, to a lesser extent, with openness to change, while remaining independent of self-enhancement.
3. Study 2—Assessing Acquiescence and the Effects of Reverse-Worded Items
Study 2 investigated the potential influence of acquiescence bias on responses to the EID scale. Given that all original items are positively worded, a balanced version including partially reverse-worded items was developed and tested. This study compared item performance, factor loadings, and reliability across versions to determine whether reverse-wording effectively reduces response bias or introduces additional measurement artifacts.
3.1. Participants
Study 2 included 225 participants who completed Version B of the EID scale. The majority were employed (68.70%), followed by students (9.67%), pensioners (7.63%), working students (6.62%), unemployed individuals (5.60%), and homemakers (2.04%). As in Study 1, the sample was predominantly female (62%), with 38% male participants. Participants were primarily aged 36–48 years (34.5%), followed by those aged 49–81 years (31.0%), 23–35 years (23.9%), and 16–22 years (10.7%). Regarding educational level, most participants had completed higher education: 38.1% held a bachelor’s degree, 16.2% a master’s or postgraduate degree, and 4.6% a doctoral degree. Additionally, 31.5% had completed secondary education, while fewer than 10% reported lower levels of education (Table 6).
Table 6.
Sociodemographic characteristics of Samples A (N = 232) and B (N = 225), including employment status, gender, age quartiles, educational level, academic field of study, and professional group.
Among the students who specified their academic field of study, Health Sciences (3.6%) was the most frequently reported area. All other fields (e.g., Social Sciences, Business Sciences, Mathematics and Statistics, Engineering, and Services) each represented 1% or less of the total sample. Regarding professional occupation, the largest group comprised specialists in intellectual and scientific professions (35%), followed by administrative staff (22.9%) and service, protection, and sales workers (15.9%). Smaller proportions were observed among technicians and associate professionals, unskilled workers, agricultural and industrial workers, managers, and armed forces personnel (Table 6).
Participants in samples A and B were comparable across all assessed sociodemographic variables (Table 6). Group comparisons were conducted using chi-square (χ2) tests and no statistically significant differences were found between the two groups in employment status (χ2(5) = 3.33, p = 0.65), gender (χ2(1) = 0.02, p = 0.89), educational level (χ2(6) = 4.57, p = 0.60), age quartiles (χ2(3) = 5.80, p = 0.12), field of study (χ2(9) = 6.97, p = 0.63), or professional group (χ2(9) = 5.82, p = 0.75). These results indicate that the two subsamples (versions A and B) did not differ significantly in key demographic or professional characteristics, supporting their comparability for subsequent analyses.
3.2. Methods
3.2.1. Instruments and Procedures
Based on the findings of Study 1, the present analyses examined whether the 14-item revised EID scale [2] showed evidence of acquiescence bias. To address this potential response style, a balanced version of the scale was developed for Study 2 (EID—14-item balanced version), in which seven items (1, 4, 5, 6, 7, 11, and 13) were rephrased in a semantically opposite but syntactically natural form.
All items in the balanced version were rated on the same 7-point Likert scale (1 = not at all true to 7 = completely true). As with the revised 14-item EID scale, the balanced version was translated into European Portuguese by two independent bilingual researchers, a Portuguese-native speaker and an English-native speaker. Both researchers reviewed the items for linguistic clarity and cultural equivalence, following the International Test Commission Guidelines for Translating and Adapting Tests [39].
3.2.2. Data Analysis
In study 2 we focused on item-level distributions and response patterns of the revised 14-item EID scale [2] whether it introduces acquiescence bias that affects its psychometric structure and score interpretation. To address this the developed balanced version of the scale contained an equal number of positively and reverse-worded items, while preserving the original content. This adaptation was intended to reduce agreement and positivity biases without altering the theoretical meaning of environmental identity.
By using the two independent samples (samples A; N = 232 and B; N = 225), we analyzed item-level distributions and response patterns, with particular attention to the reversed items, to determine whether participants showed a general tendency to agree regardless of item content. We also tested whether reversing item polarity influenced the factor structure and psychometric properties of the scale. These analyses allowed us to assess whether acquiescence distorts the measurement of environmental identity and whether the balanced EID scale version provides a more valid and interpretable representation of the construct.
All analyses were conducted using IBM SPSS Statistics (version 29) and software R v.4.3.2 [40].
- Item descriptive statistics and Reliability Analysis
Descriptive statistics were computed for each item of the balanced 14-item EID scale, including means and standard deviations, to examine response patterns and variability. Item distributions were inspected to assess endorsement tendencies and the extent to which the inclusion of reversed items mitigated response bias toward higher agreement.
The Cronbach’s alpha was computed to estimate overall scale reliability, alongside corrected item–total correlations and alpha-if-item-deleted statistics to assess individual item contributions. In addition, McDonald’s omega and total omega (ω and ωtot) were calculated as model-based reliability estimates and considered robust indicators of internal consistency. The items were retained when they contributed positively to reliability and construct coherence.
- Exploratory factor analysis
To examine the latent structure of the balanced 14-item EID scale, factorability of the data was first assessed using the KMO measure of sampling adequacy and Bartlett’s Test of Sphericity. An initial PA was conducted, and after a PCA explored the variance structure and informed subsequent factor analytic decisions; however, PCA results were interpreted cautiously due to cross-loadings and limited theoretical interpretability.
Subsequently, an EFA was performed using the minimum residual (minres) extraction method with oblimin rotation, allowing for potential factor correlations. The factor retention was guided by eigenvalues, scree plot inspection, and theoretical coherence with the environmental identity construct. The model adequacy was evaluated using multiple fit indices, including the RMSR, TLI, and RMSEA with 90% confidence intervals. The communalities and standardized factor loadings were examined to assess item performance and factor representation.
- Confirmatory factor analysis
Based on the EFA findings, CFA was conducted to test the fit of a uni- and bidimensional 14-item balanced revised EID models. CFA was estimated using DWLS, which is recommended for ordinal data and for handling deviations from normality at the item level, providing robust standard errors and corrected chi-square statistics [42].
Model fit was evaluated using multiple goodness-of-fit indices, including the CFI, TLI and RMSEA with 90% confidence intervals, and the SRMR, following commonly accepted cutoff criteria. The standardized factor loadings and item-level explained variance (R2) values were inspected to assess the relative contribution of each item to the latent environmental identity construct.
Similarly, to the analysis made in Study 1, to further assess the stability of the factor solutions and reduce the risk of capitalization on chance, a robustness check was conducted by randomly dividing the sample into two halves and repeating the analyses. The resulting solutions were highly similar to those obtained using the full sample, indicating that the factor structure was stable [43].
3.3. Results
3.3.1. Descriptive and Reliability Analysis of 14-Items Revised EID Balanced Version
To address the research question concerning potential bias arising from the uniformly positive wording of the original items, we examined the psychometric properties of the balanced (reversed-worded) version of the 14-item revised EID scale. The balanced version demonstrated satisfactory reliability in Sample B (N = 225). Cronbach’s alpha was 0.78 indicating acceptable internal consistency. McDonald’s omega coefficient further supported scale reliability (ω = 0.78; total omega ωtot = 0.81), suggesting adequate coherence among items representing the environmental identity construct.
At the item level, mean scores ranged from 5.27 (item 12) to 6.57 (item 13), on the 7-point Likert scale, reflecting generally high endorsement of environmental identity. Standard deviations were moderate (SD = 0.69 across items), indicating sufficient response variability (Table 7).
Table 7.
Descriptive and reliability of the balanced (partially reversed) 14-item revised environmental identity scale for sample B (N = 225) with corresponding reversed item description in Portuguese and in English.
Corrected item–total correlations ranged from 0.27 (item 4) to 0.66 (item 11), suggesting that most items contributed meaningfully to the internal structure of the scale. Cronbach’s alpha if item deleted ranged between 0.73 and 0.76, with no single item substantially lowering or improving reliability, supporting item retention (Table 7).
Despite the balanced wording, response distributions remained positively skewed, with a substantial proportion of responses concentrated in the upper categories. For many items (e.g., Items 1, 7, and 13), endorsement rates for response categories 6 and 7 exceeded 60% (Table 7). This pattern suggested that high agreement levels persisted even after controlling for item polarity.
3.3.2. Exploratory Factor Analysis
The KMO measure indicated good sampling adequacy (KMO = 0.80), and Bartlett’s test of sphericity was significant, χ2(91) = 660.0, p < 0.001, supporting factorability of the correlation matrix.
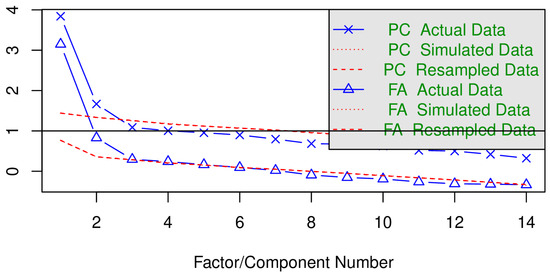
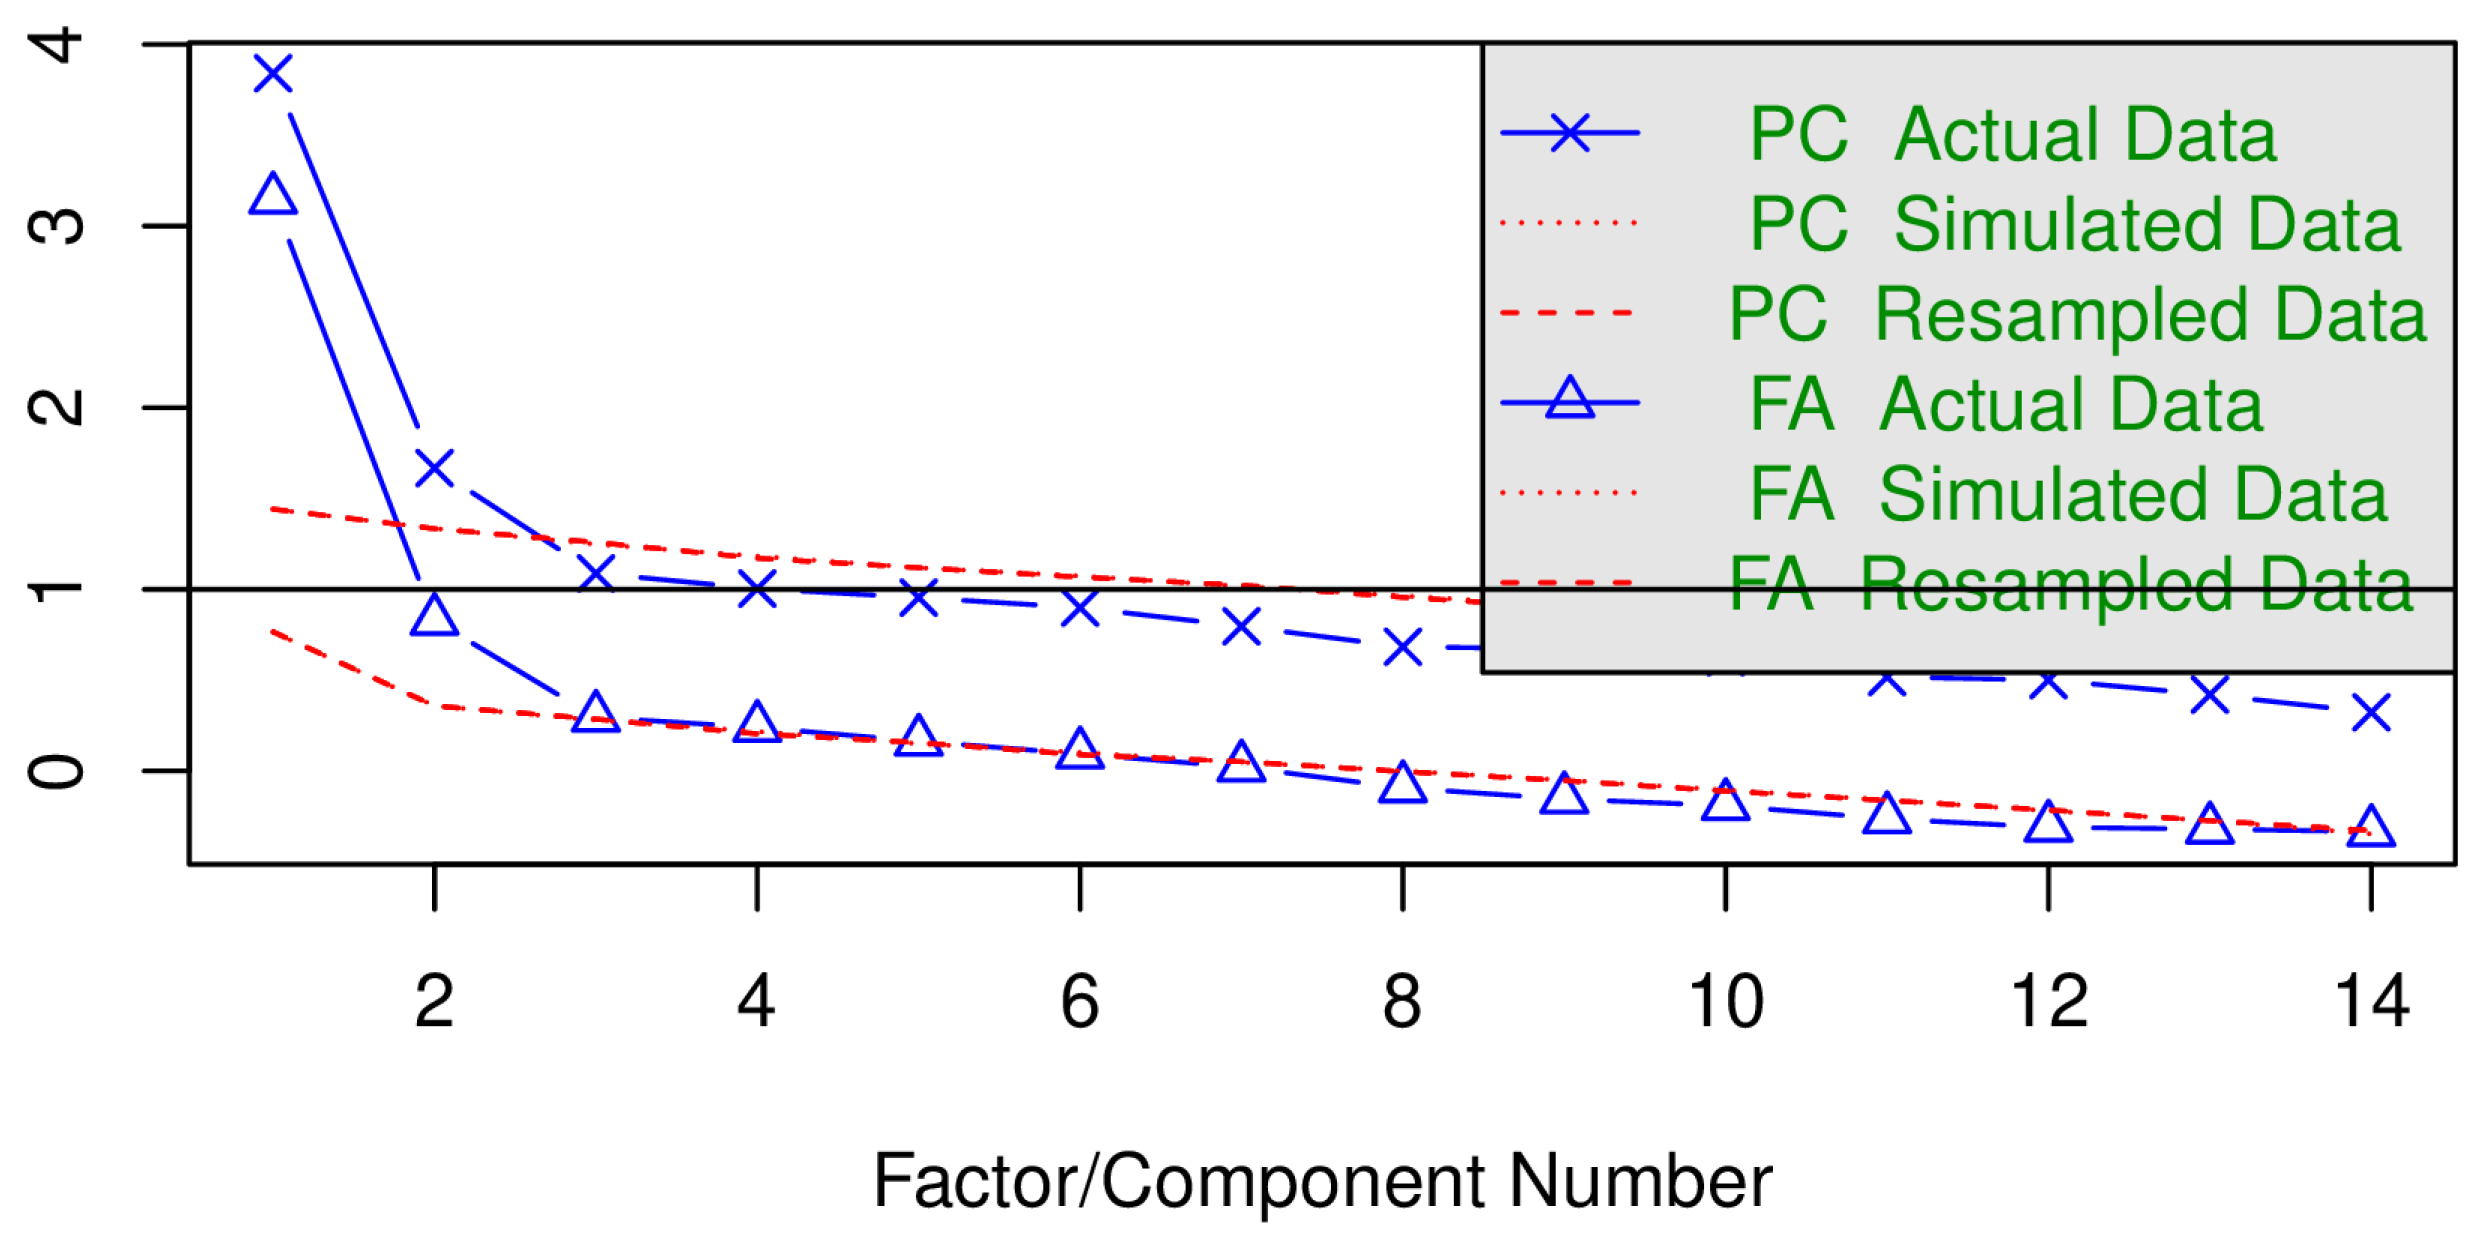
As in Study 1, Figure 4 presents the scree plot comparing eigenvalues from principal components (PC) and factor analysis (FA). For the PC solution, the first component accounts for the largest proportion of variance (eigenvalue ≈ 3.8), followed by a marked drop to the second component (≈1.6). From the third component onward, the observed eigenvalues fall below the simulated and resampled reference lines, suggesting that additional components are more likely attributable to random noise than to substantive latent structure. A similar pattern emerges for the FA solution, further supporting the retention of two factors.
Figure 4.
Parallel analysis scree plot of the 14-item balanced (partially reversed) revised environmental identity scale, Sample B (N = 225). PC, principal component; FA, factor analysis.
To further examine the results of the PA, a PCA was conducted. The eigenvalue greater than one criterion suggested a four-component solution, accounting for 54.3% of the variance (27.4%, 11.9%, 7.8%, and 7.2% respectively). However, this result should be interpreted with caution, as PCA is designed to maximize explained variance rather than to identify latent constructs. In contrast, inspection of the scree plot supported a two- to three-factor solution. Moreover, the oblimin-rotated component matrix revealed substantial cross-loadings, limiting the interpretability of the multi-component solution.
An EFA was subsequently conducted to further examine the latent structure of the scale, using the minimum residual (minres) extraction method with oblimin rotation. Both one- and two-factor solutions were tested. The one-factor model yielded an eigenvalue of 3.12 and was theoretically consistent with the conceptualization of environmental identity as a broad construct. However, it accounted for only 22% of the total variance, indicating that the single factor captured a relatively limited proportion of the shared variability among items.
Although most items showed acceptable factor loadings (e.g., Item 9 = 0.61, Item 11 = 0.71, Item 14 = 0.68), several items loaded only modestly (e.g., Item 5 = 0.40, Item 13 = 0.36). Communalities ranged from 0.06 to 0.51, suggesting uneven representation of items within the latent structure. Model fit indices indicated only moderate fit (RMSR = 0.09; RMSEA = 0.089, 90% CI [.075, 0.103]; TLI = 0.72).
In contrast, the two-factor solution provided a better representation of the data. This model explained 30% of the total variance (19% for Factor 1 and 11% for Factor 2) and demonstrated improved overall fit (RMSR = 0.05; RMSEA = 0.064, 90% CI [0.047, 0.081]; TLI = 0.85; BIC = −216.40). The pattern matrix revealed a clear and interpretable structure, with most items loading strongly on one of the two correlated factors (r = 0.40) and showing minimal cross-loadings. Taken together, these findings suggest that although environmental identity can be conceived as a broad, overarching construct, the two-factor solution provides a more adequate and psychometrically robust representation of the scale’s latent structure in this sample (see Figure 5 and Table 8).
Figure 5.
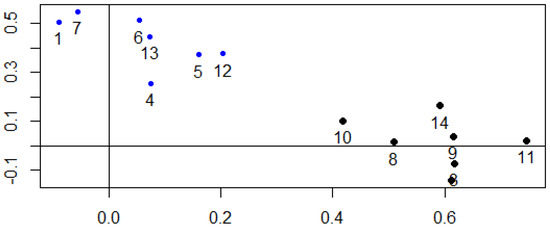
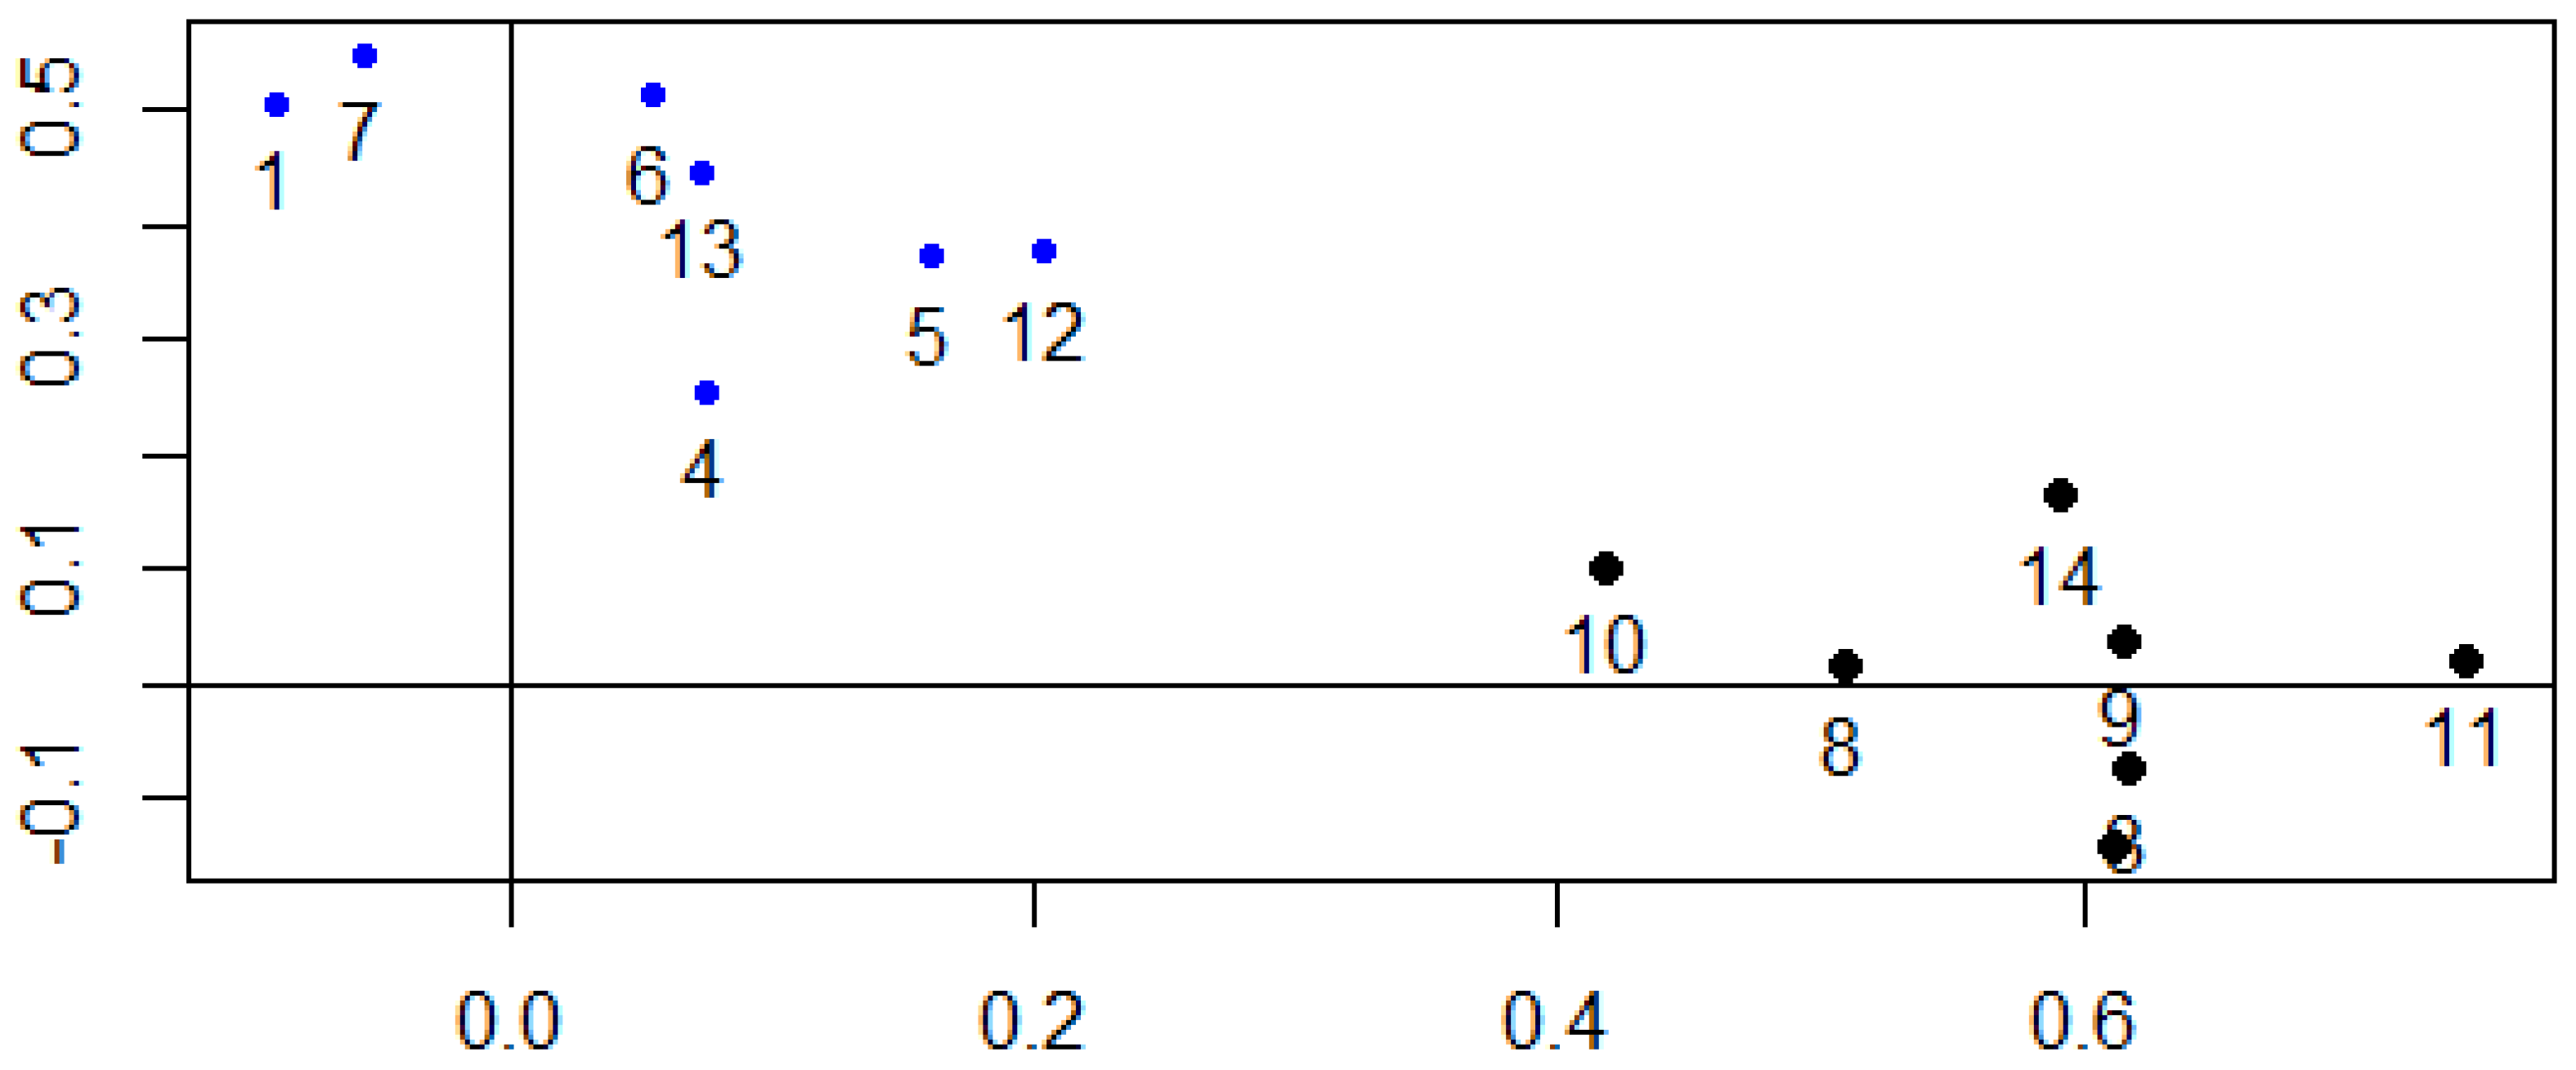
Exploratory factor analysis plot of the correlated two-factor solution for the 14-item balanced (partially reversed) environmental identity scale (Sample B, N = 225). PC = principal components; FA = factor analysis.
Table 8.
Item loadings for the one- and two-factor solutions of the 14-item balanced (partially reversed) revised environmental identity scale (Sample B, N = 225; EFA, using the minimum residual [minres] estimator with oblimin rotation).
3.3.3. Model Adjustment Using Confirmatory Factor Analysis
Based on the EFA results, a confirmatory factor analysis (CFA) was conducted in Sample B (N = 225) using the diagonally weighted least squares (DWLS) estimator. Two models were tested mirroring Study 1: a unidimensional model and a correlated two-factor model.
The one-factor model (Table 9; Figure 6a) demonstrated good fit to the data, with CFI = 0.967, TLI = 0.961, RMSEA = 0.036 (90% CI [0.007, 0.055]), and SRMR = 0.083. These indices indicate that environmental identity can be adequately represented as a single latent construct. All standardized factor loadings were statistically significant (p < 0.001), ranging from 0.18 to 0.74.
Table 9.
Fit indices for the confirmatory factor analysis models tested to assess the factorial structure of the 14-item balanced revised environmental identity scale (Sample B; N = 225).
Figure 6.
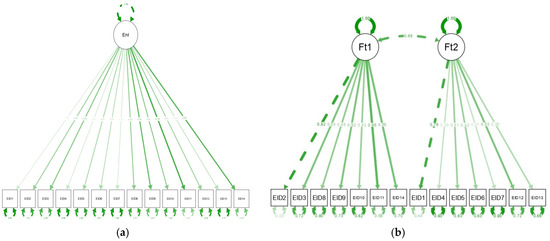
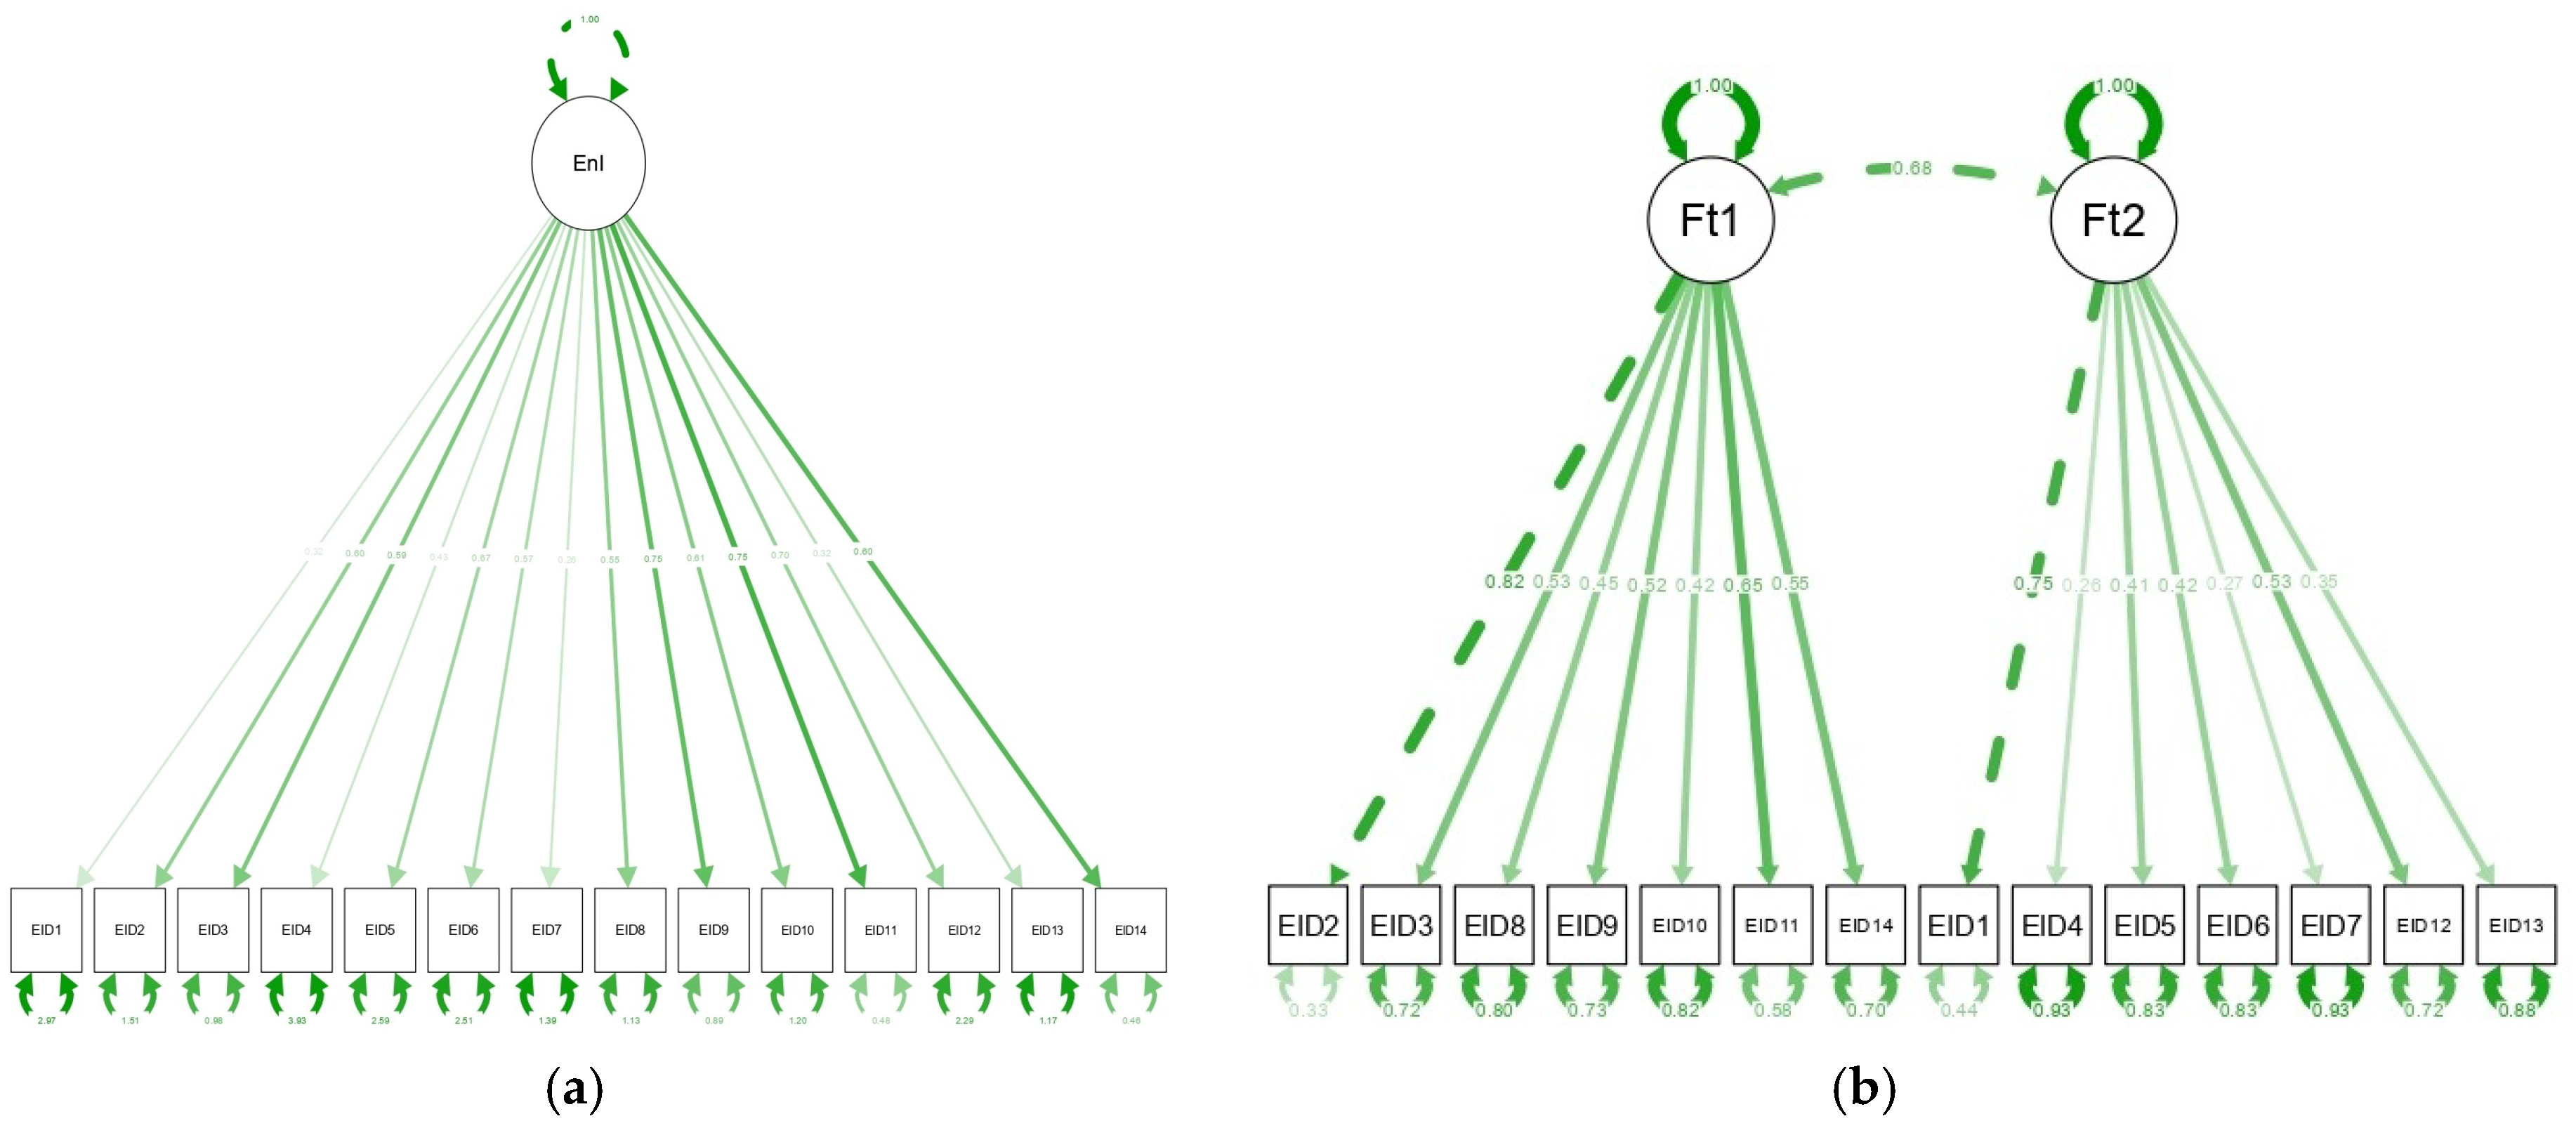
Confirmatory factor analysis models of the 14-item balanced (partially reversed) revised environmental identity scale (EnI) confirmatory factor analysis in sample B (N = 225): (a) unidimensional factor model and (b) correlated two-factor model.
In contrast, the two-factor model (Table 9; Figure 6b) showed poor fit, with CFI = 0.803, TLI = 0.767, RMSEA = 0.089 (90% CI [.075, 0.103]), and SRMR = 0.102, failing to meet conventional cut-off criteria. Although all factor loadings were statistically significant, the model exhibited limited explanatory adequacy and substantial residual variance.
4. Discussion
The present research addressed two central psychometric questions concerning the revised 14-item EID scale [2]: first, whether the exclusive use of positively worded items induces acquiescence bias; and second, whether environmental identity is best conceptualized as a strictly unidimensional construct or as an organized construct with theoretically meaningful subdimensions. Building on prior research examining the psychometric properties of the EID scale across versions and cultural contexts [1,16,20,21,32,44], this study sought to clarify persistent ambiguities regarding both factorial structure and response bias. In addition, the present work contributes to the growing body of cross-cultural validations of the EID scale by examining its psychometric behavior in a Portuguese context, an important step for assessing the generalizability of the construct across linguistic and cultural settings.
From a scale-development perspective, Study 2 introduced a balanced version of the revised EID scale, in which half of the items were reverse-worded, to directly test concerns regarding acquiescence associated with exclusively positively worded items. Contrary to expectations derived from classical psychometric recommendations [27,28], this alternative version demonstrated inferior psychometric performance when compared with the original scale [2], previous validation studies [21,32], and the findings from Study 1, which used demographically comparable samples (Sample A in Study 1 and Sample B in Study 2; see Table 6).
Although the balanced EID scale showed acceptable reliability (α and ω ≈ 0.78), internal consistency was substantially lower than that of the original version (α ≈ 0.92), and its factor structure was characterized by weak communalities and unsatisfactory fit indices. This pattern suggests that reversing item wording introduced method variance and item confusion rather than reducing acquiescence bias. Rather than reflecting a failure of scale balance per se, these findings raise broader concerns about the suitability of reverse-worded items for identity-based constructs that are value-laden, affectively charged, and socially meaningful. In such contexts, item reversal may increase cognitive load [30], introduce semantic ambiguity [31], and disrupt automatic response patterns [30], leading respondents to answer based on processing difficulty rather than on the underlying construct.
Consistent with previous research [25], reverse-worded items behave differently from their positively worded counterparts, clustering together in factor analyses and degrading model fit—patterns indicative of method artifacts rather than substantive psychological dimensions. This pattern was replicated in Study 2, where both EFA and CFA revealed a second factor composed exclusively of reverse-worded items, irrespective of content. Importantly, participants continued to endorse high levels of agreement even on reverse-worded items, suggesting that elevated agreement may reflect a genuine valuation of environmental identity rather than acquiescence bias. Similar patterns have been reported for socially desirable or morally salient constructs [23,26], supporting the interpretation that strong endorsement is substantively meaningful rather than methodologically artefactual.
In contrast, the two-factor solution revealed in Study 1—where all items were positively worded—revealed a theoretically coherent distinction between a dominant first factor, interpreted here as reflecting a Restorative Connection with Nature, and a secondary factor, conceptualized as Ecological Identity. This distinction improved both model fit and interpretability and has also been reported in prior studies (often labeled as Protection of Nature [5,19,20,21]). A similar structure was observed in recent Portuguese research [21], suggesting that this differentiation may capture meaningful facets of environmental identity within this cultural context.
However, the high explained common variance (ECV = 0.70) and substantial inter-factor correlations indicate that most shared variance is attributable to a general environmental identity dimension, a pattern consistently observed across EID scale versions [1,2]. CFA results in Study 1 further showed that the unidimensional model fit the data as well as, or slightly better than, the correlated two-factor model when robust estimators appropriate for ordinal Likert data were used. This convergence with previous international validations [2,21,32] reinforces the interpretation that the scale is essentially unidimensional, despite the presence of a replicable secondary component. Importantly, neither previous research nor the present findings support more complex multidimensional representations, such as bifactor or higher-order models (e.g., Table 4), consistent with evidence from earlier versions of the scale [19,20].
As discussed in the introduction, the relationship between environmental identity and closely related constructs such as connectedness to nature remains conceptually debated [6]. The two-factor structure identified here can be interpreted within this broader framework. Notably, the identity-based factor—here referred to as Ecological Identity, following earlier distinctions by Clayton and Opotow [7]—accounted for less than one third of the explained variance, whereas the experiential–affective factor explained a substantially larger proportion.
This pattern suggests that, in the present sample, individuals’ relationship with nature may be expressed primarily through affective and experiential dimensions rather than through an explicitly self-definitional identity component. In other words, respondents may interpret several items as feelings of closeness, enjoyment, or attachment to nature, rather than as indicators of a stable identity integrated into the self-concept.
This distinction aligns with broader evidence of substantial empirical overlap among constructs such as connectedness to nature, environmental identity, and environmental self-identity. As highlighted by Balundė, Jovarauskaitė, and Poškus [6], different theoretical traditions conceptualize the human–nature relationship either through identity frameworks or through cognitive–affective–behavioral models, leading measurement instruments to capture partially overlapping but distinct dimensions.
From this perspective, the distinction between an identity-based dimension (ecological identity) and an experiential–affective dimension (connection to nature) does not imply separate constructs, but rather reflects different facets of a broader human–nature relationship. Cultural and contextual factors may also contribute to this pattern. In contexts where everyday contact with natural environments is relatively common, relationships with nature may be experienced primarily at an affective or experiential level rather than explicitly articulated as identity. In such cases, emotional connection and experiential engagement with nature may constitute the most salient dimension, while identity-based aspects remain less central in explaining variance in responses. Thus, the two-factor structure may reflect both the multidimensional nature of environmental identity and the differential salience of its components within the specific sociocultural context.
From a methodological perspective, the divergence between EFA and CFA findings reflects a well-recognized tension in psychometric research: optimal statistical fit does not necessarily guarantee theoretical or substantive relevance. Although CFA indices favored a unidimensional solution, EFA consistently revealed residual structure warranting theoretical consideration. Clayton [1] originally defined environmental identity as: “a sense of connection to some part of the nonhuman natural environment, based on history, emotional attachment, and/or similarity, that affects the ways in which we perceive and act toward the world; a belief that the environment is important to us and an important part of who we are.” (pp. 45–46).
While this definition clearly circumscribes identity within the natural domain (and not the environment as a whole), the present findings raise the question of whether environmental identity represents a unified construct encompassing interrelated affective, cognitive, and normative facets, or whether it constitutes a specific manifestation of broader constructs, such as connectedness to nature, partly shaped by the operational characteristics of the EID scale across its versions.
This interpretation is supported by the systematic review by Pagano et al. [16], which underscores this interpretative tension. Although environmental identity is conceptually defined as multidimensional, encompassing emotional, cognitive, behavioral, developmental, and sociocultural components [1,14,45,46], most instruments, including the EID scale, are typically operationalized as unidimensional measures. Pagano et al. [16] argue that this simplification, while convenient for statistical modeling, may constrain content validity and obscure meaningful subcomponents of identity across contexts. The present findings contribute to this debate by demonstrating the empirical recurrence of a secondary dimension within the revised 14-item EID scale, while simultaneously confirming the dominance of a strong general factor.
Across studies, this secondary factor composed of a small set of items—often labeled as Protection of Nature—appears consistently [21,32]. Given its alignment with identity-related aspects of the construct, namely, the integration of nature into the self-concept and its influence on perception and action, we propose the designation Ecological Identity. This terminology is consistent with earlier distinctions in the literature (e.g., [13]), which note that while “environmental identity” is widely used, it may refer more broadly to relationships with the environment in general, whereas “ecological identity” more precisely circumscribes the construct to the natural world. In this sense, the present findings suggest that the emergent factor may reflect a more narrowly defined identity component specifically rooted in human–nature relationships. Importantly, this recurrent factor cannot be attributed to method variance, as it appears in studies using exclusively positively worded items. Its consistency across independent samples supports its substantive nature.
Nevertheless, the present study does not claim Ecological Identity as a fully established construct. Rather, it should be considered as a theoretically plausible candidate emerging from residual variance consistently observed across studies of the revised 14-item EID scale. At this stage, Ecological Identity should be regarded as a provisional conceptual refinement within the broader environmental identity framework, requiring further theoretical elaboration and empirical validation before being treated as an independent dimension. Future research may benefit from expanding and refining this component, as well as examining its relationship with related constructs such as place identity [45,46].
A key distinction emerges when comparing the two studies. In Study 1, the secondary factor emerged despite uniform item wording, suggesting that it may reflect a substantive dimension of Ecological Identity rather than a methodological artifact. In contrast, in Study 2, however, reversed items clustered together, forming a factor best interpreted as a method effect. This contrast strengthens the conclusion that the secondary factor observed in Study 1 reflects meaningful construct variance, whereas the factor in Study 2 reflects response patterns related to item phrasing rather than a distinct dimension of environmental identity.
Overall, these findings underscore the importance of integrating theoretical considerations with empirical evidence when evaluating construct validity, particularly for complex identity constructs that are unlikely to be exhaustively captured by a single psychological process. From a methodological standpoint, the present study adopted a deliberately inclusive analytic strategy, beginning with EFA to examine both uni- and multidimensional solutions, and subsequently applying CFA to test the empirically observed structure against theoretical expectations, contrary to some studies of this revised instrument (e.g., [2,32]). This approach strengthens confidence in the conclusions by avoiding premature model restriction and by allowing theoretical interpretation to emerge from the data rather than being imposed a priori.
Practically, the findings support the use of the revised 14-item EID scale as a reliable global measure of environmental identity in both individual- and group-level research, consistent with prior evidence of its predictive validity for environmental concern and behavior. At the same time, local validations such as the present study contribute to the broader process of evaluating the scale’s cross-cultural robustness. Although variations in factorial structure may emerge across contexts, the strong general factor observed here suggests that the core environmental identity construct remains largely comparable across studies, supporting the potential for future cross-cultural analyses. Rather than relying on reverse-worded items to address response styles, future research may more productively employ advanced statistical modeling approaches (e.g., method factors) or multimethod designs incorporating behavioral or implicit measures [47,48]. Cross-cultural replication in more diverse samples will be essential to evaluate the generalizability of the present structure.
Despite the use of rigorous methods and two independent samples, several limitations should be considered. The findings provide preliminary evidence regarding the dimensionality of the EID scale and the potential influence of item wording, so these results should be interpreted cautiously and require replication in larger and more diverse samples. Both samples consisted of Portuguese-speaking participants and were demographically similar in order to enable direct comparison in Study 2. Hence replication across different linguistic and cultural contexts is therefore necessary to assess the universality of the factorial structure. Additionally, although the balanced version did not improve psychometric performance, alternative responses (e.g., semantic differential scales) may offer promising avenues for future investigation.
5. Conclusions
In summary, this study contributes to ongoing debates on the measurement of environmental identity in two key ways. First, it demonstrates that reversing item wording as a strategy to control acquiescence may be ineffective—and potentially counterproductive—when assessing identity-based constructs such as EID. Second, it clarifies that the factorial structure of the revised 14-item scale, while statistically favoring a unidimensional model, retains theoretically meaningful internal differentiation.
Although a single-factor solution provides the most parsimonious representation of the data, exploratory analyses consistently reveal a subordinate, but interpretable, secondary dimension aligned with identity theory. Environmental identity therefore appears best conceptualized as an essentially unidimensional construct with coherent subcomponents, a perspective that strengthens measurement precision while deepening our understanding of how individuals integrate the natural world into their sense of self.
However, the relatively small sample size and the exclusively Portuguese composition of the samples require caution in interpreting the findings. Cultural influences may shape responses to identity-based measures, and further research using more diverse and cross-cultural samples is needed to confirm the generalizability of these results.
Author Contributions
Conceptualization, A.M.A. and A.P.; methodology, A.M.A. and A.P.; software, A.P.; validation, A.M.A. and A.P.; formal analysis, A.P.; investigation, A.M.A., A.P., E.P. and R.G.; resources, A.M.A., A.P. and R.G.; data curation, A.P. and E.P.; writing—original draft preparation, A.M.A. and A.P.; writing—review and editing, A.M.A., A.P., E.P., and R.G.; visualization, A.M.A. and A.P.; supervision; project administration, A.M.A.; funding acquisition, A.M.A. and R.G. All authors have read and agreed to the published version of the manuscript.
Funding
This research was funded by the Portuguese Foundation for Science and Technology (Fundação para a Ciência e Tecnologia-FCT) through national and European funds, the funding awarded to the institution “Centro de Ecologia, Evolução e Alterações Ambientais” with references UIDB/00329/2020 (https://doi.org/10.54499/UIDB/00329/2020) and UID/00329/2025 (https://doi.org/10.54499/UID/00329/2025). A.M.A., A.P. and R.G. were also funded based on the framework of the FCT project EXPL/ARTDAQ/1444/2021 (http://doi.org/10.54499/EXPL/ART-DAQ/1444/2021): Sense and Sensibility in Interactivity: Connecting children and teenagers to nature through the design of sensory, experiential and aesthetic experiences.
Institutional Review Board Statement
The study was conducted in accordance with the Declaration of Helsinki, and approved by the Ethics Committee of the University of Azores (No. 37/2023) on 16 May 2023.
Informed Consent Statement
Informed consent was obtained from all subjects involved in the study.
Data Availability Statement
The data presented in this study are available on request from the corresponding author due to data protection regulations.
Acknowledgments
The authors would like to thank the reviewers for their constructive comments and valuable suggestions, which helped improve the clarity and quality of this manuscript. The authors also used ChatGPT (GPT-5.3, OpenAI) to assist with table formatting and minor language editing. All outputs were carefully reviewed and validated by the authors, who take full responsibility for the final content of the manuscript.
Conflicts of Interest
The authors declare no conflicts of interest.
Appendix A
Table A1.
Items from the 14-item revised environmental identity scale original version and the 14-item revised environmental identity scale Portuguese version.
References
- Clayton, S. Environmental identity: A conceptual and operational definition. In Identity and the Natural Environment: The Psychological Significance of Nature; Clayton, S., Opotow, S., Eds.; MIT Press: Cambridge, MA, USA, 2003; pp. 45–65. [Google Scholar]
- Clayton, S.; Czellar, S.; Nartova-Bochaver, S.; Skibins, J.C.; Salazar, G.; Tseng, Y.-C.; Irkhin, B. Cross-cultural validation of a revised Environmental Identity Scale. Sustainability 2021, 13, 2387. [Google Scholar] [CrossRef] [Scilit]
- Tam, K.-P. Concepts and measures related to connection to nature: Similarities and differences. J. Environ. Psychol. 2013, 34, 64–78. [Google Scholar] [CrossRef] [Scilit]
- Dresner, M.; Handelman, C.; Braun, S.; Rollwagen-Bollens, G. Environmental identity, pro-environmental behaviors, and civic engagement of volunteer stewards in Portland area parks. Environ. Educ. Res. 2015, 21, 991–1010. [Google Scholar] [CrossRef] [Scilit]
- Scopelliti, M.; Molinario, E.; Bonaiuto, F.; Bonnes, M.; Cicero, L.; De Dominicis, S.; Fornara, F.; Admiraal, J.; Beringer, A.; Dedeurwaerdere, T.; et al. What makes you a “hero” for nature? Socio-psychological profiling of leaders committed to nature and biodiversity protection across seven EU countries. J. Environ. Plan. Manag. 2018, 61, 970–993. [Google Scholar] [CrossRef] [Scilit]
- Balundė, A.; Jovarauskaitė, L.; Poškus, M.S. Exploring the relationship between connectedness with nature, environmental identity, and environmental self-identity: A systematic review and meta-analysis. Sage Open 2019, 9, 2158244019841925. [Google Scholar] [CrossRef] [Scilit]
- Clayton, S.; Kilinç, A. Proenvironmental concern and behavior in Turkey: The role of national and environmental identity. PsyEcology 2013, 4, 311–330. [Google Scholar] [CrossRef] [Scilit]
- Clayton, S. Psychology and climate change. Curr. Biol. 2019, 29, R992–R995. [Google Scholar] [CrossRef] [Scilit]
- Mayer, F.S.; Frantz, C.M. The connectedness to nature scale: A measure of individuals’ feeling in community with nature. J. Environ. Psychol. 2004, 24, 503–515. [Google Scholar] [CrossRef] [Scilit]
- Salazar, G.; Kunkle, K.; Monroe, M.C. Practitioner guide to assessing connection to nature. N. Am. Assoc. Environ. Educ. 2020, 10, 1–63. [Google Scholar]
- Nisbet, E.K.; Zelenski, J.M.; Murphy, S.A. The nature relatedness scale: Linking individuals’ connection with nature to environmental concern and behavior. Environ. Behav. 2009, 41, 715–740. [Google Scholar] [CrossRef] [Scilit]
- Lou, X.; Li, L.M.W. The relationship between identity and environmental concern: A meta-analysis. J. Environ. Psychol. 2021, 76, 101653. [Google Scholar] [CrossRef] [Scilit]
- Clayton, S.; Opotow, S. (Eds.) Identity and the Natural Environment; MIT Press: Cambridge, MA, USA, 2003; pp. 45–65. [Google Scholar]
- Schultz, P.W. Inclusion with nature: The psychology of human–nature relations. In Psychology of Sustainable Development; Schmuck, P., Schultz, P.W., Eds.; Springer: Berlin/Heidelberg, Germany, 2002; pp. 61–78. [Google Scholar] [CrossRef] [Scilit]
- Capaldi, C.A.; Passmore, H.A.; Nisbet, E.K.; Zelenski, J.M.; Dopko, R.L. Flourishing in nature: A review of the benefits of connecting with nature and its application as a wellbeing intervention. Int. J. Wellbeing 2015, 5, 1–16. [Google Scholar] [CrossRef]
- Pagano, L.P.; Garofalo, C.; Mazzeschi, C.; de Caro, E.F.; Delvecchio, E. A Systematic Review of Environmental Identity: Definitions, Measurement Tools, and Future Directions. J. Environ. Psychol. 2025, 105, 102657. [Google Scholar] [CrossRef] [Scilit]
- Kiesling, F.M.; Manning, C.M. How green is your thumb? Environmental gardening identity and ecological gardening practices. J. Environ. Psychol. 2010, 30, 315–327. [Google Scholar] [CrossRef] [Scilit]
- Matsuba, M.K.; Pratt, M.W.; Norris, J.E.; Mohle, E.; Alisat, S.; McAdams, D.P. Environmentalism as a context for expressing identity and generativity: Patterns among activists and uninvolved youth and midlife adults. J. Personal. 2012, 80, 1091–1115. [Google Scholar] [CrossRef] [Scilit]
- Olivos, P.; Aragonés, J.I. Psychometric properties of the environmental identity scale (EID). Psyecology 2011, 2, 65–74. [Google Scholar] [CrossRef] [Scilit]
- Moreira, P.; Loureiro, A.; Inman, R.; Olivos-Jara, P. Assessing the unidimensionality of clayton’s environmental identity scale using Confirmatory Factor Analysis (CFA) and Bifactor Exploratory Structural Equation Modeling (bifactor-ESEM). Collabra Psychol. 2021, 7, 28103. [Google Scholar] [CrossRef] [Scilit]
- Ferrajão, P.; Torres, N.; Martins, A.Q. Adaptation of the revised Environmental Identity Scale to adult Portuguese native speakers: A validity and reliability study. Sustainability 2024, 16, 7877. [Google Scholar] [CrossRef] [Scilit]
- Suárez-Álvarez, J.; Pedrosa, I.; Lozano, L.M.; García-Cueto, E.; Cuesta, M.; Muñiz, J. Using reversed items in Likert scales: A questionable practice. Psicothema 2018, 30, 149–158. [Google Scholar] [CrossRef] [Scilit]
- Graeff, T.R. Response bias. In Encyclopedia of Social Measurement; Kempf-Leonard, K., Ed.; Elsevier: Amsterdam, The Netherlands, 2005; Volume 3, pp. 411–418. [Google Scholar]
- Johnson, R.L.; Morgan, G.B. Survey Scales: A Guide to Development, Analysis, and Reporting; Guilford Press: New York, NY, USA, 2016. [Google Scholar]
- Van Sonderen, E.; Sanderman, R.; Coyne, J.C. Ineffectiveness of reverse wording of questionnaire items: Let’s learn from cows in the rain. PLoS ONE 2013, 8, e68967. [Google Scholar] [CrossRef] [Scilit]
- Kam, C.C.S. Why do regular and reversed items load on separate factors? Response difficulty vs. item extremity. Educ. Psychol. Measur. 2023, 83, 1085–1112. [Google Scholar] [CrossRef] [Scilit]
- Lorenzo-Seva, U.; Ferrando, P.J. Acquiescent responding in partially balanced multidimen-sional scales. Br. J. Math. Stat. Psychol. 2009, 62, 319–326. [Google Scholar] [CrossRef] [Scilit]
- Vigil-Colet, A.; Navarro-González, D.; Morales-Vives, F. To reverse or not to reverse Likert-type items: That is the question. Psicothema 2020, 32, 108–114. [Google Scholar] [CrossRef] [Scilit]
- İlhan, M.; Güler, N.; Teker, G.T.; Ergenekon, Ö. The Effects of Reverse Items on Psychometric Properties and Respondents’ Scale Scores According to Different Item Reversal Strategies. Int. J. Assess. Tools Educ. 2024, 11, 20–38. [Google Scholar] [CrossRef] [Scilit]
- Hughes, G.D. The impact of incorrect responses on the reliability and validity of measurement scales. Personal. Individ. Differ. 2009, 46, 481–485. [Google Scholar] [CrossRef] [Scilit]
- Setiawati, F.A.; Nurhayati, S.R.; Amelia, L. Reverse-worded items and their impact on psychometric properties. J. Educ. Meas. 2022, 59, 375–392. [Google Scholar] [CrossRef] [Scilit]
- Ariccio, S.; Mosca, O. Revised environmental identity scale: Adaptation and preliminary examination on a sample of Italian pet owners. Front. Psychol. 2023, 13, 892841. [Google Scholar] [CrossRef] [Scilit] [PubMed]
- Kamitsis, I.; Francis, A.J. Spirituality mediates the relationship between engagement with nature and psychological wellbeing. J. Environ. Psychol. 2013, 36, 136–143. [Google Scholar] [CrossRef] [Scilit]
- Schwartz, S.H. A proposal for measuring value orientations across nations. Quest. Package Eur. Soc. Surv. 2003, 259, 261. [Google Scholar]
- Silva, A.; Gonçalves, M. Nature Relatedness Scale: Psychometric properties of the Portuguese version. Environ. Educ. Res. 2024, 30, 1806–1822. [Google Scholar] [CrossRef] [Scilit]
- Wood, C.; Barron, D.; Smyth, N. The current and retrospective intentional nature exposure scales: Development and factorial validity. Int. J. Environ. Res. Public Health 2019, 16, 4443. [Google Scholar] [CrossRef] [Scilit]
- Picanço, A.; Arroz, A.M.; Tsafack, N.; Sánchez, A.F.; Pereira, E.; De Benedictis, M.; Amorim, I.R.; Melo, M.d.L.; Gabriel, R. Assessing nature exposure: A study on the reliability and validity of a Portuguese version of the nature exposure scale. Front. Psychol. 2024, 15, 1290066. [Google Scholar] [CrossRef] [Scilit]
- Granjo, M.; Peixoto, F. Contributo para o estudo da Escala de Valores Humanos de Schwartz em professores. Laboratório De Psicol. 2013, 11, 3–17. [Google Scholar] [CrossRef] [Scilit]
- International Test Commission. ITC Guidelines for Translating and Adapting Tests, 1st ed.; International Test Commission: Hemel Hempstead, UK, 2005; Available online: https://www.intestcom.org (accessed on 8 March 2023).
- R Core Team. R: A Language and Environment for Statistical Computing, Version 4.3.2; R Foundation for Statistical Computing: Vienna, Austria, 2023; Available online: https://www.r-project.org (accessed on 10 July 2023).
- West, S.G.; Finch, J.F.; Curran, P.J. Structural equation models with nonnormal variables: Problems and remedies. In Structural Equation Modeling: Concepts, Issues, and Applications; Hoyle, R.H., Ed.; Sage Publications, Inc.: Thousand Oaks, CA, USA, 1995; pp. 56–75. [Google Scholar]
- Shi, D.; Maydeu-Olivares, A. The effect of estimation methods on SEM fit indices. Educ. Psychol. Meas. 2020, 80, 421–445. [Google Scholar] [CrossRef] [Scilit]
- Floyd, F.J.; Widaman, K.F. Factor analysis in the development and refinement of clinical assessment instruments. Psychol. Assess. 1995, 7, 286–299. [Google Scholar] [CrossRef]
- Clayton, S.D. 10 Environment and Identity. In The Oxford Handbook of Environmental and Conservation Psychology; Oxford University Press Inc.: New York, NY, USA, 2012; p. 164. [Google Scholar] [CrossRef] [Scilit]
- Stets, J.E.; Biga, C.F. Bringing identity theory into environmental sociology. Sociol. Theory 2003, 21, 398–423. [Google Scholar] [CrossRef] [Scilit]
- Bernardo, F.; Palma-Oliveira, J. Place identity, place attachment and the scale of place: The impact of place salience. Psyecology 2013, 4, 167–193. [Google Scholar] [CrossRef] [Scilit]
- Li, S.; Savalei, V. Evaluating statistical fit of confirmatory bifactor models: Updated recommendations and a review of current practice. Psychol. Methods 2025. Advance online publication. [Google Scholar] [CrossRef] [Scilit] [PubMed]
- Gegenfurtner, A. Bifactor exploratory structural equation modeling: A meta-analytic review of model fit. Front. Psychol. 2022, 13, 1037111. [Google Scholar] [CrossRef] [Scilit]

Disclaimer/Publisher’s Note: The statements, opinions and data contained in all publications are solely those of the individual author(s) and contributor(s) and not of MDPI and/or the editor(s). MDPI and/or the editor(s) disclaim responsibility for any injury to people or property resulting from any ideas, methods, instructions or products referred to in the content. |
© 2026 by the authors. Licensee MDPI, Basel, Switzerland. This article is an open access article distributed under the terms and conditions of the Creative Commons Attribution (CC BY) license.