


Abstract
To explore the evolutionary dynamics of green product markets under bounded rationality, this study develops a tripartite evolutionary game model involving the government, passenger vehicle enterprises, and consumers, using China’s new energy vehicle (NEV) market as a case study. By integrating system dynamics with real-world data and policies, the paper simulates strategy evolution paths and identifies equilibrium conditions. The results show a unique evolutionarily stable strategy: the government refrains from regulation, enterprises actively produce NEVs, and consumers actively purchase green products. The government’s strategy is primarily influenced by enterprises, while enterprises’ strategy is mainly driven by consumers. Numerical analysis reveals that when the premium payment ratio of green products (price difference relative to conventional vehicles) is controlled between 27.27% and 31.82%, the market evolves most rapidly toward the ideal equilibrium. Furthermore, when the additional positive benefit ratio of green consumption falls below 36.36%, market formation and development are severely hindered; raising this ratio to 40.91% yields significant promotion effects, beyond which marginal benefits diminish. These findings provide quantitative benchmarks for policy design and strategic decision-making to foster self-sustaining green product markets.
1. Introduction
The development of the green economy has gradually become a common trend in the global environmental and economic fields. It is also an inherent requirement for China’s economic development at the current stage [1]. The ninth meeting of the Central Committee for Financial and Economic Affairs clearly stated that China aims to achieve carbon peaking by 2030 and carbon neutrality by 2060 [2]. Against this background, it is particularly important to build a mechanism that adapts to the requirements of sustainable development [3]. This requires not only support from advanced scientific and technological innovation, but also strict emission reduction policy constraints. More importantly, the promotion of market-oriented means is needed [4]. Among them, the transportation sector has attracted much attention because of its significant contribution to energy consumption and carbon emission growth. Vigorously developing new energy vehicles has become a key measure to achieve the goals of carbon peaking and carbon neutrality.
Under the guidance of the concept of sustainable development, the Chinese government has continuously issued relevant policies. These policies have strongly promoted the rapid development of the new energy vehicle industry. By 2022, China’s new energy vehicle production and sales reached 7.058 million and 6.887 million units respectively, with year-on-year increases of 96.7% and 93.4%. This ranked first in the world for eight consecutive years [5]. However, as the industry gradually matures, the government’s new energy vehicle subsidy policy has entered a phase-out channel, and the subsidy intensity has been decreasing year by year [6]. At the same time, international competitive pressure continues to increase. This brings new challenges to the sustainable and healthy development of the new energy vehicle market. Against this background, how to achieve the sustainable development of the new energy vehicle industry through market mechanisms has become an important issue that needs to be solved urgently.
Therefore, accurately analyzing the evolutionary stable paths and influencing factors of the new energy vehicle market has important practical significance. This significance lies in further developing China’s domestic new energy vehicle market and achieving the goals of carbon peaking and carbon neutrality. In this study, an evolutionary game model is constructed, which includes the government, passenger vehicle enterprises, and consumers. The system dynamics method is combined to explore the equilibrium state and evolutionary path of the green product market. The aim is to provide a theoretical basis and practical reference for relevant policy formulation.
2. Literature Review
The green product market is not controlled by a single entity independently. It is a dynamic evolutionary system formed under the joint influence of producers, consumers, and the government. In terms of policy constraints, market competition, technological evolution, and demand preferences. Based on existing research, this paper reviews the literature from the perspectives of three main parties: producers, consumers, and the government.
2.1. Producer Perspective
As the supply side of the green product market, whether enterprises choose to undergo green transformation and adopt green technologies is a key factor affecting the evolutionary direction of the market. Early studies generally believed that environmental regulations do not necessarily weaken corporate competitiveness. Moderate and effective regulations can promote enterprises to improve resource allocation efficiency and green technology levels through innovation compensation effects [7,8]. Subsequently, further research pointed out that corporate green innovation is not only influenced by environmental policy pressure, but also jointly driven by market demand, competitive structure, and consumer green preferences [9,10]. In the context of green product differentiation competition, product greenness, pricing, and market share are coupled with each other. The returns from corporate green investment do not increase linearly, but depend on conditions such as technology costs, demand elasticity, and policy design [9,11].
In studies on green supply chains and green technology investment, government subsidies and carbon constraint mechanisms are generally regarded as important exogenous variables affecting corporate green decisions. Existing literature shows that subsidies can lower the threshold for corporate green technology investment, improve the level of supply chain coordination, and promote the synergy between green marketing and green research and development. However, under conditions of demand uncertainty and incomplete information, the intensity of subsidies is not always better when higher. The policy effect depends on the market risk and information structure faced by enterprises [12,13,14]. Furthermore, research based on evolutionary games shows that in a dynamic system involving the government, enterprises, and consumers, whether enterprises choose green technology innovation depends not only on subsidies and penalties, but also on consumers’ acceptance of green products and the resulting profit expectations [15].
Specifically in the new energy vehicle market, producers’ strategic choices mainly manifest as whether to increase investment in new energy vehicle research, development, and production, whether to enhance the green attributes of products, and whether to maintain green transformation under the condition of declining subsidies. Relevant evolutionary game studies have found that government subsidies, consumers’ low-carbon preferences, reward and punishment mechanisms, and carbon tax policies all significantly affect the evolutionary paths of new energy vehicle enterprises. Under certain conditions, market demand pull and the strengthening of consumer preferences can even partially replace the incentive effect of fiscal subsidies [16,17,18,19,20,21]. Therefore, from the producer’s perspective, the evolution of the green product market is not only a process of unilateral profit maximization for enterprises, but also a dynamic selection process under the joint action of policy incentives, consumer responses, and competitive interactions.
2.2. Consumer Perspective
Compared with general energy consumption research, this paper focuses on consumers’ adoption behavior in the green product market, especially the new energy vehicle market. Existing research shows that whether consumers purchase new energy vehicles is mainly influenced by various factors such as purchase cost, range capability, charging convenience, usage experience, environmental attitude, risk perception, and policy incentives [22,23,24]. Therefore, consumer preferences are not one-dimensional, but are formed by trade-offs among price, performance, convenience, and green value. This makes consumers not passive recipients of policies and supply, but important participants that directly affect the speed of market diffusion and the steady-state outcome [22,23].
In research on new energy vehicle adoption, price incentives and non-price factors have long been regarded as two core types of variables. A large number of empirical studies show that economic incentives such as fiscal subsidies and tax benefits can indeed increase consumers’ purchase probability. However, their effects are often limited by infrastructure availability, social environment, and consumer heterogeneity [25,26,27,28,29]. For example, consumers are very sensitive to range and charging time, while their response to subsidies varies depending on income level, urban conditions, and policy awareness [27,28]. Studies on markets in China, Norway, and India also show that new energy vehicle adoption is not simply a price issue, but the result of the joint effect of price, cognition, infrastructure, and low-carbon preferences [26,27,28,29,30].
In addition, new energy vehicle consumption has significant network externalities. The more complete the charging facilities, the lower the consumers’ range anxiety and usage uncertainty, and the stronger their purchase intention. An increase in the number of vehicles in turn enhances the returns from charging infrastructure construction, forming a typical “market diffusion–facility supply” mutually reinforcing mechanism [18,31,32,33,34,35]. Related studies have found that the layout of public charging facilities, charging convenience, and policy support simultaneously affect the charging behavior of new energy vehicle users and the purchase intention of potential consumers [31,32].
Therefore, under the tripartite evolutionary game framework, consumers are not exogenous demand parameters. Instead, they participate in market feedback by purchasing or not purchasing green products. As important game participants, consumers influence the sustainability of government subsidies and the enthusiasm of producers for green input [16,17,18,19,20,21,35].
2.3. Government Perspective
The role of the government in the green product market is not only that of a subsidy provider, but also that of a market rule maker, a promoter of internalizing externalities, and a guide for infrastructure construction. In the context of the new energy vehicle market, existing research has gradually expanded from “whether to subsidize” to more practically relevant issues such as “who to subsidize”, “how to coordinate subsidies with infrastructure”, and “how to adjust policies after subsidy phase-out” [36,37,38,39,40,41,42,43,44,45,46]. Existing studies have shown that new energy vehicle subsidies can effectively promote sales growth in the early stages of market development. However, their policy costs, marginal efficiency, and distributional consequences have also received increasing attention [36,37]. For example, some scholars pointed out in their study of the Chinese market that although universal subsidies help increase the market penetration rate of new energy vehicles, the cost efficiency may not be optimal. If subsidies can be more precisely targeted at price-sensitive groups, the policy effect may be better [36]. Meanwhile, from the perspective of equity and social welfare, the design of new energy vehicle policies should not only focus on increasing sales, but also take into account long-term emission reduction, fiscal efficiency, and benefit distribution [37].
In addition to direct fiscal subsidies, tax incentives, charging infrastructure support, and policy mixes have also been proven to be important means of affecting market evolution. Relevant studies on Europe show that tax incentives can significantly promote the adoption of pure electric vehicles. But their economic and environmental effects vary depending on market conditions in different countries [38]. Studies on the Chinese market have also found that subsidies, infrastructure, and policy mixes have significant synergistic effects. The effect of a single policy tool is often inferior to the linkage of multiple tools [39,41,44,45]. From the perspective of dynamic policy, subsidies are not statically optimal. The government should dynamically adjust policy intensity according to market maturity, infrastructure level, and consumer response [42,46].
In game theory research, the mechanism of government policy action has been further formalized. Related studies have compared the differences between purchase subsidies and charging infrastructure subsidies. These studies point out that the advantages of different policy tools depend on market structure and the main body of charging network construction. Under certain conditions, infrastructure subsidies can promote the market diffusion of new energy vehicles more than consumer purchase subsidies. Under other conditions, the synergistic allocation of the two is a better choice [34,35,40]. Therefore, from the government’s perspective, the key to green product market governance is not simply to increase the intensity of a single subsidy, but to optimize the incentive compatibility relationship among the three parties through subsidies, regulations, infrastructure, and policy mixes. This promotes the market system to evolve towards a stable and effective green equilibrium.
3. Model Construction
3.1. Model Assumptions
This paper assumes that under incomplete information, the government, enterprises, and consumers can only make boundedly rational decisions. Within each party, decisions are continuously adjusted by analyzing the decision-making environment and the strategies of other parties. After a period of time, the system may reach a certain stable state.
For the proposition of low-carbon supply chain construction, the decisions of the government, enterprises, and consumers are all crucial. The government has two strategies to choose from: “regulate” and “not regulate”, with selection ratios of and respectively. When the government chooses the “regulate” strategy, it needs to invest costs, including regulatory manpower, management costs, and policy support.
Enterprises have two strategies to choose from: “produce new energy vehicles” and “not produce new energy vehicles”, with selection ratios of and respectively. When a passenger vehicle enterprise chooses the “produce new energy vehicles” strategy, it needs to make low-carbon efforts in product research and development, manufacturing, and promotion. And needs to invest additional costs, including new technology and funds. However, it can obtain government subsidies and a social reputation. At the same time, it will be subject to fines such as environmental taxes when it “does not produce new energy vehicles”.
Consumers have two strategies to choose from: “consume green products” and “not consume green products”, with selection ratios of and respectively. When consumers choose the “green consumption” strategy, they incur some additional payments, but they also obtain certain government subsidies and environmental utilities.
The aforementioned , and all change over time, and their value ranges are all [0, 1].
Government-related parameters are as follows. is the regulatory cost. is the fine for passenger vehicle enterprises that fail to meet fuel consumption or new energy vehicle standards. The coefficient is used to subsidize enterprises that produce and sell new energy vehicles. The coefficient is used to subsidize consumers who purchase and use new energy vehicles. Both coefficients subsidize based on costs, and their value ranges are [0, 1]. is the environmental benefit obtained by the government from enterprises producing new energy vehicles. is the loss of government credibility when the government chooses not to regulate.
Passenger vehicle enterprise-related parameters are as follows. is the cost when not producing new energy vehicles, and is the revenue. is the additional cost that needs to be invested when producing new energy vehicles. is the additional revenue obtained by the enterprise when the strategies of the government and consumers are regulated, and consumers consume green products. It represents the profit increase caused by low-carbon consumption. is the additional revenue obtained by the enterprise when the strategies of the government are not regulated, and consumers consume green products. It includes the profit increase caused by low-carbon consumption and the improvement of corporate reputation and brand image from proactive green production. When enterprises act as pioneers and consciously engage in green production, the implicit benefits they obtain, such as reputation, ESG rating improvement, and dominance in the green supply chain, make .
Consumer-related parameters are as follows. is the expenditure when not engaging in green consumption, and is the utility. is the additional utility obtained by consumers when consuming green products, such as environmental protection. is the additional price difference that consumers need to pay when consuming green products provided by enterprises. is the additional information and switching costs that consumers need to pay when enterprises do not provide new energy vehicles. It is incurred in order to practice green consumption, in addition to the product price difference. For example, the higher price difference paid when importing green products compared to domestic products, or the time, energy, and additional price paid when voluntarily implementing alternative green solutions.
3.2. Evolutionary Game Models
Based on the above model assumptions and set parameters, the following payoff matrix can be obtained, as shown in Table 1.
Table 1.
Payment matrix of the government, businesses and consumers.
According to Table 1, the expected return of the government when choosing to regulate can be obtained as follows:
and the expected utility, , of the government choosing not to regulate can also be obtained.
The expected return of the government when choosing not to regulate is:
Therefore, the average return of the government is:
According to evolutionary game theory, for a single group in a symmetric game, the replicator dynamic equation is [47]:
Here, is the proportion of individuals in the population who adopt strategy 1; denotes the expected fitness (expected payoff) of strategy 1; denotes the expected fitness (expected payoff) of strategy 2; and denotes the average fitness (average payoff) of the population.
Substituting Equations (1)–(3) into the replicator dynamic equation, the replicator dynamic equation for the government’s decision in this evolutionary game model is obtained:
When , regardless of the value of , , and the government’s decision remains stable. When makes and , then is the equilibrium point. When makes and , then is the equilibrium point.
Similarly, in terms of the expected returns of passenger vehicle enterprises, and , the average return , and the replicator dynamic equation F(y) are as follows:
When , regardless of the value of , , and the enterprise’s decision remains stable. When makes and , then is the equilibrium point. When makes and , then is the equilibrium point.
Likewise, the expected returns of consumers, & , the average return , and the replicator dynamic equation are as follows:
When , regardless of the value of , , and the consumer’s decision remains stable. When makes and , then is the equilibrium point. When makes and , then is the equilibrium point.
3.3. Stability Analysis
Setting , and , nine equilibrium points can be obtained where the government, passenger vehicle enterprises, and consumers all reach a stable state: (0, 0, 0); (1, 0, 0); (0, 1, 0); (0, 0, 1); (1, 1, 0); (1, 0, 1); (0, 1, 1); (1, 1, 1); (, , ). Among them, (, , ) is an interior equilibrium point. The evolutionary game model constructed in this paper is a standard replicator dynamic based on a single population. The interior equilibrium point can only be a saddle point or a periodic orbit, so is not asymptotically stable [48]. The asymptotic stability of equilibrium points to can be determined by the local stability analysis method of the Jacobian matrix [49].
The Jacobian matrix corresponding to the evolutionary game model described in this paper is given below:
where:
According to Lyapunov’s rule [50], when all eigenvalues of the Jacobian matrix corresponding to a local equilibrium point are negative, the equilibrium point is asymptotically stable, and the strategy profile represented by that point is called an evolutionarily stable strategy (ESS). When all eigenvalues of the Jacobian matrix are positive, the equilibrium point is unstable. When one or two eigenvalues of are positive, the equilibrium point is a saddle point.
The eigenvalues and their signs of the Jacobian matrix at the eight equilibrium points are calculated and presented in Table 2.
Table 2.
Stability analysis of equilibrium points.
In Table 2, the symbols “+”, “−”, and “*” in parentheses represent positive eigenvalues, negative eigenvalues, and eigenvalues whose sign is to be determined (depending on specific parameter values), respectively.
From the results shown in Table 2, it can be seen that the Jacobian matrix has positive eigenvalues at , and . Therefore, , and cannot be evolutionarily stable strategies and will not be discussed further.
, , , and cannot be excluded from being evolutionarily stable strategies from a purely mathematical perspective. However, the determination of the signs of their eigenvalues can be discussed based on reality and economic rationality. Among them, the strategy profiles , and support green consumption and are the ideal market states to be studied in this paper.
Observing Table 2, it can be seen that for (0, 0, 1) to become an evolutionarily stable strategy, it needs to satisfy , and . For the government, can be interpreted as the difference in returns between the government choosing to regulate and not regulate, when the strategies of passenger vehicle enterprises and consumers are (not produce new energy vehicles, consume green products). indicates that the government’s return when choosing to regulate is greater than when choosing not to regulate. This may be reasonable in certain realistic periods, but it does not align with the government’s pursuit of profit maximization and long-term policy goals. The government would need to actively increase fines and the credibility loss when not regulating, while increasing regulatory costs and subsidies to consumers. It is clearly unreasonable and difficult to implement in practice. For passenger vehicle enterprises, is the return obtained by the enterprise from its products when the other two parties’ strategies are (not regulate, consume green products). means that enterprises need to reduce returns and increase costs, which obviously violates the rationality of profit-seeking firms. Therefore, it can be argued that as long as the government and enterprises act in accordance with common sense (i.e., pursuing cost minimization and profit maximization), (0, 0, 1) cannot become an evolutionarily stable strategy in a realistic sense.
Similarly, for (1, 0, 1) to become an evolutionarily stable strategy, it needs to satisfy , , and . Here, is the return difference for passenger vehicle enterprises between choosing to produce and not produce new energy vehicles when the other two parties’ strategies are (regulate, consume green products). indicates that when the market prefers green products, the enterprise’s return from catering to the market by producing is less than the return from deviating from market preferences by not producing. For an enterprise, this would require actively reducing the additional return under (regulate, consume green products) while increasing the additional cost of producing new energy vehicles. It is clearly unreasonable for enterprises. Therefore, when enterprises pursue cost minimization and profit maximization, (1, 0, 1) cannot become an evolutionarily stable strategy in a realistic sense.
For (0, 1, 1) to become an evolutionarily stable strategy, it needs to satisfy and . At this point, for passenger vehicle enterprises, they need to reduce the additional cost of producing new energy vehicles, while increasing the additional return under non-regulated, consumer green products. This aligns with the enterprise’s nature of pursuing cost minimization and profit maximization. For consumers, represents that the price difference between new energy vehicles and traditional fuel vehicles, as well as the usage cost, should be as low as possible. Meanwhile, the environmental benefit from supporting green consumption should be as large as possible. This aligns with the psychology of the general public. Thus, it can be seen that (0, 1, 1) becoming an evolutionarily stable strategy is consistent with economic principles.
It should be noted that the conclusion that the government does not need to regulate and that the whole society automatically shifts to green products is discussed under an idealized model. In reality, many factors, such as transaction costs, budget constraints, and social construction, hinder its realization. On the other hand, this indicates that the government should make efforts in these hindering factors to create conditions for the realization of an autonomous green market with reduced government regulation or even without government regulation.
4. Numerical Analysis
4.1. System Dynamics Model
The above analysis yielded the asymptotic stability conditions of the tripartite evolutionary game model of the government, passenger vehicle enterprises, and consumers. However, the evolutionary process of the strategies cannot be directly visualized. To compensate for the shortcomings of evolutionary game theory analysis in terms of dynamic process visualization, multi-agent nonlinear interaction simulation, and sensitivity to initial conditions, this study further introduces the system dynamics method. The Vensim PLE software is used to build a simulation model of tripartite strategic interaction. Compared with traditional analytical methods, system dynamics modeling can intuitively present the dynamic evolutionary trajectories of government, enterprise, and consumer strategies over time. It can depict the mutual feedback mechanisms of strategy adjustments among the agents. Through parameter perturbation analysis, it can identify the direction and threshold conditions of the influence of key factors on the evolutionary stable paths. This methodological extension not only verifies the existence and uniqueness of the evolutionarily stable strategy derived from theoretical analysis, but also provides an operational analytical tool for revealing the critical conditions for the green product market to shift from policy-driven to self-sustaining.
The system should contain three subsystems: government, passenger vehicle enterprises, and consumers. Using Vensim software, a system dynamics model, as shown in Figure 1, is constructed. The Vensim model’s integration method is the Runge–Kutta method. The time step of the model is set to one month.
Figure 1.
System dynamics model.
The government regulation ratio, the ratio of producing new energy vehicles, and the ratio of consuming green products are all set as level variables, representing the cumulative amount of each agent’s strategy ratio. The rate of change in regulation, the rate of change in producing new energy vehicles, and the rate of change in green consumption are rate variables, which cause the three level variables to continuously increase or decrease over time. The rest are auxiliary variables.
Observing this stock-flow diagram, the key feedback loops of the system can be summarized as follows:
- (1)
- Government regulation rate → expected return from producing new energy vehicles → new energy vehicle production ratio → expected return from government regulation → government regulation rate.
- (2)
- Green consumption ratio → expected return from producing new energy vehicles → new energy vehicle production ratio → expected return from green consumption → green consumption ratio.
- (3)
- Government regulation rate → expected return from green consumption → green consumption ratio → expected return from government regulation → government regulation rate.
The relationships and expressions between some main variables are given below.
- (1)
- Level variables:Government regulation ratio = 0.5 + INTEG (regulation change rate).New energy vehicle production ratio = 0.5 + INTEG (new energy vehicle production change rate).Green consumption ratio = 0.5 + INTEG (green consumption change rate).
- (2)
- Rate variables:Regulation change rate = 0.01 × government regulation ratio × (1 − government regulation ratio) × difference in expected returns of government.New energy vehicle production change rate = 0.01 × new energy vehicle production ratio × (1 − new energy vehicle production ratio) × difference in expected returns of the enterprise.Green consumption change rate = 0.01 × green consumption ratio × (1 − green consumption ratio) × difference in expected returns of consumer.
The parameter values of the auxiliary variables in the system dynamics model are mainly based on Chinese data. Considering the actual situation of the passenger vehicle industry, authoritative and credible official statistical data are selected to ensure the authenticity and reference value of the simulation results. The specific parameter selections and their justifications are given below.
- (1)
- Government-related parameters
According to the “Notice on Fiscal Subsidy Policies for the Promotion and Application of New Energy Vehicles in 2022” jointly issued by the Ministry of Finance and three other departments, as well as the “Announcement on the Extension and Optimization of the Purchase Tax Exemption Policy for New Energy Vehicles”, and various local implementation rules, the consumer vehicle purchase subsidy ratio is approximately 10% to 15% of the vehicle price. Considering the supporting policies such as purchase tax exemption, unrestricted driving, and charging facility construction, the consumer subsidy coefficient β is set to 0.13 [51,52].
For the enterprise side, based on the study by Chen Mi et al. [53] on the proportion of government R&D subsidies and tax incentives for new energy vehicles relative to enterprise production costs, and through calculation using the 2022 financial report of BYD, a leading new energy vehicle enterprise, is set to 0.44.
The enterprise non-compliance fine is calculated based on the “dual-credit” policy. According to the government document issued by the Ministry of Industry and Information Technology, negative credits must be offset through the trading or purchase of positive credits [54]. In 2022, the average transaction price for new energy credits ranged from 1128 to 1738 yuan per credit [53], and the median value of 1500 yuan per credit is used for calculation. Combined with the “2022 Annual Accounting Table of Average Fuel Consumption and New Energy Vehicle Credits for Chinese Passenger Vehicle Enterprises”, the non-compliance fine for enterprises is calculated to be approximately 20,000 yuan per vehicle. Therefore, is set to 2.
The environmental benefits obtained by the government from enterprises producing new energy vehicles mainly include the reduction of carbon emissions and the decrease in air pollutant concentrations due to less or no use of fossil fuels by new energy vehicles. Existing studies have shown that compared with traditional fuel vehicles, new energy vehicles can reduce carbon emissions by about 1.7 tons per vehicle per year [53]. Considering the corresponding emission reduction and pollution reduction effects comprehensively, the environmental benefit obtained by the government from enterprises producing new energy vehicles is calculated to be 15,000 yuan per vehicle. is set to 1.5.
Regarding the government’s regulatory cost and credibility loss , reference is made to the actual expenditure of provincial-level motor vehicle emission supervision service projects. is set to 0.8, and is set to 1.5.
- (2)
- Enterprise-related parameters
Enterprise production cost data refer to the study on the new energy vehicle supply chain cost in the NBER working paper. It pointed out that the manufacturing cost of traditional fuel vehicles is about 40,000 to 60,000 yuan per vehicle, and the additional cost for new energy vehicles is about 8000 to 12,000 yuan per vehicle [55]. Accordingly, is set to 5, and is set to 0.8.
Enterprise returns include , and . According to data released by the China Passenger Car Association, the average profit per vehicle in the automotive industry in 2022 was about 70,000 yuan, so is set to 7. Zhao et al. studied the panel data of 27 listed new energy vehicle enterprises in China. They derived the additional returns obtained by passenger vehicle enterprises from the development of the new energy vehicle market when the government and consumers support the green product market [56]. Based on this, in the context of government regulation and consumer green consumption, the enterprise’s additional return is set to 6. The study by Hossain et al. further quantified the value of proactive green behavior, such as the actual return rate on corporate reputation [57]. Based on this research result, is set to 7.5.
- (3)
- Consumer-related parameters
Consumer prices are determined based on the average transaction price of the Chinese passenger car market. According to data released by the China Association of Automobile Manufacturers, in 2022, the average selling price of domestic fuel passenger vehicles was about 194,000 yuan, and the average selling price of comparable new energy passenger vehicles was about 249,000 yuan, with a price difference of 55,000 yuan. Based on this, is set to 20, and is set to 6. mainly reflects additional information and switching costs. With the development of internet platforms and the maturation of the new energy vehicle market, the convenience for consumers to obtain information has greatly improved. Combined with market research data, is set to 0.2.
The utility that consumers obtain from consuming traditional fuel vehicles is slightly higher than their price. This is because, according to economic principles, consumers obtain usage returns slightly higher than the product expenditure. It should not be ignored that consumers also consider subsequent fuel and maintenance costs when purchasing fuel vehicles. In summary, based on the previously obtained average selling price of Chinese fuel passenger vehicles of about 194,000 yuan, is set to 22.
The setting of the additional utility from green consumption, , comprehensively considers both environmental benefits and psychological utility. The study by Chen Mi et al. evaluated the health benefits of new energy vehicle promotion from a life cycle perspective, showing that compared with traditional fuel vehicles, new energy vehicles can reduce carbon emissions by about 1.7 tons per vehicle per year [53]. At the same time, the monetized value of health benefits from pollutant emission reduction is about 3000 to 5000 yuan per vehicle per year. Therefore, based on a 10-year usage period for a new energy vehicle, the environmental benefit from its consumption is about 80,000 yuan. In addition, multiple studies have shown that the psychological utility consumers obtain from green consumption (e.g., satisfaction of environmental awareness, social recognition) has a significant impact on purchase decisions [58]. Combining these factors, is set to 10.
In summary, the initial numerical settings are: , , , , , , , , , , , , , , , and . The units of the above parameters, except for the coefficients and , are in 10,000 yuan per vehicle. At the same time, unless otherwise specified, the initial values of , and are all set to 0.5.
It should be noted that there is some uncertainty in the above parameter settings. For example, the additional utility from green consumption includes non-monetized psychological utility, and its monetary equivalent conversion relies on subjective valuation. The enterprise’s additional return involves intangible values such as brand reputation, which are difficult to quantify precisely. Therefore, in the subsequent analysis, sensitivity analysis will be conducted on key parameters to examine the impact of their variations within a certain range on the model conclusions, while verifying the robustness of the research results.
4.2. Analysis of Tripartite Mixed Strategy Evolution Paths
First, the evolution process of the government regulation ratio is visualized. The initial value of is set to 0.5. By randomly selecting the initial values of the enterprise’s new energy vehicle production ratio and the consumer green consumption ratio , the impact of the initial values of and on is observed. The results are shown in Figure 2.
Figure 2.
The effect of initial values and on the evolution of .
Observing Figure 2a, it can be seen that regardless of how the initial values of and are selected, the government regulation ratio eventually evolves to 0. That is, through the mutual game among the government, enterprises, and consumers, the government eventually finds it unnecessary to regulate the green product market. At the same time, the evolution process of is not always monotonic. In cases where and are less than 0.3, the government regulation ratio first increases to above 0.5, reaches a peak, and then gradually decreases to 0. This indicates that when both the willingness of enterprises to produce green products and consumers to consume green products are extremely low, the government needs to show a strong regulatory will. That will involve rewarding the production and consumption of green products at a higher rate and punishing the opposite behaviors at a higher rate, so that more enterprises and consumers shift to green products. As more and more enterprises and consumers enter the green product market, the market continues to improve, and more enterprises and consumers begin to spontaneously choose to produce and consume green products. At this time, the government gradually reduces regulatory intensity to lower regulatory costs until no regulation is needed at all.
Figure 2b,c set either or to 0 and randomly select the initial value of the other, to separately analyze the impact of enterprises or consumers on government decisions. From Figure 2c, we found that even when the initial value of is 0, the government’s decision still evolves to “not regulate”. This result is consistent with the result in Figure 2a. That is, consumers’ strategic choices have a relatively small direct impact on the government’s strategic choices, only slightly affecting the evolution speed of the government’s regulatory policy without changing the outcome. From Figure 2b, it can be found that the decisive factor for the government’s equilibrium decision is the initial value of . That is, the production decision of enterprises directly affects the government’s equilibrium decision of whether to regulate.
Similarly, the evolution process of the enterprise’s new energy vehicle production ratio is visualized. The initial value of is set to 0.5. By randomly selecting the initial values of the government regulation ratio and the consumer green consumption ratio , the impact of the initial values of and on is observed. The results are shown in Figure 3.
Figure 3.
The effect of initial values and on the evolution of .
As shown in Figure 3a, regardless of the initial values of and , the enterprise’s new energy vehicle production ratio eventually evolves to 1. It means that enterprises eventually choose to produce all new energy vehicles. It is observed that in cases where the initial values of and are very small, the change in the speed of the enterprise’s new energy vehicle production ratio experiences a transition from slow to fast in the initial stage. This phenomenon, as reflected by the line graph, exactly matches the situation where China’s new energy vehicle market is gradually entering a rapid development stage. To more clearly understand the decisive factor affecting the evolution process of enterprise decisions, whether it is the government or consumers, observe Figure 3b,c.
Figure 3b,c set either or to 0 and select different initial values of the other, to separately analyze the impact of the government or consumers on enterprise decisions. First, comparing Figure 3b with Figure 3a, the two shapes are basically consistent, and enterprises eventually choose to “produce new energy vehicles”. This indicates that the government does not have a decisive impact on enterprise decisions; consumers may be the key factor. Figure 3c provides evidence for this argument. When the value of is set to 0, the enterprise’s decision does not evolve to a stable state but fluctuates continuously under the unilateral influence of the government. Moreover, the fluctuation amplitude increases as the initial value of increases. The underlying mechanism is hypothesized to be as follows: enterprises are forced by government regulatory pressure to produce new energy vehicles, yet the green products thus produced are not consumed by consumers. The continuously increasing costs and decreasing returns cause enterprises to switch back to “not produce new energy vehicles”. Intensified government regulation exacerbates this decision fluctuation. This indicates that to make enterprises voluntarily provide green products, “green consumption” is of paramount importance.
Finally, the evolution process of the consumer green consumption ratio is visualized. The initial value of is set to 0.5. By randomly selecting the initial values of the government regulation ratio and the enterprise’s new energy vehicle production ratio , the impact of the initial values of and on is observed. The results are shown in Figure 4.
Figure 4.
The effect of initial values and on the evolution of .
As shown in Figure 4a, evolves relatively quickly and eventually evolves to 1. It means that consumers choose to consume green products. Similarly, setting the initial value of or to 0 and varying the value of the other, the impact of one party on the evolution of is analyzed separately. The results are shown in Figure 4b,c. It is easy to see from the figures that the evolution speed of the value differs very slightly in the two different scenarios. The final evolution results are consistent with Figure 4a. This indicates that whether it is the low-carbon behavior of the government or enterprises unilaterally, or the combined efforts of both, consumers have the will to support and consume green products.
4.3. Analysis of Evolutionary Pathways for Pure Strategies
When the government, enterprises, and consumers all choose pure strategies, there are eight pure strategy combinations: (0, 0, 0), (1, 0, 0), (0, 1, 0), (0, 0, 1), (1, 1, 0), (1, 0, 1), (0, 1, 1) and (1, 1, 1).
In Section 3, it was known through the game model that all these eight pure strategy combinations can bring the game to equilibrium. It means that under these eight conditions, none of the three parties has an incentive to change strategies. However, from an evolutionary perspective, it is also known that not all pure strategy profiles are asymptotically stable. That is, when the strategy of any party undergoes a slight change due to its own or external factors, the equilibrium state may be broken rather than spontaneously corrected to return to the initial state.
Through the evolutionary game model analysis, the asymptotic stability analysis of each of the eight pure strategy profiles was given. Combined with the realistic situation, it was concluded that (0, 1, 1) is the only strategy profile that may achieve asymptotic stability in both mathematical and realistic senses. To provide a more intuitive verification of this theoretical result and to observe the evolution process and results when the tripartite pure strategy profiles are disrupted, system dynamics simulations are conducted for the seven strategy profiles other than (0, 1, 1).
The specific operation is to make slight changes to the initial values of the tripartite strategies , , and . For example, changing (0, 0, 0) to (0.01, 0.01, 0.01), and then simulating the situation when the equilibrium state is disrupted. In this way, the stability and evolution process and results of each strategy profile are tested sequentially.
As demonstrated in Figure 5, with the exception of (0, 1, 1), none of the pure strategy portfolios demonstrate asymptotic stability; minor alterations cause deviation from the original equilibrium state. It is evident that all pure strategy portfolios that deviate from the original equilibrium state ultimately evolve to (0, 1, 1). It can thus be concluded that, under actual circumstances, this system dynamics model possesses a unique evolutionarily stable strategy, (0, 1, 1). This scenario is characterized by the absence of government regulation, the decision of automakers to produce new energy vehicles, and the purchase of green products by consumers. This result aligns with the findings from the evolutionary game model analysis in Section 3, providing mutual corroboration.
Figure 5.
Evolutionary pathways for pure strategies.
Figure 5 shows the simulation results of the evolution paths when the auxiliary variables take benchmark values that accurately reflect the realistic situation based on statistical results and existing research. As shown in the figure, all pure strategy profiles except (0, 1, 1) are not asymptotically stable and will deviate from the original equilibrium state due to small changes. All pure strategy profiles that deviate from the original equilibrium state eventually evolve to (0, 1, 1). This system dynamics model has a unique evolutionarily stable strategy (0, 1, 1). It represents that the government does not need to regulate; enterprises choose to produce new energy vehicles, and consumers consume green products. This result is consistent with the analysis of the evolutionary game model in Section 3, corroborating each other.
At the same time, to test the robustness of the model conclusions, a global sensitivity analysis was conducted on key parameters, including , , , , , , , , , , and . The above parameters were varied within ±50% of the benchmark values (−50%, −25%, benchmark, +25%, +50%) using Latin hypercube sampling, generating 50 parameter combinations, each simulated separately. The simulation results show that all combinations eventually converge to the evolutionarily stable strategy (0, 1, 1). This indicates that the model conclusions are robust to parameter changes.
4.4. Analysis of Main Influencing Factors
According to the previous research, the key to the tripartite decisions in the green product market is the supply and demand situation of the market. The key factors affecting the supply and demand situation of the green product market are costs and the utility of the product itself and additional utilities. Similarly, based on the above analysis, several important variables that have a profound impact on the green product market can be obtained. These include the additional cost required when producing new energy vehicles, the price difference that consumers need to pay when consuming green products, and the additional utility obtained by consumers when consuming green products. Among them, is mainly limited by production technology. Therefore, the following analysis focuses on and . These two parameters are more likely to change due to policy factors. By changing their initial values, the impact of these two specific factors on the decisions of the three parties is further analyzed.
The first is the price difference between fuel vehicles and new energy vehicles. Previously, based on data from the China Association of Automobile Manufacturers, was set to 6. However, in reality, this value may vary depending on factors such as brand, region, manufacturer’s production technology, and policies. To more clearly examine the specific impact of on the evolution of the tripartite strategies, numerical simulations are conducted below. We take values of ranging from 3 to 12 in steps of 1. The evolution of each agent’s strategy is shown in Figure 6.
Figure 6.
The effect of changes in on strategy evolution.
It is evident that within a certain range, does not exert a decisive influence on the government’s regulatory decisions; ultimately, the government will always opt for “no regulation.”
As shown in Figure 6, the price difference is an important factor affecting decisions. Observing Figure 6a, it can be seen that the price difference within a reasonable range does not have a decisive impact on the government’s regulatory decision. The government eventually chooses “not to regulate”.
A noteworthy detail is that the speed at which evolves to 0 does not always monotonically decrease or increase as increases. According to the graph, when , the speed at which evolves to 0 increases as increases; when , the opposite occurs. Combined with existing conclusions, an explanation can be given: when is within a certain range, although consumers’ acceptance of green products decreases as the price difference increases, enterprises choose to produce new energy vehicles at a higher rate as the price difference increases. Since it is known from Section 4.2 that government decisions are greatly influenced by enterprises, the government will reduce the regulation ratio faster because enterprises actively shift to the green product market. However, when exceeds this range, consumers’ acceptance of green products drops sharply. As known from Section 4.2, enterprise decisions undergo significant changes due to changes in consumer behavior, reducing the production ratio of new energy vehicles. At this time, the government’s strategy selection is influenced by both parties. This will cause the speed at which evolves to 0 to decrease.
The impact of the price difference on the enterprise decision-making process is simpler. The speed at which the enterprise’s new energy vehicle production ratio evolves to 1, gradually decreases as increases. When increases beyond a certain range, no longer evolves to 1. Combining existing conclusions to analyze the reason, when is greater than 10, consumers refuse green products because the price difference is higher than the additional utility they obtain from green products, thereby affecting enterprise decisions through supply and demand.
Observing Figure 6c, it is found that should be controlled within a reasonable range; otherwise, an excessively high price difference will deter consumers from green products. Figure 6c shows the specific impact of on consumer decision-making. When , the speed at which evolves to 1 decreases as increases. It is noteworthy that when changes from 9 to 10, this speed decreases significantly. Considering the consumer’s premium payment ratio (price difference/revenue) as an indicator, based on the benchmark value , when the premium payment ratio is higher than 40.9%, the speed at which evolves to 1 is severely affected.
When is greater than 10, the evolution direction of consumers’ strategy reverses to not consuming green products. The reason is that at this time, , and consumers refuse to consume green products because the price difference is higher than the additional utility they obtain from green products.
Comprehensively considering the way the tripartite decisions of the government, enterprises, and consumers change as the price difference changes, it is easy to find that is the most appropriate. Under this situation, the government can let go of its regulatory work on the green product market at the fastest speed, while enterprises and consumers also choose to voluntarily enter the green product market at a relatively fast speed. At this time, even if is further reduced, the increase in the evolution speed of consumer decisions is not significant, but the evolution speed of government decisions decreases. Using the consumer’s premium payment ratio as an indicator, based on the benchmark value , the premium payment ratio for new energy vehicles is between 27.27% and 31.82%, which is an ideal premium payment ratio conducive to the development of the new energy vehicle market. Prior to this, some survey studies on the willingness to pay a premium for green and low-carbon products have found that the premium payment ratio for low-carbon pork is 27.6%, for green home appliances is 26.5%, and for low-carbon bamboo (wood) flooring is 22.05% [59,60,61]. The conclusions of this paper are relatively consistent with the studies of other scholars on other green products.
Next, the impact of the additional utility on the evolution process of the tripartite decisions is discussed.
The concept contained in is relatively broad, mainly including the actual environmental benefits generated by consuming green products, energy savings, and the psychological utility of consumers for their own green and low-carbon lifestyle. Based on official statistical results and existing research, the benchmark value of is given as 10. However, the value of is not static. For example, new energy vehicles mainly use electricity as their power source. The impact of electricity production on the environment and the amount of energy saved vary with different power generation methods. The popularization of wind power and photovoltaic power generation makes electricity production more environmentally friendly. At this time, the environmental protection benefits and energy savings from using new energy vehicles also increase. On the other hand, consumers’ own value perception of green and low-carbon consumption also varies and increases with the popularization of environmental awareness. Based on the above analysis, the value of is varied according to the level of green and low-carbon facility construction and the overall level of public environmental awareness in different societies, regions, or stages of social development. Simulations are conducted with taking values ranging from 5 to 15 in steps of 1. The results are shown in Figure 7.
Figure 7.
The effect of changes in on strategy evolution.
From Figure 7a,b, it can be seen that changes in the initial value of do not have a decisive impact on the final decisions of the government and enterprises. The final decisions of the government and enterprises are not regulated to produce new energy vehicles, and the evolution speed of both parties’ strategies increases as increases. At the same time, it is observed that when , the impact of its change on the evolution speed of government and enterprise strategies is significantly greater than when . Using the additional positive benefit ratio of consuming green products as an indicator, based on the benchmark value , when the additional positive benefit ratio is less than 36.36%, the government’s use of policies to increase this value has a significant effect on guiding enterprises to quickly shift to the green product market. Meanwhile, the government can also accelerate its withdrawal from regulating the green product market. When the additional positive benefit ratio is greater than 40.91%, the effect is significantly reduced.
Observing Figure 7c, when , the evolution direction of the consumer group’s strategy turns to “not consume green products”, because at this time . It is also worth noting that when , i.e., the additional positive benefit ratio is less than 36.36%, a further decrease in has a significant impact on the speed at which the consumer group’s strategy ratio evolves to 1. Therefore, from the perspective of guiding consumer groups to quickly shift to the green product market, the government should also use policy guidance and infrastructure construction to increase the additional positive benefit ratio above 36.36%.
To promote consumers to enter the green product market, the government needs to work on reducing and increasing . Among them, increasing is of paramount importance because the determination of is mainly influenced by the market, and reducing in turn affects the enthusiasm of enterprises to enter the green product market.
According to the content contained in given above, first, the government should work on improving green and low-carbon facility construction, such as the development and improvement of clean power generation systems. Second, through policy publicity, popularization, education, and other means, the government should increase the overall green environmental awareness of consumers and vigorously publicize the environmental benefits of green products, so that consumers gradually increase the psychological expectations of their own green and low-carbon consumption behavior.
5. Conclusions and Policy Implications
This paper focuses on the new energy vehicle industry. A tripartite evolutionary game model and a system dynamics model are established, involving the government, passenger vehicle enterprises, and consumers. Combined with the actual situation in China, the critical conditions for the market’s self-evolution are discovered, and quantitative bases for policy design after subsidy phase-out are provided. The main conclusions are as follows:
- (1)
- The government regulation ratio x is mainly influenced by the passenger vehicle enterprise new energy vehicle production ratio y. The passenger vehicle enterprise new energy vehicle production ratio y is mainly influenced by the consumer green consumption ratio z. The consumer green consumption ratio z is influenced by both x and y.
- (2)
- When the relevant parameters satisfy C1−R2 < 0 and P1−U1 < 0, that is, when the additional return of passenger vehicle enterprises under the other two parties’ strategies (do not regulate, consume green products) is greater than their additional cost of producing new energy vehicles, and the additional return obtained by consumers from consuming green products is greater than the price difference they bear, there is a unique evolutionarily stable strategy profile for the government, enterprises, and consumers. The unique strategy profile is not to regulate, produce new energy vehicles, and adopt green product consumption. This paper proves it from both theoretical and numerical perspectives.
- (3)
- The price difference P1 and the additional utility U1 are important factors affecting green and low-carbon consumption. An excessively large price difference between new energy vehicles and fuel vehicles will force consumers to refuse to consume green products. According to the numerical analysis results, in the passenger vehicle industry, when the consumer’s premium payment ratio for new energy vehicles is controlled between 27.27% and 31.82%, it is most conducive to promoting the evolution of tripartite decisions to the ideal evolutionarily stable strategy profile (do not regulate, produce new energy vehicles, consume green products). Similarly, when the additional utility U1 of consuming green products is too low, consumers will also refuse to consume green products. When the additional positive benefit ratio of green consumption is below 36.36%, the formation and development of the green product market are severely affected. When the additional positive benefit ratio of green consumption reaches 40.91%, further increasing this value has a limited promoting effect on the development of the green product market.
At the same time, this study has certain limitations. These limitations are explained below, and future research directions are proposed based on them:
- (1)
- The gap between model assumption simplification and real-world complexity. This paper assumes that the government, enterprises, and consumers are all boundedly rational agents, and that strategic choices are driven only by the payoff matrix. Realistic factors such as information asymmetry among agents, differences in learning speed, and time lags in strategy adjustment are not considered. In addition, the government’s strategy is simplified to a binary choice of “to regulate” and “not to regulate”, failing to distinguish the heterogeneous effects of different types of policy tools such as environmental taxes, credit trading, and infrastructure construction. Future research can introduce elements such as multiple strategy choices, heterogeneous agents, and network interaction structures into the existing model to construct a policy simulation framework closer to reality, thereby enhancing the model’s explanatory power and applicability.
- (2)
- External validity and boundaries of policy generalization. The model construction and numerical analysis of this paper are mainly based on the realistic background of China’s passenger vehicle industry. Some conclusions (such as the consumer premium payment ratio threshold of 27.27–31.82% and the additional positive benefit ratio threshold of 36.36–40.91%) have strong industry specificity and stage characteristics. The policy environment, market structure, and consumer preferences in different countries or regions differ significantly, and the applicability of the model needs further testing. Future research can explore the cross-context applicability of the model by comparing the evolution paths of green product markets under different institutional backgrounds, or conduct case studies in combination with specific policy pilots to provide more targeted decision support for policy generalization.
Based on the above conclusions, this study proposes the following policy recommendations to promote the construction and development of a voluntary green product market:
- (1)
- Implement differentiated phased regulatory strategies and follow the government’s exit path. The model simulation results show that in the early stage of market development, the government’s regulatory ratio shows a characteristic of first increasing and then decreasing. That is, when the willingness of enterprises and consumers to participate in green activities is low, the government needs to guide the market start-up by strengthening regulation (e.g., increasing subsidy incentives and increasing penalties for violations). When green production and consumption form a self-reinforcing trend, the government should actively and gradually reduce regulatory intensity, ultimately achieving the evolutionary equilibrium of “not to regulate”. It is recommended that the government formulate a clear regulatory exit roadmap, gradually shift policy goals from “direct intervention” to “institutional guarantee”, and avoid long-term high-intensity administrative intervention crowding out the market’s spontaneous adjustment mechanism.
- (2)
- Control the price difference within the range of consumers’ willingness to pay a premium, and optimize subsidy policy design. Numerical analysis shows that when the premium payment ratio for new energy vehicles is between 27.27% and 31.82%, the market evolves to the ideal equilibrium at the fastest speed. This threshold is highly consistent with the existing research on consumers’ willingness to pay a premium for low-carbon products. It is recommended that when designing consumer-side subsidy policies, the government aim to “bridge the price difference to the consumer’s acceptable range” rather than simply reducing the absolute price. During the subsidy phase-out process, changes in the sensitivity of different types of consumers to the price difference should be dynamically tracked to ensure that the price difference remains within a reasonable range, avoiding a large-scale exit of consumers from the green market due to excessively rapid subsidy withdrawal.
- (3)
- Strive to improve the level of social green and low-carbon development and enhance the additional utility of green consumption. The model analysis finds that when the additional utility of consumer green consumption is at a low level (e.g., an additional positive utility ratio below 36.36%), the market struggles to form an ideal equilibrium. When this ratio is raised to between 36.36% and 40.91%, the market evolution speed accelerates significantly. Further increasing this ratio has diminishing marginal promoting effects. It is recommended that the government increase the utility from both the supply side and the demand side. On the supply side, accelerate the construction of clean energy infrastructure (e.g., offshore wind power, photovoltaic power generation, charging pile networks) to reduce the actual environmental cost of using green products. On the demand side, through means such as carbon labeling, green certification, and environmental publicity and education, enhance consumers’ perception of the environmental value of their own green consumption behavior, transforming “psychological utility” into sustainable market demand.
- (4)
- Guide enterprises to shift from passive response to active commitment, and strengthen reputation incentive mechanisms. The model reveals that enterprise strategy choices are mainly influenced by consumers’ green consumption behavior, rather than relying solely on government subsidies. When the consumer green consumption ratio is low, relying solely on government regulation increases the volatility of enterprise strategies. Therefore, it is recommended that while pursuing profit maximization, enterprises pay attention to the long-term value of ESG (environmental, social, and governance) performance and brand reputation. The government can transform enterprises’ green production behavior into tradable market value (e.g., new energy credit income) by establishing a corporate green information disclosure system and improving the carbon trading market mechanism, making green transformation a “competitive advantage” rather than a “cost burden”, and reducing enterprises’ dependence on direct government subsidies.
- (5)
- Promote the transformation of policy tools from “one-way incentives” to “multi-party collaboration”. The model shows that there is a clear transmission chain in the strategy evolution of the government, enterprises, and consumers: enterprise strategies are influenced by consumers, and government strategies are influenced by enterprises. Policy interventions targeting a single agent struggle to produce sustained effects. It is recommended that policy design take into account the tripartite linkage relationship: with consumer green consumption as the ultimate goal, achieved by guiding enterprise green production, with the government acting as a phased “catalyst” rather than a permanent “controller”. Specifically, a closed-loop policy system of “green consumption points—enterprise point trading—government tax adjustment” can be explored, forming a positive cycle mechanism where consumer choices drive enterprise transformation, and enterprise transformation supports government exit.
Author Contributions
Conceptualization, H.X.; methodology, H.X.; validation, H.X.; formal analysis, H.X.; investigation, H.X.; resources, L.L.; data curation, L.L.; writing—original draft preparation, H.X.; writing-review and editing, H.X.; visualization, H.X.; supervision, R.P.; project administration, R.P. All authors have read and agreed to the published version of the manuscript.
Funding
This research was funded by the National Science Foundation of China under Grant No. 72431008.
Institutional Review Board Statement
Not applicable.
Informed Consent Statement
Not applicable.
Data Availability Statement
The original contributions presented in this study are included in the article. Further inquiries can be directed to the corresponding author.
Acknowledgments
We are very grateful to the editor and anonymous reviewers for their valuable feedback.
Conflicts of Interest
The authors declare no conflicts of interest.
References
- Wang, B.; Liu, G.T. Energy Conservation and Emission Reduction and China’s Green Economic Growth—Based on a Total Factor Productivity Perspective. China Ind. Econ. 2015, 5, 57–69. [Google Scholar]
- Liu, Y.H.; Li, Y.H.; Wang, W.T. Challenges, opportunities and actions for China to achieve the targets of carbon peak and carbon neutrality. China Popul. Resour. Environ. 2021, 31, 1–5. [Google Scholar]
- Zhou, Y.; Pan, Y. Subsidization versus tax reduction:The policy choice for new energy vehicles under the constraints of transaction costs. J. Manag. World 2019, 35, 133–149. [Google Scholar]
- Xie, Q.; Tian, Z. How Innovation Policy Promotes China’s New Energy Vehicle Industry:A Text Research from Policy Tools and Innovation Value Chain. Sci. Sci. Manag. S. T 2015, 36, 3–14. [Google Scholar]
- Li, C.; Lu, X.; Liu, Y.; Xia, Z.; Wang, X.; Zhao, H. A study of tripartite strategies for closed-loop charging infrastructure construction of new energy vehicles in China under the expectation of government withdrawal subsidies. J. Clean. Prod. 2025, 493, 144943. [Google Scholar] [CrossRef] [Scilit]
- Tang, B.; Wang, X.; Wang, B.; Wu, Y.; Zou, Y.; Xu, H.; Ma, Y. Analysis and Prospect of China’s New Energy Vehicles Industry Development Level. J. Beijing Inst. Technol. (Soc. Sci. Ed.) 2019, 21, 6–11. [Google Scholar]
- Porter, M.E.; van der Linde, C. Toward a new conception of the environment-competitiveness relationship. J. Econ. Perspect. 1995, 9, 97–118. [Google Scholar] [CrossRef] [Scilit]
- Brunnermeier, S.B.; Cohen, M.A. Determinants of environmental innovation in US manufacturing industries. J. Environ. Econ. Manag. 2003, 45, 278–293. [Google Scholar] [CrossRef] [Scilit]
- Conrad, K. Price competition and product differentiation when consumers care for the environment. Environ. Resour. Econ. 2005, 31, 1–19. [Google Scholar] [CrossRef] [Scilit]
- Johnstone, N.; Haščič, I.; Popp, D. Renewable energy policies and technological innovation: Evidence based on patent counts. Environ. Resour. Econ. 2010, 45, 133–155. [Google Scholar] [CrossRef] [Scilit]
- Ling, Y.; Xu, J.; Ülkü, M.A. A game-theoretic analysis of the impact of government subsidy on optimal product greening and pricing decisions in a duopolistic market. J. Clean. Prod. 2022, 338, 130028. [Google Scholar] [CrossRef] [Scilit]
- Li, Z.; Pan, Y.; Yang, W.; Ma, J.; Zhou, M. Effects of government subsidies on green technology investment and green marketing coordination of supply chain under the cap-and-trade mechanism. Energy Econ. 2021, 101, 105426. [Google Scholar] [CrossRef] [Scilit]
- Zheng, S.; Jiang, C.; Fu, X.; Ge, Y.-E.; Shu, J. Subsidies for green technology adoption under uncertain demand and incomplete information. Omega 2022, 112, 102675. [Google Scholar] [CrossRef] [Scilit]
- Zolfagharinia, H.; Zangiabadi, M.; Hafezi, M. How much is enough? Government subsidies in supporting green product development. Eur. J. Oper. Res. 2023, 309, 1316–1333. [Google Scholar] [CrossRef] [Scilit]
- Guo, L.; Zhang, Q.; Wu, J.; Gonzalez, E.D.S. An evolutionary game model of manufacturers and consumers’ behavior strategies for green technology and government subsidy in supply chain platform. Comput. Ind. Eng. 2024, 189, 109918. [Google Scholar] [CrossRef] [Scilit]
- Shi, Z.; Cheng, J. How do government subsidies and consumers’ low-carbon preference promote new energy vehicle diffusion? A tripartite evolutionary game based on energy vehicle manufacturers, the government and consumers. Heliyon 2023, 9, e14327. [Google Scholar] [CrossRef] [Scilit]
- Song, R.; Shi, W.; Qin, W.; Xue, X. Exploring the interplay of new energy vehicle enterprises, consumers, and government in the context of the” dual carbon” target: An evolutionary game and simulation analysis. PLoS ONE 2023, 18, e0291175. [Google Scholar]
- Zhao, D.; Ji, S.F.; Wang, H.P.; Jiang, L.W. How do government subsidies promote new energy vehicle diffusion in the complex network context? A three-stage evolutionary game model. Energy 2021, 230, 120899. [Google Scholar] [CrossRef] [Scilit]
- Liao, D.; Tan, B. An evolutionary game analysis of new energy vehicles promotion considering carbon tax in post-subsidy era. Energy 2023, 264, 126156. [Google Scholar]
- Cai, R.; Zhang, T.; Wang, X.; Jia, Q.; Zhao, S.; Liu, N.; Wang, X. Evolutionary Game and Simulation Analysis of New-Energy Vehicle Promotion in China Based on Reward and Punishment Mechanisms. Mathematics 2024, 12, 2900. [Google Scholar] [CrossRef] [Scilit]
- Xu, Y.; Han, L.; Li, X.; Zhu, W.; Ren, H. Evolutionary Game-Based New Energy Vehicle Supply Chain Strategies That Consider Carbon Reduction and Consumers’ Low-Carbon Preferences. Systems 2024, 12, 328. [Google Scholar] [CrossRef] [Scilit]
- Rezvani, Z.; Jansson, J.; Bodin, J. Advances in consumer electric vehicle adoption research: A review and research agenda. Transp. Res. Part D 2015, 34, 122–136. [Google Scholar] [CrossRef] [Scilit]
- Liao, F.; Molin, E.; van Wee, B. Consumer preferences for electric vehicles: A literature review. Transp. Rev. 2017, 37, 252–275. [Google Scholar] [CrossRef] [Scilit]
- Hardman, S.; Jenn, A.; Tal, G.; Axsen, J.; Beard, G.; Daina, N.; Figenbaum, E.; Jakobsson, N.; Jochem, P.; Kinnear, N.; et al. A review of consumer preferences of and interactions with electric vehicle charging infrastructure. Transp. Res. Part D 2018, 62, 508–523. [Google Scholar] [CrossRef] [Scilit]
- Sierzchula, W.; Bakker, S.; Maat, K.; van Wee, B. The influence of financial incentives and other socio-economic factors on electric vehicle adoption. Energy Policy 2014, 68, 183–194. [Google Scholar] [CrossRef] [Scilit]
- Mersky, A.C.; Sprei, F.; Samaras, C.; Qian, Z. Effectiveness of incentives on electric vehicle adoption in Norway. Transp. Res. Part D 2016, 46, 56–68. [Google Scholar] [CrossRef] [Scilit]
- Zhang, Y.; Qian, Z.S.; Sprei, F.; Li, B. The impact of car specifications, prices and incentives for battery electric vehicles in Norway: Choices of heterogeneous consumers. Transp. Res. Part C 2016, 69, 386–401. [Google Scholar] [CrossRef] [Scilit]
- Zhang, Y.; Yu, Y.; Zou, B. Analyzing public awareness and acceptance of alternative fuel vehicles in China: The case of EV. Energy Policy 2011, 39, 7015–7024. [Google Scholar] [CrossRef] [Scilit]
- Jaiswal, D.; Kaushal, V.; Kant, R.; Singh, P.K. Consumer adoption intention for electric vehicles: Insights and evidence from Indian sustainable transportation. Technol. Forecast. Soc. Change 2021, 173, 121089. [Google Scholar]
- Globisch, J.; Plötz, P.; Dütschke, E.; Wietschel, M. Consumer preferences for public charging infrastructure for electric vehicles. Transp. Policy 2019, 81, 54–63. [Google Scholar] [CrossRef] [Scilit]
- Wolbertus, R.; Kroesen, M.; van den Hoed, R.; Chorus, C.G. Policy effects on charging behaviour of electric vehicle owners and on purchase intentions of prospective owners: Natural and stated choice experiments. Transp. Res. Part D 2018, 62, 283–297. [Google Scholar] [CrossRef] [Scilit]
- Funke, S.Á.; Sprei, F.; Gnann, T.; Plötz, P. How much charging infrastructure do electric vehicles need? A review of the evidence and international comparison. Transp. Res. Part D 2019, 77, 224–242. [Google Scholar] [CrossRef] [Scilit]
- Greene, D.L.; Kontou, E.; Borlaug, B.; Brooker, A.; Muratori, M. Public charging infrastructure for plug-in electric vehicles: What is it worth? Transp. Res. Part D 2020, 78, 102182. [Google Scholar] [CrossRef] [Scilit]
- Jeremy, D.V.; Nathan, D.; Bruno, L. Technology Adoption and Early Network Infrastructure Provision in the Market for Electric Vehicles. Environ. Resour. Econ. 2022, 83, 631–679. [Google Scholar] [CrossRef] [Scilit]
- Li, L.; Wang, Z.; Xie, X. From government to market? A discrete choice analysis of policy instruments for electric vehicle adoption. Transp. Res. Part A 2022, 160, 143–159. [Google Scholar] [CrossRef] [Scilit]
- Sheldon, L.T.; Dua, R. Effectiveness of China’s plug-in electric vehicle subsidy. Energy Econ. 2020, 88, 104773. [Google Scholar] [CrossRef] [Scilit]
- Sheldon, T.L. Evaluating Electric Vehicle Policy Effectiveness and Equity. Annu. Rev. Resour. Econ. 2022, 14, 669–688. [Google Scholar] [CrossRef] [Scilit]
- Yan, S. The economic and environmental impacts of tax incentives for battery electric vehicles in Europe. Energy Policy 2018, 123, 53–63. [Google Scholar] [CrossRef] [Scilit]
- Zheng, X.; Menezes, F.; Zheng, X.; Wu, C. An empirical assessment of the impact of subsidies on EV adoption in China: A difference-in-differences approach. Transp. Res. Part A 2022, 162, 121–136. [Google Scholar] [CrossRef] [Scilit]
- Shao, J.; Jiang, C.; Cui, Y.; Tang, Y. A game-theoretic model to compare charging infrastructure subsidy and electric vehicle subsidy policies. Transp. Res. Part A 2023, 176, 103799. [Google Scholar] [CrossRef] [Scilit]
- Burra, L.T.; Sommer, S.; Vance, C. Policy complementarities in the promotion of electric vehicles. Energy Policy 2024, 192, 114262. [Google Scholar] [CrossRef] [Scilit]
- Sheldon, L.T.; Dua, R. The dynamic role of subsidies in promoting global electric vehicle sales. Transp. Res. Part A 2024, 187, 104173. [Google Scholar] [CrossRef] [Scilit]
- Martins, E.C.S.; Lépine, J.; Corbett, J. Assessing the effectiveness of financial incentives on electric vehicle adoption in Europe: Multi-period difference-in-difference approach. Transp. Res. Part A 2024, 189, 104217. [Google Scholar]
- Zhang, T.; Burke, P.J.; Wang, Q. Effectiveness of electric vehicle subsidies in China: A three-dimensional panel study. Resour. Energy Econ. 2024, 76, 101424. [Google Scholar] [CrossRef] [Scilit]
- Zhao, X.; Li, X.; Jiao, D.; Mao, Y.; Sun, J.; Liu, G. Policy incentives and electric vehicle adoption in China: From a perspective of policy mixes. Transp. Res. Part A 2024, 190, 104235. [Google Scholar] [CrossRef] [Scilit]
- Luo, Q.; Yin, Y.; Chen, P.; Zhan, Z.; Saigal, R. Dynamic subsidies for synergistic development of charging infrastructure and electric vehicle adoption. Transp. Policy 2022, 129, 117–136. [Google Scholar] [CrossRef] [Scilit]
- Xie, S. Evolutionary Game Theory Under Bounded Rationality. J. Shanghai Univ. Financ. Econ. 2001, 3, 3–9. [Google Scholar]
- Ritzberger, K.; Weibull, J.W. Evolutionary Selection in Normal-Form Games. Econometrica 1995, 63, 1371–1399. [Google Scholar] [CrossRef] [Scilit]
- Daniel, F. Evolutionary Games in Economics. Econometrica 1991, 59, 637–666. [Google Scholar] [CrossRef] [Scilit]
- Lyapunov, A.M. The general problem of the stability of motion. Int. J. Control 1992, 55, 531–534. [Google Scholar] [CrossRef] [Scilit]
- Ministry of Finance; Ministry of Industry and Information Technology; Ministry of Science and Technology and National Development and Reform Commission. Notice on fiscal subsidy policies for the promotion and application of new energy vehicles in 2022. Gaz. Minist. Financ. People’s Repub. China 2022, 19–20, 24–26. [Google Scholar]
- Ministry of Finance; State Taxation Administration; Ministry of Industry and Information Technology. Announcement on the Extension and Optimization of the Purchase Tax Exemption Policy for New Energy Vehicles. Financ. Account. Transp. 2023, 7, 94–95. [Google Scholar]
- Chen, M.; Tang, L.C.; Zeng, X.G. Health benefit evaluation of the promotion and use of new energy vehicles in China: 2019~2023. China Environ. Sci. 2025, 45, 5858–5872. [Google Scholar]
- Ministry of Industry and Information Technology. Administrative Measure for the Parallel Management of Average Fuel Consumption of Passenger Vehicle Enterprises and New Energy Vehicle Credits. Gaz. State Counc. People’s Repub. China 2017, 35, 27–32. [Google Scholar]
- Liu, X.; Zhao, F.; Hao, H.; Liu, Z. Comparative analysis for different vehicle powertrains in terms of energy-saving potential and cost-effectiveness in China. Energy 2023, 276, 127564. [Google Scholar] [CrossRef] [Scilit]
- Zhao, X.; Li, X. Market-incentive environmental regulation and business performance of new energy vehicle enterprises: Empirical evidence from China’s dual-credit policy. Environ. Dev. Sustain. 2024, 1–28, prepublish. [Google Scholar] [CrossRef] [Scilit]
- Hossain, M.M.; Wang, L.; Yu, J. The reputational costs of corporate environmental underperformance: Evidence from China. Bus. Strategy Environ. 2023, 33, 930–948. [Google Scholar] [CrossRef] [Scilit]
- Zheng, X.; Huang, J.; Wang, M.; Li, W. The Impact of the Expected Utility and Experienced Utility Gap on Electric Vehicle Repurchase Intention in Jiangsu, China. World Electr. Veh. J. 2025, 16, 517. [Google Scholar] [CrossRef] [Scilit]
- Ying, R.; Xu, B.; Hu, H. China Urban Resident’s Motives of Willingness to Pay for Low-carbon Agricultural Products. China Popul. Resour. Environ. 2012, 22, 165–171. [Google Scholar]
- Li, X.; Shao, J.; Sun, Y. A Research on Vitality Stimulating of Low-carbon Supply Chain ConsumptionMarket Based on SD and Tripartite Game. Ind. Eng. J. 2021, 24, 150–159. [Google Scholar]
- Peng, W.; Gu, L.; Hu, C.; Zhou, P.; Hong, M.; Li, C. A research on consumers’ willingness to pay for low-carbon floor in the scenario simulation of carbon labeling. J. Zhejiang AF Univ. 2015, 32, 655–660. [Google Scholar]
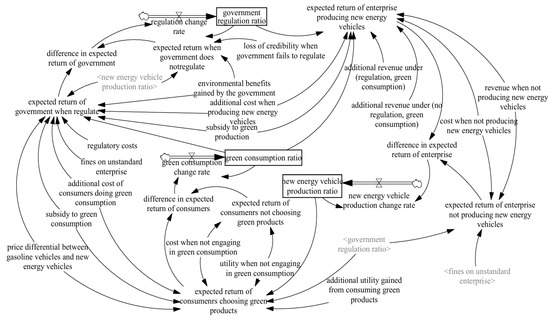
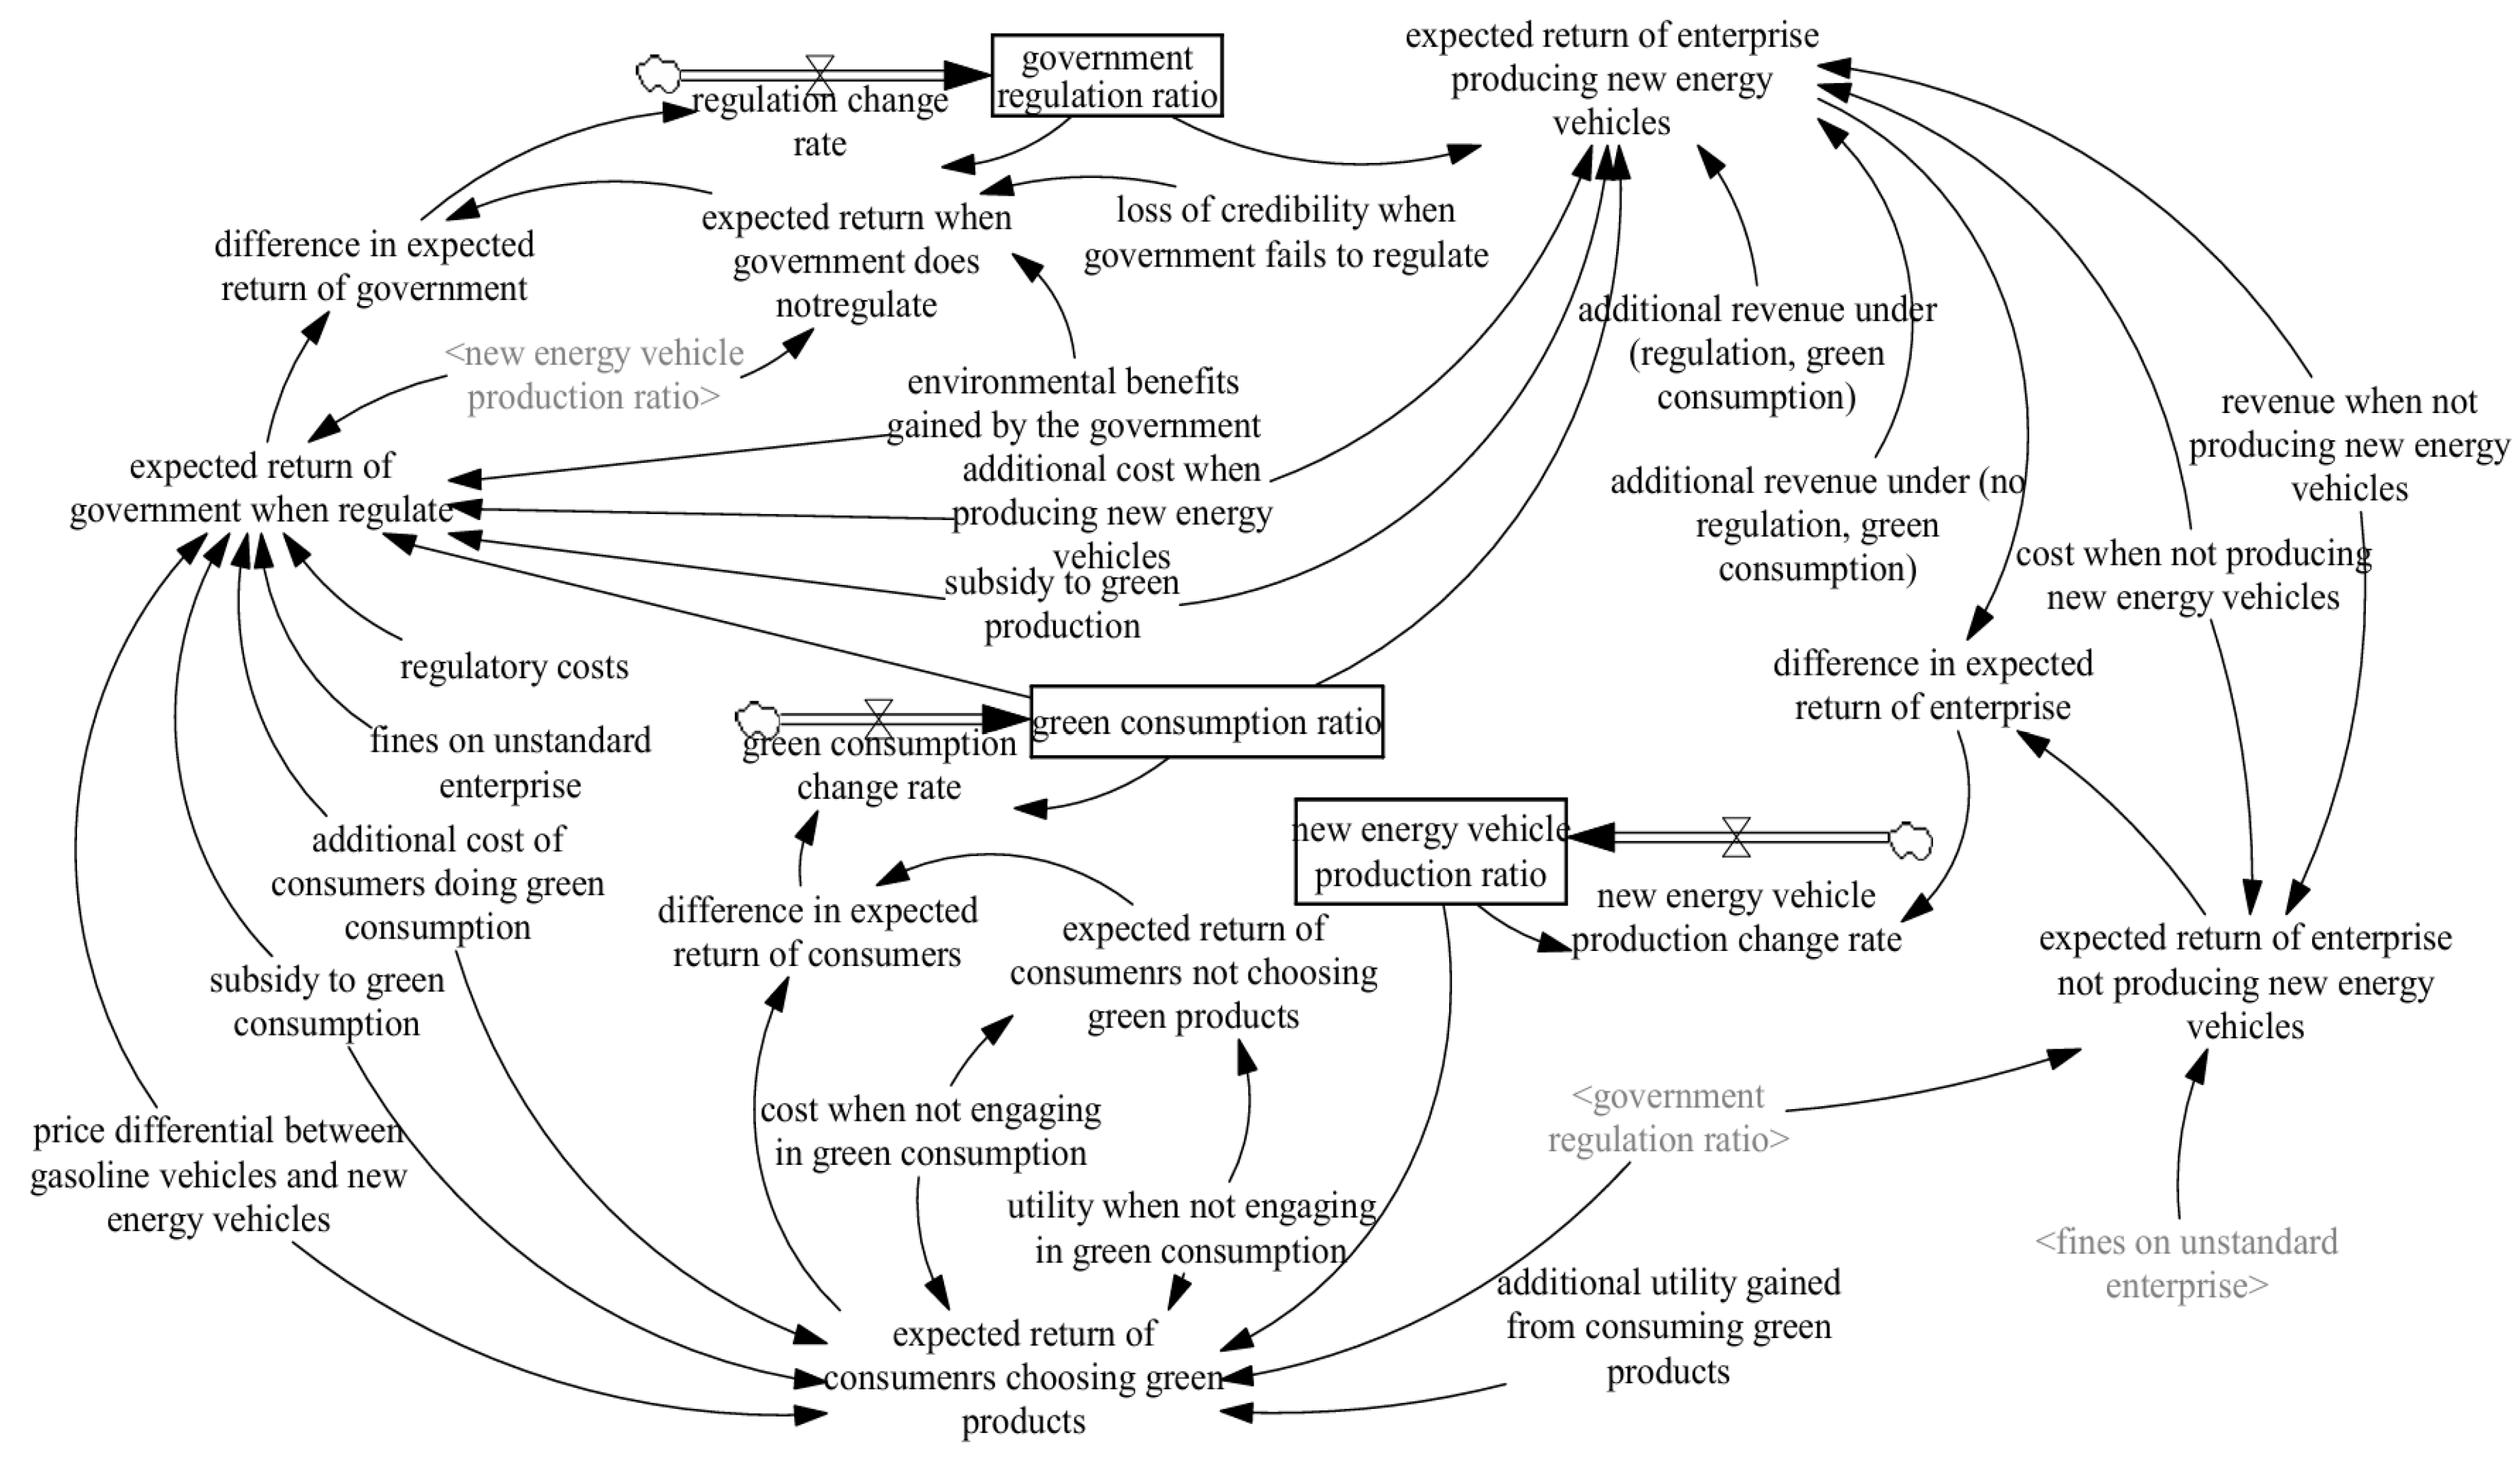
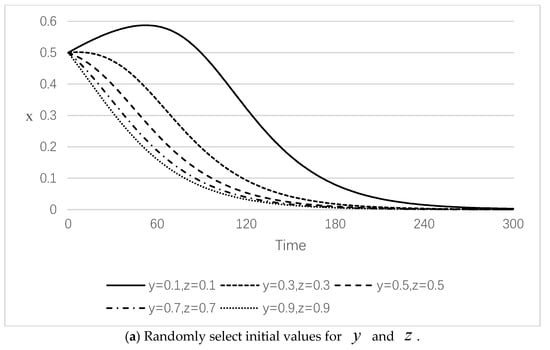
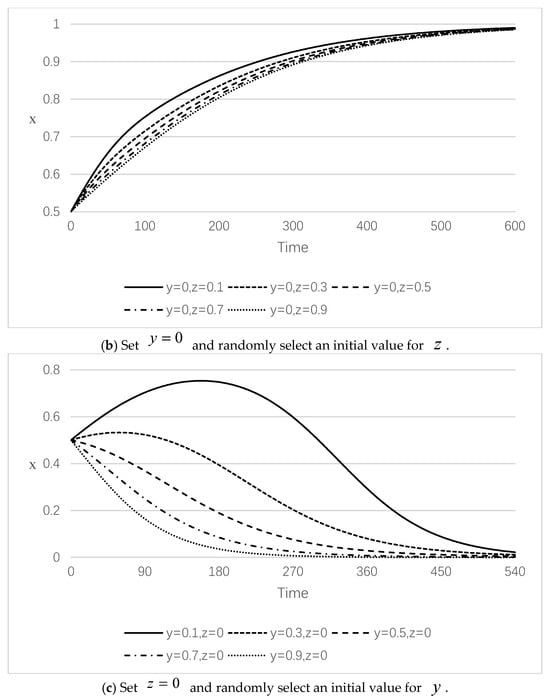
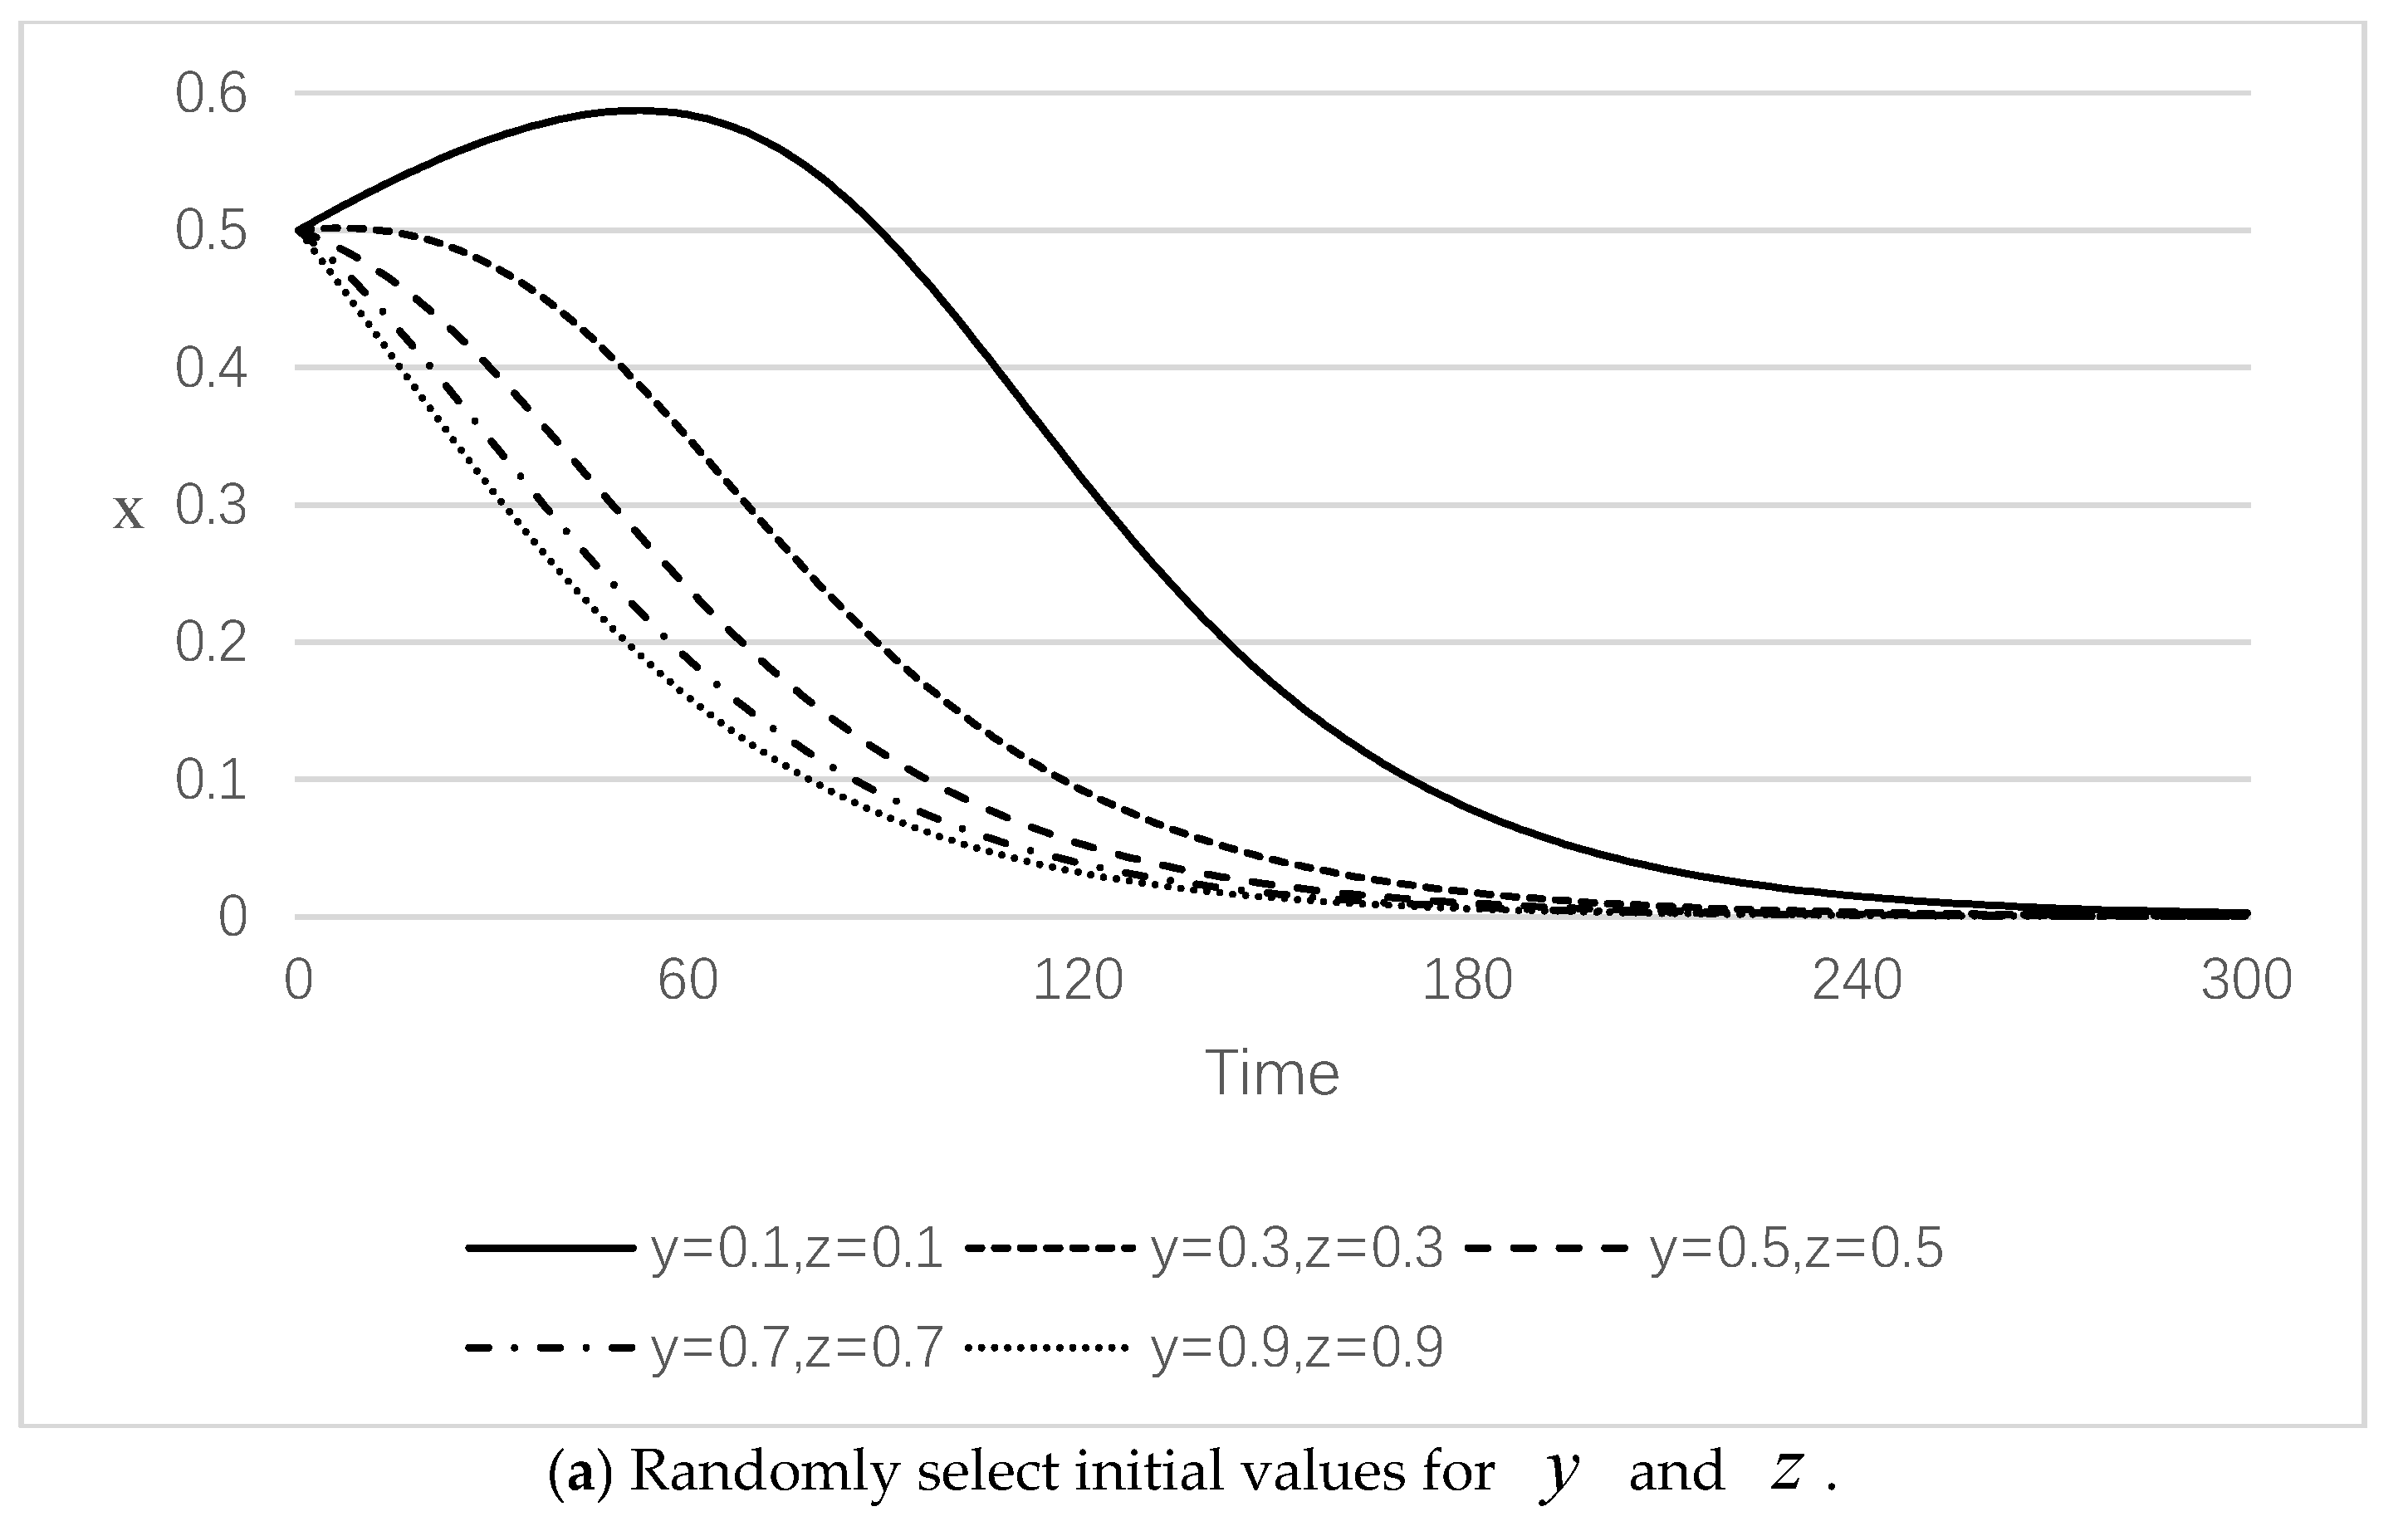
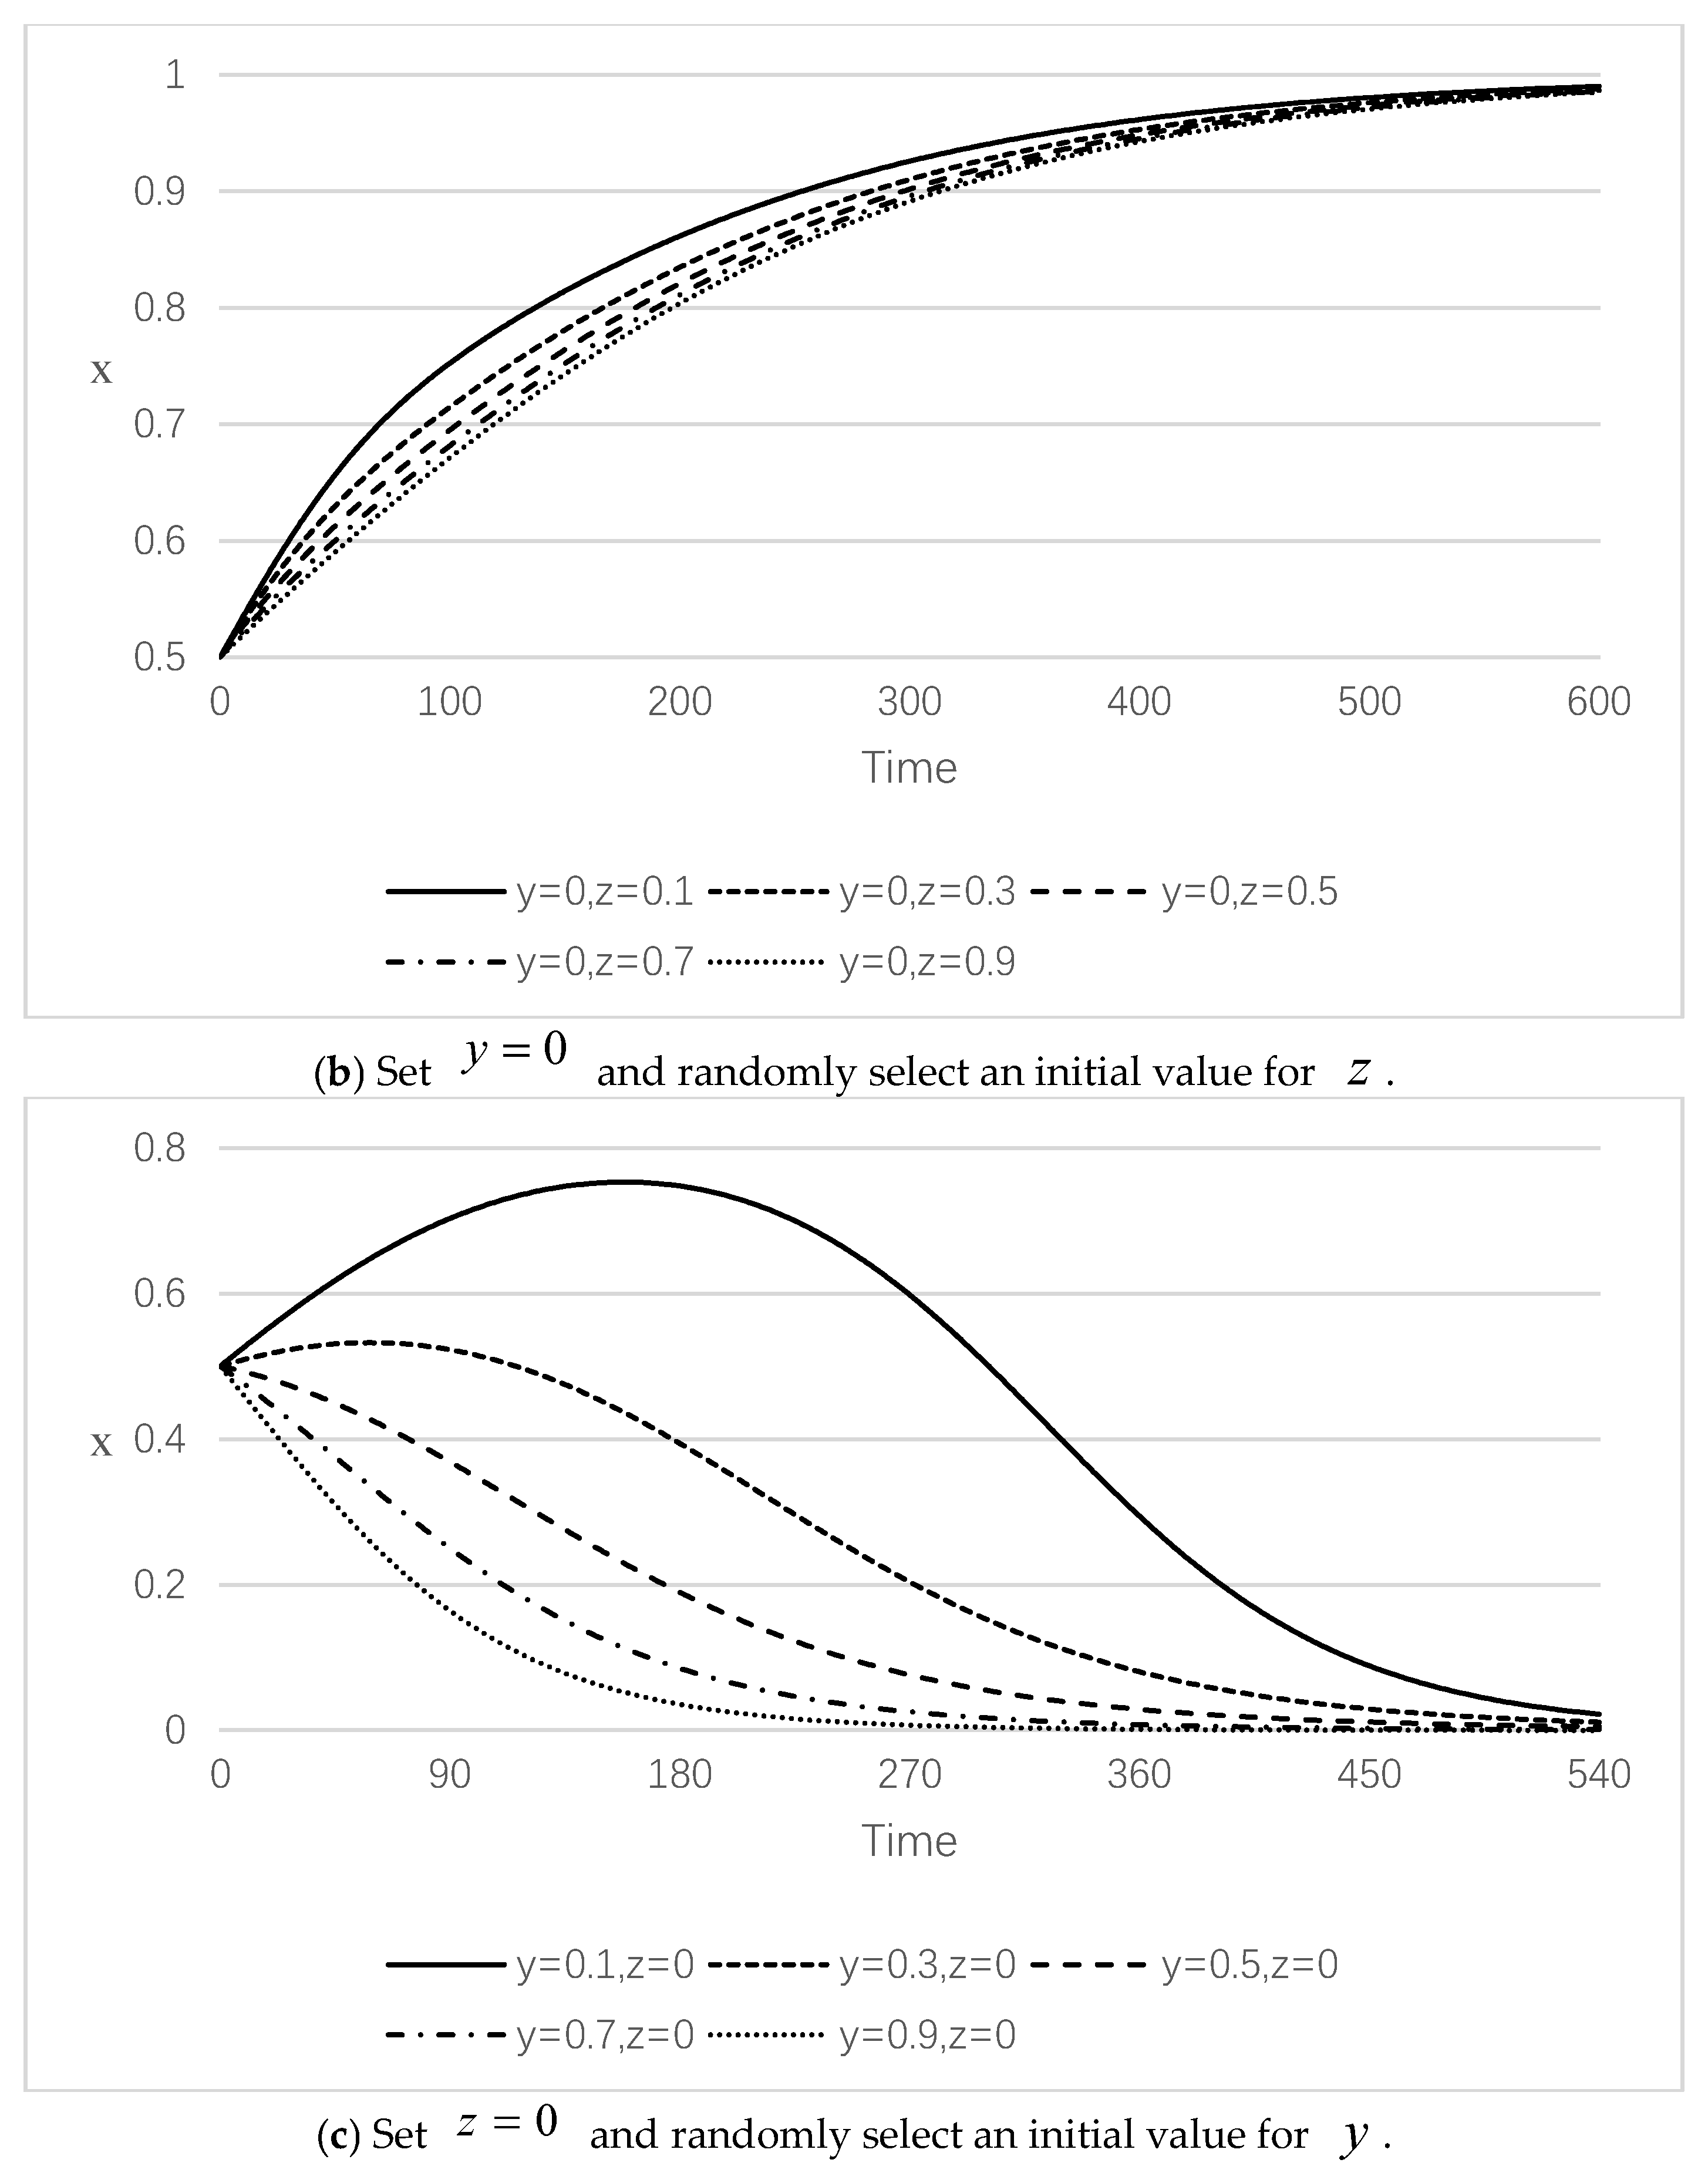
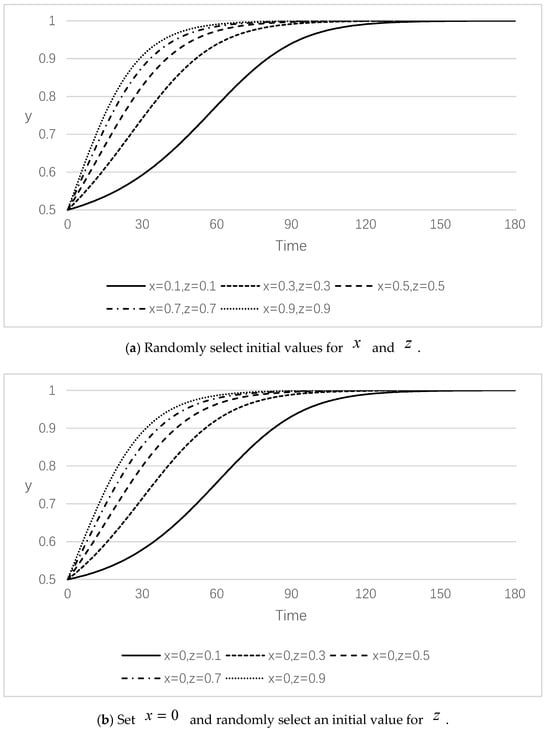
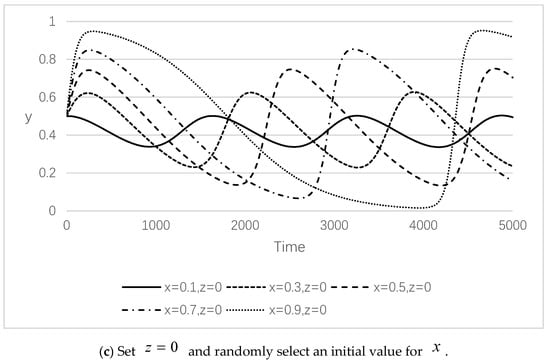
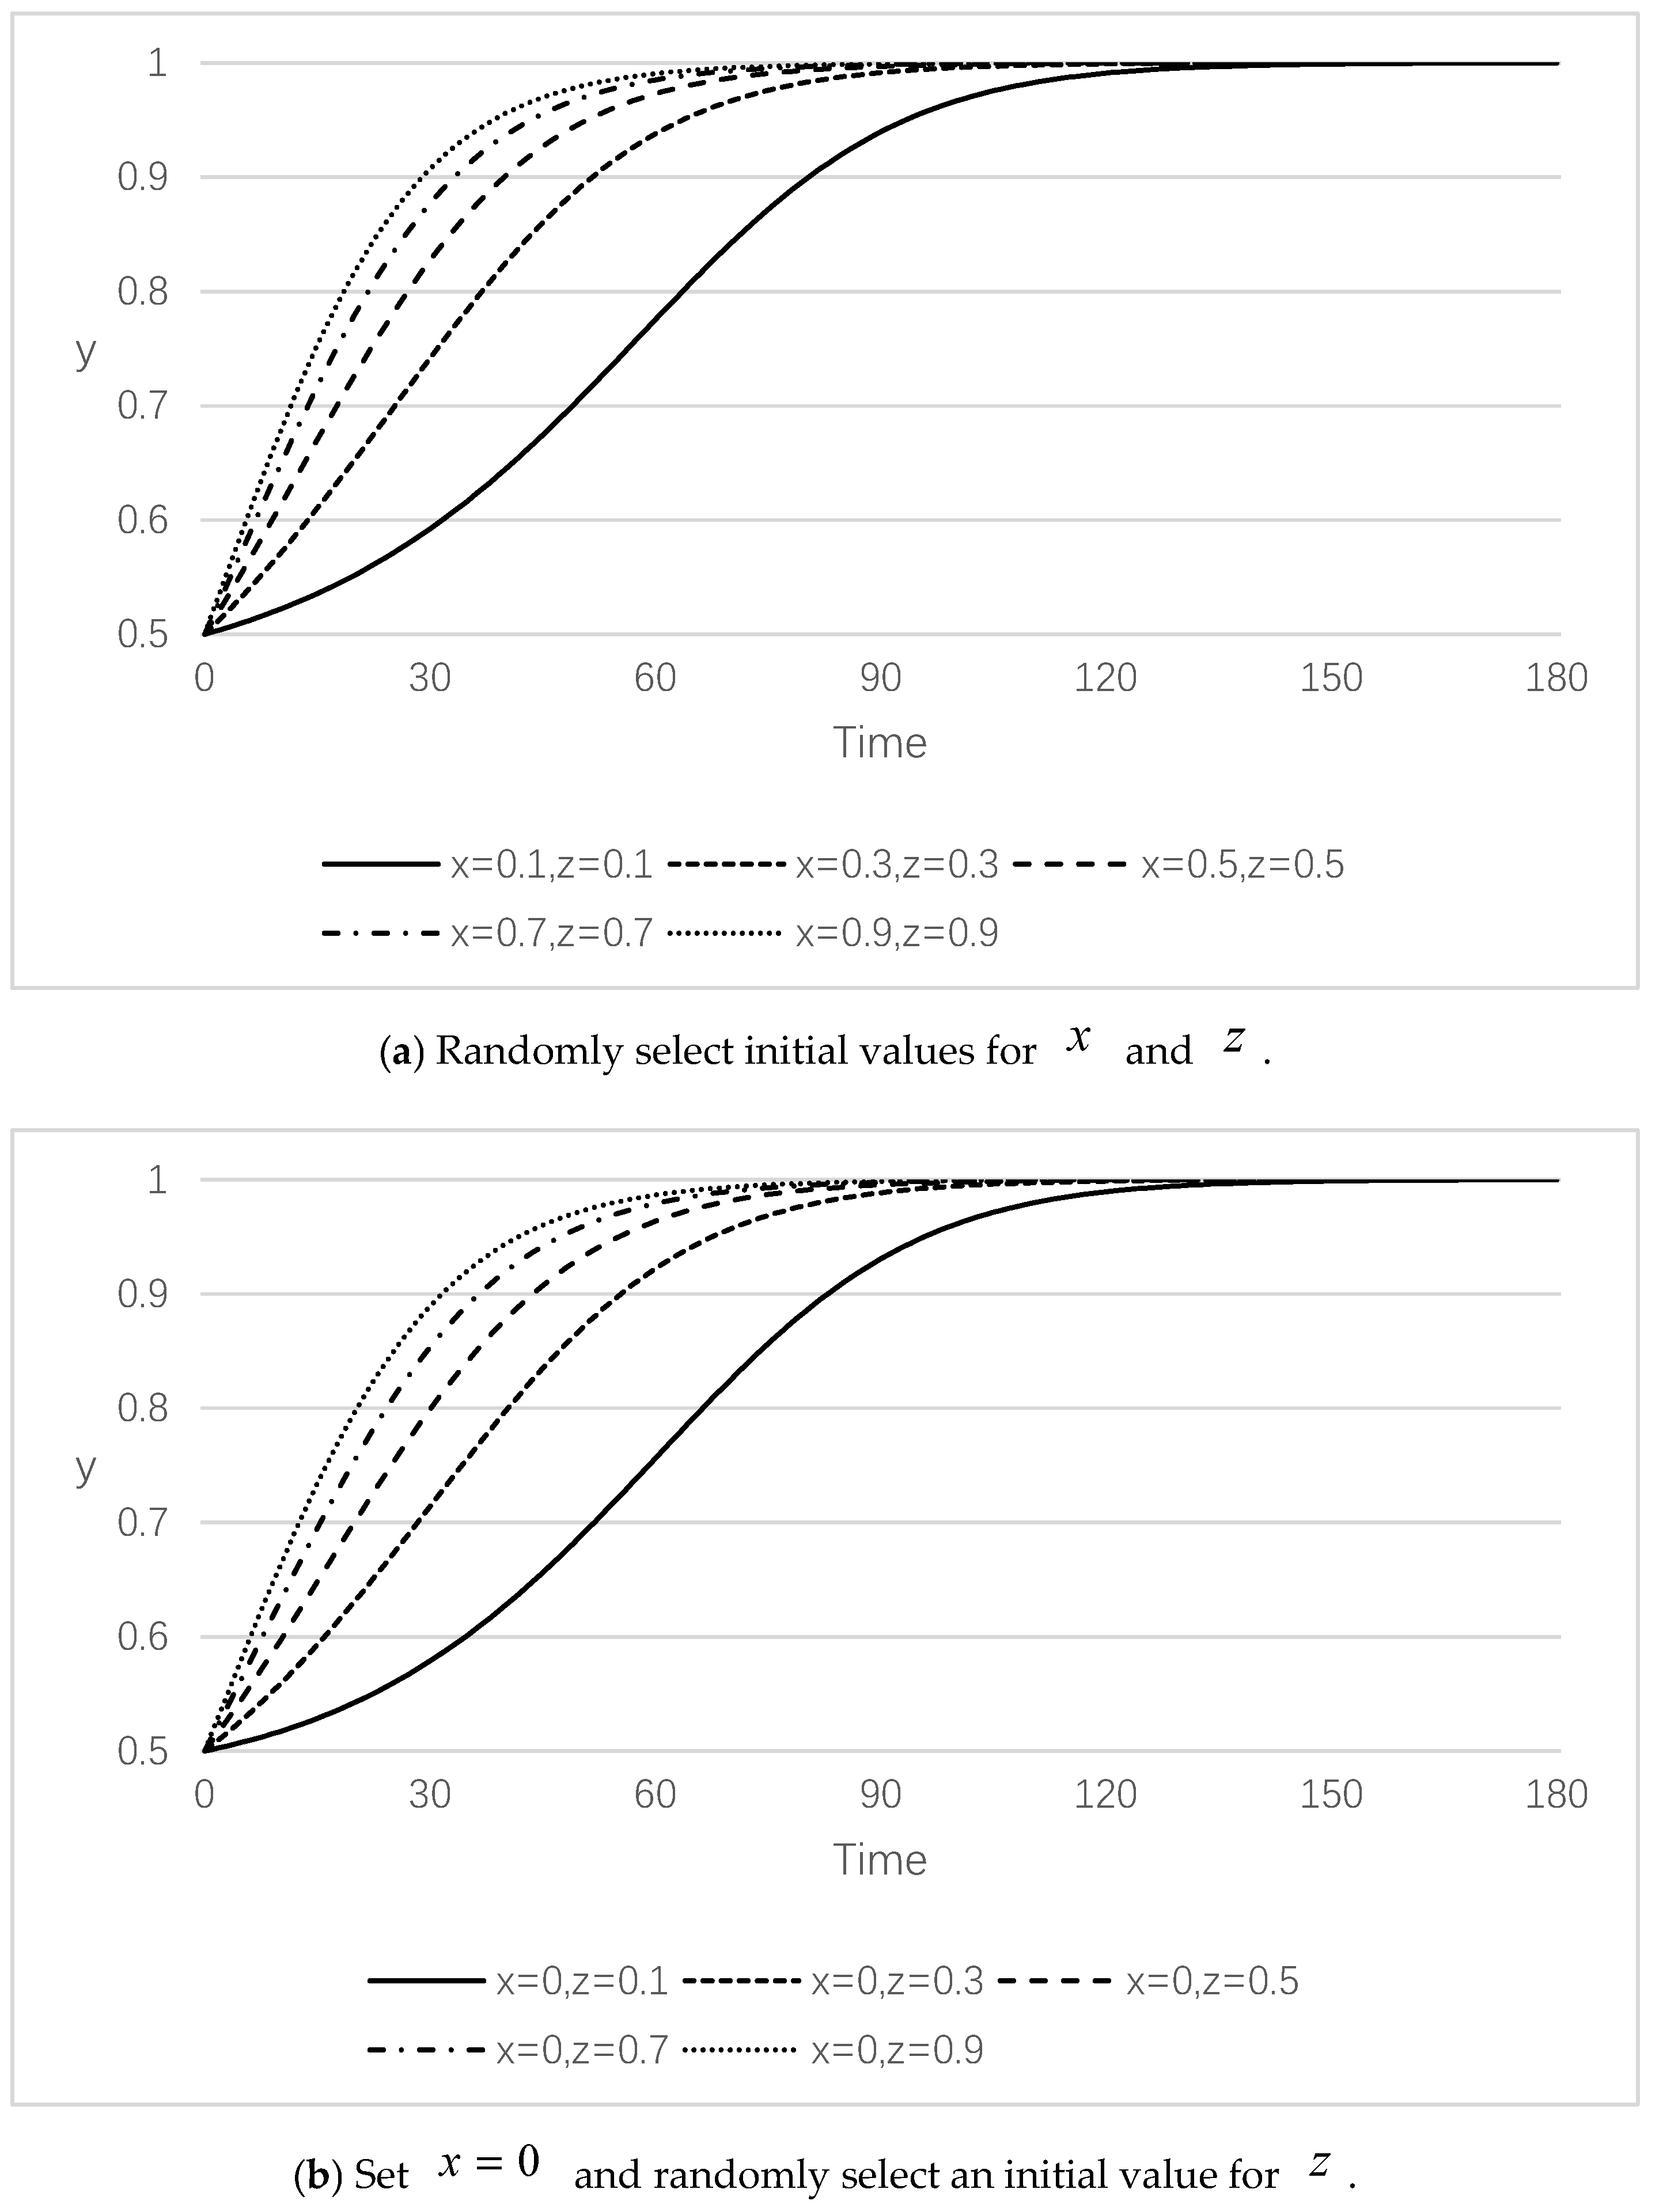
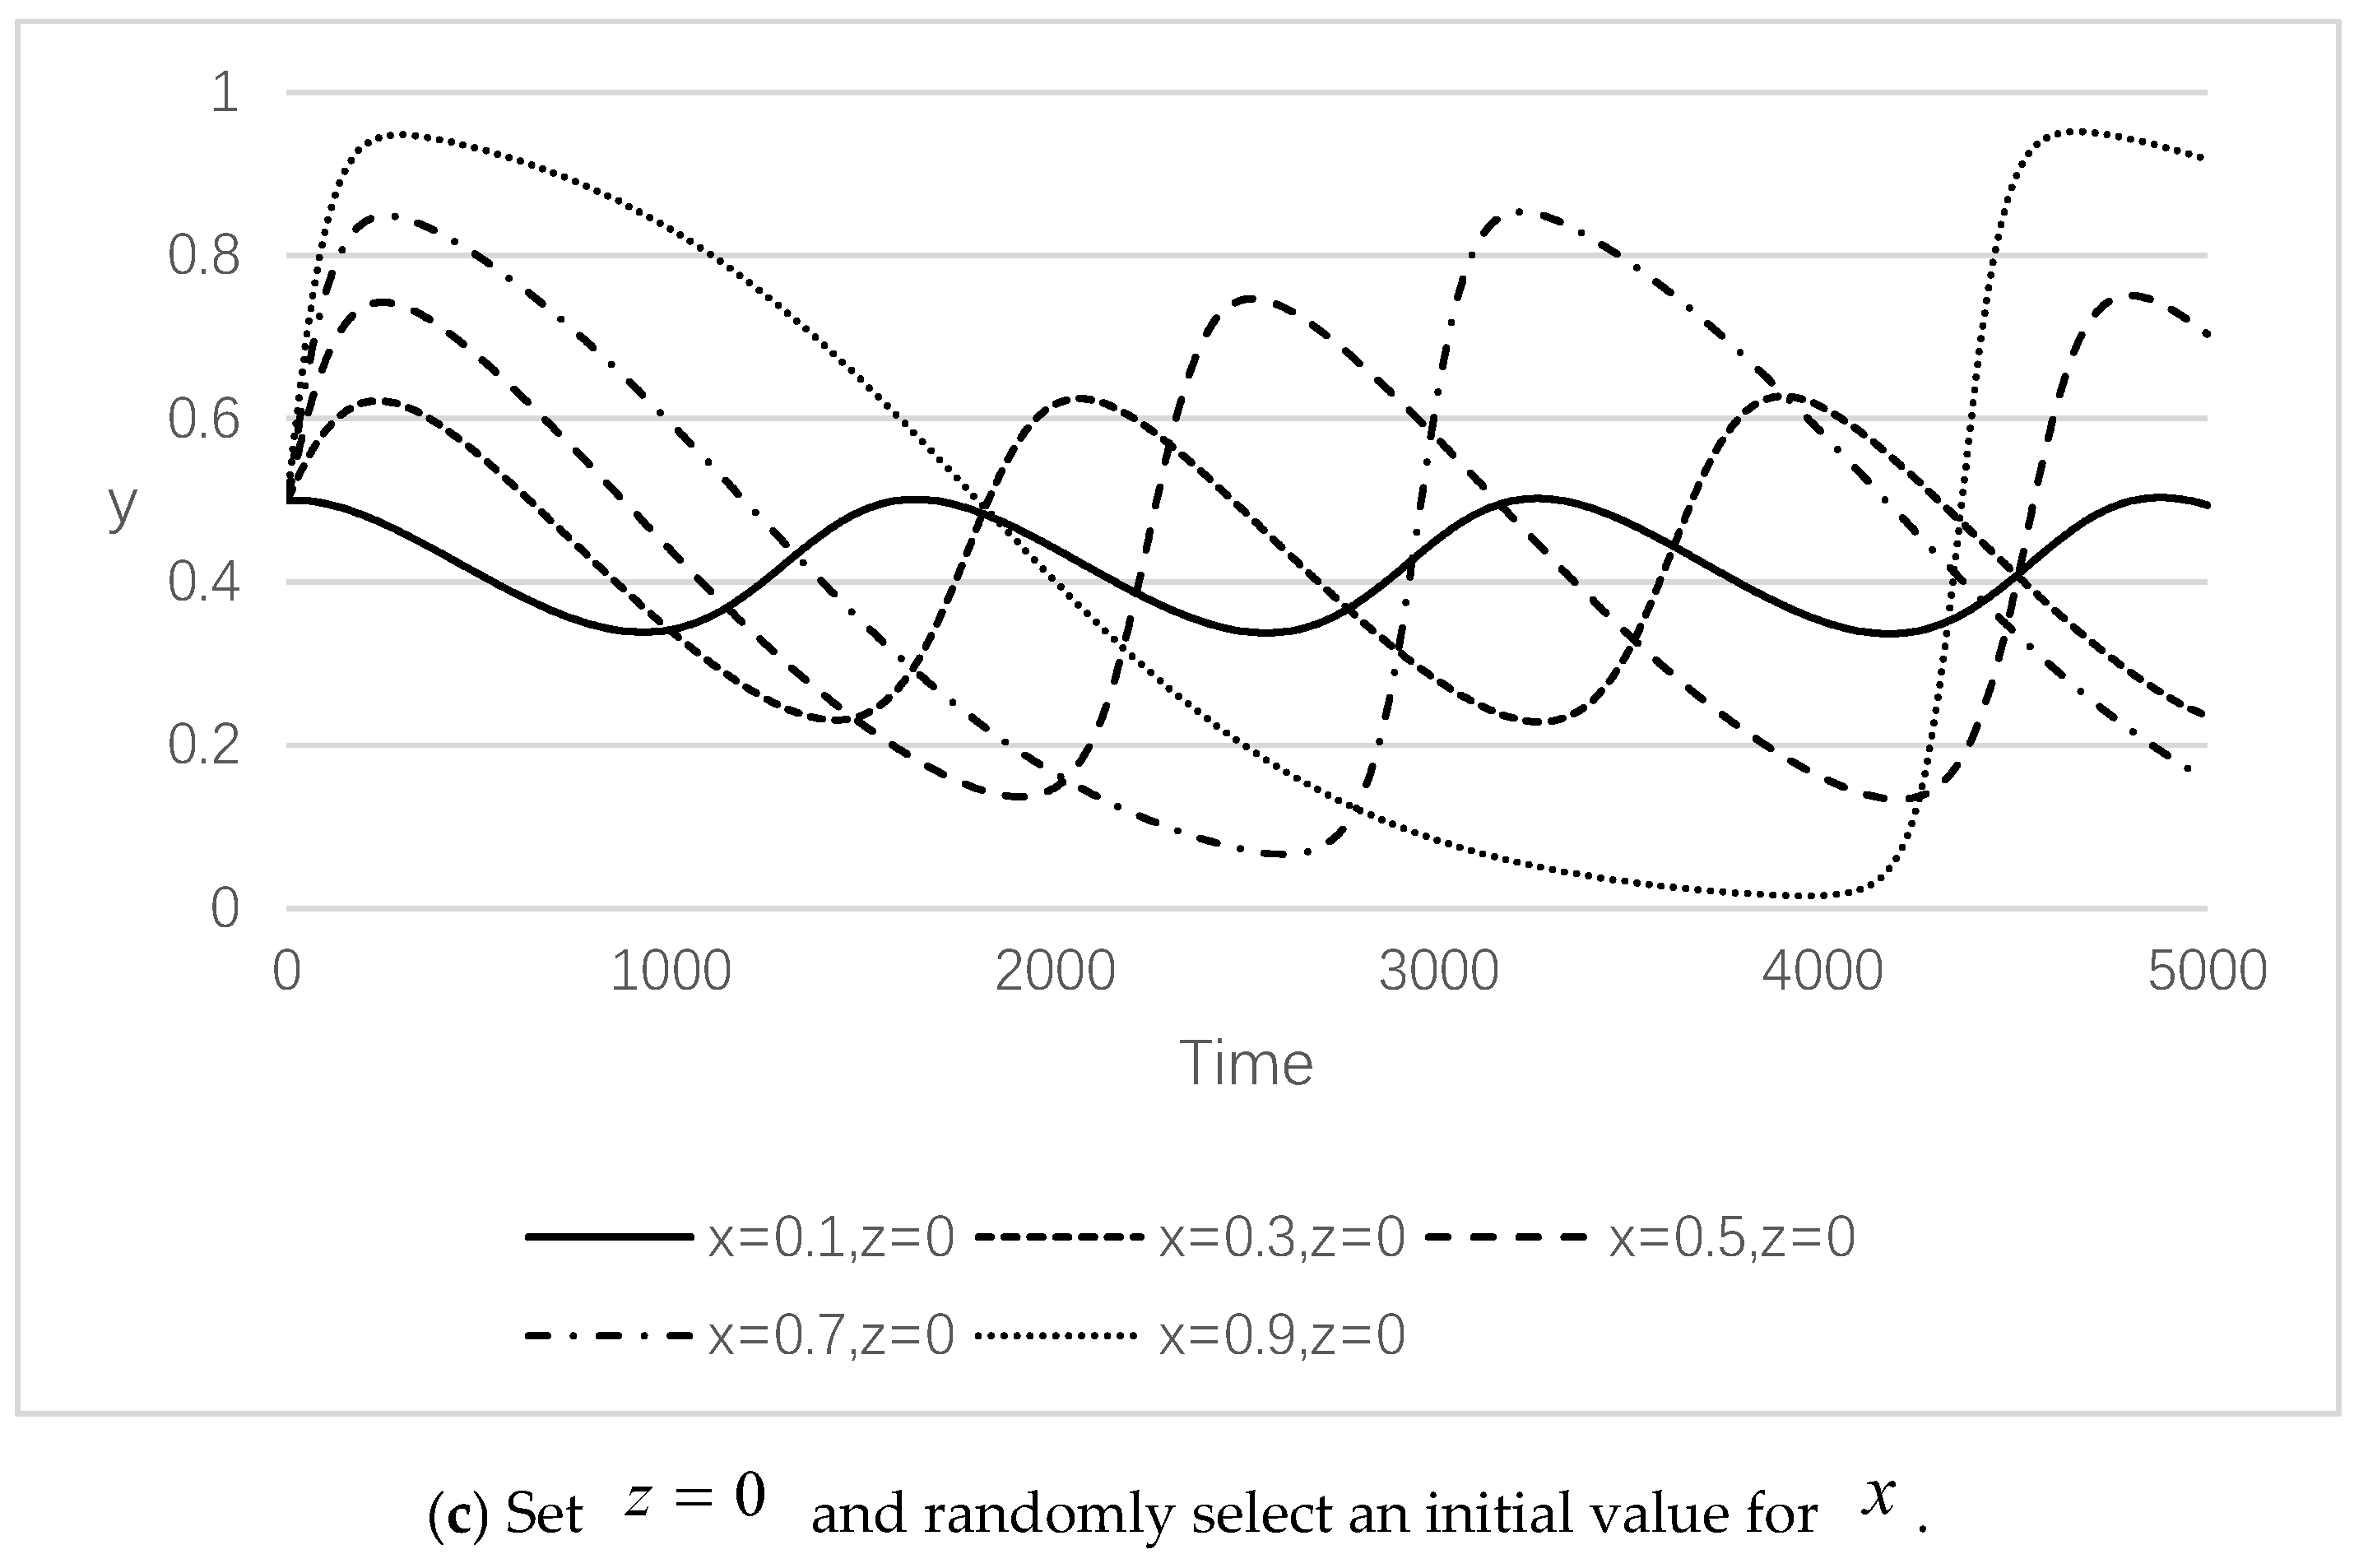
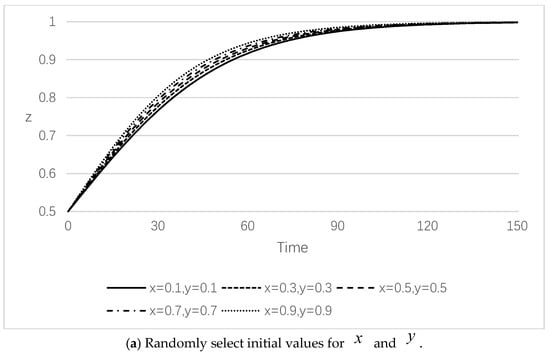
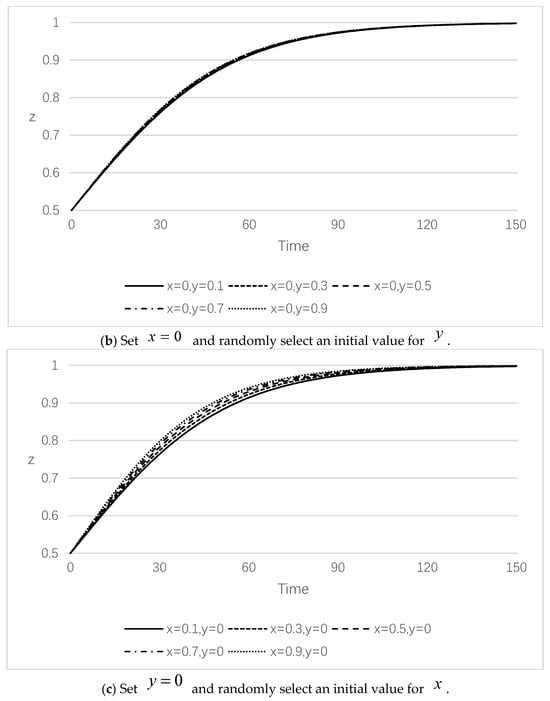
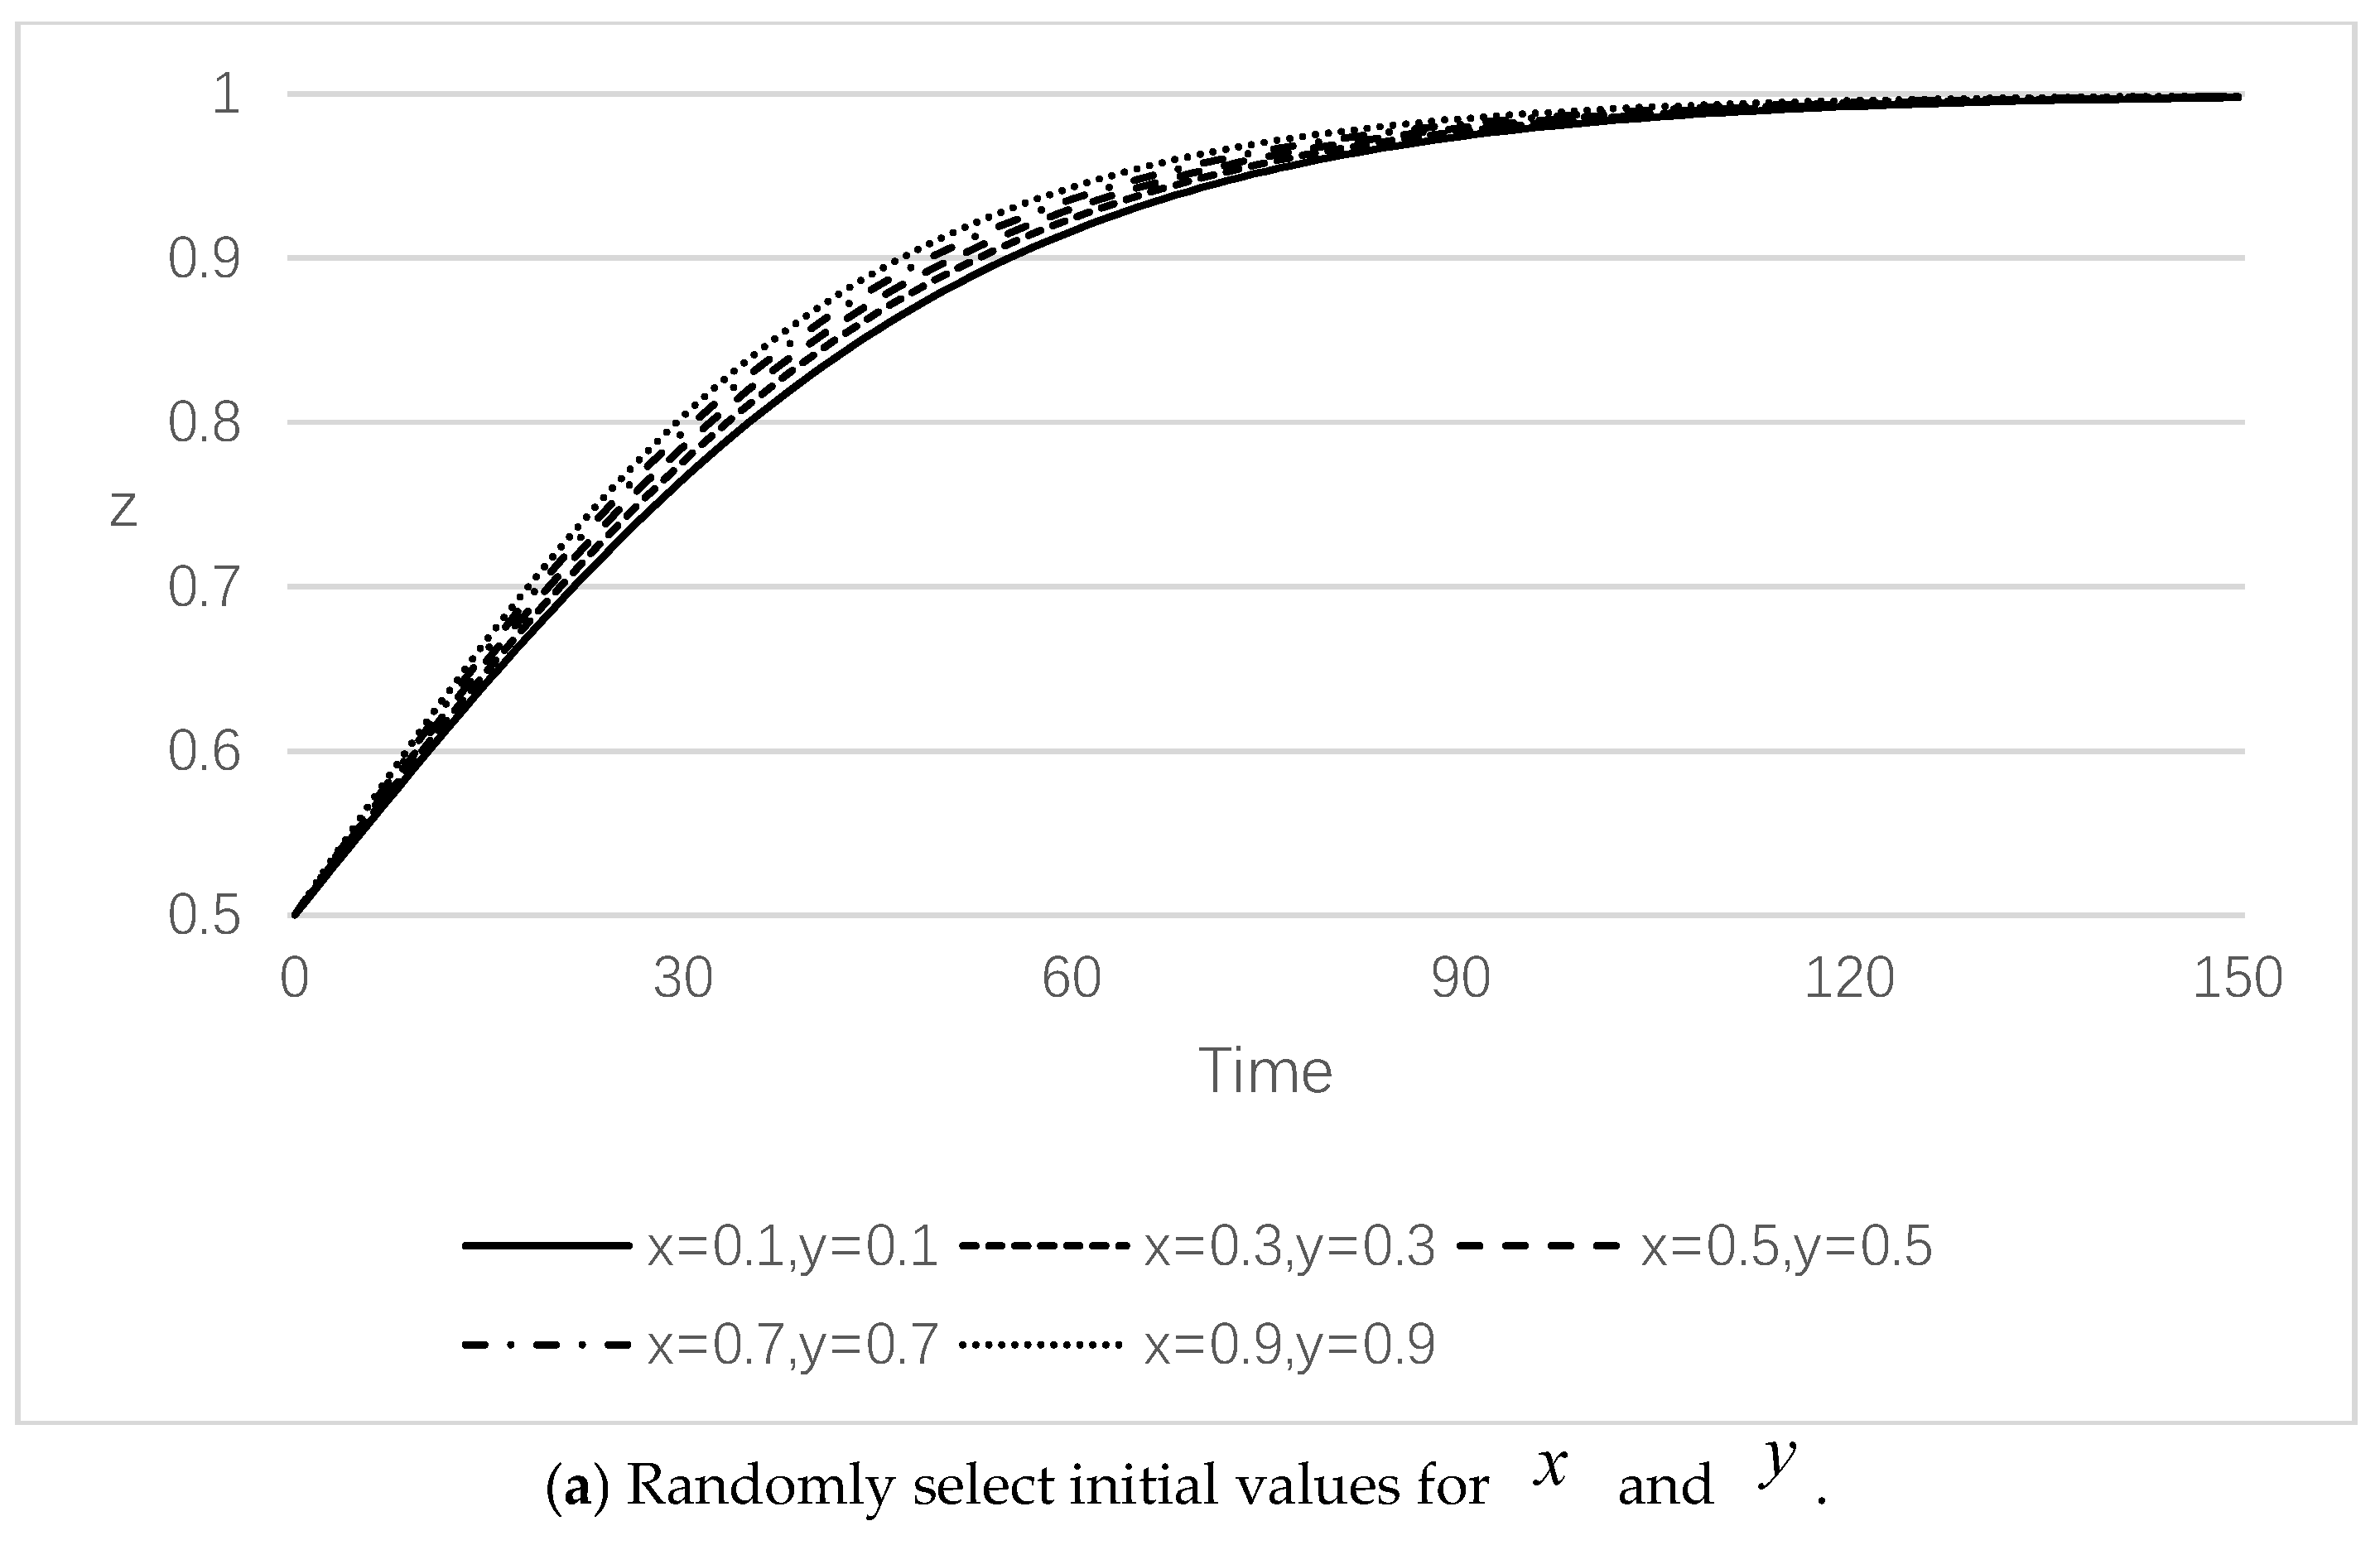
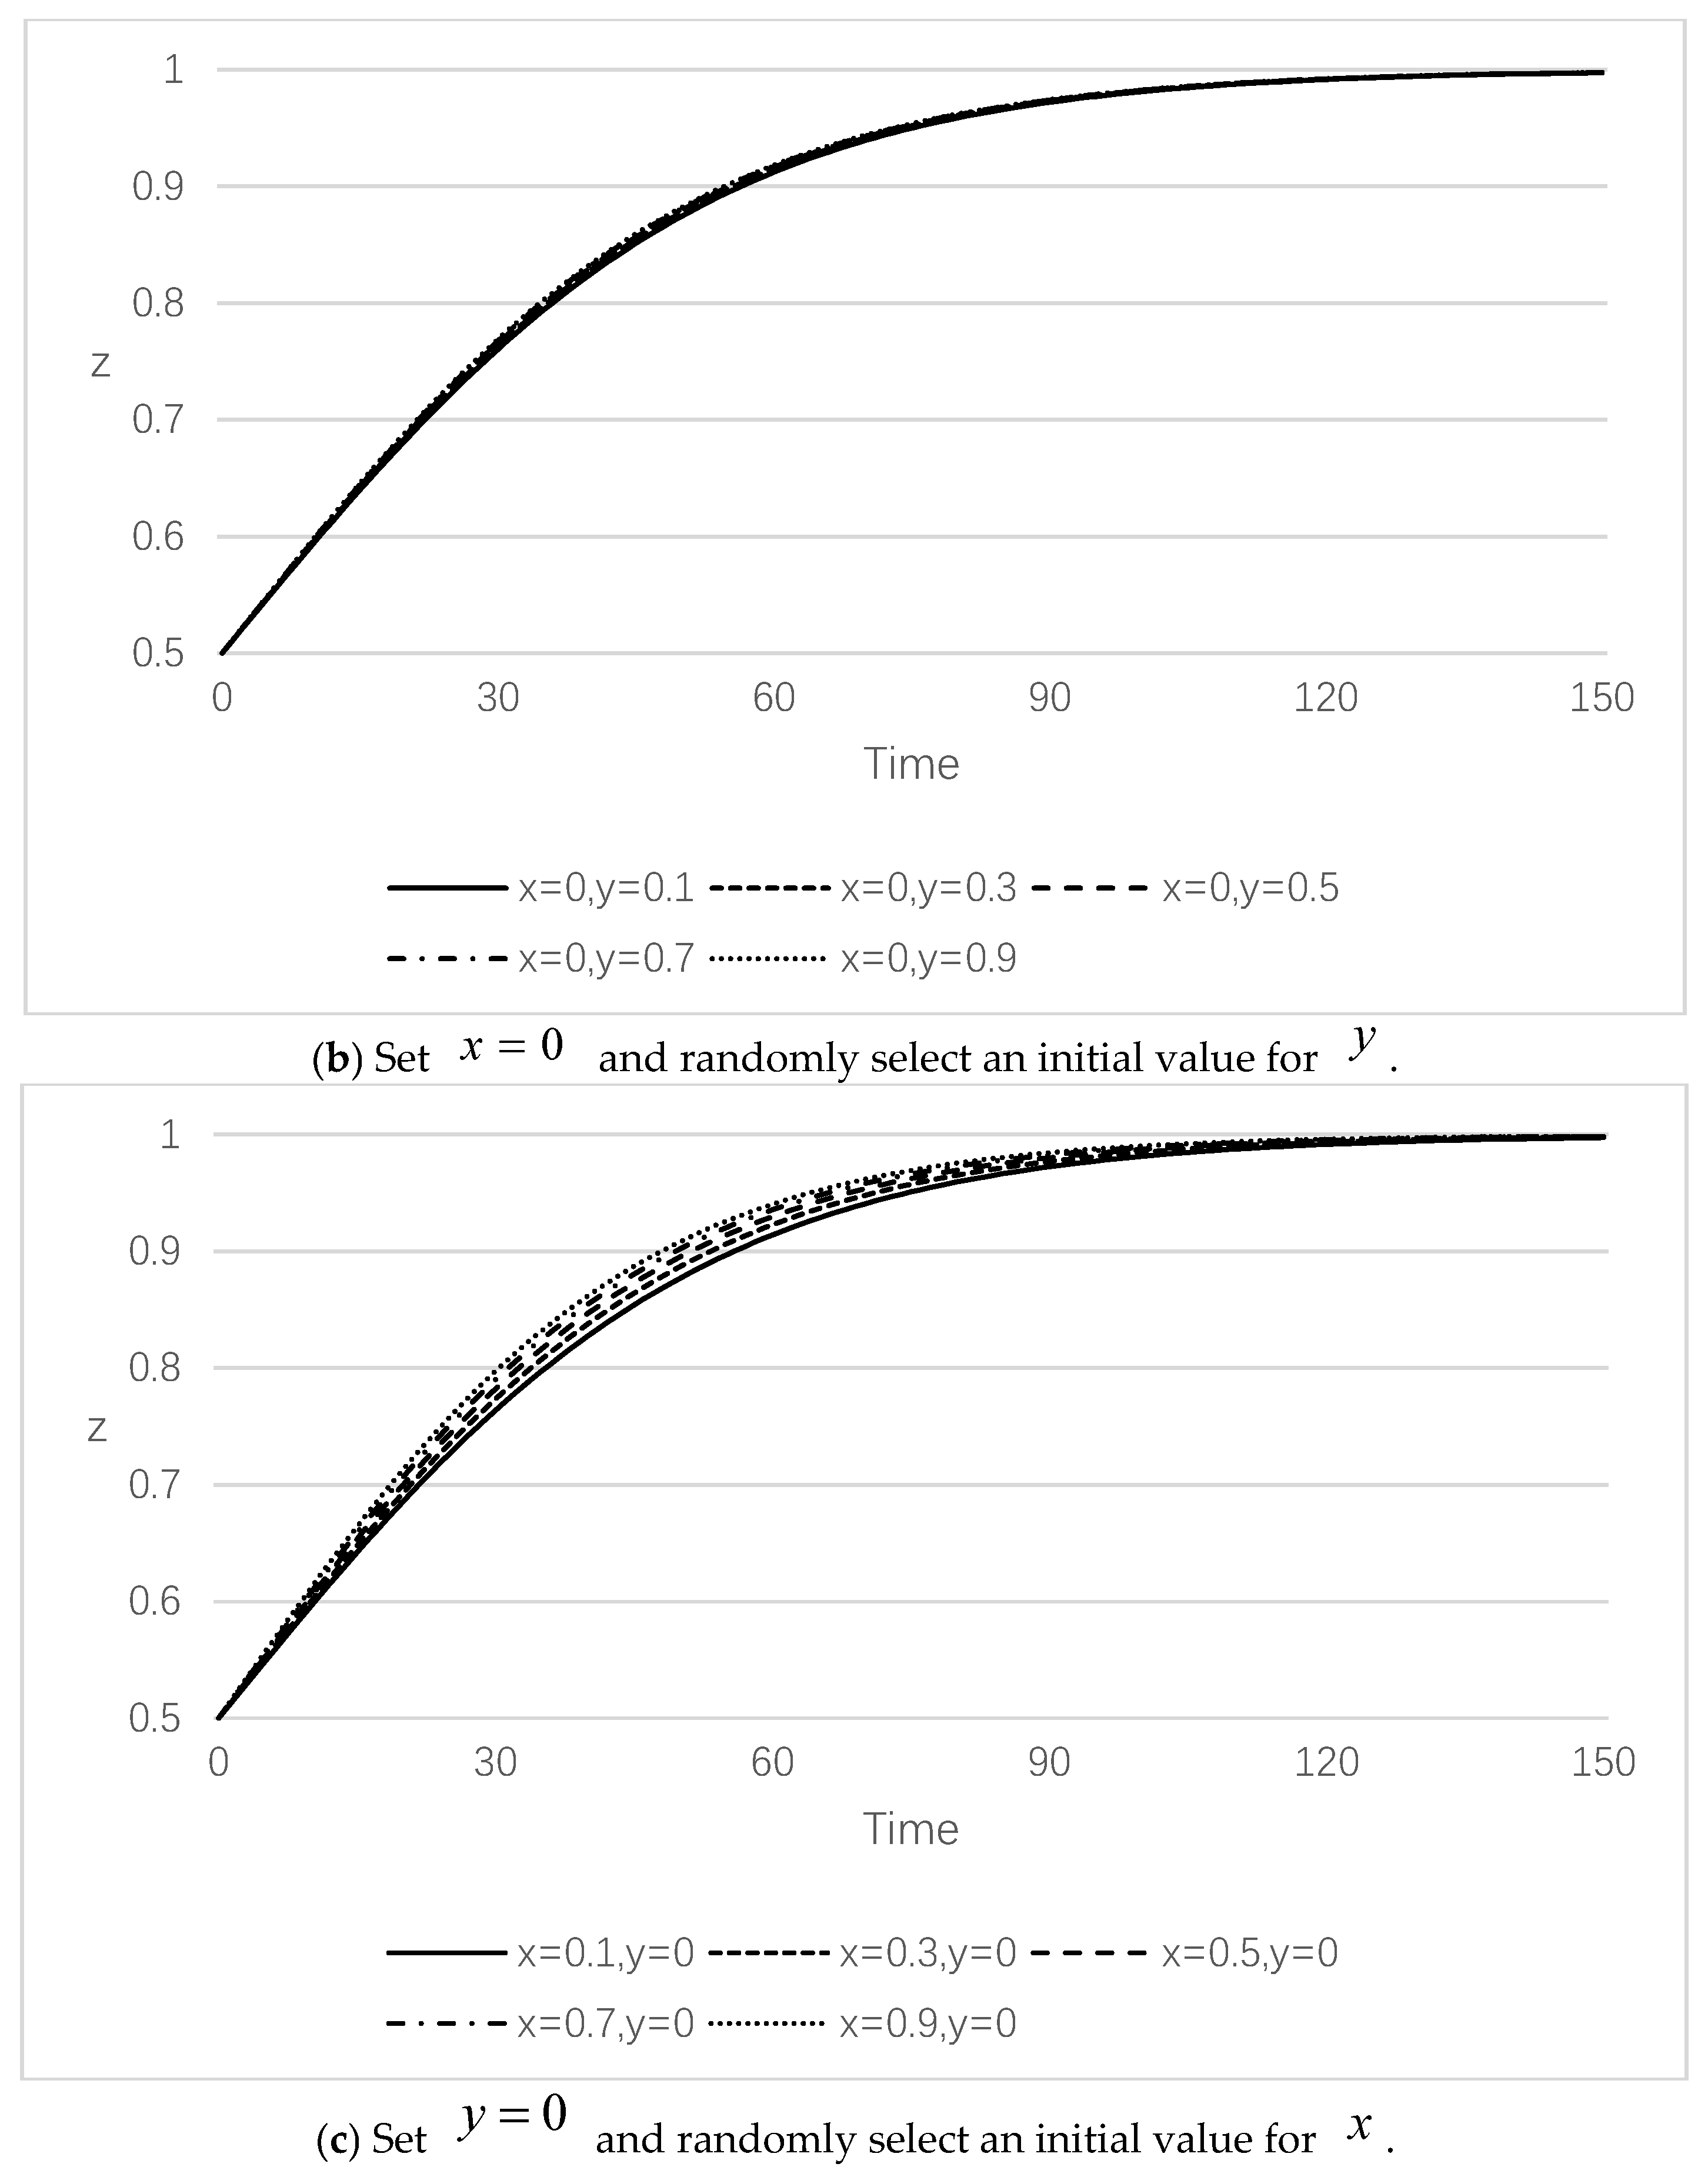
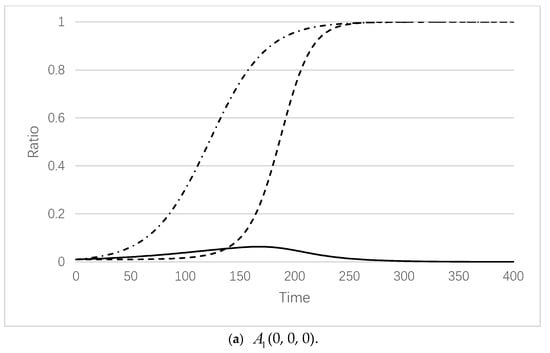
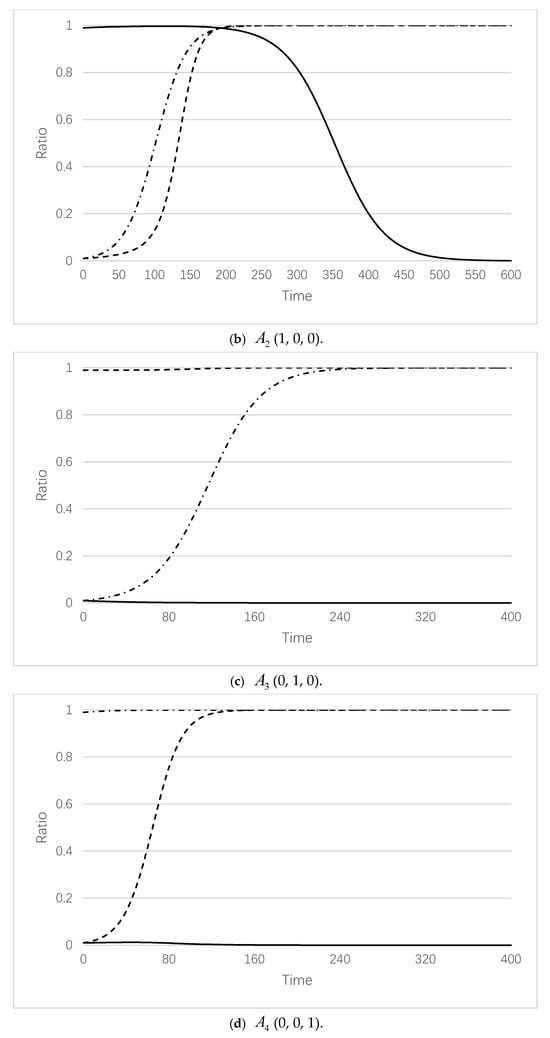
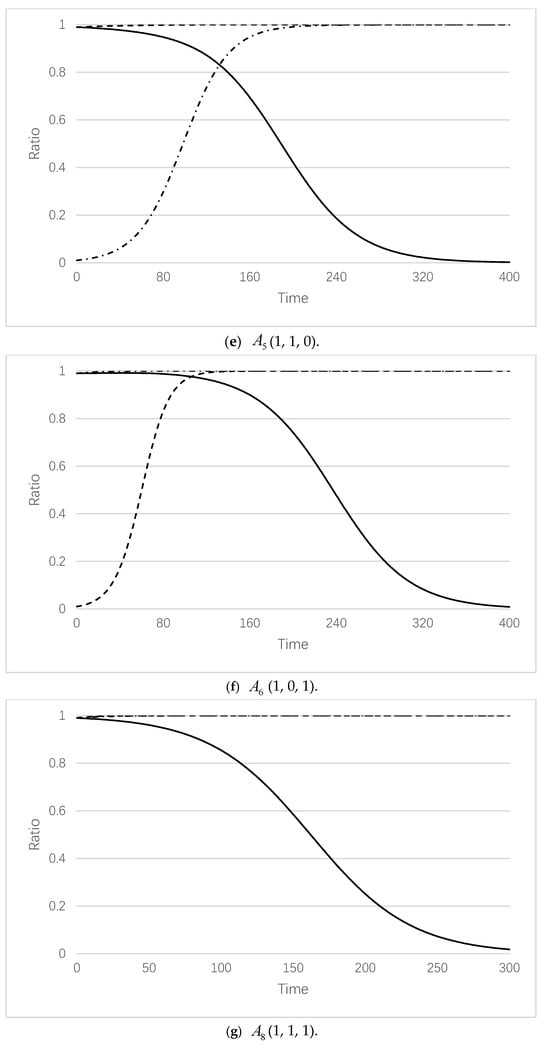
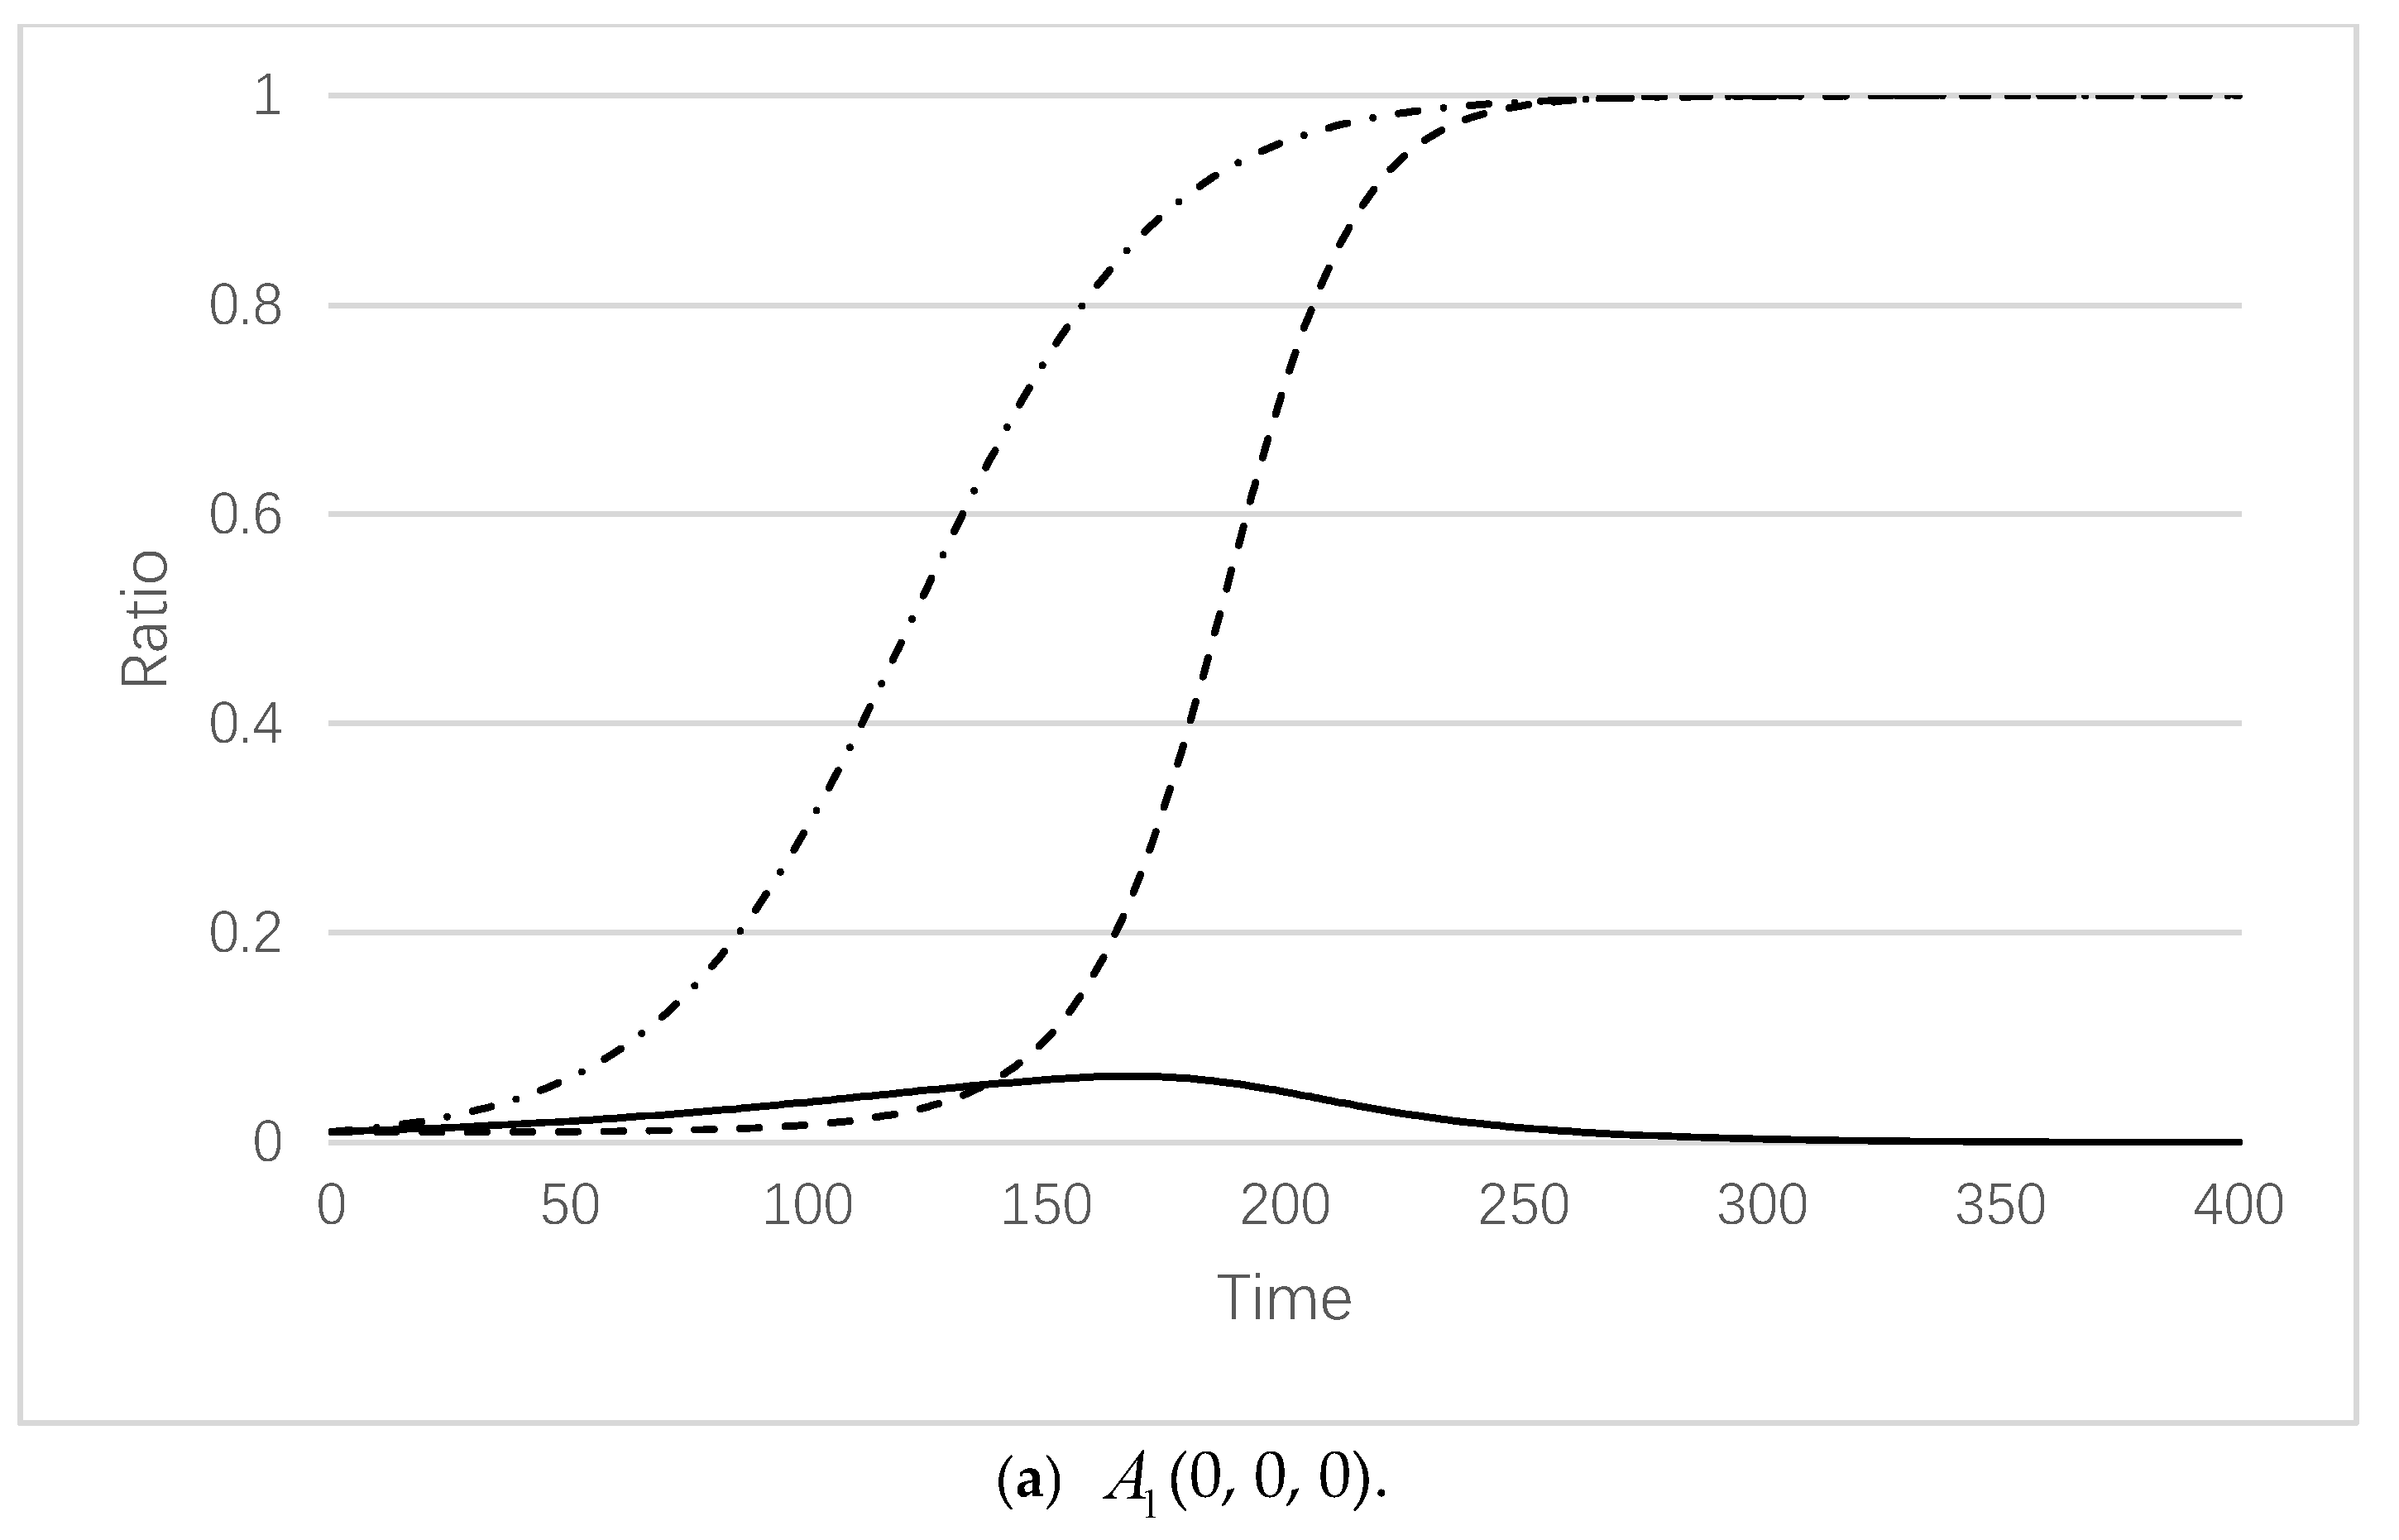
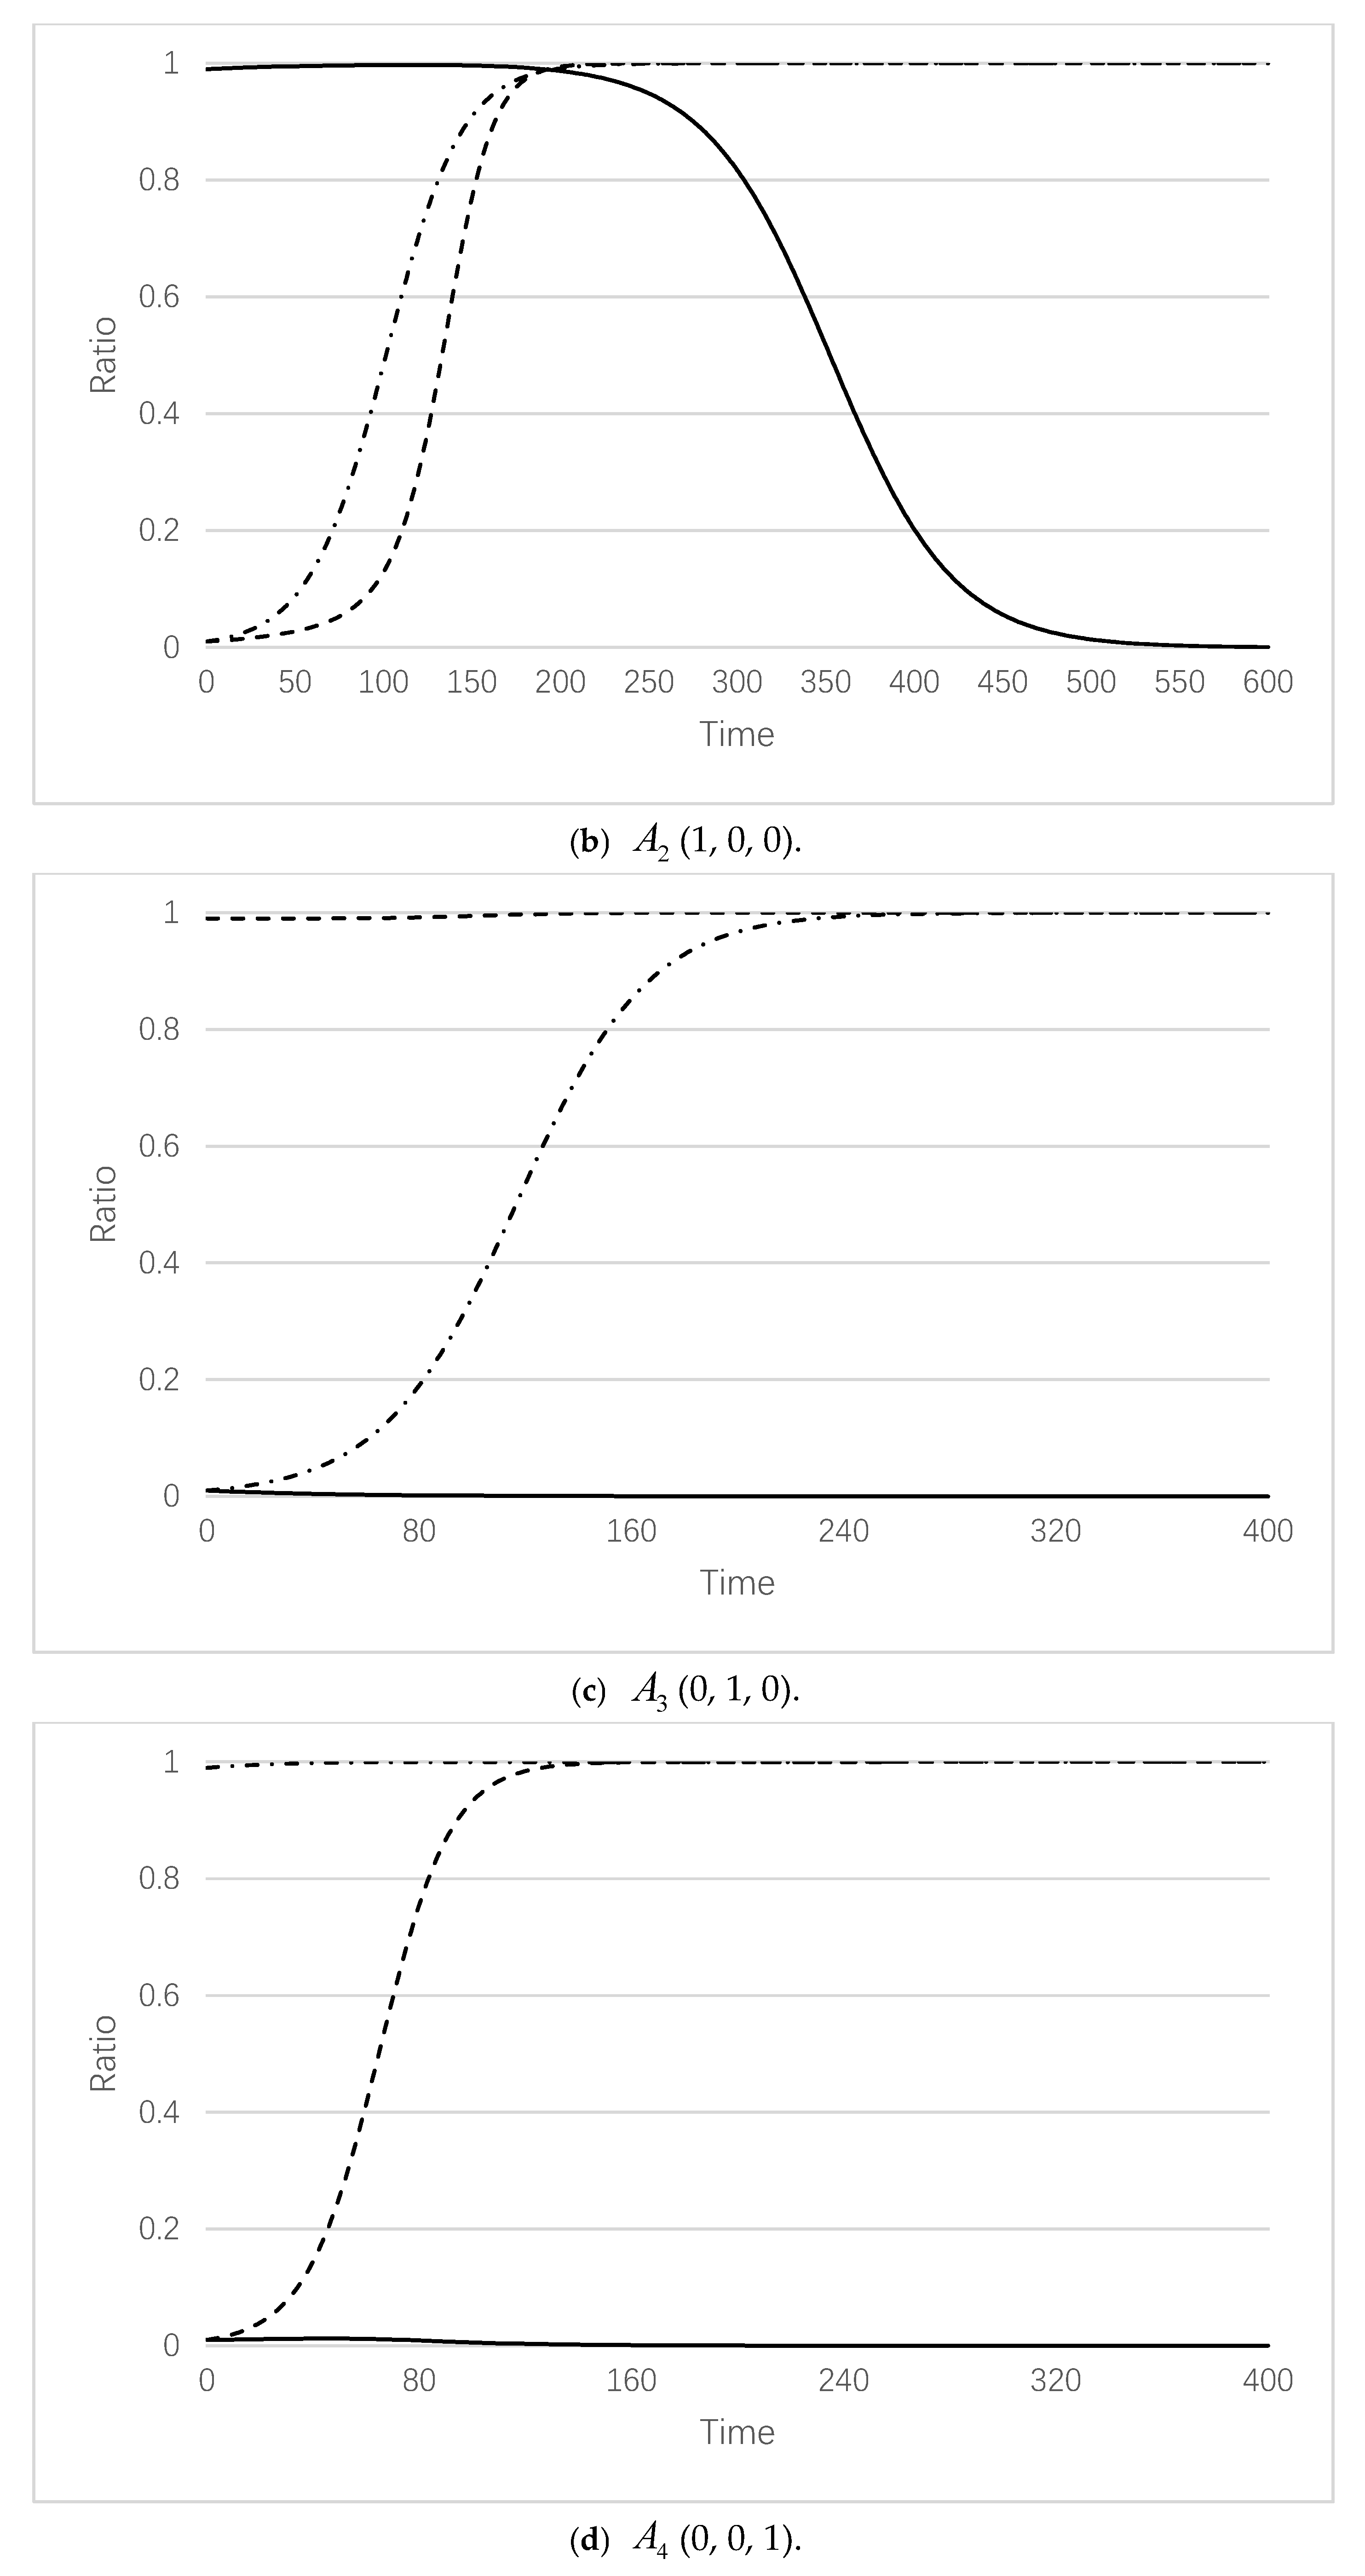
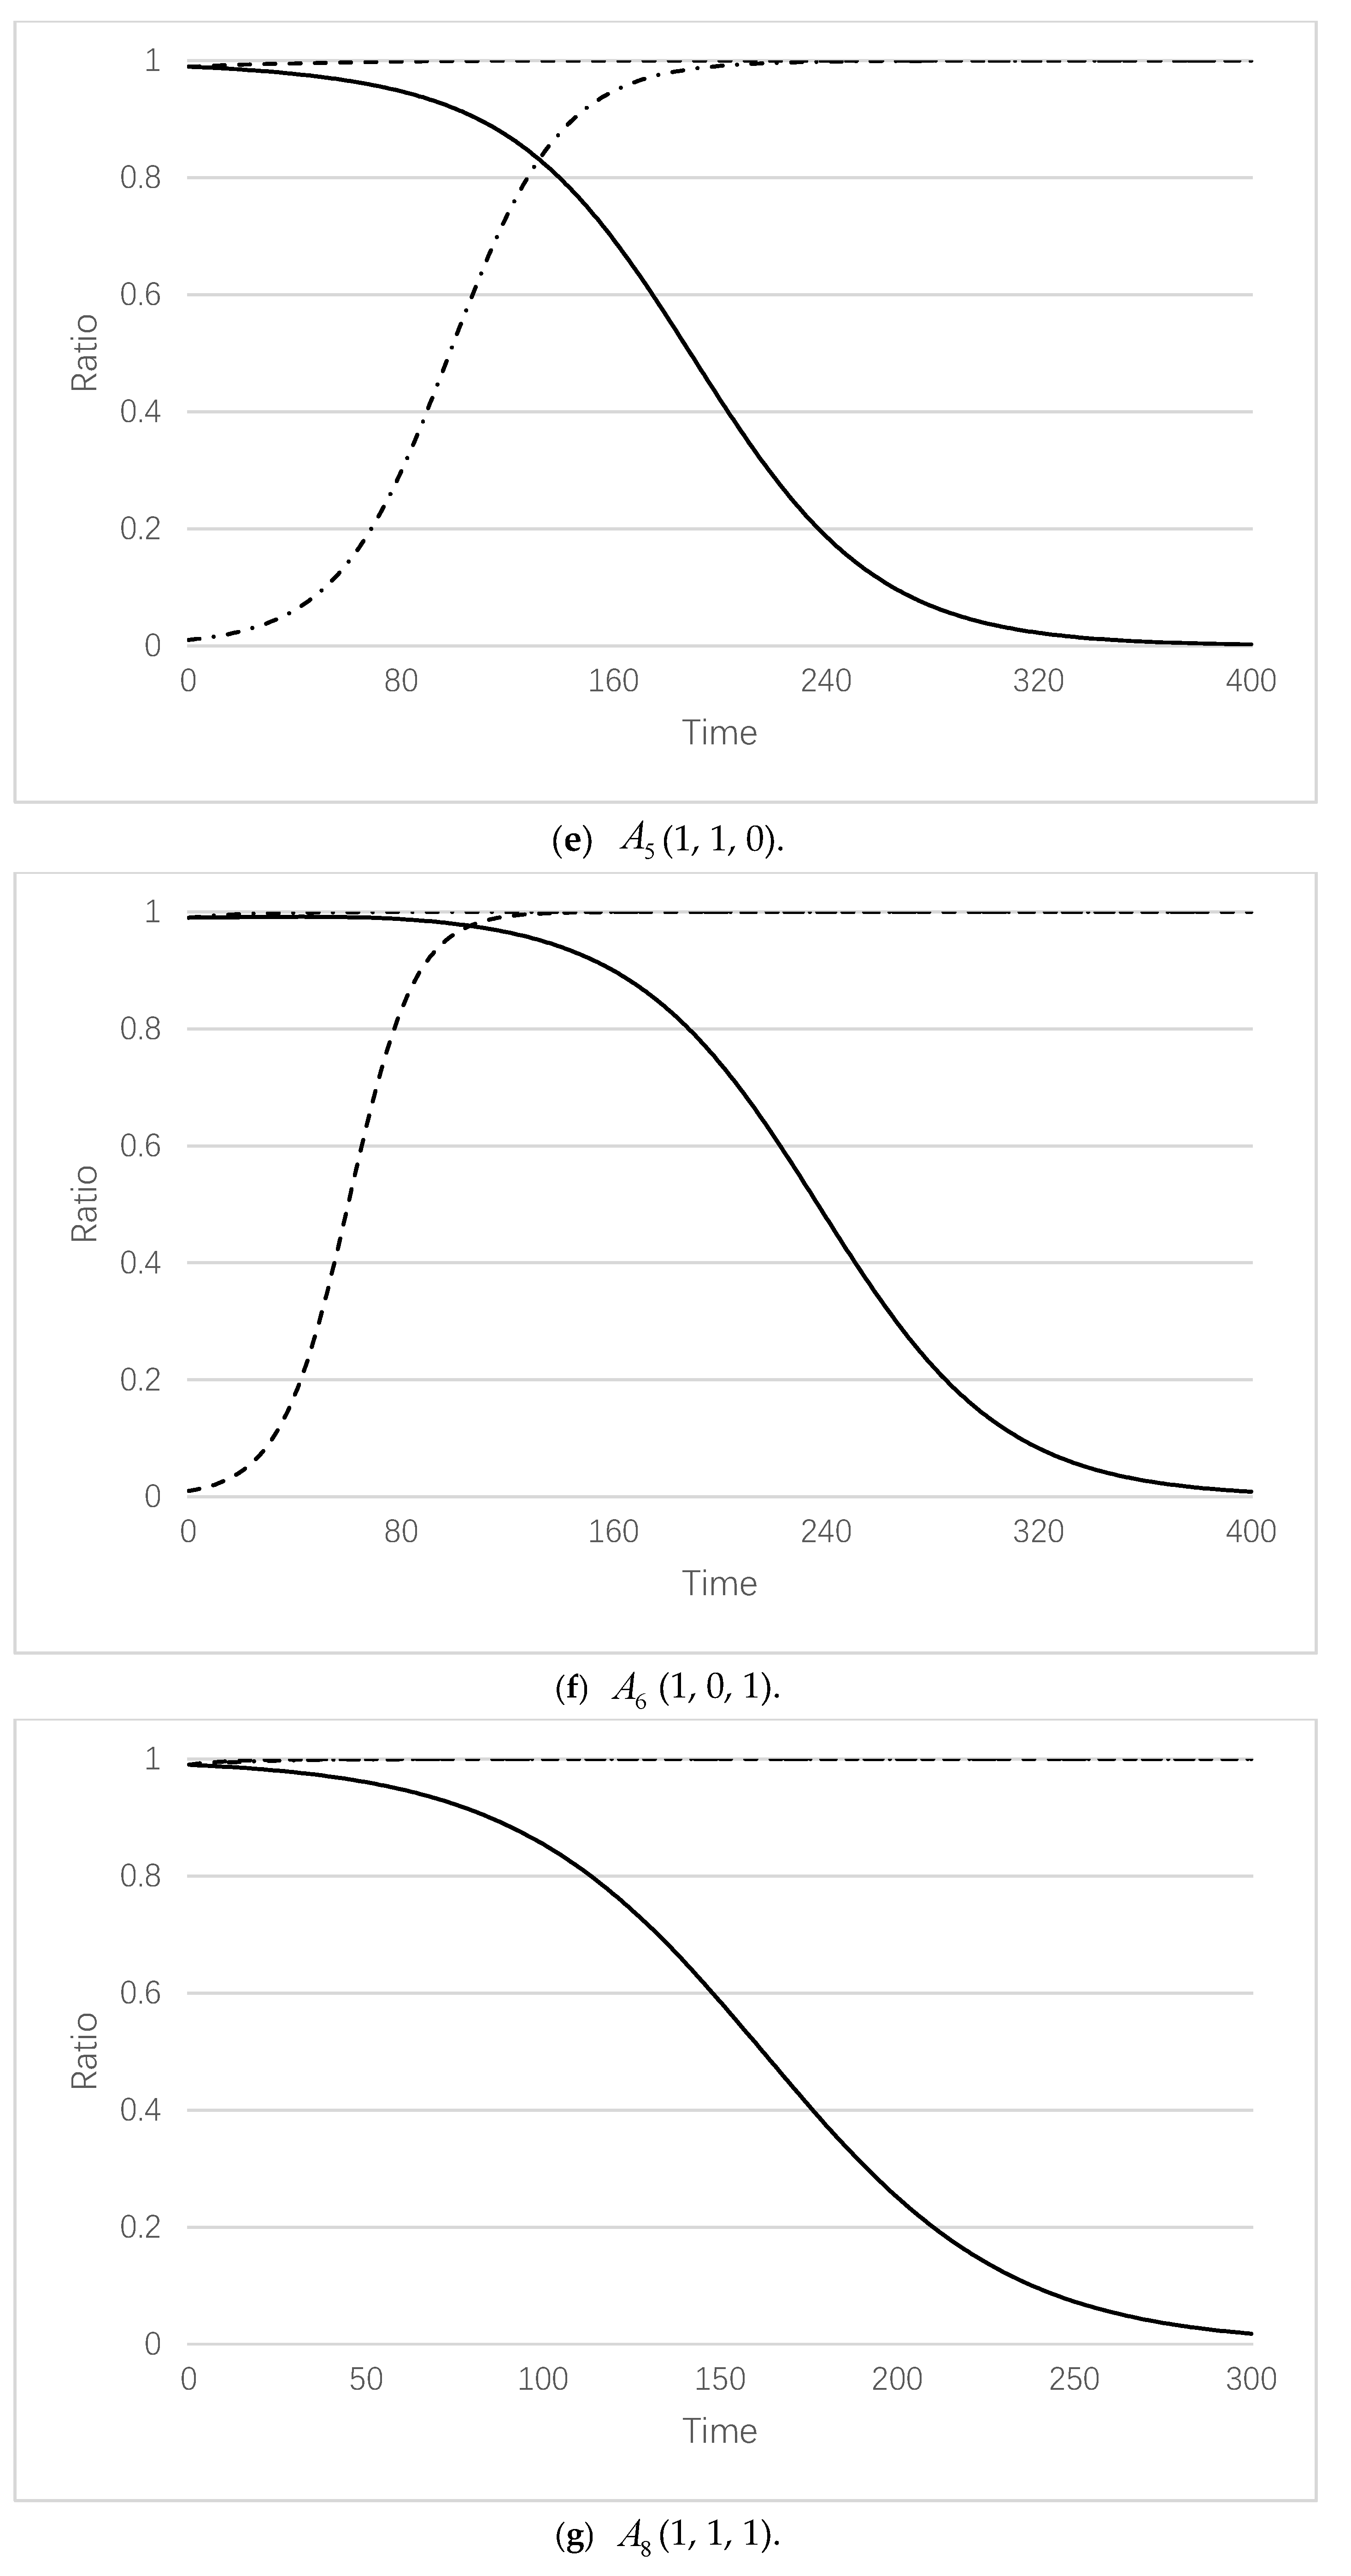
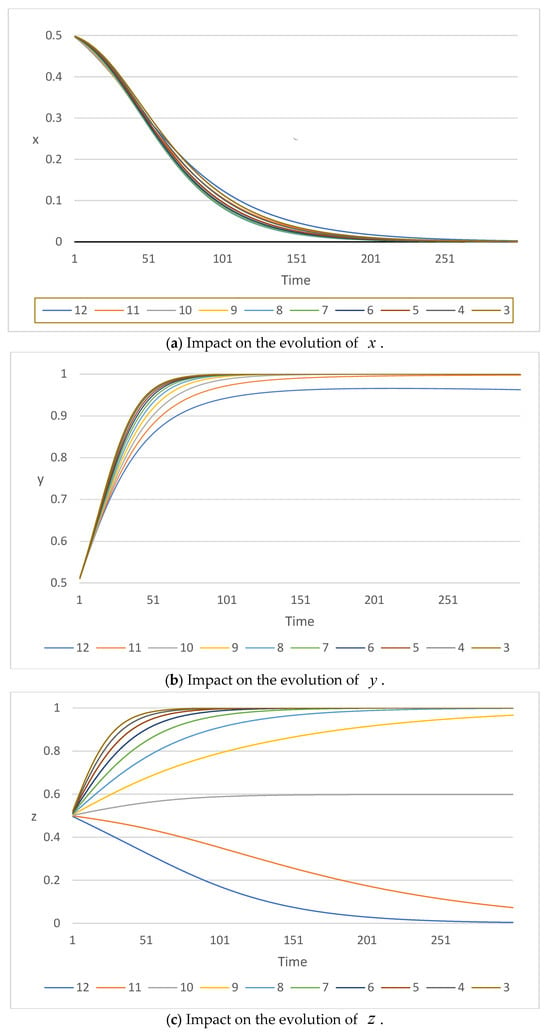
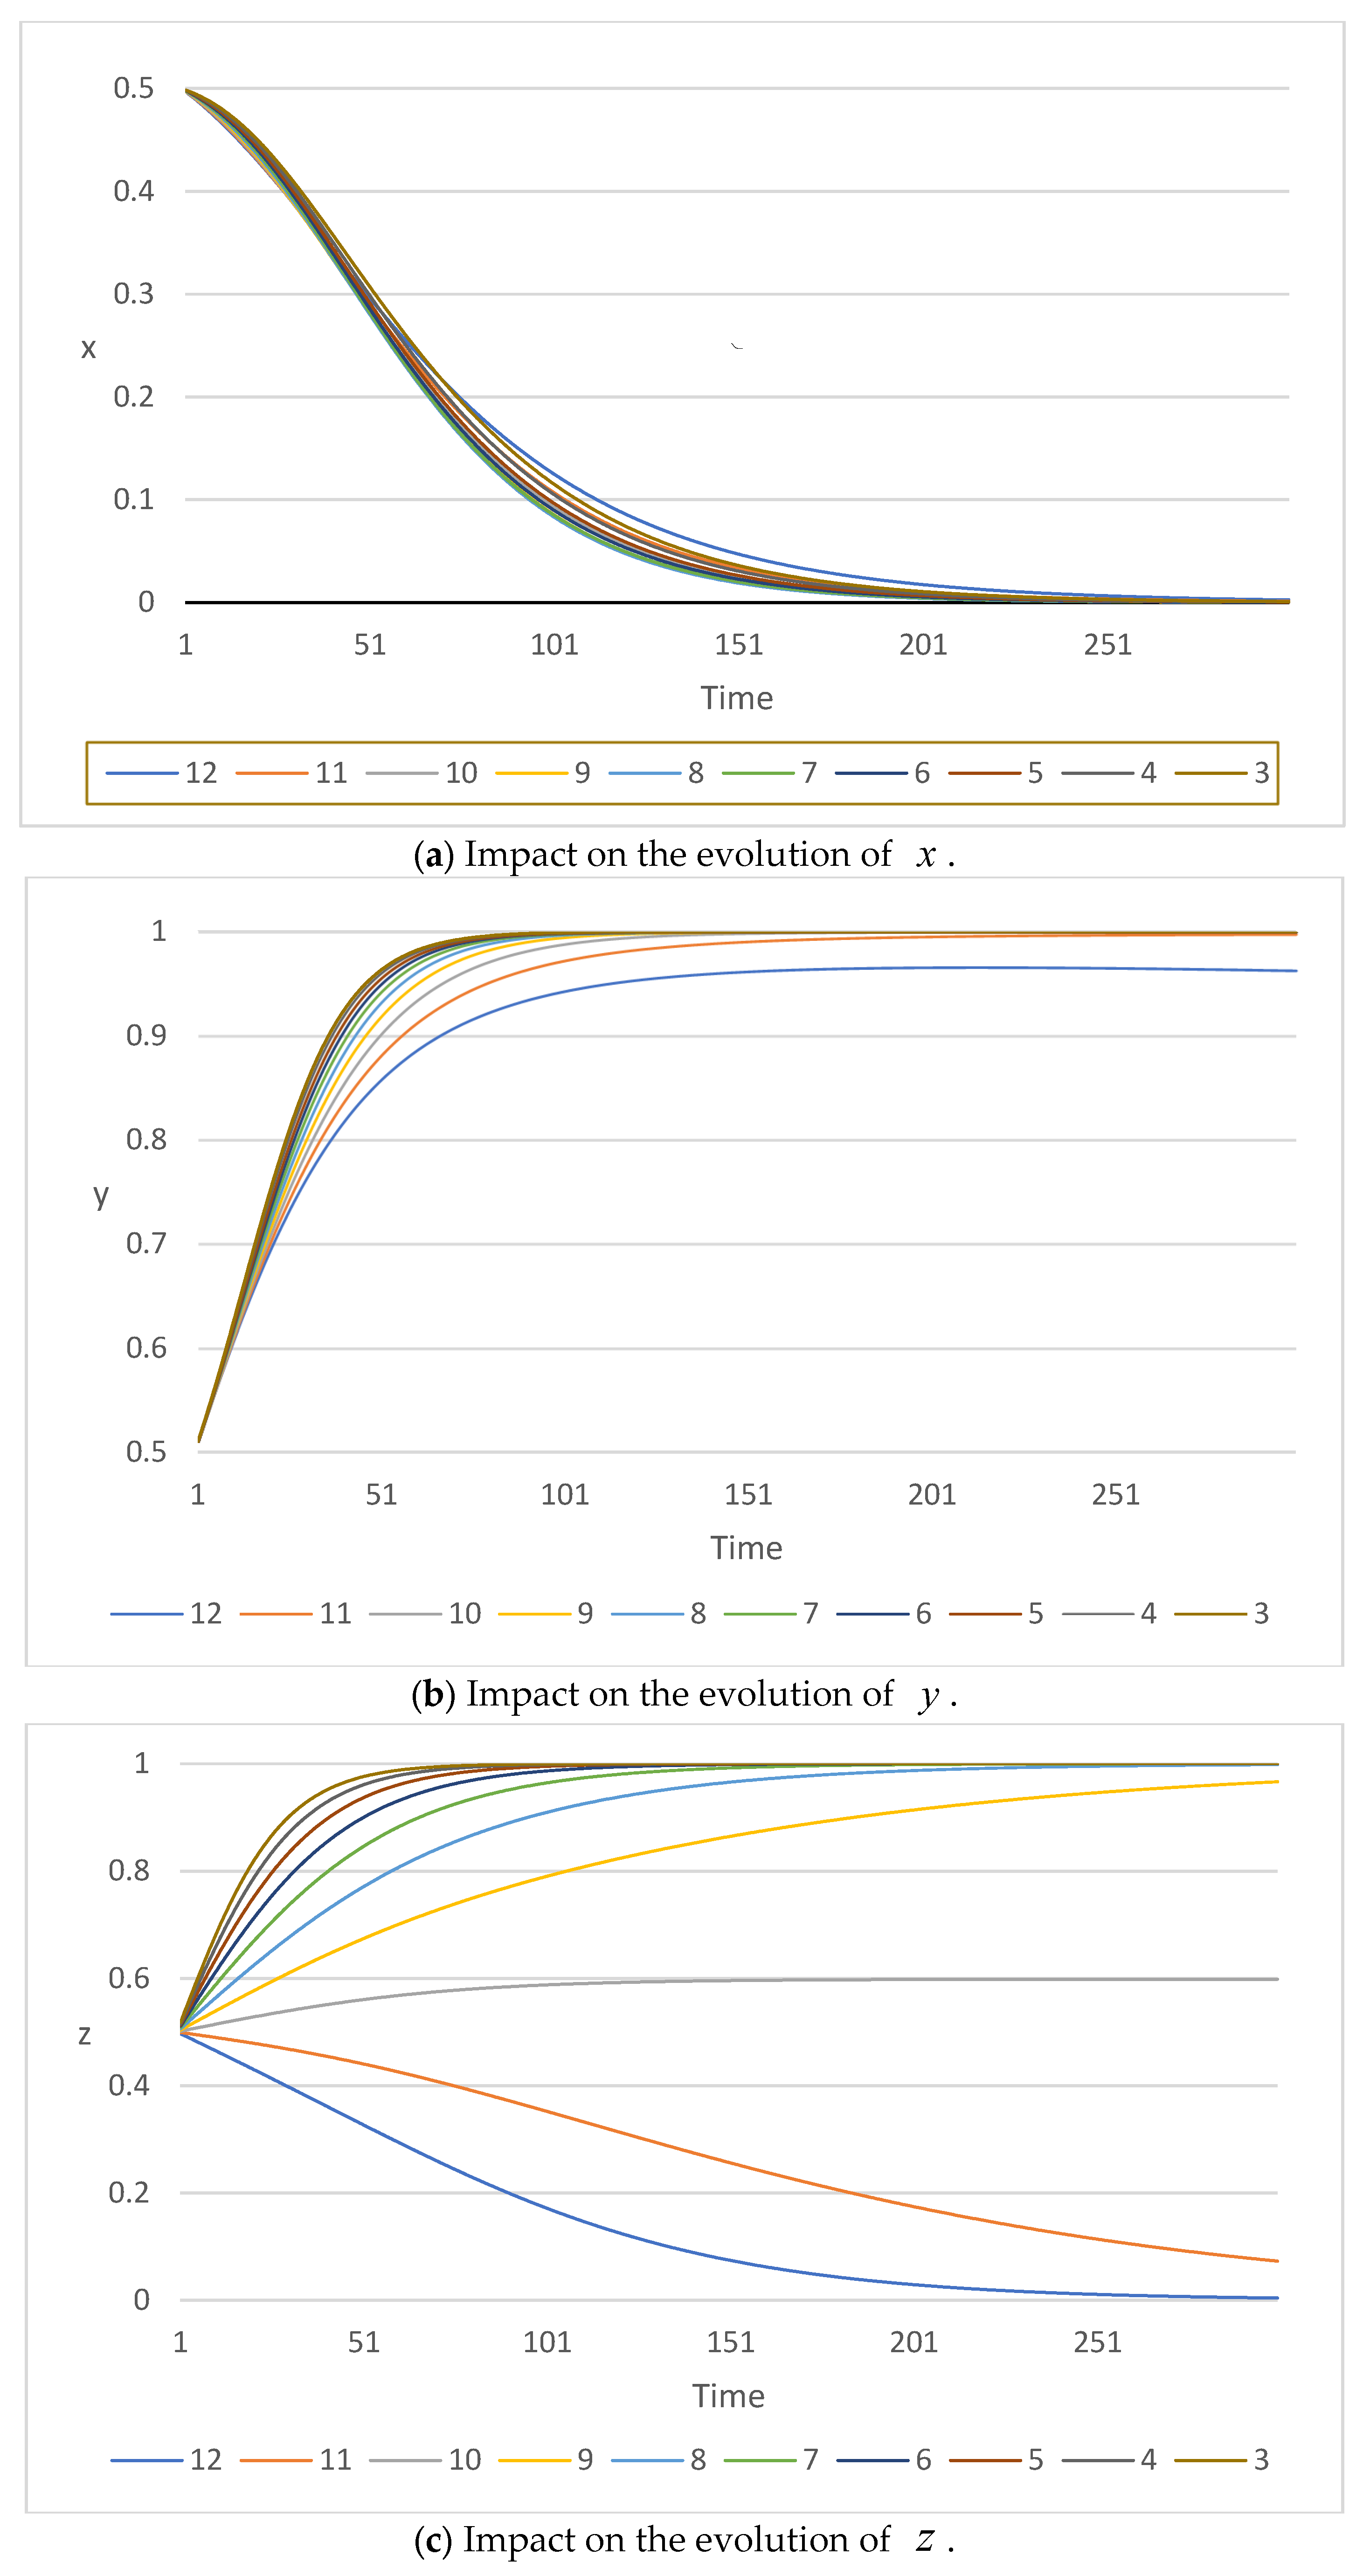
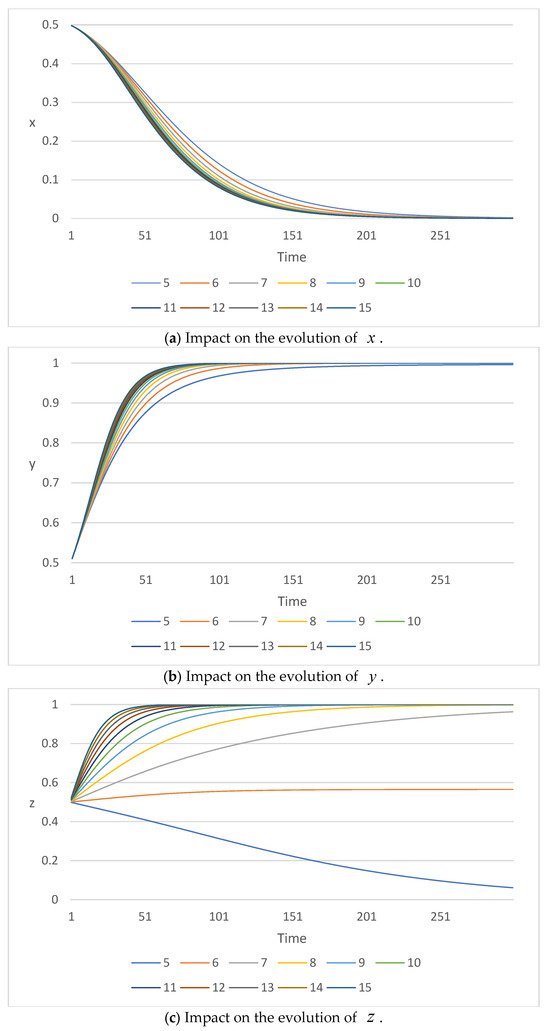
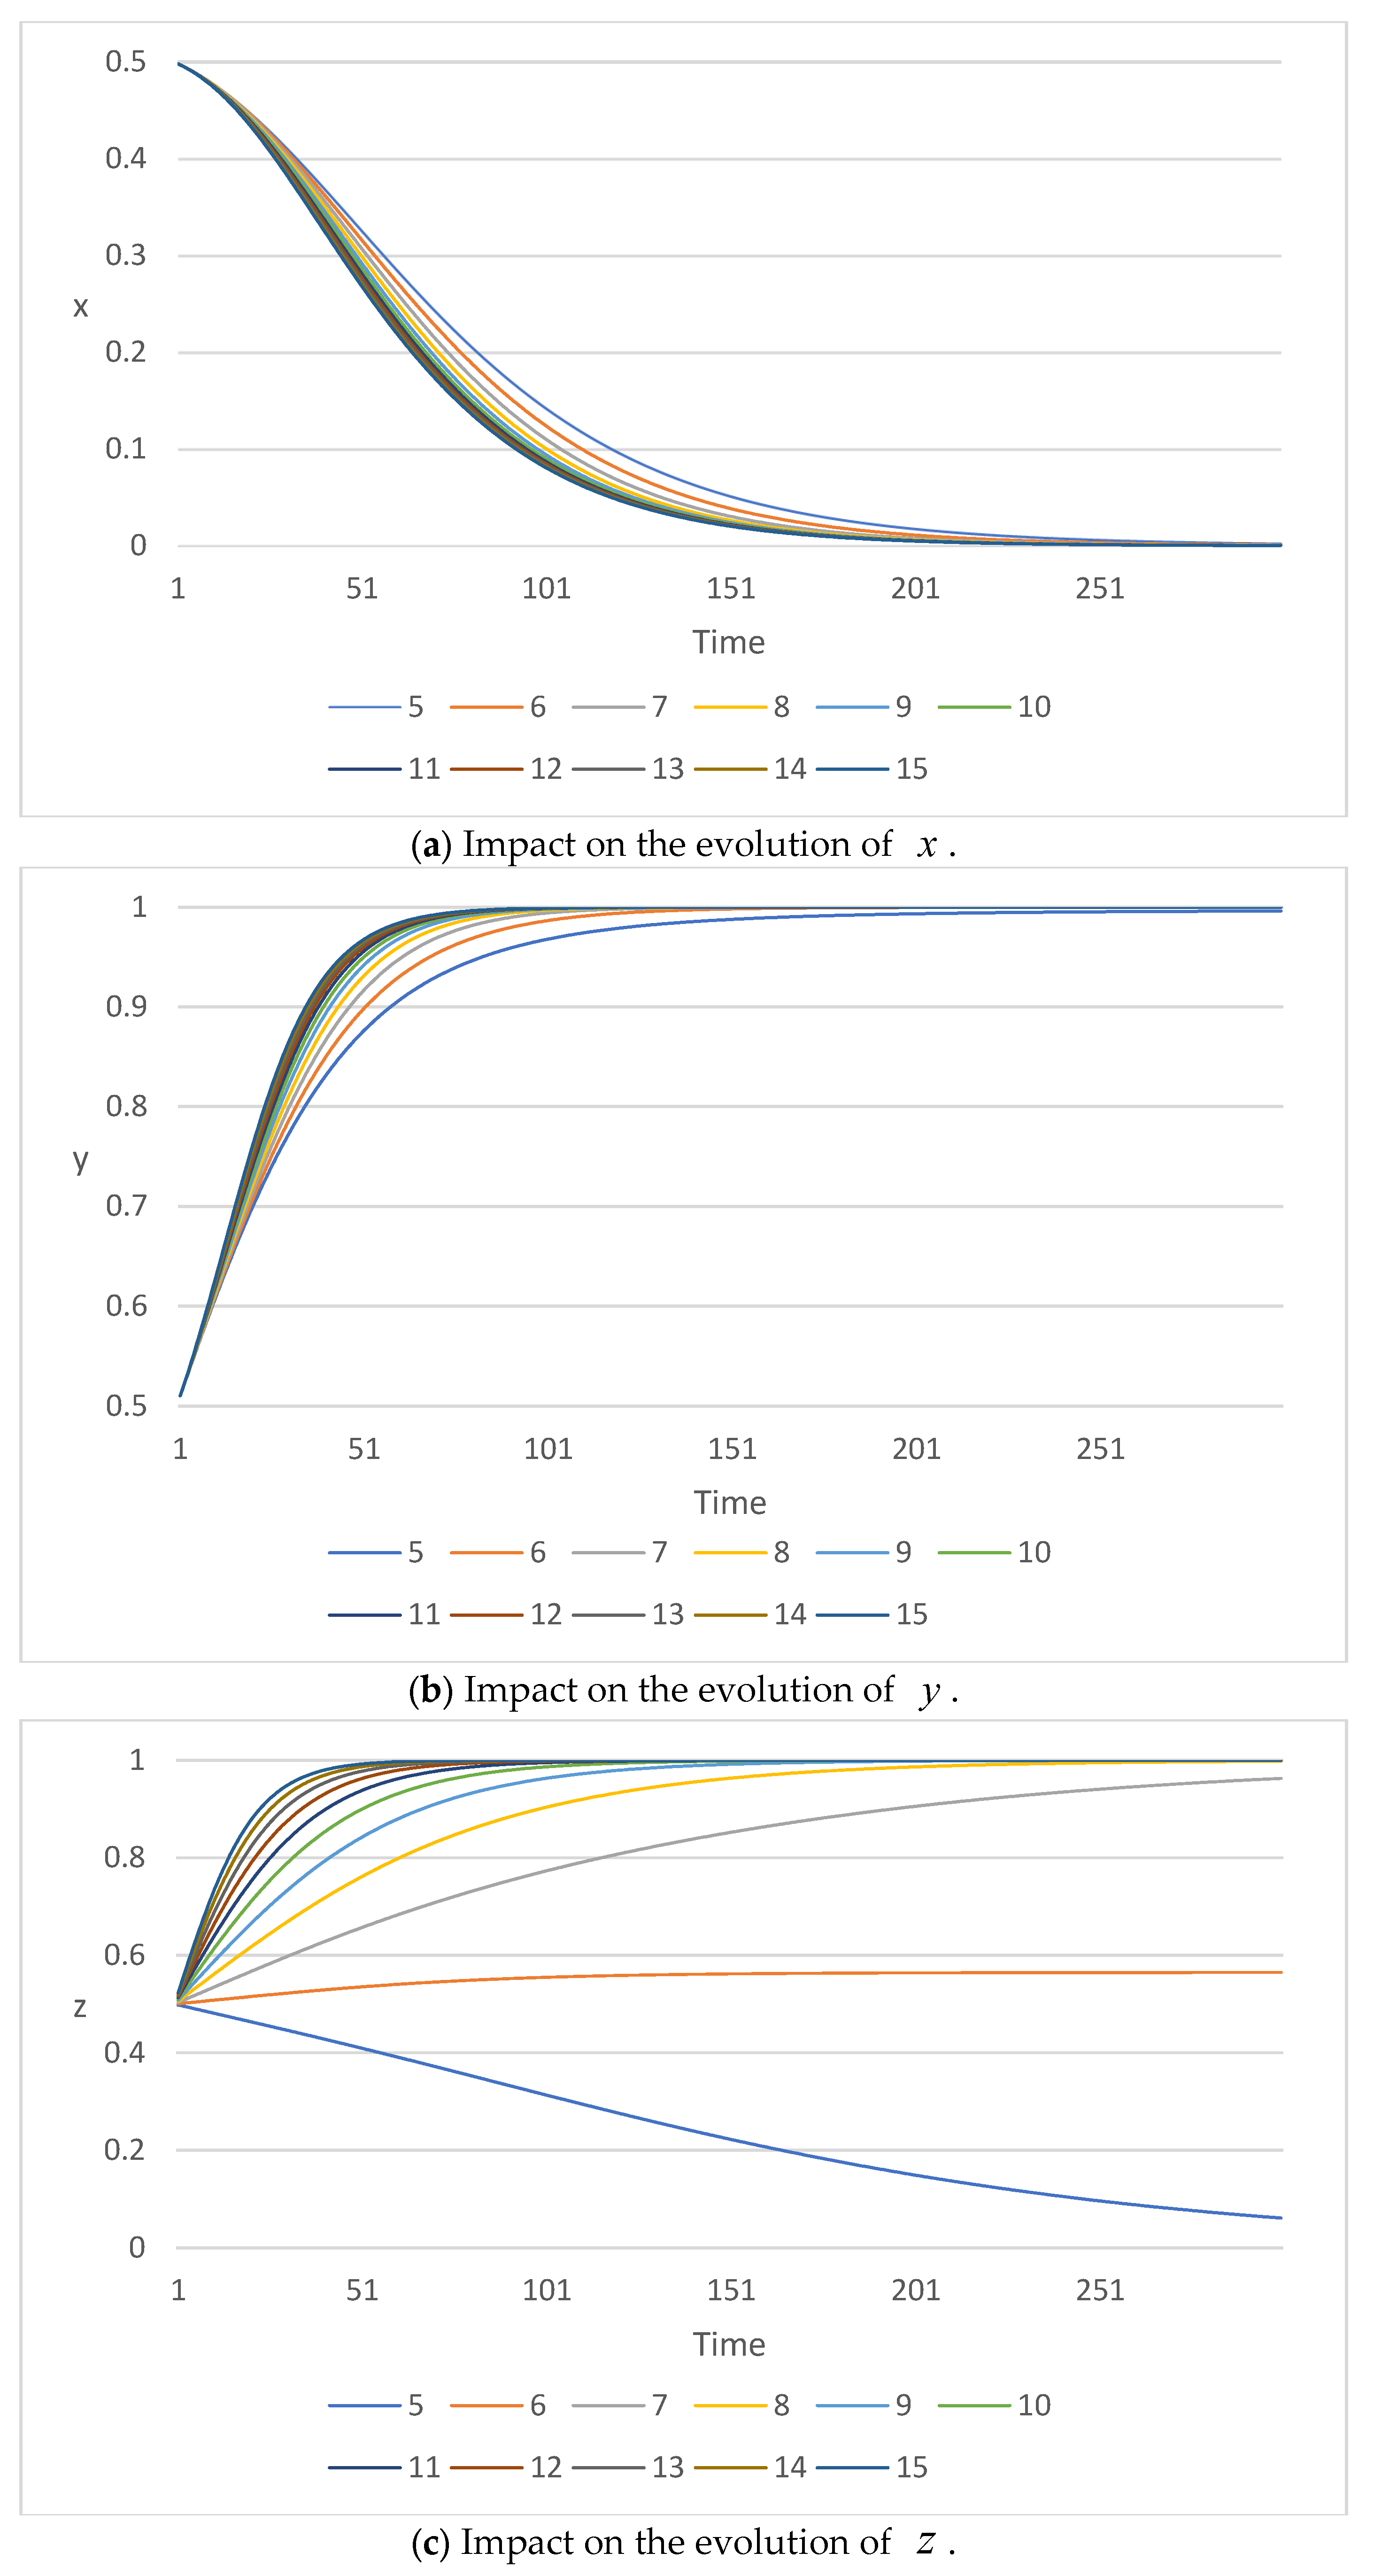

Disclaimer/Publisher’s Note: The statements, opinions and data contained in all publications are solely those of the individual author(s) and contributor(s) and not of MDPI and/or the editor(s). MDPI and/or the editor(s) disclaim responsibility for any injury to people or property resulting from any ideas, methods, instructions or products referred to in the content. |
© 2026 by the authors. Licensee MDPI, Basel, Switzerland. This article is an open access article distributed under the terms and conditions of the Creative Commons Attribution (CC BY) license.