


Abstract
Potassium is an essential nutrient for crop growth and plays a critical role in regulating water metabolism, facilitating photosynthate transport, and improving agricultural product quality. The precise management of potash fertilizer inputs is therefore vital for enhancing agricultural productivity and promoting sustainable resource use. Using panel data for 31 provinces in China from 2000 to 2024, obtained from the China Statistical Yearbook, this study integrates the Tapio decoupling model, stochastic frontier analysis (SFA), fixed-effects models, and an XGBoost–BiLSTM hybrid model to investigate the dynamic relationship, utilization efficiency, and driving mechanisms of potash fertilizer inputs and grain production. The results indicate that the relationship between potash fertilizer inputs and grain production has shifted from an expansive negative decoupling state—characterized by faster growth in fertilizer inputs than in output—to a strong decoupling state, where fertilizer inputs decline while grain production continues to increase. This transition exhibits a clear spatial gradient, with improvements from eastern to northeastern and central regions. Potassium use efficiency (KUE) shows a steady upward trend, with significant regional heterogeneity, characterized by higher efficiency in the south, lower efficiency in the north, and notable differentiation in western regions, largely driven by climatic and soil variations. Despite these improvements, substantial potential for reducing fertilizer inputs remains across provinces. Potash fertilizer inputs exert a significant positive effect on grain production, while the cultivation of potassium-intensive crops, such as sugar crops, tobacco, and fruits, is a key driver of regional demand. Model projections suggest that from 2025 to 2030, grain production will grow at an annual rate of 1.2–1.5%, while potash fertilizer inputs will decline by 2–4% annually, indicating a transition toward greener agricultural development. These findings highlight the need for region-specific fertilization strategies, optimized fertilizer structures, and improved soil nutrient monitoring systems to ensure food security and sustainability.
1. Introduction
Food security constitutes a foundational pillar of socioeconomic stability and human well-being [1,2]. Against the backdrop of accelerating climate change, increasingly constrained arable land, and escalating ecological pressures, sustaining growth in food production on a finite land base has emerged as one of the most pressing challenges facing global agriculture [3,4,5]. Among essential plant nutrients, potassium plays an irreplaceable physiological role in regulating plant water relations, enhancing photosynthate translocation, and improving crop quality, thereby exerting a direct and substantial influence on crop productivity and resilience [6,7,8].
Since the second half of the twentieth century, rapid population growth and rising food demand have markedly intensified agriculture’s dependence on chemical fertilizers [9,10]. Global potassium fertilizer consumption increased from less than 10 million tons in 1960 to approximately 38.8 million tons in 2024 [11,12]. However, potassium input levels vary enormously across regions due to differences in economic development, agrarian structure, and technological capacity. Using FAO data, Wang et al. [13] reported that during 2016–2020, the global average potassium application rate for cereal crops was only 27 kg ha−1, with values of 19 kg ha−1 in developed countries, 41 kg ha−1 in developing countries, and as low as 1.9 kg ha−1 in the least developed countries. In striking contrast, China’s potassium fertilizer input reached approximately 80 kg ha−1, far exceeding the global mean and underscoring a substantial anomaly in input intensity.
Potassium use efficiency (KUE) likewise exhibits pronounced spatial differentiation. Dhillon et al. [14] estimated that the global average KUE for cereal crops remains below 30%. While advanced regions such as North America and Western Europe have achieved utilization rates exceeding 60% through precision fertilization and scientifically informed management practices, KUE in many developing countries remains below 25% due to imbalanced nutrient application regimes and extensive field management practices. Excessive potassium application not only generates substantial resource waste but also exacerbates soil acidification and aquatic eutrophication, thereby imposing increasing ecological externalities [6,15,16].
As the world’s largest grain producer, China has realized sustained and stable growth in grain output since the initiation of economic reforms [17,18], a trajectory that has relied heavily on increasing fertilizer inputs, including potassium. Between 2000 and 2015, China’s potassium fertilizer consumption increased from 3.66 to 6.42 million tons, accounting for roughly 17% of global use during the same period [15], thereby revealing a structural pattern of “high input–low efficiency” production. More critically, China possesses only about 2% of the world’s proven potassium reserves, and its external dependence on potassium fertilizer imports has persistently exceeded 50% [7,19]. This pronounced import reliance renders domestic supply highly vulnerable to geopolitical shocks and volatility in international markets, thereby posing a substantial yet latent threat to national food security.
In recent years, policy initiatives such as the “Zero Growth of Fertilizer Use” and the “Fertilizer Reduction Action Plan” have driven a continuous decline in China’s total fertilizer inputs since 2015, signaling a structural transition from high-input expansion toward a quality-oriented development pathway emphasizing efficiency and input optimization [10,20,21]. Accumulating evidence indicates that scientifically guided fertilization combined with precision management can maintain high and stable yields while reducing fertilizer inputs. Using nationwide microdata from millions of smallholder farmers, Yin et al. [22] demonstrated that scientific fertilization coupled with technical guidance can simultaneously reduce fertilizer use and sustain high grain yields. Zhao et al. [12] further showed that optimized nutrient management and cropping systems can maintain yield stability under an average annual fertilizer reduction rate of approximately 1.5%.
However, despite these advances, a critical limitation persists. Existing studies overwhelmingly concentrate on the aggregate relationship between total fertilizer inputs and grain output, while systematic, nutrient-specific quantification of the mechanisms linking potassium fertilizer inputs to grain production remains notably absent. In particular, little is known about (i) whether and to what extent potassium inputs have decoupled from grain output growth, (ii) how potassium use efficiency varies across space and time, (iii) which structural and agronomic factors drive regional potassium demand, and (iv) whether future grain production can be sustained under declining potassium input trajectories. This lack of targeted evidence severely limits the development of rational, region-specific potassium fertilization strategies and weakens the empirical foundation for reconciling food security with an agricultural green transition.
The Tapio decoupling model is employed to characterize the dynamic coupling and decoupling states between potash fertilizer inputs and grain production, thereby providing a macro-level perspective on the evolution of agricultural sustainability [23]. Stochastic frontier analysis (SFA) enables a precise assessment of potassium use efficiency by disentangling random shocks from technical inefficiency. The fixed-effects model controls for time-invariant regional heterogeneity, allowing for the identification of structural factors influencing both grain output and fertilizer inputs. Furthermore, the XGBoost–BiLSTM hybrid deep learning framework captures complex nonlinear relationships and temporal dependencies within the agricultural system, significantly enhancing the accuracy and generalizability of future trend predictions.
In summary, based on panel data for 31 provinces in China from 2000 to 2024, this study integrates the Tapio decoupling model, stochastic frontier analysis, fixed-effects modeling, and an XGBoost–BiLSTM hybrid framework to systematically examine the decoupling relationship, utilization efficiency, and driving mechanisms of potash fertilizer inputs and grain production, as well as to forecast their trends for the period 2025–2030. By jointly incorporating input dynamics, utilization efficiency, and future trajectories, this study provides robust empirical evidence for the formulation of region-specific potash fertilizer management strategies, and offers policy insights for balancing grain production growth with efficient resource use and long-term agricultural sustainability.
2. Materials and Methods
2.1. Data Sources
All data used in this study were obtained from the China Statistical Yearbook 2001–2025 (http://www.stats.gov.cn). The study covers 31 provincial-level administrative units in mainland China (excluding Hong Kong, Macao, and Taiwan). Missing observations were imputed using linear interpolation in Stata 18 to maintain the completeness and continuity of the panel dataset, a balanced panel dataset was constructed for subsequent decoupling analysis, efficiency evaluation, econometric modeling, and machine-learning forecasting. The selected indicators include the following:
- Outputs of major agricultural products (grain, cotton, oil crops, fiber crops, sugar crops, tobacco, tea, and fruit);
- Sown area of grain crops;
- Input amounts of nitrogen (N), phosphorus (P), and potassium (K) fertilizers;
- Compound fertilizer inputs;
- Total agricultural machinery power;
- Effective irrigated area of cultivated land.
To ensure consistency and comparability, fertilizer input variables were measured in nutrient-equivalent terms using the standardized statistical definitions reported in the China Statistical Yearbook. Specifically, fertilizer use was recorded as the amount of agricultural chemical fertilizer applied after conversion to pure nutrient content, including nitrogen (N), phosphorus (P2O5), and potassium (K2O). This approach reduces potential bias caused by differences in fertilizer types and nutrient concentrations across regions and over time.
To investigate regional heterogeneity in potassium fertilizer inputs under different levels of economic development, the 31 provincial units were classified into four major economic regions—eastern, central, western, and northeastern China—based on the regional development criteria issued by the Development Research Center of the State Council of China (Table 1). This regional grouping framework was used consistently throughout the empirical analysis to identify spatial gradients, structural differences, and region-specific driving mechanisms of potassium fertilizer use.
Table 1.
Classification of Four Major Chinese Economic Regions.
2.2. Research Methods
2.2.1. Tapio Decoupling Model
The Tapio decoupling model is a widely used analytical framework for evaluating the relationship between economic growth and resource consumption or environmental pressure [24,25]. To examine the coupling between potassium fertilizer inputs and grain production, we applied this model and identified the decoupling status by calculating the decoupling elasticity coefficient [26], which is defined as
where e denotes the decoupling elasticity coefficient; GUAt and GUAt−1 represent grain output per unit area in the current and base periods, respectively; PFUt and PFUt−1 denote potassium fertilizer input per unit area in the current and base periods, respectively; and and represent the changes in grain output and potassium fertilizer input between two consecutive periods, respectively.
Based on the value of the decoupling elasticity coefficient and the directional changes in grain output and potassium fertilizer inputs, the decoupling relationship was classified into three major categories—decoupling, coupling, and negative decoupling—and further subdivided into eight specific states [27]. The detailed classification criteria are presented in Table 2.
Table 2.
Classification Criteria for Decoupling States.
From the perspective of agricultural sustainable development, strong decoupling represents the most desirable state, characterized by a reduction in potassium fertilizer input alongside continued growth in grain output. This reflects the goal of green development—achieving higher agricultural productivity with lower resource inputs. In contrast, strong negative decoupling represents the least desirable state, where grain output declines despite increased potassium fertilizer input. This indicates that agricultural production fails to generate proportional output returns from increased input, leading to resource waste and greater environmental pressure. It reflects a significant deterioration in input–output efficiency and poses a serious challenge to the green transformation and sustainable development of agriculture.
2.2.2. Stochastic Frontier Analysis (SFA)
Stochastic frontier analysis (SFA) is a parametric efficiency evaluation method that specifies the functional form of a production or cost function in advance and decomposes the composite error term into a stochastic disturbance component and a non-negative technical inefficiency term, thereby enabling the quantitative identification of the relative technical efficiency of decision-making units [28,29]. Technical efficiency reflects the ability of a decision-making unit to achieve an optimal input–output allocation under given technological constraints, that is, the extent to which maximum output can be obtained from a fixed input level or a given output can be produced with minimal inputs [30,31]. The core SFA specification is expressed as
where represents the observed output of decision unit i at time t; denotes the theoretical maximum attainable output given the input vector , i.e., the production frontier; is the stochastic disturbance term capturing measurement errors and uncontrollable random shocks, assumed to follow a normal distribution ; and is a non-negative technical inefficiency term that measures the deviation of observed output from the production frontier [32,33,34,35].
In this study, the stochastic production frontier was specified in the Cobb–Douglas functional form, which is widely adopted in agricultural efficiency research and avoids potential multicollinearity issues associated with transcendental logarithmic functions [36,37]. Since potassium fertilizer inputs are included within the total chemical fertilizer metric, multicollinearity among explanatory variables was examined, and all variance inflation factors (VIFs) were found to be below commonly accepted thresholds, indicating the statistical robustness of the model specification.
Based on this framework, an input-oriented, time-varying decay model was employed to capture the dynamic evolution of technical efficiency. The stochastic frontier production function for potassium use efficiency was specified as
where i = 1, 2, …, n denotes the decision-making units; t denotes time; is the grain output per unit area of unit i at time t; Kit, Wit, and represent potassium fertilizer inputs, irrigated area, agricultural machinery input, and total fertilizer inputs, respectively; and β0~β4 are the parameters to be estimated.
The technical inefficiency term μit was modeled using a time-varying decay specification:
where μit is the unit-specific baseline inefficiency, η is the decay parameter representing the temporal trend of technical inefficiency, and T denotes the final period of the sample [38,39].
Based on the stochastic frontier model estimates, KUE was calculated as
Substituting Equation (4) into Equation (5) yields
where represents the ratio of the minimum feasible optimal potassium input to the actual input , with a theoretical range of (0, 1]. Values approaching 1 indicate higher efficiency [32,33].
KUE directly determines the potential for input reduction. Accordingly, the feasible reduction ratio of potassium inputs REit was defined as
The corresponding feasible reduction in potassium input can then be calculated as
In this framework, RE quantifies the amount by which actual potassium fertilizer application can be safely reduced without compromising the frontier output level, thereby providing an empirical basis for precision fertilization strategies.
2.2.3. Fixed-Effects Model
The fixed-effects model controls for time-invariant individual heterogeneity in panel data, effectively mitigating omitted variable bias and enabling the precise estimation of the causal effects of explanatory variables on the dependent variable [30,40]. In this study, four estimation approaches were applied for comparative analysis: pooled ordinary least squares (POLSs), individual fixed effects (FEs), random effects (REs), and two-way fixed effects (TWFEs) [41,42]. The corresponding model specifications are as follows:
Equations (9)–(12) correspond to POLS, FE, RE, and TWFE models, respectively. Here, i = 1, 2, …, n, denotes the provincial units; t = 1, 2, …, T represents the time periods; and Yit is the dependent variable, representing grain output in province i at year t; α is the overall intercept. In the FE model, represents the unit-specific fixed effect, while in the RE model, it is assumed to follow a normal distribution N (0, ) and is uncorrelated with the explanatory variables. denotes the time fixed effect, capturing common temporal trends across all provinces. Xkit represents the k-th explanatory variable (e.g., potassium fertilizer input, nitrogen fertilizer input, irrigated area, etc.), βki is the corresponding regression coefficient, and uit is the stochastic error term, assumed to follow N (0, ) [42,43,44].
2.2.4. XGBoost-BiLSTM
The accurate prediction of potassium fertilizer inputs and grain output provides a quantitative basis for analyzing the driving mechanisms of potassium use in grain production. While traditional econometric models capture linear relationships between variables, they are limited in representing the complex nonlinearities and temporal dependencies inherent in agricultural production systems. To address this limitation, an XGBoost-BiLSTM hybrid deep learning model was developed to enhance predictive accuracy and generalization capability.
XGBoost (eXtreme Gradient Boosting) is a highly efficient gradient boosting decision tree algorithm [45], which iteratively integrates multiple weak learners to construct a strong learner [46]. The algorithm incorporates a regularization term in the objective function to control model complexity and prevent overfitting. BiLSTM (Bidirectional Long Short-Term Memory) is a bidirectional recurrent neural network architecture composed of forward and backward LSTM layers, capable of capturing both forward and backward temporal dependencies in time-series data [47].
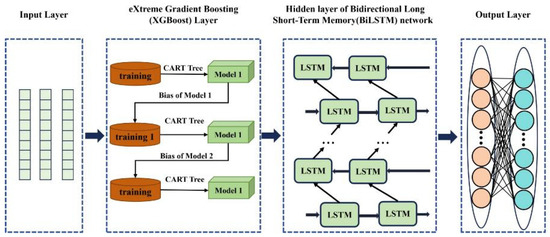
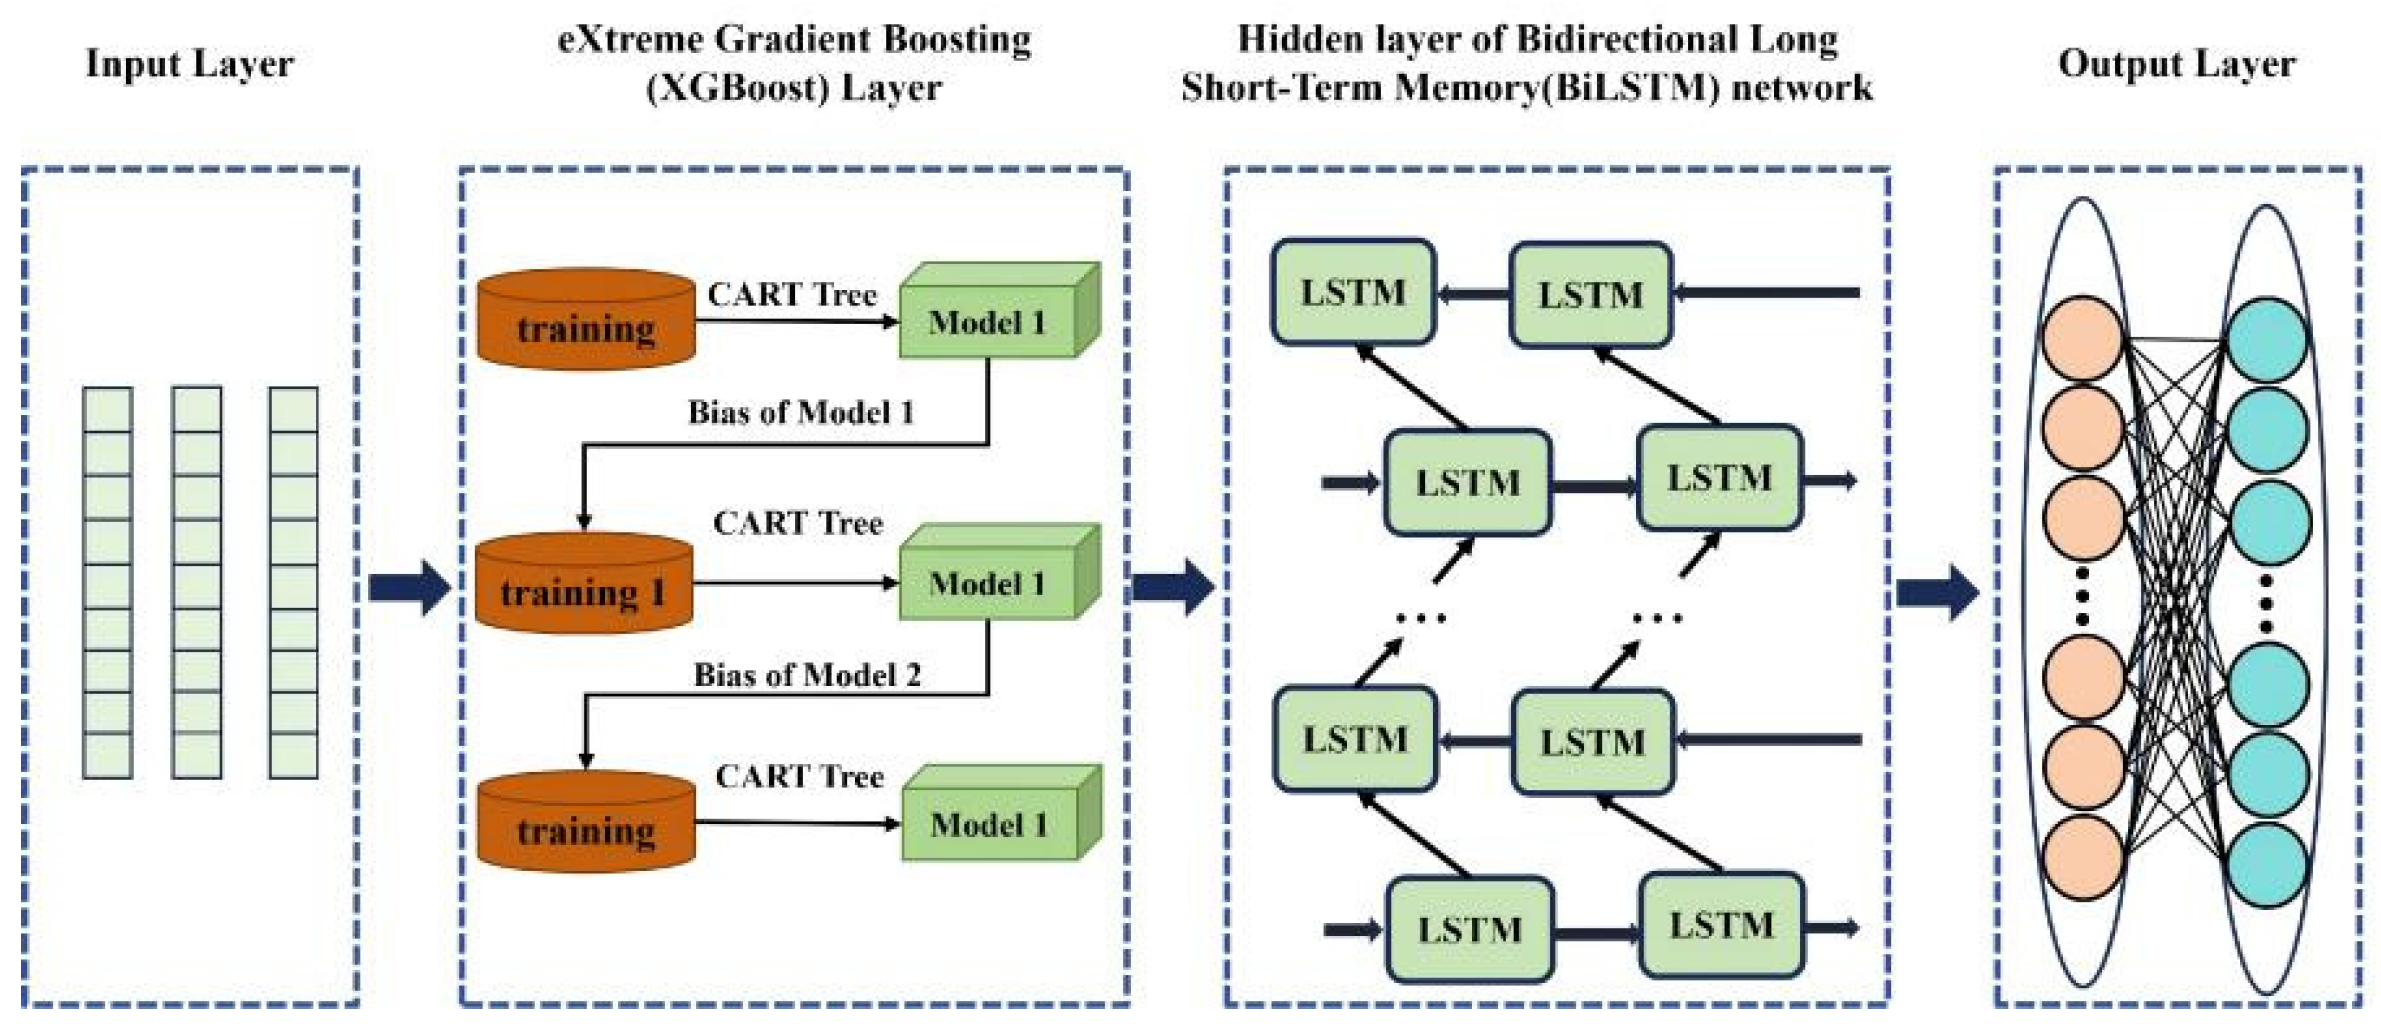
The XGBoost-BiLSTM hybrid model employs a hierarchical ensemble structure, integrating the feature extraction and selection strength of XGBoost with the temporal modeling capability of BiLSTM, thereby overcoming the limitations of single-model approaches [48]. This architecture effectively captures complex nonlinear relationships and dynamic temporal patterns in agricultural production data, providing technical support for precise prediction of potassium fertilizer inputs and grain output. The structure of the XGBoost-BiLSTM model used in this study is illustrated in Figure 1.
Figure 1.
Schematic Architecture of the XGBoost-BiLSTM.
3. Results
3.1. Decoupling Relationship Between Potassium Fertilizer Inputs and Grain Output
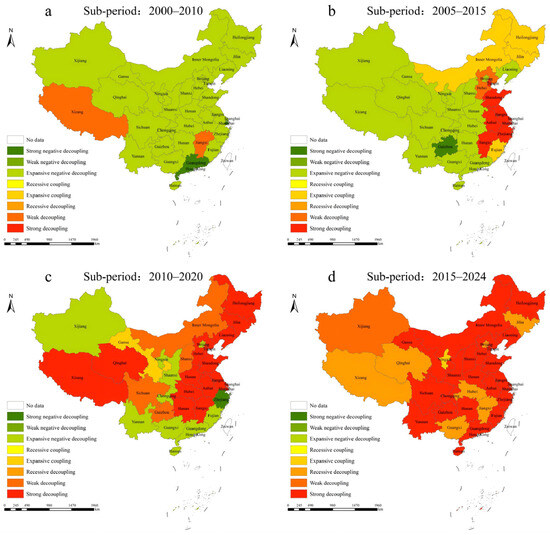
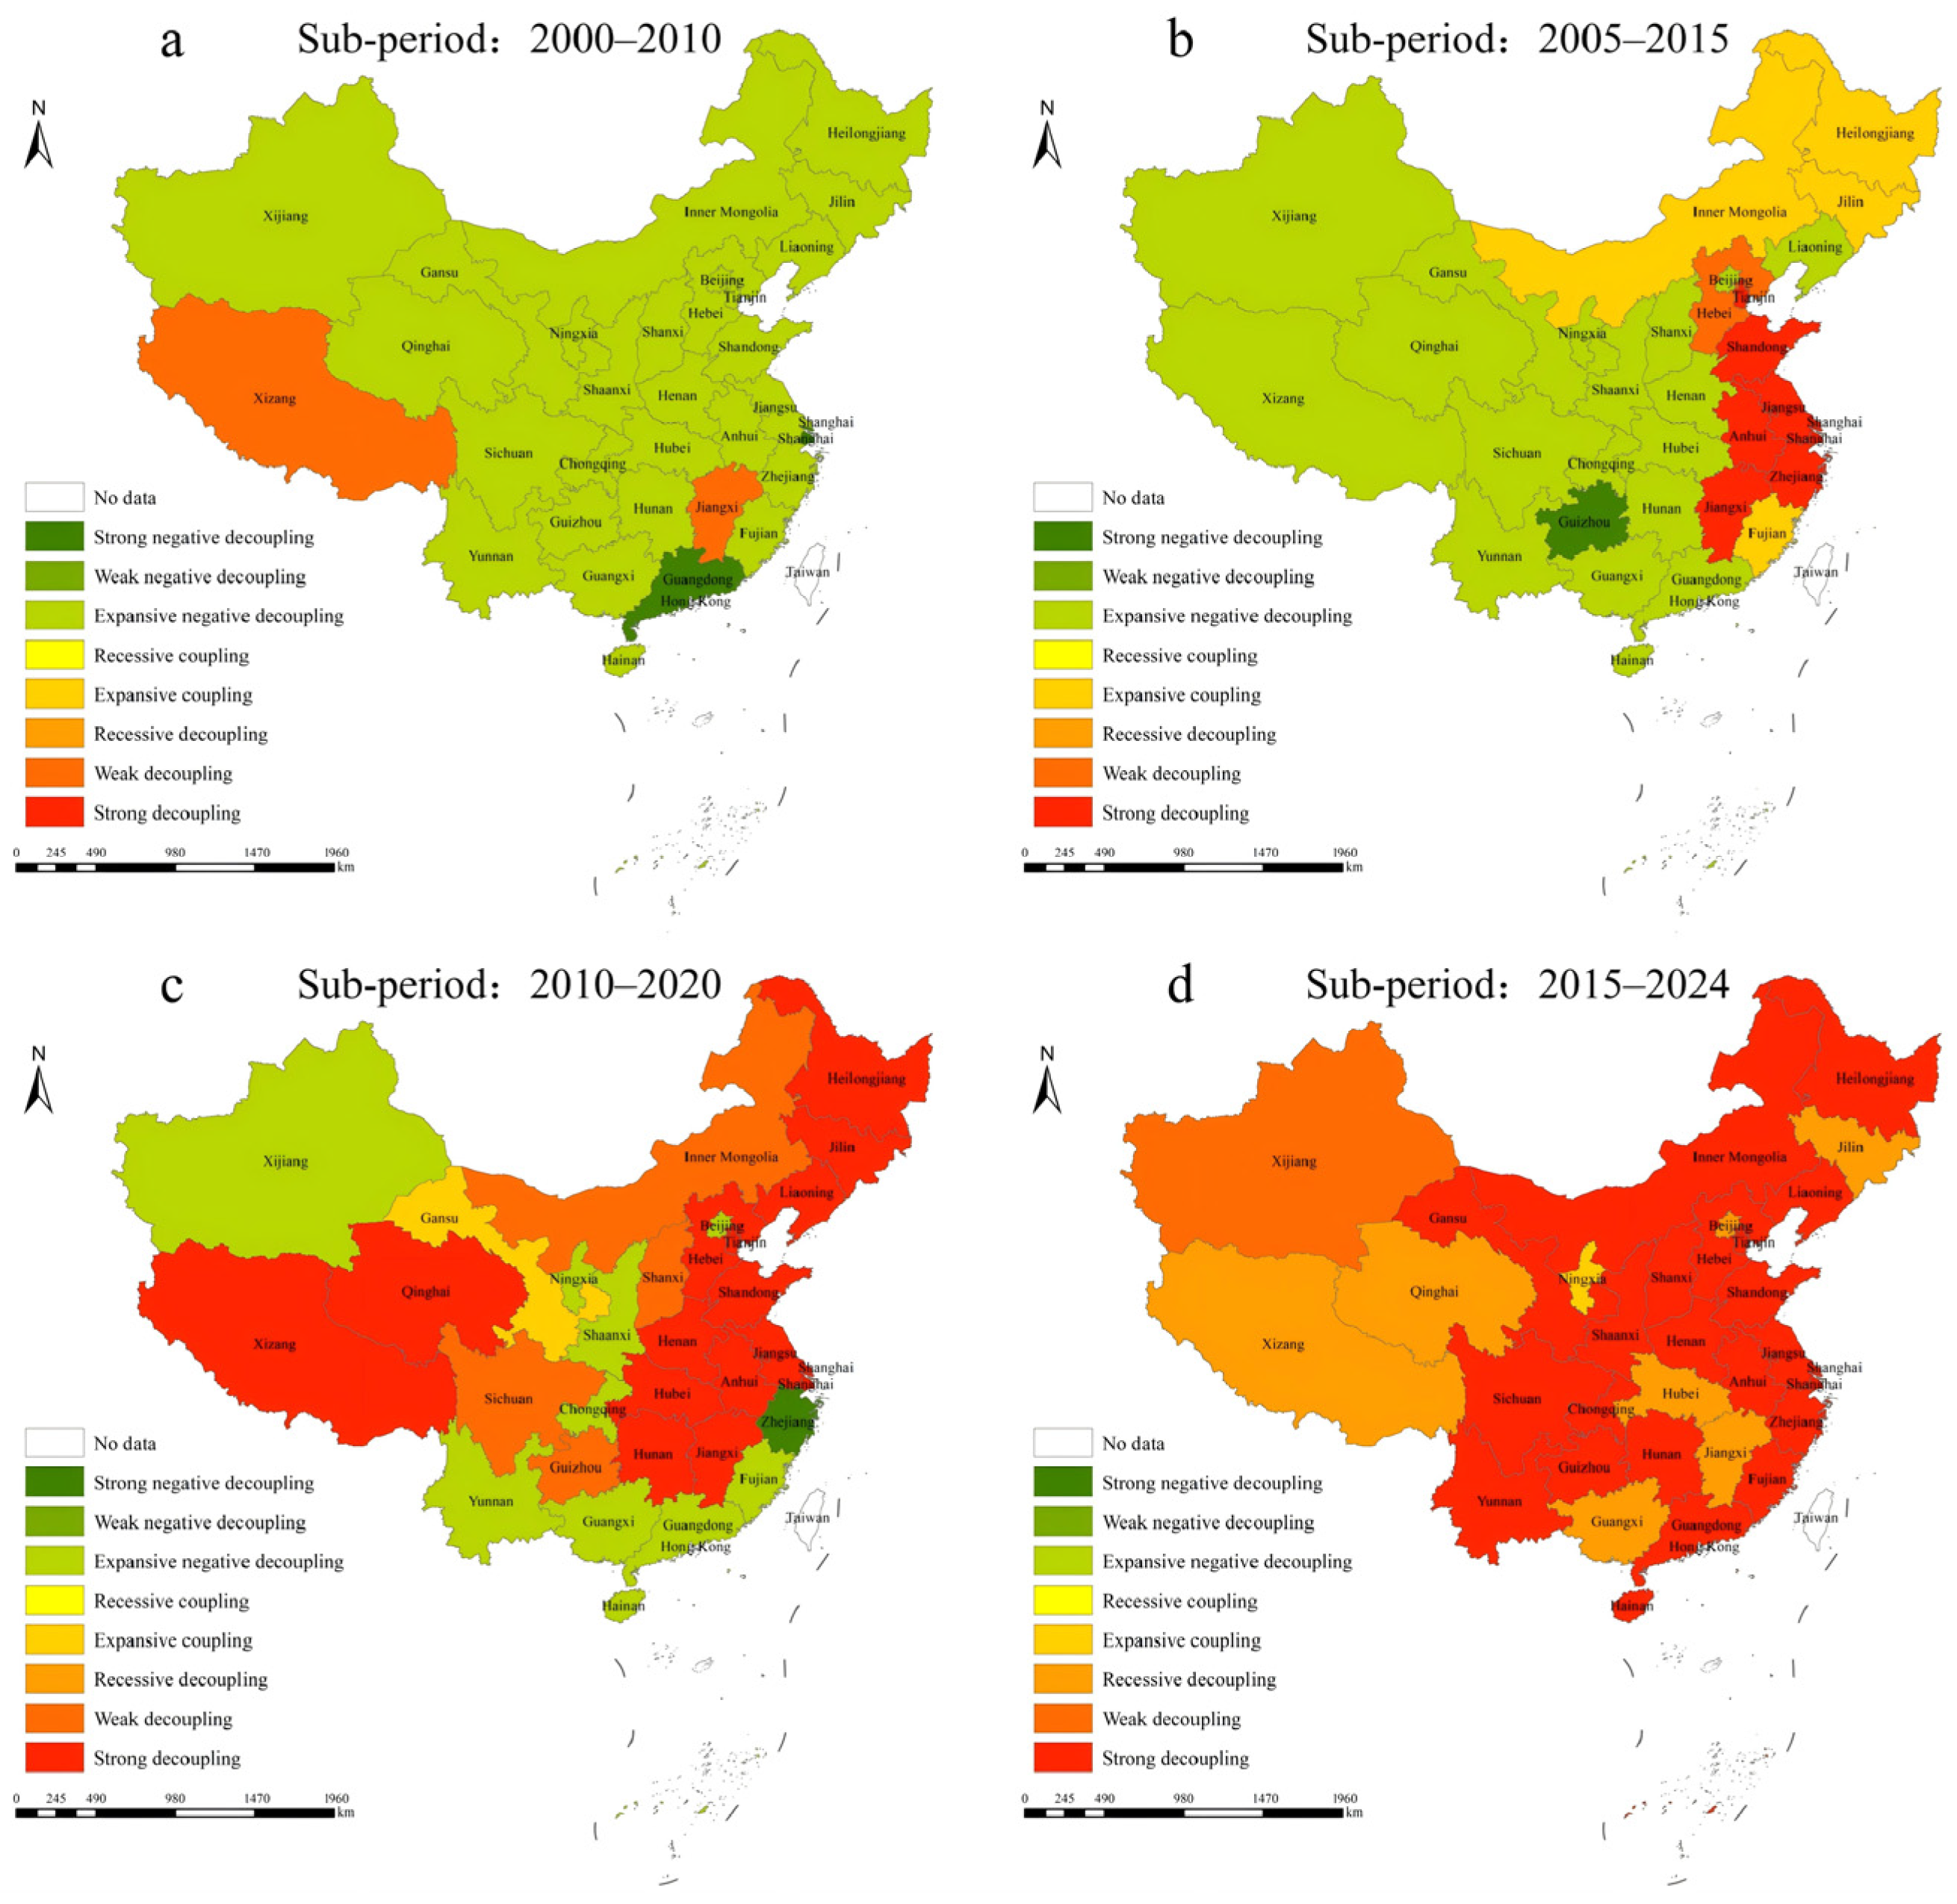
A sliding-window analysis was conducted to examine the Tapio decoupling relationship between potassium fertilizer inputs and grain output across 31 provincial-level units in China. The 25-year study period was divided into four overlapping intervals: 2000–2010, 2005–2015, 2010–2020, and 2015–2024. The temporal and spatial evolution of the decoupling states is illustrated in Figure 2.
Figure 2.
Spatiotemporal evolution of decoupling states between grain output and potassium fertilizer inputs in 31 Chinese provinces. (a) 2000–2010; (b) 2005–2015; (c) 2010–2020; (d) 2015–2024.
Figure 2 shows that from 2000 to 2010, the vast majority of Chinese provinces were in a state of expansive negative decoupling, indicating that potassium fertilizer inputs and grain output increased simultaneously, while the growth rate of potassium fertilizer inputs generally exceeded that of grain output. A clear positive association between the two variables was observed, with only limited regional variation, resulting in a high degree of overall consistency across the country.
Between 2005 and 2015, the decoupling relationship between potassium fertilizer inputs and grain output in China began to undergo a marked transformation, accompanied by an emerging trend of regional differentiation. In eastern coastal provinces such as Tianjin, Shanghai, Jiangsu, Zhejiang, and Anhui, the decoupling state gradually shifted from expansive negative decoupling to strong decoupling, indicating that grain output continued to increase despite a slowdown or even decline in potassium fertilizer inputs. In contrast, the decoupling process in the central and western regions lagged behind, where expansive negative decoupling remained the dominant pattern.
During 2010–2020, the decoupling pattern further evolved, and regional disparities continued to widen. Provinces including Tianjin, Jilin, Heilongjiang, Jiangsu, Zhejiang, and Anhui maintained relatively stable and coordinated relationships between potassium fertilizer inputs and grain output. Strong decoupling and expansive negative decoupling expanded from the eastern coastal region toward the northeast and central regions, showing a certain degree of spatial diffusion. Although a few provinces experienced temporary fluctuations during specific periods, the overall direction of decoupling evolution continued to improve.
From 2015 to 2024, a nationwide spatial pattern dominated by strong decoupling gradually emerged. More than 20 provinces exhibited strong decoupling, characterized by a continued decline in potassium fertilizer inputs alongside sustained growth in grain output. Although grain output declined slightly in some provinces, the reduction in potassium fertilizer inputs was even greater. At this stage, the coordination between input and output improved significantly, and the overall trend remained stable and robust.
Overall, from 2000 to 2024, the relationship between potassium fertilizer inputs and grain output in China underwent a transition from a pattern dominated by expansive negative decoupling to one characterized primarily by strong decoupling. The overall spatial pattern displayed a gradient of improvement progressing sequentially from the eastern region to the northeast and then to the central region.
3.2. Potassium Use Efficiency (KUE) Estimation
KUE serves as a critical indicator for evaluating the effective utilization of potassium fertilizer resources. The systematic measurement of KUE, combined with an analysis of spatial heterogeneity and temporal dynamics, facilitates a comprehensive assessment of the effectiveness of potassium inputs across regions and helps identify potential optimization opportunities.
3.2.1. Stochastic Frontier Model Estimation
The SFA estimation results are presented in Table 3. Core explanatory variables and efficiency-related parameters (γ, μ, η, etc.) were statistically significant at the 1% level, with generally high absolute t-values, indicating robust and unbiased parameter estimates. These results validate the appropriateness of the SFA model specification.
Table 3.
Estimation Results of the KUE Production Function Based on SFA.
Specifically, the Gamma (γ) value was 0.786 and significant at the 1% level, indicating that 78.6% of the variance in the stochastic frontier production function can be attributed to technical inefficiency, with the remaining 21.4% arising from uncontrollable random factors such as climatic variability or measurement errors. This confirms the model’s ability to separate controllable efficiency losses from stochastic disturbances. The total variance (σ2 = 0.191) was moderate, indicating that the model captured output fluctuations appropriately without evidence of overfitting or underfitting. Furthermore, the estimated results are consistent with theoretical expectations and empirical findings in prior agricultural efficiency studies, providing additional validation for the model specification.
3.2.2. Potassium Use Efficiency (KUE)
The KUE values for the 31 Chinese provinces from 2000 to 2024, estimated based on the SFA model, are summarized in Table 4.
Table 4.
KUE values of China’s provinces from 2000 to 2024.
The results indicate that KUE exhibited a steady upward trend nationwide, with the average KUE increasing from 0.458 in 2000 to 0.565 in 2024. Spatially, KUE displayed a “high in the south, low in the north, and marked differentiation in the western region” pattern. Provinces such as Fujian, Guangdong, and Hainan consistently maintained high efficiency levels, whereas Beijing, Shanghai, and Jiangsu, although exhibiting relatively low efficiency levels, showed stable improvement trends. In the northeastern region, Heilongjiang exhibited the highest efficiency, while Liaoning and Jilin maintained moderate efficiency with steady growth. The central region exhibited a polarized pattern: Jiangxi and Hunan led in efficiency, whereas traditional major grain-producing provinces such as Henan and Hubei still had considerable room for improvement. The western region demonstrated the highest internal heterogeneity, with Guangxi ranking highest nationally, Guizhou, Yunnan, and Tibet maintaining above-average efficiency, and northwestern arid provinces such as Xinjiang, Ningxia, and Qinghai exhibiting lower efficiency but relatively higher growth rates, indicating a clear catching-up trend.
3.2.3. Potassium Fertilizer Reduction Potential (PFRP)
Based on the estimated potassium use efficiency (KUE) for each province (Table 4) and the average potash fertilizer input per unit area, and in conjunction with Equations (7) and (8), the average annual PFRP for each province over the period 2000–2024 was further calculated (Table 5).
Table 5.
Average KUE, APFI and PFRP in each province from 2000 to 2024.
The analysis reveals marked regional disparities in KUE, fertilization intensity, and fertilizer reduction potential across provinces. Provinces with high KUE are generally associated with high potassium fertilizer inputs per unit area. Guangxi, Jiangxi, Fujian, and Hunan all exhibit KUE values above 0.90, while their per-hectare potassium fertilizer inputs remain significantly above the national average. Despite their high efficiency levels, these provinces still show measurable fertilizer reduction potential due to relatively large baseline application rates; the reducible potassium fertilizer amounts reach 15.7 kg ha−1 in Fujian and 20.5 kg ha−1 in Guangdong.
Provinces with medium to low KUE display substantially greater reduction potential. Xinjiang, Hubei, Hainan, Shandong, Shaanxi, and Henan record KUE values between 0.27 and 0.42, with per-hectare reducible potassium fertilizer amounts generally exceeding 30 kg ha−1. Xinjiang shows the highest reduction potential, at 40.9 kg ha−1.
3.3. Driving Mechanisms of Potassium Fertilizer Input and Grain Production
3.3.1. Drivers of Grain Production
To examine the mechanisms and effect magnitudes of various production factors on grain output, this study introduces control variables—such as nitrogen and phosphorus fertilizers—to eliminate confounding effects and mitigate potential bias in estimating the marginal contribution of potash fertilizer arising from omitted variables. Furthermore, pooled ordinary least squares (POLSs), fixed-effects (FEs), random-effects (REs), and two-way fixed-effects (TWFEs) models are sequentially estimated to ensure the robustness of the results (Table 6).
Table 6.
Response of grain production to key factors.
Hausman test results (χ2 = 124.62, p < 0.01) strongly rejected the RE model, supporting the use of the FE specification. Joint F-tests for time effects (F = 1.75, p < 0.05) indicated the significance of time-fixed effects, which were accordingly included. Across all models, the TWFE model exhibited the highest explanatory power (R2 = 0.872).
The model results indicate that cultivated land area and agricultural machinery power exert significant positive effects on grain production (p < 0.01). Specifically, the two-way fixed-effects model shows that a 1% increase in cultivated land area is associated with an approximately 0.72% increase in grain output, while a 1% increase in total agricultural machinery power leads to an approximately 0.33% increase in grain production, highlighting the critical roles of land input and mechanization in promoting yield growth. With respect to fertilizer inputs, compound fertilizers exhibit a robust positive effect on grain production, whereas the coefficients for nitrogen and phosphorus fertilizers are significantly negative in most model specifications. In contrast, potash fertilizer inputs display a significant positive effect after controlling for individual fixed effects, suggesting that optimizing the input structure of nitrogen, phosphorus, and potassium fertilizers plays an important role in enhancing grain productivity in these regions.
3.3.2. Drivers of Potassium Fertilizer Input
To further assess the impact of crop structure on regional potassium fertilizer demand, eight major crop categories—grain, cotton, oil crops, hemp, sugar crops, tobacco, tea, and fruits—were analyzed (Table 7). Among these, sugar crops, tobacco, and fruits are potassium-intensive crops, characterized by high potassium requirements during growth stages.
Table 7.
Response of potassium fertilizer input to major crops.
The Hausman test (χ2 = 34.05, p < 0.01) supports the use of the fixed-effects model, while the joint test for time effects (F = 44.74, p < 0.01) indicates that time fixed effects should be included. The two-way fixed-effects (TWFEs) model achieves an R2 of 0.718, demonstrating relatively strong explanatory power, and it is therefore adopted for further analysis. The TWFE results show that sugar crops, tobacco, and fruits exert significant positive effects on potash fertilizer inputs (p < 0.01), indicating that the expansion of potassium-intensive cash crops is a key driver of regional fertilizer demand growth. In contrast, the effects of grain crops, oil crops, and tea are not statistically significant, while fiber crops exhibit a significant negative effect and cotton shows a weakly significant positive effect. Overall, crop planting structure—particularly the spatial distribution of potassium-intensive cash crops—is an important factor contributing to regional disparities in potash fertilizer inputs.
3.4. Response of Grain Production to Potassium Fertilizer Input
3.4.1. Model Performance Evaluation
Five models—BiLSTM, TFT-BiLSTM, CNN-BiLSTM, Transformer-BiLSTM, and XGBoost-BiLSTM—were constructed to compare their predictive performances. The training and evaluation results for grain yield and potassium fertilizer inputs are summarized in Table 8 and Table 9.
Table 8.
Training and evaluation metrics for grain yield prediction.
Table 9.
Training and evaluation metrics for potassium fertilizer input prediction.
Table 8 and Table 9 indicate substantial differences among models for both grain yield and potassium fertilizer prediction tasks. For grain yield, the XGBoost-BiLSTM model outperformed the others, achieving a test set MAE of 45.955, RMSE of 78.781, and R2 of 0.981. Compared with the BiLSTM model (MAE = 110.717, R2 = 0.942), the XGBoost-BiLSTM reduced the MAE by 58.5% and increased R2 by 4.15%, demonstrating superior predictive accuracy and generalization capability. Moreover, its training and testing performances were well balanced, indicating strong model stability and effective mitigation of overfitting.
For potassium fertilizer input prediction, although the CNN-BiLSTM model achieved the best test set performance (MAE = 1.126, R2 = 0.973), the difference between its training and test MAE reached 3.5%, suggesting potential overfitting. In contrast, the XGBoost-BiLSTM model showed more balanced performance across training and test sets (Test-K—R2 = 0.913). Considering both prediction tasks, the hybrid XGBoost-BiLSTM model, by integrating XGBoost’s nonlinear feature learning and BiLSTM’s temporal modeling capabilities, demonstrated superior overall performance in predictive accuracy, generalization, and robustness, making it suitable for multi-objective agricultural production prediction tasks.
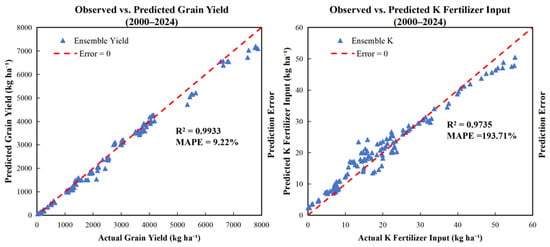
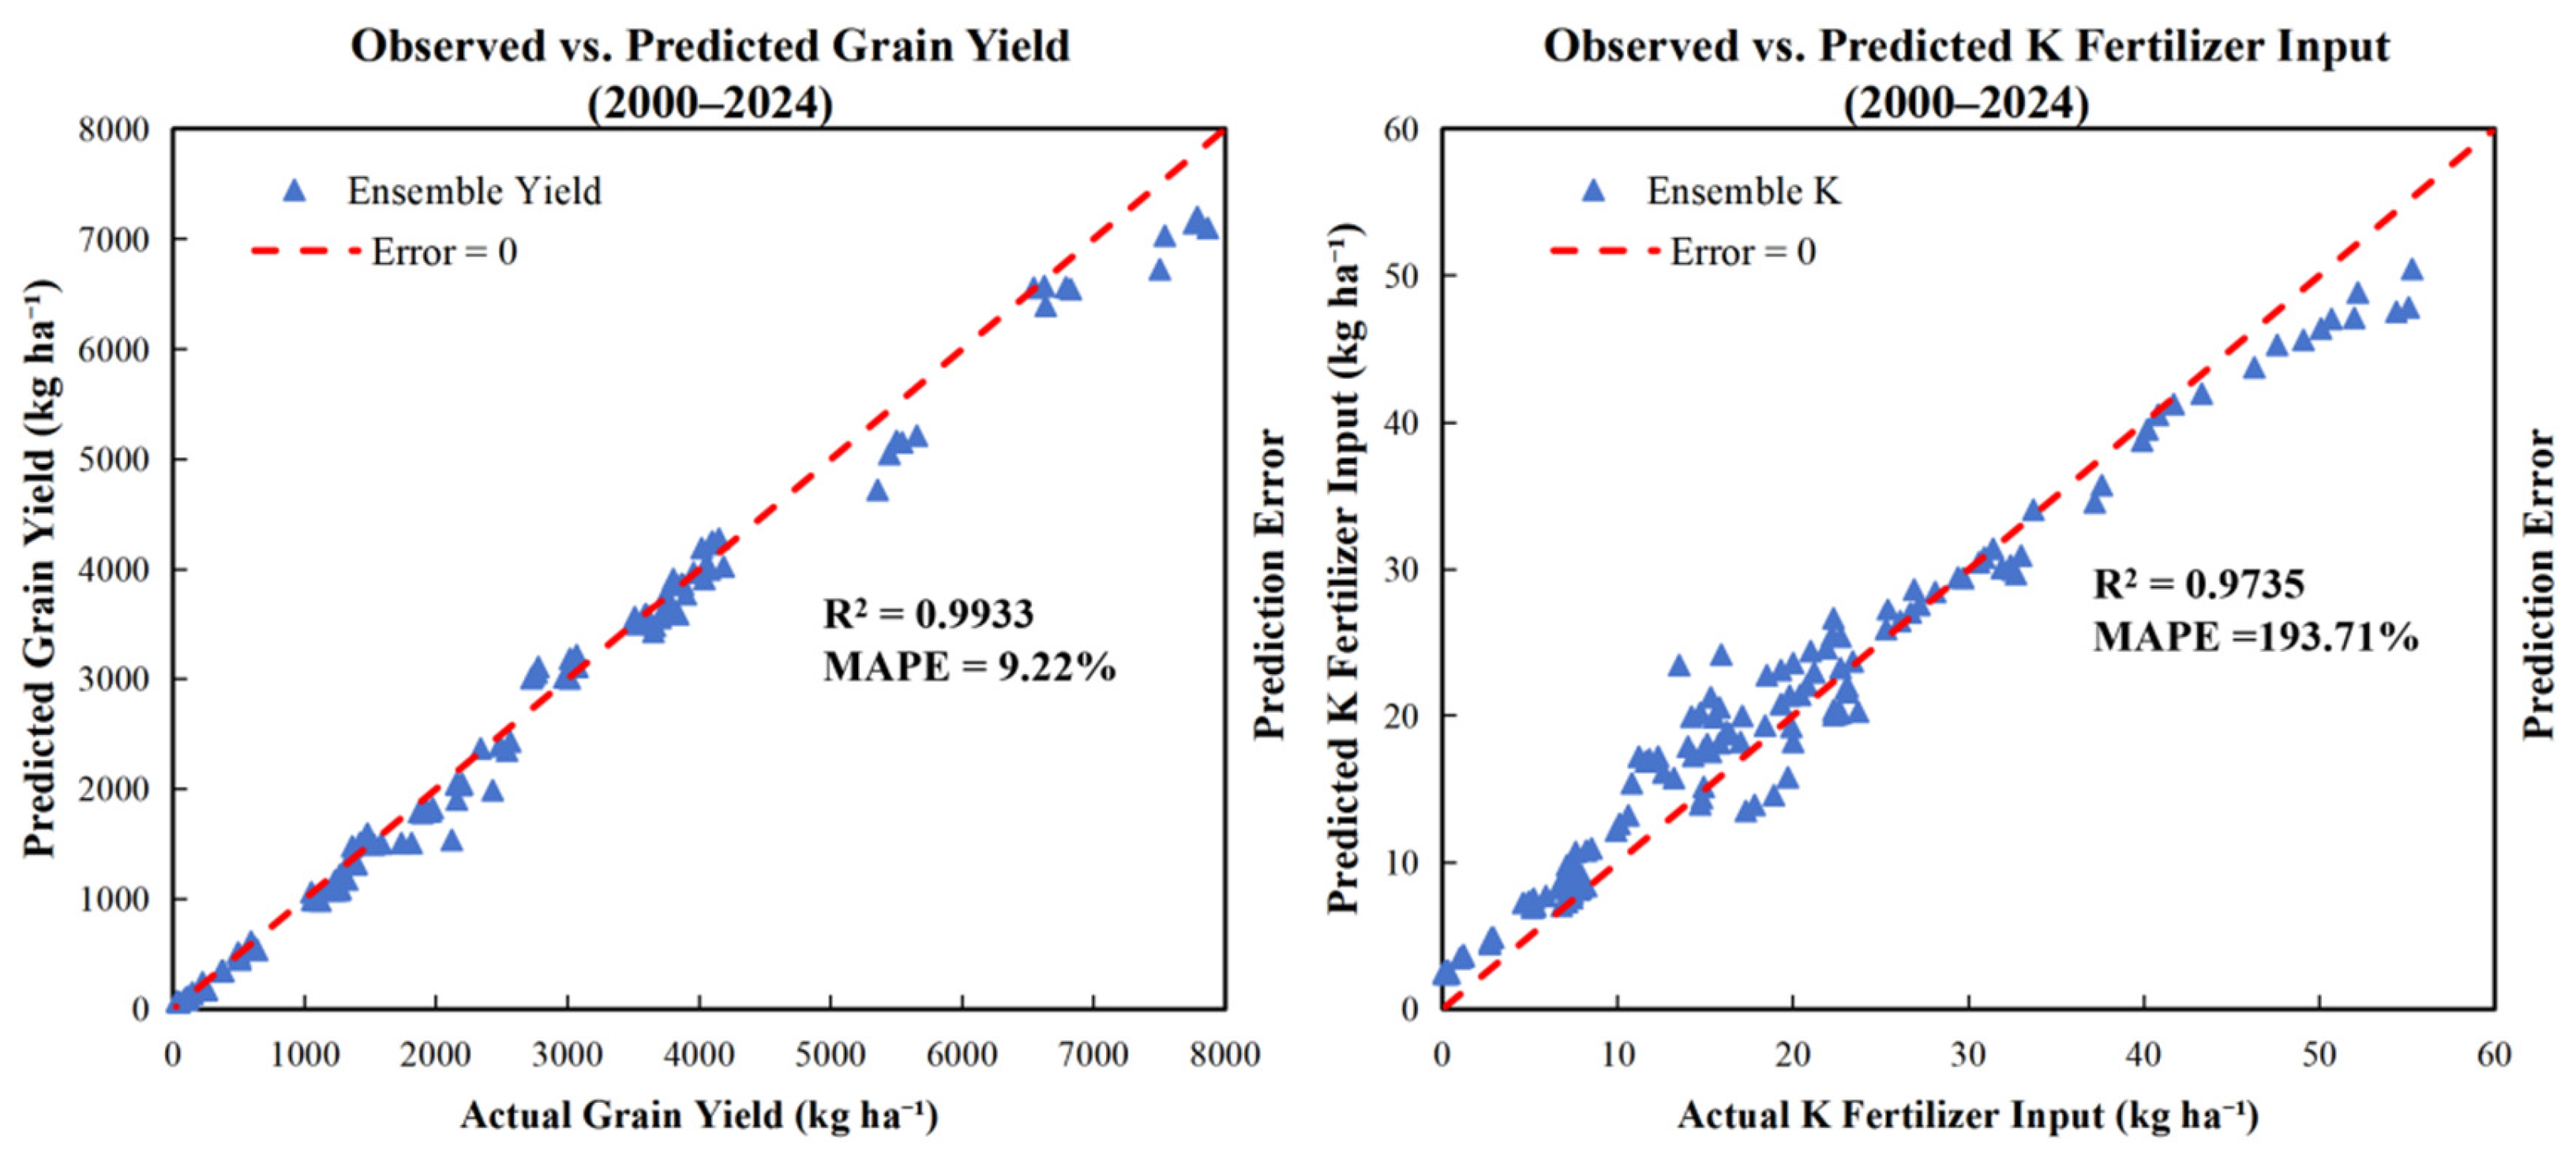
Figure 3 shows the comparison results between the predicted data of the XGBoost-BiLSTM hybrid model and the actual data for the period 2020–2024. From grain yield predictions, the model demonstrated an excellent fit, with R2 = 0.993 and a mean absolute percentage error (MAPE) of 9.22%. The scatter points were closely distributed around the 1:1 reference line, indicating that spatial yield variations among provinces were accurately captured. For potassium fertilizer input (K), the model achieved R2 = 0.974, capturing overall trends well; however, MAPE was relatively high at 193.7%, primarily due to low input provinces such as Tibet and Qinghai, where small base values amplified relative errors. These outliers had minimal impact on national or regional-scale trend assessments. On an annual average basis, both actual and predicted grain yields showed consistent year-on-year increases during 2020–2024, while potassium fertilizer input exhibited a continuous decline, accurately reflecting the direction and magnitude of changes. Overall, the XGBoost-BiLSTM model demonstrated high reliability for both yield and fertilizer input predictions, providing a robust reference for regional agricultural decision-making.
Figure 3.
Scatter Plot of Predicted vs. Actual Values from 2020 to 2024 Based on XGBoost-BiLSTM Hybrid Model.
3.4.2. Forecast Results
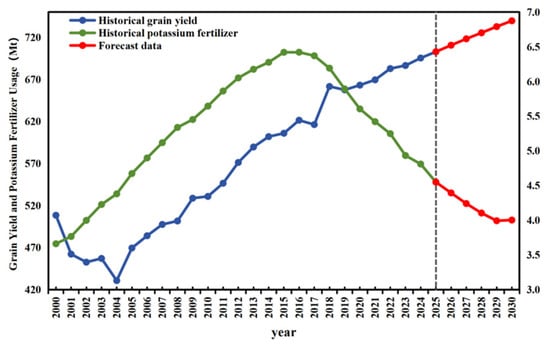
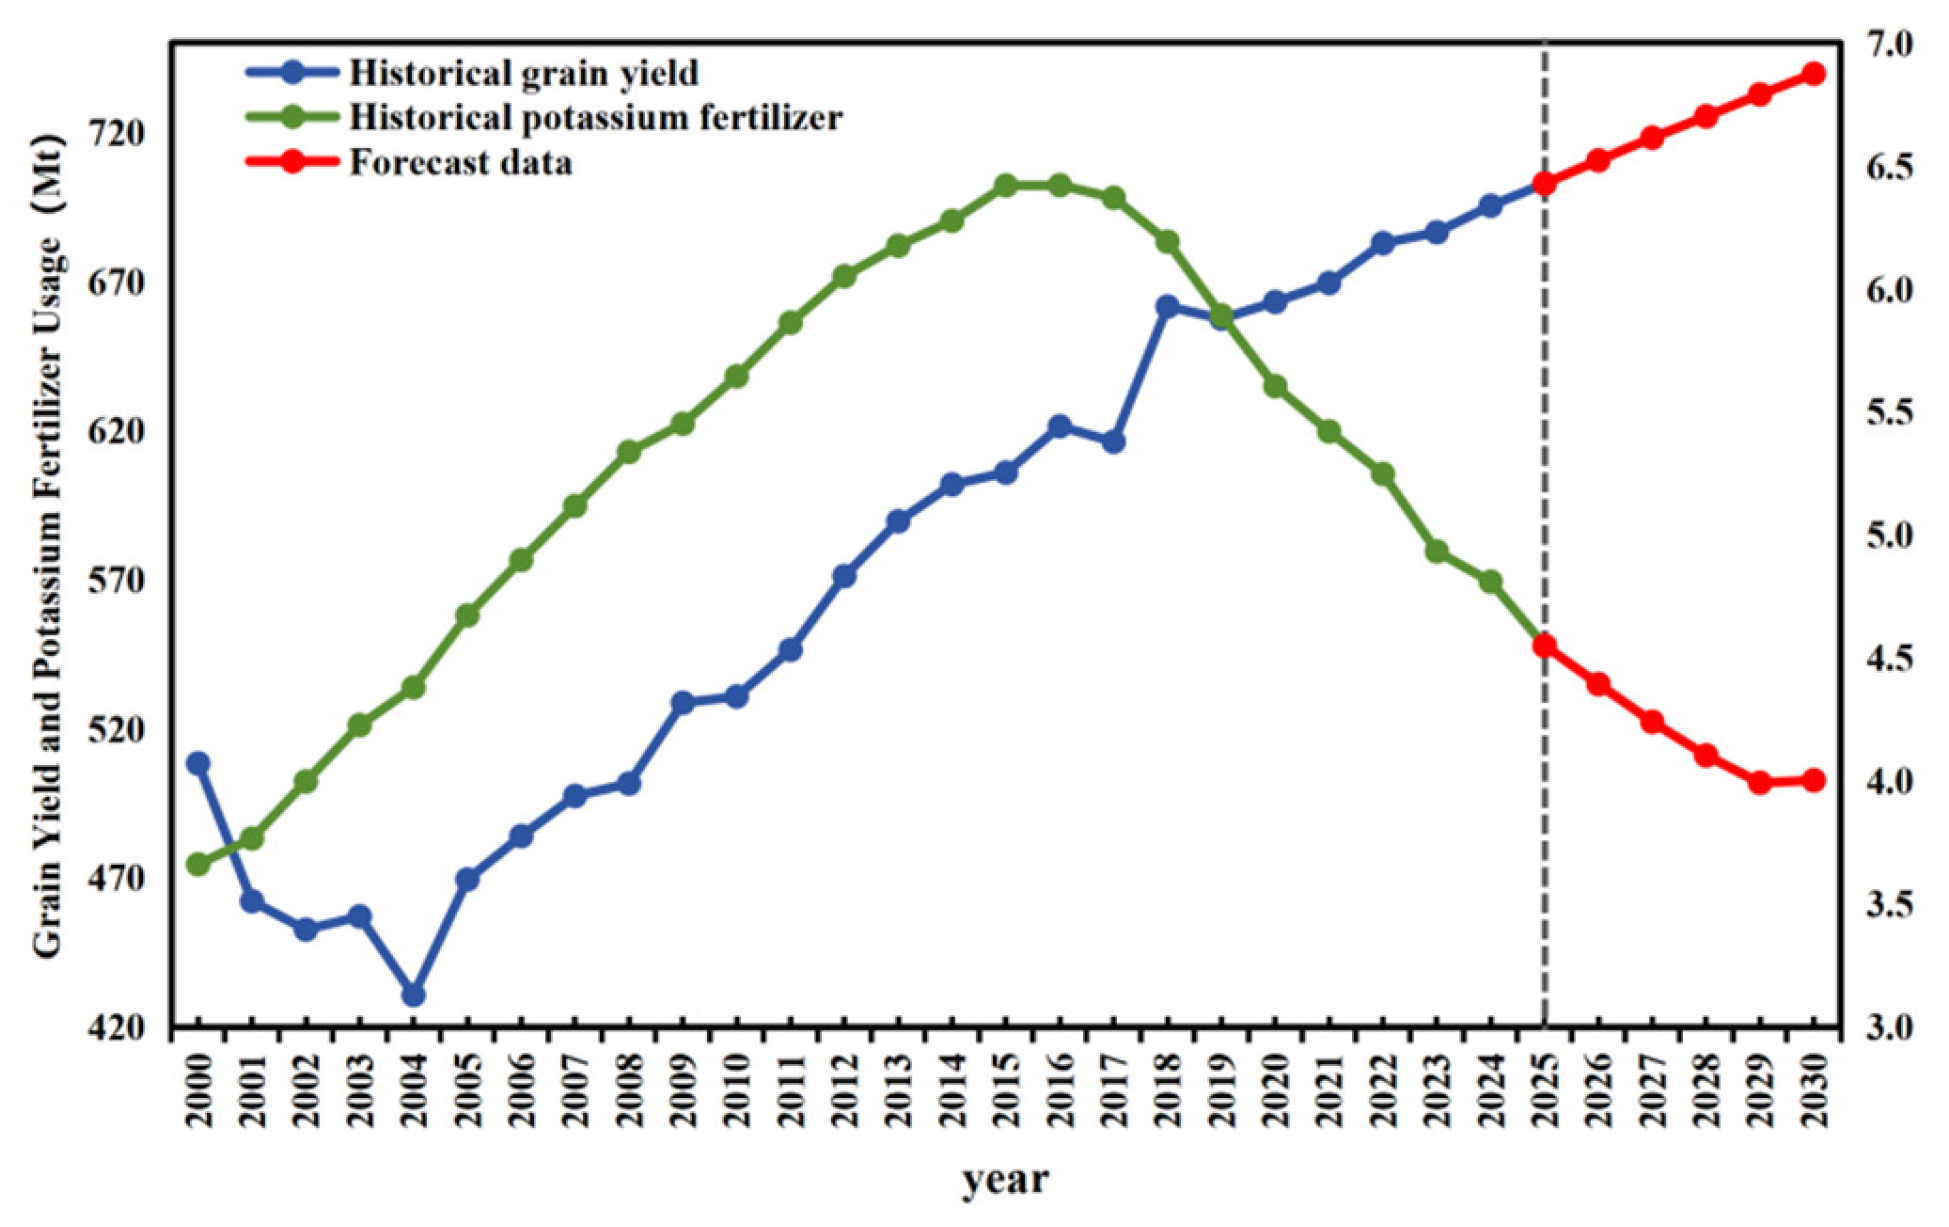
Figure 4 shows the predicted relationship between grain production and potassium fertilizer inputs in China for the period 2025–2030, based on the XGBoost-BiLSTM model.
Figure 4.
Trends of Grain Production and Potassium Fertilizer Inputs in China from 2000 to 2024 and Forecasts for Subsequent Years.
From 2000 to 2024, total grain production in China demonstrated a continuous upward trend, rising from 508.4 Mt in 2000 to 695.4 Mt in 2024, with an average annual increment of approximately 7.8 Mt. Total potassium fertilizer inputs followed an inverted U-shaped pattern, increasing from 3.66 Mt in 2000 to a historical peak of 6.42 Mt in 2015, followed by a gradual decline thereafter.
Forecast results indicate that from 2025 to 2030, grain production is projected to continue increasing at an average annual rate of approximately 1.1%, reaching 739.7 Mt by 2030. Conversely, potassium fertilizer input is expected to decrease at an average annual rate of 3.1%, declining from 4.81 Mt in 2024 to 4.0 Mt in 2030. A minor rebound in potassium fertilizer input in 2030 compared to 2029 is primarily attributed to the expansion of cultivated arable land.
4. Discussion
4.1. Driving Mechanisms of Decoupling Evolution
The observed shift in the decoupling relationship between potassium fertilizer input and grain production in China is consistent with the study of Xiong and Zhao [27], who reported dynamic interactions between fertilizer input and crop yield. This alignment further validates that post-2015 Chinese agriculture has transitioned from a high-input mode to a green development model characterized by “reducing inputs while increasing output”. This transformation results from coordinated policy, technological, and market forces [49]. At the policy level, the 2015 issuance of the “Action Plan for Zero Growth of Fertilizer Use by 2020” marked a pivotal milestone, shifting national agricultural objectives from solely ensuring supply and increasing output to a multidimensional focus on yield stability, quality enhancement, and ecological security [50]. Technological innovations, including controlled-release fertilizers, integrated water–fertilizer management, and variable-rate fertilization, have provided the technical foundation for reducing inputs while maintaining or increasing output, thereby improving nutrient use efficiency [51]. Market-driven price fluctuations have further encouraged farmers to optimize fertilizer application, reducing excessive use and improving the cost-effectiveness of input–output relationships, indirectly contributing to the decoupling of potassium input from grain yield [52].
The observed spatial gradient in decoupling states, following an Eastern–Northeastern–Central pattern, reflects the uneven progression of agricultural modernization. Eastern provinces, benefiting from higher economic development and greater accessibility to agricultural services, were the first to adopt precision fertilization at scale [53]. Northeastern provinces leveraged large-scale farming to enhance potassium use efficiency, whereas parts of the Central and Western regions experienced delayed decoupling due to geographic constraints and weaker technology dissemination networks [54,55].
4.2. Mechanisms Underlying Spatial Variations in Potassium Use Efficiency
Differences in regional natural conditions are a key factor contributing to the significant spatial heterogeneity in potash fertilizer use [56]. The southern regions are predominantly characterized by acidic red soils, with low baseline potassium content and strong leaching effects, but favorable water and heat conditions and high cropping intensity. The central and northeastern plains are dominated by black soils and meadow soils, with good basic fertility and concurrent rainfall and heat. The northwestern region is mainly composed of desert soils, where water availability is the primary limiting factor.
The differences in natural conditions lead to variations in planting structures, which are the main factors driving the divergence in potash fertilizer inputs between the north and south. In the southern provinces, potassium-intensive cash crops, such as sugarcane, citrus, and tobacco, dominate, and their potassium demand is much higher than that of the grain crops, such as wheat and corn, in the north [57,58]. Additionally, due to the low baseline potassium levels in the soil, more potash fertilizer is required to ensure normal crop growth. Moreover, compared to the north, southern regions tend to have more precise field management and higher levels of agricultural intensification, which collectively contribute to the efficient use of potash fertilizer, forming a “high in the south, low in the north” spatial pattern of KUE [59,60].
Provinces such as Guangxi, Jiangxi, Fujian, and Hunan exhibit a “high input—high output—high efficiency” characteristic, where both potash fertilizer use efficiency and input amounts are high. This phenomenon results from the combined effect of regional planting structures and agricultural management practices [61,62]. On one hand, these regions widely cultivate potassium-intensive cash crops, and the acidic red soils naturally prompt farmers to increase potash fertilizer inputs per unit area [63]. On the other hand, the application of modern agricultural techniques such as soil testing and formula fertilization, and integrated water and fertilizer management, has effectively improved the absorption and conversion efficiency of potash fertilizer by crops, thus forming a positive feedback loop. This suggests that efficient potash fertilizer use does not necessarily depend on low-input models but can be achieved by optimizing crop planting structures and improving agricultural management practices, leading to a synergistic increase in both fertilizer input and efficiency [64].
4.3. Yield Effects of Input Factors
Fertilizer structure and agricultural practices are core determinants of crop yield [65]. Compound fertilizers have a significant positive effect on yield, while single nitrogen and phosphorus fertilizers exhibit negative impacts. This conclusion is empirically supported by the fixed-effects model results in Table 6. This apparent contradiction reflects structural imbalances in fertilizer application in certain provinces, where excessive single-nutrient inputs cause antagonistic effects and soil acidification, thereby limiting crop uptake of other nutrients [66]. Compound fertilizers, by optimizing N–P–K ratios and supplying essential microelements, better match crop nutrient requirements and soil nutrient supply, promoting synergistic nutrient uptake and efficient nutrient conversion [10,67].
Changes in agricultural practices, particularly mechanization, further enhance yield. Mechanized fertilization enables precise nutrient application, adjusting both rate and depth according to field heterogeneity and crop growth stage, thereby reducing nutrient losses and improving application efficiency [68]. Mechanization also increases field management efficiency, reduces labor costs, and supports yield improvement [69]. However, the observed higher output elasticity of cultivated area compared with mechanization indicates that yield increases in China still partially depend on land expansion, highlighting that some regions have not fully transitioned from “extensive expansion” to “intensive optimization” [70].
4.4. Mechanisms of “Increased Output with Reduced Input” and Comparative Analysis
The intensity of fertilizer use in China has shown a phased transition from an increasing to a decreasing trend over the long term. Since the implementation of policies such as the “Zero Growth Action on Fertilizer Use” in 2015, total fertilizer input has continued to decline, and the agricultural growth model has gradually shifted from being factor-driven to efficiency-driven [63,71]. However, as of 2024, China’s fertilizer application intensity still exceeds the international safety threshold, indicating that while fertilizer reduction policies have achieved some success, the pressure on resources and the environment has not been fundamentally alleviated. Forecasts suggest that in the future, China’s grain production and potash fertilizer input will continue to exhibit an “increased output with reduced input” optimization trend, reflecting China’s confidence in improving agricultural resource use efficiency and signaling a transition toward a more efficient and greener agricultural production model [6,7].
However, the path to reducing fertilizer use relies not only on improvements in technical efficiency but also on changes in crop planting structures, which exhibit significant regional heterogeneity [15]. Additionally, soil potassium deficiencies and fluctuations in international potash fertilizer prices present exogenous constraints that may undermine the stability of the reduction path. Therefore, potash fertilizer management strategies must shift from a singular focus on reduction goals to optimal inputs under constraint conditions. By adjusting fertilizer structures, promoting agricultural mechanization, improving crop varieties, and optimizing field management, a multifaceted approach can collectively drive the transformation of agricultural production from “extensive growth reliant on high-input factors” to “intensive growth reliant on efficient resource utilization,” thus achieving a balance between input efficiency and ecological constraints [40].
4.5. Limitations
Although this study has constructed a relatively systematic analytical framework, there are still certain limitations. Based on data from the China Statistical Yearbook, the study analyzes the driving mechanisms of potash fertilizer input and grain production at a macro scale, providing initial empirical evidence for related research. However, due to data availability constraints, the study does not fully incorporate heterogeneous factors such as regional climate, soil nutrient conditions, and field management practices. As a result, the identification of fine-grained mechanisms, the testing of regional applicability, and the predictive capacity under different environmental conditions still need improvement. Future research could build upon this macro-level analysis, incorporating regional differences to conduct more detailed and mechanistic studies. Additionally, long-term field trials and multi-environment validation should be introduced to systematically examine the interactive effects of different soil types, irrigation conditions, and crop varieties on potash fertilizer use efficiency. Such efforts would enhance the reliability of predictive models and provide more accurate evidence for scientific fertilization and grain production management.
5. Conclusions and Recommendations
5.1. Conclusions
Based on agricultural panel data for China’s 31 provinces from 2000 to 2024 (China Statistical Yearbook), this study applied the Tapio decoupling model, SFA, fixed-effects models, and an XGBoost-BiLSTM hybrid deep learning model to systematically investigate the dynamic relationship, efficiency, and future trends of potassium fertilizer use and grain production. The main findings are as follows:
- Fundamental shift in decoupling relationship: Between 2000 and 2024, the overall decoupling pattern changed from predominantly “expansive negative decoupling” to “strong decoupling,” with an “Eastern—Northeastern—Central” spatial gradient, reflecting the influence of regional modernization and technology dissemination on decoupling evolution.
- KUE steadily improved with significant spatial variation: National KUE increased overall, displaying a “high South—low North” pattern. Southern high-yield regions, despite high efficiency, maintain a substantial base of fertilizer application, leaving room for reduction, whereas low- to mid-efficiency provinces have even greater reduction potential.
- Input structure optimization drives yield gains: Sown area, total agricultural mechanization, potassium, and compound fertilizer inputs positively influence yield. The cultivation of potassium-demanding crops (sugarcane, tobacco, fruits) is a key driver of regional potassium demand.
- Sustained trend of “reducing input while increasing efficiency”: Projections indicate that from 2025 to 2030, grain production will grow at an annual rate of 1.2–1.5%, while potassium input will decline at 2–4% annually.
5.2. Recommendations
To further optimize potassium use and ensure food security, the following recommendations are proposed:
- Implement region-specific fertilization strategies: In line with the “high South—low North” KUE pattern, southern provinces should exploit reduction potential from high input bases, northern major grain-producing areas should accelerate the adoption of soil-testing-based precision fertilization, and northwest arid regions should integrate water-fertilizer management to determine optimal potassium thresholds.
- Optimize fertilizer input structure: Considering the diminishing marginal returns of excessive single-component nitrogen and phosphorus fertilizers, policy guidance and technical demonstrations should encourage gradual adjustment toward higher compound fertilizer and potassium ratios, correcting the historical “high N-P, low K” bias and ensuring balanced nutrient supply.
- Establish soil nutrient monitoring and early-warning systems: To mitigate risks from decreasing potassium application, dynamic soil nutrient monitoring networks should be constructed in major agricultural regions, with scientifically defined potassium balance thresholds to prevent soil fertility decline.
- Strengthen technological innovation and policy coordination: Stakeholders should promote research, development, and the adoption of controlled-release potassium fertilizers and intelligent fertilization technologies; improve extension services; and enhance strategic potassium reserves and recycling to reduce external dependency and ensure food security.
Author Contributions
Conceptualization, R.D.; methodology, J.L.; software, J.L.; validation, R.D., J.L. and J.H.; formal analysis, R.D.; investigation, R.D.; resources, R.D.; data curation, J.H.; writing—original draft preparation, J.H.; writing—review and editing, R.D.; supervision, C.W.; project administration, C.W. All authors have read and agreed to the published version of the manuscript.
Funding
This research received no external funding.
Institutional Review Board Statement
Not applicable.
Informed Consent Statement
Not applicable.
Data Availability Statement
The data presented in this study are available on request from the corresponding author.
Conflicts of Interest
The authors declare no conflicts of interest.
Abbreviations
The following abbreviations are used in this manuscript:
| SFA | Stochastic frontier analysis |
| KUE | Potassium use efficiency |
| VIFs | variance inflation factors |
| FE | Individual fixed effects |
| RE | Random effects |
| TWFE | Two-way fixed effects |
| PFRP | Potassium Fertilizer Reduction Potential |
| APFI | Average potassium fertilizer inputs |
| MAE | Mean absolute error |
| RMSE | Root mean square error |
| MAPE | Mean absolute percentage error |
References
- Shahhosseini, M.; Hu, G.; Archontoulis, S.V. Forecasting Corn Yield with Machine Learning Ensembles. Front. Plant Sci. 2020, 11, 1120. [Google Scholar] [CrossRef] [Scilit] [PubMed]
- Bi, W.; Song, Y.; Liu, Y.; Li, Z.; Zhang, Y. Food Consumption Structure and Food Security—Through Mediating Effect Analysis of Agricultural R&D and Agricultural Investment. Int. J. Environ. Res. Public Health 2022, 19, 12524. [Google Scholar] [CrossRef] [Scilit]
- Liu, J.; Xu, Q.; Zhou, T. Role of Mechanization: The Impact of the Cropland Use Scale on Fertilizer Reduction. Front. Environ. Sci. 2022, 10, 1053715. [Google Scholar] [CrossRef] [Scilit]
- Kuzman, B.; Petković, B.; Denić, N.; Petković, D.; Ćirković, B.; Stojanović, J.; Milić, M. Estimation of Optimal Fertilizers for Optimal Crop Yield by Adaptive Neuro Fuzzy Logic. Rhizosphere 2021, 18, 100358. [Google Scholar] [CrossRef] [Scilit]
- Wu, H.; Ding, B.; Liu, L.; Zhou, L.; Meng, Y.; Zheng, X. Have Agricultural Land-Use Carbon Emissions in China Peaked? An Analysis Based on Decoupling Theory and Spatial EKC Model. Land 2024, 13, 585. [Google Scholar] [CrossRef] [Scilit]
- Gaytancıoğlu, O.; Yılmaz, F. Sustainable Paddy Farming in Edirne: Evaluating the Impacts of Excessive Fertilizer and Pesticide Use. Sustainability 2024, 16, 7814. [Google Scholar] [CrossRef] [Scilit]
- Song, X.; Geng, Y.; Zhang, Y.; Zhang, X.; Gao, Z.; Li, M. Dynamic Potassium Flows Analysis in China for 2010–2019. Resour. Policy 2022, 78, 102803. [Google Scholar] [CrossRef] [Scilit]
- Yin, Z.; Guo, W.; Xiao, H.; Liang, J.; Hao, X.; Dong, N.; Leng, T.; Wang, Y.; Wang, Q.; Yin, F. Nitrogen, Phosphorus, and Potassium Fertilization to Achieve Expected Yield and Improve Yield Components of Mung Bean. PLoS ONE 2018, 13, e0206285. [Google Scholar] [CrossRef] [Scilit]
- Barłóg, P. Improving Fertilizer Use Efficiency—Methods and Strategies for the Future. Plants 2023, 12, 3658. [Google Scholar] [CrossRef] [Scilit]
- Fan, P.; Mishra, A.K.; Feng, S.; Su, M. The Effect of Agricultural Subsidies on Chemical Fertilizer Use: Evidence From a New Policy in China. J. Environ. Manag. 2023, 344, 118423. [Google Scholar] [CrossRef] [Scilit]
- Arbačauskas, J.; Vaišvila, Z.J.; Staugaitis, G.; Žičkienė, L.; Masevičienė, A.; Šumskis, D. The Influence of Mineral NPK Fertilizer Rates on Potassium Dynamics in Soil: Data from a Long-Term Agricultural Plant Fertilization Experiment. Plants 2023, 12, 3700. [Google Scholar] [CrossRef] [Scilit] [PubMed]
- Zhao, R.; Ma, Y.; Wu, S. A Review of the Research Status and Prospects of Regional Crop Yield Simulations. Agronomy 2024, 14, 1397. [Google Scholar] [CrossRef] [Scilit]
- Wang, C.; Xie, Y.; Tan, Z. Soil Potassium Depletion in Global Cereal Croplands and Its Implications. Sci. Total Environ. 2024, 907, 167875. [Google Scholar] [CrossRef] [Scilit] [PubMed]
- Dhillon, J.S.; Eickhoff, E.M.; Mullen, R.W.; Raun, W.R. World Potassium Use Efficiency in Cereal Crops. Agron. J. 2019, 111, 889–896. [Google Scholar] [CrossRef] [Scilit]
- Lu, X.; Guo, J.; Guo, Z.; Fan, H.; Wang, K. Excessive Potassium Fertilization Reduces Sugar Distribution in Taproots and Sugar Yield in Drip-Irrigated Sugar Beets Cultivated in Calcareous Soils. Sugar Tech 2025. [Google Scholar] [CrossRef] [Scilit]
- Ozbek, F. Contribution of Improving Nitrogen Use Efficiency to Agricultural Economics in Europe. J. Anim. Plant Sci. 2023, 33, 1367–1373. [Google Scholar] [CrossRef] [Scilit]
- Chi, M.; Guo, Q.; Mi, L.; Wang, G.; Song, W. Spatial Distribution of Agricultural Eco-Efficiency and Agriculture High-Quality Development in China. Land 2022, 11, 722. [Google Scholar] [CrossRef] [Scilit]
- Lin, B.; Wang, Y. Climate Change and China’s Food Security. Energy 2025, 318, 134852. [Google Scholar] [CrossRef] [Scilit]
- Wu, J.; Wen, X.; Qi, X.; Fang, S.; Xu, C. More Land, Less Pollution? How Land Transfer Affects Fertilizer Application. Int. J. Environ. Res. Public Health 2021, 18, 11268. [Google Scholar] [CrossRef] [Scilit]
- Aryal, J.P.; Sapkota, T.B.; Krupnik, T.J.; Rahut, D.B.; Jat, M.L.; Stirling, C.M. Factors Affecting Farmers’ Use of Organic and Inorganic Fertilizers in South Asia. Environ. Sci. Pollut. Res. 2021, 28, 51480–51496. [Google Scholar] [CrossRef] [Scilit]
- Long, X.; Luo, Y.; Sun, H.; Tian, G. Fertilizer Using Intensity and Environmental Efficiency for China’s Agriculture Sector from 1997 to 2014. Nat. Hazards 2018, 92, 1573–1591. [Google Scholar] [CrossRef] [Scilit]
- Yin, Y.; Zhao, R.; Yang, Y.; Meng, Q.; Ying, H.; Cassman, K.G.; Cong, W.; Tian, X.; He, K.; Wang, Y.; et al. A Steady-State N Balance Approach for Sustainable Smallholder Farming. Proc. Natl. Acad. Sci. USA 2021, 118, e2106576118. [Google Scholar] [CrossRef] [Scilit] [PubMed]
- Cao, Z.; He, X.; Zhang, K. Research on the Evolution Mechanism and Decoupling Effect of China’s Carbon Emissions from the Perspective of Green Credit: Based on System Dynamics Model and Tapio Model. Environ. Sci. Pollut. Res. 2023, 30, 118897–118915. [Google Scholar] [CrossRef] [Scilit] [PubMed]
- Jiang, J.; Zhao, T.; Wang, J. Decoupling Analysis and Scenario Prediction of Agricultural CO2 Emissions: An Empirical Analysis of 30 Provinces in China. J. Clean. Prod. 2021, 320, 128798. [Google Scholar] [CrossRef] [Scilit]
- Wang, Q.; Su, M. The Effects of Urbanization and Industrialization on Decoupling Economic Growth from Carbon Emission—A Case Study of China. Sustain. Cities Soc. 2019, 51, 101758. [Google Scholar] [CrossRef] [Scilit]
- Xiong, C.; Zhao, X. Impacts of Chemical Fertilizer Reduction on Grain Yield: A Case Study of China. PLoS ONE 2024, 19, e0298600. [Google Scholar] [CrossRef] [Scilit]
- Song, Y.; Sun, J.; Zhang, M.; Su, B. Using the Tapio-z Decoupling Model to Evaluate the Decoupling Status of China’s CO2 Emissions at Provincial Level and Its Dynamic Trend. Struct. Change Econ. Dyn. 2020, 52, 120–129. [Google Scholar] [CrossRef] [Scilit]
- Yang, Y.; Qi, C.; Gu, Y.; Fang, G. Use Efficiency, Reduction Potential, and Effects of Fertilizers on Carbon Emissions in China’s Major Citrus Regions. Agriculture 2024, 14, 1971. [Google Scholar] [CrossRef] [Scilit]
- Bai, X.; Zhang, T.; Tian, S. Evaluating Fertilizer Use Efficiency and Spatial Correlation of Its Determinants in China: A Geographically Weighted Regression Approach. Int. J. Environ. Res. Public Health 2020, 17, 8830. [Google Scholar] [CrossRef] [Scilit]
- Qi, L.; Li, Y. Balancing Productivity and Carbon Emissions: The Potential for Carbon Reduction in Wheat Fertilization Practices in China. Front. Environ. Sci. 2024, 12, 1427250. [Google Scholar] [CrossRef] [Scilit]
- Zhang, Y.; Zheng, Y.; Xu, J. Research on Factors Influencing Green Production Efficiency of Grain and Its Associative Pathways. Pol. J. Environ. Stud. 2024, 33, 4959–4971. [Google Scholar] [CrossRef] [Scilit] [PubMed]
- Liu, Q.; Wu, K.; Song, W.; Zhong, N.; Wu, Y.; Fu, X. Improving Crop Nitrogen Use Efficiency Toward Sustainable Green Revolution. Annu. Rev. Plant Biol. 2022, 73, 523–551. [Google Scholar] [CrossRef] [Scilit] [PubMed]
- Zhu, Q.; Voort, M.V.D.; Ren, G.; Bai, J. Impact of Information and Communication Technologies on Fertilizer and Pesticide Use Efficiency of China’s Grain Production. Rev. Dev. Econ. 2023, 27, 2331–2356. [Google Scholar] [CrossRef] [Scilit]
- Luo, H.; Hu, Z.; Hao, X.; Khan, N.; Liu, X. Assessment and Comparison of Agricultural Technology Development Under Different Farmland Management Modes: A Case Study of Grain Production, China. Land 2022, 11, 1895. [Google Scholar] [CrossRef] [Scilit]
- Yang, S.; Wang, H.; Tong, J.; Ma, J.; Zhang, F.; Wu, S. Technical Efficiency of China’s Agriculture and Output Elasticity of Factors Based on Water Resources Utilization. Water 2020, 12, 2691. [Google Scholar] [CrossRef] [Scilit]
- Jiang, Y.; Feng, Z.; Bo, Y. Mechanisms and Impact Effects of Digital Agriculture Development on Agricultural Eco-Efficiency in China. Sustainability 2024, 16, 4148. [Google Scholar] [CrossRef] [Scilit]
- Zmyślona, J.; Sadowski, A.; Pawłowski, K.P. How Can Overinvestment in Farms Affect Their Technical Efficiency? A Case Study From Poland. Agriculture 2024, 14, 1799. [Google Scholar] [CrossRef] [Scilit]
- Wang, P.; Zhang, W.; Li, M.; Han, Y. Does Fertilizer Education Program Increase the Technical Efficiency of Chemical Fertilizer Use? Evidence From Wheat Production in China. Sustainability 2019, 11, 543. [Google Scholar] [CrossRef] [Scilit]
- Rudinskaya, T.; Náglová, Z. Analysis of Consumption of Nitrogen Fertilisers and Environmental Efficiency in Crop Production of EU Countries. Sustainability 2021, 13, 8720. [Google Scholar] [CrossRef] [Scilit]
- Liu, S.; Lin, Y.; Ye, Y.; Xiao, W. Spatial-Temporal Characteristics of Industrial Land Use Efficiency in Provincial China Based on a Stochastic Frontier Production Function Approach. J. Clean. Prod. 2021, 295, 126432. [Google Scholar] [CrossRef] [Scilit]
- Sun, X.; Guang, S.; Cao, J.; Zhu, F.; Liu, J.; Sriboonchitta, S. Effect of Agricultural Production Trusteeship on Agricultural Carbon Emission Reduction. Agriculture 2023, 13, 1457. [Google Scholar] [CrossRef] [Scilit]
- Hua, J.; Gao, J.; Chen, K.; Li, J. Driving Effect of Decoupling Provincial Industrial Economic Growth and Industrial Carbon Emissions in China. Int. J. Environ. Res. Public Health 2023, 20, 145. [Google Scholar] [CrossRef] [Scilit] [PubMed]
- Wang, Y.; Khor, L.Y.; Siddig, K. Socioeconomic Factors Determining Fertilizer Use in China for Different Crops: Same Factors, Different Effects. Agron. J. 2018, 110, 1813–1819. [Google Scholar] [CrossRef] [Scilit]
- Billé, A.G.; Rogna, M. The Effect of Weather Conditions on Fertilizer Applications: A Spatial Dynamic Panel Data Analysis. J. R. Stat. Soc. Ser. A Stat. Soc. 2022, 185, 3–36. [Google Scholar] [CrossRef] [Scilit]
- Grekousis, G. Geographical-XGBoost: A New Ensemble Model for Spatially Local Regression Based on Gradient-Boosted Trees. J. Geogr. Syst. 2025, 27, 169–195. [Google Scholar] [CrossRef] [Scilit]
- Gu, Z.; Cao, M.; Wang, C.; Yu, N.; Qing, H. Research on Mining Maximum Subsidence Prediction Based on Genetic Algorithm Combined with XGBoost Model. Sustainability 2022, 14, 10421. [Google Scholar] [CrossRef] [Scilit]
- Yuan, Q.; He, M.; Chen, Z.; Liu, M.; Chen, X. A Real-Time Prediction Method for Rate of Penetration Sequence in Offshore Deep Wells Drilling Based on Attention Mechanism-Enhanced BiLSTM Model. Ocean Eng. 2025, 325, 120820. [Google Scholar] [CrossRef] [Scilit]
- Li, S.; Jiang, Z.; Zhu, Z.; Jiang, W.; Ma, Y.; Sang, X.; Yang, S. A Framework of Joint SOC and SOH Estimation for Lithium-Ion Batteries: Using BiLSTM as a Battery Model. J. Power Sources 2025, 635, 236342. [Google Scholar] [CrossRef] [Scilit]
- Zhang, Y.; Lu, X. A Comprehensive Evaluation of Food Security in China and Its Obstacle Factors. Int. J. Environ. Res. Public Health 2023, 20, 451. [Google Scholar] [CrossRef] [Scilit]
- Du, Y.; Jiang, J.; Li, C. Ecological Efficiency Evaluation of Marine Ranching Based on the Super-SBM Model: A Case Study of Shandong. Ecol. Indic. 2021, 131, 108174. [Google Scholar] [CrossRef] [Scilit]
- Tang, C.; Xie, X.; Wei, G.; Pan, L.; Qi, Z. Exploring the Evolutionary Characteristics of Food Security in China and the United States From a Multidimensional Perspective. Foods 2024, 13, 2272. [Google Scholar] [CrossRef] [Scilit] [PubMed]
- Xie, D.; Bai, C.; Xiao, W. Institutional Environment, Development Model Transformation and North–South Economic Disparity in China. Growth Change 2022, 53, 1877–1906. [Google Scholar] [CrossRef] [Scilit]
- Hu, L.; Zhang, X.; Zhou, Y. Farm Size and Fertilizer Sustainable Use: An Empirical Study in Jiangsu, China. J. Integr. Agric. 2019, 18, 2898–2909. [Google Scholar] [CrossRef] [Scilit]
- Xin, L.; Li, X.; Tan, M. Temporal and Regional Variations of China’s Fertilizer Consumption by Crops During 1998–2008. J. Geogr. Sci. 2012, 22, 643–652. [Google Scholar] [CrossRef] [Scilit]
- Qiao, J.; Cao, Q.; Zhang, Z.; Cao, Z.; Liu, H. Spatiotemporal Changes in the State of Food Security Across Mainland China During 1990–2015: A Multi-Scale Analysis. Food Energy Secur. 2022, 11, e318. [Google Scholar] [CrossRef] [Scilit]
- Sun, Y.; Hu, R.; Zhang, C. Does the Adoption of Complex Fertilizers Contribute to Fertilizer Overuse? Evidence from Rice Production in China. J. Clean. Prod. 2019, 219, 677–685. [Google Scholar] [CrossRef] [Scilit]
- Lee, C.; Zeng, M.; Luo, K. Food Security and Digital Economy in China: A Pathway Towards Sustainable Development. Econ. Anal. Policy 2023, 78, 1106–1125. [Google Scholar] [CrossRef] [Scilit]
- Wu, Z.; Feng, X.; Zhang, Y.; Fan, S. Repositioning Fertilizer Manufacturing Subsidies for Improving Food Security and Reducing Greenhouse Gas Emissions in China. J. Integr. Agric. 2024, 23, 430–443. [Google Scholar] [CrossRef] [Scilit]
- Hisbani, W.A.; Manono, B.O.; Nawaz, M.; Mehmood, K.; Hasnain, Z.; Rais, A.; Irshad, S.; Ibrar, D.; Siddiqui, M.H.; Alamri, S.; et al. Assessing the Influence of Potassium Fertilizer Variations on Growth, Yield, and Crop Quality of Sugarcane (Saccharum officinarum L.) Genotypes. Int. J. Plant Prod. 2025, 19, 155–166. [Google Scholar] [CrossRef] [Scilit]
- Buresh, R.J.; Pampolino, M.F.; Witt, C. Field-Specific Potassium and Phosphorus Balances and Fertilizer Requirements for Irrigated Rice-Based Cropping Systems. Plant Soil 2010, 335, 35–64. [Google Scholar] [CrossRef] [Scilit]
- Huang, N.; Lin, X.; Lun, F.; Zeng, R.; Sassenrath, G.F.; Pan, Z. Nitrogen fertilizer use and climate interactions: Implications for maize yields in Kansas. Agric. Syst. 2024, 220, 104079. [Google Scholar] [CrossRef] [Scilit]
- Rangaiah, K.M.; Nagaraju, B.; Kasturappa, G.; Maragondanadibba Nanjundappa, S.; Sugaturu Narayanaswamy, U.K.; Srivastava, S.; Dey, P. Assessment of fertilizer prescription equations, crop and soil performance with different nutrient management practices for green gram (Vigna radiata) in Southern India’s Alfisols. Sci. Rep. 2025, 15, 31954. [Google Scholar] [CrossRef] [Scilit]
- Ji, Y.; Liu, H.; Shi, Y. Will China’s fertilizer use continue to decline? Evidence from LMDI analysis based on crops, regions and fertilizer types. PLoS ONE 2020, 15, e0237234. [Google Scholar] [CrossRef] [Scilit]
- Cao, G.; Zhang, L.; Wang, G.; Zheng, J.; Liang, F. Effect of Different Potassium Fertilizer Application Rates on the Yield and Potassium Utilization Efficiency of Maize in Xinjiang, China. Agronomy 2026, 16, 72. [Google Scholar] [CrossRef] [Scilit]
- Yang, S.; Chen, H.; Li, Z.; Ruan, Y.; Yang, Q. Temporal and Spatial Analysis of Fertilizer Application Intensity and Its Environmental Risks in China From 1978 to 2022. Environ. Sci. Eur. 2024, 36, 188. [Google Scholar] [CrossRef] [Scilit]
- Zhan, X.; Shao, C.; He, R.; Shi, R. Evolution and Efficiency Assessment of Pesticide and Fertilizer Inputs to Cultivated Land in China. Int. J. Environ. Res. Public Health 2021, 18, 3771. [Google Scholar] [CrossRef] [Scilit] [PubMed]
- Wang, X.; Xu, M.; Lin, B.; Bodirsky, B.L.; Xuan, J.; Dietrich, J.P.; Stevanović, M.; Bai, Z.; Ma, L.; Jin, S.; et al. Reforming China’s Fertilizer Policies: Implications for Nitrogen Pollution Reduction and Food Security. Sustain. Sci. 2023, 18, 407–420. [Google Scholar] [CrossRef] [Scilit]
- Qian, C.; Antonides, G.; Zhu, X.; Heerink, N.; Lades, L.K. Do Economic Preferences and Personality Traits Influence Fertilizer Use? Evidence from Rice Farmers in Eastern China. J. Environ. Psychol. 2024, 96, 102328. [Google Scholar] [CrossRef] [Scilit]
- Zhang, J.; Balkovič, J.; Azevedo, L.B.; Skalský, R.; Bouwman, A.F.; Xu, G.; Wang, J.; Xu, M.; Yu, C. Analyzing and Modelling the Effect of Long-Term Fertilizer Management on Crop Yield and Soil Organic Carbon in China. Sci. Total Environ. 2018, 627, 361–372. [Google Scholar] [CrossRef] [Scilit]
- Yu, X.; Schweikert, K.; Li, Y.; Ma, J.; Doluschitz, R. Farm Size, Farmers’ Perceptions and Chemical Fertilizer Overuse in Grain Production: Evidence from Maize Farmers in Northern China. J. Environ. Manag. 2023, 325, 116347. [Google Scholar] [CrossRef] [Scilit]
- Hu, Y.; Liu, Y. Impact of Fertilizer and Pesticide Reductions on Land Use in China Based on Crop-Land Integrated Model. Land Use Policy 2024, 141, 107155. [Google Scholar] [CrossRef] [Scilit]

Disclaimer/Publisher’s Note: The statements, opinions and data contained in all publications are solely those of the individual author(s) and contributor(s) and not of MDPI and/or the editor(s). MDPI and/or the editor(s) disclaim responsibility for any injury to people or property resulting from any ideas, methods, instructions or products referred to in the content. |
© 2026 by the authors. Licensee MDPI, Basel, Switzerland. This article is an open access article distributed under the terms and conditions of the Creative Commons Attribution (CC BY) license.