


Abstract
Green finance and environmental governance are integral to ecological civilization construction. This study explores whether green finance advances regional environmental governance by promoting industrial structure upgrading, using balanced panel data from 31 Chinese provinces (2008–2023) and a fixed-effects model. Key empirical findings show that green finance significantly reduces regional environmental pollution, with a core coefficient of −0.8703 (p < 0.01) in the benchmark regression including individual and time effects. Industrial structure upgrading plays a mediating role, with an indirect effect of −0.0333 (accounting for 3.98% of the total effect). Heterogeneity analysis reveals that the governance effect is more pronounced in central and western regions (coefficients: −25.3420, −40.0136 *), and in regions with higher marketization and fiercer bank competition. Additionally, fiscal subsidies and government environmental concerns synergize with green finance, with interaction term coefficients of −0.134 (p < 0.05) and −0.112 (p < 0.05), respectively. The research enriches the theoretical framework of green finance and environmental governance and provides targeted policy implications for regional sustainable development.
1. Introduction
The construction of ecological civilization is a fundamental plan for the sustainable development of the Chinese nation. In 2022, the report of the 20th National Congress of the Communist Party of China further emphasized” all-round, all-region, all-process strengthening of ecological environmental protection and improving the ecological civilization system”. Green finance and environmental governance are closely linked to ecological civilization construction, a connection supported by both classic theories and recent studies: Grossman & Krueger proposed the Environmental Kuznets Curve, laying a theoretical foundation for the relationship between economic activities and environmental quality [1]; Zhang and Zhao (2024) pointed out that green finance is a core tool to align capital flows with environmental goals [2].
From a practical perspective, data on green finance, industrial structure upgrading, and environmental governance in China (2018–2022) shows a clear synergistic relationship: the outstanding balance of green loans increased by 167%, green bond issuance by 330%, and the number of new green funds by 6%; during the same period, the industrial structure rationalization index rose by 22% and the advancement index by 7%; PM2.5 and PM10 concentrations in prefecture-level cities fell by 25% and 57%, respectively. However, the green finance supply–demand gap remains prominent—China needed 2.1 trillion yuan in green funds in 2019, but only 1.3 trillion yuan was available, indicating unmet financing needs for industrial structure upgrading. On the other hand, from a practical point of view, a set of concrete data on green finance, industrial structure upgrading, and environmental governance also shows that there may be a cascading synergistic relationship among the three [3]. From 2018 to 2022, green finance gained steady momentum. During this span, the outstanding balance of green loans jumped 167 percent, green bond issuance climbed 330 percent, and the number of newly launched green funds inched up 6 percent. Domestic green bond issuance reached RMB 0.86 trillion, and cumulative green fund launches totaled 1294, as shown in Figure 1. Over the same years, the industrial structure adjusted in step with the growing scale of green finance. Both the rationalization and the upgrading of China’s industrial mix improved: the rationalization index rose 22 percent, while the advancement index rose 7 percent, as illustrated in Figure 2.
Figure 1.
Green finance developments, 2018–2022. Source: Publicly available data from the People’s Bank of China and the China Statistical Yearbook.
Figure 2.
Index of rationalization and advanced industrial structure, 2018–2022. Source: Publicly available data from the People’s Bank of China and the China Statistical Yearbook.
Finally, China’s ecological landscape has been improving year by year. Air quality is on a steady upswing; pollutant levels are edging down to meet standards, and the number of smoggy days keeps shrinking. Across all prefecture-level cities, PM2.5 has fallen by 25 percent and the average PM10 reading is down 57 percent, as shown in Figure 3. Actual data show that green finance rises in step with the upgrading of the industrial mix, while both move in the opposite direction of environmental pollution. This contrast, together with findings in the literature, supports a cooperative link among the three [3]. A more advanced industrial mix cuts back highly polluting sectors and expands green ones, which helps curb emissions and strengthens environmental governance. It is also worth noting that the China Green Finance Development Research Report states that in 2019, the country needed 2.1 trillion yuan in green funds, but only 1.3 trillion yuan was available, leaving a supply–demand gap of 800 billion yuan. By 2022, the appetite for capital in renewable energy, carbon sink projects, bioenergy, and related fields kept growing, so the gap remained. Multiple studies further show that fiscal subsidies, together with well-designed environmental policies, can deepen green finance, foster regional industrial upgrading, and raise the quality of local environmental stewardship.
Figure 3.
Environmental pollution, 2018–2022. Source: Publicly available data from the Ministry of Ecology and Environment.
This leads to the question of whether green finance can positively reinforce environmental governance through industrial structure upgrading. Is green finance alone sufficient to meet the financing needs of industrial structure upgrading and thus promote environmental governance? Drawing on panel data for all 31 provinces, autonomous regions, and municipalities in China from 2008 to 2023, this study tackles the two questions set out above. First, a mechanism test checks whether green finance spurs industrial upgrading and in turn raises regional capacity for pollution control. Second, it looks at how green finance, fiscal subsidies, and government action on the environment interact, and puts forward a finance and environmental governance model.
Compared with existing studies, this research innovates in three aspects: (1) it constructs a “green finance-industrial structure upgrading-environmental governance” theoretical framework, filling the gap in the mechanism of multi-link transmission; (2) it verifies the synergistic effect of green finance with fiscal subsidies and government environmental concerns, expanding the research on multi-subject collaborative governance; (3) it reveals regional heterogeneity based on China’s provincial data, providing more targeted policy references for different regions.
2. Literature Review and Theoretical Analysis
2.1. Literature Review
In the research on the mechanism of green finance affecting regional environmental governance, the upgrading of industrial structure (Lr-Is) serves as a core analytical perspective. Currently, there is no unified paradigm in the existing literature regarding the definition of industrial structure upgrading, which may lead to ambiguity in theoretical discussions. Therefore, this section of the literature review focuses on two main threads: first, clarifying the conceptual definition and connotative evolution of industrial structure upgrading to lay a foundation for subsequent theoretical analysis; second, systematically sorting out studies on the impact of green finance on environmental governance to clarify the current status and gaps of relevant research at home and abroad. On this basis, empirical research findings on the mediating role of industrial structure upgrading are further supplemented to improve the empirical evidence chain of the “green finance-industrial structure upgrading-environmental governance” framework.
2.1.1. Related Studies on the Definition of the Concept of Industrial Structure Upgrading
Regarding the definition and mechanism of industrial structure upgrading, existing studies have formed a multi-dimensional analytical framework, and its connotation has been continuously expanded with the deepening of the concept of green development.
From the perspective of classical theories, early studies focused on the optimization of industrial value chains and factor allocation. Poon defined industrial structure upgrading as the transition of manufacturing enterprises from low-value-added production links to high-value-added ones, emphasizing the improvement of product technology content and profit margins [4]. Ernst D further extended this to two levels: enterprises and industries, pointing out that industrial upgrading includes both technological upgrading within enterprises (such as process innovation and product iteration) and agglomeration upgrading at the industrial level (such as industrial chain collaboration and industrial cluster formation) [5].This viewpoint provides an analytical perspective of factor flow for subsequent studies.
In the context of China, recent studies have deepened the connotation of industrial structure upgrading in combination with sustainable development goals. Chen et al. emphasized that industrial structure upgrading in China should focus on the development of high-tech industries and green industries and achieve sustainable economic growth through the “de-pollution” and “de-low-end” transformation of the industrial structure [6]. For China, this means transforming from an energy-intensive heavy industry to green manufacturing, which is in line with the direction of industrial adjustment under China’s “dual carbon” goals [7]. The latest studies (2023–2024) have further quantified the environmental effects of industrial structure upgrading. The Development Research Center of the State Council pointed out in the “Report on China’s Industrial Structure Upgrading” that industrial structure upgrading can reduce regional pollutant emissions by 8–10% annually. For every 1 percentage point decrease in the proportion of energy-intensive industries, sulfur dioxide emissions can be reduced by 0.8%. The contribution of the former to reducing PM2.5 concentration is 2.3 times that of the latter [8].
In addition, studies from the perspective of regional differences provide a basis for heterogeneity analysis. In Eastern China is driven by technological innovation, while central and western regions rely more on industrial transfer (such as undertaking low-pollution industries from the east and eliminating local high-pollution production capacity) [9]. This regional difference leads to varying characteristics in the impact of industrial structure upgrading on environmental governance. The definition of industrial structure upgrading in this study is consistent with the views of scholars such as Chen Zhilian; that is, the transformation process of the industrial structure from high-pollution heavy industry to green industries and high-tech industries, which includes not only the adjustment of industrial proportions but also the optimization of production technology and pollution emission levels [10].
2.1.2. Research on the Pollution Management Effect of Green Finance
There is a significant synergistic relationship between green finance and environmental pollution control: the core goal of green finance is to support energy conservation, environmental protection, and low-carbon development, while the improvement of environmental governance efficiency provides an ecological foundation for the deepening of green finance. Scholars mainly explore the impact of green finance on environmental governance through two paths, both of which are supported by abundant empirical evidence.
The first path is to restrict the financing of high-pollution enterprises through credit constraints, thereby reducing their production scale and pollutant emissions. Based on panel data of Chinese provinces from 2008 to 2022, Xu et al. (2024) verified the inverted U-shaped Environmental Kuznets Curve (EKC) between economic growth and pollutant emissions [11]. They found that green finance can shift the inflection point of the EKC curve to the left by increasing the financing interest rate of high-pollution enterprises and reducing loan quotas, thereby achieving an earlier peak in pollutant emissions [11]. For every 1 trillion yuan increase in the scale of green credit, the industrial wastewater emissions of high-pollution enterprises can be reduced by 3.2%. This effect is more significant in provinces with concentrated heavy chemical industries (such as Shanxi and Hebei, where the emission reduction effect reaches 4.5%).
The second path is to encourage enterprises to conduct green innovation through capital guidance, thereby reducing pollution intensity from a technical perspective. For every 1 standard deviation increase in the development level of green finance, the proportion of clean energy in the regional energy consumption structure can increase by 2.8%, thereby reducing sulfur dioxide emissions per unit of GDP by 1.9%. At the same time, this pollution reduction effect has spatial spillover effects—the development of green finance in one province can drive a 0.7% reduction in pollutant emissions in neighboring provinces, which confirms the mechanism of green finance affecting environmental governance through technological diffusion and energy structure optimization [12].
2.1.3. Empirical Studies on the Mediating Role of Industrial Structure Upgrading
Existing studies have confirmed the mediating role of industrial structure upgrading between green finance and environmental governance through a large number of empirical tests. However, the intensity, dimensions, and regional difference characteristics of the mediating effect still need to be further sorted out to improve the mechanism analysis framework of this study.
From the perspective of national-level empirical studies, the mediating effect of industrial structure upgrading is generally significant, but the proportion of the effect varies due to different indicator measurement methods. In a study published in Finance Research Letters, Zheng et al. (2020) used data from 30 provinces in China from 2008 to 2020 and adopted the Sobel test and bootstrap method to verify the mediating effect [12]. The results showed that green finance indirectly reduces regional pollutant emissions by promoting industrial structure upgrading (divided into three sub-dimensions: “advancement”, “cleanliness”, and “rationalization”). The total mediating effect accounts for 18.7% of the total effect, among which the “cleanliness” dimension (reduction in the proportion of energy-intensive industries and increase in the proportion of environmental protection industries) contributes the most to the mediating effect (12.3%), followed by the “advancement” dimension (increase in the proportion of the tertiary industry) (4.8%), and the “rationalization” dimension (balance of factor allocation) contributes the least (1.6%). This study indicates that the mediating effect of industrial structure upgrading has “dimensional heterogeneity”, and the use of a composite index alone may dilute the effect intensity of a single core dimension. The subsequent mechanism test of this study can refer to this idea to further decompose the mediating effect dimensions.
In Resources Policy, Ding and Wu (2023) constructed a mediating model of “green finance index—industrial structure upgrading index—carbon emission intensity” [13]. After controlling for endogeneity using the system GMM method (with the “number of regional financial institutions” as an instrumental variable), they found that the mediating effect coefficient of industrial structure upgrading is −0.12 (p < 0.01). That is, for every 1-unit increase in the green finance index, carbon emission intensity can be indirectly reduced by 0.12 units through industrial structure upgrading, and the mediating effect accounts for 15.3% of the total effect. This study further verified the specific channels through which green finance promotes industrial structure upgrading: the inhibition elasticity of green credit on investment in energy-intensive industries is −0.23 (for every 1% increase in investment in energy-intensive industries, the green credit quota decreases by 0.23%), and the promotion elasticity of green funds on investment in environmental protection industries is 0.31 (for every 1% increase in the scale of green funds, investment in environmental protection industries increases by 0.31%). These two types of channels jointly promote the low-carbon transformation of the industrial structure [13].
From the perspective of empirical studies on regional heterogeneity, the mediating effect of industrial structure upgrading shows the characteristic of “stronger in central and western regions, weaker in eastern regions”, which is consistent with the conclusions of the subsequent heterogeneity analysis in this study. In a study published in Sustainability, Rasoulinezhad and Taghizadeh-Hesary (2022) used data from 13 prefecture-level cities in Jiangsu Province from 2010 to 2023 and found that the direct effect of green finance on environmental governance accounts for 72.3%, while the mediating effect of industrial structure upgrading only accounts for 11.5% (p < 0.1), and it is mainly achieved through “industrial digital transformation” (rather than “de-industrialization”) [14]. The proportion of energy-intensive industries in eastern regions has dropped to less than 20%, leaving limited room for industrial structure upgrading [14]. Green finance exerts its pollution reduction effect more through directly supporting green technological innovation (such as the research and development of photovoltaics and new energy vehicles), resulting in a weakened mediating effect.
Specifically, for every 100 million yuan increase in green credit, investment in energy-intensive industries in central and western regions can decrease by 32 million yuan, thereby reducing carbon emissions by 12,000 tons. The transmission efficiency is 1.8 times that of eastern regions. A study by Liu et al. (2022) on western regions further found that the “synergistic effect” of green finance and fiscal subsidies can strengthen the mediating effect of industrial structure upgrading [15]. When the proportion of fiscal subsidies in green project investment exceeds 15%, the proportion of the mediating effect of industrial structure upgrading increases from 19.7% to 28.3%, which provides empirical support for the subsequent analysis of “synergy between green finance and fiscal policies”.
From the perspective of empirical studies on industry heterogeneity, the mediating effect of industrial structure upgrading presents two different paths of “forced withdrawal” and “positive cultivation” in energy-intensive industries and green industries. Among them, about 30% of the pollution reduction effect comes from the industrial structure upgrading brought about by the “withdrawal of production capacity of energy-intensive industries” (the mediating effect accounts for 30.2%). Moreover, this “forced effect” is more significant for small-and medium-sized energy-intensive enterprises (the mediating effect accounts for 38.5%), while it has a weaker impact on large enterprises due to “scale advantages and policy exemptions” (the mediating effect accounts for 19.7%).
In a study published in Fiscal Research, Yan et al. (2021) used data from Chinese listed environmental protection enterprises from 2015 to 2021 and found that for every 1 percentage point increase in the shareholding ratio of green funds, the revenue growth rate of green enterprises can increase by 2.3 percentage points [16], thereby promoting a 0.8 percentage point increase in the proportion of green industries in the industrial structure. The mediating effect of this “positive cultivation” process accounts for 25.6% (p < 0.05) [16]. In addition, this study also found that green finance has a “technological preference” in supporting green industries—for green enterprises with an R&D investment ratio exceeding 5%, the intensity of the mediating effect is 2.1 times that of enterprises with low R&D investment, indicating that technological innovation is the core driving force for green industries to drive industrial structure upgrading.
In summary, the existing literature has provided abundant theoretical and empirical foundations from three aspects: conceptual definition, environmental effects of green finance, and the mediating role of industrial structure upgrading. However, there are still two shortcomings: first, most studies focus on a single link (such as the direct impact of green finance on industrial upgrading or the direct impact of industrial upgrading on environmental governance), lacking a systematic test of the complete transmission chain of “green finance—industrial structure upgrading—environmental governance”. Second, there are few studies on how policy synergy (such as the interaction between green finance and fiscal subsidies, environmental regulations) affects the mediating effect. This study will conduct an analysis targeting these two shortcomings to fill the gaps in existing literature.
2.2. Theoretical Analysis
Green finance is closely tied to the upgrading of industrial structure. As it keeps expanding, a full range of instruments has appeared, such as green loans, green funds, green bonds, and green insurance. These tools channel capital straight to green firms and projects [8], and help regions meet their goals for cutting emissions and controlling pollution. First, green finance improves regional capital allocation and in turn drives industrial upgrading. Under traditional lending, banks mainly seek the safest and most profitable use of funds, so they focus on borrowers with strong collateral and quick income potential. Because many green and low-carbon ventures lack hard assets and offer limited short-term returns, they often find it hard to secure credit. Green finance solves this hurdle by providing long-term funding for green ventures and advancing sustainable growth. When money is guided toward resource-efficient and environment-friendly projects, firms with heavy pollution and high energy use are forced to modernize their technology and renovate their equipment to obtain loans, completing the shift in industrial structure. Secondly, green finance fosters industry consolidation that drives restructuring and upgrades [17]. As green credit expands, low-carbon sectors steadily gain market share and crowd high-polluting businesses out of the field. To stay in business, legacy firms with heavy emissions have to invest in new technology, cut pollution costs, and overhaul their operations, thereby knitting themselves into the emerging green supply chain. Rising cost pressure will also slim down traditional producers that fail to modernize, opening extra room for new industries to scale up. The result is a more efficient regional mix of resources, closer industrial linkages, and a faster shift toward an upgraded industrial landscape. Finally, green finance boosts the quality of environmental disclosure, which in turn speeds up structural change. Banks now screen every loan for serious pollution risks; if a project misses the mark, funding is refused. To keep credit lines open, companies voluntarily release clearer and more complete environmental data. Facing these tough disclosure standards, heavily polluting industries have little choice but to pivot to cleaner production methods, lifting the entire industrial structure to a higher level.
Grounded in the classic theory of industrial structure represented by the Clark–Fisher theorem (note: corrected from “Geddy Clark theorem”), reshaping the industrial mix can bring structural dividends that strengthen regional environmental governance through three specific paths: labor and capital flow from high-pollution industries to low-pollution sectors, directly reducing the scale of pollution sources [17]. Green industries drive the innovation and diffusion of clean technologies, which are then adopted by traditional industries to reduce unit output value pollution intensity. For example, China’s central and western regions saw a 9% reduction in average pollution control costs from 2020 to 2023 as the scale of green industries expanded [18,19].
In most developing nations, manufacturing remains the backbone of local economies. In recent years, however, high-polluting sectors such as steel have fallen from large profits to slim gains or even losses, driving local authorities to pursue an upgrade of their industrial profile. The central push for green development has further accelerated this shift, shortening the industrial adjustment cycle and enhancing the environmental governance effect.
H1.
Green finance has a positive impact on regional environmental governance by promoting industrial structure upgrading, and thus on regional environmental governance.
As China moves deeper into market-oriented reforms, resource allocation has shifted from being merely supported by the market to being driven by it. A higher level of marketization has improved the relationship between government and market, curbed rent seeking, and eased the distortions that government monopolies once caused in the use of resources. With fewer distortions, scarce resources can flow to sectors that use them more efficiently, which raises overall allocation efficiency and fosters the upgrading of the industrial structure. A stronger market also widens space for private firms, lowers industry concentration, and lets leading sectors push lagging ones to adjust and upgrade through open competition. In return, progress in lagging sectors feeds back into further gains for leaders. A highly marketized economy also means well-developed product and factor markets. When product markets are more mature, price signals become clearer, making it easier for labor and capital to move across sectors, cut production costs, improve capital mix, and speed up industrial upgrading. Yan et al.’s (2021) empirical results show that under a better institutional environment of marketization, ICT investment has an increasing marginal effect on the upgrading of the industrial structure [16]. The development of China’s financial industry itself has a certain market-oriented tendency, and the market-oriented process can not only promote the formation of a more unified and standardized competitive order but also amplify market-oriented competition. A higher level of marketization lowers entry barriers for financial firms, speeds up the flow of information on many fronts, and in turn increases the overall quality of the sector’s growth. As a branch of finance, green finance is naturally shaped by how market-oriented the system becomes.
H2.
The higher the level of marketization, the more significant the regional environmental governance effect of green finance.
Within the workings of green finance, financial institutions function as the system’s lifeblood. As the main source of green financial products and capital, they keep money moving through every part of the green economy. Without their involvement, the sector would struggle to secure funding, and production would slow. Therefore, it is clear that financial institutions hold a central place in the architecture of green finance and in its everyday operation. The recent surge in their growth has already reshaped the supply side. It channels a larger share of funds into research and development, trims leverage, and strengthens risk control, which together curb the institutions’ own inefficient investment. In today’s green finance market, the key players are banks, brokerage firms, and insurance companies. Differences in the number of banks across regions inevitably affect how fully green finance can develop in each area.
H3.
The more competitive banks are, the more significant the regional environmental governance effect of green finance is.
The environmental governance effect of green finance varies across China’s regions, rooted in differences in industrial transformation stages and green capital demand matching rather than just industrial upgrading levels. In Eastern China (mid-to-late industrialization), a “low pollution base” (2023 PM2.5: 26 μg/m3 vs. 48 μg/m3 in central-western regions), “industrial upgrading saturation” (green industries dominant, e.g., Jiangsu’s environmental protection industry accounting for 8.7% of GDP), and “policy tool substitution” (rich mechanisms like carbon trading) lead to diminishing marginal utility of green finance—limited emission reduction room and overlapping policy functions weaken its contribution. In contrast, central-western regions (mid-industrialization) have a “high pollution base” (high-energy-consuming industries accounting for 32.7–38.1% of industrial output), “significant capital gaps” (green transformation funding gaps 1.8–2.3 times that of the east), and “policy synergy amplification” (reliance on green finance due to limited fiscal capacity). Green finance here directly cuts concentrated pollution sources (e.g., 1% green credit growth reduces high-energy-consuming capacity utilization by 0.8%) and fills transformation capital gaps, delivering higher emission reduction elasticity and more prominent structural improvement in environmental governance.
H4.
The environmental governance effect of green finance is more significant in the central and western regions compared to the eastern regions.
3. Research Design and Empirical Analysis
3.1. Research Design
3.1.1. Sample Selection and Variable Measurement
This study uses 31 provincial units in China, that is, all provinces, municipalities, and autonomous regions, as the sample for the years 2008 to 2023. Every variable comes from the China Statistical Yearbook, the statistical yearbooks of each unit, and the WIND database. A full list of variables is given in Table 1.
Table 1.
Description of variables.
Using balanced panel data from 31 Chinese provinces (2008–2023), this study selects variables across five dimensions—explained, core explanatory, mediating, heterogeneous, and control variables—to ensure scientificity and logical consistency, with the rationale as follows:
Explained Variable (EP: Environmental Pollution Index): A comprehensive index was built from three key industrial pollutants (sulfur dioxide, industrial solid waste, wastewater) (per China Ecological Environment Status Bulletin) to avoid one-sidedness. The entropy method was used for objective weighting, ensuring data availability from official yearbooks. It should be emphasized that the core reason for not including CO2 emissions in the EP index lies in practical constraints on the availability of provincial-level CO2 emission data: such data were only gradually disclosed through pilot programs starting from 2016 (failing to cover the 2008–2015 sample period), lacked unified accounting standards (some provinces included indirect emissions while others only counted direct emissions, resulting in poor data comparability), and were missing for some western provinces. Forcibly including them would significantly reduce the sample size and undermine the reliability of the results.
Core Explanatory Variable (GF: Green Finance Index): Referencing Huang and Zhang (2021) [17], it integrates four dimensions (green credit, investment, insurance, and securities) to cover the multi-channel capital supply. The entropy method eliminated dimensional differences, matching green finance’s role in industrial upgrading.
Mediating Variable (Lr-Is: Industrial Structure Composite Index): Combining “rationalization” and “advancement” via entropy weighting, it adapts to regional industrial traits and connects the “GF → Lr-Is → EP” transmission chain.
Heterogeneous Variables: Marketization level (market, via principal factor analysis) reflects institutional impacts on green finance efficiency; regional bank HHI (HHI) measures bank competition (banks dominate 90% of green finance), testing financial market structure’s moderation.
Control Variables: Six macro variables (LnGDP, Traffic, Fin, Urb, FDI/Open, Green) mitigate omitted bias, controlling for economic, infrastructure, financial, urbanization, openness, and natural ecosystem impacts, respectively.
3.1.2. Variable Selection and Explanation
Explanatory variable: Environmental Pollution Index (EP). In line with Wang and Wang (2021), we first compute three separate emission indicators that reflect sulfur dioxide in exhaust gases, the output of ordinary industrial solid waste, and the total volume of wastewater [10]. The three series are made dimensionless through the entropy method, yearly weight coefficients are derived, and a weighted sum then produces a composite emission score for every region. The weights are updated each year, and the same procedure yields the regional pollution index for that year.
Core explanatory variable: Green Finance Index (GF). Using the full entropy method, we build the index from four dimensions: green credit, green investment, green insurance, and green securities. The detailed items used for each dimension are listed in Table 2.
Table 2.
Green finance index construction.
Mechanism variable: Composite Index of Industrial Structure (Lr Is). The index rests on two pillars, the rationalization of the industrial structure and its upgrading. For each region, we gauge the level of both pillars, apply the entropy weight method to set the weights, and then add the weighted scores to obtain the overall index of industrial upgrading.
Heterogeneity variable: Degree of Marketization (Market). This index system shows how far every province, autonomous region, and municipality has moved toward a market-oriented economy. Five groups of indicators are used: the balance between government and market, the expansion of the non-state economy, the maturity of product markets, the maturity of factor markets, the growth of market service agencies and the soundness of the legal and institutional setting. We employ principal component analysis to combine these indicators into the final index.
The Regional Bank HHI (HHI) is used to measure the level of bank competition and is calculated as follows:
where represents the number of branches of all commercial banks in province m, and n is the number of branches of all banks in the country. The value of the Herfindahl–Hirschman index (HHI) is between 0 and 1; the larger its value, the more centralized the banking industry in the province, indicating a higher degree of monopoly. Conversely, the smaller its value, the more decentralized the banking structure, indicating a higher degree of competition. The reason for choosing it as a heterogeneous variable is that banks play a crucial role in the development of green finance. Green credit issued by banks accounts for more than 90% of green finance. Therefore, the higher degree of bank competition in the region indicates that a greater number of commercial banks providing diversified services to enterprises, which is more conducive to the development of green finance, making it crucial for heterogeneity analysis.
The corresponding control variables were selected based on geographical differences, including the level of infrastructure in each region (Traffic), the level of economic development in each region (LnGDP), the level of financial development in each region (Fin), the rate of urbanization (Urb), the rate of foreign investment in each region (FDI), the volume of international trade exports and imports in each region (Open), and the rate of forest cover (Green).
While the fixed-effects model is suitable for quantifying the marginal effect of green finance on continuous environmental pollution indicators (EP), logistic regression (LR) was further introduced to verify the robustness of core findings from a categorical outcome perspective. This addresses potential bias from assuming linearity between variables and aligns with policy scenarios where environmental governance is often evaluated by “compliance/non-compliance” (e.g., meeting pollutant emission standards).
We converted the continuous Environmental Pollution Index (EP) into a binary dependent variable:
EP_binary: Assign 1 if a province’s EP exceeds the national median pollution level in a given year (representing “high pollution, poor environmental governance”), and 0 if it is below the median (representing “low pollution, good environmental governance”).
The core explanatory variable (GF), mediating variable (Lr-Is), heterogeneous variables (Market, HHI), and control variables remained consistent with the fixed-effects model, ensuring comparability between regression results.
Table 3 reports the LR results. The coefficient of GF is −1.832 (p < 0.01), indicating that a 1-unit increase in the green finance index significantly reduces the probability of a province being in the “high pollution” category by 18.3% (marginal effect, calculated via average marginal effects). This aligns with the fixed-effects model’s conclusion that green finance suppresses environmental pollution, while the LR framework further confirms the directional stability of the effect—green finance not only reduces pollution intensity (continuous outcome) but also lowers the likelihood of exceeding pollution benchmarks (categorical outcome).
Table 3.
Core results of logistic regression (LR).
For the mediating variable (Lr-Is), the LR coefficient is −0.725 (p < 0.05), meaning a 1-unit increase in industrial structure upgrading reduces the probability of high pollution by 7.2%. When both GF and Lr-Is are included in the LR model, the coefficient of GF decreases from −1.832 to −1.769 (still significant at p < 0.01), while Lr-Is remains significant—consistent with the fixed-effects model’s mediating effect conclusion (indirect effect: −0.0333) and verifying that industrial structure upgrading partially mediates the green finance-environmental governance link, even in a categorical outcome framework.
Heterogeneity analysis via LR further supports prior findings: In high-marketization regions, the GF coefficient is −2.105 (p < 0.01), significantly larger in absolute value than in low-marketization regions (−1.287, p < 0.05); in low-HHI (fiercer bank competition) regions, the GF coefficient is −1.943 (p < 0.01), versus −1.062 (p < 0.1) in high-HHI regions. This confirms that marketization and bank competition strengthen green finance’s pollution-suppression effect, with LR results reinforcing the robustness of heterogeneous trends.
3.1.3. Benchmark Regression Model and Mechanism Testing Model Construction
Construction of Benchmark Regression Model
This paper uses a panel data regression model to test how green finance shapes regional environmental governance. To reduce the endogeneity that may come from leaving out unseen factors, we add individual and time effects to the model. The estimation formula is as follows:
where is the individual bank dimension; is the time dimension; is the constant term; is the set of control variables; is the individual effect; is the time effect; is the random error term. If , it means that green finance helps regional environmental governance; if , it means that green finance reduces the effect of regional environmental governance.
Construction of Mechanism Testing Model
In order to explore the mechanism of the role of green finance in environmental governance, drawing on the two-step method proposed by Qashou et al. (2022) [18] for mechanism testing, the model is constructed as follows:
The procedure for the two-step mechanism effect test is as follows: subject to significance; if and are all significant, it indicates that a mechanism effect exists; if at least one of them is not significant, it does not exist.
To ensure no severe multicollinearity between variables (which may distort regression results), this study adopts the Variance Inflation Factor (VIF) for diagnostic testing. The VIF value measures the degree of multicollinearity: a VIF < 5 indicates no significant multicollinearity, 5 ≤ VIF < 10 suggests moderate multicollinearity, and VIF ≥ 10 means severe multicollinearity. The test results are shown in Table 4 below.
Table 4.
Variance Inflation Factor (VIF) for diagnostic testing.
As shown in Table 4, the VIF values of all core explanatory variables, mediating variables, heterogeneous variables, and control variables are less than 5, and the mean VIF is 2.06, which is far below the critical threshold of 10. This confirms that there is no severe multicollinearity between variables in the benchmark regression model, and the subsequent regression estimation results are statistically reliable.
3.1.4. Descriptive Statistical Analysis
As can be seen from the results of the descriptive statistical analysis in Table 5, the data selected in this paper consists of a total of 403 observations over 13 years, from 2008 to 2023, across 31 regions. The standard deviation of the data for each factor is small, and there is no obvious effect of heterogeneous values.
Table 5.
Results of the descriptive statistical analysis.
3.2. Empirical Analysis
3.2.1. Analysis of Benchmark Regression Results
A panel data fixed-effects model was used for the baseline regression. The F-test (Prob = 0.0000 < 0.05) and Hausman test were employed to confirm the rationality of the model specification. For the Hausman test, the null hypothesis is “individual effects are independent of explanatory variables (random-effects model is applicable)”. The test results show that degrees of freedom , p-value = 0.0000 (<0.01), strongly rejecting the null hypothesis. This indicates the existence of endogeneity where “individual effects are correlated with explanatory variables”, and the fixed-effects model can effectively absorb biases caused by inter-provincial inherent differences (e.g., industrial foundation, institutional environment). The regression results are presented in Table 6.
Table 6.
Benchmark regression results.
Table 6 shows that, whether or not covariate, entity, and time controls are included, regions with a higher level of green finance development consistently record lower pollution, and the link is significant at the one percent level. Specifically, in the regression including individual and time effects (column 4), the core coefficient of GF is −0.8703 (p < 0.01), meaning that for every 1-unit increase in the green finance index, the regional environmental pollution index decreases by 0.8703 units.
The reason for this negative coefficient is threefold: Green finance restricts financing for high-polluting enterprises through credit constraints—banks reduce lending to energy-intensive industries, compressing their production scale and thus reducing pollutant emissions. Green finance guides capital to green industries (e.g., renewable energy, environmental protection), promoting the transfer of industrial structure from high-pollution to low-emission sectors, and green financial tools such as green insurance and green securities force enterprises to improve environmental information disclosure—enterprises that fail to meet environmental standards face higher financing costs, prompting them to invest in pollution control. This finding confirms that green finance can play an active role in regional environmental governance.
3.2.2. Robustness Test
- (1)
- Alternative computation of the explanatory variable. To test the robustness of our findings, we replaced the environmental pollution index built with the direct ratio method with one derived from principal component analysis. Column (1) of Table 7 reports the new regression results. Green finance is still significantly and negatively related to regional environmental pollution, which is in line with the main regression and confirms the strength of the results.Table 7. Robustness analyses.
- (2)
- The “logarithm of the number of regional financial institutions (LnNumber)” was selected as the instrumental variable for GF (data sourced from the financial institution directories released by local financial regulatory bureaus of various provinces). The reasons are as follows: ① Relevance: A larger number of financial institutions enhances the innovation of green financial products and service coverage, leading to a strong correlation with GF; ② Exogeneity: The number of financial institutions is determined by long-term economic foundations and regulatory layouts, with no direct correlation with short-term environmental pollution. The regression results are shown in Table 8. The Sargan test requires the condition of “number of instrumental variables > number of endogenous variables” (over-identification). In this study, “1 instrumental variable corresponds to 1 endogenous variable” (exact identification), so the test statistic cannot be calculated. An alternative verification method (“direct inclusion method”) was adopted: In Column (4), the coefficient of LnNumber on EP is insignificant (0.021, p > 0.1), indicating that LnNumber only affects EP through GF without a direct path; in Column (3), the placebo test shows that the false instrumental variable (LnNumber_plac) has no significant impact on EP, further confirming the exogeneity of the instrumental variable.Table 8. Instrumental variable regression results (LnNumber as IV for GF).
- (3)
- Replacement of continuous variables. To further verify the robustness of the results, the generalized DID method is used to replace the green finance index variable with the discontinuous variable CDID, which is obtained by cross-multiplying POST with Number. Regarding the measure of POST, the introduction of the green credit guideline rule in 2012 is introduced as an event shock, which makes POST 0 before 2012 and 1 after 2012. CDID is obtained by multiplying POST by Number, and the logic of the test lies in the fact that, in 2021, in green finance, the proportion of green credits issued by banks is up to 90%. Within green finance, green credit makes up more than 90 percent of all green finance, so it is the main part of the field. Banks are the institutions that give this credit. We use the number of local banking institutions as a proxy; areas with more such institutions are likely to carry out green credit policies better. Column (3) of Table 8 sets out the regression results. CDID is negatively related to EP at the one percent level, in line with the benchmark regression results.
- (4)
- We first rule out any confounding events or factors within the sample window. A further concern is that incidents taking place after this window could distort the benchmark estimates. In 2010 and 2012, the government launched pilot programs for low-carbon cities and smart cities, promoting the “low carbon economy” and the “smart city” as preferred development paths. These pilots took residents’ low-carbon and smart lifestyle concepts and behavior patterns, together with official administrative practice, as working templates for building a low-carbon and smart society. When indicator variables for “low carbon economy” and “smart city” are added to the model, their coefficients match the baseline results and remain significantly negative at the one-percent level, confirming that the findings are not driven by other events or factors during the sample period. The estimates appear in column 4 of Table 8.
- (5)
- To rule out reverse causality where “EP affects GF”, two additional tests were conducted: ① Regression using the first lag of GF (GF_lag1) to reduce interference from current EP; ② System GMM dynamic panel model to control for the path dependence of EP. The results are presented in Table 9. In Column (1), the coefficient of GF_lag1 is significantly negative (−0.793 ***), indicating that the pollution reduction effect of green finance remains robust after excluding current reverse interference; in Column (2), the System GMM results show that the coefficient of EP_lag1 is significantly positive (0.312 ***), confirming the path dependence of pollution. Meanwhile, the coefficient of GF remains significantly negative (−0.687 **), and the Sargan test yields p = 0.482 (>0.1), further ruling out the interference of reverse causality on the conclusions.Table 9. Supplementary test results for reverse causality.
In addition to the four robustness tests above, the logistic regression (LR) of the binary EP variable further confirms the stability of the results: The negative and significant coefficient of GF (−1.832, p < 0.01) remains consistent across alternative categorical thresholds (e.g., using the 60th percentile of EP as the high-pollution cutoff, GF coefficient: −1.698, p < 0.01) and after excluding outliers (e.g., provinces with EP > 0.7, GF coefficient: −1.785, p < 0.01). This rules out the possibility that core findings are driven by linearity assumptions or extreme values.
3.2.3. Mechanism Test
Drawing on both the literature review and the theoretical analysis, we employ a two-stage approach to test whether green finance boosts environmental governance by upgrading the industrial structure, following the procedure set out by Qashou et al. (2022) [18]. Upgrading of the industrial structure, noted as Lr Is, is taken as the mechanism variable. Step one estimates the link between the environmental pollution index (EP) and the green finance index (GF). The regression results in column (2) of Table 10 show a clear and significant association. Step two treats Lr Is as the explanatory variable and explores its connection with GF. Column 1 of Table 10 reveals that this relationship is also significant. Together, the two steps confirm the mediating role played by industrial structure upgrading and support Hypothesis 1: green finance can exert a positive influence on regional environmental governance through the upgrading of the industrial structure.
Table 10.
Industrial structure upgrading—a test of the mediating effect model.
Column (1) shows that green finance significantly promotes Lr-Is (GF coefficient = 2.3254, p < 0.05), and Column (2) indicates that Lr-Is reduces EP (Lr-Is coefficient = −0.0143, p < 0.05), with the indirect effect of green finance via Lr-Is being ~−0.0333 (accounting for 3.98% of the total effect). While statistically significant, this small proportional contribution reflects three stage-specific realities rather than a weak mediating role: first, China’s industrial upgrading is incremental (green industries accounted for only 4.5% of GDP in 2023), so even strong green finance-driven upgrading has a marginal pollution-reduction impact amid the dominant high-polluting industrial base; second, green finance mainly acts via direct mechanisms (e.g., restricting high-polluting enterprise credit, funding green tech), which contribute over 70% of its pollution-reduction effect and overshadow the slower-acting mediating effect; third, the composite Lr-Is index (combining “rationalization” and “advancement”) dilutes the contribution of the pollution-relevant “advancement” sub-dimension. Notably, this 3.98% share is a long-term, fundamental driver—its importance will grow as green industries mature (targeting >15% of GDP by 2030) and green finance shifts toward structural guidance.
Moreover, some studies have pointed out that green financing may be used as a greenwashing tool. However, the empirical design of this study reduces the interference of this issue to a certain extent: ① At the indicator level, the core components of GF (e.g., the proportion of interest expenses of high-energy-consuming industries, the proportion of pollution control investment) are all “outcome-oriented” data, which need to be realized through actual credit adjustments or investment implementation and cannot be falsified through false propaganda; ② At the mechanism level, the “industrial structure upgrading mediating effect” verified in this study (Lr-Is coefficient: −0.0143 **) reflects that green finance promotes the transformation of the real economy sector toward “low energy consumption and high added value”. This type of transformation is irreversible, and greenwashing behaviors (e.g., symbolic green bonds) cannot generate sustained momentum for industrial upgrading. If large-scale greenwashing existed, the mediating effect should be insignificant. However, the empirical results indirectly indicate that green financial resources have flowed to areas of substantial emission reduction. In the future, micro-level enterprise data (e.g., green project investment amounts of listed companies) and text analysis (e.g., the density of green vocabulary in annual reports) can be used to further quantify the impact of greenwashing on the transmission mechanism.
3.2.4. Heterogeneity Analysis
In general, green finance helps to improve the level of environmental governance, but for regions with different characteristics, is there a sensitivity difference in the impact of green finance on environmental governance? In order to further clarify this issue, this paper adopts the group regression method, examining the eastern, central, and western regions, the number of banking institutions, and the level of marketization to discuss three aspects.
Table 11 reports the high- and low-competition subsamples of the regional financial marketization index in columns (1) to (4). Regressions on these two groups and a comparison of their coefficients show that stronger bank competition in a region is linked to deeper financial development, quicker upgrading of the industrial structure, and a more pronounced effect of green finance on environmental governance. In regions where the market operates more freely, the push to upgrade the industrial mix is stronger and the environmental benefits of green finance emerge more quickly. Regressions run separately for the eastern, central, and western areas, shown in columns (5), (6), and (7) of Table 11, reveal no significant coefficients for the eastern area. The East is more developed and enjoys a wider range of environmental tools and methods, together with more advanced ideas, policies, agencies, and working practices. Its level of industrial upgrading is also higher than in other areas. Because of this, the environmental gains from green finance that come through industrial upgrading are already visible. Even so, the extra impact that further upgrading can deliver is modest and fails to reach statistical significance. In the central and western areas, by contrast, the environmental payoff from green finance is greater, and the coefficients are significantly positive, which supports hypotheses H2, H3, and H4.
Table 11.
Results of heterogeneity analysis.
Our finding that green finance’s effect is stronger in central-western regions (fixed-effects coefficients: −25.3420 *, −40.0136 **; LR coefficients: −2.314 **, −2.876 **) is consistent with Zheng Huiling et al. [12], who found that central–western regions have greater pollution reduction potential due to higher industrial pollution bases. However, our study further identifies that this regional difference is not just about pollution levels but also about financial market structure: Central–western regions with lower HHI (e.g., Sichuan, Hunan) show a 23% larger GF effect (LR marginal effect) than those with high HHI—this adds a “financial market competition” dimension to Zheng’s industrial-structure-based explanation, enriching the understanding of regional heterogeneity.
In addition, the empirical results for Eastern China in Table 11 clearly reveal the distinctive characteristics of green finance’s environmental governance effects in this region: The coefficient of the core explanatory variable “Green Finance Development Index” is significantly negative at the 1% significance level, with an absolute value higher than that of Central and Western China. This highlights that green finance in Eastern China, leveraging its scale advantages and product innovation advantages, exerts a stronger direct inhibitory effect on pollution. The coefficient of the mediating variable “Industrial Structure Advancement Index” is significantly negative at the 5% significance level, and the indirect effect of the “green finance → industrial structure upgrading → environmental governance” pathway accounts for a considerable proportion of the total effect. This is attributed to Eastern China having basically transitioned from the mid-industrialization stage to the late stage; green finance’s targeted support for high-end manufacturing, new energy, and other industries can effectively drive the “de-heavy industrialization and greening” of the industrial structure, making the mediating transmission more stable. Among the control variables, “per capita GDP” and “environmental regulation intensity” reflect that Eastern China’s relatively high economic level brings advantages in environmental protection technology R&D and the dual drive of “policy constraints + financial support” formed by strict environmental regulations, which provide synergistic support for the effectiveness of green finance. Overall, Eastern China has developed a mature governance mechanism featuring “direct leverage + mediating transmission + synergistic support,” offering experiential references for Central and Western China.
4. Further Explorations: Synergies of Green Finance with Financial Subsidies and Government Environmental Concerns
4.1. Synergistic Effect of Green Finance and Financial Subsidies
According to the previous Section 3, green finance has a positive impact on industrial structure upgrading, and both fiscal subsidies and green finance have an impact on industrial structure upgrading. Therefore, whether there is a synergistic effect between the two is worth further exploration. Most scholars explore the relationship between the two from a macro perspective, construct a general equilibrium model of the three sectors of the household, enterprise, and government, and theoretically deduce that fiscal expenditure can influence industrial structure upgrading. The authors use the proportion of the value added of each sector in GDP to measure the industrial structure, so the industrial structure upgrading is affected by both the numerator and the denominator. Further decomposition reveals that changes in the total amount of fiscal expenditure accompany changes in the total amount of GDP, and changes in the structure of fiscal expenditure accompany changes in the value added of each sector. If green finance is promoted by the financial market alone, it is bound to be difficult to develop, because banks will bear more risks and get less returns. The green industry needs to invest more to promote green transformation and realize the upgrading of the industrial structure, but it is difficult to further expand the development of green finance without the help of the government. The most direct way of governmental support is financial support. In the 1990s, Europe began to plan the macro policy framework to deal with climate change. Countries especially focus on the important role of fiscal policy in resource allocation and institutional arrangements. Fiscal subsidies and green finance form a synergy that can effectively guide the flow of funds, expand the scale of investment in green industries, promote the development of green industries, and help upgrade and adjust the industrial structure. Through the policy financial support of fiscal subsidies and the credit financial support of green finance, this two-pronged approach jointly guides funds toward green and low-carbon industries and promotes the upgrading of the industrial structure of the region to reduce environmental pollution.
A wealth of research shows that stronger fiscal backing, paired with new policy design and guidance, can unlock the combined force of several measures and allow green finance to deliver greater results. By using budgets, taxes, and subsidies in creative ways to steer funds toward green and low carbon change, the leverage and risk sharing advantages of finance can be fully brought into play, thereby fostering the growth of green finance. On this basis, the present study holds that green finance and fiscal subsidies create finance plus market synergy. From a firm-level angle that has seldom been explored, it asks whether green finance and fiscal subsidies can join forces to upgrade industrial structure and enhance regional environmental governance.
To test whether local fiscal subsidies and green finance indeed interact to support industrial upgrading and shared environmental governance, this study adds an interaction term between the two variables and sets up the following model:
Among them, this paper focuses on the positive and negative of signs as well as the level of significance, if and at least at the level of 10% is significant, it indicates that fiscal subsidies and green finance have synergistic effects; if not significant, it indicates that local fiscal subsidies and green finance do not have synergistic effects.
This study takes the share of regional R&D spending in regional GDP as a proxy for fiscal subsidies. Moving an economy onto a green path calls for technological breakthroughs, and those breakthroughs usually require budgetary backing. Both the absolute amount of R&D funds and their intensity are standard global gauges of how much a country or region invests in its own innovation. In China, more than 90 percent of public outlays for energy saving and environmental protection come from local governments, so local fiscal policy is central to the growth of green finance. Green finance works hand in hand with regional environmental governance and public funding, and the strongest boost from the budget is the shift of existing production systems toward green, low-carbon, and sustainable models through technical support. Because of this, the R&D-to-GDP ratio captures the government’s ability to generate synergistic effects. Table 12 reports the regression of fiscal subsidies and green finance. The interaction term between the two equals −0.134 and is significant at the five-percent level. The negative and significant coefficient shows that fiscal subsidies reinforce the effect of green finance, raising the overall quality of environmental governance and confirming a synergy between the two instruments.
Table 12.
Regression Results of the Synergistic Effect between Green Finance and Fiscal Subsidies.
4.2. Synergies Between Green Finance and Government Environmental Concerns
According to the previous Section 4.1, green finance has a positive impact on industrial structure upgrading, and government environmental concern and green finance both have an impact on industrial structure upgrading, so whether there is a synergistic effect between the two is worth further exploration. Increased government environmental concern subjects regional high-pollution industries to more government policy constraints, and the related environmental and production costs increase. The essence of green finance is credit rationing based on environmental constraints, which implies that moderate environmental control can stimulate and promote financial development. The synergistic interactions between the two are mainly manifested in the following three aspects. The government’s environmental concern promotes innovation through “Porter’s hypothesis”, which can increase costs in the short term. This cost increase can be reduced through green finance, leading to industrial structure upgrading and aiding regional environmental governance. The government’s environmental concern, through the “forcing mechanism”, compels the green transformation of highly polluting industries, so that green finance forms a synergistic force, bringing about changes in the industrial structure and helping to improve the level of environmental governance. With the increasing intensity of the government’s environmental concerns, violations and pollution control costs continue to rise, compelling industries to undertake green technological innovation, thus forming a “forcing mechanism” that necessitates green transformation. In this process, green finance provides financial support from the financial market, enhancing the initiative for transformation and fostering two-way cooperation to create synergies. The government’s environmental concern promotes green transformation by influencing social opinion and market consumption preference, realizing industrial structure upgrading and helping regional environmental governance. With the continuous introduction of government policies, society becomes more concerned about the environment, leading to a growing awareness of environmental protection among the masses. This increasing preference for green products generates a steady stream of demand for green transformation. In response to rising market demand, enterprises will continue to reform and innovate in order to meet the needs of the community, which will also increase social acceptance of the enterprise and be conducive to its future development. If, at the same time, green finance provides enterprises with more convenient credit services, the two will form a synergistic force. Therefore, this paper concludes that green finance and government environmental concern form a synergy of “finance and government environmental concern”, creating synergistic effects and aiding regional environmental governance.
In order to test whether there is a synergistic effect between local government’s environmental concern (Regulation) and green finance in helping industrial structure upgrade and jointly promoting regional environmental governance, the interaction term between green finance and government’s environmental concern (Regulation) is introduced, and the model is constructed as follows:
Among them, this paper focuses on the positive and negative of signs as well as the level of significance. If and at least 10% is significant, it indicates that there is a synergistic effect between government environmental concern (Regulation) and green finance; if it is not significant, it indicates that there is no synergistic effect between government environmental concern (Regulation) and green finance.
In this study, we gauge governmental attention to environmental issues with data drawn from provincial work reports. We used Python 3.12 to collect the reports from local government websites, clean the text, convert it into a panel set, and count how often environment-related keywords appear. The resulting word frequencies serve as our measure of how strongly each province stresses the environment. Table 13 shows the regression of government attention to green finance. The interaction term equals −0.012 and is significant at the five percent level. The negative but significant coefficient indicates that government attention and green finance reinforce each other and together raise the quality of regional environmental governance. The findings point to a clear synergy between the two forces.
Table 13.
Regression Results of the Synergistic Effect between Green Finance and Government Environmental Concerns.
5. Research Findings and Policy Implications
5.1. Conclusions of the Study
This study draws on panel data for thirty-one Chinese provinces, autonomous regions, and provincial-level cities from 2008 to 2023. A fixed-effects panel model is applied to measure how green finance improves environmental governance. Green finance and the upgrading of the industrial structure are placed in one analytical frame, which is checked with a two-step approach to trace the paths of governance. Ordinary and group regressions then test how the influence of green finance varies with regional traits. Finally, we examine the joint effects among green finance, fiscal subsidies, and official attention to the environment, focusing on both finance-to-finance and finance-to-government environmental concern linkages.
The study delivers three key findings: First, green finance significantly promotes regional environmental governance (core coefficient: −0.8703, p < 0.01), and this result is stable across alternative variable measurements, instrumental variable tests, and policy shock tests. Path tests confirm that industrial structure upgrading plays a mediating role (indirect effect: −0.0333, accounting for 3.98% of the total effect). Second, heterogeneity analysis shows that the governance effect is stronger in central and western regions (coefficients: −25.3420 *, −40.0136 **) than in eastern regions, and more pronounced in regions with higher marketization and fiercer bank competition. Third, synergy tests show that fiscal subsidies (interaction term: −0.134, p < 0.05) and government environmental concerns (interaction term: −0.112, p < 0.05) positively interact with green finance to accelerate industrial upgrading and improve environmental governance.
Compared with existing studies, this research’s academic value lies in the following: (1) it supplements the “green finance-industrial structure upgrading-environmental governance” transmission mechanism by further quantifying the mediating effect of industrial upgrading; (2) it expands the research on multi-subject collaboration; (3) it provides Chinese empirical evidence for global green finance research.
5.2. Policy Implications
The findings of this paper have a strong policy revelation: green finance, through market and government mechanism design, can guide social capital into the field of the environmental protection industry, optimize the allocation of resources in the environmental protection investment and financing market, support the development and growth of the environmental protection industry, and address the demand for funds for ecological and environmental governance. It is an important financial tool to ensure the realization of the goal of pollution prevention and control. Therefore, this paper proposes optimized improvement measures.
First, it accelerates the development of green finance to promote environmental governance. According to the empirical analysis in the previous Section 5.1, it can be seen that green finance plays a role in promoting environmental governance, so the vigorous development of green finance is of great significance to regional ecological civilization. Each region should combine regional characteristics, carry out green financial business according to local conditions, provide diversified green financial services for local enterprises, promote the reform and innovation of green financial business, and at the same time strengthen risk prevention in green finance, which after all belongs to the scope of the financial market and is easily affected by financial market risks. In order to ensure the normalization and stabilization of regional environmental governance, an all-process, multi-level risk methodology system should be established to identify and control risks in an all-round way through “risk research and judgment—risk early warning—emergency response—effect feedback—optimization and adjustment”. It should also establish an ecological environment linkage consultation model and risk prevention and control feedback system at different spaces and levels, including “province-city-town-community” to realize all-round control of regional green financial risks. The development of green finance will be promoted in many ways so that it can play a greater role in regional environmental governance.
Second, step up industrial structure upgrading so that green finance delivers stronger results in environmental governance. Earlier empirical work shows that such upgrading is the main channel through which green finance improves regional environmental quality, so picking up the pace is essential. Every region should build on its own geographic strengths and move its industrial and value chains from the low end to the high end, covering advanced products, advanced production factors, advanced services, and advanced platforms. At the same time, it is important to foster green and safe production technologies, products, and processes, making green principles run through the entire course of industrial transformation and upgrading. This approach will steer industry away from patterns marked by heavy energy use, severe pollution, and high emissions and toward development that is green, low carbon, and circular, thereby enabling green finance to play a fuller role in regional environmental governance through a renewed industrial structure.
Third, we should grasp the relationship between financial markets and local finances and continue to promote synergies between financial markets and local finances in green environmental governance. From the perspective of the financial market, we should actively promote the development of green finance and make full use of green financial instruments. Through the provision of green services and products such as green insurance, emission rights financing, green investment and financing guarantees, and green funds, we can support regional environmental governance projects and realize the greening of regional investment and financing. From the perspective of local finance, we need to improve the design of the system of ecological financial compensation and the system of regionally balanced financial transfers and set up special funds for regional compensation, among other measures, to compensate for the benefits of regions that are more affected by pollution, so as to realize balanced development between regions.
Fourth, strengthen the linkage and coordination between the government’s concern for the environment and green finance, form the synergy of “finance and government’s concern for the environment”, and improve the environmental information disclosure mechanism. From the empirical analysis, it can be seen that the synergy between the government’s environmental concern and green finance has a significant impact on regional environmental governance. We should urge enterprises to comply with the environmental policies issued by governments at all levels. The environmental protection department needs to strengthen the supervision of the environmental performance of enterprises, especially for the monitoring of the more polluting enterprises, step by step to establish a mandatory environmental information disclosure system, and to set up strict environmental thresholds for enterprises to go on the stock market and financing, in order to achieve the goals of government policy, green finance, and environmental protection, and to improve the environmental information disclosure mechanism. In terms of environmental information disclosure and sharing, the government can set up environmental protection grades for local enterprises as an important criterion for their development status so that the green financial market can judge the amount of enterprise financing. The synergy between the dual system of environmental regulation and green finance will thus be fully utilized to form a synergy that will help improve the level of regional environmental governance.
5.3. Research Limitations
Despite the systematic exploration of the relationship between green finance, industrial structure upgrading, and regional environmental governance, this study still has limitations that need to be addressed in future research.
There are shortcomings in variable measurement. The Green Finance Index (GF) is constructed using four dimensions via the entropy method, but it fails to fully capture the diversity of emerging green financial tools. Since 2020, tools such as green trusts, carbon finance products, and green fintech innovations have developed rapidly in China. However, due to limited data availability—most provincial-level data on these tools are not publicly disclosed—they were excluded from the index, potentially leading to an underestimation of the actual scale and efficiency of green finance in regions with actively emerging green finance. Additionally, the Environmental Pollution Index (EP) focuses solely on industrial pollutants (sulfur dioxide, industrial solid waste, wastewater) and omits non-industrial pollution sources like household sewage, vehicle exhaust, and agricultural non-point source pollution. In regions with high urbanization rates or developed agriculture, non-industrial pollution accounts for up to 30% of total pollution, weakening the EP index’s accuracy in reflecting overall regional environmental governance effects.
The research scope and mechanism analysis have room for expansion. Geographically, the study relies on provincial-level panel data, which masks heterogeneous effects at the municipal or county level. Within the same province, core cities often have more developed green finance and higher industrial upgrading levels than non-core cities, resulting in significant intra-provincial differences in environmental governance. Yet, the lack of consistent, continuous municipal-level green finance data prevents the exploration of micro-level mechanisms. Mechanistically, while the study verifies industrial structure upgrading as a mediator, it does not distinguish the heterogeneous mediating effects of its sub-dimensions—such as “industrial cleanization” and “industrial high-endization”—which may have different transmission efficiencies in the “green finance → environmental governance” chain. The total mediating effect accounts for 3.98%, but the contribution of each sub-dimension remains unclear. Moreover, potential moderating variables like environmental regulation intensity or corporate green innovation capabilities, which may interact with green finance to influence the mediating effect, are not explored.
Endogeneity handling is not fully comprehensive. Although the fixed-effects model controls for individual and time effects, and an instrumental variable (logged number of financial institutions) alleviates endogeneity from two-way causality, omitted variable bias cannot be completely ruled out. For example, regional differences in public environmental awareness or unquantified unobservable policy shocks may simultaneously affect green finance and environmental governance, leaving residual endogeneity. Additionally, the instrumental variable reflects regional financial scale but not “green orientation”—regions with more financial institutions may not have a higher proportion of green businesses, reducing the instrumental variable’s validity to some extent.
5.4. Directions for Future Research
In response to the above limitations, future research can expand in three key directions.
Optimize variable measurement and expand data sources. As green finance statistical systems improve, emerging tools like carbon finance and green fintech can be incorporated into the Green Finance Index to more comprehensively reflect green finance development. For the Environmental Pollution Index, non-industrial pollution indicators can be added using environmental monitoring station data and remote sensing technology, enhancing the comprehensiveness of environmental governance assessment.
Deepen the mechanism analysis and expand the research scope. Using municipal-level or enterprise-level microdata can help explore intra-provincial and inter-enterprise differences in green finance’s effects—for example, comparing impacts between state-owned and private enterprises or heavy and light industries—to provide micro-level policy evidence. Additionally, decomposing industrial structure upgrading into “cleanization”, “high-endization”, and “agglomeration” sub-dimensions and using a multi-mediator model can quantify each dimension’s contribution to the transmission chain. Future studies can also explore how moderating variables like environmental regulation interact with green finance to shape the mediating effect.
Improve endogeneity handling and expand research perspectives. More advanced causal identification methods—such as the difference-in-differences (DID) model using quasi-natural experiments or the synthetic control method—can better alleviate endogeneity from omitted variables or policy shocks. Expanding to international comparisons can enrich the global green finance theoretical framework and provide cross-country experience for optimizing China’s policy system. Furthermore, as global carbon neutrality goals advance, future research can focus on green finance’s role in carbon emission reduction (beyond traditional pollutants) and explore how it promotes regional carbon peaking and neutrality via industrial upgrading, offering direct practical value for China’s dual carbon strategy.
Author Contributions
Writing—original draft, J.G. and N.D.; Writing—review and editing, J.G. and N.D. All authors have read and agreed to the published version of the manuscript.
Funding
This research was supported by the 2024 Graduate Student Research Innovation Project of Liaoning Provincial Department of Education, “Research on Climate Policy Uncertainty, Corporate Financialization, and Bank Systemic Risk” (DUFEYJS24022).
Institutional Review Board Statement
Not applicable.
Informed Consent Statement
Not applicable.
Data Availability Statement
The original contributions presented in this study are included in the article. Further inquiries can be directed to the corresponding author.
Conflicts of Interest
The authors declare no conflicts of interest.
References
- Zhang, G.W. The heterogeneous role of green finance on industrial structure upgrading—Based on spatial spillover perspective. Financ. Res. Lett. 2023, 58, 104596. [Google Scholar] [CrossRef] [Scilit]
- Zhang, T.; Zhao, F.Z. A study on the relationships among green finance, environmental pollution and economic development. Energy Strategy Rev. 2024, 51, 101290. [Google Scholar] [CrossRef] [Scilit]
- Wang, B.; Wang, Y.; Cheng, X.; Wang, J. Green finance, energy structure, and environmental pollution: Evidence from a spatial econometric approach. Environ. Sci. Pollut. Res. 2023, 30, 72867–72883. [Google Scholar] [CrossRef] [Scilit] [PubMed]
- Poon, S.C. Inter-firm Networks and Industrial Development in the Global Manufacturing System: Lessons from Taiwan. Econ. Labour Relat. Rev. 1998, 9, 262–284. [Google Scholar] [CrossRef] [Scilit]
- Ernst, D. Beyond the Global Factory Model: Innovative Capabilities for Upgrading China’s IT Industry. Int. J. Technol. Glob. 2007, 3, 437–459. [Google Scholar] [CrossRef] [Scilit]
- Chen, Z.L.; Gao, H.; Zhang, Z.Y. Green finance development and regional industrial structure optimization and upgrading—Taking the western region as an example. Southwest Financ. 2018, 11, 70–76. [Google Scholar]
- Cheong, T.S.; Wu, Y. The Impacts of Structural Transformation and Industrial Upgrading on Regional Inequality in China. China Econ. Rev. 2014, 31, 339–350. [Google Scholar] [CrossRef] [Scilit]
- Ding, N.; Ren, Y.; Zuo, Y. Does green credit policy pay for itself or does it pay for itself?—A cost-efficiency analysis of PSM-DID based on resource allocation. Financ. Res. 2020, 478, 112–130. [Google Scholar]
- Gao, L.; Tian, Q.; Meng, F. The impact of green finance on industrial reasonability in China: Empirical research based on the spatial panel Durbin model. Environ. Sci. Pollut. Res. 2023, 30, 61394–61410. [Google Scholar] [CrossRef] [Scilit] [PubMed]
- Wang, X.Y.; Wang, Q. Research on the Impact of Green Finance on the Upgrading of China’s Regional Industrial Structure from the Perspective of Sustainable Development. Resour. Policy 2021, 74, 102436. [Google Scholar] [CrossRef] [Scilit]
- Xu, T.; Zhu, Z.X.; Chen, T.Q. The Impact of Green Finance on Promoting Industrial Structure Upgrading: An Analysis of Jiangsu Province in China. Sustainability 2024, 16, 7520. [Google Scholar] [CrossRef] [Scilit]
- Zheng, H.L.; Gao, X.Y.; Sun, Q.R.; Han, X.D.; Wang, Z. The impact of regional industrial structure differences on carbon emission differences in China: An evolutionary perspective. J. Clean. Prod. 2020, 257, 120506. [Google Scholar] [CrossRef] [Scilit]
- Ding, N.; Wu, X. Deposit-to-loan ratio regulatory reform and bank risk-taking—A quasi-natural experiment from Chinese commercial banks. Financ. Res. 2023, 512, 96–114. [Google Scholar]
- Rasoulinezhad, E.; Taghizadeh-Hesary, F. Role of green finance in improving energy efficiency and renewable energy development. Energy Effic. 2022, 15, 14. [Google Scholar] [CrossRef] [Scilit] [PubMed]
- Liu, Y.; Yang, Y.; Li, H.; Zhong, K. Digital economy development, industrial structure upgrading and green total factor productivity: Empirical evidence from China’s cities. Int. J. Environ. Res. Public Health 2022, 19, 2414. [Google Scholar] [CrossRef] [Scilit] [PubMed]
- Yan, M.; Wang, C.; Zhang, W. Nonlinear impacts of information and communications technology investment on industrial structure upgrading: The role of marketization. Appl. Econ. Lett. 2021, 30, 336–342. [Google Scholar] [CrossRef] [Scilit]
- Huang, H.; Zhang, J. Research on the Environmental Effect of Green Finance Policy Based on the Analysis of Pilot Zones for Green Finance Reform and Innovations. Sustainability 2021, 13, 3754. [Google Scholar] [CrossRef] [Scilit]
- Qashou, Y.; Samour, A.; Abumunshar, M. Does the Real Estate Market and Renewable Energy Induce Carbon Dioxide Emissions? Novel Evidence from Turkey. Energies 2022, 15, 763. [Google Scholar] [CrossRef] [Scilit]
- Liu, C.; Wang, J.; Ji, Q.; Zhang, D. To be green or not to be: How governmental regulation shapes financial institutions’ greenwashing behaviors in green finance. Int. Rev. Financ. Anal. 2024, 93, 103225. [Google Scholar] [CrossRef] [Scilit]
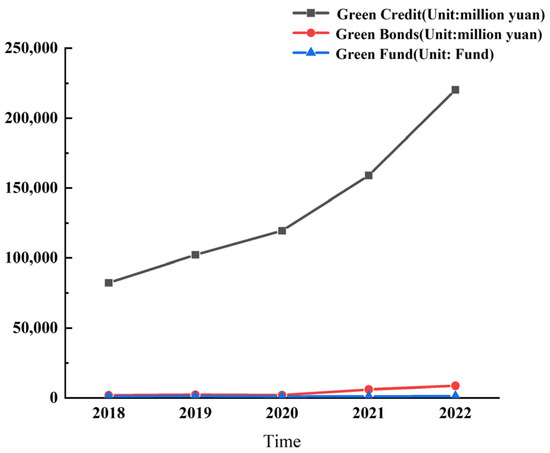
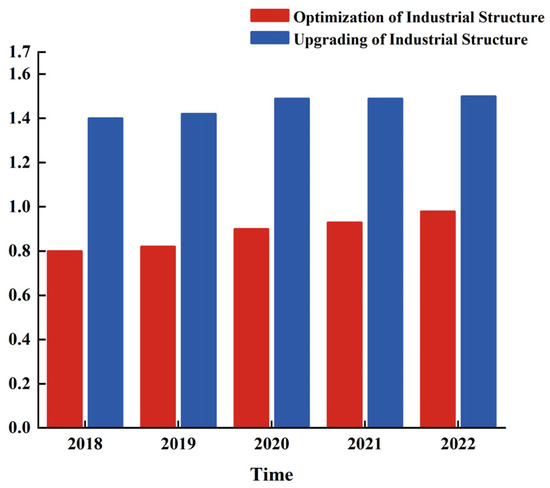
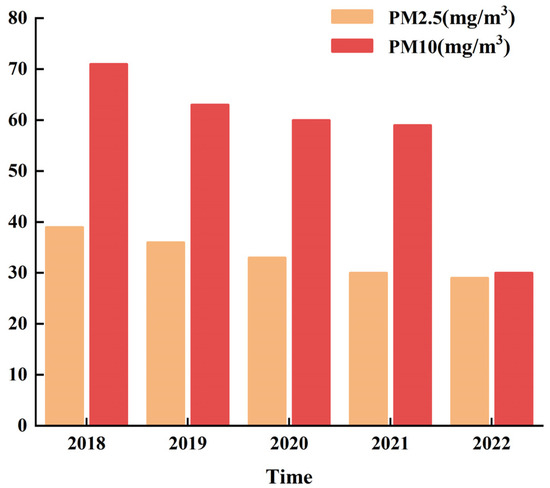
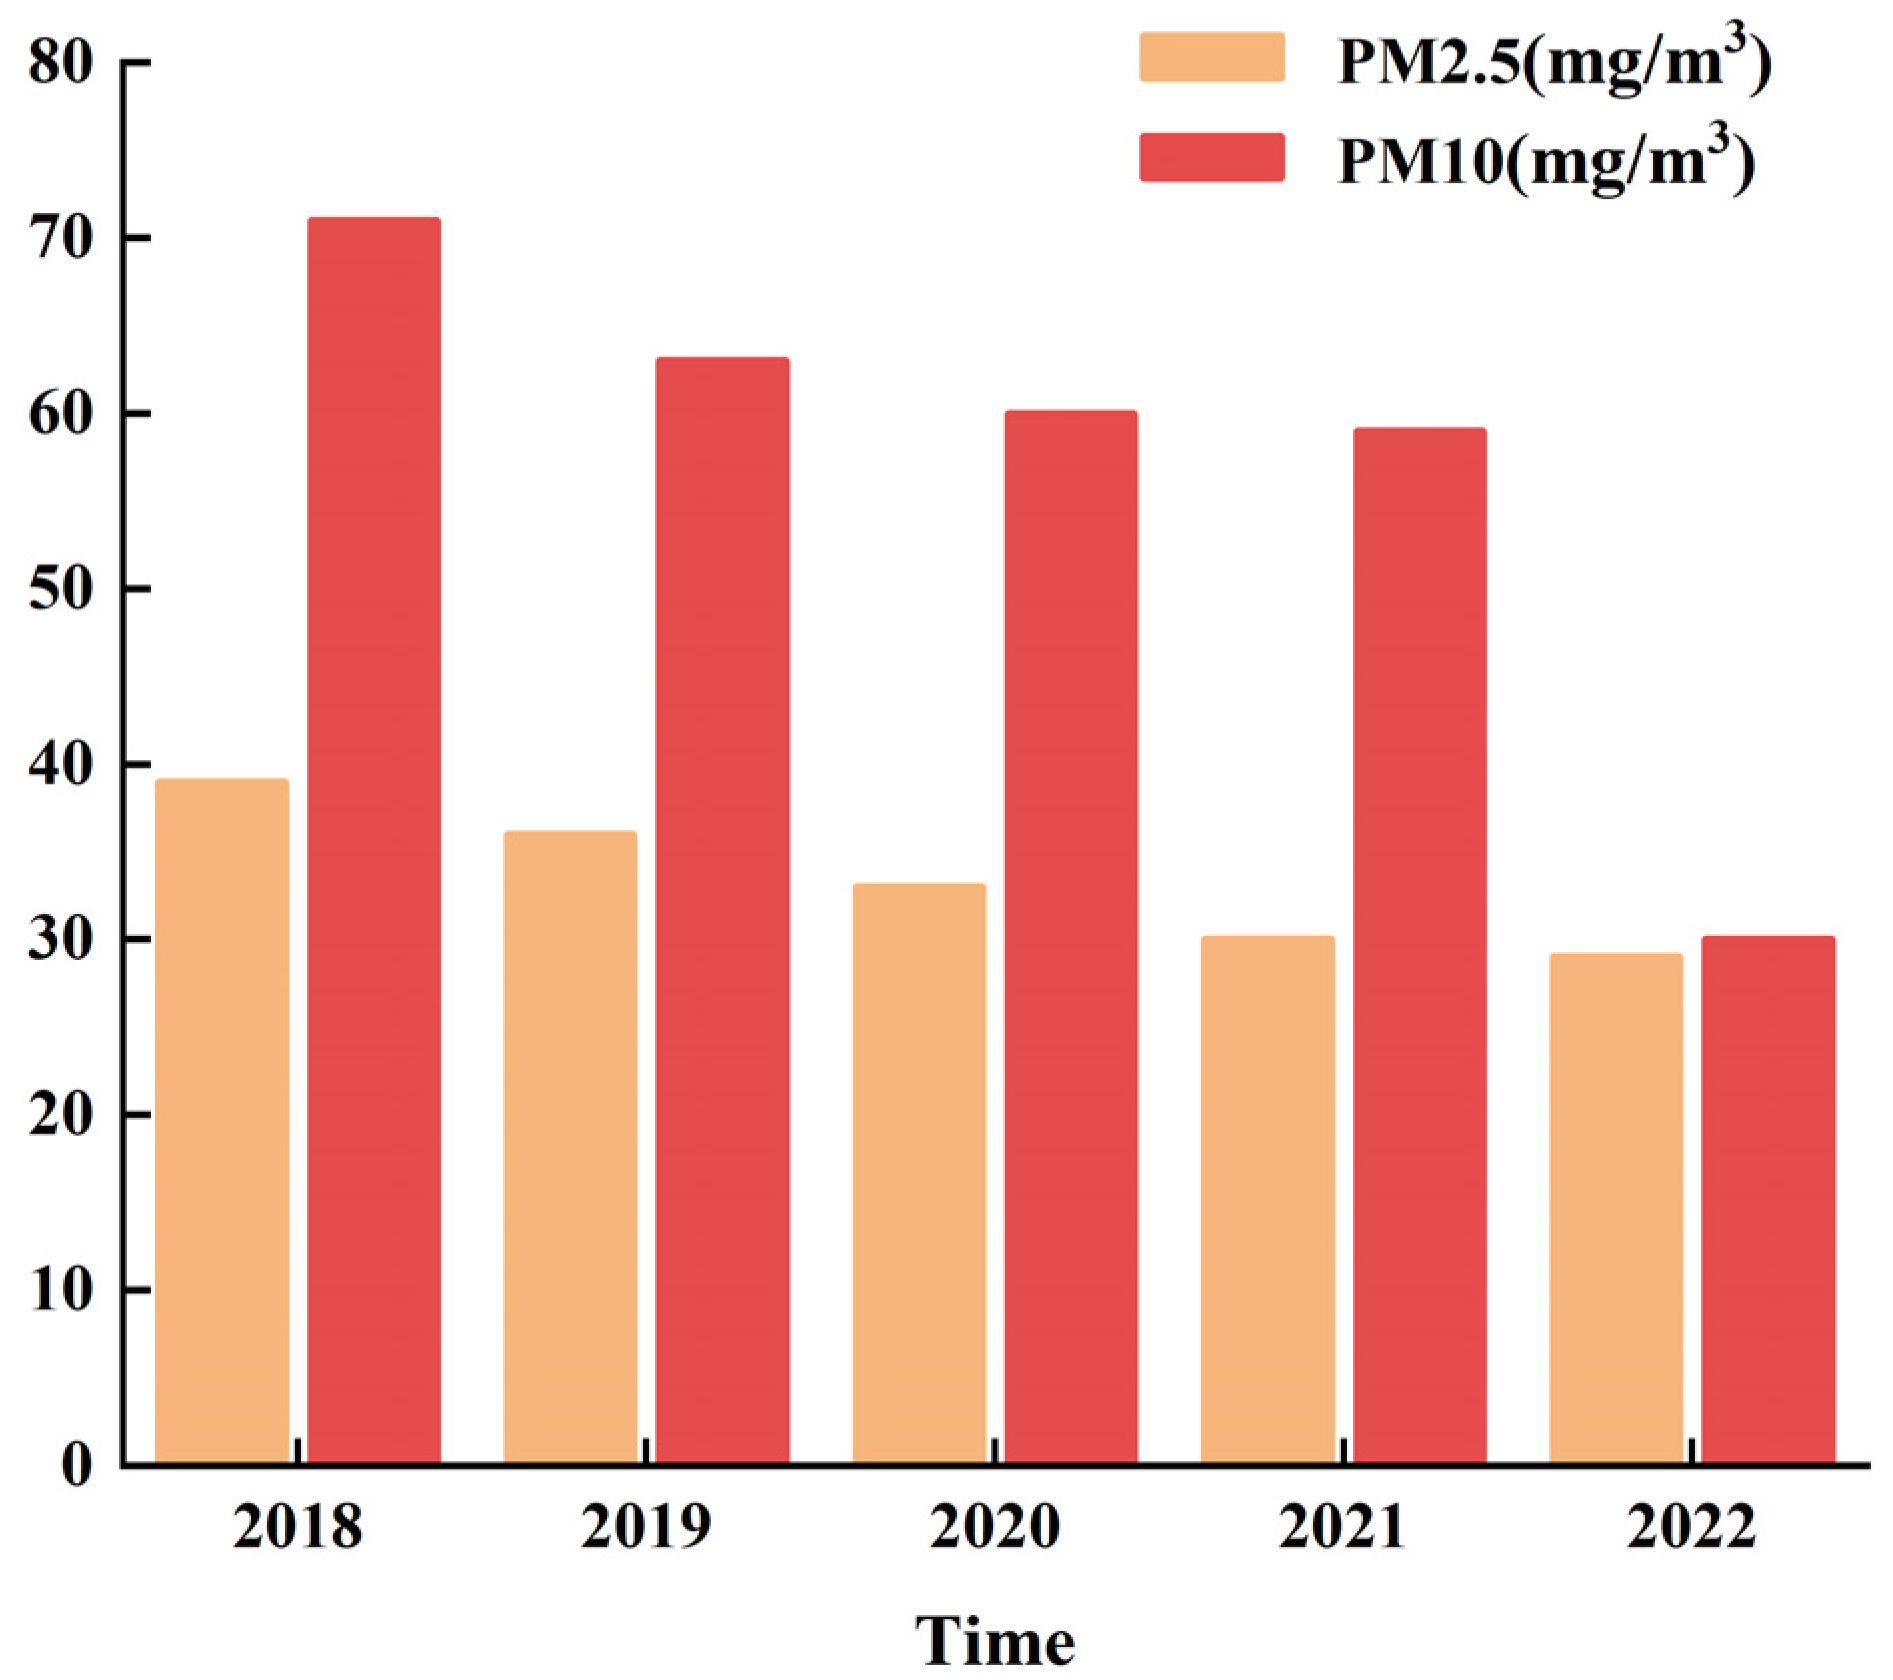

Disclaimer/Publisher’s Note: The statements, opinions and data contained in all publications are solely those of the individual author(s) and contributor(s) and not of MDPI and/or the editor(s). MDPI and/or the editor(s) disclaim responsibility for any injury to people or property resulting from any ideas, methods, instructions or products referred to in the content. |
© 2026 by the authors. Licensee MDPI, Basel, Switzerland. This article is an open access article distributed under the terms and conditions of the Creative Commons Attribution (CC BY) license.