1. Introduction
In higher education, statistics courses often represent a major challenge for students, not only because of their conceptual difficulty but also due to the negative emotions they tend to generate, such as anxiety, frustration, and low self-confidence [
1]. This phenomenon, commonly referred to as statistical anxiety, is widely identified by researches as a key factor that undermines student engagement and performance, ultimately limiting the development of essential transferable competencies such as critical thinking, problem-solving, and data-driven decision making in complex and uncertain professional environments [
2,
3].
Addressing these intertwined cognitive and emotional challenges is particularly relevant in the context of Sustainable Development Goal 4.7, which emphasizes the role of education in equipping learners with the knowledge, skills, and dispositions needed to make informed, responsible decisions and to address complex societal and organizational challenges.
In this context, traditional approaches to teaching Probability Calculus and Inferential Statistics in Business Administration and Management studies often prove to be insufficient. Methods based primarily on lectures and rote memorization may fail to actively engage students or to promote a deep understanding of statistical concepts [
4,
5]. Moreover, they tend to offer limited opportunities for students to connect abstract techniques with their practical application [
6], which may result in difficulties in grasping and applying essential skills, lower academic performance, and the persistence of negative emotional responses such as anxiety and low confidence.
Researchers in mathematics education have highlighted the role of the learning environment in shaping the emotions and motivations of students [
7], which are integral to their problem-solving behavior and classroom engagement [
8]. In this sense, emotions are not merely by-products of learning but central components of the learning process, by influencing attention, persistence, and cognitive engagement.
From this perspective, educational research increasingly calls for pedagogical approaches that move beyond traditional instruction and explicitly integrate both cognitive and emotional dimensions of learning. In response to these challenges, innovative methodologies such as Problem-Based Learning (PBL) [
9] offer a promising alternative. PBL is a student-centered instructional approach in which learners acquire knowledge and skills through the active resolution of complex-world or simulated problems, typically in collaborative settings. Unlike traditional lecture-based methods, PBL emphasizes self-directed learning, critical thinking, and the application of knowledge to practical contexts [
9,
10,
11].
In this study, PBL is implemented through structured group-based activities in which students collaboratively analyze statistical problems, receive continuous feedback from the instructor, and produce explanatory outputs (e.g., videos). Unlike more traditional PBL approaches, which often rely on minimal instructor intervention and a high degree of student autonomy, the implementation adopted in this study incorporates structured guidance and continuous feedback, tailored to the specific context of statistics education. This approach aligns with previous research [
12,
13,
14] emphasizing the role of guided support and scaffolding in PBL, particularly in disciplines such as statistics where conceptual complexity may require additional instructional structure.
PBL emphasizes active learning through problem-solving and collaboration within contextually embedded and professionally relevant scenarios [
15], which is associated with higher levels of student engagement and understanding [
16], while fostering the development of transferable competencies [
17].
By situating learning in meaningful and context-rich scenarios, this approach not only promotes active engagement but also facilitates the development of both cognitive and socio-emotional competencies relevant to complex decision-making processes.
Studies show that PBL promotes critical thinking [
18], increases motivation [
19,
20], and strengthens the connection between theoretical concepts and their practical application [
21]. As a result, researchers increasingly consider it a relevant approach in higher education [
22]. Furthermore, by situating learning in meaningful and context-rich scenarios, PBL aligns with the principles of sustainability-oriented education, supporting students in developing the ability to address complex and uncertain challenges characteristic of contemporary professional and societal contexts.
Although researchers have explored the benefits of PBL in various disciplines, including Statistics [
23], most studies have focused primarily on the impact on student achievement [
24], with little attention to emotional aspects [
25]. Research indicates that PBL can lead to a better understanding and retention of knowledge [
26], as well as greater motivation and engagement of students [
27].
The literature on emotions in PBL includes the use of facial expressions [
28], the comparison of emotional effects in near-PBL tutoring and faculty-led PBL tutoring [
29], the development of new strategies for the integration of emotions in the teaching of engineering ethics [
30], and the analysis of how emotions influence the way students search for and process information to solve problems on the internet [
31]. Recently, Kazemitabar et al. [
32] have explored how medical students regulate their emotions when communicating bad news to patients in a technology-enhanced learning environment by obtaining data through the application of PBL.
These studies illustrate a growing interest in the role of emotions within PBL contexts, but the evidence remains fragmented and context-specific. A notable gap still exists in the literature regarding the systematic analysis of how emotional factors shape student engagement with PBL [
33] and influence learning and performance outcomes [
34], particularly in the context of statistics education.
This study addresses this gap by examining how emotions influence engagement with PBL in Statistics within the business domain. In this regard, we extend the work of Muerza et al. [
35], who investigates the relationship of PBL with students’ emotions and academic performance. Given that prior research has extensively documented the impact of emotions on learning and motivation [
36,
37], we focus specifically on positive emotions, aiming to understand how they strengthen the engagement with PBL and contribute to its effectiveness, ultimately improving educational results.
A thorough exploration of these emotional aspects, along with the development of competencies required by PBL, provides a holistic view of the effectiveness of this pedagogical approach. Understanding how emotions fluctuate and interact with academic challenges in the context of PBL can offer valuable insight into designing more effective and empathetic learning environments [
38]. Integrating emotional intelligence into the educational process can improve student’ resilience, enhance their ability to handle challenging situations, and support their overall personal development [
39]. In line with this, prior research views learning as a holistic experience in which emotions and intellect are intertwined, highlighting the inseparability of affect and cognition in the learning process [
40].
Our study investigates the application of PBL specifically within the Statistics II course at the Faculty of Economics and Business, University of Zaragoza. This course is part of the second-year curriculum for both the Business Administration and Management (ADE) and Law-Business Administration and Management (DADE) programs and introduces the Probability Calculus and Inferential Statistics methods. The analysis is framed as an exploratory single-campus case study, based on a modestly sized sample of undergraduate students from a single Faculty. We hypothesize that fostering positive emotions within PBL enhances student engagement and academic performance by integrating emotional considerations with academic content.
This study is based on the research question: How are positive emotions related to the engagement of students with PBL and their perception of learning in Statistics II? To address this question, we employ a second-order Structural Equation Modeling (SEM) approach that allows us to analyze complex relationships between latent constructs and their indicators [
41]. Specifically, we develop a second-order model to capture positive emotions and PBL engagement as overarching constructs, focusing on how pre- and post-PBL emotions shape students’ perceptions of its usefulness, teamwork skills and communication with instructors.
Given the dynamic and cumulative nature of emotions in education [
42,
43,
44], we integrate both pre- and post-PBL emotions into a single construct. This approach is consistent with prior research [
42,
45] that conceptualizes emotions as temporally structured and evolving processes, where anticipatory and evaluative emotional states jointly contribute to the overall learning experience.
Based on the results of the estimation of the structural equation model, we also perform a Cluster Analysis to identify distinct student groups according to their levels of involvement with PBL and their emotional responses. We analyze these clusters in relation to some socio-demographic and academic factors and, in particular, the academic performance to examine their impact on student achievement. Understanding these relationships can provide information on how different levels of engagement and emotional states impact students’ academic success. This information can inform educators on adapting teaching methods to better support students with varying levels of engagement and emotional responses, thus promoting overall learning effectiveness and student well-being.
This study makes three key contributions. First, it examines the role of positive emotions in students’ engagement with PBL in the context of teaching Probability Calculus and Inferential Statistics in Business Administration and Management Studies. Second, it identifies patterns in positive emotions, which contribute to a deeper understanding of their relationship with learning processes. Third, given the demonstrated importance of these emotions, it highlights the need to foster them through strategies such as interactive introductory sessions, reflection exercises, a supportive classroom environment [
46], positive feedback [
47], and strong student–teacher relationships [
48]. These interventions not only aim to improve emotions, but also to ensure that students remain motivated and engaged.
Hence, this study contributes to the framework of Education for Sustainable Development (ESD) by demonstrating how active methodologies such as Problem-Based Learning (PBL), together with the development of socio-emotional capacities, strengthen key sustainability competencies, including critical thinking, collaboration, communication, and statistical literacy for informed decision-making. By examining the role of positive emotions in shaping student’ engagement with PBL in a Statistics course, the study provides evidence on how emotionally supportive and participatory learning environments foster more resilient, inclusive and sustainable educational practices.
The remainder of this paper is structured as follows.
Section 2 analyzes the background with regard to emotions in the teaching of Mathematics and Statistics.
Section 3 outlines the material and methods employed in this research and specifies the structural equation models used.
Section 4 details the results and discusses their implications. Finally,
Section 5 concludes this study, offers some preliminary recommendations, and outlines future research lines. Four appendices are also included.
Appendix A presents the questionnaire;
Appendix B and
Appendix C present the validity and reliability study of the first- and second-order structural equation models; and
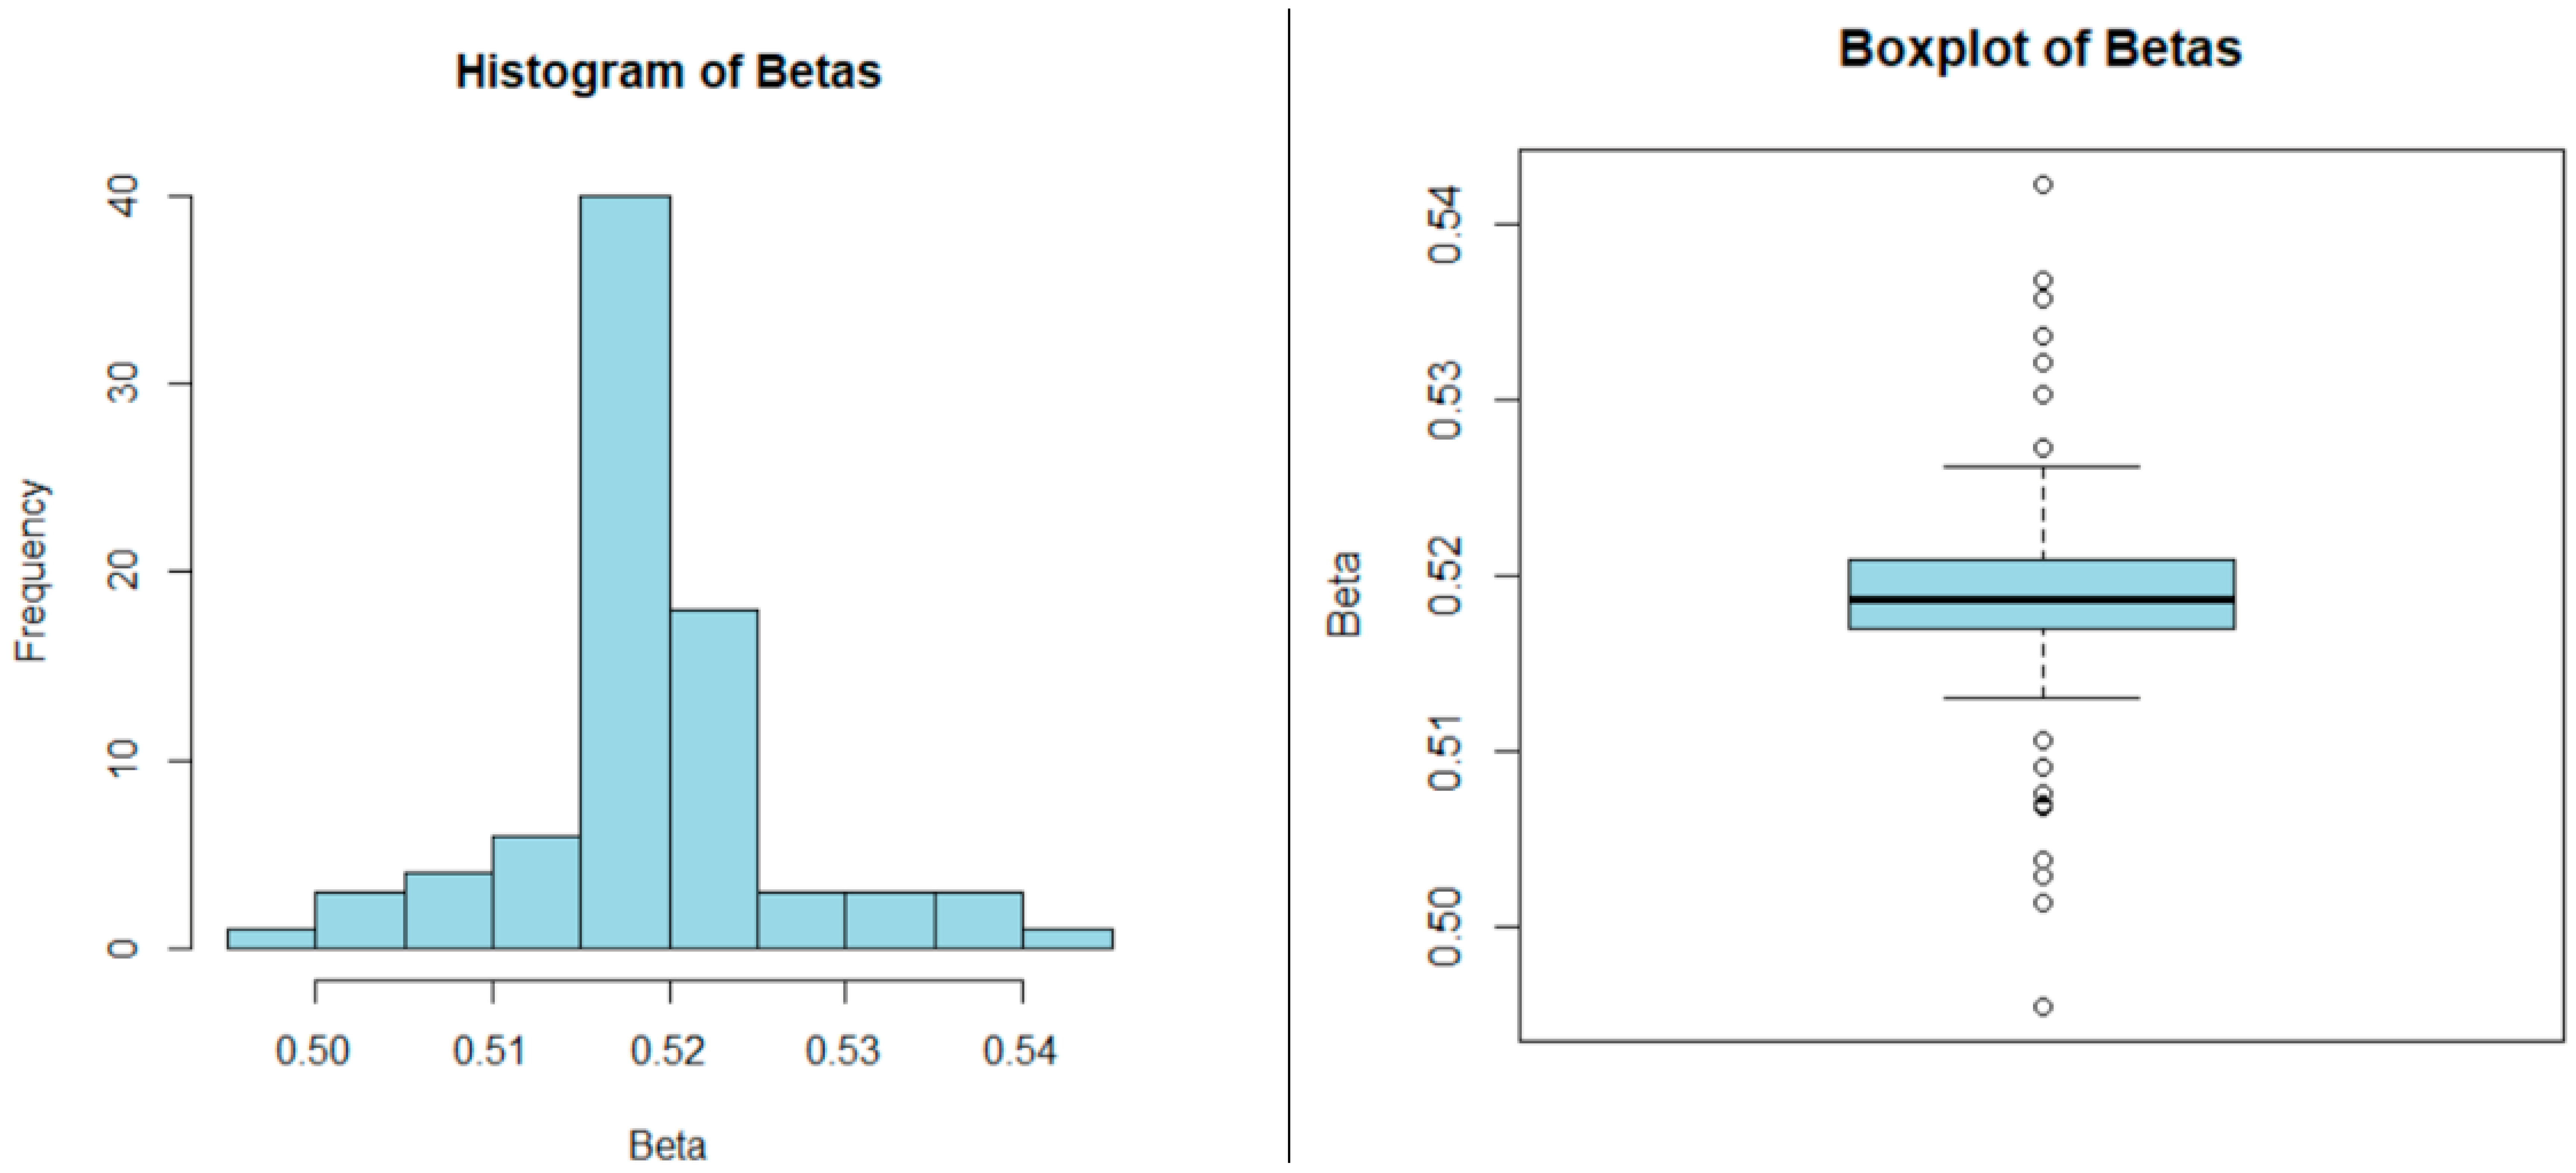
Appendix D presents a sensitivity analysis of the beta coefficient relating the positive emotions construct to PBL engagement.
2. The Role of Emotions in Learning Mathematics and Statistics
Mathematics and Statistics play a fundamental role in academic and professional development [
49], and emotions have been increasingly recognized as key factors in their learning process [
50]. Rather than being mere by-products of learning, emotions actively shape students’ motivation, self-efficacy, and academic performance.
Research highlights that fostering positive emotions, such as enjoyment and satisfaction, strengthens persistence in mathematical challenges and improves students’ attitudes [
51]. This shift in perspective moves away from viewing mathematics primarily as a source of anxiety and instead emphasizes how well-designed, challenging yet achievable tasks can generate positive affective states such as pride and engagement [
52].
In this context, both personal and situational factors, including self-efficacy, feedback, and the quality of instructional support, shape emotions [
53,
54]. Empirical evidence consistently shows that positive emotions, such as motivation and self-confidence, are associated with improved academic outcomes, whereas negative emotions, particularly anxiety, tend to hinder learning [
55,
56].
From the perspective of achievement emotion theory, emotions are not only outcomes of learning but also determine students’ readiness to engage with academic challenges, influencing both cognitive processing and performance [
57,
58,
59]. In addition, students’ self-concept plays a key role, as those with a more positive perception of their abilities tend to experience more favorable emotions and lower levels of anxiety, regardless of their actual performance [
60,
61].
Taken together, these findings highlight the need to conceptualize learning in mathematics and statistics as an inherently cognitive-affective process, in which emotions are integral to students’ engagement and success.
Within this theoretical framework, active pedagogical approaches, particularly PBL, emerge as effective strategies for shaping both the cognitive and emotional dimensions of learning. PBL [
33] promotes active participation, autonomy, and collaboration, creating learning environments that enhance motivation and reduce anxiety.
Empirical studies show that such environments, especially when based on meaningful and achievable tasks, foster positive emotional experiences and strengthen students’ engagement [
52]. In addition, PBL has been associated with improvements in communication skills, teamwork, and the perceived relevance of learning, contributing to a more meaningful educational experience [
33].
However, despite the growing body of research on PBL, most studies focus primarily on academic performance and cognitive outcomes, while the emotional dimension receives less attention [
25]. Moreover, existing studies often analyze emotions at a single point in time, which fails to capture their dynamic evolution throughout the learning process.
This limitation is particularly relevant in statistics education, where research on emotions remains less developed than in mathematics, despite evidence suggesting that emotional factors play a crucial role in students’ engagement and performance [
62].
To address these limitations, it is necessary to adopt a more integrative perspective that conceptualizes emotions as dynamic and temporally structured processes. Emotions experienced prior to engaging in a learning activity influence students’ expectations, confidence, and predisposition to participate, while emotions experienced after the activity reflect their evaluation of the learning experience in terms of usefulness, satisfaction, and achievement.
From this perspective, emotions should not be analyzed in isolation but as part of a continuous and cumulative process that unfolds throughout the learning experience [
57,
59].
Despite extensive research on emotions and active methodologies in mathematics education, there remains a notable gap in the literature on statistics education. Although studies such as [
62] have examined PBL in university-level Probability and Statistics courses, most research on emotions in learning continues to focus primarily on Mathematics.
Our study addresses this gap by examining how positive emotions are related to statistical learning in a business education context. We hypothesize that positive emotions are positively related to students’ motivation and engagement in PBL, and that these dimensions are associated with greater commitment and improved performance, highlighting the need to integrate emotional factors into academic content.
Modeling positive emotions as a second-order construct that integrates both pre- and post-learning emotional states is theoretically justified, as it reflects the temporally structured and evolving nature of emotional processes in learning contexts. This approach provides a more comprehensive understanding of how emotions shape students’ engagement with PBL, as both initial predispositions and subsequent emotional responses jointly influence their participation, collaboration, and perception of learning outcomes.
In this context, the present study aims to fill a gap in the literature by examining the role of positive emotions in statistical learning within a business education context and proposes a second-order structural model in which emotions before and after PBL jointly explain students’ engagement with the methodology.
3. Materials and Methods
From a sustainable educational governance perspective, the implementation of innovative teaching methodologies such as PBL serves as a strategic tool for enhance equity, participation, and the overall quality of learning environments. Strengthening students’ positive emotions is not only pedagogically beneficial but also contributes to the sustainability of the educational system by improving engagement, supporting retention, and helping reduce performance-related inequalities.
In this study, the use of data-driven analytical techniques, specifically Structural Equation Modeling (SEM) and Cluster Analysis, provides empirical evidence to inform decision-making. These methods allow institutions to monitor students’ emotional and learning profiles, evaluate the effectiveness of instructional innovations, and design targeted interventions, thereby positioning data analytics as a key resource for sustainable educational management.
3.1. Case Study
During the 2022–2023 academic year, PBL was implemented in the Statistics II course for second-year ADE and DADE students at the University of Zaragoza’s Faculty of Economics and Business. This 6-ECTS course included 30 h of lectures and 60 h of practical activities using R Commander, a graphical user interface for the statistical software R.
All students enrolled in the Statistics II course in both degree programs were invited to participate in the study, and participation was voluntary. In the ADE group, a total of 96 students were enrolled. Of these, 44 students agreed to participate, while 52 did not participate. Among those who participated, 37 completed the final survey and were included in the analysis.
In the DADE group, 94 students were enrolled in the course and invited to participate. A total of 45 students agreed to participate and completed the final survey.
The study formed part of an officially approved Teaching Innovation Project and did not require formal approval from an Institutional Review Board or Ethics Committee according to institutional regulations. We obtained informed consent from all participants prior to data collection.
We read an information statement to students in class explaining the purpose of the study, its voluntary nature, and the use of the data for research and publication purposes. We informed them that all data would be collected and analyzed anonymously and in aggregate form, and that no personal or identifying information would be recorded. Students provided consent by voluntarily proceeding with the activity after receiving this information.
Table 1 shows a summary of the participants’ characteristics.
The introduction of PBL aimed to enhance traditional learning by helping students bridge theoretical concepts in probability and statistical inference with business scenarios derived from complex organizational contexts. Many students struggle to recognize the usefulness of probability in decision-making and to select the appropriate model based on the problem at hand.
Therefore, in the first stage of the course, practical cases were introduced in which students analyzed scenarios such as demand forecasting for a business, the probability of default in a customer portfolio, or waiting times in a customer service setting. Through PBL, they explored the application of key probability distributions (Binomial, Poisson, Normal, Exponential, among others) and justified their selection in each context.
The course then progressed to statistical inference, starting with sampling theory and the Central Limit Theorem, which helped students understand how sample distributions facilitate the estimation of population parameters. To reinforce this concept, they conducted simulations using business datasets and analyzed the variability of sample statistics.
In the parameter estimation unit, they applied confidence intervals to assess key business indicators such as average customer spending or employee satisfaction. Finally, in the hypothesis-testing unit, the students worked on validating critical business claims, such as whether a new marketing campaign had increased sales or whether there were significant salary differences between departments.
In addition to performing calculations, they interpreted the results and justified their application in business decision-making, thereby strengthening their analytical skills and competence in data management.
To implement this approach effectively, the course did not follow the traditional seven-step PBL model by Schmidt [
63], but rather the method developed by Muerza et al. [
27], which is specifically designed to support statistical learning through collaborative problem-solving and the co-creation of shared learning resources.
This approach was adopted because it places greater emphasis on applied data analysis, continuous feedback during the problem-solving process, and the production of explanatory materials within a statistics learning context.
The method involved six steps: (i) Identification of concepts and understanding of the problem; (ii) Analysis of the problem; (iii) Development of solutions; (iv) Group tutoring; (v) Recording an explanatory video; (vi) Sharing the problem in an online platform.
Students first worked in teams to analyze the situation, identify the appropriate statistical tools, and reach a solution together. They then presented their responses to the tutoring in-groups of the teacher, who provided corrections and feedback until the solution was precise and well founded.
Once their results were validated, the students recorded explanatory videos in which they detailed the step-by-step procedure used, ensuring that their peers could fully understand the problem-solving process. We will henceforth refer to the process developed by the student as the “project”.
The project was implemented as a complementary, out-of-class component that did not replace or reduce the rigor of the core course. For each team, the activity lasted one month. Each team met to analyze and solve the exercise before their group tutorial.
During the tutorial, students took on the role of the teacher, with the teacher provided support to reinforce and clarify concepts. Subsequently, students had to meet again to prepare a script for their solution video and to record it. The teaching staff did not receive any additional training to carry out their role throughout the process.
This approach is associated with higher levels of student engagement and understanding, particularly through the promotion of active participation, communication skills, and a deeper comprehension of statistical concepts.
In this way, the students not only mastered statistical techniques, but also developed critical soft skills essential for data-driven decision-making in modern business contexts.
A structured questionnaire served as the primary instrument for data collection (see
Appendix A). The questionnaire included closed-ended questions designed to capture students’ perceptions of various aspects of PBL implementation.
This questionnaire was aligned with the methodological framework proposed by Muerza et al. [
27], and the constructs and items reflect the main components of the PBL process, including collaborative work, interaction with the instructor, and the development of applied statistical understanding.
In this way, the measurement model is directly linked to the structure and objectives of the implemented methodology.
Responses were measured on a 5-point Likert scale, where 1 indicated “totally disagree”, 2 indicated “strongly disagree”, 3 indicated “neutral”, 4 indicated “strongly agree”, and 5 indicated “totally agree”.
We also asked the participants about the intensity with which they experienced some positive emotions before and after the project. Participants marked the corresponding value.
3.2. The Model
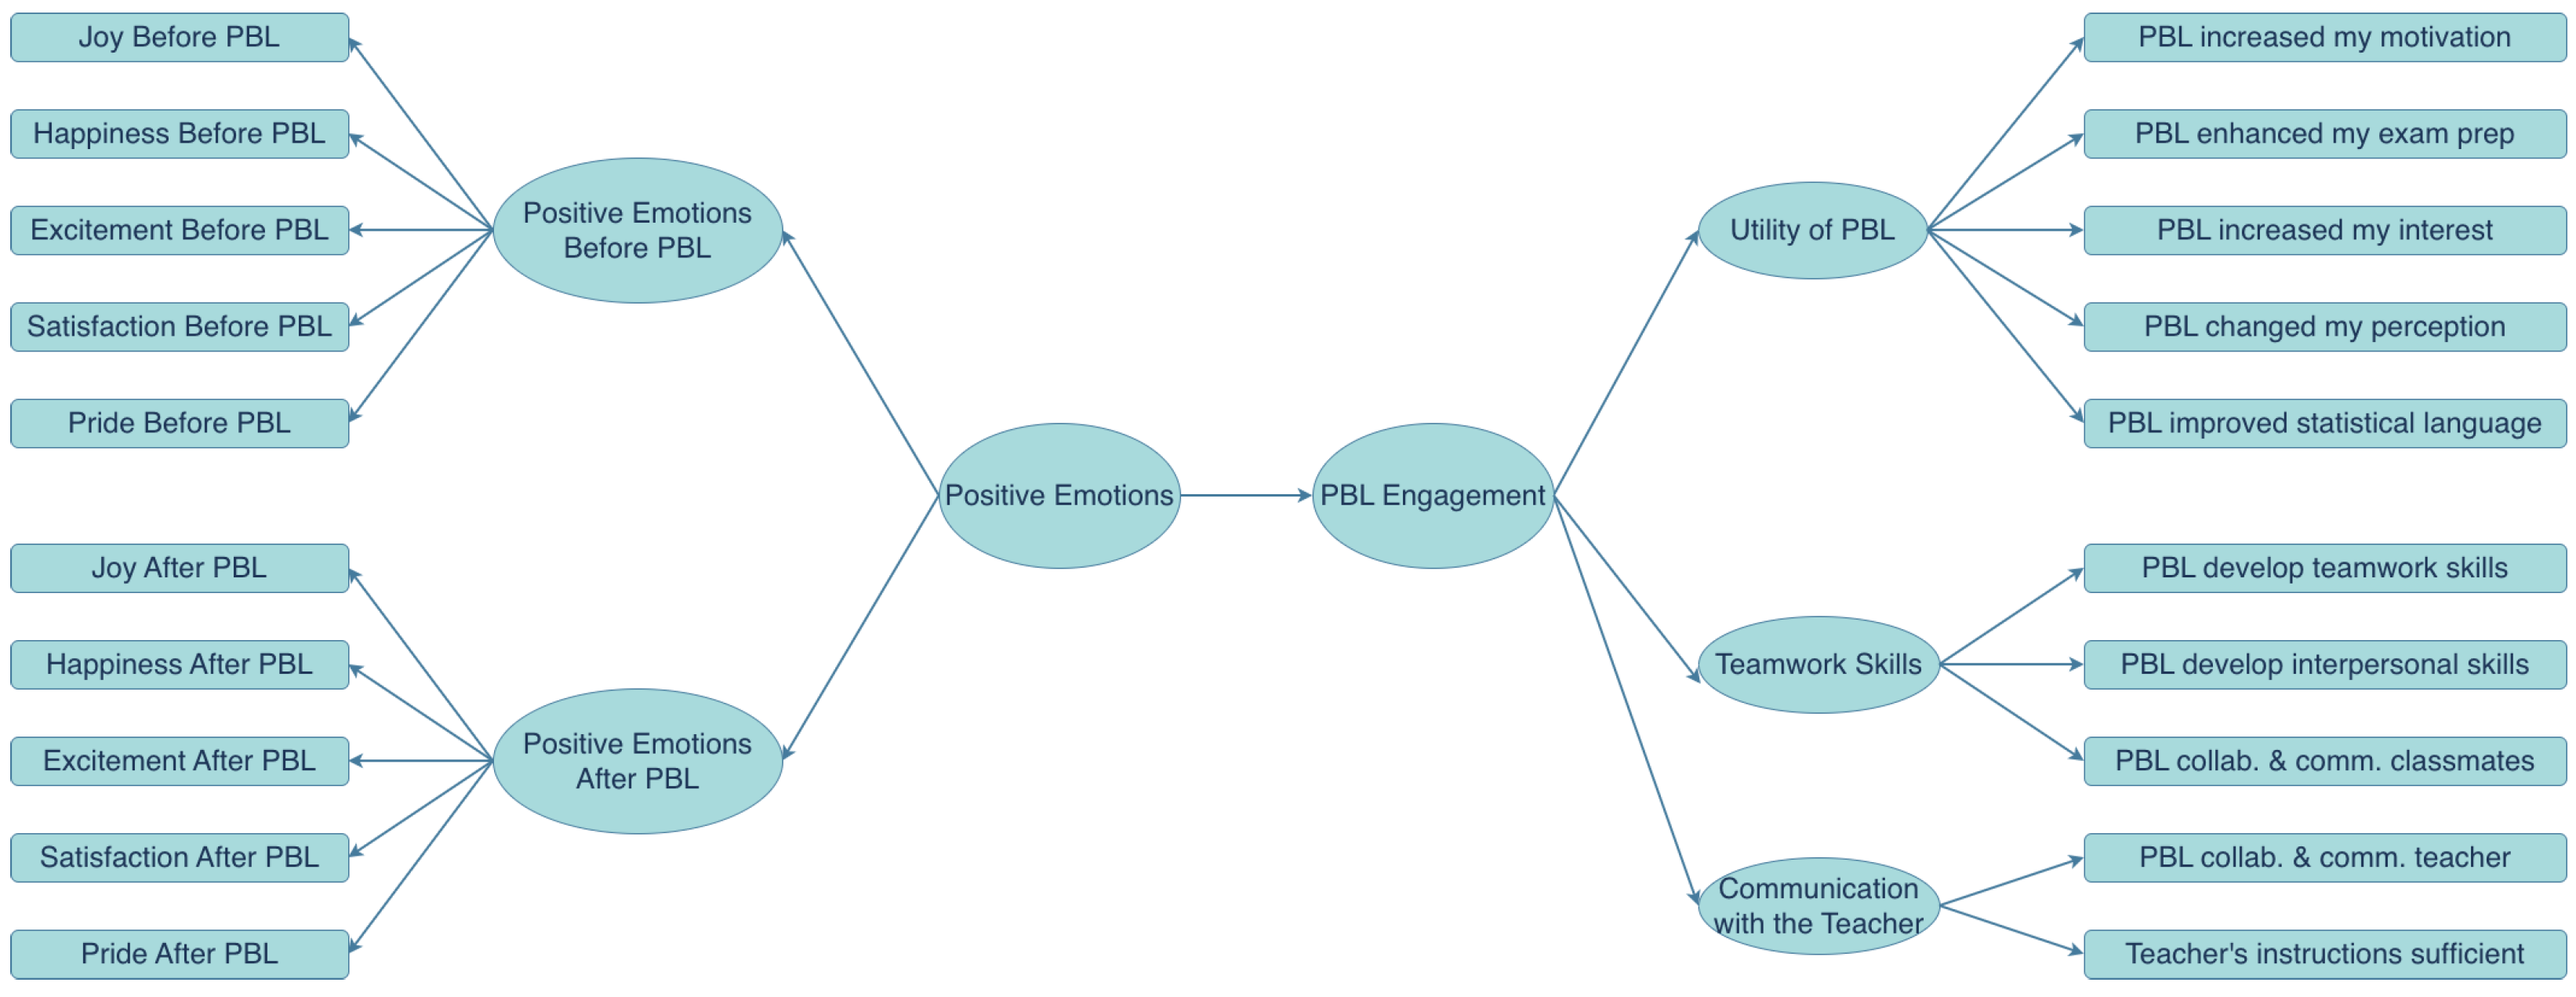
We used a Partial Least Squares Structural Equation Modeling (PLS-SEM) with a second-order specification to analyze the influence of positive emotions on engagement with PBL (see
Figure 1).
The use of PLS-SEM in this study is justified by several characteristics of the research design. First, the primary objective is predictive and exploratory, as the study seeks to understand the relationships between positive emotions and students’ engagement with PBL in a context where these relationships have not been extensively modeled in statistics education. In this regard, PLS-SEM is particularly suitable because it focuses on maximizing explained variance and supports theory development.
Second, the proposed model includes higher-order (second-order) constructs, specifically Positive Emotions and PBL Engagement, each composed of multiple first-order dimensions, reflecting the multidimensional nature of emotional and behavioral responses in PBL settings. PLS-SEM is well-suited for estimating complex hierarchical models of this type, offering greater flexibility and fewer identification constraints than covariance-based SEM.
Third, the data exhibit deviations from normality, as indicated by the descriptive statistics (e.g., skewness and kurtosis values, see
Table A1 in
Appendix B), which is expected in educational settings involving self-reported emotional measures. This further supports the use of PLS-SEM, as it does not require multivariate normality assumptions.
Finally, the sample size (
) is relatively modest for covariance-based SEM, particularly given the complexity of the model and the number of indicators, as well as the specific context of a single-course implementation. Given the importance of sample size in the choice of estimation method, we further assess its adequacy by applying the inverse square root method [
64]. Considering that the most complex part of the model includes two predictors, and assuming a significance level of 0.05, a statistical power of 0.80, and a medium effect size (0.21–0.30), the minimum required sample size is 69 observations [
41] (Exhibit 1.7, p. 27). Therefore, the final sample of 82 students is sufficient to support the estimation of the proposed model and ensures adequate statistical power for detecting the expected relationships.
From a theoretical perspective, this temporal structure is particularly relevant, as it captures the evolution of students’ emotional experiences from anticipatory states to evaluative responses. Emotions experienced before the activity reflect students’ initial expectations, confidence, and predisposition toward learning, while emotions experienced after the activity represent their evaluation of the experience in terms of achievement, usefulness, and satisfaction.
Therefore, both measurements correspond to the same emotional constructs, but fulfill different functional roles within the learning process.
This reasoning supports modeling emotions as a second-order construct, as it allows us to capture a higher-level latent dimension representing the continuity and transformation of students’ emotional experiences over time. Rather than treating pre- and post-learning emotions as independent variables, the second-order specification recognizes them as intrinsically linked manifestations of a single affective process that unfolds throughout the learning experience [
57,
59].
From a methodological standpoint, this approach is consistent with the use of second-order constructs in structural equation modeling when multiple first-order dimensions represent different manifestations of the same underlying phenomenon.
In this case, the repeated measurement of identical emotional indicators across two time points provides strong conceptual and empirical support for integrating them into a unified higher-order construct, offering a more coherent and parsimonious representation of students’ emotional engagement.
Positive emotions are defined as a second-order reflective construct that includes the constructs Positive Emotions Before and Positive Emotions After. The construct Positive Emotions Before captures positive emotions such as Joy, Happiness, Excitement, Satisfaction and Pride [
65] experienced before implementing PBL, while the construct Positive Emotions After captures the same positive emotions experienced after the implementation of PBL.
The decision to combine emotions experienced before and after PBL into a single construct is based on the dynamic and cumulative nature of emotions in educational contexts [
42,
43,
44]. Pre-learning emotions can shape the PBL experience, influencing subsequent emotions and contribute to an overall affective state throughout the learning process [
66,
67].
From a methodological perspective, integrating both measurements into a single construct provides a more comprehensive assessment of the role of emotions in academic performance [
68]. Furthermore, by capturing emotions as a continuous process, this approach offers a more accurate representation of affective influences on PBL, aligning with contemporary theoretical models on the interaction between emotions and cognitive processes in educational settings [
69].
Engagement with PBL, in turn, is defined as a second-order reflective construct that includes the reflective constructs Utility of PBL, Teamwork Skills, and Communication with the Teacher.
These first-order constructs consist of indicator variables derived from the student survey, providing a comprehensive view of their engagement levels. The Utility of PBL construct captures students’ perceptions of the usefulness of PBL in their learning. It reflects how students perceive the relevance and applicability of PBL in their learning, reflecting how they perceive its relevance and applicability in statistical education.
Perceived utility is closely related to motivation and engagement in learning, as students are more likely to invest effort when they perceive clear benefits in their learning [
70].
The Teamwork Skills construct evaluates students’ perceived improvement in their ability to work in teams after PBL. Teamwork not only enhances collaborative skills but also increases student engagement and participation, as students interact and rely on each other to solve problems.
The Communication with the Teacher construct assesses how PBL enhances students’ relationships with the teacher. Good communication with the teacher can improve students’ motivation and participation by providing guidance and ongoing support [
71].
Our primary objective was to examine how positive emotions relate to PBL engagement, that is, to investigate how positive emotions before and after implementing PBL relate to the perceived usefulness of PBL, teamwork skills, and communication with the teacher (see
Figure 1).
4. Results and Discussion
4.1. Relationship Between Positive Emotions and PBL Engagement
In this section, we present the results of the analysis on the relationship between positive emotions and PBL engagement, based on the model shown in
Figure 1, which we estimated using R 4.1.3 and the seminr statistical package.
To assess the significance of the path coefficients and the stability of the estimates, we applied a bootstrapping procedure with 1000 resamples. To examine this relationship, we used the two-stage disjoint estimation method described by Sarstedt et al. [
72], applying the PLS-SEM algorithm at each stage [
73].
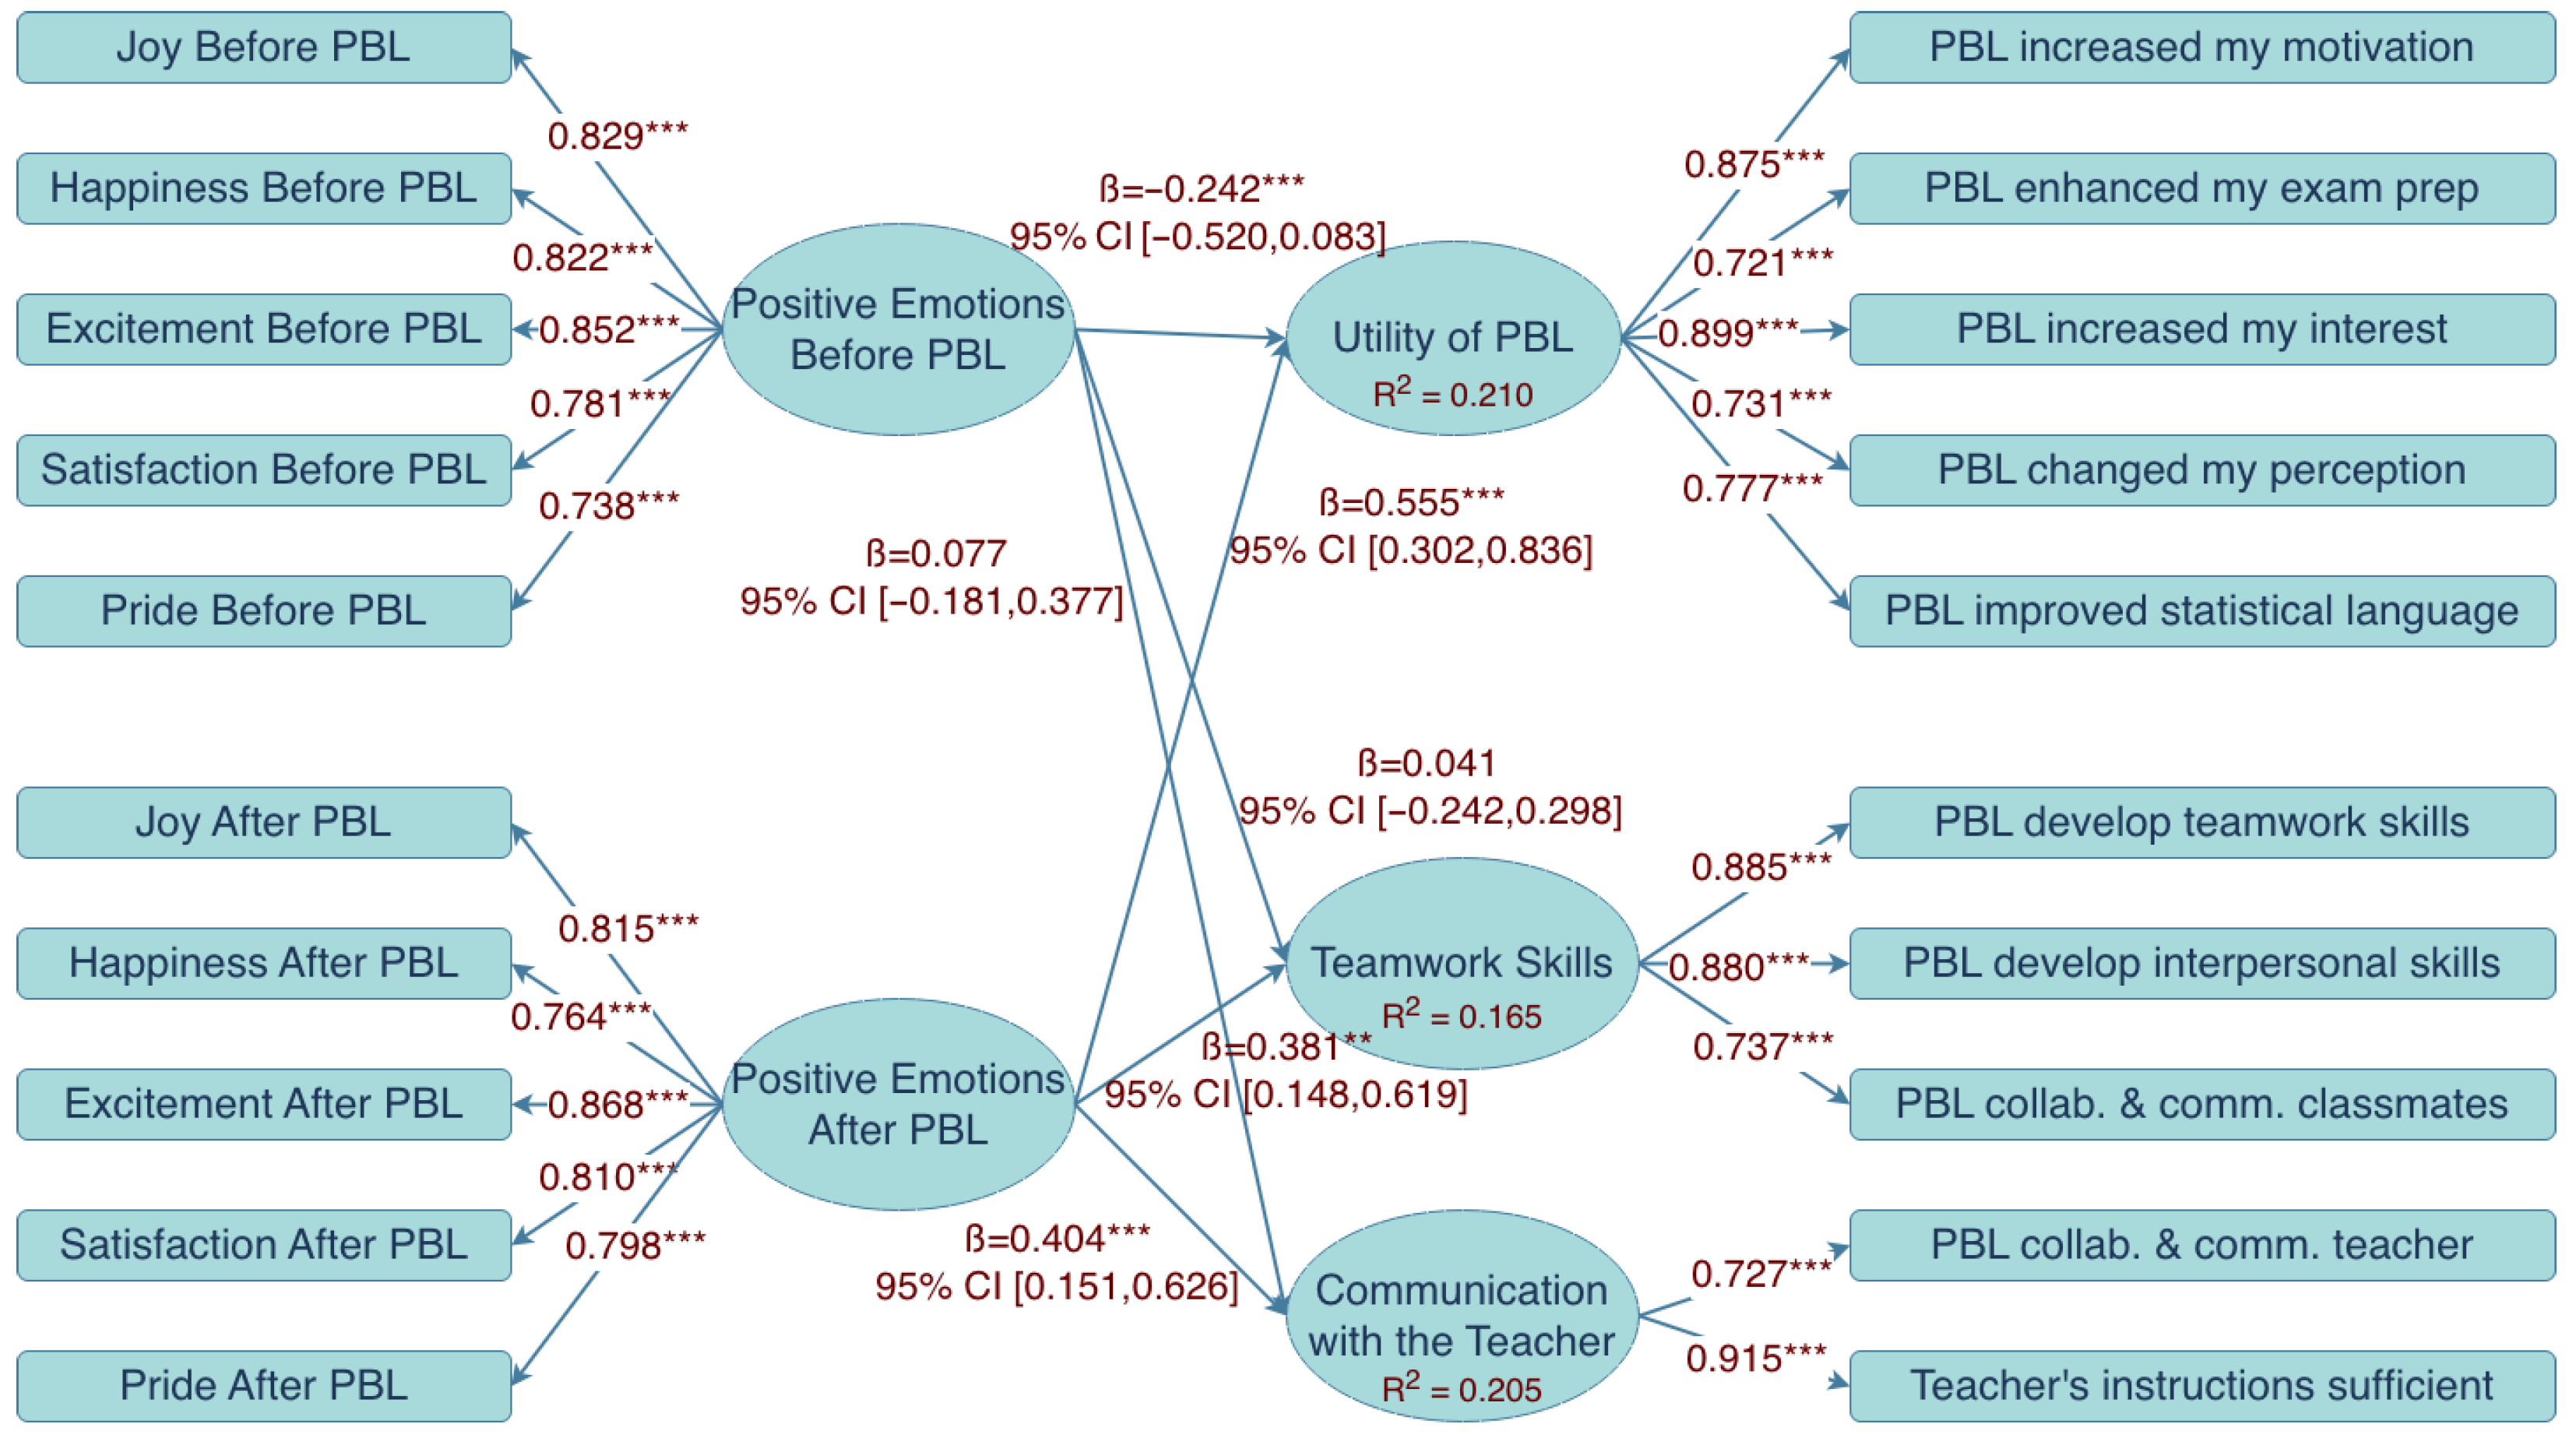
In the first stage, which serves as an intermediate step, we estimated the relationships between the observable indicator variables and the first-order constructs using a first-order structural model.
Figure 2 presents this model together with its parameter estimations.
The figures in the arrows represent the regression coefficients. All model loadings show the expected signs, and most regression coefficients are significant at the 95% level.
The results indicate that pre-learning positive emotions do not significantly influence teamwork or communication with the teacher and are negatively related to the perceived utility of PBL. This suggests that, in line with Pekrun et al. [
74], anticipatory emotional states play a different role from those that emerge during the learning process.
The absence of significant effects on teamwork and communication may be explained by the fact that these dimensions develop during the PBL experience itself rather than beforehand. Therefore, initial emotional states may have limited influence on the social and collaborative dynamics that emerge throughout the learning process [
75].
More importantly, the negative relationship between pre-learning positive emotions and perceived utility can be interpreted in terms of students’ perceived need for instructional support. Students who begin the course with high levels of confidence may feel less need for alternative methodologies, as they are already comfortable with their existing learning strategies.
In contrast, students with lower initial emotional states, such as uncertainty or anxiety, may be more receptive to innovative approaches like PBL and perceive them as more useful, which is consistent with previous research suggesting that learners differ in their preferences and responses to instructional methods [
76,
77].
In line with the framework proposed by Pekrun and Linnenbrink-Garcia [
78], this finding suggests that anticipatory emotions do not necessarily translate into higher engagement but rather influence students’ openness to pedagogical change and their perceived need for support.
The stronger effect of post-learning emotions, compared to pre-learning emotions, suggests that evaluative emotions (e.g., satisfaction and pride) play a key role in reinforcing engagement. In PBL contexts, these emotions emerge through active participation and successful task completion, thereby strengthening students’ perceptions of usefulness and collaboration, which is consistent with experiential learning approaches to student engagement [
79].
These relationships are not discussed at a general level, but are interpreted in relation to the specific dimensions of engagement examined in this study.
Additionally, the relationship between positive emotions and teamwork can be explained by the role of affective states in facilitating social interaction and cooperation. Positive emotions promote openness and collaborative behavior, thereby enhancing the quality of group interaction, as highlighted in recent research on emotional presence in collaborative learning [
80].
In line with the PBL literature, teamwork is a core component of this methodology, and emotional engagement contributes to more effective collaboration [
81]. This is particularly relevant in the context of ESD, where collaboration and communication are essential competencies for addressing complex challenges [
82].
Finally, the results indicate that pre-learning positive emotions are not significantly associated with communication with the teacher, whereas post-learning positive emotions have a significant and positive influence.
This pattern suggests that interaction with the instructor in PBL contexts does not depend on students’ initial emotional states but instead develops throughout the learning process. As students engage in PBL activities, continuous guidance, feedback, and support from the instructor foster positive emotional experiences, which in turn strengthen communication and interaction.
However, these findings should be interpreted with caution. The observed relationships do not allow for definitive causal conclusions, as alternative explanations cannot be ruled out. For instance, students with higher initial motivation or prior ability may be more likely to engage with the activity and report more positive emotions. Similarly, differences across degree programs may also influence both emotional responses and engagement levels. Further research would be needed to separate the influence of these possible confounding effects in order to establish causal influences.
In the second stage (see
Figure 3), which is the most relevant as it directly addresses the research objective, we find that all the coefficients of the structural equation are significant at the 95% level and exhibit the expected positive signs.
Finally, as expected, positive emotions have a significant positive impact on engagement with PBL, highlighting the need to enhance students’ positive emotions to increase their engagement with PBL.
To assess the robustness of this impact, we conducted a leave-one-out cross-validation sensitivity analysis, which did not reveal significant differences (see
Appendix D).
This finding suggests that positive emotions enhance students’ motivation, engagement, and persistence by shaping how they appraise learning tasks [
83,
84].
From the perspective of PBL literature, active and collaborative learning environments foster these emotional states, which in turn sustain participation and involvement [
85].
Moreover, these results align with ESD, as they support the development of key competencies such as critical thinking, collaboration, and problem-solving [
86].
The measurement models of both stages demonstrate strong reliability, convergence and discriminant validities using standard criteria (see
Appendix B for first-order constructs and
Appendix C for second-order constructs).
All constructs are specified as reflective and include at least two indicators, ensuring the minimum conditions for model identification. The internal consistency reliability is high with the exception of the construct Communication with the Teacher. Although slightly lower, this construct still demonstrates a reasonable level of internal consistency with a high value of the composite reliability coefficient rhoC = 0.81 (>0.7) and a Dijkstra–Henseler coefficient rhoA = 0.67 which is very close to the recommended threshold 0.7. In addition, the construct shows high loadings on its items, supporting its internal consistency (see
Appendix B).
Model stability and statistical inference were evaluated using a bootstrapping procedure, which confirms the robustness of the estimated relationships. This is particularly relevant given the modestly sized sample (n = 82), a context in which PLS-SEM is especially appropriate.
To assess potential multicollinearity issues, the Variance Inflation Factor (VIF) value was examined. The VIF value for the constructs Positive Emotions Before and Positive Emotions After was below the recommended threshold of 3 (VIF = 1.515), indicating that multicollinearity is not a concern in the model.
Besides, the values obtained for the endogenous constructs (, , , and ) indicate an acceptable, albeit moderate, level of explanatory power, which is common in social science research.
Finally, no missing data were observed in the dataset; therefore, no imputation procedures were required.
4.2. Groups of Students
This section presents the results of the cluster analysis, which establish a typology of students with similar profiles in terms of Positive Emotions and PBL Engagement. Both constructs were used as grouping variables.
To determine the optimal number of clusters, we employed the NbClust package in R, which evaluates multiple clustering validity indices simultaneously. Specifically, NbClust computes a wide range of criteria (e.g., Calinski–Harabasz, Dunn, Silhouette, and Gap statistic) and identifies the optimal number of clusters based on a majority rule across these indices.
The results indicated that nine indices suggested a two-cluster solution, which was the most frequently recommended option compared to alternative solutions (e.g., 3, 4, or more clusters). Therefore, following this criterion, we selected a two-cluster solution.
Subsequently, we combined a hierarchical agglomerative algorithm (Ward’s method) with a k-means procedure to refine the solution.
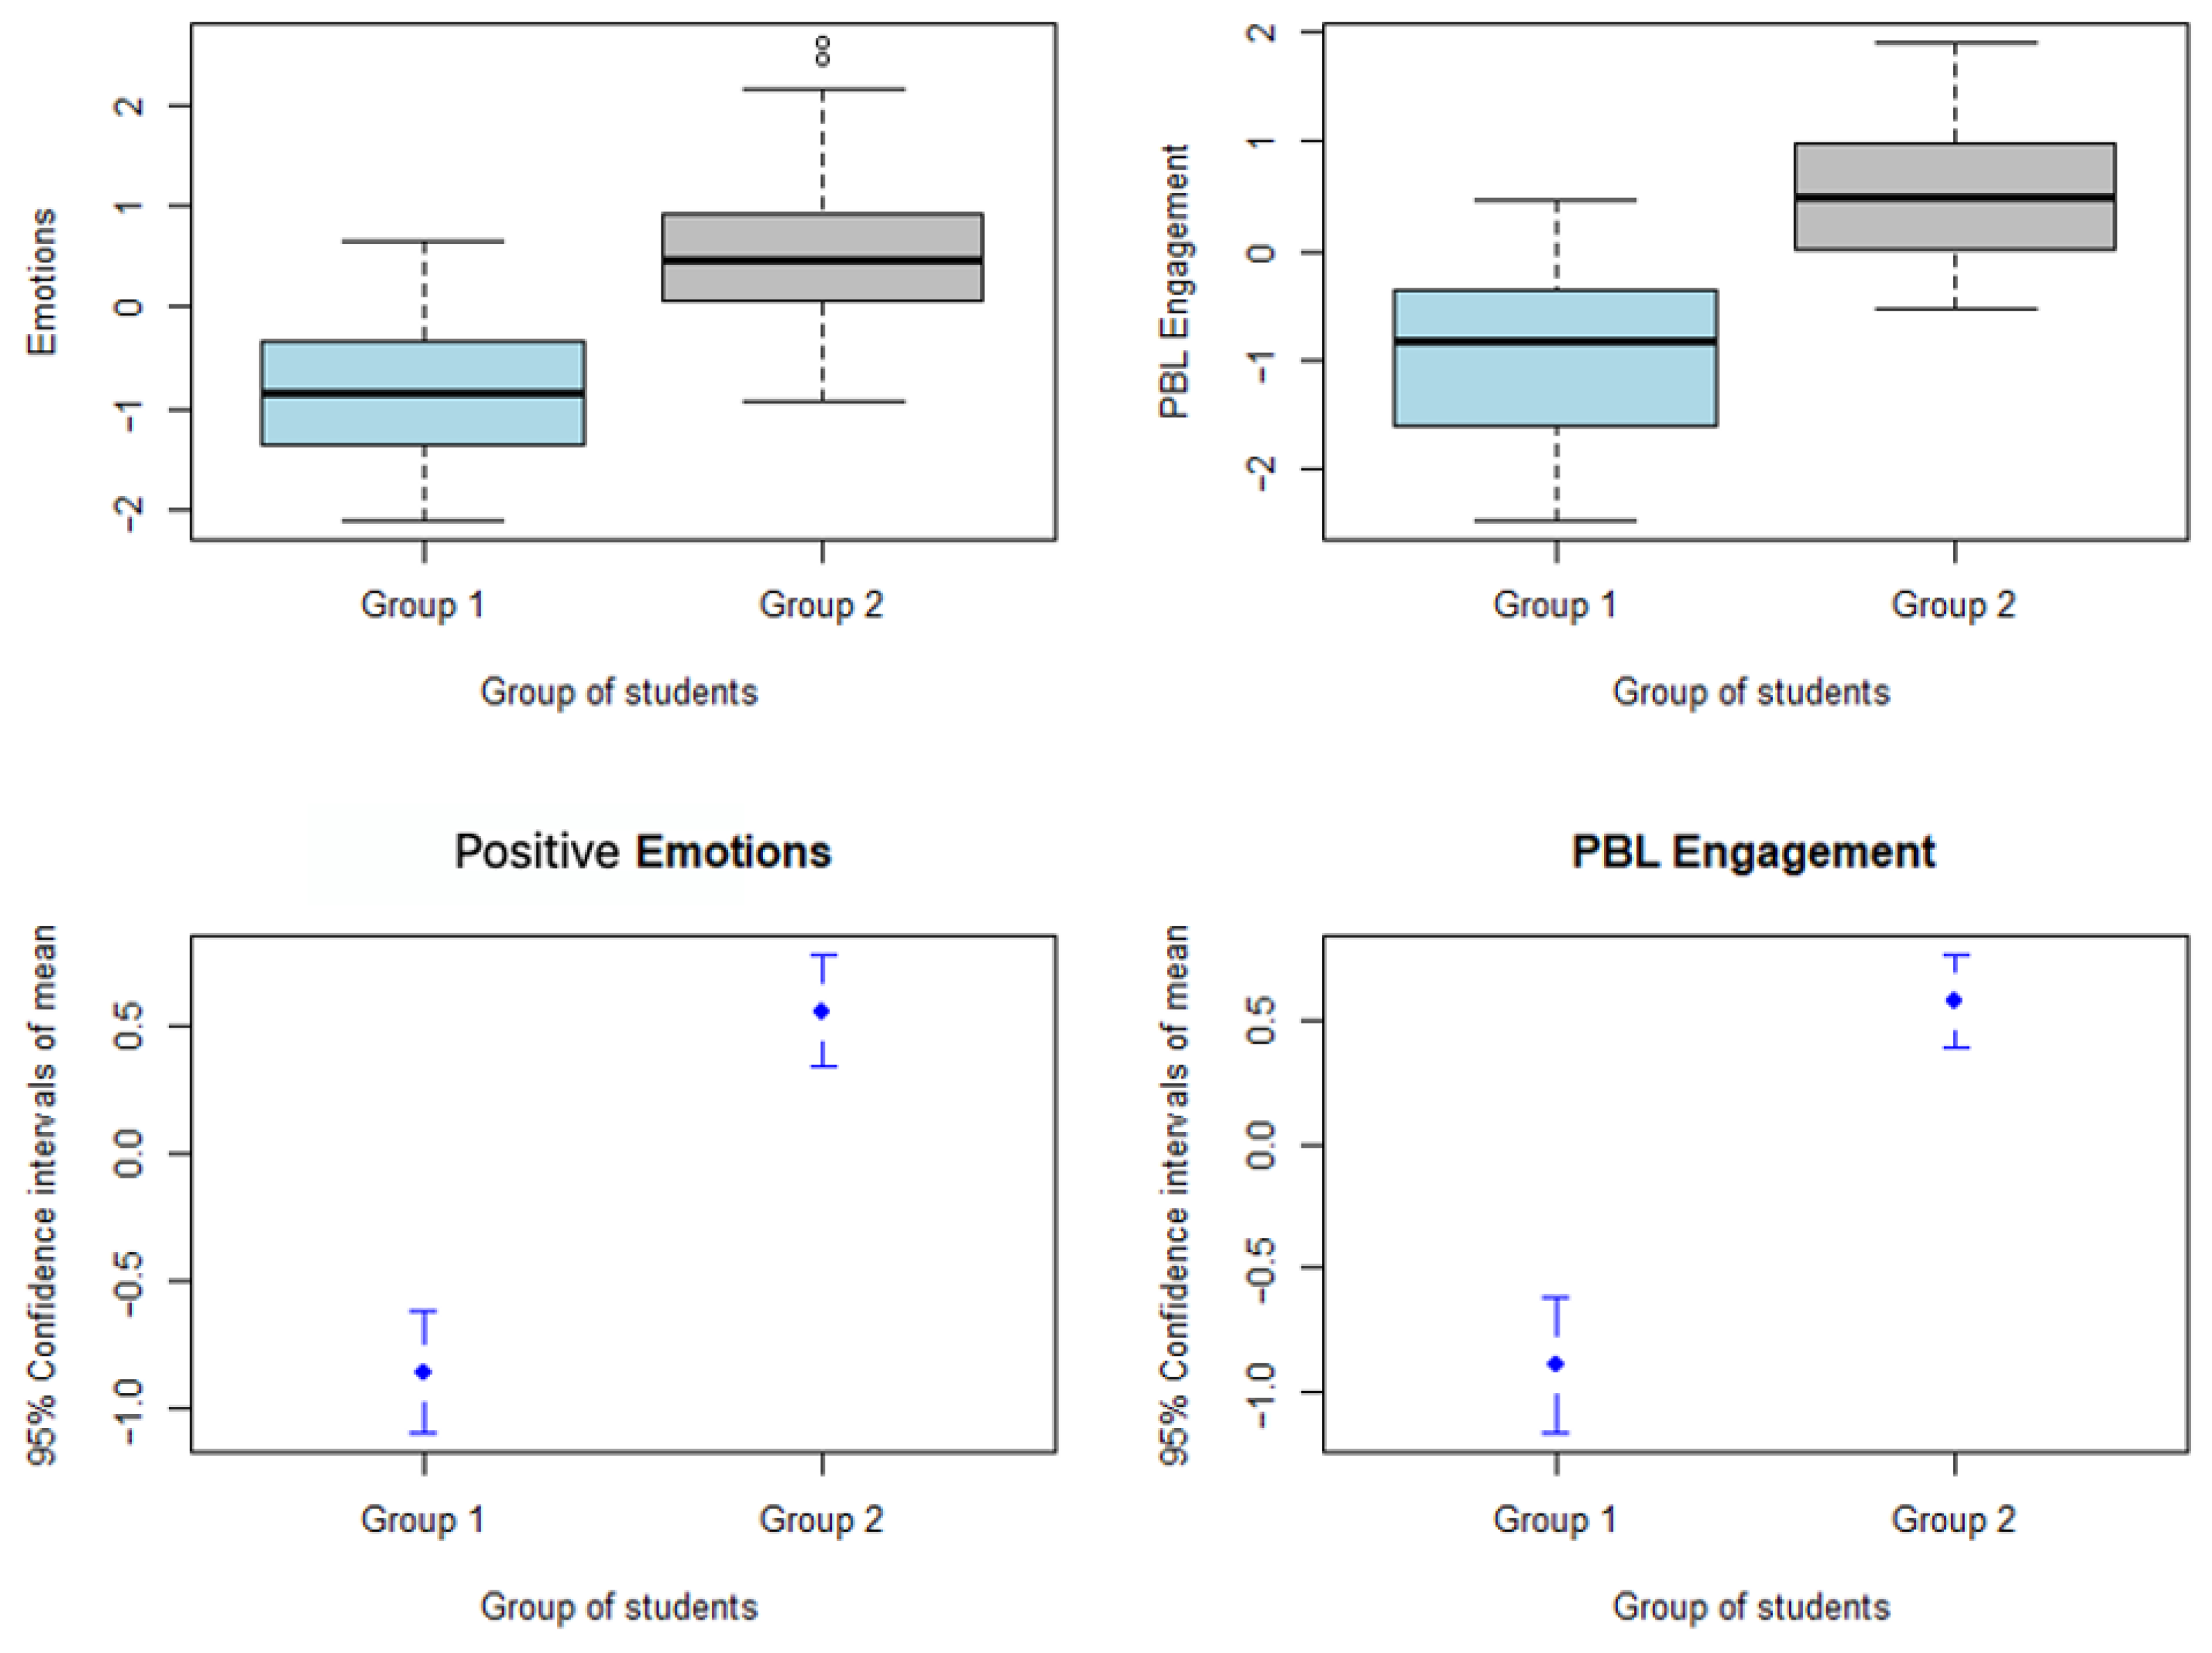
Figure 4 presents the boxplots obtained by crossing the two constructs with the identified groups, along with error bars representing the 95% confidence intervals for the mean scores of both constructs. In addition,
Table 2 and
Table 3 provide a comprehensive overview of group differences by summarizing descriptive statistics and comparisons for continuous and categorical variables, respectively.
A clear separation between the two groups can be observed (see
Figure 4), with statistically significant differences for both Positive Emotions and PBL Engagement (see
Table 2).
In the first group (39.02% of the students), both constructs tend to have low values, indicating that these students experience relatively low positive emotions and exhibit low levels of engagement with PBL.
In contrast, the second group (60.98% of the students) shows substantially higher values for both constructs, indicating higher levels of positive emotions and stronger engagement with PBL.
These differences reflect distinct quantitative profiles between groups. While these patterns may be indicative of variation in students’ experiences with PBL, they should be interpreted with caution, as no qualitative data were collected to explain the underlying reasons for these differences.
4.2.1. Cross-Analysis of Groups with Demographic and Academic Variables
In this section, we examine whether there are significant patterns between the two identified student groups by cross-referencing them with demographic and academic variables. This cross-analysis helps determine whether factors such as gender, degree program, first-time enrollment, age, and academic performance are associated with cluster membership.
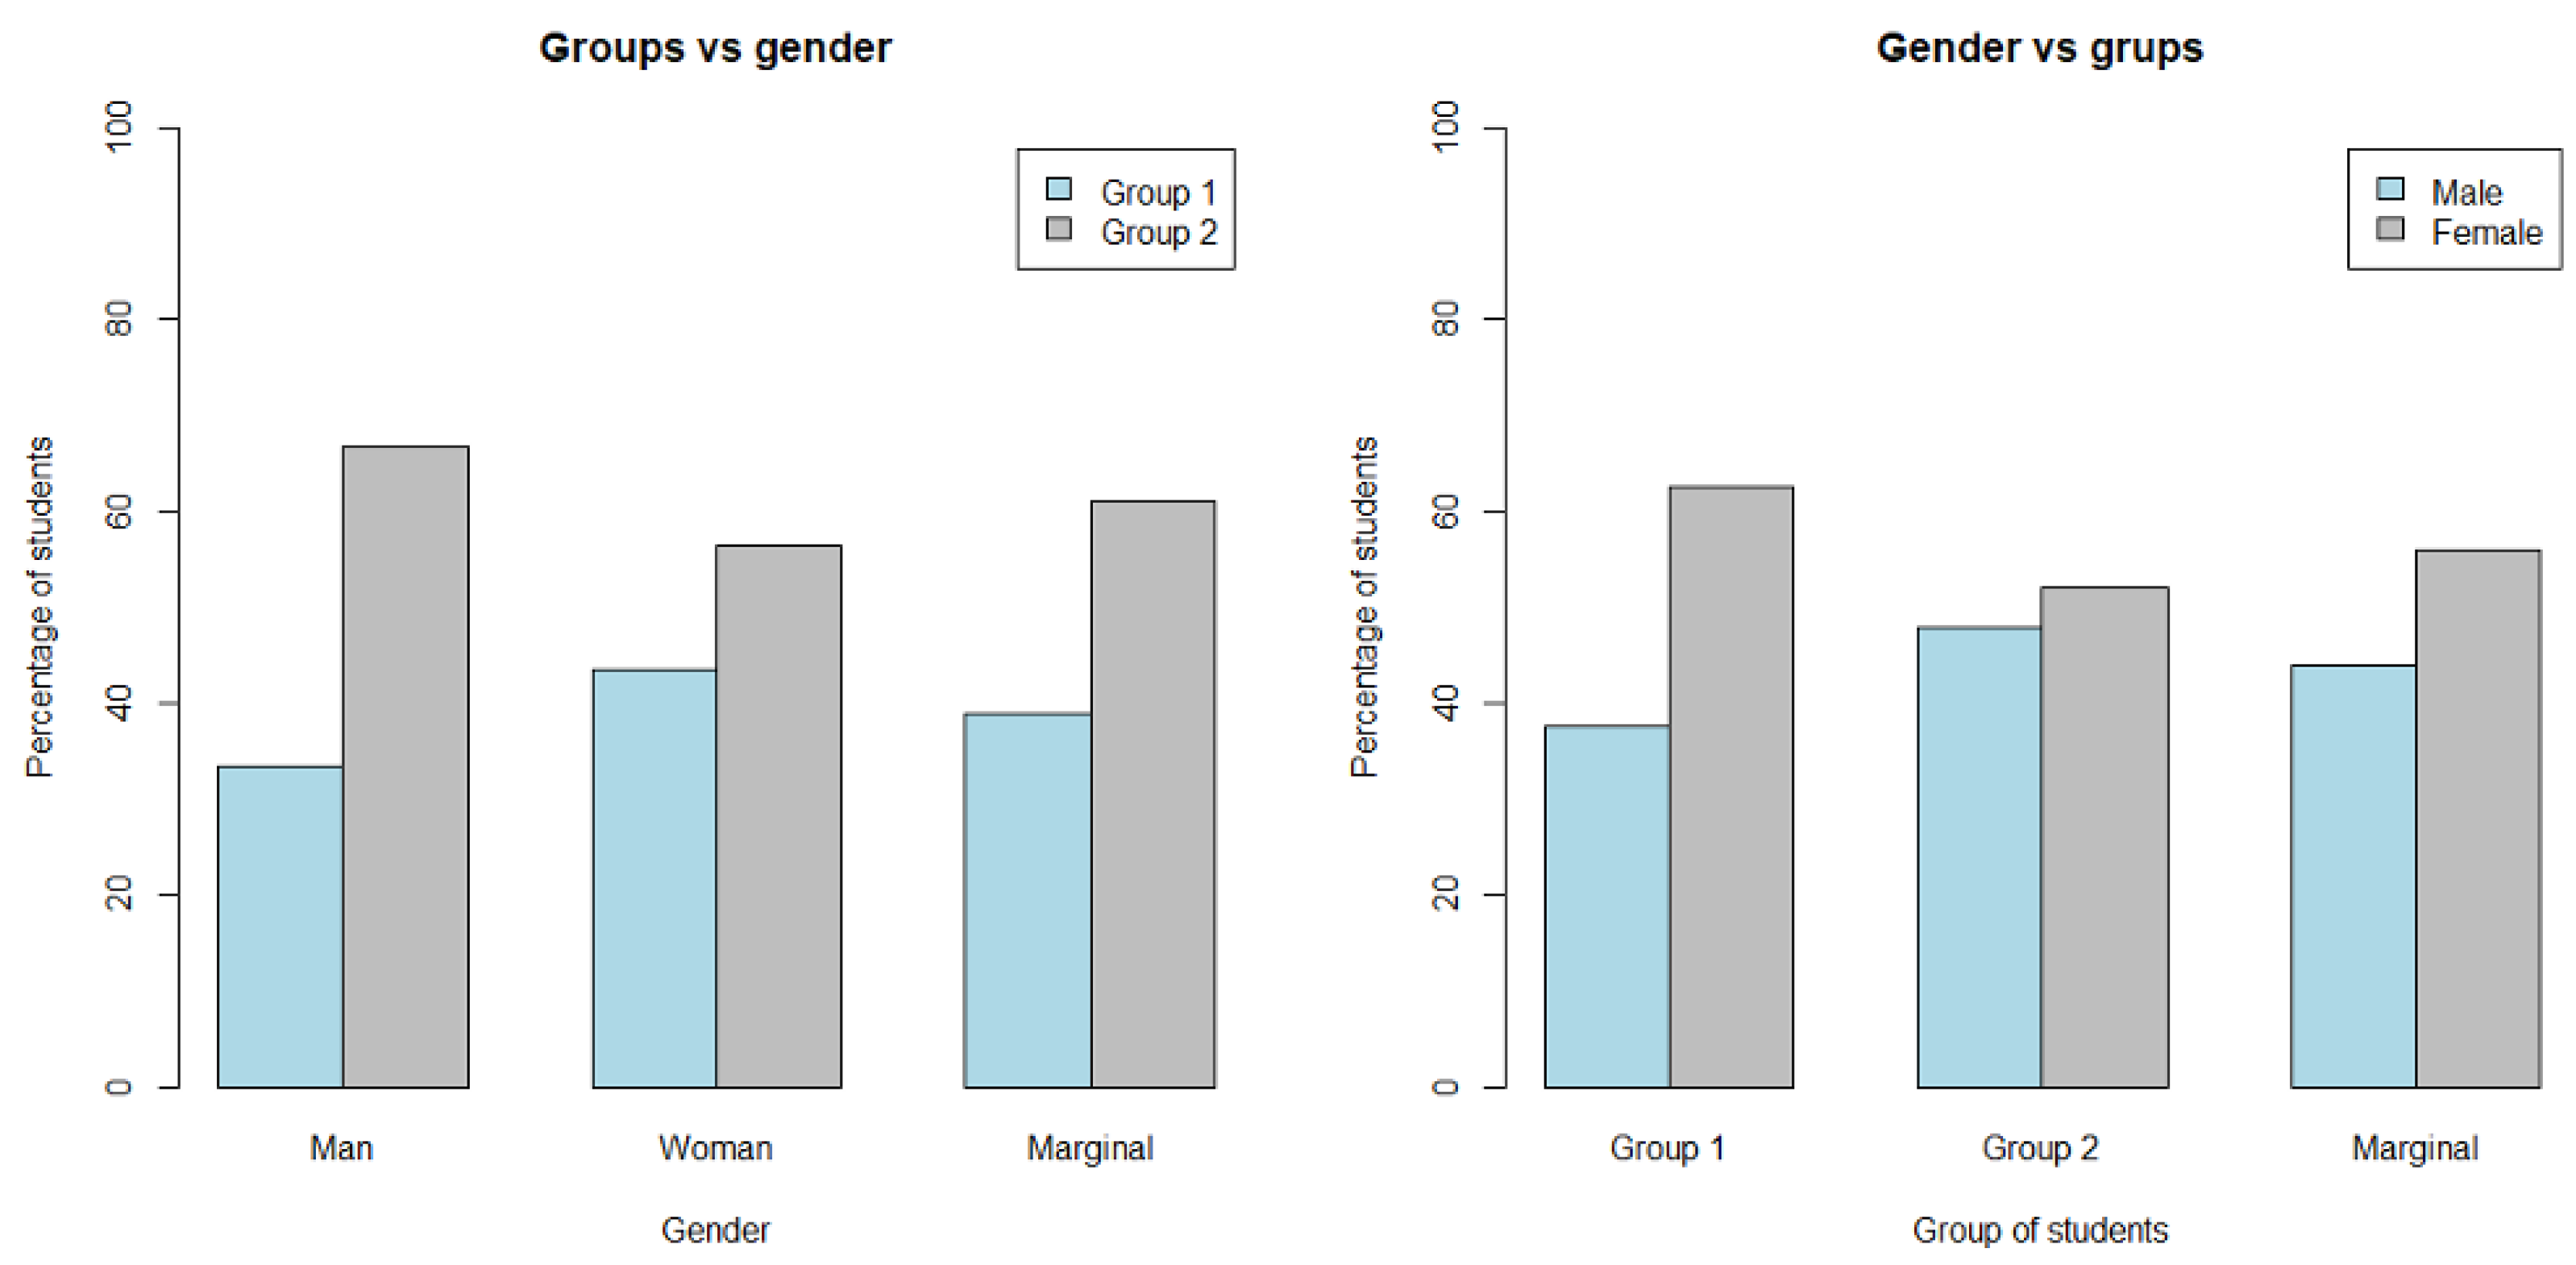
Gender
Figure 5 displays bar plots showing the distribution of student groups by gender (left) and the distribution of gender across groups (right), while
Table 3 analyzes the presence of statistically significant differences using the Pearson’s chi-squared test with Yates’ continuity correction.
The results indicate that there are no significant differences in the distribution of male and female students across the two groups (Pearson’s chi-squared p-value = 0.480). Therefore, gender does not appear to be a determining factor in students’ experience with PBL.
The lack of a significant relationship between gender and levels of engagement and positive emotions towards PBL suggests that the method is equally effective across genders. This indicates that the PBL approach is inclusive and unbiased with respect to gender, which is a positive aspect in terms of educational equity.
The uniformity in the PBL experiences among all students highlights the effectiveness of the approach in providing equitable learning opportunities.
The absence of significant gender differences in cluster membership contrasts with part of the existing literature, which reports gender-based differences in emotional responses to mathematics, often indicating higher levels of anxiety among female students [
87,
88]. However, the findings of this study suggest that, within the context of PBL, these differences may be reduced or attenuated.
One possible explanation is that PBL environments promote collaborative learning, active participation, and continuous interaction, which may help mitigate traditional gender-related disparities in emotional engagement.
Additionally, the business school context, where students may have more homogeneous academic backgrounds and motivations, could also contribute to reducing such differences.
These results are consistent with studies suggesting that student-centered and interactive methodologies foster more inclusive learning environments, thereby minimizing the impact of individual characteristics such as gender on engagement and emotional experience [
89].
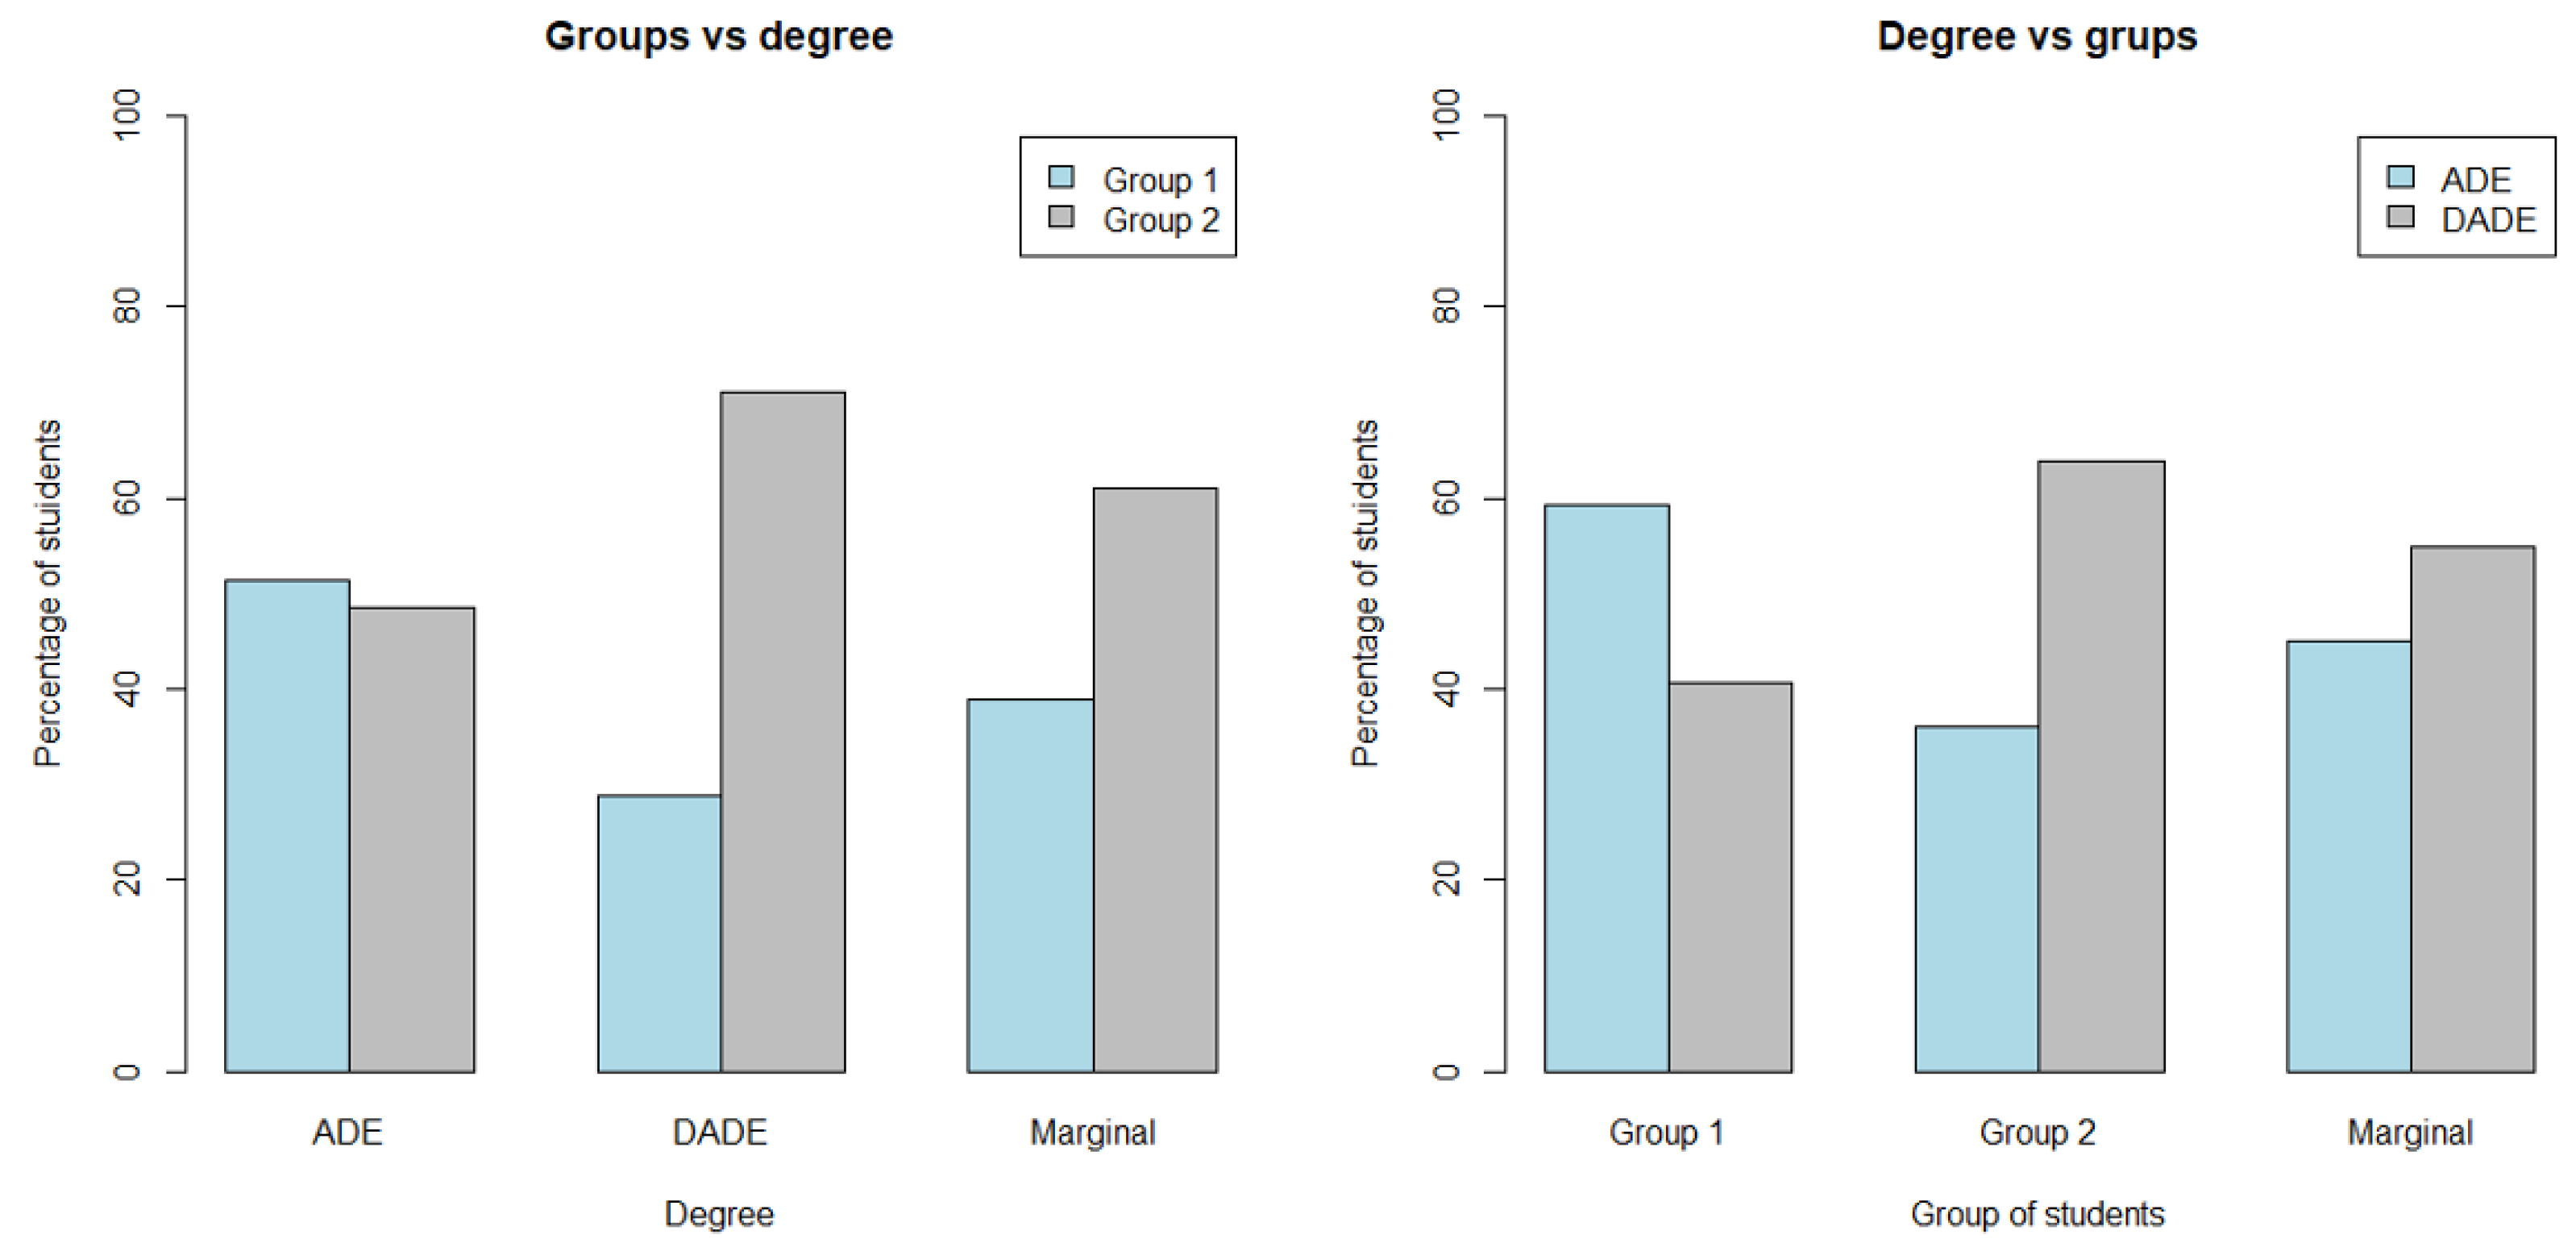
Degree Program
Figure 6 presents the distribution of student groups by degree program (left) and the distribution of degree programs across groups (right), while
Table 3 analyzes the presence of statistically significant differences using the Pearson’s chi-squared test with Yates’ continuity correction.
It can be observed (see
Table 3) that there is a marginally significant association at the 10% level between degree program and cluster membership (Pearson’s chi-squared
p-value = 0.065). Students in Group 2 (high engagement) are more frequently enrolled in the DADE program, whereas students in Group 1 are more commonly associated with the ADE program (see
Figure 6 and
Table 3).
Although this relationship does not reach conventional levels of statistical significance, the observed pattern suggests a potential association between academic background and students’ engagement and emotional experience in PBL.
One possible explanation is that the degree program may act as a proxy for underlying differences in students’ academic profiles, such as prior preparation, quantitative skills, or motivation. For instance, DADE programs often involve more competitive admission criteria, which may be associated with these characteristics.
However, these findings should be interpreted with caution. Selection effects and prior academic ability may influence both emotional responses and engagement, potentially confounding the observed relationship. In addition, potential self-selection effects cannot be ruled out, as participation in the activity was voluntary and may be influenced by students’ initial motivation or attitudes.
Furthermore, since prior academic performance was not directly measured in this study, it is not possible to disentangle whether the observed differences between degree programs reflect the effect of the program itself or pre-existing differences in students’ academic profiles. This limitation is particularly relevant when interpreting the degree-program pattern, which should therefore be understood as indicative rather than causal. Further research is needed to better understand the underlying mechanisms and to isolate the potential effects of prior academic ability, self-selection, and degree-program differences.
First-Time Enrollment
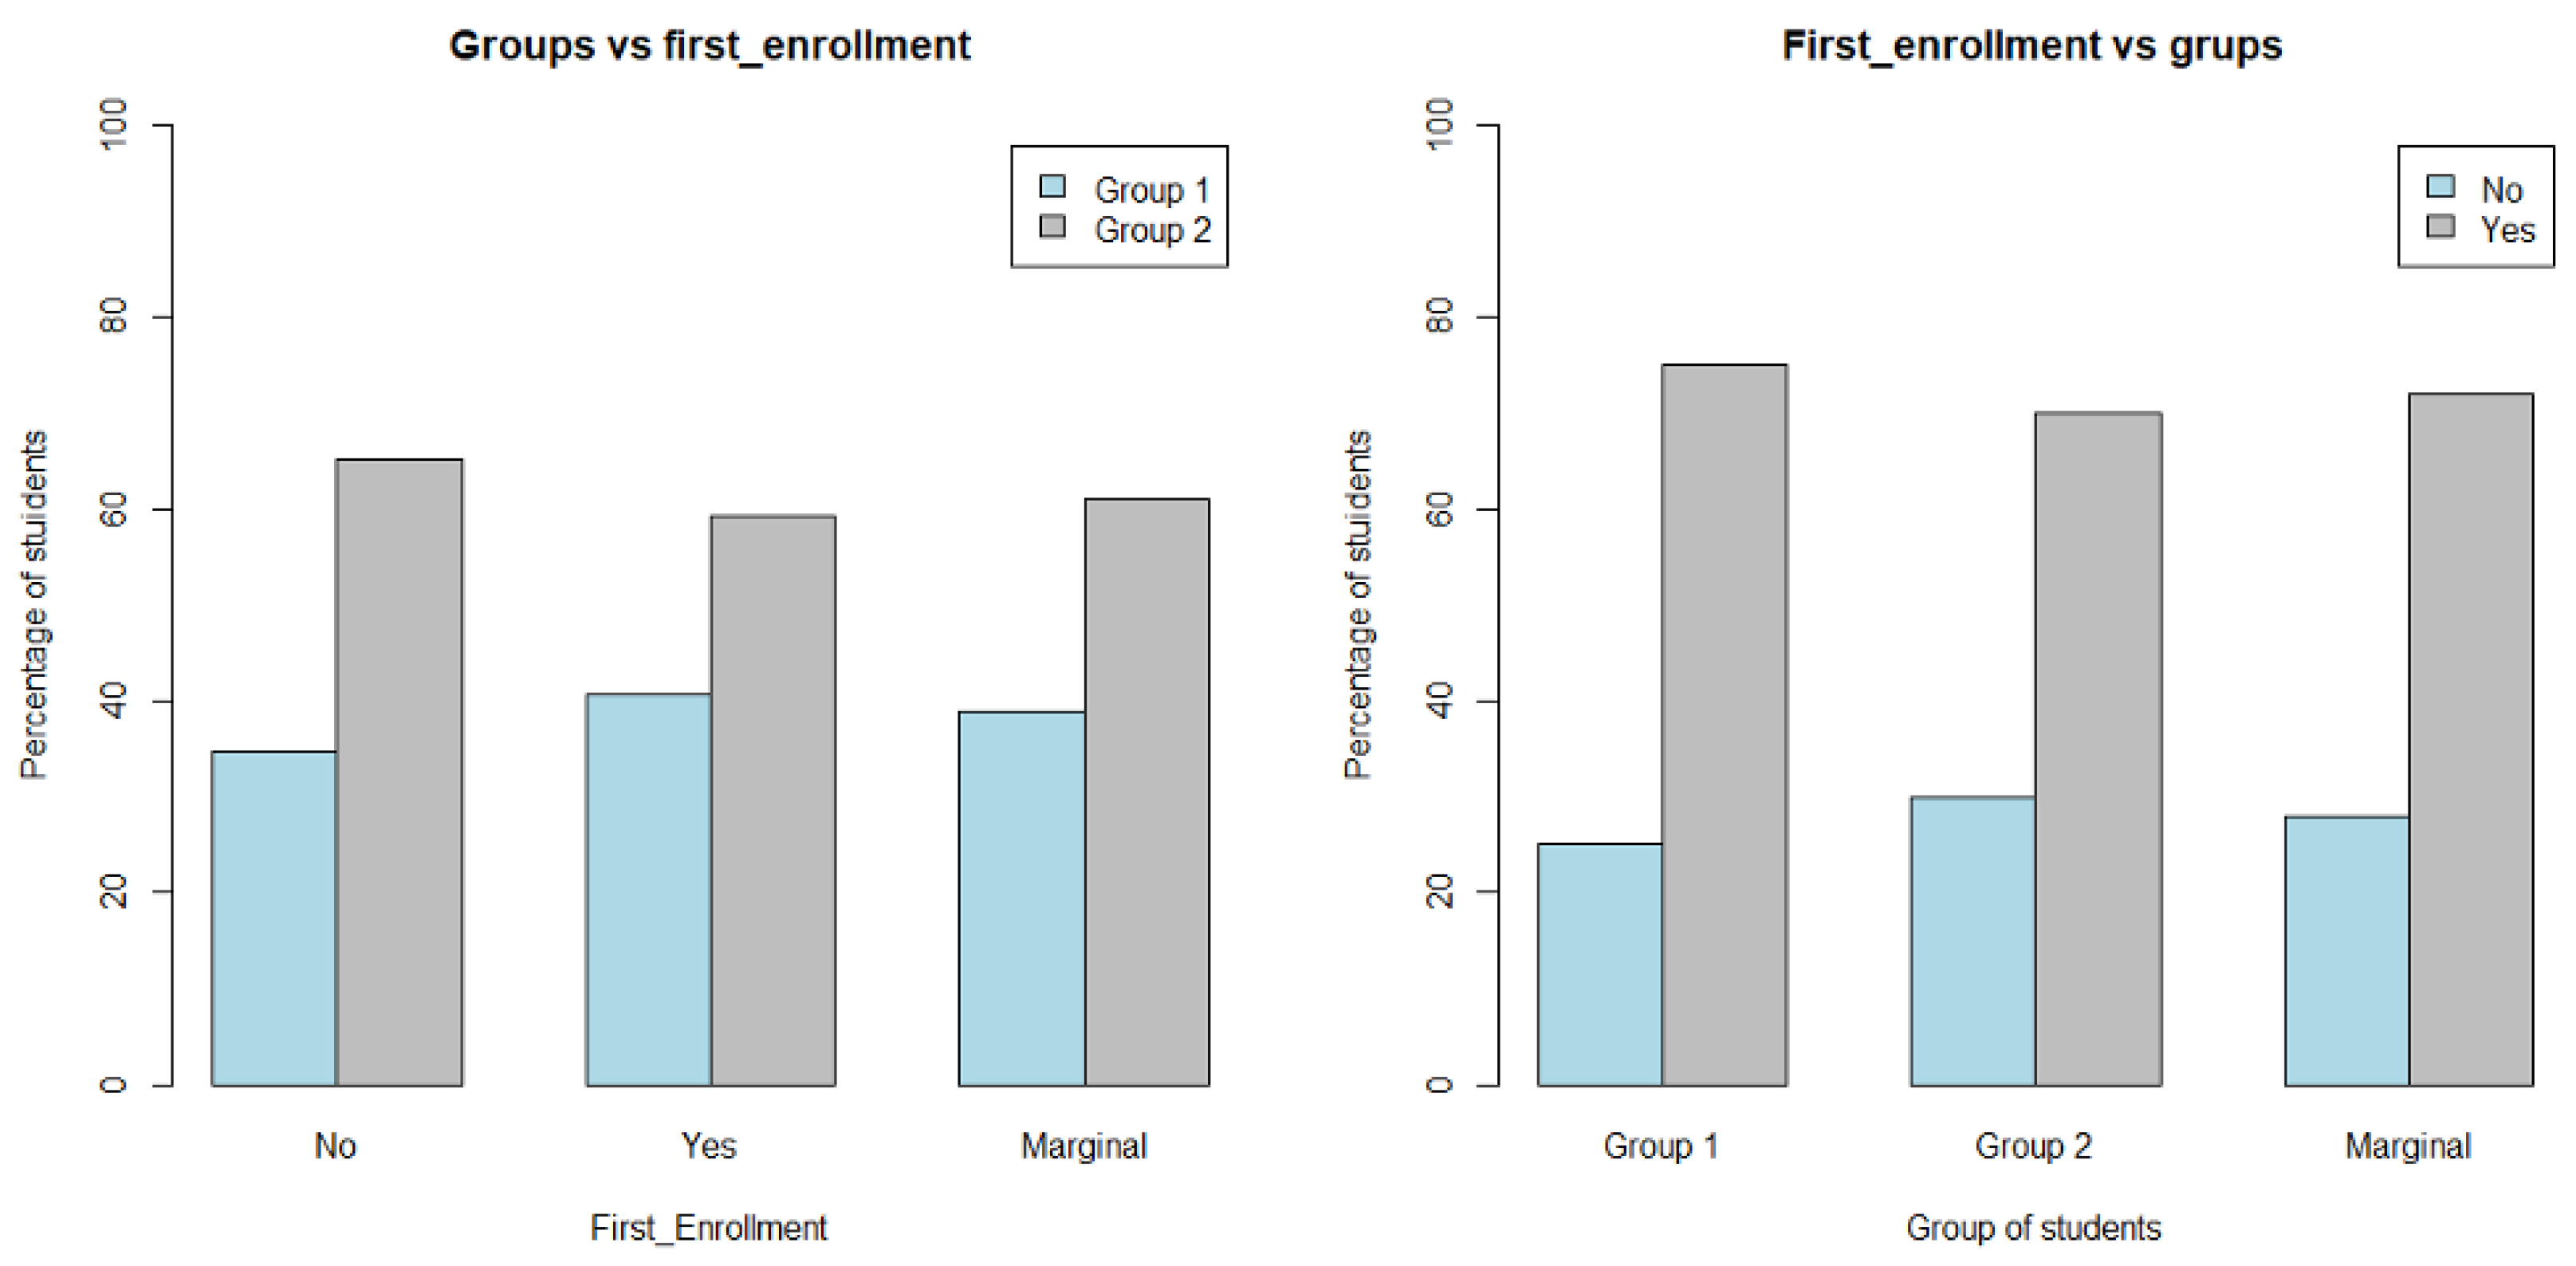
We examined whether students taking the Statistics II course for the first time differ from repeat students in terms of cluster membership, in order to assess whether prior experience with the course influences engagement with PBL and associated positive emotions.
The Pearson’s chi-squared test with Yates’ continuity correction indicated no significant association between first-time enrollment and cluster membership (
p-value = 0.811, see
Table 3). As shown in
Table 3 and
Figure 7, the distribution of first-time and repeat students is very similar across both groups.
These results suggest that prior experience with the course is not significantly associated with students’ engagement with PBL or their positive emotional responses. In this context, the PBL approach appears to be associated with similar outcomes regardless of whether students are taking the course for the first time or repeating it, indicating a consistent pattern across different student profiles. This pattern suggests that PBL may be applied in a consistent manner across students with different levels of prior exposure.
Age
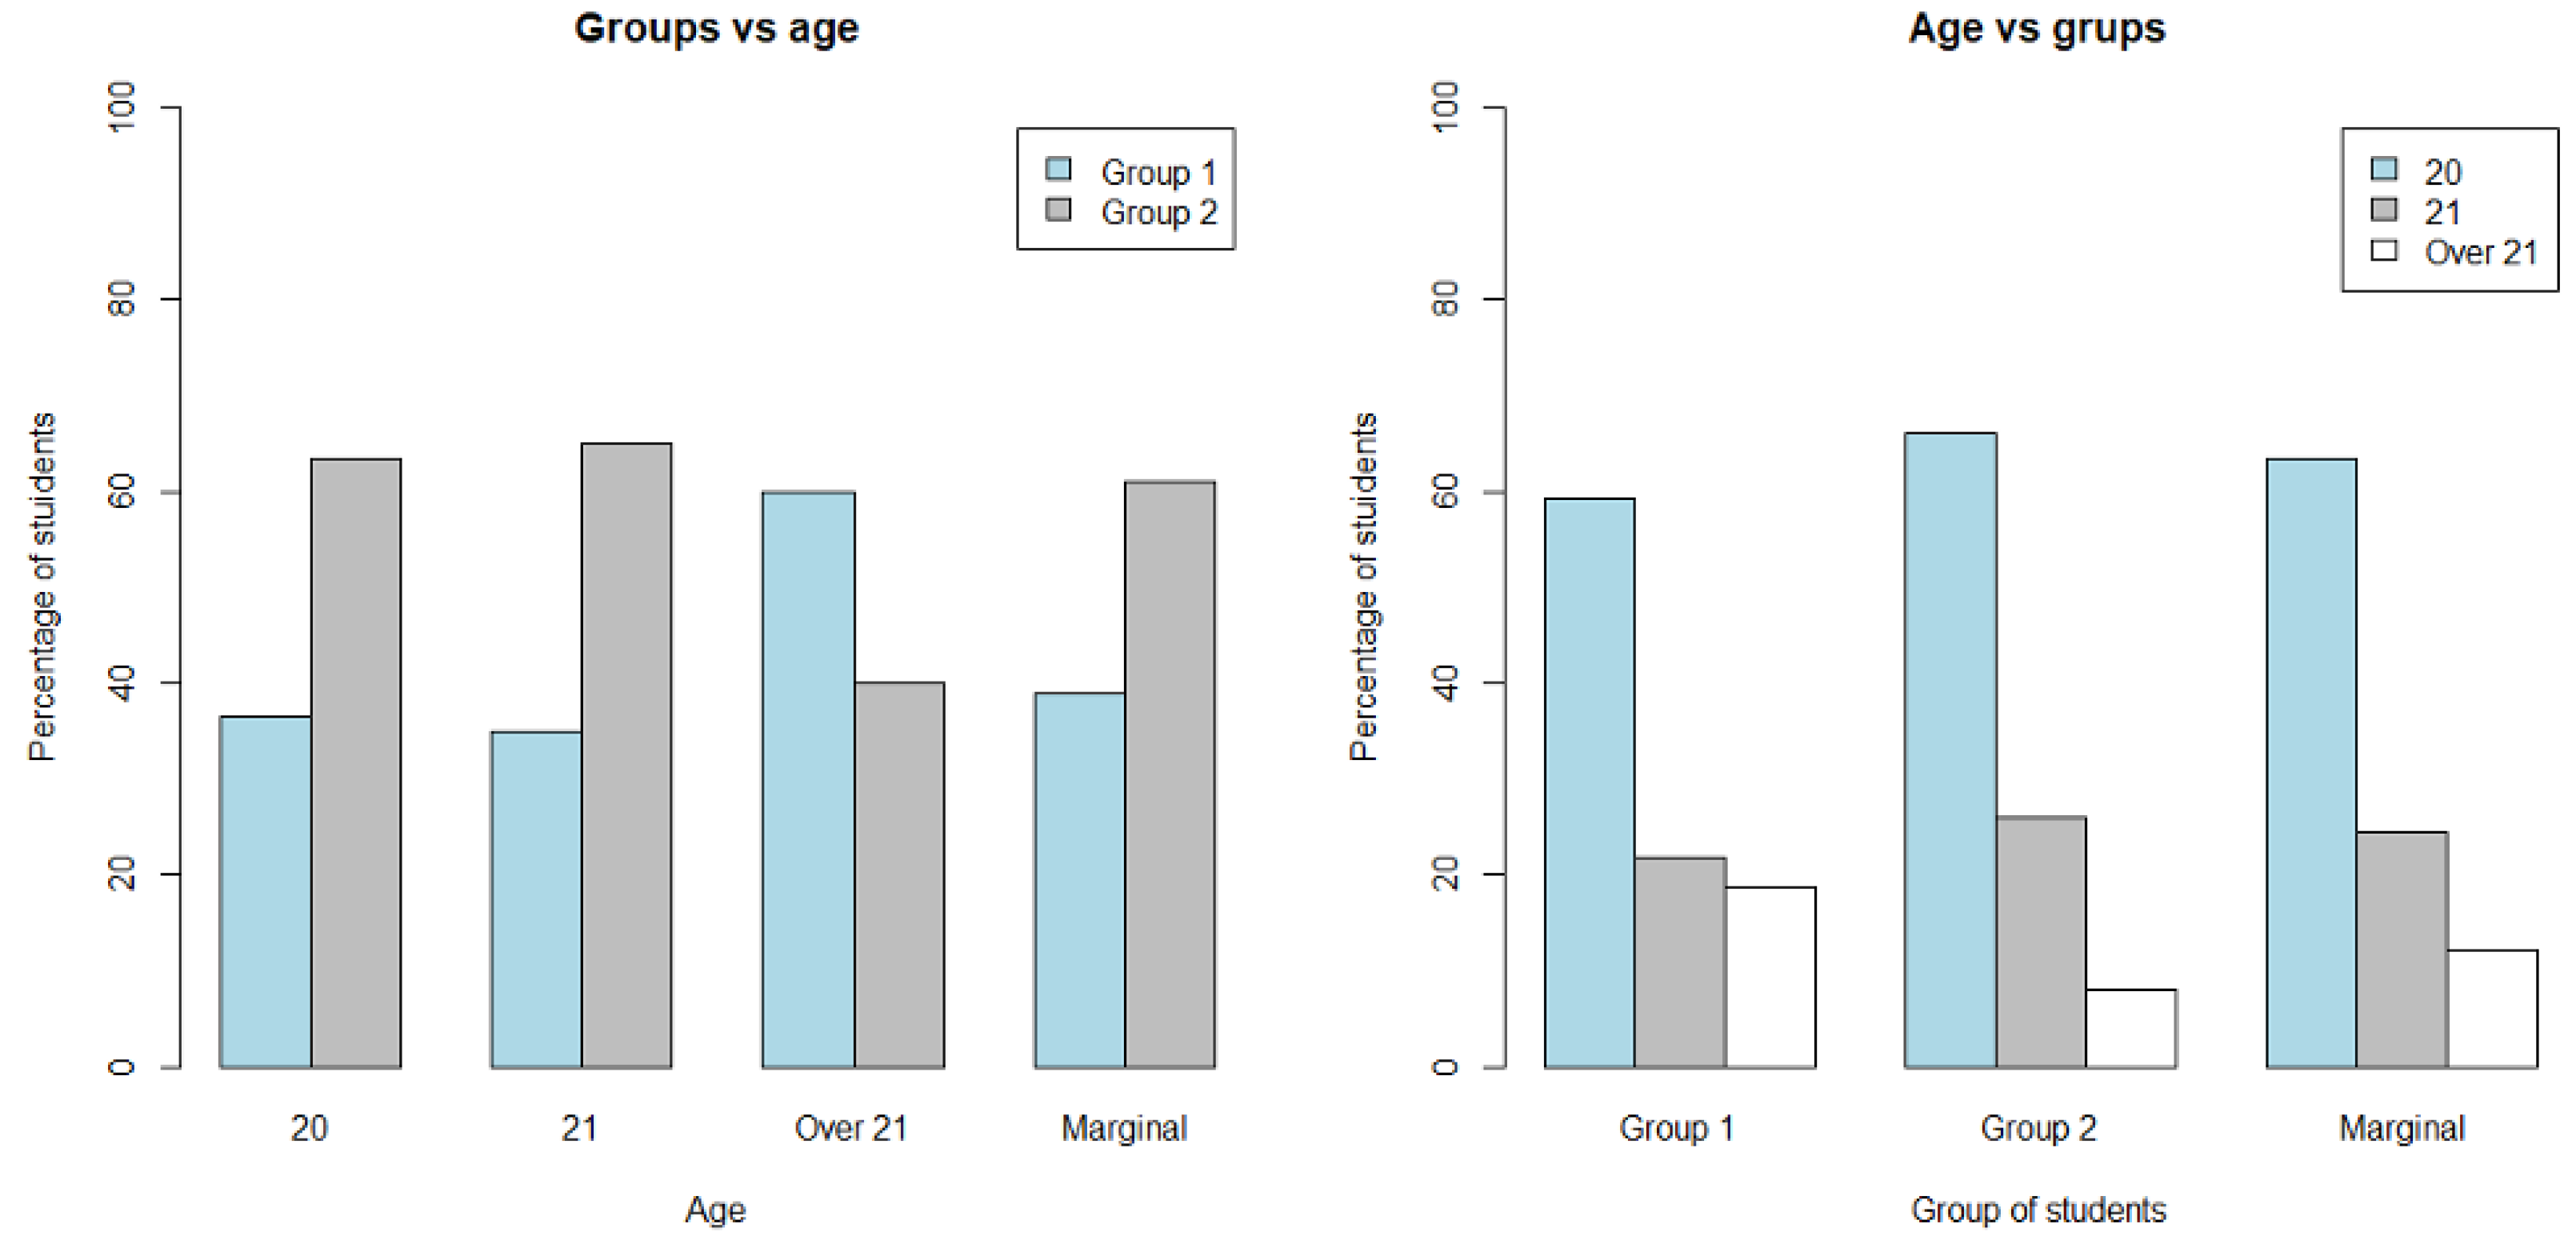
We conducted an analysis to examine whether age-related patterns were present across the clusters, in order to assess whether students of different age groups were more likely to belong to high- or low-engagement profiles.
The results (see
Table 3) indicate no significant association between age and cluster membership (Pearson’s chi-squared
p-value = 0.346). As shown in
Table 3 and
Figure 8, the distribution of age groups is similar across clusters, with only minor differences that are not statistically significant.
These findings suggest that age does not play a determining role in students’ engagement with PBL or their positive emotional responses. This result is consistent with the findings for first-time enrollment, indicating that neither age nor prior experience appears to substantially influence cluster membership. Overall, these results suggest that the PBL approach can be applied across students of different ages, supporting its consistency as a teaching methodology.
5. Conclusions
This study examined the role of positive emotions in the teaching of Probability Calculus and Inferential Statistics within Business Administration and Management programmes, and analyzed their relationship with PBL.
Using PLS-SEM techniques, the results reveal a significant and direct positive relationship between students’ positive emotions and their engagement with PBL. These findings highlight the central role of emotional factors in shaping students’ involvement, motivation, and active participation in statistical learning, as also suggested by Valiente et al. [
25].
Moreover, the work of Wickramasinghe and Appiah [
62] reinforces the benefits of PBL for students’ conceptual understanding and statistical literacy, highlighting the importance of active learning methodologies. In line with previous research, emotionally supportive and active learning environments appear to foster deeper engagement and contribute to the development of key competencies.
Integrating emotional considerations into PBL strategies not only improves student’ self-efficacy and motivation, but also promotes teamwork and enhances communication with the teacher, which may lead to improved academic performance.
Together, the evidence reinforces the importance of emotionally responsive and active methodologies in promoting engagement, deeper conceptual understanding, and skill development in statistical learning. Striking a balance between challenge and accessibility, combined with teacher support and opportunities for both autonomous and collaborative learning, enhances students’ attitudes toward Statistics while improving their performance and emotional well-being.
The study also identified two distinct student profiles characterized by different levels of positive emotions and engagement with PBL. One group exhibited lower emotional behavior as well as lower engagement and participation, while the other showed higher levels of both constructs. These results underline the importance of recognizing heterogeneity in student experiences and the need for targeted pedagogical strategies to support less engaged learners.
At the same time, the role of students’ initial emotional status should be understood as part of a broader and more complex set of factors that extend beyond the classroom. Students often enter statistics courses with pre-existing beliefs, prior experiences, and emotional dispositions, such as anxiety or low self-confidence, that have developed over time and may not be easily modified through a single pedagogical intervention.
In this context, while PBL can contribute to improving engagement by fostering positive emotional experiences during the learning process, it should not be considered a standalone solution to deeply rooted emotional barriers. Rather, its effectiveness depends on how it is integrated within a broader educational framework that includes supportive teaching practices, scaffolding, and institutional strategies aimed at addressing students’ diverse needs.
This perspective highlights the importance of combining pedagogical innovation with a more holistic understanding of students’ learning conditions, recognizing that emotional engagement is shaped by both in-class and out-of-class factors. Based on the empirical findings of this study, the following prioritized actions are proposed. Each recommendation specifies the relevant actor, the stage of implementation, and its direct link to the observed results.
First, instructors should actively promote participation at the beginning of the course by clearly communicating the purpose, benefits, and expectations of the activity. This recommendation is directly linked to the empirical finding that pre-learning positive emotions are negatively associated with perceived utility, suggesting that students who already feel confident may underestimate the value of the activity and therefore require additional motivation to engage.
Second, instructors should focus on supporting students throughout the PBL activity, particularly during key stages such as group tutoring and feedback on video production, by providing structured guidance. This recommendation is based on the empirical result that post-learning emotions are strongly associated with perceived utility, teamwork, and communication with the teacher, indicating that positive emotional experiences are developed during the process rather than prior to it.
Third, course instructors should design activities that explicitly emphasize collaborative and reflective components, such as group discussion, peer interaction, and the creation of explanatory materials (e.g., videos). This action is directly supported by the observed association between positive emotions and improvements in teamwork and communication skills.
Fourth, course instructors should ensure the availability of shared learning resources, such as the online platform used to disseminate student-produced materials, both during and after the activity. This recommendation is linked to the importance of reinforcing the collective learning environment, which is associated with higher levels of engagement observed in the study.
These actions should be implemented across different stages of the activity: initial communication (before participation), guided support (during the process), and resource sharing (after completion), aligning with the temporal dynamics of students’ emotional experiences.
Beyond these practical implications, these findings also contribute to the framework of ESD, illustrating how emotionally supportive and active learning methodologies can strengthen key sustainability competencies, including critical thinking, collaboration, communication, and data-informed decision-making.
This study presents several limitations that should be considered when interpreting the results. To begin with, the sample consists of 82 students from a single faculty at one university, which limits external validity and restricts the generalizability of the findings. Although this design allows for an in-depth analysis of a specific educational context, the results should be interpreted cautiously, as institutional and contextual factors may influence the observed relationships.
In addition, the study was conducted in a natural educational setting without a control group exposed exclusively to traditional methodologies. While this enhances ecological validity, it prevents isolating the specific effects of PBL from other influencing factors, such as prior academic ability, motivation, prior experiences, beliefs or instructor-related variables. Therefore, the findings should be understood as indicative of associations rather than causal relationships.
Furthermore, the data were collected using a structured Likert-scale questionnaire, which may introduce response biases and may not fully capture the complexity of students’ emotional experiences. The absence of qualitative methods limits the depth of interpretation, and the cross-sectional design prevents the analysis of temporal dynamics and causal directionality between variables.
Finally, the use of a single data source and measurement method raises the possibility of common method bias, which may inflate observed relationships. Future research should address these limitations by incorporating mixed-method approaches, longitudinal designs, and multiple data sources, allowing for a more comprehensive understanding of the interplay between emotions, engagement, and learning outcomes. Further studies should also expand the scope of analysis by including larger and more diverse samples across institutions and disciplines, enabling comparative studies and the identification of contextual factors that may moderate the effectiveness of PBL. Additionally, experimental or quasi-experimental designs could help clarify causal relationships, while qualitative approaches may provide deeper insights into students’ emotional trajectories and learning experiences.