


Abstract
Madeira’s agricultural sector is characterised by pronounced structural heterogeneity, land fragmentation, and increasing socio-economic and environmental pressures. However, comprehensive typological and spatial analyses remain limited, particularly in small island contexts. This study addresses this gap by providing a typological and spatial analysis of the agrarian structure in the Autonomous Region of Madeira, Portugal, using 2019 Agricultural Census data. An integrated framework combining Principal Component Analysis (PCA), Partitioning Around Medoids (PAM) clustering, and Random Forest validation—representing a novel approach in agrarian typology studies—is employed to identify three agricultural models: Intensive Subtropical Agriculture (24.1% of parishes), characterised by small holdings and high labour intensity; Extensive Traditional Agriculture (64.8%), featuring moderate farm size and diversified cropping; and Pasture-based Agriculture (11.1%), dominated by larger farms and low labour input. The results confirm significant structural trade-offs, including a strong inverse relationship between farm size and labour intensity (r = −0.653) and a negative correlation between specialisation and crop diversity (r = −0.673). Spatially, the models exhibit clear territorial differentiation, with subtropical systems concentrated in southern coastal areas and traditional systems prevailing in northern and interior regions. These findings support the hypothesis of a hybrid agrarian transition. Despite relying on cross-sectional data, the results provide a robust basis for targeted and place-based policy design within the Common Agricultural Policy (CAP) framework.
1. Introduction
Small island regions concentrate many of the structural constraints shaping contemporary agriculture, including steep topography, land scarcity, microclimatic variability, and high exposure to climatic and market shocks. These conditions restrict mechanisation and economies of scale, favouring small-scale, labour-intensive, and spatially adaptive farming systems [1,2,3]. In this context, agriculture plays a multifunctional role, extending beyond food production to include landscape management, cultural identity, and environmental services, with diversification often enhancing resilience to economic and environmental shocks [4,5].
The Autonomous Region of Madeira in Portugal illustrates these dynamics. Terraced slopes shape its agricultural landscape, with pronounced altitudinal gradients and extreme land fragmentation, historically supporting smallholder systems adapted to local ecological conditions [6,7]. Although agriculture contributes modestly to regional output, it remains central to rural livelihoods, territorial identity, and ecosystem maintenance. Recent structural evidence shows that between 2019 and 2023, the number of agricultural holdings declined by 9.8%, while utilised agricultural area increased by 2.1%, resulting in only a marginal rise in average farm size to 0.39 hectares. Despite this limited consolidation, more than 77% of holdings remain economically very small, and agricultural labour remains overwhelmingly family-based, accounting for over 85% of total work units. Land use has become increasingly polarised, with permanent crops exceeding 50% of the total Utilised Agricultural Area (UAA), driven primarily by the expansion of subtropical fruits in southern coastal areas. At the same time, diversified cropping systems and pasture-based agriculture persist in interior and upland zones [8]. Together, these patterns point to a structurally heterogeneous agrarian system composed of multiple, territorially embedded production models.
Despite Madeira’s relevance in regional agricultural strategies, its internal agrarian organisation remains poorly quantified. Existing studies are largely descriptive, emphasising family farming, terraced micro-holdings, or niche crop expansion without producing a statistically validated and spatially explicit typology [3,9]. This limitation has direct policy implications. Aggregate indicators obscure heterogeneity across Madeira’s 54 parishes, while case studies cannot determine whether observed patterns reflect coherent production systems or localised exceptions. Consequently, agricultural interventions under the Common Agricultural Policy (CAP) risk being weakly aligned with territorial realities.
The absence of a robust typology also constrains the understanding of key structural relationships emphasised in agrarian economics. The literature consistently identifies an inverse relationship between farm size and labour intensity, particularly in fragmented smallholder systems [10,11]. A further central trade-off concerns specialisation versus diversification: while specialisation may enhance efficiency and market integration, diversification improves resilience to climatic and economic shocks [4]. In small island contexts, these strategies often coexist as adaptive responses rather than linear transitions towards uniform modernisation [12]. However, these relationships have not been systematically examined for Madeira using spatially disaggregated data.
Building on this context, the study develops a parish-level, data-driven, and statistically validated agrarian typology for Madeira using the 2019 Agricultural Census. It contributes to the literature by providing an integrated framework to capture structural diversity and spatial differentiation in small island agricultural systems, where such approaches remain limited. The methodological strategy combines established multivariate and machine learning techniques, whose detailed implementation is presented in the Section 3 [13,14,15].
The analysis is guided by the central question of how Madeira’s agrarian structure is organised in terms of structural diversity, productive specialisation, and territorial patterning, and which agricultural systems emerge from this organisation. Six hypotheses are tested.
Hypothesis 1.
First, Madeira’s parishes are expected to cluster into distinct production models reflecting differentiated agrarian systems, consistent with typological approaches in rural development and island studies [3,16].
Hypothesis 2.
Second, an inverse relationship between farm size and labour intensity is anticipated reflecting the prevalence of family labour in fragmented systems [10,11].
Hypothesis 3.
Third, productive specialisation, particularly in subtropical fruits, is expected to be negatively associated with crop diversity, reflecting the efficiency–resilience trade-off documented in agroecological and agrarian literature [14].
Hypothesis 4.
Fourth, agricultural systems are hypothesised to exhibit clear territorial segmentation across municipalities and ecological zones, as observed in other island and Mediterranean contexts shaped by altitude, exposure, and historical land use [3].
Hypothesis 5.
Fifth, the coexistence of intensive, traditional, and pasture-based systems is interpreted as evidence of a hybrid agrarian transition rather than a linear modernisation pathway, consistent with the concept of agrarian multiplicity [12].
Hypothesis 6.
Finally, higher land fragmentation is expected to be associated with greater reliance on family labour, reflecting institutional and structural constraints on mechanisation and scale efficiency [17].
By providing a validated, spatially explicit typology, this study advances the understanding of agrarian structure in small island regions and offers a robust empirical basis for differentiated, place-based agricultural policy aligned with CAP objectives on farm viability and resilience, environmental sustainability, and balanced territorial development.
2. Literature Review
Small islands face distinctive agricultural constraints arising from land scarcity, steep topography, microclimatic variability, and exposure to climatic and market shocks [1,5]. These conditions favour small-scale, labour-intensive, and diversified production systems aimed at risk mitigation rather than scale efficiency. This logic is central to the FAO framework for resilient island agriculture [2] and is consistent with evidence identifying diversification as a key resilience strategy [4].
Structural vulnerability in island agriculture is reinforced by fragmented land tenure [18], topographic barriers to mechanisation [19], and diseconomies of scale that increase production costs [2]. These constraints historically promoted adaptive practices such as terracing, mixed cropping, and the use of altitude gradients to exploit microclimatic variation [1]. Empirical studies across the Caribbean, Pacific, and Mediterranean islands consistently report smallholder systems combining crop diversity, family labour, and spatial adaptation [1,5].
Madeira reflects these structural characteristics. Madeira reflects typical small-island structural constraints, including land fragmentation and altitude-conditioned land use [6,7]. Recent evidence indicates modest land consolidation, suggesting the emergence of spatially differentiated agrarian clusters [8], supporting the clustered agrarian structure hypothesis (H1).
Land fragmentation, driven by inheritance practices, socio-cultural norms, and complex topography, is a defining feature of small-island agriculture [17,20]. Although fragmentation can enhance crop diversity and optimise microclimate, it also increases transaction costs, limits mechanisation, and increases dependence on family labour [10].
Empirical literature consistently identifies an inverse relationship between farm size and labour intensity, with smaller and fragmented holdings relying disproportionately on family labour [11]. These patterns reflect technological constraints and household-based production strategies. In Madeira, microplots embedded in terraced landscapes reinforce labour-intensive systems, with permanent crops dominating land use and family labour remaining the primary workforce component, despite a recent decline [8]. These features support the size–intensity hypothesis (H2) and the fragmentation–labour dependence hypothesis (H6).
A central trade-off in agrarian economics concerns efficiency versus resilience. Diversification stabilises income and reduces climate risk, while specialisation enhances technical efficiency but increases vulnerability [4]. Madeira exhibits this trade-off: specialised subtropical fruit production has expanded in southern coastal parishes, while interior highlands maintain mixed cropping and permanent pastures [8]. This coexistence supports the specialisation–diversification trade-off hypothesis (H3) and the structural transition hypothesis (H5).
Agricultural typologies are essential for analysing structural heterogeneity and informing policy under the Common Agricultural Policy [16]. Empirical applications across island and Mediterranean regions demonstrate their value for territorial planning and targeted interventions [3]. In Madeira, however, existing classifications remain descriptive and lack quantitative and spatial validation [9,21], highlighting the need for a rigorous typological framework and reinforcing H1. Complex island agrarian systems require multivariate methods to identify latent structures [13]. Principal Component Analysis (PCA) is widely used to reduce dimensionality, while Partitioning Around Medoids (PAM) offers robust clustering in the presence of outliers [22]. Random Forest approaches further validate typologies and assess variable importance. Although applied elsewhere in Southern Europe and the Azores, this integrated framework has not been applied to Madeira.
Spatial differentiation in island agriculture is strongly shaped by altitude, slope, exposure, and historical specialisation [3]. In Madeira, subtropical fruits dominate the southern coast, viticulture is concentrated in the northern valleys, and the interior highlands support mixed cropping and pastures, notably on the Paul da Serra plateau [8]. These patterns support the territorial segmentation hypothesis (H4).
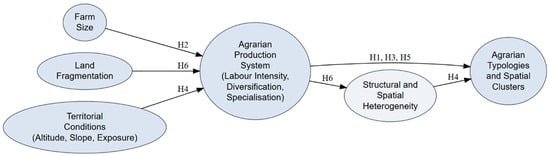
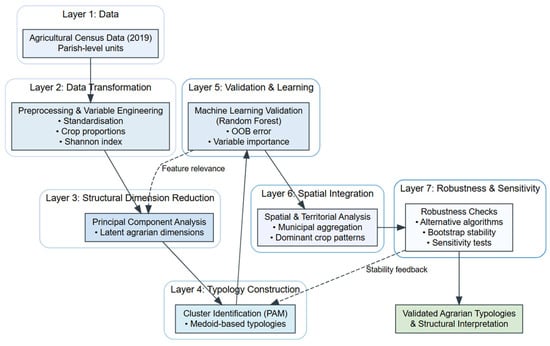
By integrating PCA, PAM clustering, Random Forest validation, and spatial analysis using Agricultural Census data, this study delivers the first statistically validated agrarian typology for Madeira. It provides an empirical basis for CAP implementation, territorial planning, and sustainable agricultural policy, while directly testing hypotheses (H1–H6). Indeed, Figure 1 synthesises the literature by linking land structure and territorial conditions to agrarian production systems and their spatial typologies in small island contexts. The framework provides the theoretical basis for analysing structural heterogeneity, specialisation–diversification trade-offs, and territorial segmentation in Madeira.
Figure 1.
Conceptual framework linking land structure, agrarian production systems, and spatial typologies in small island agriculture. This figure was created by the authors.
3. Materials and Methods
3.1. Material
This study uses secondary data from the 2019 Agricultural Census on the Structure of Agricultural Holdings [8]. The study area is Madeira Island, part of Portugal’s Autonomous Region of Madeira, located in the North Atlantic Ocean. The analysis covers the entire agricultural sector across 54 parishes and 11 municipalities (see Table A1 in Appendix A).
The dataset provides a structural snapshot of agriculture in 2019. The analysis employs primary census variables in their original units (ares) and derived indicators that capture intensity, diversification, and specialisation. Area-based variables were converted to hectares only for selected indicators (e.g., farm size and labour density), while proportions and standardised scores remain unitless. Variable selection and transformations follow standard practices in agricultural economics and rural geography. Table 1 reports all variables, sources, and transformations.
Table 1.
Variables used in the analysis.
Primary census variables were transformed into derived indicators to ensure standardisation and comparability. UAA and crop areas were converted from ares to hectares to align with SI units and with Eurostat, FAO, and regional datasets. Labour density was calculated as persons per 100 hectares by converting AWU to person equivalents. Crop proportions were computed relative to total UAA to assess specialisation, while diversification was measured using the Shannon Diversity Index [24]. Prior to Principal Component Analysis and clustering, all variables were standardised (mean = 0, SD = 1) to eliminate scale effects and ensure equal weighting [25]. These transformations provide a consistent framework for analysing structural, intensity, and specialisation dimensions.
The 2019 Agricultural Census provides full coverage of all holdings in Madeira, eliminating sampling error and enabling detailed spatial analysis. As a decennial survey, the 2019 reference year captures structural change since 2009. It offers a robust baseline for evaluating contemporary agrarian structures relevant to rural development, land-use planning, and the European Union’s Common Agricultural Policy.
3.2. Methods
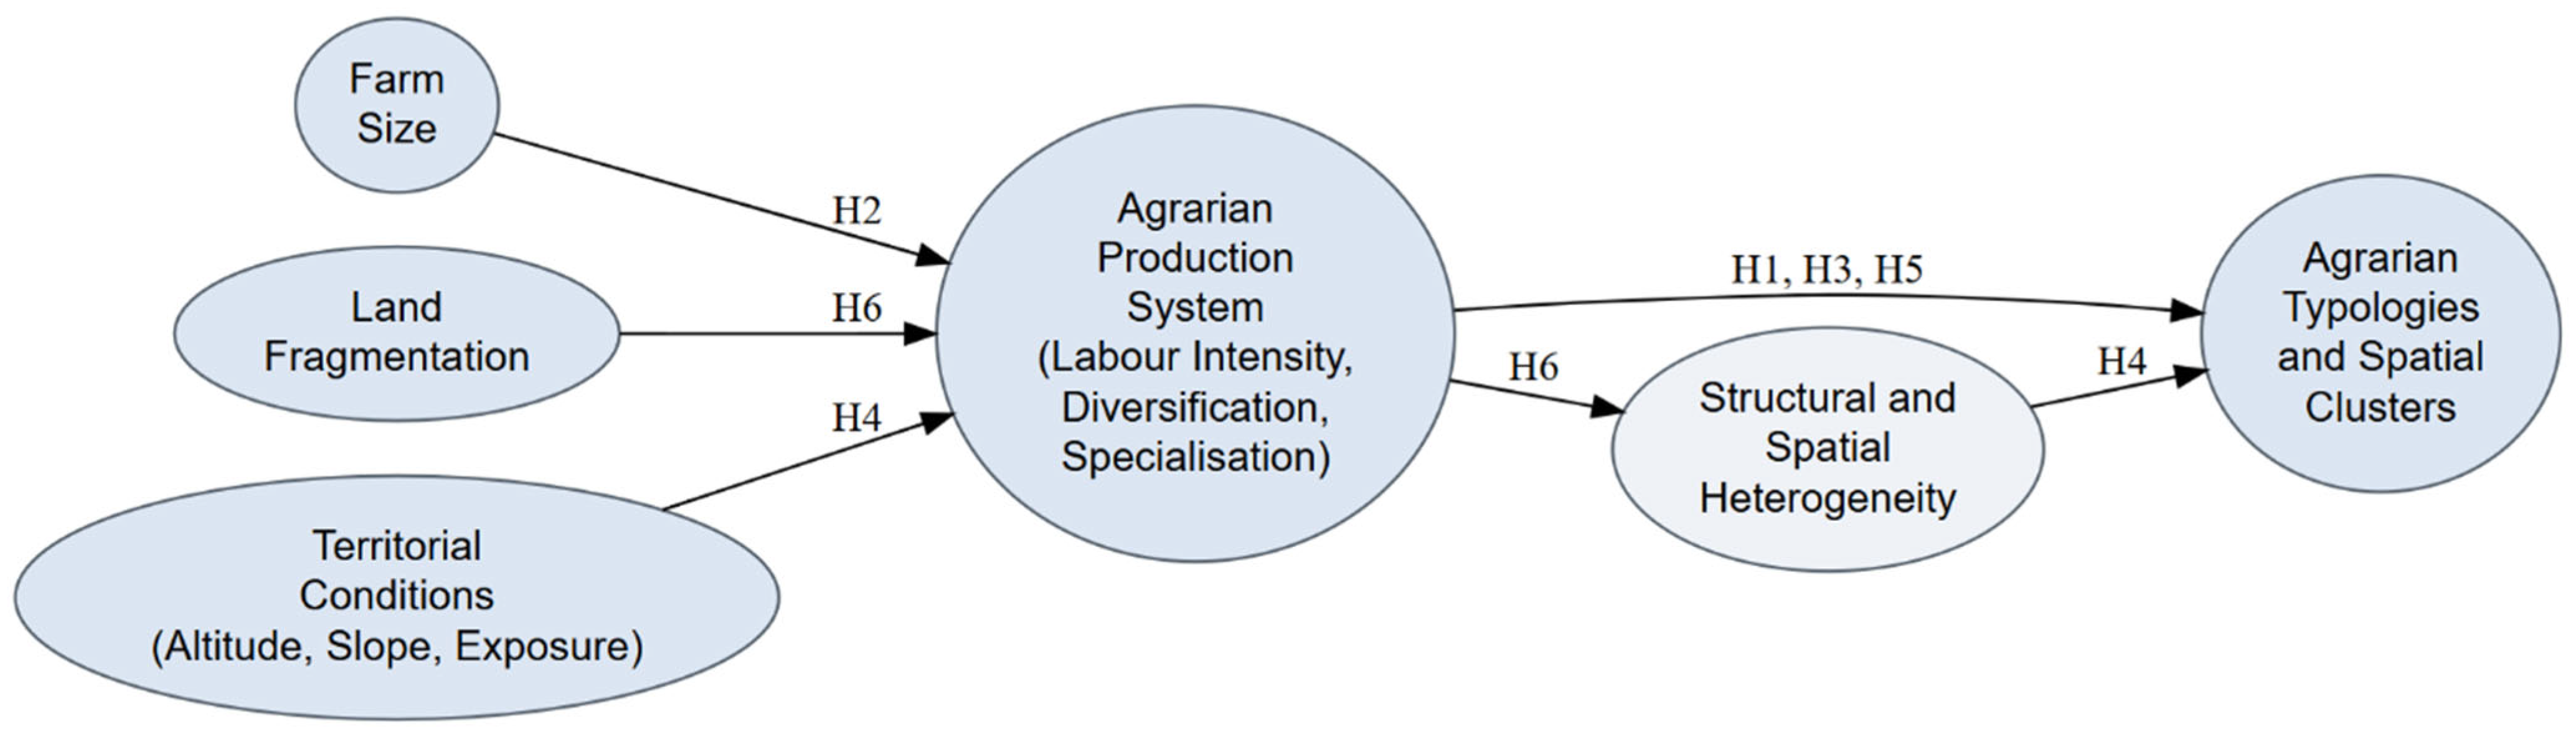
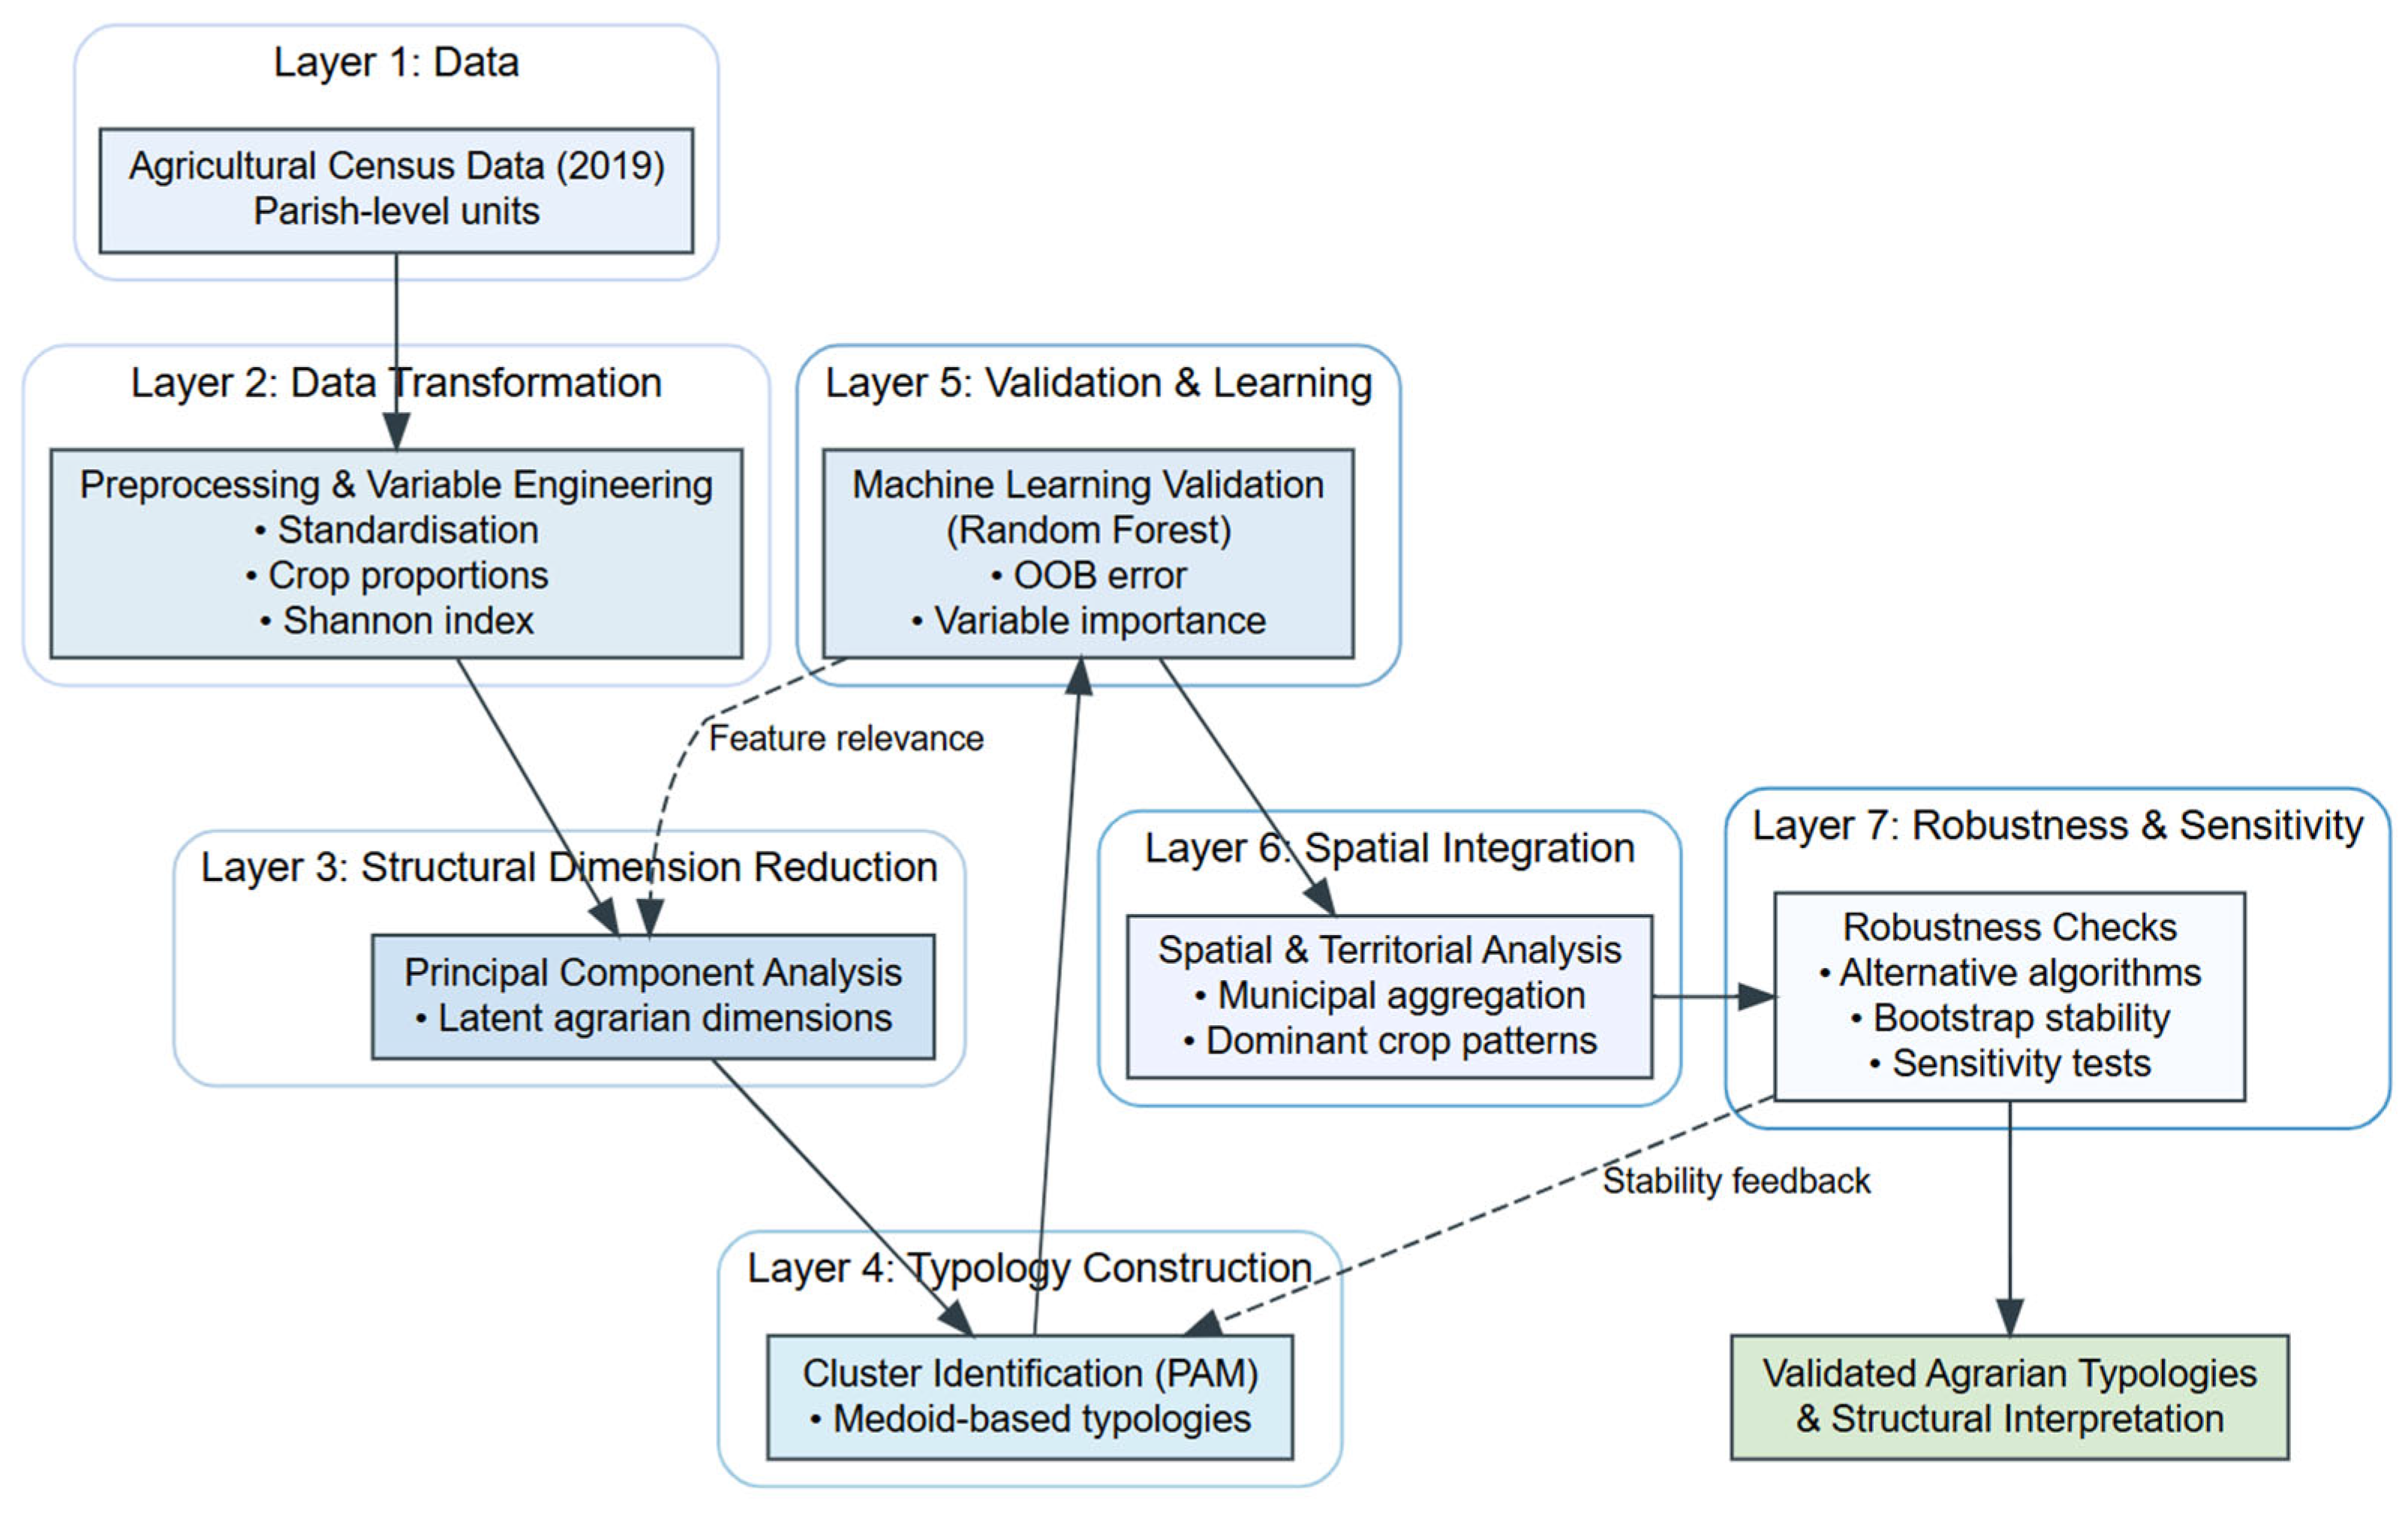
This study applies an integrated methodological framework to characterise the agrarian structure of the Autonomous Region of Madeira. Analyses were conducted in R 4.4.1 using specialised packages, including readxl for data import, dplyr and tidyr [26] for data manipulation, ggplot2 [27] for visualisation, FactoMineR and factoextra [28] for Principal Component Analysis (PCA), cluster [14] for Partitioning Around Medoids (PAM), corrplot [29] for correlation visualisation, and randomForest [15] for machine learning validation. Additional packages, such as viridis, RColorBrewer, and ggrepel, were used to enhance the graphical representation, while sf and geodata supported spatial analysis and mapping. Figure 2 presents an overview of the methodological workflow, which includes data preprocessing and variable construction, descriptive and correlation analyses, dimensionality reduction via PCA, cluster identification, machine-learning validation, spatial analysis, and robustness checks.
Figure 2.
Methodological workflow for agrarian structure analysis. This figure was created by the authors.
3.2.1. Data Preprocessing and Variable Construction
Primary data from the 2019 Agricultural Census were processed using a standardised transformation pipeline to ensure comparability and interpretability. To maintain consistency in internal calculations (e.g., crop proportions), most area-based variables (e.g., UAA, crop areas) were kept in their original unit (ares). However, for specific derived indicators intended for human interpretation and alignment with standard agricultural reporting (e.g., farm size in hectares, labour density per 100 hectares), conversions from ares to hectares were applied where analytically meaningful.
- (a)
- Standardisation
Before multivariate analysis, continuous variables were standardised to eliminate scale effects and ensure comparability across different measurement units (e.g., hectares, percentages, counts). The standardised value represents the number of standard deviations that an observation deviates from the mean and is computed as follows:
where is the original value of the variable for observation (expressed in its original unit, e.g., hectares, percentage, or number of workers), is the mean of the variable , and is the standard deviation. The resulting is a dimensionless (unit-free) variable.
- (b)
- Crop Proportions
Crop specialisation indicators were calculated as proportional shares of the total utilised agricultural area (UAA), ensuring comparability across parishes of different sizes:
where represents the proportion (unitless, ranging from 0 to 1) of the crop in the total agricultural area, is the cultivated area of the crop (measured in ares), and is the total Utilised Agricultural Area (UAA) of the parish (also measured in ares).
- (c)
- Agricultural Diversification (Shannon Diversity Index)
Agricultural diversification was measured using the Shannon Diversity Index, which captures both crop richness and evenness:
where is the Shannon Diversity Index (dimensionless), is the total number of crop categories considered, and is the proportion (unitless, ranging from 0 to 1) of the crop in the total utilised agricultural area (UAA), as defined in Equation (2). This index increases with both the number of crops (richness) and the evenness of their distribution across the total area [24]. All variables were screened for missing values. Proportional variables were set to zero where the corresponding crop area was absent. Extreme values were identified using the Interquartile Range (IQR) method, but were retained to preserve the full heterogeneity of Madeira’s agrarian structure.
3.2.2. Descriptive and Correlation Analysis
Descriptive statistics were computed using dplyr [25]. Pearson correlations assessed pairwise relationships (α = 0.05; [26,30]), visualised with corrplot and hierarchical clustering (Euclidean distance, Ward’s method) to identify patterns prior to dimensionality reduction [29].
3.2.3. Dimensionality Reduction via PCA
To address multicollinearity and extract dominant dimensions of agricultural variation, PCA was applied to nine standardised variables (UAA per farm, labour density, Shannon Diversity Index, agricultural land share, and proportional areas of subtropical fruits, vineyards, vegetables, potatoes, and permanent pastures) using FactoMineR [28]. PCA is widely used in agricultural and rural studies to reduce dimensionality and identify latent structural patterns in complex datasets [13,31]. Variables were standardised (mean = 0, standard deviation = 1) to ensure equal weighting and eliminate scale effects across variables with different measurement units (e.g., hectares, proportions). The Principal Component Analysis (PCA) transformation is expressed as follows:
where is the matrix of standardised variables (dimensionless), with observations (parishes) and variables; is the matrix of eigenvectors (loadings), representing the linear combinations of the original variables; and is the matrix of principal component scores (dimensionless), representing the projection of the observations onto the new orthogonal component space.
Component retention followed the Kaiser–Guttman criterion (eigenvalues > 1) [32] and was supported by scree plot inspection [33]. Based on these criteria, three principal components were retained (eigenvalues: 3.124, 1.886, and 1.172), which together explained 68.68% of the total variance. The component loadings informed the interpretation of the underlying structural dimensions and provided the reduced-dimensional input for subsequent clustering [13].
3.2.4. Cluster Analysis and Validation
Cluster analysis was conducted on PCA scores using PAM, selected for its robustness to outliers and use of observed medoids in heterogeneous agricultural data [14]. Clustering approaches such as PAM have been widely applied in agrarian typology studies to classify heterogeneous farming systems into homogeneous groups [31,34]. Clustering employed Euclidean distance, defined as follows:
where is the Euclidean distance (dimensionless) between observations and ; and are the values of the -th variable for observations and , respectively; and is the number of variables. As all variables were standardised prior to analysis, the resulting distance measure is unit-free and ensures equal contribution of each variable.
The number of clusters () was selected based on a combination of internal validation metrics, stability analysis, and theoretical interpretability. Internal criteria included silhouette width [35], Dunn Index [36], and connectivity [37], while cluster stability was assessed through 30 bootstrap iterations using the Adjusted Rand Index [38]. In addition, Kruskal–Wallis tests were conducted to confirm statistically significant differences across clusters for the main variables [39].
The selection of a three-cluster solution (k = 3) was based on a combination of internal validation metrics (silhouette coefficient, Dunn index, and connectivity), cluster balance, and theoretical interpretability. This specification provided the best compromise between cohesion and separation (silhouette = 0.286; Balance Index = 0.171), outperforming alternative configurations. The choice was further supported by NbClust results and k-means comparisons [40].
3.2.5. Machine Learning Validation (Random Forest)
The Random Forest (RF) model was employed as a supervised validation tool to assess the robustness, discriminative power, and internal consistency of the clustering solution [15]. Random Forest has been increasingly applied in agricultural and environmental studies due to its ability to model complex, non-linear relationships and interactions [41]. Specifically, the PAM-derived cluster labels were used as the response variable, while the original variables served as predictors. High classification accuracy and low out-of-bag error indicate that the identified clusters represent structurally meaningful groupings rather than artefacts of the clustering algorithm. The model was built in R (randomForest package) with 500 trees () and [42]. The RF model predicts the cluster label as the majority vote of all decision trees:
where is the vector of predictor variables (dimensionless, as all variables were standardised), is the prediction of the -th decision tree, and is the total number of trees.
Out-of-bag (OOB) error provides an unbiased estimate of predictive performance:
where is the number of observations, is the predicted class for observation using trees where was not included in the bootstrap sample, is the true class label, and is the indicator function, which equals 1 if the condition is true and 0 otherwise.
Validation included stratified 5-fold cross-validation [43], with evaluation metrics defined as follows:
where , , , and denote true positives, true negatives, false positives, and false negatives, respectively; is the observed agreement, and is the expected agreement by chance. All metrics are dimensionless.
Variable importance was assessed using Mean Decrease in Accuracy (MDA) and Mean Decrease in Gini (MDG):
where is predictor , and is the decrease in Gini impurity at the node . Both measures are unitless.
Finally, the RF proximity matrix , which measures the proportion of trees in which two observations fall in the same terminal node, was analysed using Classical Multidimensional Scaling (MDS):
where is the proximity between observations and , is the derived distance (dimensionless), and represents the coordinates in the reduced-dimensional space.
High classification accuracy and clear separation in the MDS space indicate that the clusters represent structurally meaningful agrarian groupings rather than artefacts of the clustering algorithm.
3.2.6. Spatial and Territorial Analysis
The geographic distribution of clusters was examined at the municipal level by calculating the proportion of parishes in each cluster and identifying the dominant crop per parish (i.e., the crop with the highest UAA proportion) [44].
3.2.7. Robustness Checks and Sensitivity Analysis
Robustness was assessed using complementary approaches. Multivariate outliers were identified via the Interquartile Range (IQR) method, and cluster stability was evaluated by comparing PAM assignments with and without outliers. Algorithm robustness was tested by comparing PAM results with k-means [45] and Ward’s hierarchical clustering, using the Adjusted Rand Index (ARI) to measure agreement. Variable sensitivity was examined by re-running PCA and clustering with alternative transformations (logarithmic or square root) for skewed variables. Sample stability was assessed through 30 bootstrap iterations, with ARI evaluating consistency across resampled datasets.
4. Empirical Results
4.1. Descriptive Statistics of the Agricultural Sector
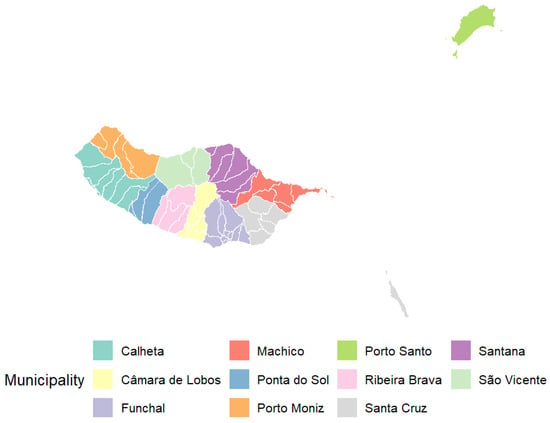
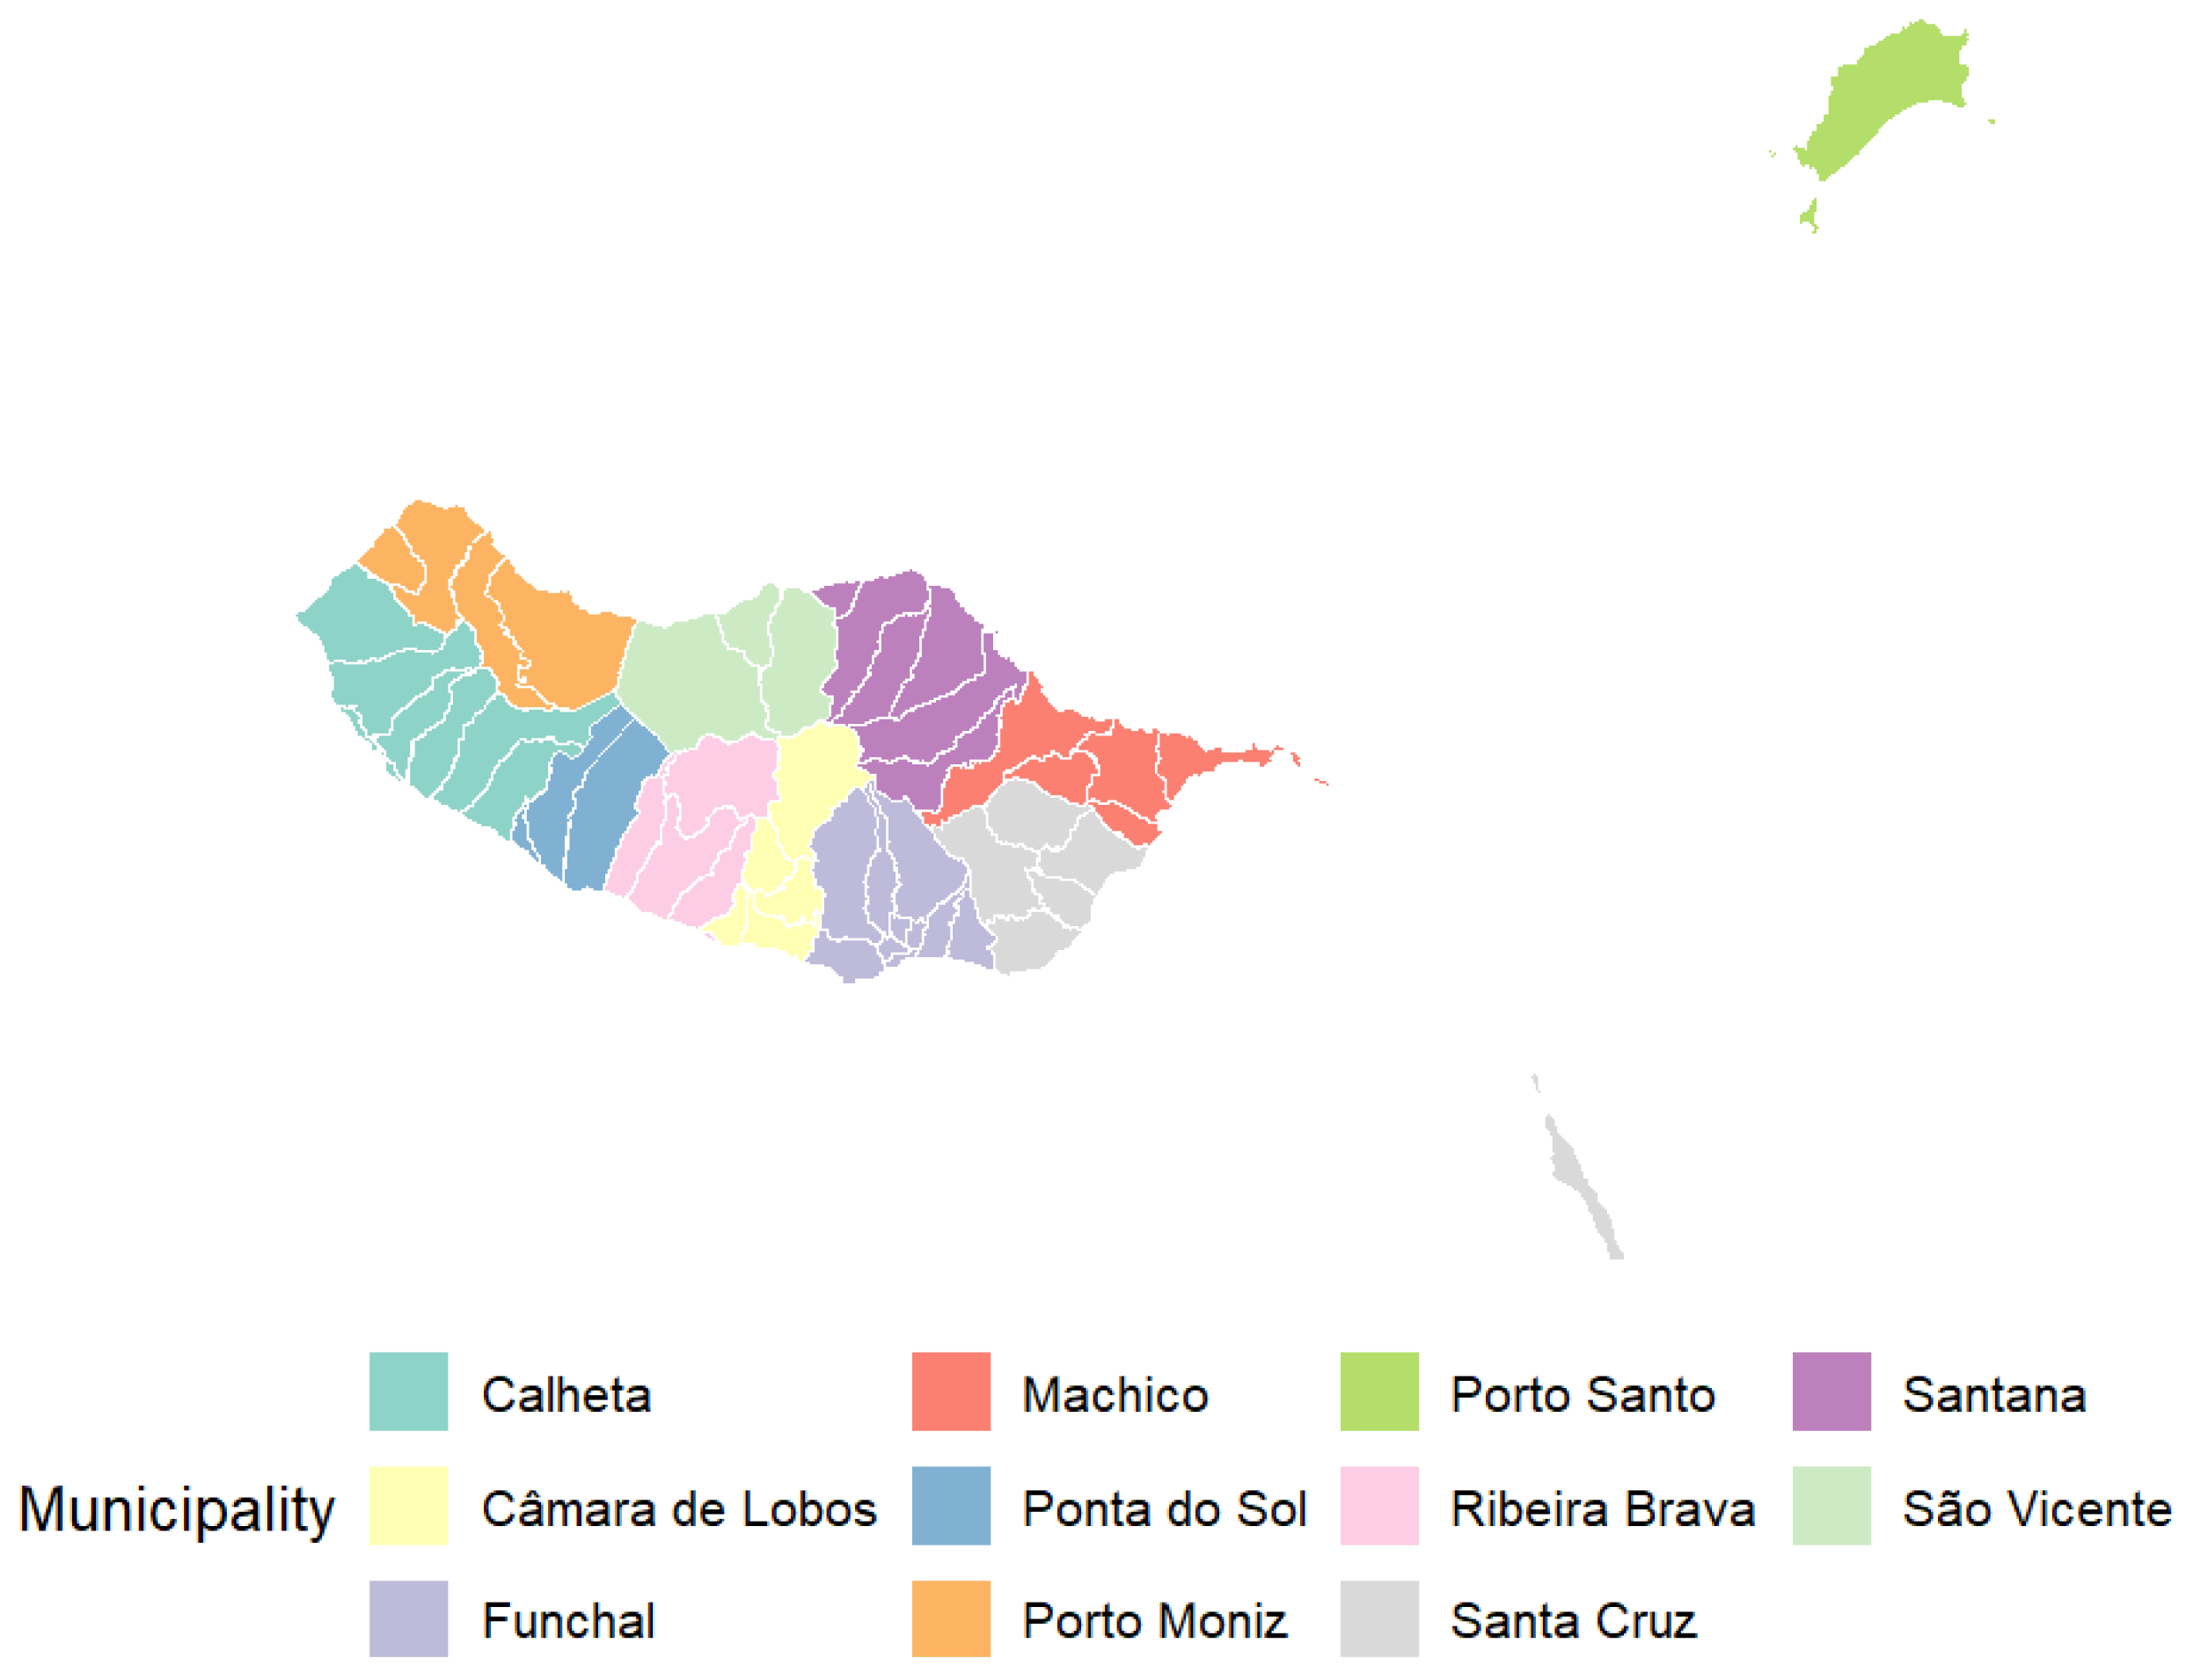
Descriptive statistics for the 54 parishes of Madeira (Table A2, Appendix A) reveal substantial heterogeneity in agricultural structure, see Figure 3 below.
Figure 3.
Administrative Division of Freguesias in the Madeira Archipelago. This figure was created by the authors.
The average number of farms per parish is 250.63 (median 175.00; SD 225.06), with a mean UAA of 85.27 ha (median 59.27 ha; SD 72.08). Family labour averages 0.68 AWU per farm (SD 0.64), and agricultural land represents 9.82% of parish territory (median 6.89%; SD 8.01%). Crop areas are unevenly distributed, with mean values of 4.82 ha for potatoes, 13.37 ha for vegetables, 19.93 ha for subtropical fruits, 13.31 ha for vineyards, 9.57 ha for permanent pastures, and 2.41 ha for family gardens. At the municipal level (Table A3, Appendix A), disparities persist. The share of agricultural land ranges from 19.5% in Câmara de Lobos to 2.8% in Porto Moniz, while average UAA per parish varies from 35.78 ha in Funchal to 212.85 ha in Porto Santo. Family labour remains low overall, peaking in Ponta do Sol (1.25 AWU per farm) and reaching a minimum in Porto Moniz (0.238 AWU per farm).
Derived indicators (Table A4, Appendix A) show a mean UAA per holding of 0.38 ha, labour density of 0.86 persons per 100 ha, and an average Shannon Diversity Index of 1.36 (range 0.19–1.88), indicating moderate levels of agricultural diversification.
4.2. Patterns of Agricultural Structure and Specialization
The analysis of Pearson correlations [26,30] revealed key relationships between land size, labour intensity, and productive specialisation in RAM. As shown in Table 2.
Table 2.
Correlation matrix of agricultural variables.
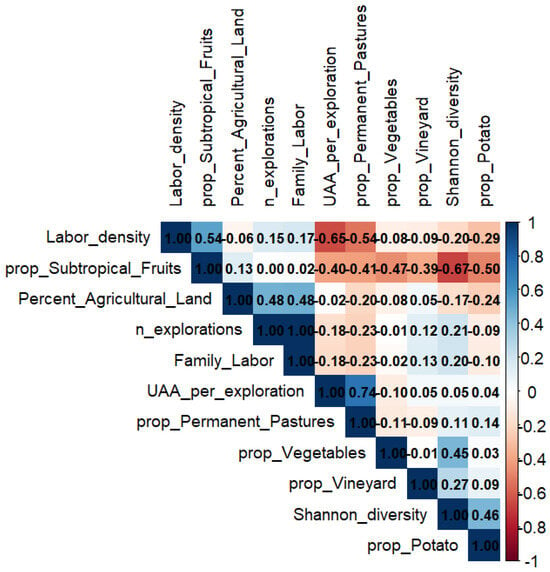
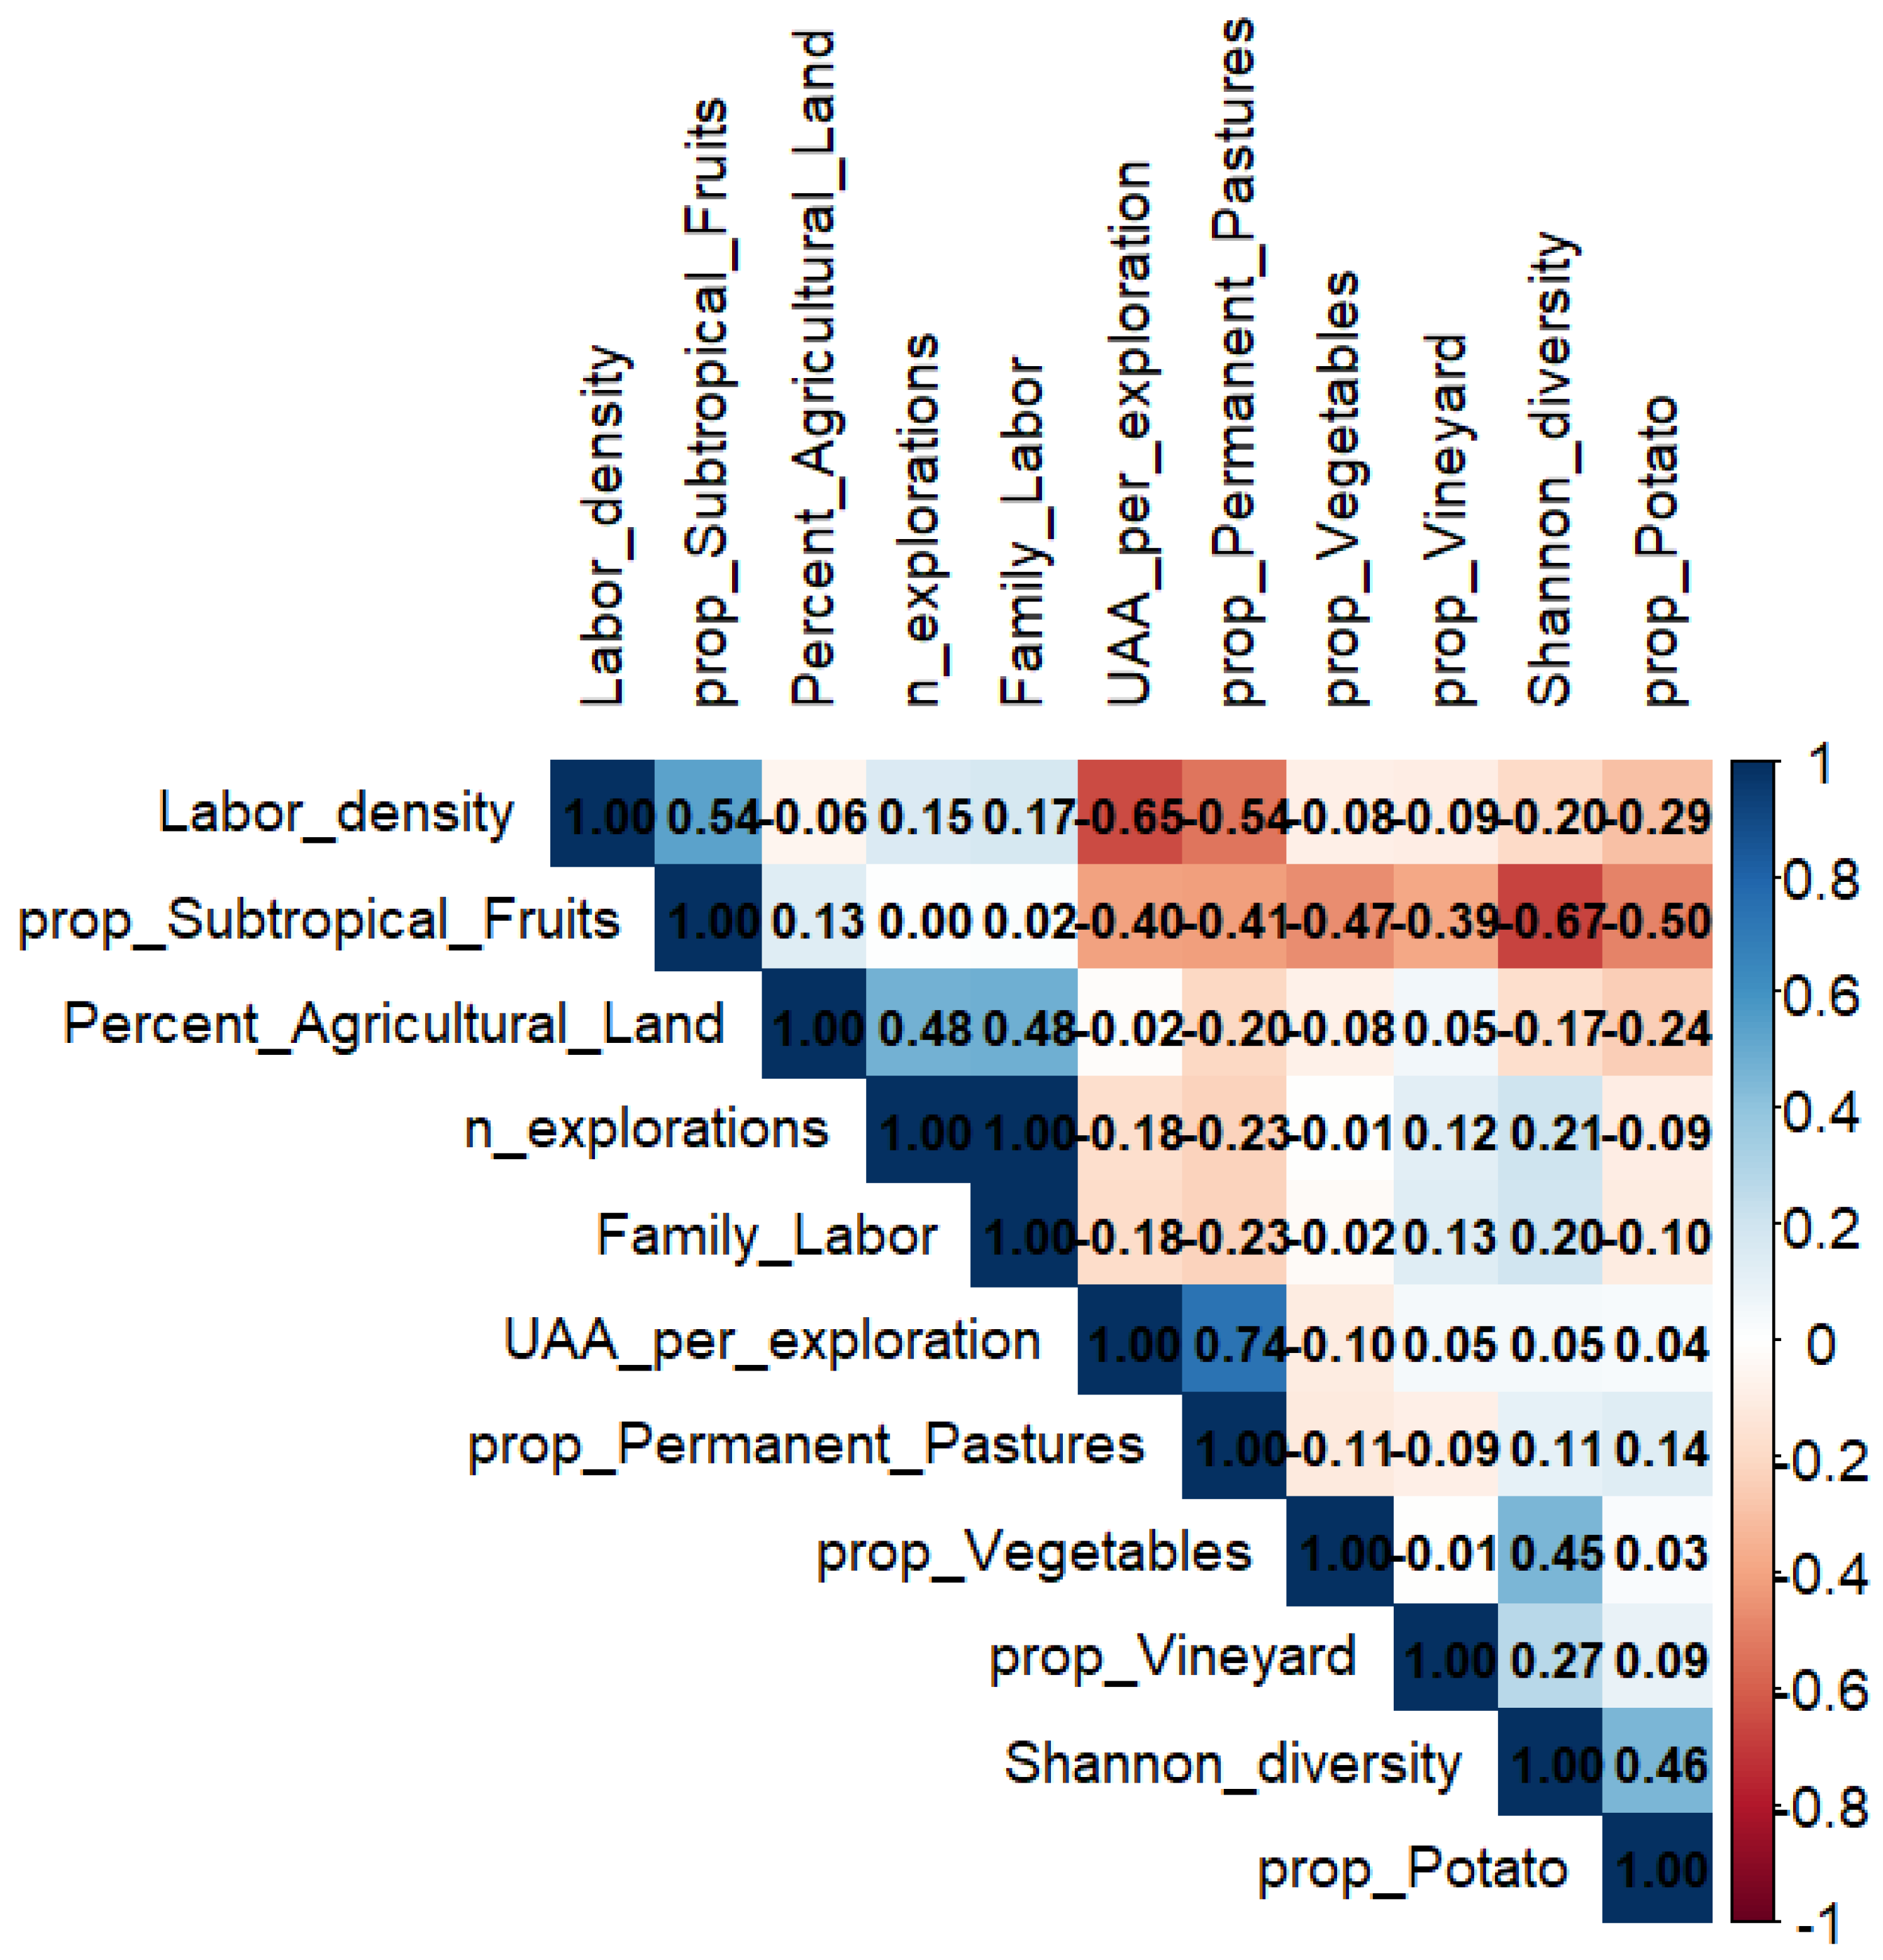
The results indicate a strong negative correlation between farm size and labour density (r = −0.653) and between subtropical fruit specialisation and agricultural diversity (r = −0.673), supporting H2 and H3. A near-perfect positive correlation between the number of farms and total family labour (r = 0.997) strongly supports H6 and reflects the census definition of family labour as a relatively fixed number of AWU per holding. Both variables are retained for descriptive completeness; however, multivariate analyses (PCA and PAM clustering) rely on standardised composite indicators and are robust to multicollinearity.
This correlation structure arises from the low variability of family labour per farm (mean ≈ 0.68 AWU), implying that total family labour is largely proportional to the number of holdings (Family labour ≈ number of farms × 0.68 AWU). These patterns characterise Madeira’s highly fragmented agrarian structure, with an average farm size of 0.38 ha and 77.2% of holdings classified as very small, sustained by intensive family labour, which represents 85.5% of the agricultural workforce [21].
Given the robustness of PCA and PAM clustering to multicollinearity [14], the observed correlations reflect substantive structural features rather than methodological artefacts. Figure 4 presents the updated correlation matrix of the agricultural variables.
Figure 4.
Correlation matrix of agricultural variables. This figure was created by the authors.
4.3. Dimensionality Reduction and Cluster Identification
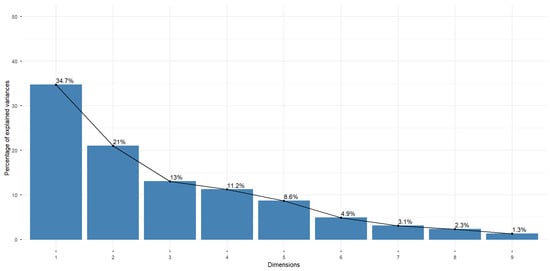
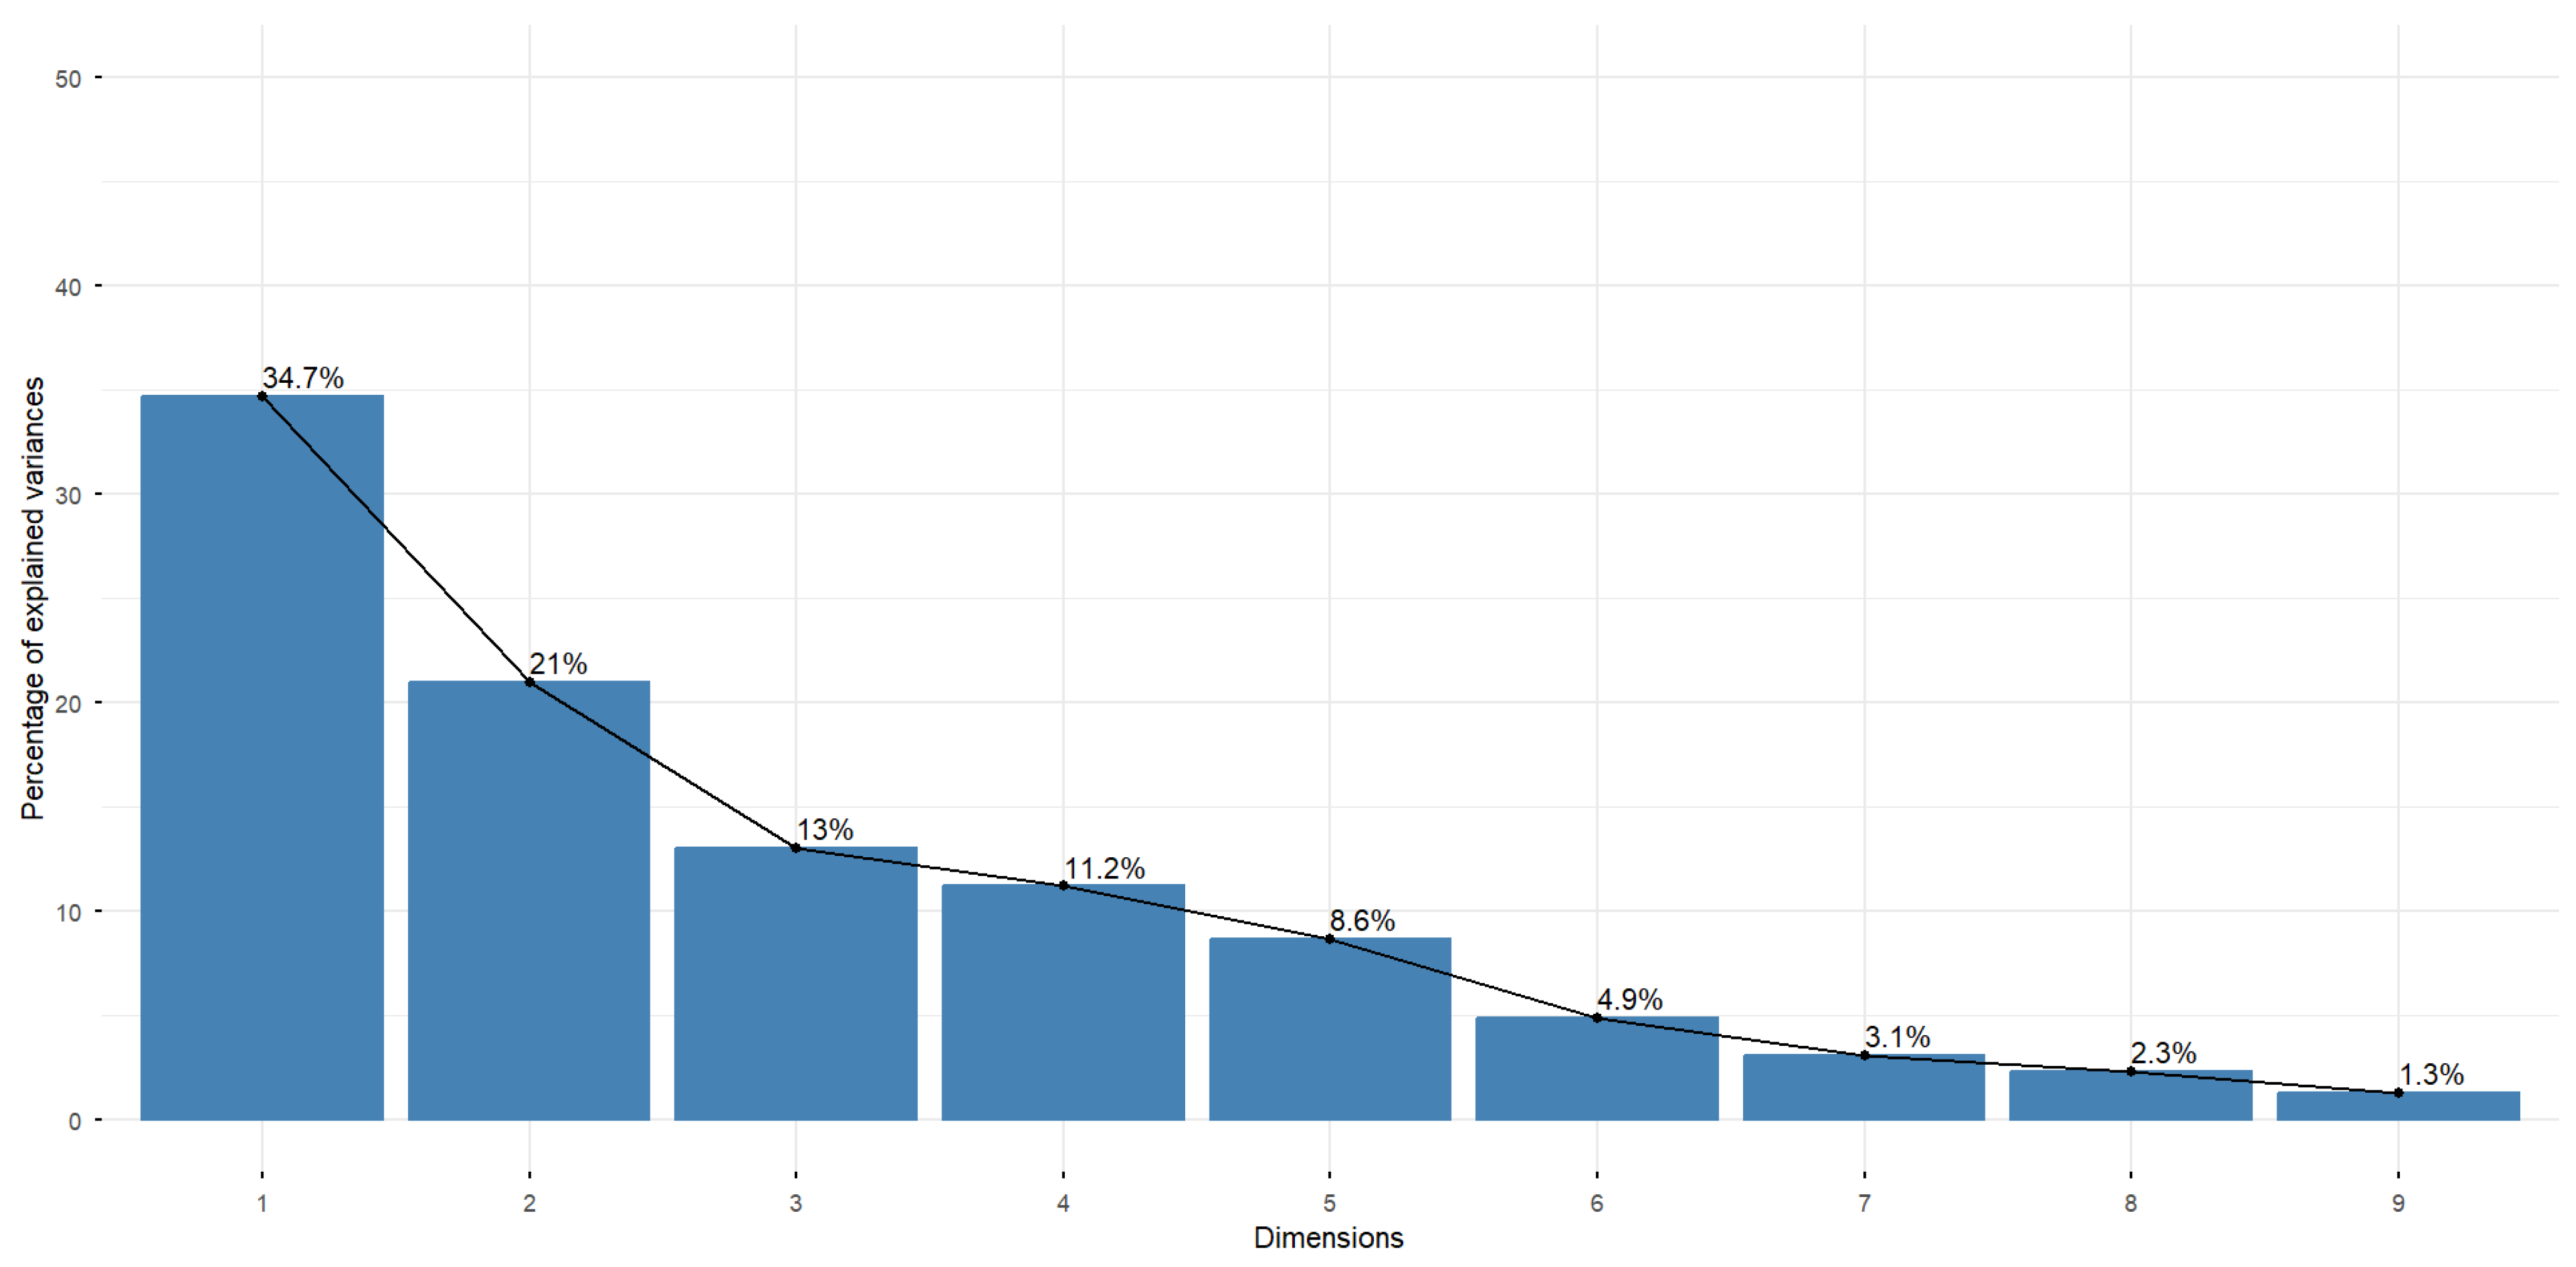
PCA was used to reduce dimensionality and identify key patterns in the agricultural structure [13,46]. The first three components explained 68.68% of the total variance (PC1 = 34.71%, PC2 = 20.95%, PC3 = 13.02%; see Table S1 in the Supplementary Materials for eigenvalues and cumulative variance), providing a robust foundation for subsequent cluster analysis (Figure 5, below) and capturing meaningful variation in land size, labour intensity, and crop specialisation.
Figure 5.
Variance explained by principal components. This figure was created by the authors.
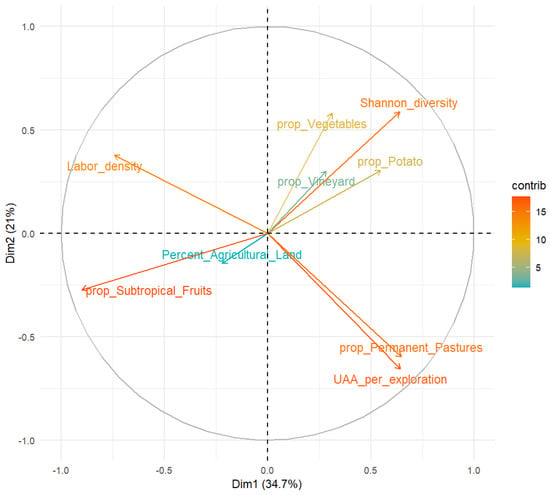
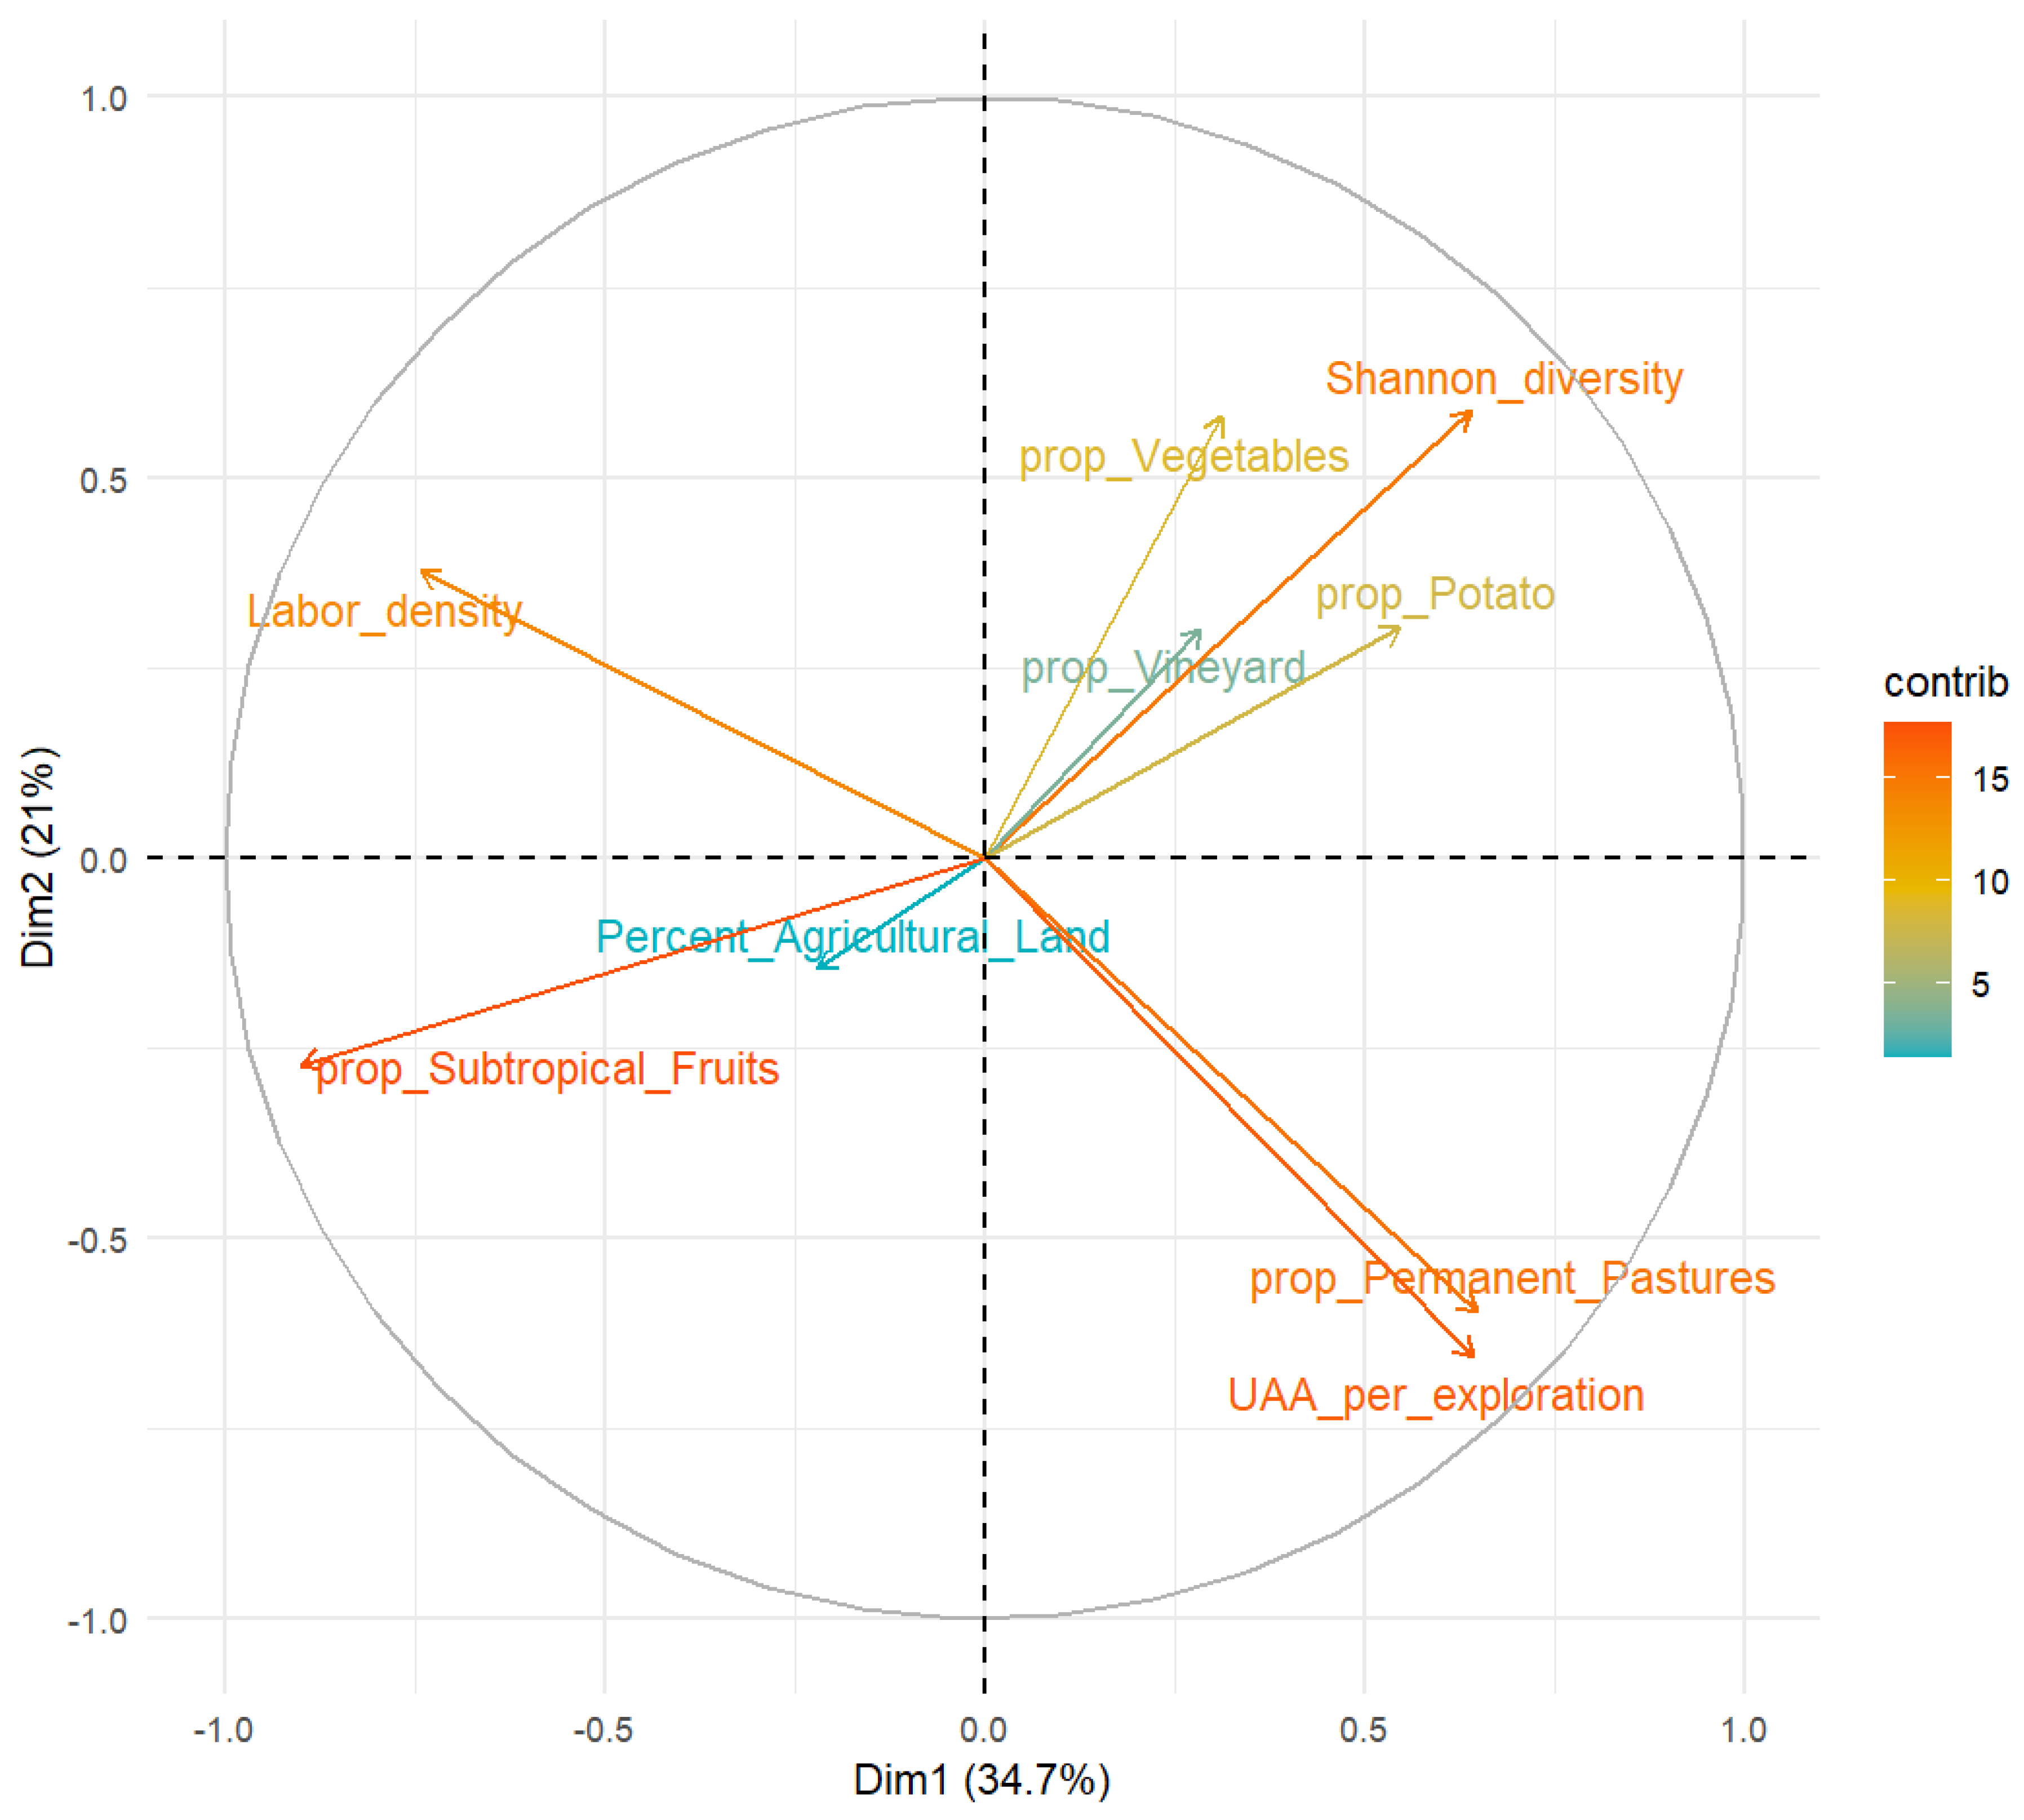
Loadings of the first three principal components (Table S2) reveal distinct sources of structural variation. PC1 is dominated by subtropical fruit specialisation (−0.900) and labour density (−0.741), with secondary contributions from permanent pastures, farm size, and agricultural diversity. PC2 contrasts diversified systems, reflected by the Shannon Diversity Index (0.588) and vegetables (0.580), with extensive pasture-based systems, indicated by negative loadings for permanent pastures (−0.597) and UAA per farm (−0.654). PC3 captures land-use structure, driven by agricultural land share (0.804) and vineyards (0.569), reflecting the intensity and type of land occupation.
These components quantitatively corroborate trends reported by [21]: PC1 aligns with the 12.3% expansion of subtropical fruits and the dominance of family labour (85.5% of the workforce); PC2 reflects the decline of arable land to 31.2% of UAA alongside the expansion of permanent pastures to 13.5%; and PC3 corresponds to the 623.3 ha of vineyards and spatial variation in land-use intensity. The PCA scatter plot (Figure 6) shows the distribution of parishes in the reduced component space, highlighting distinct agricultural profiles and supporting cluster identification.
Figure 6.
PCA-agricultural variables. This figure was created by the authors.
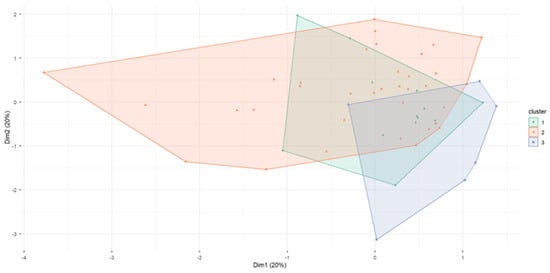
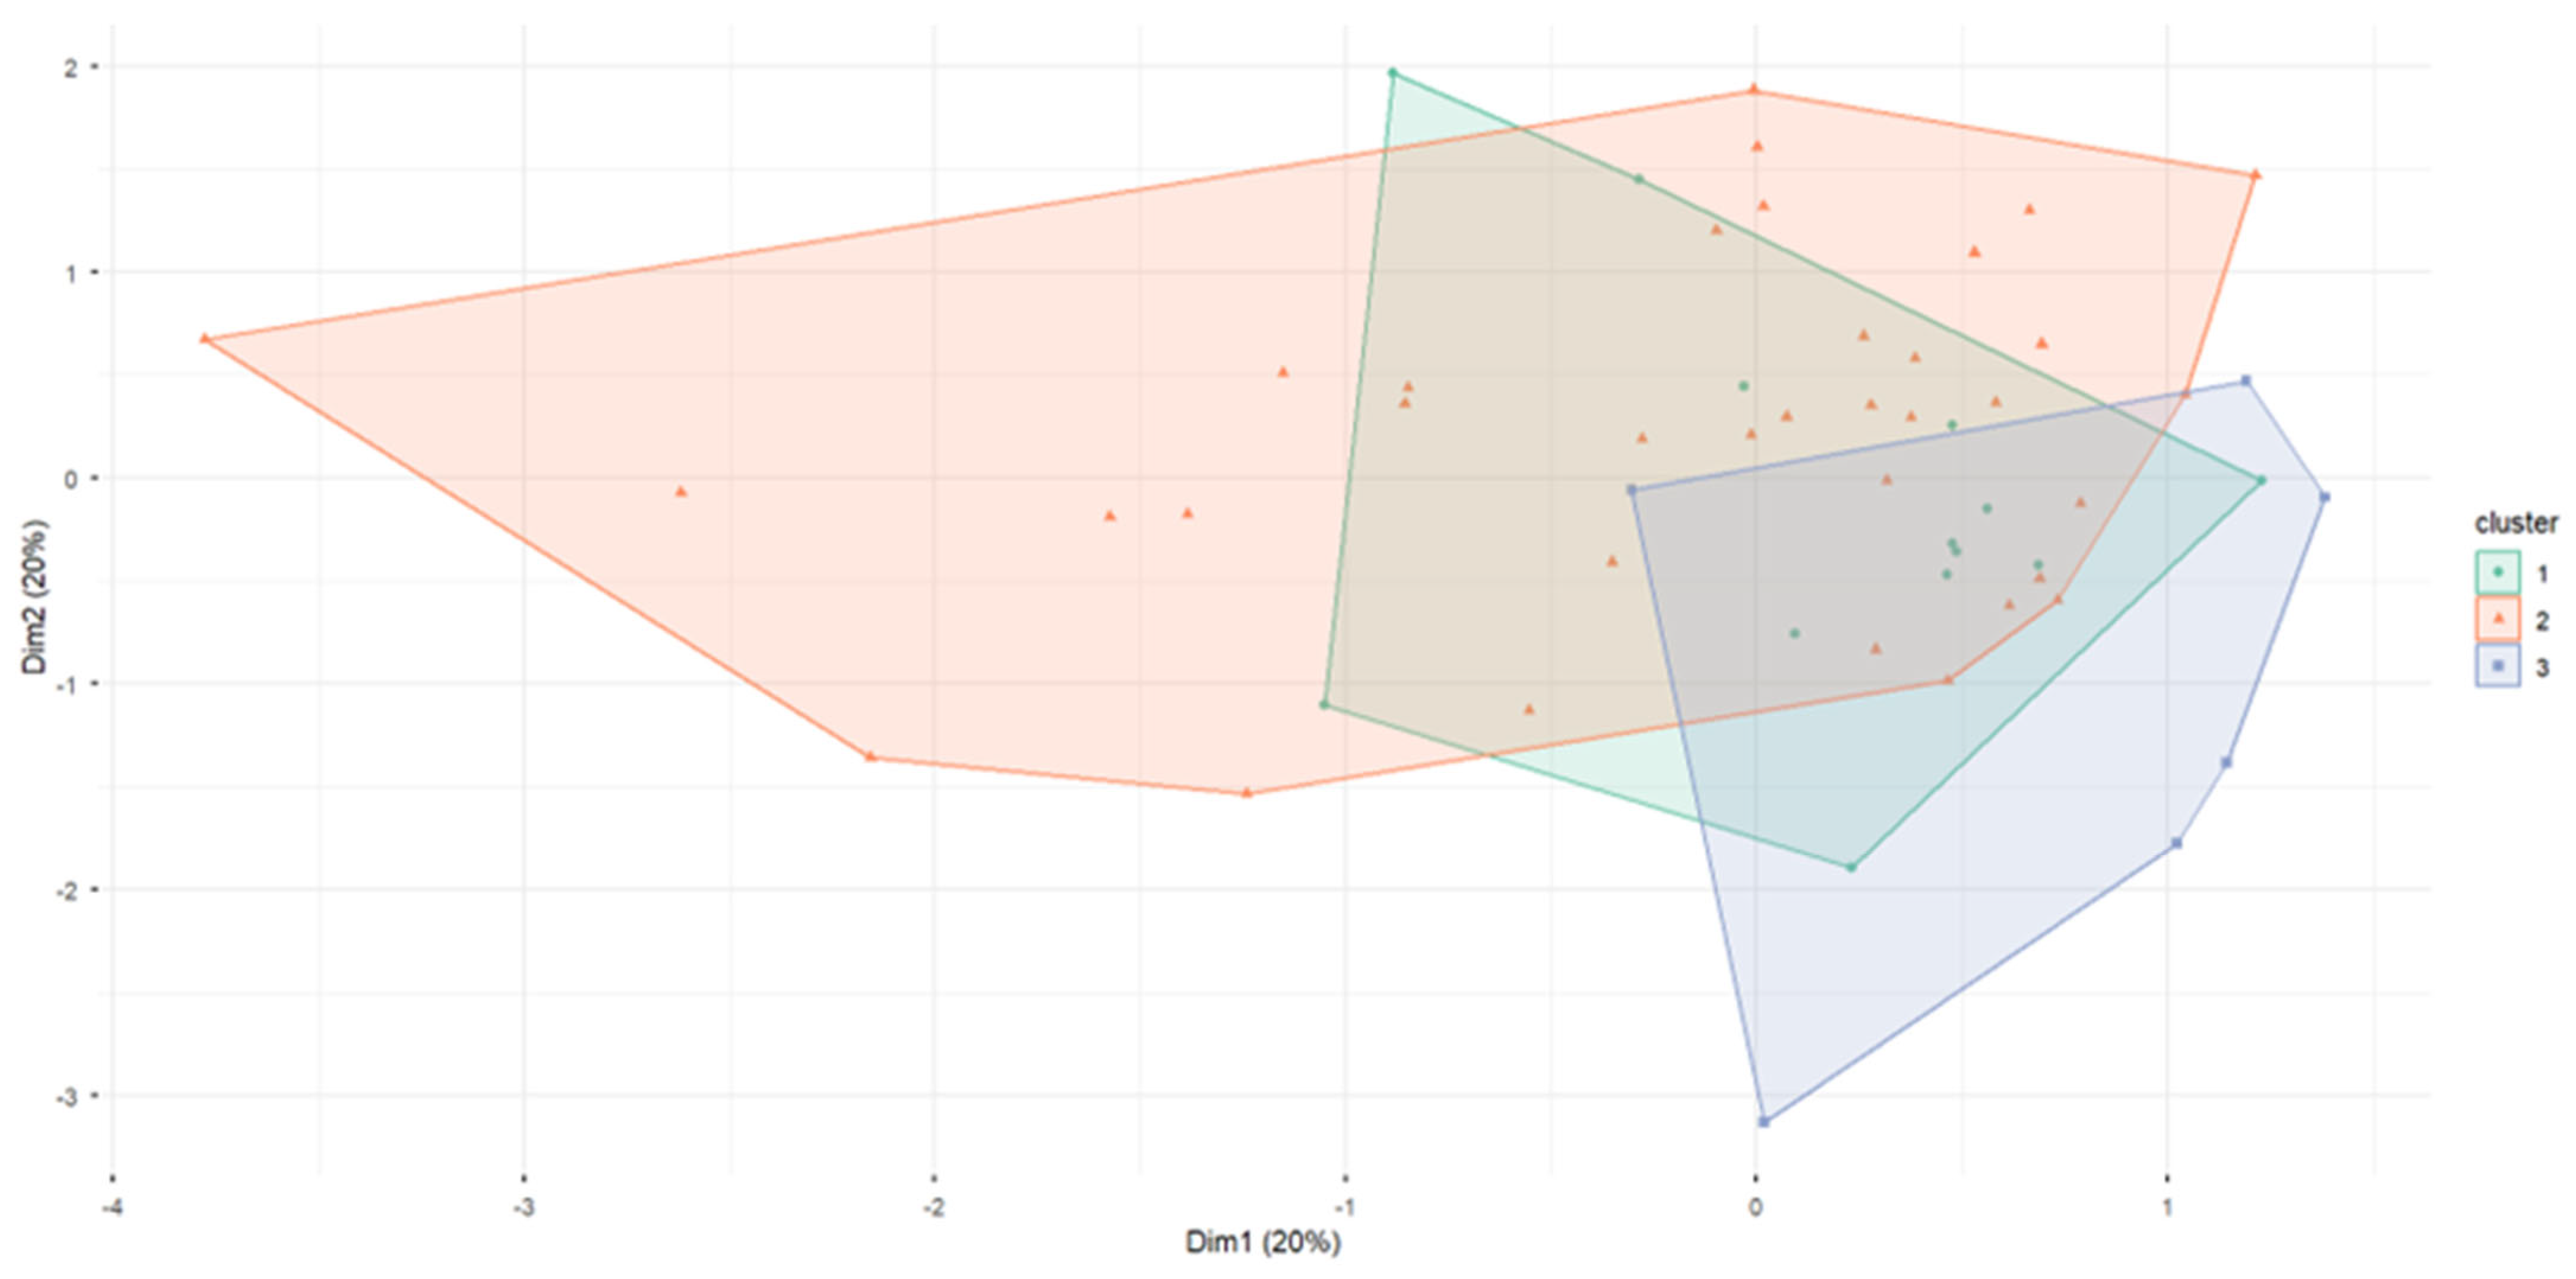
For clustering, K-means and PAM were evaluated for k = 2–6 using multiple internal validation metrics, including silhouette scores, Dunn index, connectivity, and cluster balance (Tables S3 and S4). Following internal validation criteria [47], PAM with k = 3 was selected because it achieved a higher silhouette score (0.286, compared with 0.272 for k = 2) and superior cluster separation (Dunn index 0.180 vs. 0.142), despite moderate imbalance (Balance Index 0.171). This choice is further supported by NbClust results [45], which identifies k = 3 as optimal for 8 of 23 indices. Statistical tests confirm significant differences across clusters for key agricultural variables. The resulting solution identifies three distinct agricultural systems with clear territorial patterns across parishes (Table S5 and Figure 7).
Figure 7.
Cluster of parishes—PAM. This figure was created by the authors.
Table 3 summarises cluster-level characteristics, including the number of parishes, average UAA, labour density, Shannon Diversity Index, and land-use proportions. Cluster 1 is dominated by subtropical fruits, with relatively low diversity and high labour density. Cluster 2 exhibits higher diversity, a predominance of arable crops, and moderate labour density. Cluster 3 comprises larger farms, with an average holding size of 0.86 hectares, and lower labour intensity.
Table 3.
Cluster-level agricultural characteristics: UAA, crop proportions, and labour density.
Table 3 identifies three agricultural clusters in Madeira. Cluster 1—Intensive Subtropical Agriculture (13 parishes; 24.1%) is characterised by very small farms (0.25 ha), high labour density (1.11 persons/100 ha), low diversity (Shannon 0.94), and strong specialisation in subtropical fruits (72.2%). Cluster 2—Extensive Traditional Agriculture (35 parishes; 64.8%) shows moderate farm size (0.35 ha), lower labour intensity (0.85 persons/100 ha), higher diversity (1.52), and predominance of arable land (41.7%). Cluster 3—Pasture-based Agriculture (6 parishes; 11.1%) comprises the largest farms (0.86 ha), the lowest labour density (0.38 persons/100 ha), and a high share of permanent pastures (48.6%).
Table S6 confirms clear spatial segregation and strong contrasts in crop composition among clusters. The profiles align with regional statistics [21]: Cluster 1 reflects the 12.3% expansion of subtropical fruits supported by intensive family labour (85.5% of the workforce); Cluster 3 corresponds to the growth of permanent pastures (13.5% of UAA); and Cluster 2 mirrors the decline of arable land to 31.2% of UAA. Overall, the results confirm three spatially distinct agricultural models, supporting H1 and H5.
4.4. Territorial Specialisation Patterns
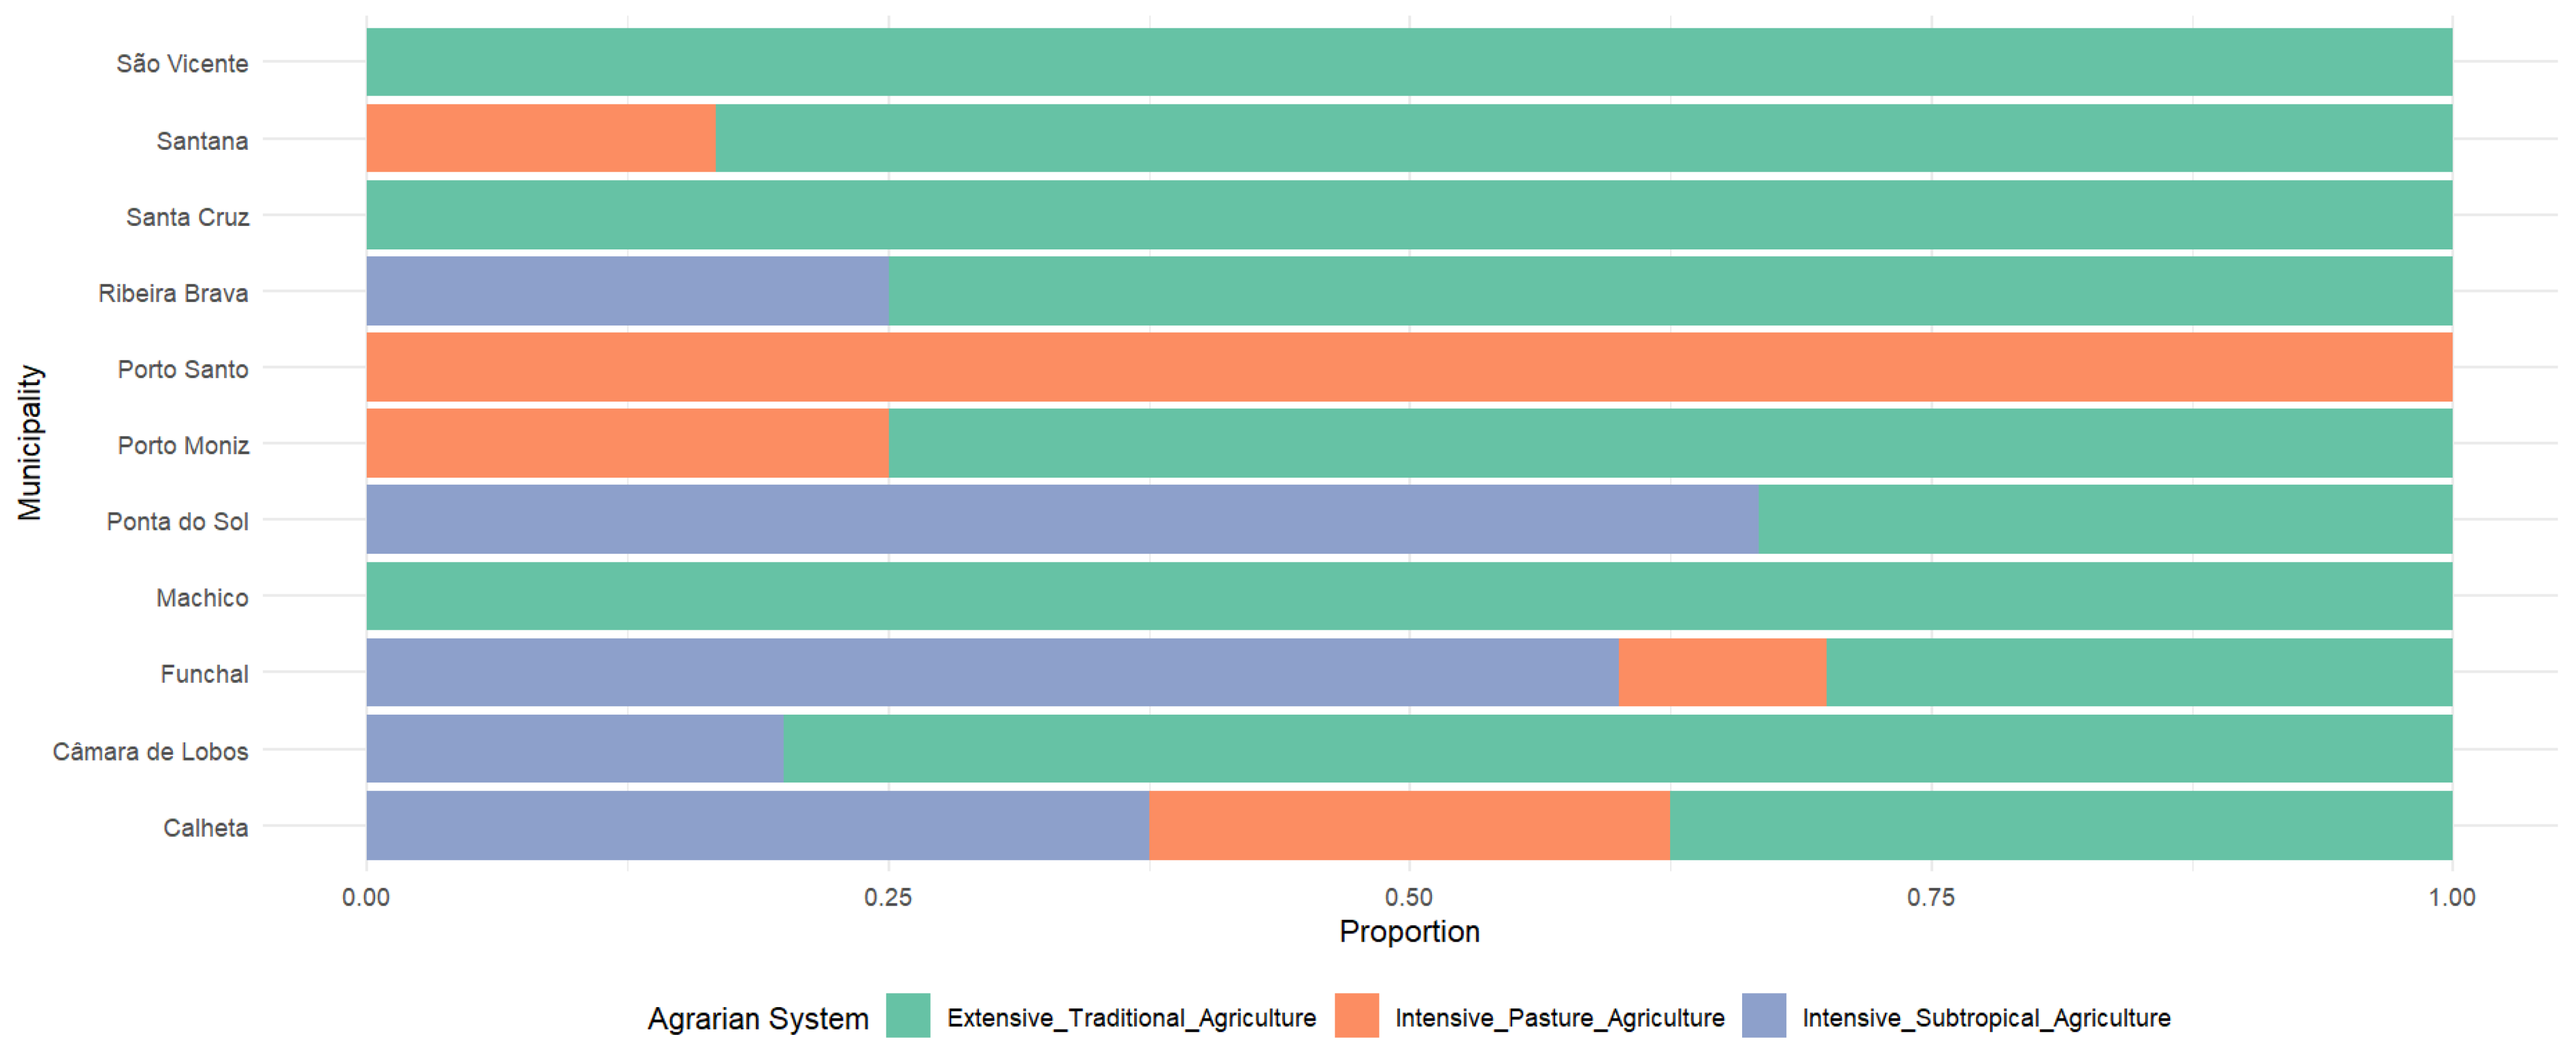
Table 4 shows clear territorial specialisation across Madeira’s municipalities, supporting H4. Extensive Traditional Agriculture dominates in Machico, Santa Cruz, Santana, and São Vicente (80–100% of parishes), reflecting a diversified set of small-scale systems. Intensive Subtropical Agriculture is concentrated in Funchal (60%) and Ponta do Sol (66.7%), consistent with recent structural expansion trends [21]. Pasture-based Agriculture dominates Porto Santo (100%) and is present in Porto Moniz (25%), Calheta (25%), and Santana (16.7%), aligning with the growth of permanent pastures (13.5% of UAA). Porto Moniz and Calheta exhibit mixed systems, indicating local coexistence of crop- and pasture-based models. Overall, the results confirm a spatially segmented agrarian landscape characterised by the coexistence of traditional, intensive crop, and pasture-based systems.
Table 4.
Municipality-level distribution of agricultural cluster types.
Moreover, Table 4 further supports the spatial differentiation of agrarian systems by linking structural characteristics with territorial distribution. The observed variation across clusters reflects differing levels of exposure to geographic, economic, and environmental conditions, reinforcing the interpretation of distinct agrarian regimes within the island.
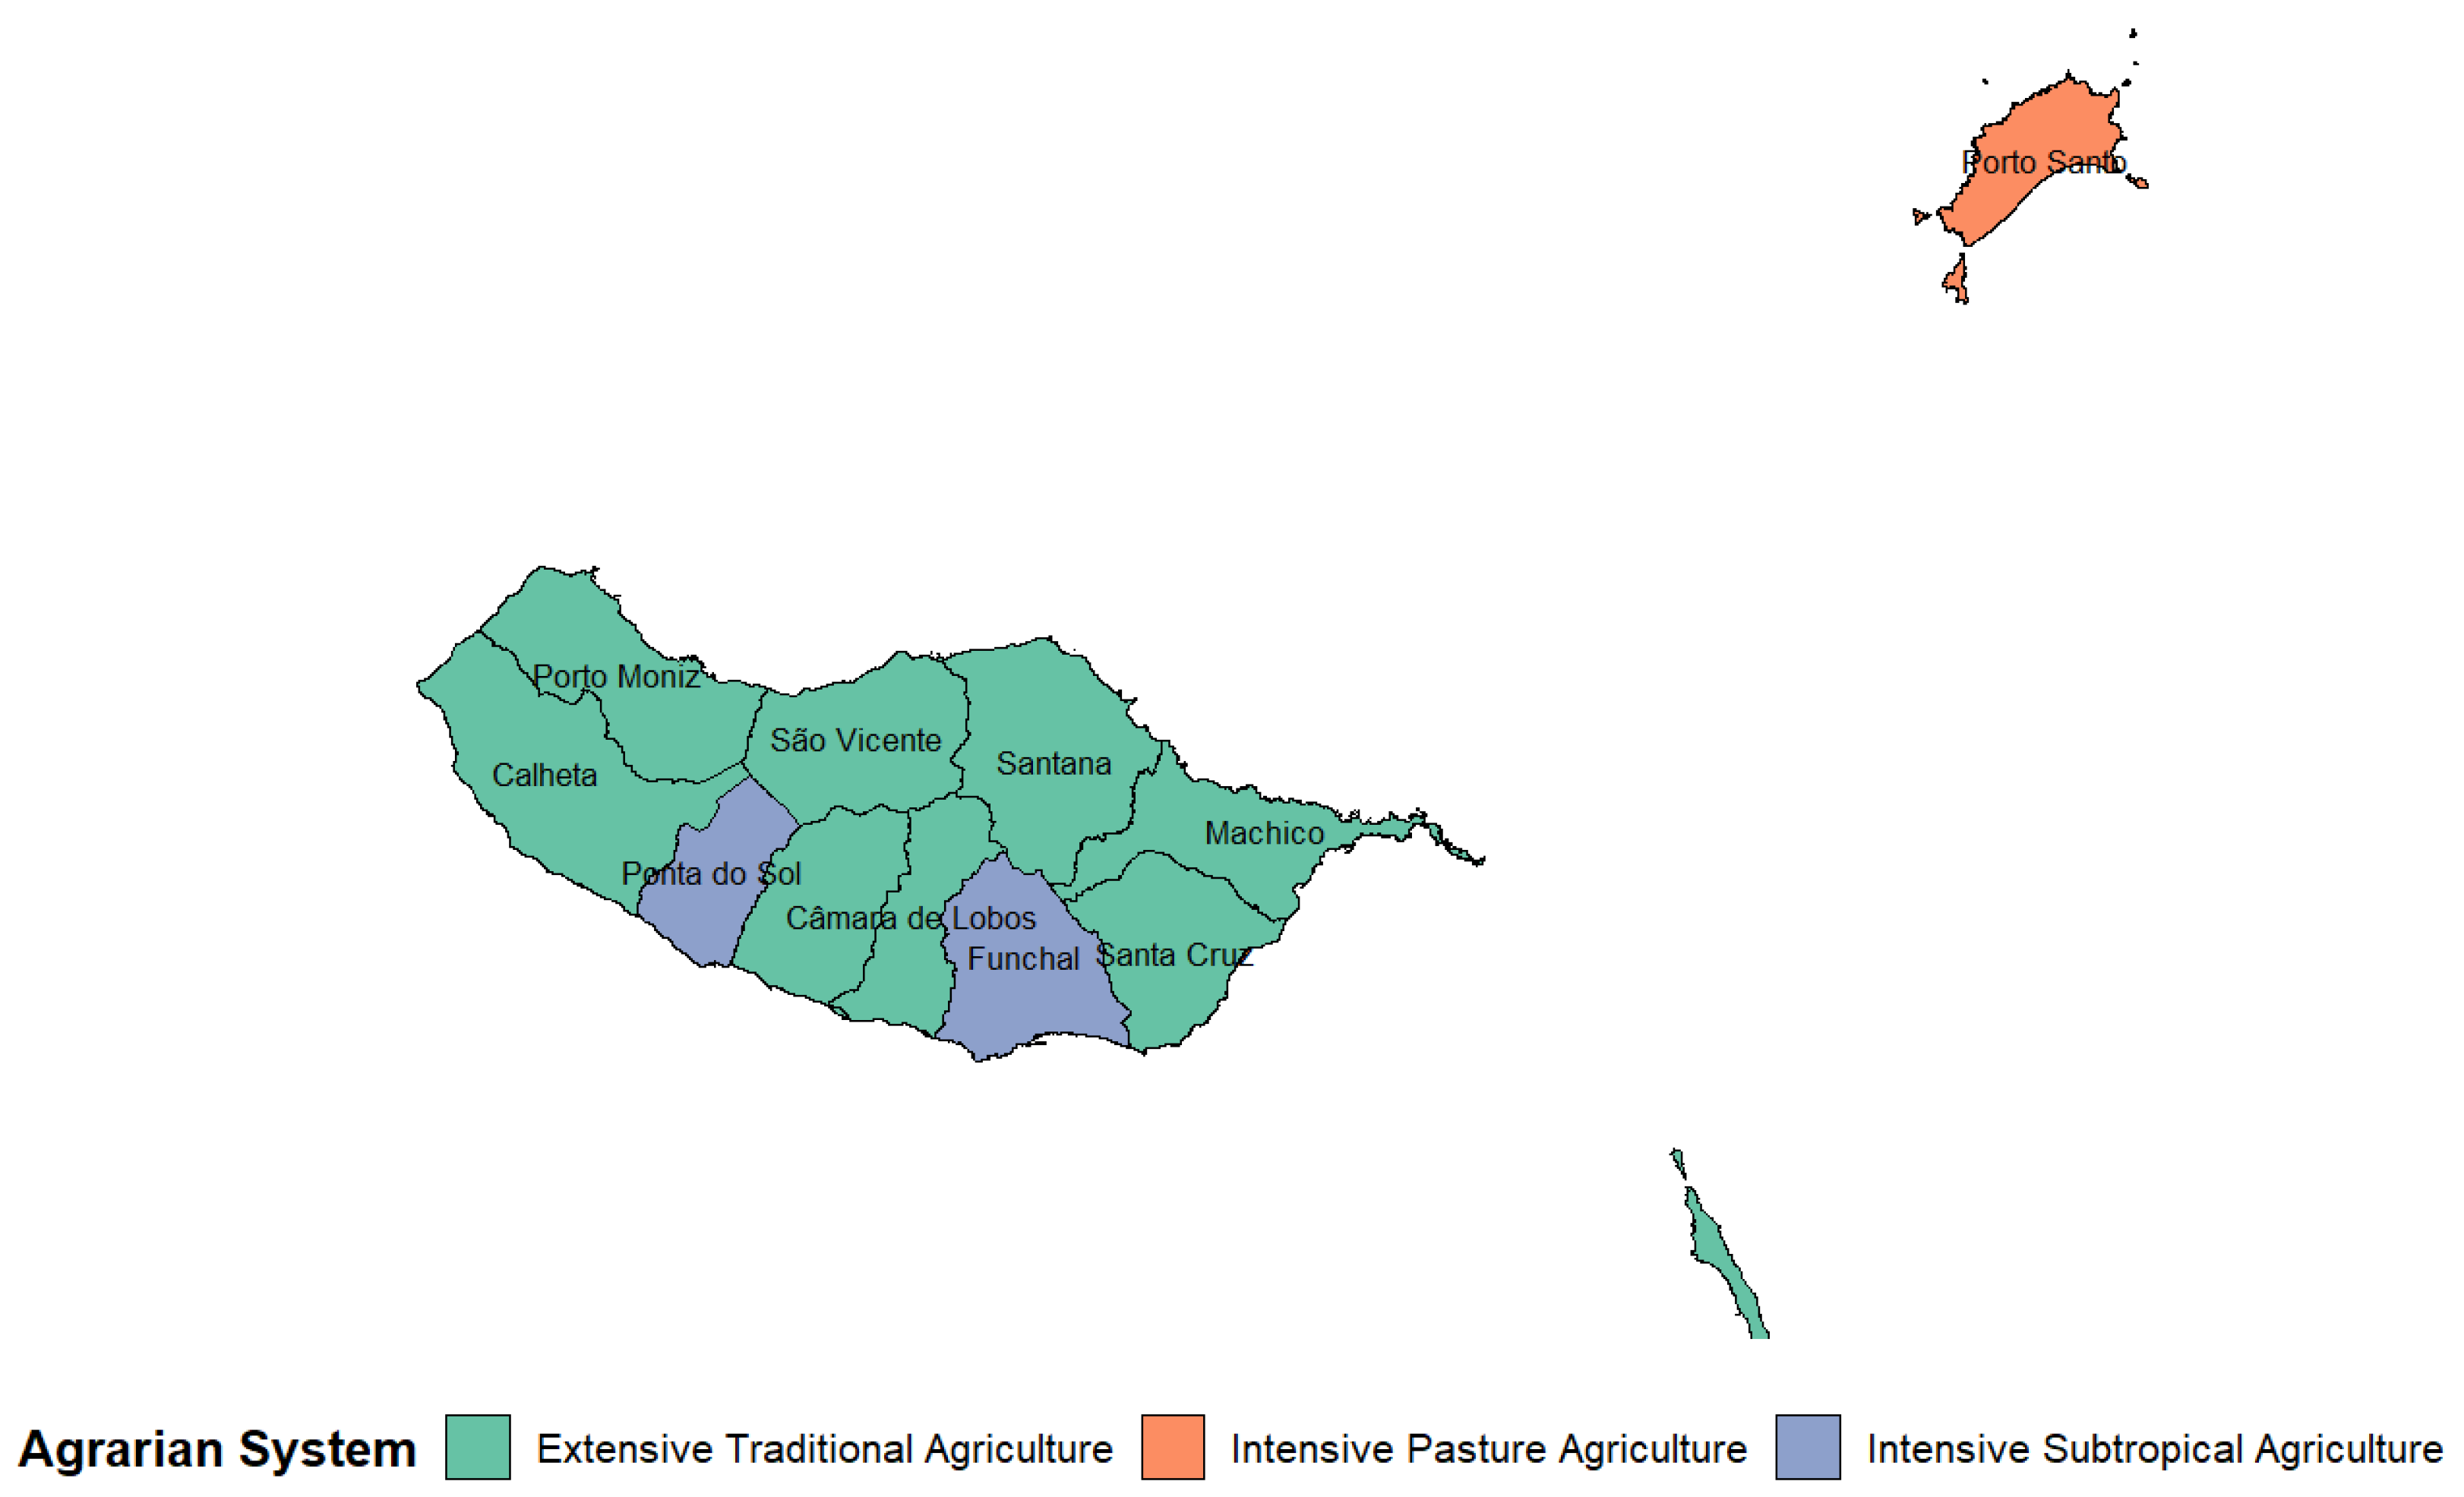
Figure 8 presents the spatial distribution of the identified agrarian systems across the Madeira archipelago. Although the analysis is conducted at the parish level, the spatial representation is aggregated at the municipality level by assigning the dominant agrarian system within each municipality. The results reveal a clear territorial differentiation, with intensive subtropical systems concentrated in southern coastal areas, traditional mixed systems predominating in interior and northern municipalities, and pasture-based systems occupying more marginal and less densely cultivated regions.
Figure 8.
Spatial distribution of agrarian systems in the Madeira archipelago based on parish-level PCA–PAM clustering, aggregated at the municipality level (2019 Agricultural Census). This figure was created by the authors.
The spatial distribution of agrarian systems (Figure 9) confirms a clear coastal–interior differentiation. Global Moran’s I for dominant cluster assignment (I = 0.412; p < 0.01) indicates significant positive spatial autocorrelation, with similar agricultural systems clustering geographically. Intensive Subtropical Agriculture concentrates along the southern coast, while Extensive Traditional Agriculture dominates the northern and interior areas. This spatial segregation reflects agro-ecological conditions, infrastructure, and historical land-use patterns, underscoring the need for place-based policies that explicitly account for spatial dependence rather than treating parishes as independent units.
Figure 9.
Distribution of agrarian systems by municipality. This figure was created by the authors.
Table S7 reports the predominant crops by cluster, clarifying patterns of agricultural specialisation. Cluster 1 is fully specialised in subtropical fruits (100% of parishes), reflecting the 12.3% sector expansion and intensification of permanent crops [21]. Cluster 2 exhibits a diversified structure dominated by clean arable land (74.3%), with vineyards (14.3%) and subtropical fruits (11.4%), consistent with the decline of arable land to 31.2% of UAA. Cluster 3 is pasture-oriented, with 66.7% of parishes dominated by permanent pastures, aligning with their growth to 13.5% of UAA. These patterns translate aggregate statistics into distinct territorial agricultural models, supporting H3 and H4 on specialisation and spatial differentiation across Madeira’s parishes.
4.5. Model Validation and Robustness Check
To validate the clustering solution, a Random Forest model was applied using PAM-derived cluster assignments as training labels [15]. The dataset included 54 parishes and 11 variables, distributed across clusters (13, 35, and 6), corresponding to the optimal three-cluster solution identified through PAM balance diagnostics (Table S8).
The three-cluster solution proved robust across multiple criteria. The Random Forest achieved 92.85% accuracy in 10 × 5-fold cross-validation (95% CI: 80.41–100%) and a low out-of-bag (OOB) error of 4.55% (Table S9). Confusion matrices indicate minimal misclassification: two errors in the training set (Table S10) and 90% accuracy with Kappa = 0.75 in the test set, exceeding the No Information Rate (0.70) (Tables S11–S13). Outlier analysis identified six parishes (11.1%); their removal preserved 64.58% concordance in cluster assignments, indicating structural stability. Statistical tests confirmed significant differences across clusters for all key agricultural variables.
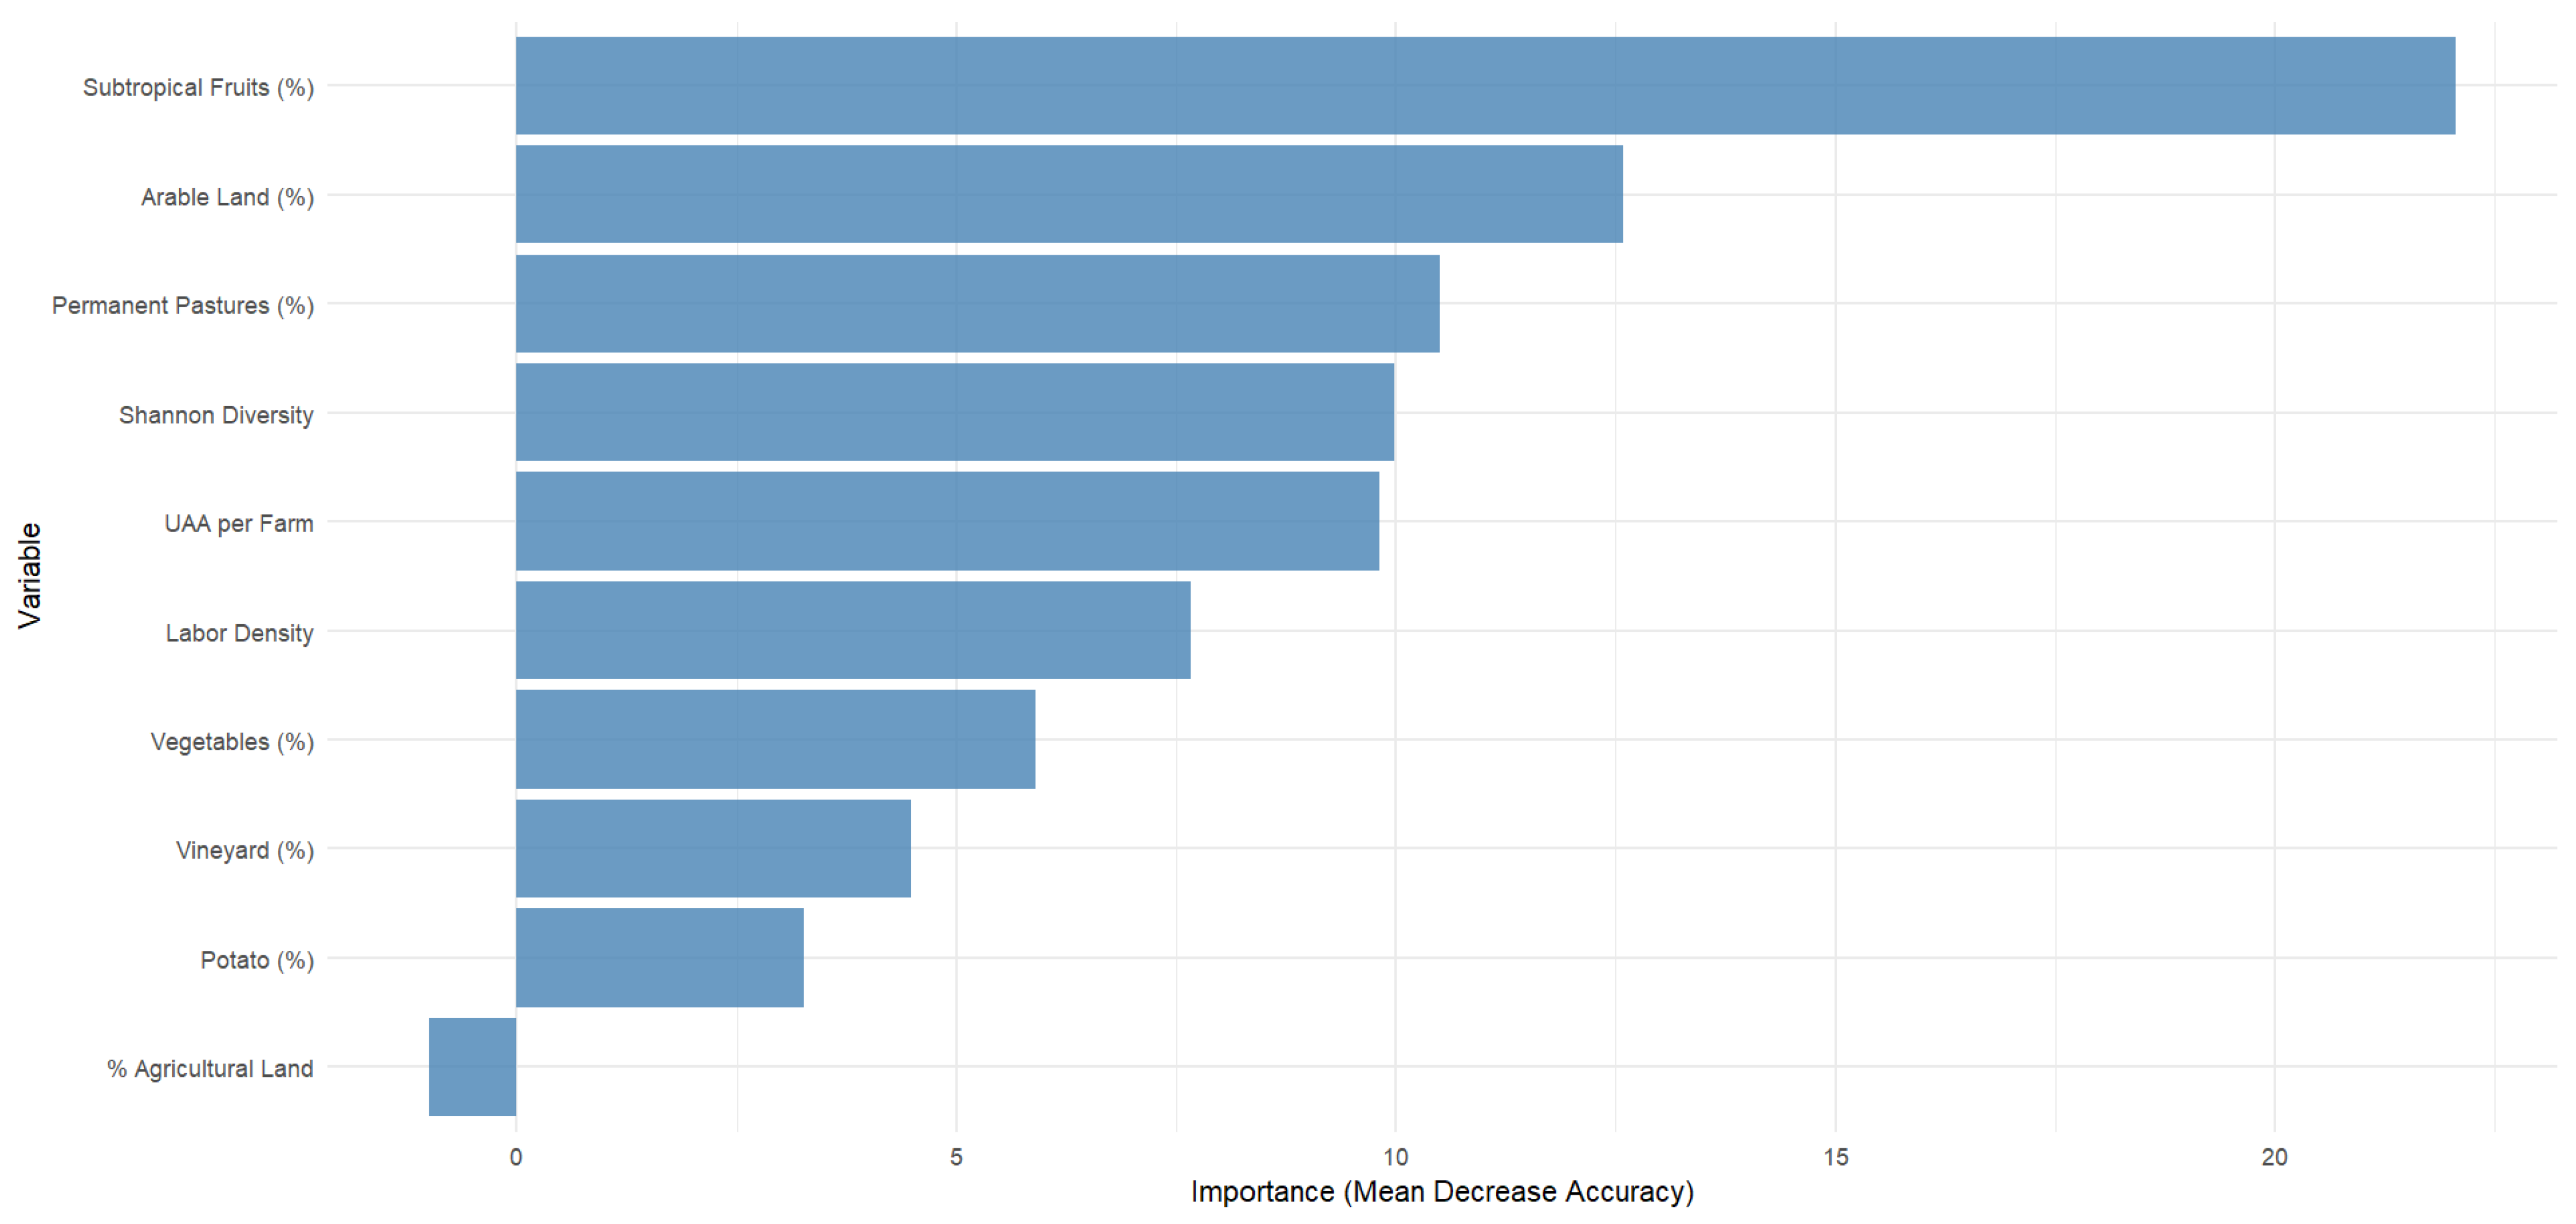
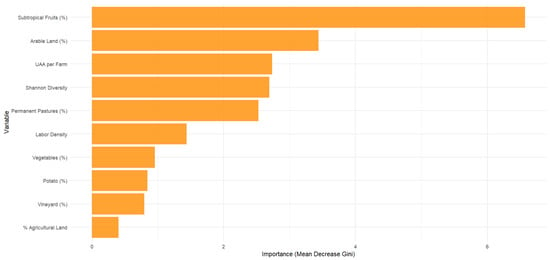
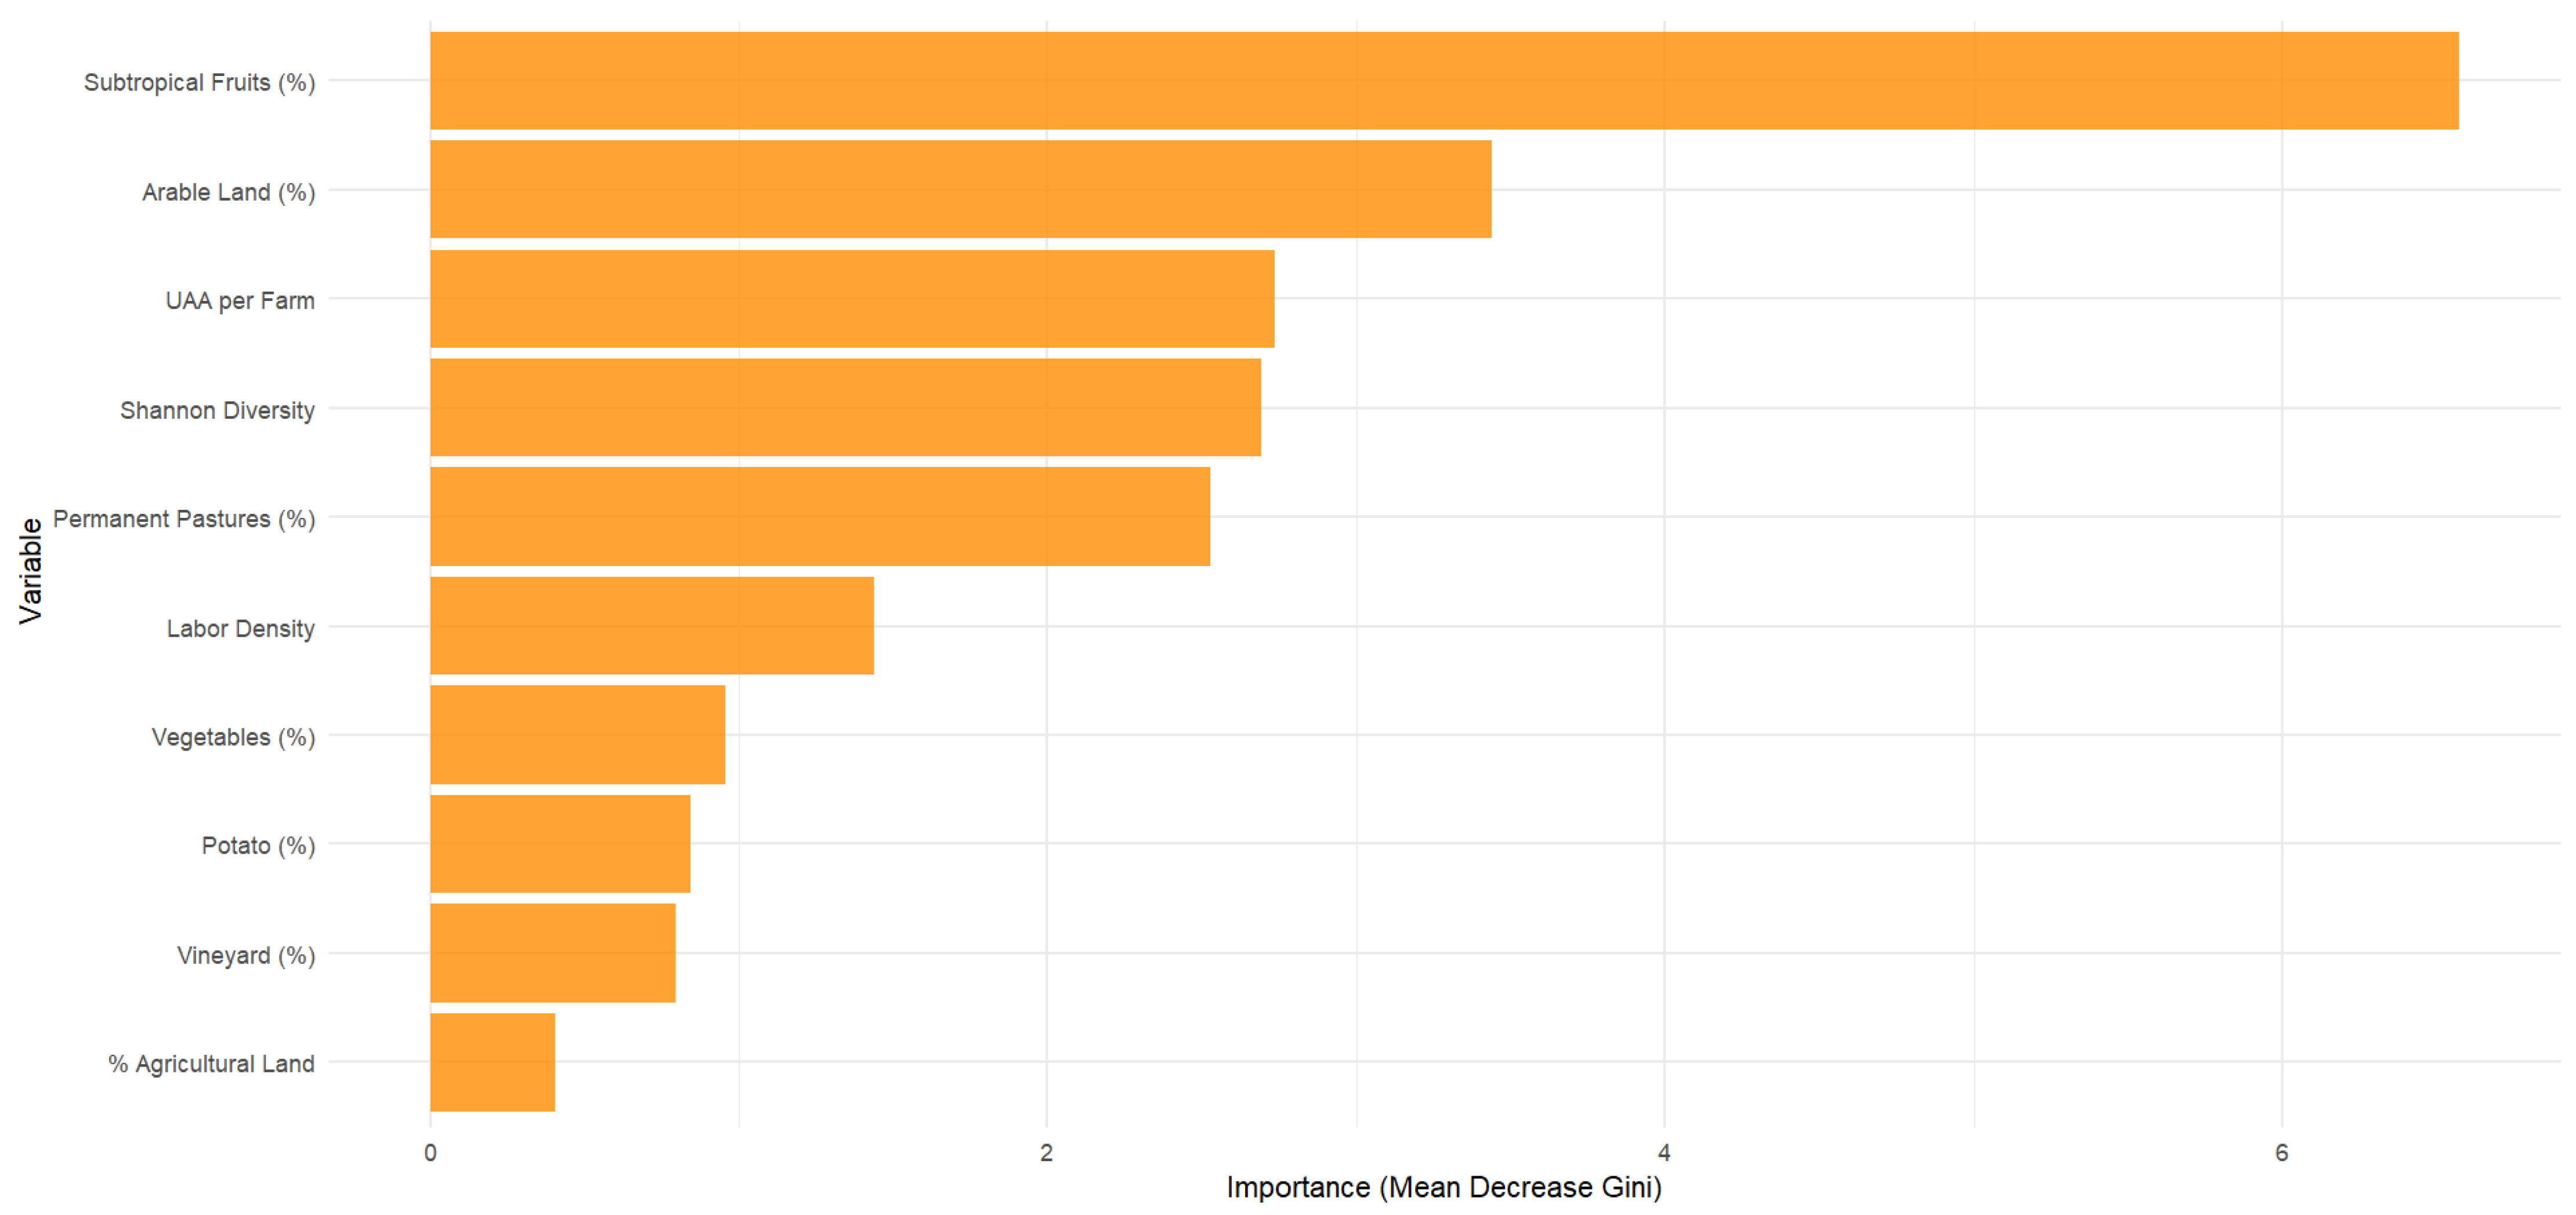
Variable importance results (Table S14) show that subtropical fruit area is the dominant predictor, followed by arable land and permanent pastures. The Shannon Diversity Index, average farm size, and labour density also contribute substantially, while potato area and total agricultural land have limited influence. Figure 10 and Figure 11 illustrate these patterns. Overall, the low error rates, high accuracy, stability to outliers, and coherent variable importance confirm that the identified clusters represent structurally meaningful agricultural typologies rather than methodological artefacts [15].
Figure 10.
Importance of variables in the discrimination of agrarian systems (Mean Decrease accuracy). This figure was created by the authors.
Figure 11.
Importance of variables in the discrimination of agrarian systems (Mean Decrease Gini). This figure was created by the authors.
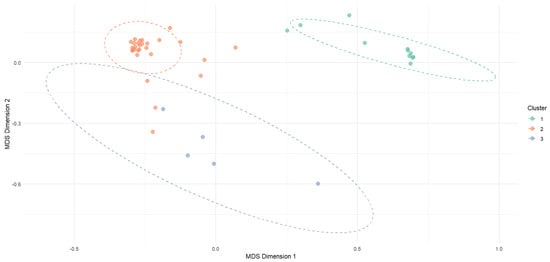
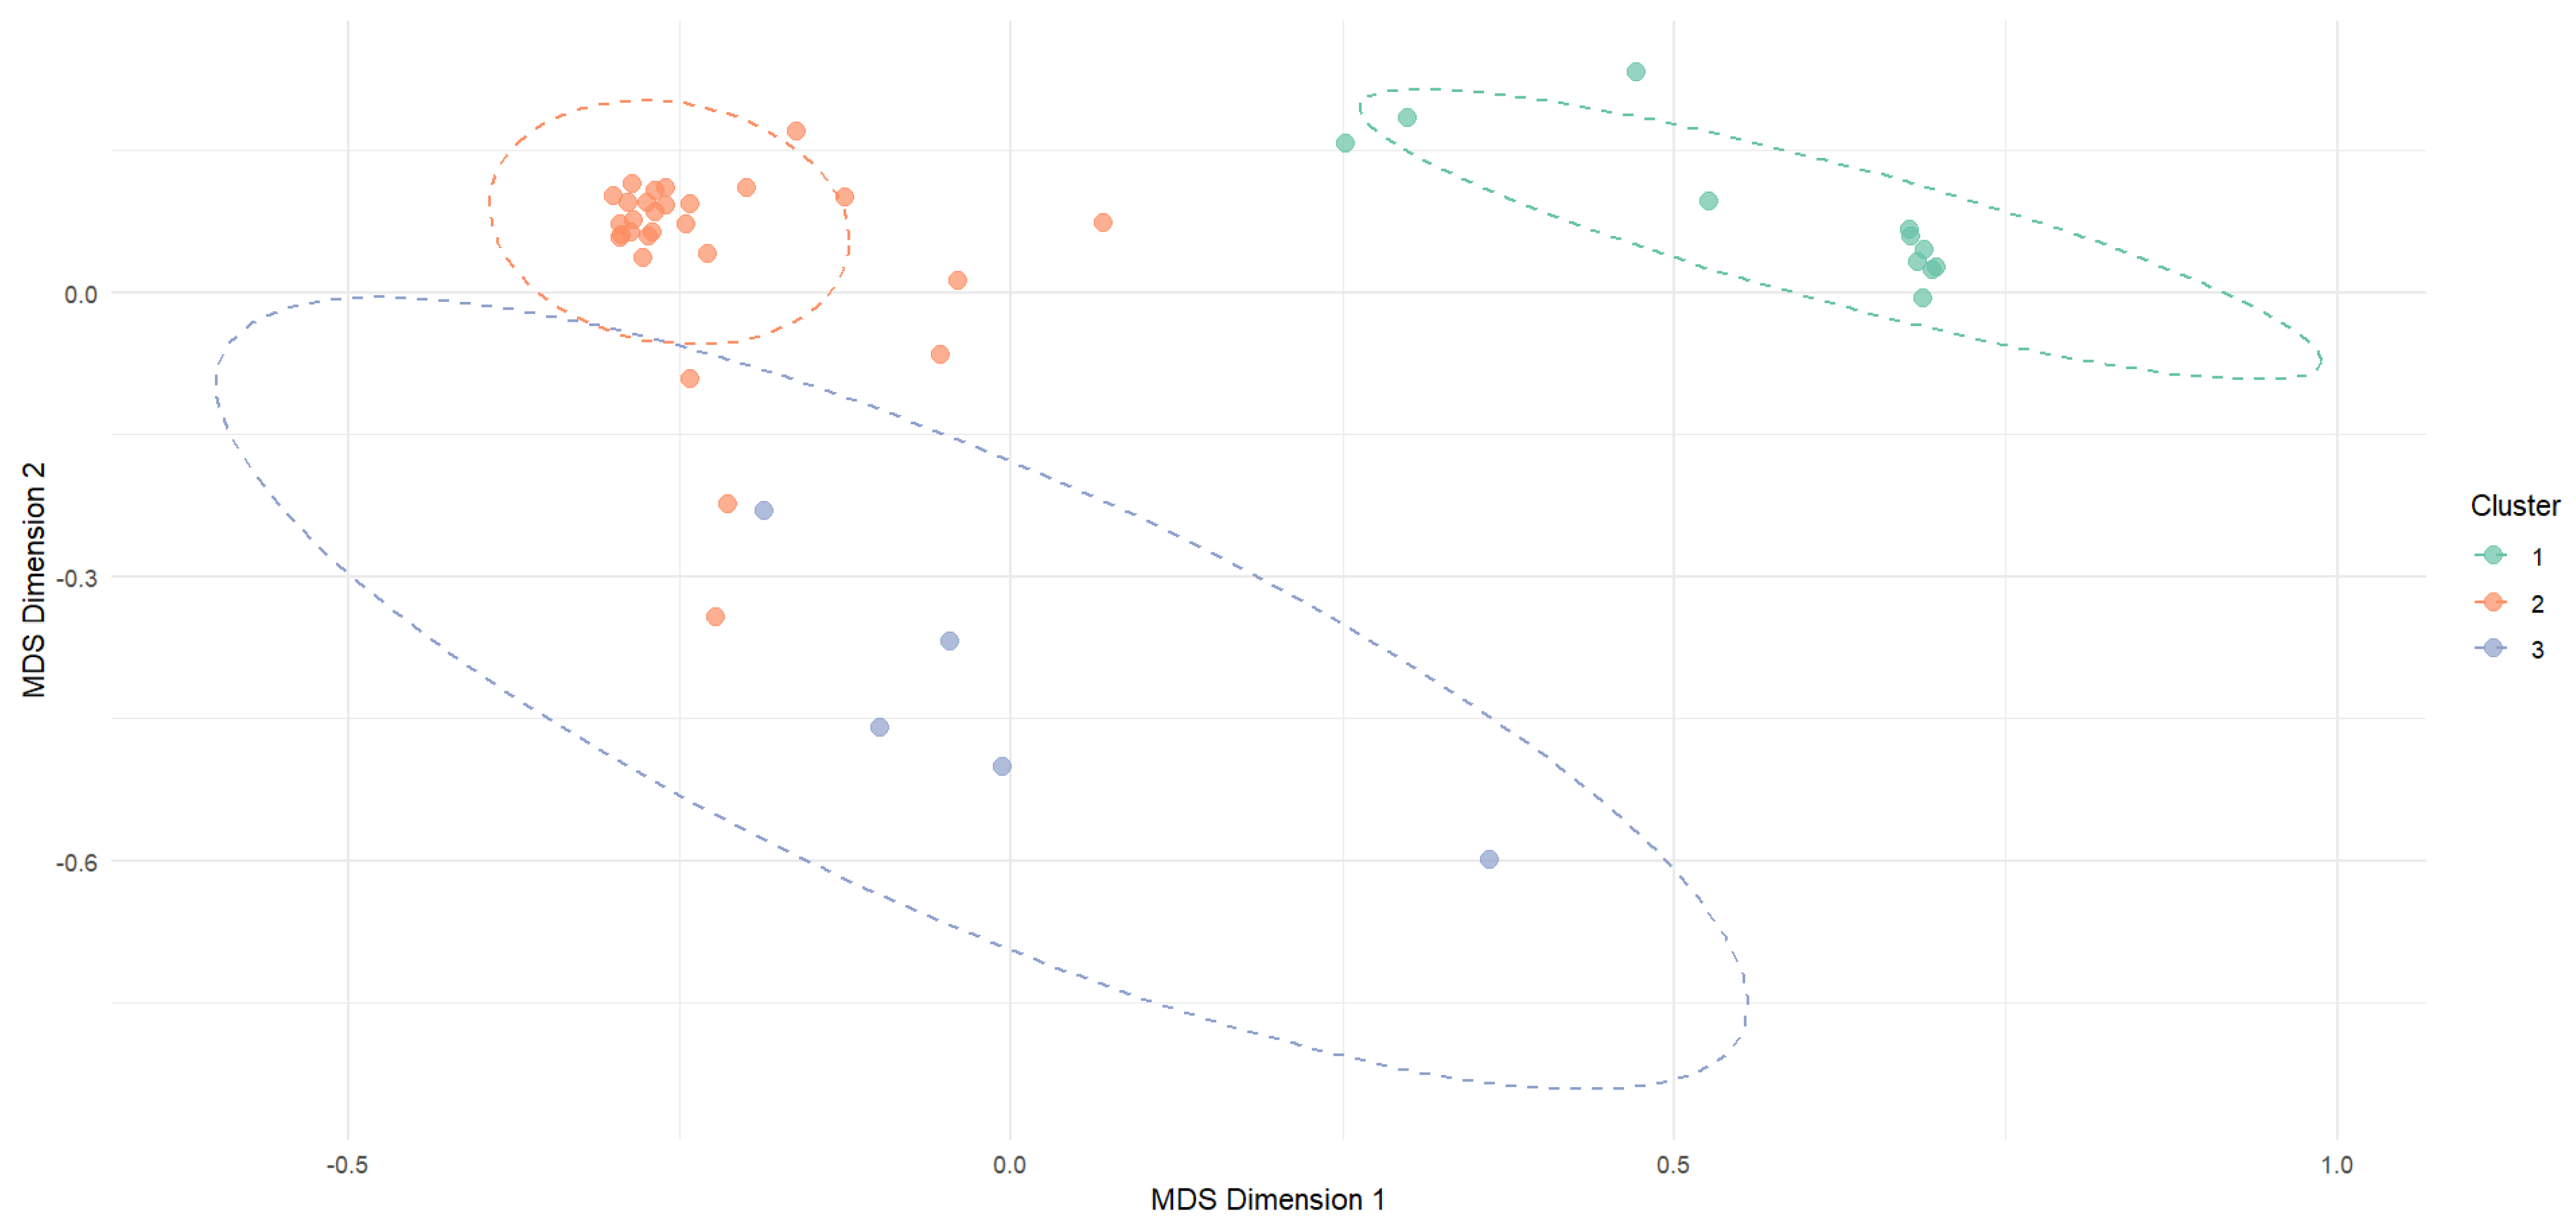
To examine cluster separability, a Multidimensional Scaling (MDS) plot based on the Random Forest proximity matrix was generated (Figure 12). The two-dimensional representation visualises parish similarity, enabling a direct assessment of cluster cohesion and distinctness.
Figure 12.
Proximity analysis between clusters—Random Forest MDS: based on the Random Forest proximity matrix. This figure was created by the authors.
The MDS plot identifies three agricultural clusters. Clusters 1 and 2 are clearly separated, indicating strong dissimilarity, whereas Cluster 3 is more dispersed, reflecting higher internal heterogeneity and a smaller sample size. These patterns indicate that the Random Forest model captures meaningful structural differences among clusters rather than random classification artefacts [15]. Five-fold cross-validation yielded an accuracy of 90.91% (SD = 11.13%). For the full dataset, overall accuracy reached 98.15% (95% CI: 90.11–99.95%), with a Kappa coefficient of 0.963. The full-sample confusion matrix is reported in Table S15, while cross-validation confusion matrices and class-level and cluster-level performance metrics are presented in Tables S16–S18.
Overall, the Random Forest analysis validates the clustering results, confirming that observed patterns of subtropical fruit specialisation and high labour density (Cluster 1), diversified arable systems (Cluster 2), and pasture-based structures (Cluster 3), reflect statistically robust agricultural typologies rather than clustering artefacts.
5. Discussion
This study provides a comprehensive, data-driven characterisation of Madeira’s agrarian structure, identifying three spatially and structurally distinct agricultural models. The results strongly support all proposed hypotheses and demonstrate that Madeira’s agricultural sector is undergoing a hybrid agrarian transition, reflected in the simultaneous coexistence of intensive subtropical systems, diversified traditional farming, and pasture-based structures. This configuration indicates non-linear, territorially embedded adaptation pathways. In this modernisation, the persistence of smallholder practices, and land-use extensification occur in parallel rather than sequentially, a pattern characteristic of structurally constrained small-island systems.
The core hypothesis (H1) was confirmed by identifying three clusters using PAM, validated with Random Forest classification (98.15% accuracy). This tripartite pattern also supports H5, revealing intensive subtropical, extensive traditional, and intensive pasture-based systems. Several structural trade-offs explain this configuration and directly underpin the hybrid transition dynamic. The inverse correlation between farm size (measured as hectares of UAA per holding) and labour intensity (H2, r = −0.653) highlights the persistence of a smallholder economy reliant on family labour. This is reinforced by the near-perfect correlation between the number of farms and family labour (H6, r = 0.997) [21].
Likewise, the negative association between subtropical fruit specialisation and crop diversity (H3, r = −0.673) reflects classic efficiency–resilience tensions in specialised systems [47] These structural relationships manifest in three distinct models.
Cluster 1—Intensive Subtropical Agriculture is defined by very small farms, averaging 0.25 hectares per holding, high labour intensity, and strong specialisation in subtropical fruit (72.2% of UAA). This system is predominantly located in southern coastal parishes (e.g., Funchal, Ponta do Sol), as illustrated in Figure 7. The typology reflects highly specialised and labour-intensive production systems, with elevated labour density indicating a strong concentration of the agricultural workforce in these areas. This configuration corroborates H4 and mirrors patterns observed in other island regions, particularly the Canary Islands and parts of Sicily, where high-value crop specialisation coexists with structural fragmentation [20,48]. While competitive, its low crop diversity heightens vulnerability to market or climate shocks, requiring sustainable intensification strategies [49]. Within the hybrid agrarian transition framework, this cluster represents the intensification and market-oriented pole of the agrarian system.
Cluster 2—Extensive Traditional Agriculture is the most widespread and forms the structural backbone of Madeira’s agrarian landscape. Spatially, this system predominates in interior and northern areas (Figure 7). It is characterised by moderate farm size, greater crop diversity, and balanced land use, supporting a more distributed agricultural workforce than in more specialised systems. With moderate farm size, high diversity, and mixed vegetables, vineyards, and arable land, it sustains food security and cultural heritage [50]. Its concentration in interior and northern municipalities aligns with H4. This system is comparable to diversified smallholder structures found in Mediterranean island regions such as Sicily and Crete, where mixed farming persists under structural constraints. However, demographic ageing and declining crop areas [21] echo broader pressures observed across Southern Europe and the Mediterranean [51,52,53]. In the context of a hybrid agrarian transition, this cluster reflects the persistence of traditional, resilience-oriented farming systems.
Cluster 3—Pasture-based Agriculture occupies specific ecological niches, with larger farms, lower labour intensity, and dominance of permanent pastures (48.6%). As shown in Figure 7, this system is concentrated in more marginal and less densely cultivated areas. The relatively low labour density reflects a reduced agricultural workforce, consistent with extensive production systems and land-use specialisation. It plays a multifunctional role in biodiversity conservation and fire-risk mitigation. Its emergence follows the abandonment of marginal arable land, paralleling extensification trends observed in the Azores, Southern Apennines, and the Guadalquivir Valley [10,32,54,55,56,57]. Within the hybrid transition framework, this cluster represents a process of land-use extensification and ecological reconfiguration, highlighting how structural adjustment in small island systems may lead to simultaneous intensification and abandonment dynamics.
The integration of spatial and structural evidence highlights clear patterns of territorial differentiation and functional specialisation. Intensive systems are concentrated in accessible coastal areas and exhibit high labour intensity and crop specialisation, while traditional systems maintain diversified production and broader territorial distribution. In contrast, pasture-based systems are associated with more marginal areas, lower labour requirements, and greater land concentration. These patterns suggest the coexistence of differentiated agrarian regimes, reflecting processes of spatial segregation and varying degrees of agricultural specialisation.
Theoretically, the results challenge linear modernisation narratives predicting uniform shifts toward specialised, large-scale agriculture. Instead, Madeira exemplifies a hybrid agrarian transition in which multiple production logics coexist across space, reflecting differential responses to environmental constraints, market integration, and labour dynamics. This position places Madeira alongside other small island regions, yet with a particularly pronounced degree of structural coexistence across contrasting agricultural systems. Instead, Madeira reflects a hybrid transition consistent with [12] “agrarian multiplicity,” shaped by differential market integration, labour dynamics, and environmental constraints. This coexistence represents a strategic adaptation that balances specialisation and diversification, while also exposing vulnerabilities, including fragmentation, ageing farmers, and subsidy dependence. Although Madeira follows broader European trends toward specialisation and consolidation [58,59], it maintains a distinct agrarian identity grounded in mixed farming and family labour [60,61].
From a practical standpoint, differentiated, place-based policies are required. For intensive subtropical systems, priorities include sustainable intensification and risk-management tools for monoculture-prone areas. For extensive traditional systems, policy measures should focus on leveraging their high diversification value by supporting short supply chains, local food systems, and quality-labelled products (e.g., geographical indications). Targeted incentives for agroecological practices, combined with programmes for generational renewal (e.g., access to land, training, and financial support for young farmers), are critical to maintaining the socio-economic viability of these systems.
For pasture-based systems, policy interventions should prioritise the formal recognition and remuneration of ecosystem services (e.g., fire risk reduction, biodiversity conservation, and landscape maintenance) through targeted CAP instruments. Support for sustainable grazing management, including incentives for extensification practices and the development of livestock value chains, is essential to enhance the economic viability of these structurally marginal but environmentally critical systems. Cross-cutting measures should address structural constraints, such as land fragmentation, through land consolidation mechanisms and improved access to land markets, strengthen institutional coordination across agricultural and territorial governance levels, and promote the integration of agricultural, environmental, and spatial planning within the CAP framework. Establishing a regional agrarian observatory to monitor structural dynamics and support evidence-based policymaking would further enhance policy effectiveness.
Beyond structural and spatial differentiation, the findings raise important considerations regarding the implications for the local population. The coexistence of highly specialised, labour-intensive systems alongside more extensive, less labour-intensive systems suggests uneven distributions of employment opportunities, income stability, and exposure to market and environmental risks. While intensive subtropical systems may generate higher short-term economic returns, they may also increase vulnerability to external shocks. In contrast, more diversified traditional systems can contribute to greater resilience and food security at the local level.
However, the extent to which current agricultural policies and regulatory frameworks effectively support these different agrarian models remains an open question. In particular, it is unclear whether existing policy instruments adequately address the structural imbalances, demographic challenges, and territorial disparities identified in this study. These aspects warrant further investigation, particularly through longitudinal and micro-level data, and represent a relevant avenue for future research.
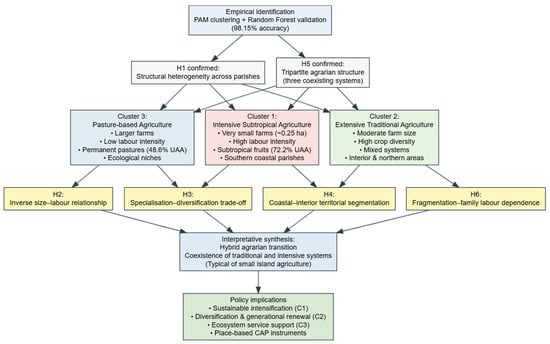
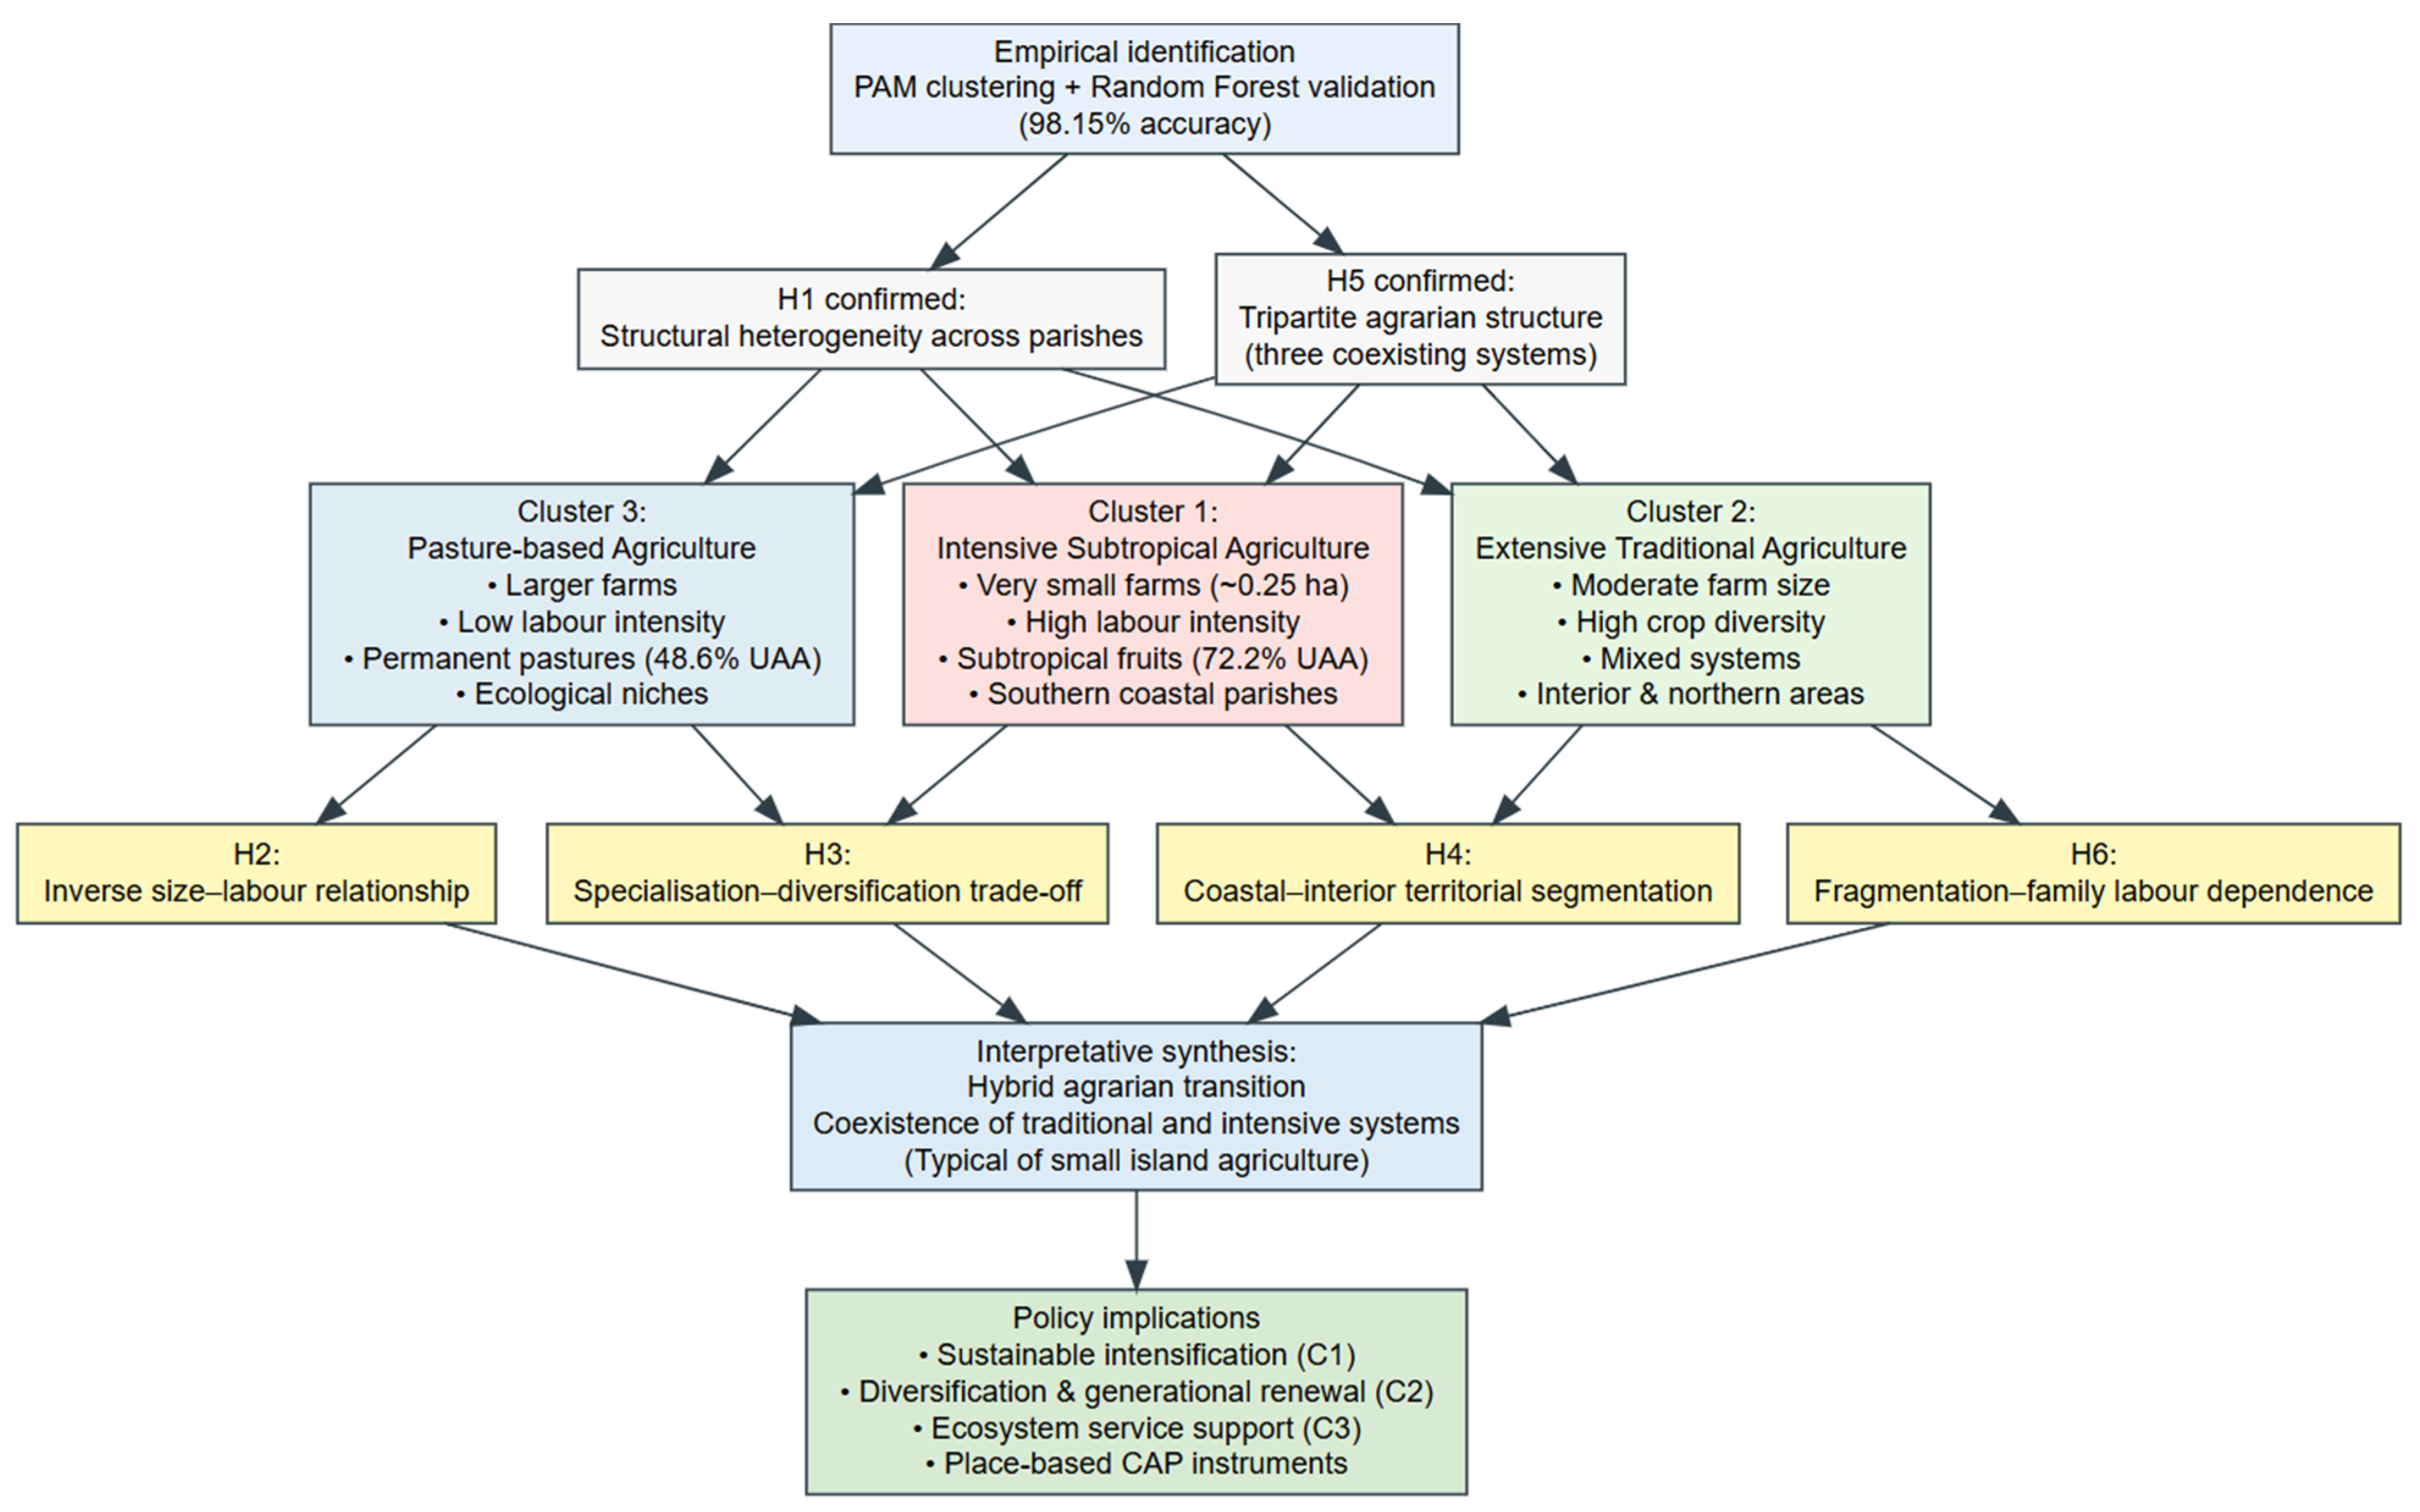
Overall, the results consistently support all six hypotheses. The identification of three distinct agricultural systems across Madeira’s parishes confirms structural heterogeneity and a hybrid agrarian transition (H1, H5). The inverse relationship between farm size and labour intensity (H2), together with the negative association between subtropical crop specialisation and agricultural diversity (H3), highlights key efficiency–resilience trade-offs. Clear coastal–interior territorial segmentation validates (H4), while the close correspondence between the number of holdings and family labour inputs provides strong support for (H6). Collectively, these findings reveal an agrarian structure shaped by embedded trade-offs between scale, labour, diversification, and territorial conditions. Figure 13 provides a synthetic overview of the validated hypotheses (H1–H6), linking the three empirically identified agrarian models to their underlying structural trade-offs and supporting the interpretation of a hybrid agrarian transition in Madeira.
Figure 13.
Empirical synthesis of agrarian models and validated hypotheses in Madeira. This figure was created by the authors.
Despite the robustness of the analytical framework, several limitations should be acknowledged. First, reliance on cross-sectional data from the 2019 Agricultural Census limits causal inference and the ability to capture dynamic processes and structural transitions over time, particularly in the context of evolving agrarian systems. Second, while the census provides full territorial coverage, potential measurement and classification biases may arise from reporting practices and the aggregation of heterogeneous farming activities, thereby affecting the precision of some indicators. Third, parish-level aggregation may conceal intra-parish heterogeneity, while the absence of farm-level socio-economic variables limits insight into behavioural drivers and decision-making processes. Moreover, some observed structural relationships may reflect historical and institutional path dependencies rather than independent causal mechanisms. External drivers such as climate change, market dynamics, and Common Agricultural Policy reforms were not explicitly modelled, indicating directions for future longitudinal and scenario-based research.
6. Conclusions and Policy Recommendations
This study provides the first statistically validated, spatially explicit typology of Madeira’s agrarian structure, identifying three differentiated production systems with distinct structural logics and territorial configurations. This tripartite structure confirms a hybrid agrarian transition shaped by the interplay between modernisation forces, environmental constraints, and longstanding smallholder traditions.
The intensive subtropical cluster is the most dynamic, driven by the expansion of permanent crops and competitive value chains. However, its low diversity heightens exposure to monoculture-related risks, requiring targeted resilience strategies. The traditional diversified cluster remains central to food security, local cultural identity, and ecological balance, but faces demographic decline, reduced horticultural areas, and structural vulnerability. The pasture-based cluster ensures critical ecosystem services, such as fire prevention, landscape conservation, and biodiversity, but remains economically marginal and dependent on targeted support.
The sustainability of Madeiran agriculture will hinge on managing these differentiated systems through place-based, tailored interventions rather than uniform policy approaches. For intensive subtropical agriculture, priorities include risk management instruments (crop insurance), investment in resilient crop varieties, and technological modernisation through precision irrigation and improved value chains. For traditional diversified systems, policies should focus on revitalisation through agroecological incentives, enhanced local markets, and integrated programs for generational renewal. For pasture-based systems, strategic support for sustainable grazing practices, ecosystem-service remuneration, and livestock chain development is essential.
Across all clusters, broader governance measures are necessary. These include establishing the following: a permanent Agrarian Observatory to track structural evolution; creating mechanisms to improve access to land and reduce fragmentation; integrating agricultural policy with territorial planning, tourism, and environmental management to reinforce multifunctionality and rural vitality.
This study is subject to limitations inherent to cross-sectional census data and parish-level aggregation, as well as the absence of socio-economic variables and external drivers such as climate scenarios or CAP reforms. In particular, the analysis does not directly assess the socio-economic impacts of the identified agrarian systems on the local population, nor the effectiveness of current policy frameworks in supporting these systems.
Future research should incorporate longitudinal approaches to capture temporal dynamics and higher-resolution farm-level data to address potential aggregation and coverage biases in census-based datasets. Moreover, further investigation is needed to examine employment patterns, income distribution, and the effectiveness of agricultural policies across different agrarian systems. Comparative analyses with other small island regions, such as the Azores and the Canary Islands, would also provide valuable insights into how insular agrarian systems respond to structural pressures and transition pathways.
Overall, the study offers a validated, spatially explicit framework for understanding Madeira’s agrarian diversity and provides evidence-based guidance for designing differentiated, resilient agricultural strategies. Strengthening the balance between specialisation, diversification, and environmental stewardship will be central to ensuring the long-term vitality of Madeira’s agricultural sector and its contribution to regional identity, landscape maintenance, and sustainable development.
Supplementary Materials
The following supporting information can be downloaded at: https://www.mdpi.com/article/10.3390/su18073545/s1. Table S1: Variance Explained by Principal Components; Table S2: Loadings of Variables on the First Three Principal Components; Table S3: K-means Cluster Distribution and Balance for Different K Values; Table S4: Cluster of Parishes—PAM; Table S5: Parish Distribution Across Agricultural Cluster Types; Table S6: Overview of Agricultural Cluster Characteristics; Table S7: Predominant Crops by Cluster; Table S8: PAM Cluster Distribution and Balance for Different K Values; Table S9: Random Forest Model Summary (Training Data); Table S10: Confusion Matrix of the Random Forest Model (Training Data); Table S11: Confusion Matrix of the Random Forest Model (Test Data); Table S12: Overall Performance Statistics of the Random Forest Model (Test Data); Table S13: Class-wise Performance Metrics of the Random Forest Model (Test Data); Table S14: Variable Importance Ranking of the Random Forest Model; Table S15: Confusion Matrix of the Random Forest Model (Full Dataset Predictions); Table S16: Overall Performance Statistics of the Random Forest Model (Full Dataset Predictions); Table S17: Class-wise Performance Metrics of the Random Forest Model (Full Dataset Predictions); Table S18: Class-wise Performance Metrics (Cluster-Level Statistics).
Author Contributions
M.K.: Conceptualisation, Methodology, Writing—original draft preparation, Supervision, Validation, Data curation, Investigation, Formal analysis, and Visualisation. J.A.F.: Investigation. I.O.: Investigation. All authors have read and agreed to the published version of the manuscript.
Funding
UCILeR is an R&D Unit accredited and funded by FCT—Portugal National Agency within the scope of its strategic project (UIDB/04643/2020). CeBER is an R&D unit funded by National Funds through FCT—Fundação para a Ciência e a Tecnologia, I.P. (UIDB/05037/2020).
Institutional Review Board Statement
Not applicable.
Informed Consent Statement
Not applicable.
Data Availability Statement
Data are available upon reasonable request.
Conflicts of Interest
The authors declare no conflicts of interest.
Abbreviations
| AWU | Annual Work Unit |
| CAP | Common Agricultural Policy |
| DREM | Direção Regional de Estatística da Madeira |
| IQR | Interquartile Range |
| MDA | Mean Decrease Accuracy |
| MDG | Mean Decrease Gini |
| MDS | Multidimensional Scaling |
| PAM | Partitioning Around Medoids |
| PCA | Principal Component Analysis |
| RF | Random Forest |
| SD | Standard Deviation |
| UAA | Utilised Agricultural Area |
Appendix A
Table A1.
Municipalities and parishes of the Autonomous Region of Madeira.
Table A2.
Descriptive statistics of the main variables.
Table A3.
Agricultural statistics by municipality.
Table A4.
Descriptive statistics of derived variables.
References
- Connell, J. Islands at Risk? Environments, Economies and Contemporary Change; Edward Elgar Publishing: Cheltenham, UK, 2014; ISBN 978-1-78100-350-3. [Google Scholar]
- FAO. Small Island Developing States and Agriculture; Food and Agriculture Organization: Rome, Italy, 2019; Available online: https://openknowledge.fao.org/server/api/core/bitstreams/137c207f-180c-4858-be24-f1d128aefc4d/content (accessed on 4 March 2026).
- Baldacchino, G. (Ed.) The Routledge International Handbook of Island Studies: A World of Islands; Routledge: London, UK, 2018; ISBN 9780367659899. [Google Scholar]
- Lin, B.B. Resilience in agriculture through crop diversification: Adaptive management for environmental change. BioScience 2011, 61, 183–193. [Google Scholar] [CrossRef] [Scilit]
- Barnett, J.; Waters, E. Rethinking the vulnerability of small island states: Climate change and development in the Pacific Islands. In The Palgrave Handbook of International Development; Palgrave Macmillan: London, UK, 2016; pp. 731–748. [Google Scholar] [CrossRef] [Scilit]
- Cruz, M.J.; Aguiar, R.; Correia, A.; Tavares, T.; Pereira, J.S.; Santos, F.D. Impacts of climate change on the terrestrial ecosystems of Madeira. Int. J. Des. Nat. Ecodyn. 2009, 4, 415–424. [Google Scholar] [CrossRef] [Scilit]
- Pinheiro de Carvalho, M.A.A.; Ragonezi, C.; Oliveira, M.C.O.; Reis, F.; Macedo, F.L.; de Freitas, J.G.R.; Nobrega, H.; Gananca, J.F.T. Agricultural sustainability in Madeira: Historical perspectives and future challenges. Sustainability 2022, 14, 8201. [Google Scholar] [CrossRef] [Scilit]
- DREM. Agricultural Census 2019: Structure of Agricultural Holdings; Direção Regional de Estatística da Madeira: Funchal, Portugal, 2025. Available online: https://estatistica.madeira.gov.pt (accessed on 4 March 2026).
- DREM. Regional Agricultural Statistics 2022; Direção Regional de Estatística da Madeira: Funchal, Portugal, 2022. [Google Scholar]
- Eastwood, R.; Lipton, M.; Newell, A. Farm size. In Handbook of Agricultural Economics; Evenson, R., Pingali, P., Eds.; Elsevier: Amsterdam, The Netherlands, 2010; Volume 4, pp. 3323–3397. [Google Scholar]
- Rada, N.E.; Fuglie, K.O. New perspectives on farm size and productivity. Food Policy 2019, 84, 147–152. [Google Scholar] [CrossRef] [Scilit]
- Ellis, F. Peasant Economics: Farm Households and Agrarian Development, 2nd ed.; Cambridge University Press: Cambridge, UK, 1993. [Google Scholar] [CrossRef] [Scilit]
- Jolliffe, I.T.; Cadima, J. Principal component analysis: A review and recent developments. Philos. Trans. R. Soc. A 2016, 374, 20150202. [Google Scholar] [CrossRef] [Scilit] [PubMed]
- Kaufman, L.; Rousseeuw, P.J. Finding Groups in Data: An Introduction to Cluster Analysis; Wiley: New York, NY, USA, 1990. [Google Scholar] [CrossRef] [Scilit]
- Breiman, L. Random forests. Mach. Learn. 2001, 45, 5–32. [Google Scholar] [CrossRef] [Scilit]
- Van der Ploeg, J.D.; Renting, H.; Brunori, G.; Knickel, K.; Mannion, J.; Marsden, T.; de Roest, K.; Sevilla-Guzman, E.; Ventura, F. Rural development: From practices and policies towards theory. Sociol. Rural. 2000, 40, 391–408. [Google Scholar] [CrossRef] [Scilit]
- Demetriou, D. The Development of an Integrated Planning and Decision Support System (IPDSS) for Land Consolidation; Springer: Cham, Switzerland, 2013. [Google Scholar] [CrossRef] [Scilit]
- Connell, J. Greenland and the Pacific Islands: An improbable conjunction of development trajectories. Isl. Stud. J. 2016, 11, 465–484. [Google Scholar] [CrossRef] [Scilit]
- Guell, C.; Brown, C.R.; Navunicagi, O.W.; Iese, V.; Badrie, N.; Wairiu, M.; Saint Ville, A.; Unwin, N. Perspectives on strengthening local food systems in Small Island Developing States. Food Secur. 2022, 14, 1227–1240. [Google Scholar] [CrossRef] [Scilit]
- Ginésy, M.; Biasi, R. New Insights into Agriculture on Small Mediterranean Islands: A Systematic Review. Land 2025, 14, 1874. [Google Scholar] [CrossRef] [Scilit]
- DREM. Statistical Yearbook of the Autonomous Region of Madeira 2023; Direção Regional de Estatística da Madeira: Funchal, Portugal, 2024. [Google Scholar]
- Lantz, B. Machine Learning with R, 2nd ed.; Packt Publishing: Birmingham, UK, 2015. [Google Scholar]
- Magurran, A.E. Measuring Biological Diversity; Blackwell Publishing: Oxford, UK, 2004. [Google Scholar]
- Jolliffe, I.T. Principal Component Analysis, 2nd ed.; Springer: New York, NY, USA, 2002. [Google Scholar]
- Wickham, H.; François, R.; Henry, L.; Müller, K. dplyr. Available online: https://CRAN.R-project.org/package=dplyr (accessed on 4 March 2026).
- Pearson, K. Notes on regression and inheritance in the case of two parents. Proc. R. Soc. Lond. 1895, 58, 240–242. [Google Scholar] [CrossRef] [Scilit]
- MacQueen, J. Some methods for classification and analysis of multivariate observations. In Proceedings of the Fifth Berkeley Symposium on Mathematical Statistics and Probability; University of California Press: Berkeley, CA, USA, 1967; Volume 1, pp. 281–297. Available online: http://projecteuclid.org/euclid.bsmsp/1200512992 (accessed on 2 February 2026).
- Lê, S.; Josse, J.; Husson, F. FactoMineR: An R package for multivariate analysis. J. Stat. Softw. 2008, 25, 1–18. [Google Scholar] [CrossRef] [Scilit]
- Wei, T.; Simko, V. R package ‘corrplot’: Visualization of a Correlation Matrix. 2021. Available online: https://github.com/taiyun/corrplot (accessed on 4 March 2026).
- Field, A. Discovering Statistics Using IBM SPSS Statistics, 4th ed.; Sage: London, UK, 2013. [Google Scholar]
- Andersen, E.; Elbersen, B.; Godeschalk, F.; Verhoog, D. Farm management indicators and farm typologies as a basis for assessments in a changing policy environment. J. Environ. Manag. 2007, 82, 353–362. [Google Scholar] [CrossRef] [Scilit] [PubMed]
- Kaiser, H.F. The application of electronic computers to factor analysis. Educ. Psychol. Meas. 1960, 20, 141–151. [Google Scholar] [CrossRef] [Scilit]
- Cattell, R.B. The scree test for the number of factors. Multivar. Behav. Res. 1966, 1, 245–276. [Google Scholar] [CrossRef] [Scilit]
- Kostrowicki, J. Agricultural typology: Concept and method. Agric. Syst. 1977, 2, 33–45. [Google Scholar] [CrossRef] [Scilit]
- Rousseeuw, P.J. Silhouettes: A graphical aid to the interpretation and validation of cluster analysis. J. Comput. Appl. Math. 1987, 20, 53–65. [Google Scholar] [CrossRef] [Scilit]
- Dunn, J.C. Well-separated clusters and optimal fuzzy partitions. J. Cybern. 1974, 4, 95–104. [Google Scholar] [CrossRef] [Scilit]
- Handl, J.; Knowles, J.; Kell, D.B. Computational cluster validation in post-genomic data analysis. Bioinformatics 2005, 21, 3201–3212. [Google Scholar] [CrossRef] [Scilit]
- Hubert, L.; Arabie, P. Comparing partitions. J. Classif. 1985, 2, 193–218. [Google Scholar] [CrossRef] [Scilit]
- Kruskal, W.H.; Wallis, W.A. Use of ranks in one-criterion variance analysis. J. Am. Stat. Assoc. 1952, 47, 583–621. [Google Scholar] [CrossRef]
- Charrad, M.; Ghazzali, N.; Boiteau, V.; Niknafs, A. NbClust: An R package for determining the relevant number of clusters in a data set. J. Stat. Softw. 2014, 61, 1–36. [Google Scholar] [CrossRef] [Scilit]
- Belgiu, M.; Drăguţ, L. Random forest in remote sensing: A review. ISPRS J. Photogramm. Remote Sens. 2016, 114, 24–31. [Google Scholar] [CrossRef] [Scilit]
- Liaw, A.; Wiener, M. Classification and regression by randomForest. R News 2002, 2, 18–22. Available online: https://journal.r-project.org/articles/RN-2002-022/RN-2002-022.pdf (accessed on 2 February 2026).
- Kuhn, M. Building predictive models in R using the caret package. J. Stat. Softw. 2008, 28, 1–26. [Google Scholar] [CrossRef] [Scilit]
- Wickham, H. ggplot2: Elegant Graphics for Data Analysis; Springer: New York, NY, USA, 2016. [Google Scholar] [CrossRef] [Scilit]
- Liu, Y.; Li, Z.; Xiong, H.; Gao, X.; Wu, J. Understanding of internal clustering validation measures. In Proceedings of the 2010 IEEE International Conference on Data Mining; IEEE: Sydney, Australia, 2010; pp. 911–916. [Google Scholar] [CrossRef] [Scilit]
- Lever, J.; Krzywinski, M.; Altman, N. Principal component analysis. Nat. Methods 2017, 14, 641–642. [Google Scholar] [CrossRef] [Scilit]
- Klasen, S.; Meyer, K.M.; Dislich, C.; Euler, M.; Faust, H.; Gatto, M.; Hettig, E.; Melati, D.N.; Jaya, I.N.S.; Otten, F.; et al. Economic and ecological trade-offs of agricultural specialization at different spatial scales. Ecol. Econ. 2016, 122, 111–120. [Google Scholar] [CrossRef] [Scilit]
- Cruz-Pérez, N.; Santamarta, J.C.; Álvarez-Acosta, C. Water footprint of representative agricultural crops on volcanic is-lands: The case of the Canary Islands. Renew. Agric. Food Syst. 2023, 38, e36. [Google Scholar] [CrossRef] [Scilit]
- Fischetti, E.; Beni, C.; Santangelo, E.; Bascietto, M. Agroecology and precision agriculture as combined approaches to increase field-scale crop resilience and sustainability. Sustainability 2025, 17, 961. [Google Scholar] [CrossRef] [Scilit]
- Dinis, I. The concept of family farming in the Portuguese political discourse. Soc. Sci. 2019, 8, 213. [Google Scholar] [CrossRef] [Scilit]
- Houssni, M.; Kassout, J.; El Mahroussi, M.; Chakkour, S.; Kadiri, M.; Ater, M.; Petrisor, A.I. Evaluation and structuring of agrodiversity in oases agroecosystems of Southern Morocco. Agriculture 2023, 13, 1413. [Google Scholar] [CrossRef] [Scilit]
- Batista, D. The Multi-Functionality and Resilience of the Mediterranean Landscape: Traditional Vegetable Gardens in Southern Portugal and Northern Morocco. Available online: http://hdl.handle.net/10174/14013 (accessed on 4 March 2026).
- Anthopoulou, T.K.; Kaberis, N.; Petrou, M. Crisis and rural resilience in Greece. J. Rural Stud. 2017, 52, 1–11. [Google Scholar] [CrossRef] [Scilit]
- Hidalgo, P.J.; Hernández, H.; Sánchez-Almendro, A.J.; López-Tirado, J.; Vessella, F.; Porras, R. Fragmentation and connectivity of island forests in agricultural Mediterranean environments. Forests 2021, 12, 1201. [Google Scholar] [CrossRef] [Scilit]
- Troiano, C.; Buglione, M.; Petrelli, S.; Belardinelli, S.; De Natale, A.; Svenning, J.-C.; Fulgione, D. Traditional free-ranging livestock farming and landscape preservation. Land 2021, 10, 957. [Google Scholar] [CrossRef] [Scilit]
- De Almeida, A.M.; Alvarenga, P.; Fangueiro, D. The dairy sector in the Azores Islands: Possibilities and main constraints towards increased added value. Trop. Anim. Health Prod. 2020, 53, 40. [Google Scholar] [CrossRef] [Scilit] [PubMed]
- Morais, T.G.; Teixeira, R.F.M.; Rodrigues, N.R.; Domingos, T. Carbon footprint of milk from pasture-based dairy farms in Azores, Portugal. Sustainability 2018, 10, 3658. [Google Scholar] [CrossRef] [Scilit]
- European Commission. EU Agricultural Outlook 2024–2035; Publications Office of the Eropean Union: Luxembourg, 2025. [Google Scholar]
- Eurostat. Agri-Environmental Indicator—Specialisation. Available online: https://ec.europa.eu/eurostat/statistics-explained (accessed on 4 March 2026).
- Ortiz-Miranda, D.; Moragues-Faus, A.; Arnalte-Alegre, E. Agriculture in Mediterranean Europe: Between Old and New Paradigms; Emerald: Bingley, UK, 2013; Available online: https://orca.cardiff.ac.uk/id/eprint/52908 (accessed on 4 March 2026).
- Hilmi, N.; Crisóstomo, M.; Bermudo, A.; Chami, R.; Imbert, N.; Duarte, C.M. Resilience of small islands: Unveiling nature-based solutions for sustainable futures. In Climate-Resilient Cities; Arora, A., Belaïd, F., Lechtenberg-Kasten, S., Eds.; Springer: Cham, Switzerland, 2024; pp. 1–18. [Google Scholar] [CrossRef] [Scilit]

Disclaimer/Publisher’s Note: The statements, opinions and data contained in all publications are solely those of the individual author(s) and contributor(s) and not of MDPI and/or the editor(s). MDPI and/or the editor(s) disclaim responsibility for any injury to people or property resulting from any ideas, methods, instructions or products referred to in the content. |
© 2026 by the authors. Licensee MDPI, Basel, Switzerland. This article is an open access article distributed under the terms and conditions of the Creative Commons Attribution (CC BY) license.