


Abstract
Flooding is one of the most persistent and destructive natural hazards in West Virginia. However, community-scale assessments that connect social vulnerability with physical flood vulnerability are still limited. Existing floodplain management plans often focus on infrastructure and hydrology, overlooking how socioeconomic disparities shape resilience. This study assesses flood resilience in West Virginia communities by connecting socioeconomic vulnerability with physical flood vulnerability. Using data from the American Community Survey (ACS) and state floodplain maps, we developed a Socioeconomic Vulnerability Index (SEVI) and combined it with physical indicators, such as the percentage of residential buildings in the 100-year floodplain, the share of mobile homes in flood-prone areas, the presence of essential facilities and community assets within flood zones, and the proportion of roads submerged by at least one foot of water. Incorporated and unincorporated communities were analyzed separately to reflect differences in governance and service capacity. The results reveal that high flood vulnerability areas often coincide with high socioeconomic vulnerability, especially in the southern and southeastern counties, where long-term economic decline has increased risks. Communities like McDowell and Mingo face a combined challenge of social and physical vulnerability, adding pressure to populations already dealing with limited resources. These findings emphasize the importance of integrated resilience planning that combines physical protection with social support. Considering the increasing intensity of extreme precipitation events associated with climate change, these findings also highlight the importance of incorporating long-term climate considerations into flood resilience planning. Policy suggestions include expanding targeted flood insurance subsidies for low-income households, prioritizing the relocation or retrofitting of mobile homes and essential facilities, investing in green and open spaces, and encouraging community-based mitigation strategies. Together, these actions can lower long-term flood risks while addressing structural inequalities that make certain populations more vulnerable.
1. Introduction
Flooding has long been recognized as the most damaging natural hazard in the United States, historically managed through structural defenses such as levees designed to resist water intrusion [1,2]. However, growing climate-related risks have shifted focus from resistance-based approaches toward resilience, highlighting recovery, adaptation, and risk reduction beyond traditional design limits [3,4,5].
In this study, we focus specifically on riverine flooding, defined by the Federal Management Agency (FEMA) [6] as flooding that occurs when streams and rivers exceed the capacity of their natural or constructed channels, causing water to overflow into adjacent low-lying areas. Riverine floods typically develop over larger areas and over longer periods than flash floods, which, according to the National Severe Storms Laboratory [7], occur when heavy rainfall overwhelms the ground’s ability to absorb water, leading to rapid increases in water levels, often within minutes. Flash floods are highly destructive but tend to be localized and short-lived, whereas riverine floods represent the more persistent and widespread threat to many West Virginia communities located along river valleys.
Flood risk in West Virginia is influenced by its geography and history of settlement. Many communities are located in steep, narrow valleys with extensive floodplains, the result of both industrial development and topographic constraints [8]. Over time, urban growth, resource extraction, and increased demands for energy and infrastructure have altered natural systems, leading to more impervious surfaces and frequent flooding [9,10].
According to the National Research Council [11], strengthening community resilience requires both physical improvements, such as upgraded infrastructure, and profound systemic shifts in governance, planning, and social support [7,12]. This research is based on the concept of resilience and examines how communities can prepare for and recover from flood-related disasters. Although resilience and vulnerability are closely related concepts, they represent different aspects of disaster risk and are not simply opposites. Vulnerability indicators are often used to identify weaknesses in a community’s ability to prepare for, respond to, and recover from disasters [13,14,15]. Recent work by UN-affiliated and humanitarian data researchers has emphasized that disaster risk assessment should move beyond hazard detection alone and incorporate multidimensional indicators of exposure, social conditions, and impact to support decision-making across the disaster management cycle. In this context, vulnerability assessment provides an essential baseline for building resilience because it helps identify communities and population groups that may need prioritized preparedness, targeted communication, and post-disaster support. Studies have also shown that integrating spatial risk information with socially informed indicators can enhance early warning and emergency management by better identifying highly affected or insufficiently responsive populations [16,17].
In this study, vulnerability indicators are used as analytical tools to assess community resilience by identifying the social and physical conditions that may limit adaptive capacity and post-disaster recovery. The Socioeconomic Vulnerability Index (SEVI), therefore, functions as a diagnostic measure that highlights communities where resilience may be constrained.
These indicators address vulnerabilities across economic, environmental, institutional, and cultural dimensions [14,18].
Physical vulnerability indicates how much physical elements like buildings, infrastructure, and critical facilities are susceptible to damage from hazardous events [19,20]. It is determined by the design, materials, and location of structures, as well as the intensity and frequency of the hazard itself. Socioeconomic vulnerability describes how social and economic conditions influence a population’s capacity to anticipate, cope with, and recover from disasters [21,22]. It incorporates factors such as poverty, inequality, education, and access to resources that shape adaptive capacity at both individual and community levels [23,24,25].
To assess flood resilience in West Virginia, we connected physical and socioeconomic indicators in this study to identify the most flood-vulnerable communities. A key methodological choice was to focus on residential buildings when assessing physical vulnerability. The main goal of this study is to identify and analyze the overlaps between flood vulnerability and socioeconomic vulnerability across West Virginia’s incorporated and unincorporated communities. Many socioeconomic variables were examined, including income, employment, housing characteristics, and family structure, aligned with those used in FEMA’s Resilience Analysis and Planning Tool (RAPT) and the CDC’s Social Vulnerability Index. However, the scale of this study differs from these national frameworks. Instead of counties or census tracts, we analyze incorporated and unincorporated communities.
This approach reflects both the availability of detailed physical data at the community level and the importance of governance structures. Incorporated areas have their own local governments and decision-making bodies, whereas unincorporated areas rely on county-level governance and external resources for their management. Studying vulnerability at this level enables us to connect physical indicators, such as buildings and critical facilities, directly to social contexts and governance systems that influence resilience. By combining these data sources, this research highlights the areas where vulnerability is heightened and where resilience efforts must be tailored to the realities of local community structures. By linking socioeconomic vulnerability to physical flood exposure at the community level, it becomes possible to pursue sustainable planning by identifying where long-term risk reduction, equitable investment, and resilience-building efforts are most critically needed.
Socioeconomic Vulnerability
Resilience and vulnerability are conceptual connections, but they are not simply opposites, as a community or social group can be highly vulnerable and still show strong resilience [13,26]. Community disaster resilience refers to a community’s ability to anticipate, prepare for, respond to, and recover quickly from disasters [12,15]. It also encompasses the capacity to adapt, grow, and improve despite ongoing challenges [14,27]. Although definitions vary, key aspects of resilience generally include predicting risks, reducing impacts, and bouncing back through effective responses [11,28].
Social vulnerability describes the likelihood that individuals or communities will be affected by environmental challenges, such as floods [17,24]. These environmental changes are important because they disrupt daily life and require adaptation [29,30]. Stressors refer to environmental events, such as flooding, that place pressure on communities and their resources [24,31]. Social vulnerability is often linked to personal factors such as income, employment, race, age, health, and housing conditions [24,32]. It also involves place-based inequalities that reflect broader community traits, such as levels of urbanization, growth rates, and economic health [33,34]. These factors together impact a community’s ability to withstand and recover from disasters [24,29].
Conversely, resilience is not a new concept; it has long been used in mathematical, physical, and ecological fields [35,36]. Alexander [37] pointed out its adoption into the social sciences, especially in disaster risk reduction [37,38]. A key milestone in including social factors in resilience analysis was the development of the Social Vulnerability Index (SoVI) by Cutter, Boruff, and Shirley [24,39]. Using county-level socioeconomic and demographic data from 1990, the SoVI aimed to measure socially built vulnerabilities, an area often missed in disaster impact assessments because of the difficulties in measurement [24,40]. As a result, social losses were rarely included in post-disaster loss reports [40,41].
LaLone [28] believed that research on community resilience has increasingly incorporated perspectives from the applied social sciences [15,28]. Social resilience is defined as the ability of communities or groups to absorb, adapt to, and recover from social, environmental, or political disruptions [42,43]. It involves institutions that support collective action, strong governance systems, and diverse livelihood opportunities, all of which help lessen the impacts of natural hazards and promote long-term recovery [23,44].
Economic vulnerability is widely seen as one of the significant threats to community resilience after a disaster [38,39]. At the individual level, the negative effects of low income on recovery after a disaster are even more severe when people live in low-income neighborhoods, where recovery resources are limited [45]. Research shows that people in economically disadvantaged communities face a higher risk of death after a disaster than residents in wealthier areas, as seen in studies of Hurricane Katrina and other events [32,46]. For marginalized groups, these stressors are often widespread and closely linked to underlying economic and social conditions marked by a lack of income and resources [21,47].
In addition to limited access to political power, factors such as a large proportion of elderly residents or people with physical limitations, high cultural and linguistic diversity, and indigenous populations can also pose challenges to post-disaster recovery, thereby impacting community resilience [24,45]. Furthermore, elements like population density, housing tenancy arrangements, and residential instability have been shown to weaken community resilience during disasters, as these conditions can delay or hinder both immediate response efforts and long-term rebuilding [38,39]. This demonstrates how socioeconomic inequalities and neighborhood-level vulnerabilities significantly impact a community’s capacity to withstand and recover from disasters.
In short, previous research shows that resilience cannot be understood by looking only at the hazard or only at the community. What is less understood is how these social and physical aspects interact with where people live and decisions are made. In West Virginia, this means looking beyond counties or census tracts to focus on both incorporated and unincorporated communities, which face different challenges in governance, resources, and infrastructure. Filling this gap is essential for identifying not just where vulnerability exists, but how both social conditions and the built environment shape it. This understanding shapes the purpose of our study and prepares the way for the integrated approach we will employ.
2. Methodology
This section describes the data source, data collection, and analysis process for this study. While considering data availability, we focused on the methodologies that align with our research objective.
2.1. Geography of Interest
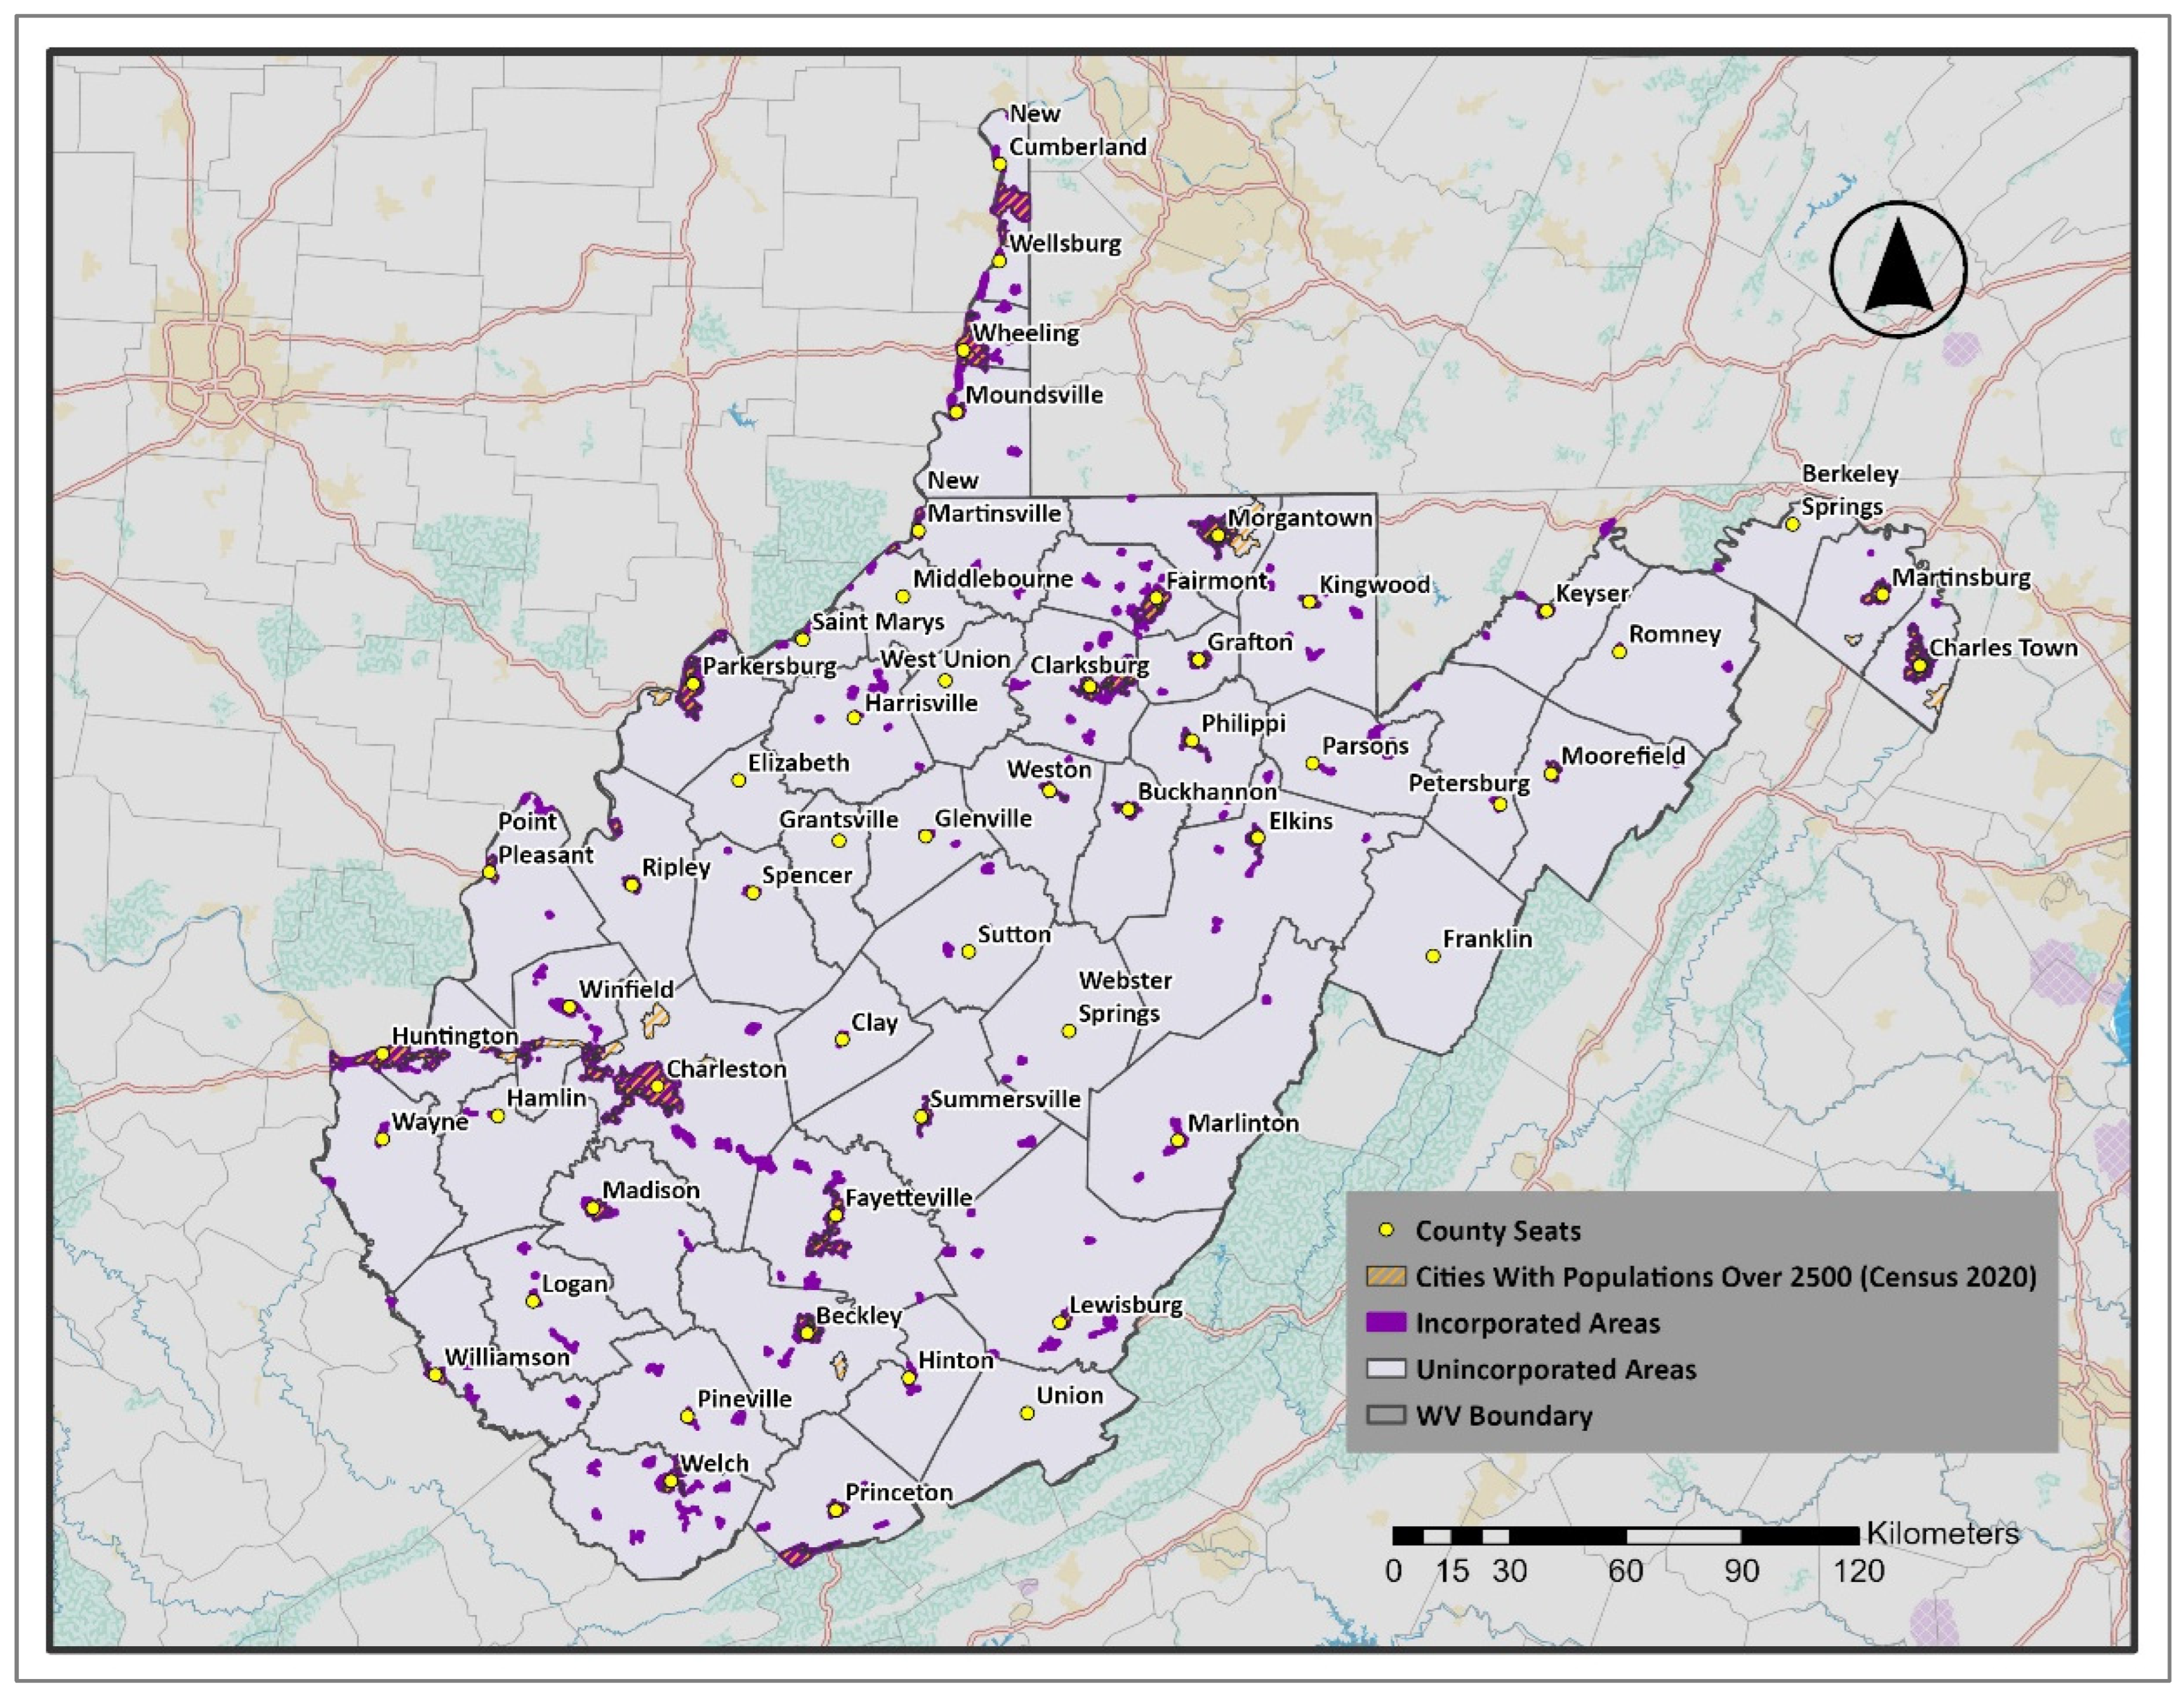
Our study focuses on the distinction between incorporated and unincorporated areas in West Virginia, as shown in Figure 1. Incorporated areas, highlighted in dark purple, include cities and towns with formal municipal governance, tax collection, and public services. In contrast, unincorporated areas, shaded in gray, are the parts of the counties that do not have municipal governance and are managed at the county level. These unincorporated areas often have fewer public services compared to their incorporated counterparts. This classification allows us to clearly analyze socioeconomic and flood vulnerability patterns across different governance geographies.
Figure 1.
Incorporated & Unincorporated Communities in West Virginia. (Figures are original and created by the authors).
West Virginia consists of 229 incorporated communities (towns or cities) and 55 unincorporated areas. Understanding these differences is crucial for our analysis, as governance has a significant influence on resource allocation, community development, and disaster resilience. By examining both incorporated and unincorporated areas, we aim to evaluate socioeconomic vulnerability to flood resilience across various governance settings.
2.2. Data Source and Analytical Tools
The primary socioeconomic data for this study were obtained from the 2021 American Community Survey (ACS) 5-year estimates, which provide comprehensive socioeconomic statistics at the community level. To analyze this data in the context of flood resilience, the flood data was collected from a FEMA-funded project carried out by the West Virginia GIS Technical Center (WVGISTC) between 2015 and 2021. This project focused on identifying structures located within areas with a 1% annual chance of flooding, commonly known as the 100-year flood zone.
Using TidyCensus for Socioeconomic Data Collection
To analyze the socioeconomic vulnerability of communities, we used TidyCensus (Version 1.7.3). This R package provides direct access to data from the U.S. Census Bureau, specifically the Decennial Census and the American Community Survey (ACS). Released in 2017, TidyCensus has become popular for its ability to acquire, process, and analyze demographic and socioeconomic data. By connecting with the Census Bureau’s Application Programming Interface (API), this R package allows users to efficiently retrieve and manage large datasets in R. Its user-friendly interface enables users to specify geographic units (such as Census-Designated Places (CDPs), counties, or states), select relevant variables, and obtain data in either tabular or spatial formats. This functionality makes the R package especially useful for our research, which involves statistical and spatial analysis of demographic data. R version 4.4.1. [39] was used in this study.
2.3. Identifying Socioeconomically Vulnerable Communities
The maps presented in this study were generated using ArcGIS Pro Version 3.4 [48]. In the first part of the study, we aimed to identify socioeconomically vulnerable communities in West Virginia. Therefore, we needed to define the indicators based on socioeconomic status. Reviewing similar studies, we extracted these indicators from the ACS 2021 5-year estimates using TidyCensus. The selected indicators were organized into six categories: Demography, Economy, Education, Housing, Infrastructure, and Community Development. Table 1 presents the categories and their corresponding indicators.
Table 1.
Socioeconomic Indicators.
The socioeconomic indicators were selected based on commonly used variables in vulnerability assessment frameworks like the Social Vulnerability Index (SoVI) [24], FEMA’s Resilience Analysis and Planning Tool (RAPT) [49], and related flood vulnerability studies. These indicators reflect key demographic, economic, housing, and infrastructure features that have been widely linked to disaster vulnerability and recovery capacity in prior research. To create a Socioeconomic Vulnerability Index (SEVI), we first normalized the indicators listed above by calculating their percentages. Using percentages instead of raw numbers provided comparable results across different scales. Then, the indicators were combined by summing their values for each community and calculating the average score to form a composite measure of socioeconomic vulnerability at the community level (Equation (1)). This index evaluates disparities among communities and is an important metric for identifying areas that may be disproportionately vulnerable to external stressors, including flooding.
Once the indicators are normalized, the average of all indicators for each community is calculated as:
where
- ▪
- Avgc is the average socioeconomic score for community c.
- ▪
- Xnorm represents the normalized value (percentage) of the i-th socioeconomic indicator for community c.
- ▪
- n is the total number of socioeconomic indicators considered in the study.
Composite vulnerability indices often combine normalized socioeconomic indicators into a single metric to summarize multidimensional social conditions and facilitate comparison across geographic units, as in Ahsan & Warner [50] or the Centers for Disease Control and Prevention (CDC) [51]. All indicators were assigned equal weight when constructing the Socioeconomic Vulnerability Index (SEVI). Equal weighting is commonly used in composite vulnerability indices when there is not enough evidence to justify assigning different levels of importance to individual variables. This approach provides a transparent and reproducible method for aggregating indicators while reducing subjective bias in the weighting process. Similar methods have been used in previous vulnerability assessments [52,53].
To evaluate the robustness of the equal-weight aggregation method, principal component analysis (PCA) was also used as an alternative statistical weighting approach for the socioeconomic indicators. The PCA results showed that the first principal component was mainly associated with low household income, poverty, government assistance, disability, limited access to vehicles, and rental housing. These variables represent key aspects of socioeconomic vulnerability and are consistent with the conceptual framework used in this study. To further verify the consistency of the findings, the PCA-based ranking of communities was compared with the ranking derived from the equal-weight SEVI. The comparison revealed a very high correlation between the two methods (Spearman = 0.985), suggesting that identifying vulnerable communities is not sensitive to the weighting method. However, because the aim of the SEVI was to develop a transparent and easy-to-interpret composite index based on conceptually chosen indicators, the equal-weight approach was retained in the final analysis. A comparison of PCA-based and equal-weight rankings is provided in Appendix A.
After calculating the average socioeconomic score for each community (Equation (1)), we ranked the communities to determine their relative socioeconomic vulnerability (Equation (2)). Ranking allows for straightforward comparisons across communities, emphasizing those with higher or lower vulnerability levels.
In Excel, this was implemented using the RANK function:
where:
Rankc = RANK(Sc, {S1, S2, …, Sn}, 0)
- ▪
- Rankc is the rank of community c
- ▪
- Sc refers to the socioeconomic index average percentage (s) for community c
- ▪
- {S1, S2, …, Sn} is the set of average scores for all communities
- ▪
- The final argument, 0, indicates descending order (i.e., the highest vulnerability score gets rank 1).
This ranking process ensures that communities with higher socioeconomic vulnerability are ranked at the top of the index, making disparities easier to identify for comparison and policy analysis prioritization.
It is important to note that the socioeconomic data obtained from the Census Bureau was available at the Census-Designated Place (CDP) level. However, our goal was to present results at the community level, encompassing both incorporated and unincorporated areas. To do this, we first identified and processed data for 229 incorporated areas and 55 counties separately. Then, this data was subtracted from the countywide totals to estimate values for unincorporated areas. These results were later used to develop our indicators and index. This approach enabled us to represent socioeconomic vulnerability at the community level more effectively, aligning the dataset with real-world governance and administrative boundaries.
2.3.1. Split Communities
Some incorporated communities extend across two or more counties (e.g., Alderson, Huntington, Montgomery, Nitro, Paden City, Smithers, Weirton, and Wheeling). To assess the socioeconomic vulnerability of these split communities, an allocation method was needed to assign community-level data to each county portion. Since detailed socioeconomic data (such as household counts or parcel-level information) were not available separately for each section of these communities, the building footprint data obtained from the West Virginia GIS Technical Center were used as a proxy for the spatial distribution of population and development within split communities. The percentage of building footprints within each county segment was calculated and used to approximate the relative distribution of development across the community. These percentages were then applied to the normalized socioeconomic indicators (expressed as percentages) to distribute values among county segments. Because the indicators were normalized, this process did not change the overall SEVI value for each community. As a result, split communities were treated as single entities in the final ranking, while still reflecting their geographic spread across counties.
2.3.2. Assessing Flood Vulnerability in Socioeconomically Vulnerable Communities
When identifying socioeconomically vulnerable communities, the next step was to determine if these communities also showed high flood vulnerability. To do this, we used spatial flood hazard data from the West Virginia GIS Technical Center. The dataset includes over 98,000 buildings in high-risk flood zones, providing an opportunity to evaluate flood vulnerability at the community level. By overlaying the Socioeconomic Vulnerability Index (SEVI) with the flood hazard data, we performed a spatial intersection analysis to see if the most socioeconomically vulnerable communities also had a disproportionately high number of buildings in flood-prone areas. This analysis helped us understand the compounded risks faced by specific communities due to the combination of economic hardship and flood vulnerability.
3. Discussion and Results
3.1. Socioeconomic Vulnerability in Incorporated Areas
The resulting vulnerability maps can help flood warning and resilience planning by pinpointing communities where communication, preparedness, evacuation support, and recovery resources may need to be prioritized. This aligns with broader humanitarian research showing that disaster information systems are most effective when they combine hazard signals with contextual indicators of social vulnerability, exposure, and recovery capacity [40,54]. In this way, the present framework provides a place-based baseline for targeting resilience-building efforts before and after flood events.
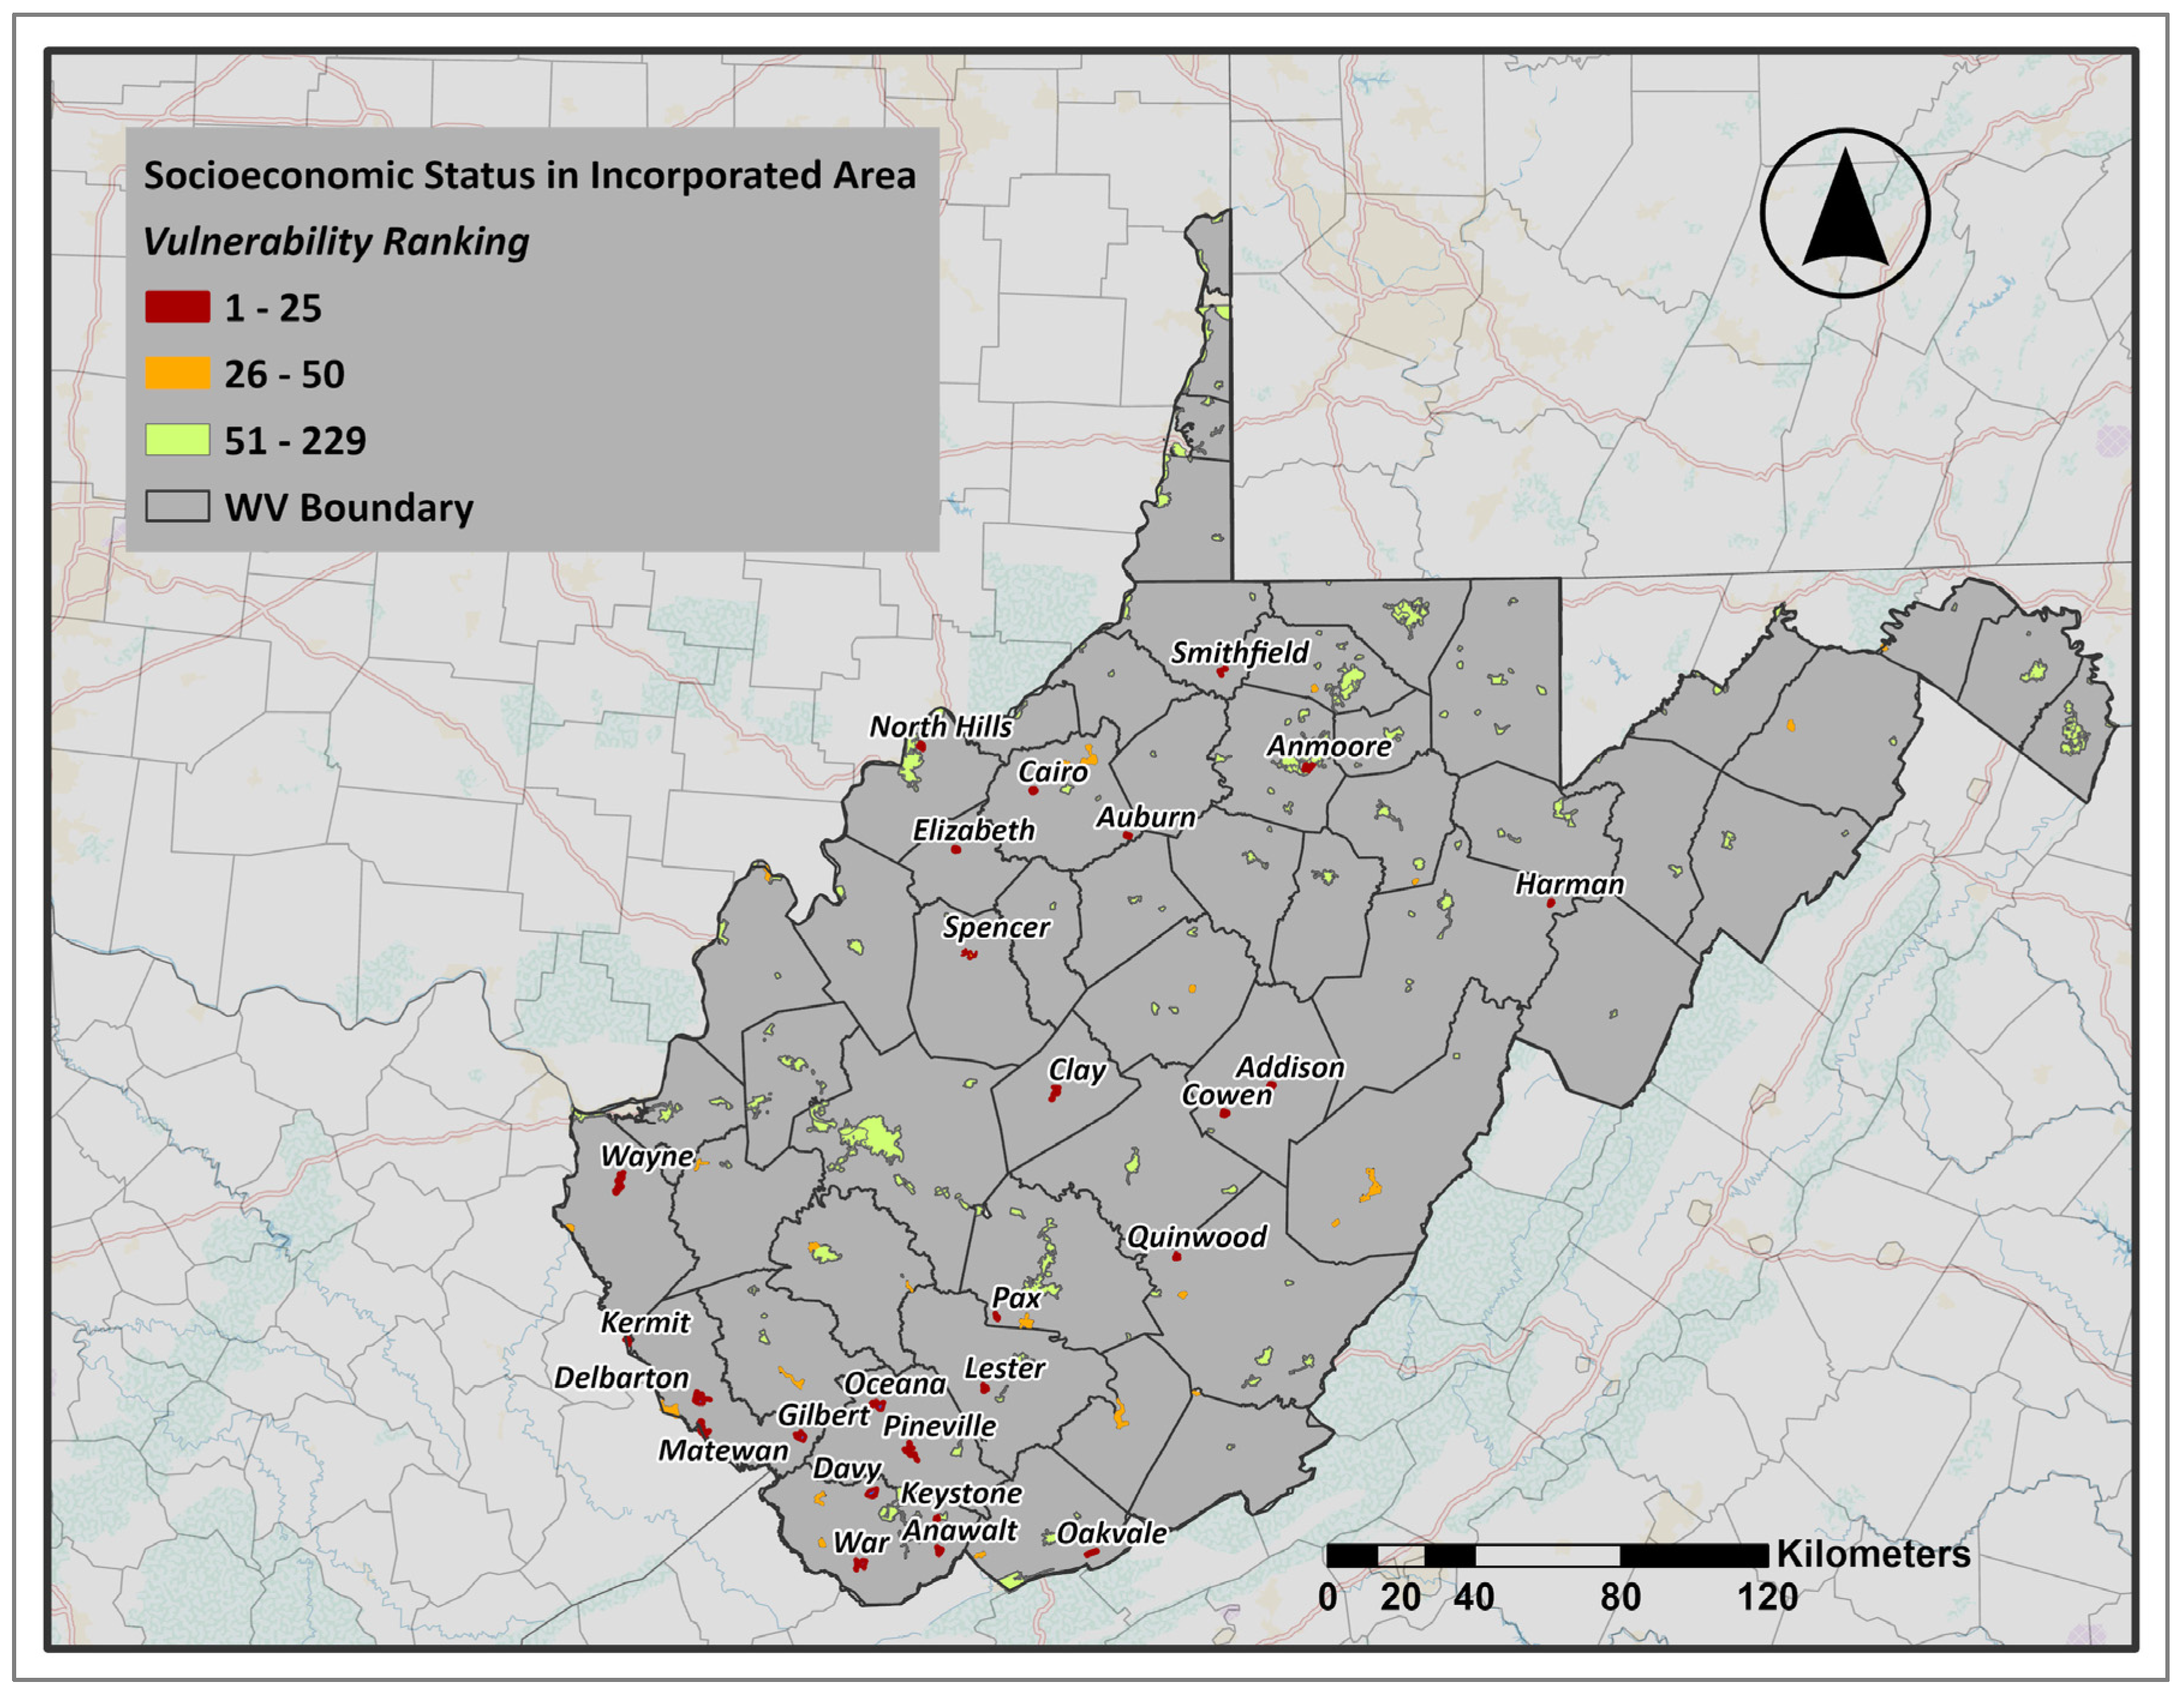
The analysis of incorporated areas in West Virginia reveals notable disparities in socioeconomic vulnerability across communities (Figure 2). The ranking results indicate that North Hills (Wood County), Auburn (Ritchie County), Anwalt (McDowell County), Matewan (Mingo County), and Delbarton (Mingo County) exhibit the highest levels of socioeconomic vulnerability. In contrast, communities such as Thurmond (Fayette County), Glenville (Gilmer County), Bridgeport (Harrison County), Harpers Ferry (Jefferson County), and Bolivar (Jefferson County) demonstrate the lowest levels of socioeconomic vulnerability, suggesting comparatively stronger socioeconomic conditions and greater adaptive capacity.
Figure 2.
Socioeconomic Vulnerability Ranking in Incorporated Areas. (Figures are original and created by the authors).
These findings highlight the uneven distribution of vulnerability across the state’s incorporated areas. Notably, many of the most vulnerable areas are located in the southern part of the state, aligning with broader regional patterns seen in later analysis stages. This suggests that incorporated communities with high socioeconomic vulnerability are not evenly spread but tend to cluster in southern regions. It highlights a wider spatial divide that becomes more evident when comparing with unincorporated areas.
3.2. Socioeconomic Vulnerability in Unincorporated Areas
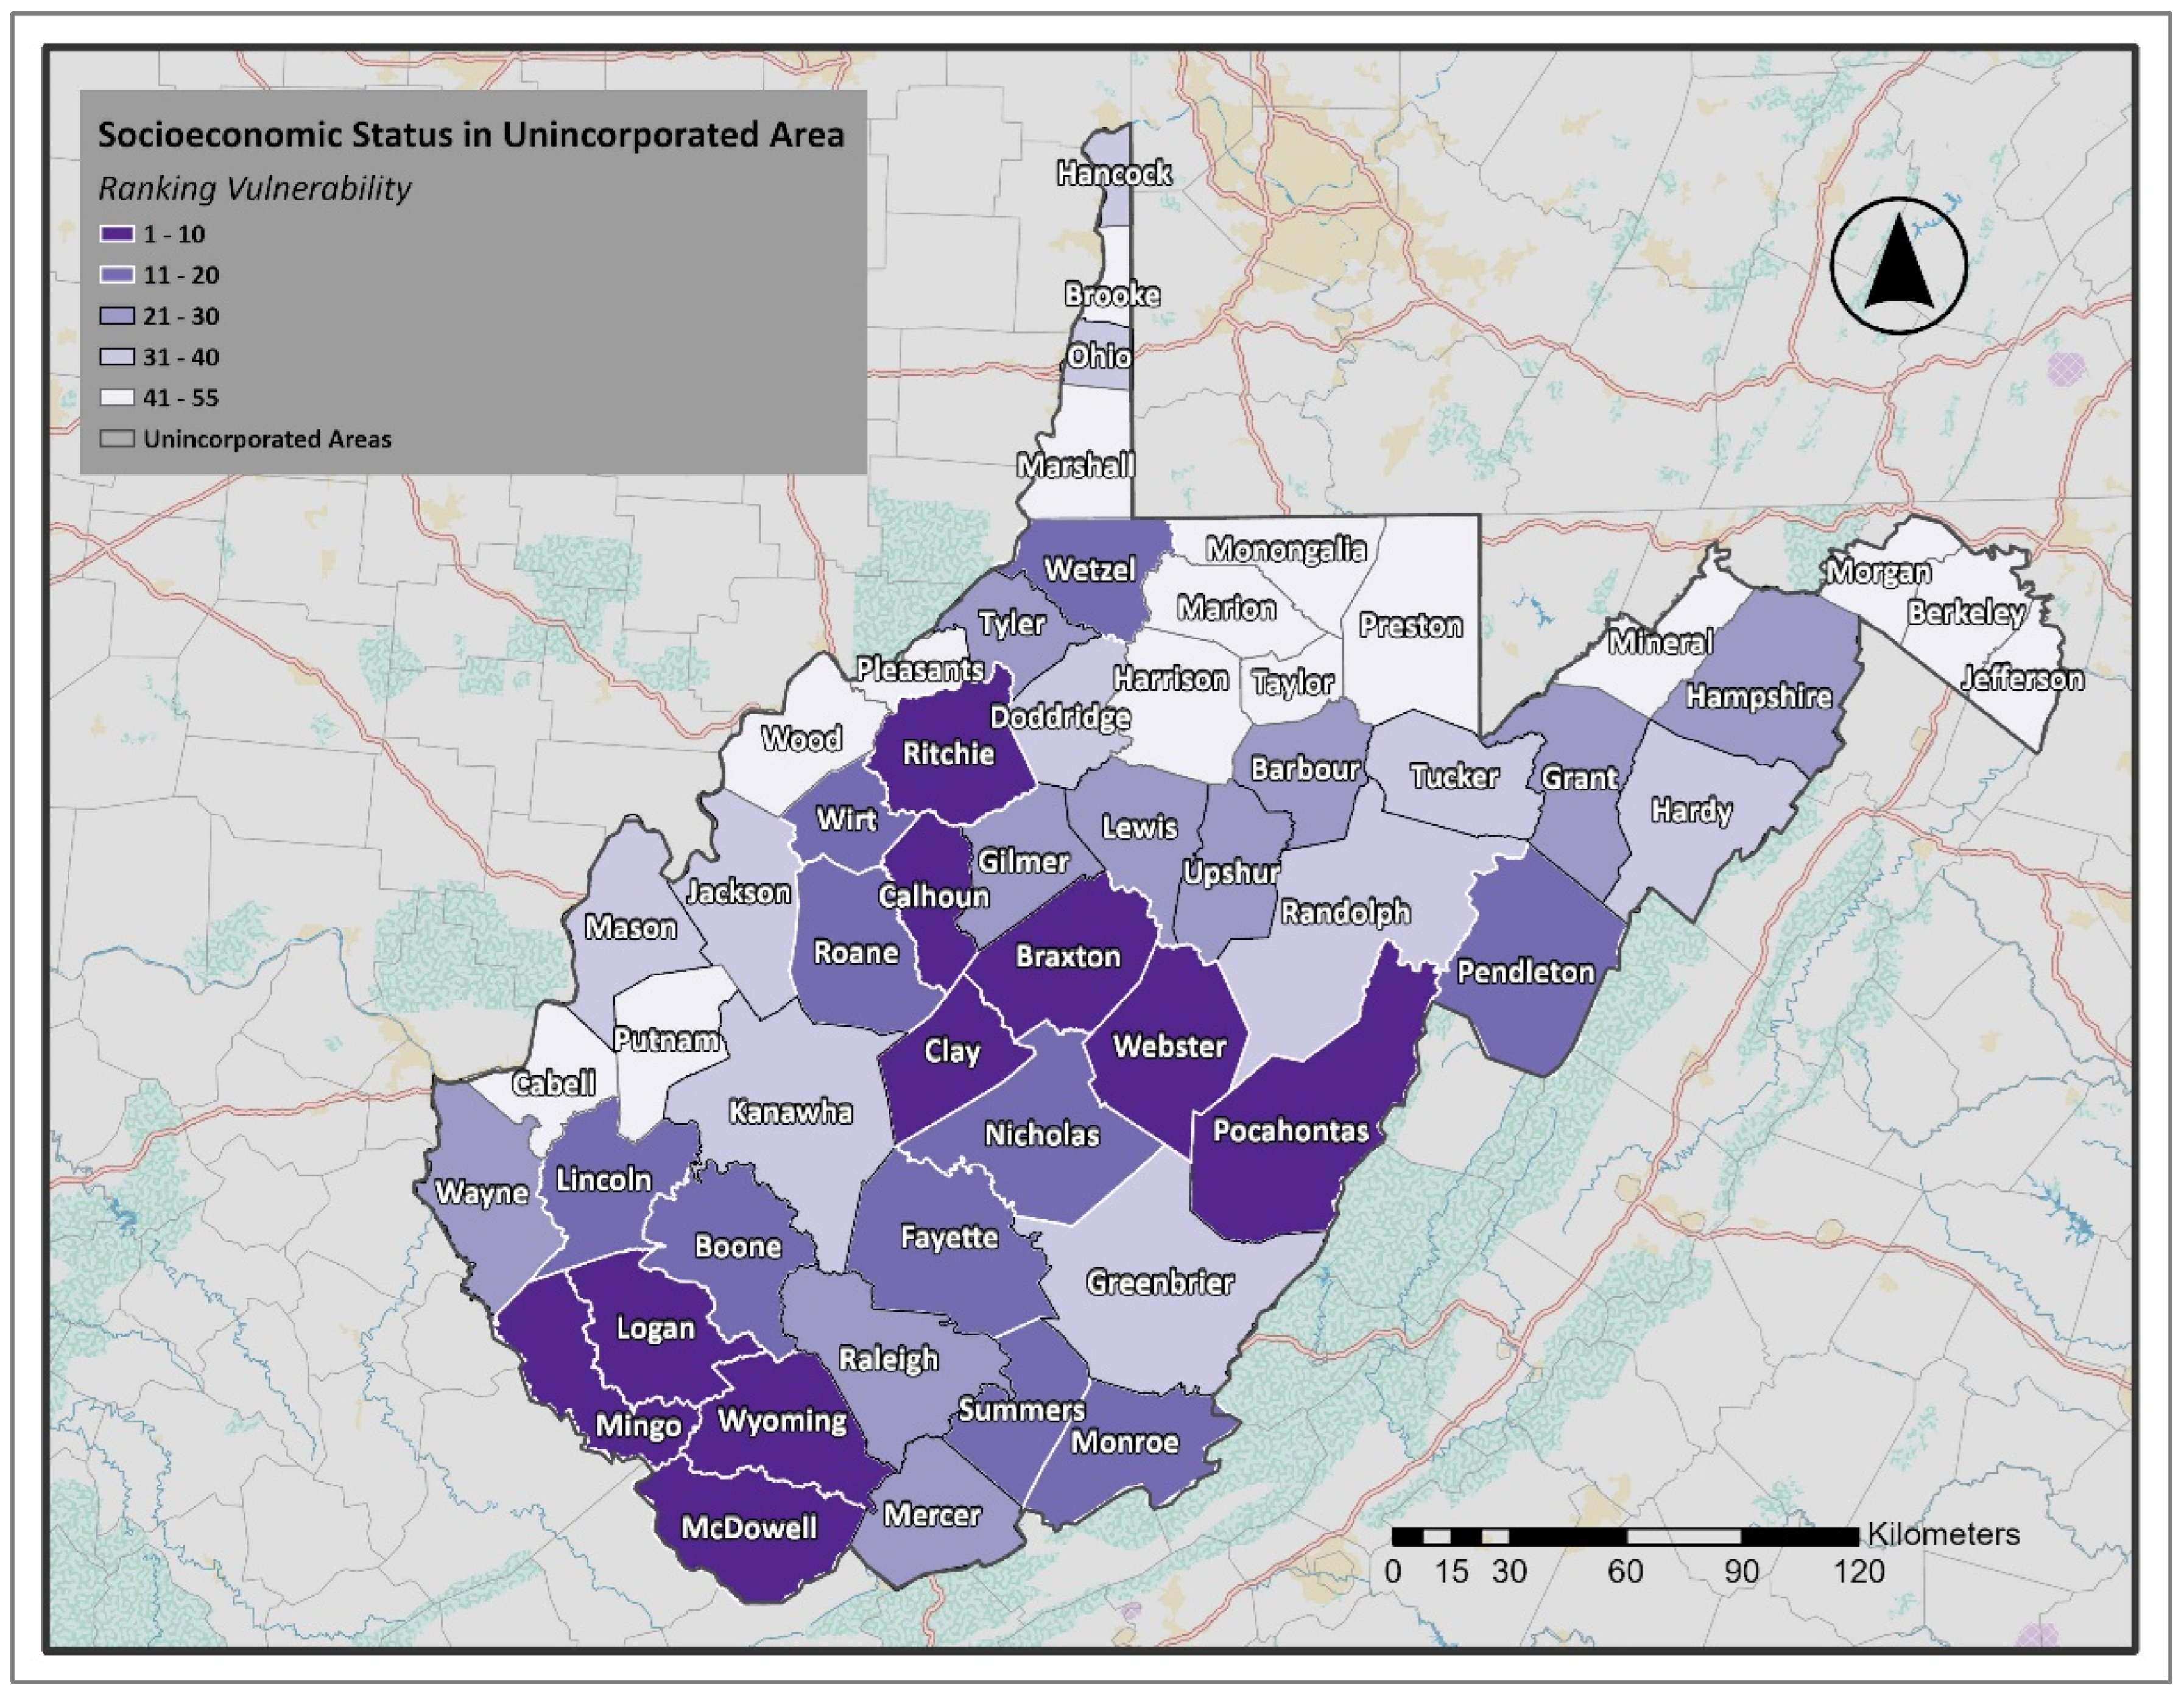
The map (Figure 3) illustrates the socioeconomic vulnerability of unincorporated areas in West Virginia. The results show a clear ranking pattern across counties. The highest vulnerability levels are observed in McDowell, Webster, Clay, Pocahontas, and Mingo Counties (ranks 1–5), closely followed by Calhoun, Braxton, Wyoming, Logan, and Ritchie Counties (ranks 6–10). These counties are among the most vulnerable, reflecting weaker socioeconomic conditions. At the other end of the spectrum, the least vulnerable unincorporated areas include Berkeley, Monongalia, Jefferson, Putnam, and Marion Counties (ranks 51–55), which are characterized by a stronger socioeconomic standing relative to the rest of the state. As illustrated in Figure 3, the spatial distribution of socioeconomic vulnerability demonstrates that the most at-risk unincorporated areas are primarily located in the southern counties. In contrast, the least vulnerable are concentrated in the northeastern and north-central regions. This geographic divide reinforces the broader trend observed in the incorporated analysis, where southern West Virginia communities exhibit greater socioeconomic vulnerability.
Figure 3.
Socioeconomic Vulnerability Index in WV Unincorporated Areas. (Figures are original and created by the authors).
3.3. Assessing Flood Vulnerability
After identifying vulnerable socioeconomic areas in West Virginia, we used data from the WVGISTC, which includes details on over 98,000 floodplain structures, to evaluate the flood risk of these high-risk incorporated and unincorporated areas. For this analysis, we examined data on the ratio of residential buildings and mobile homes in the 100-year floodplain and the number of essential facilities within the floodplain.
3.3.1. Residential Exposure and Housing Vulnerability
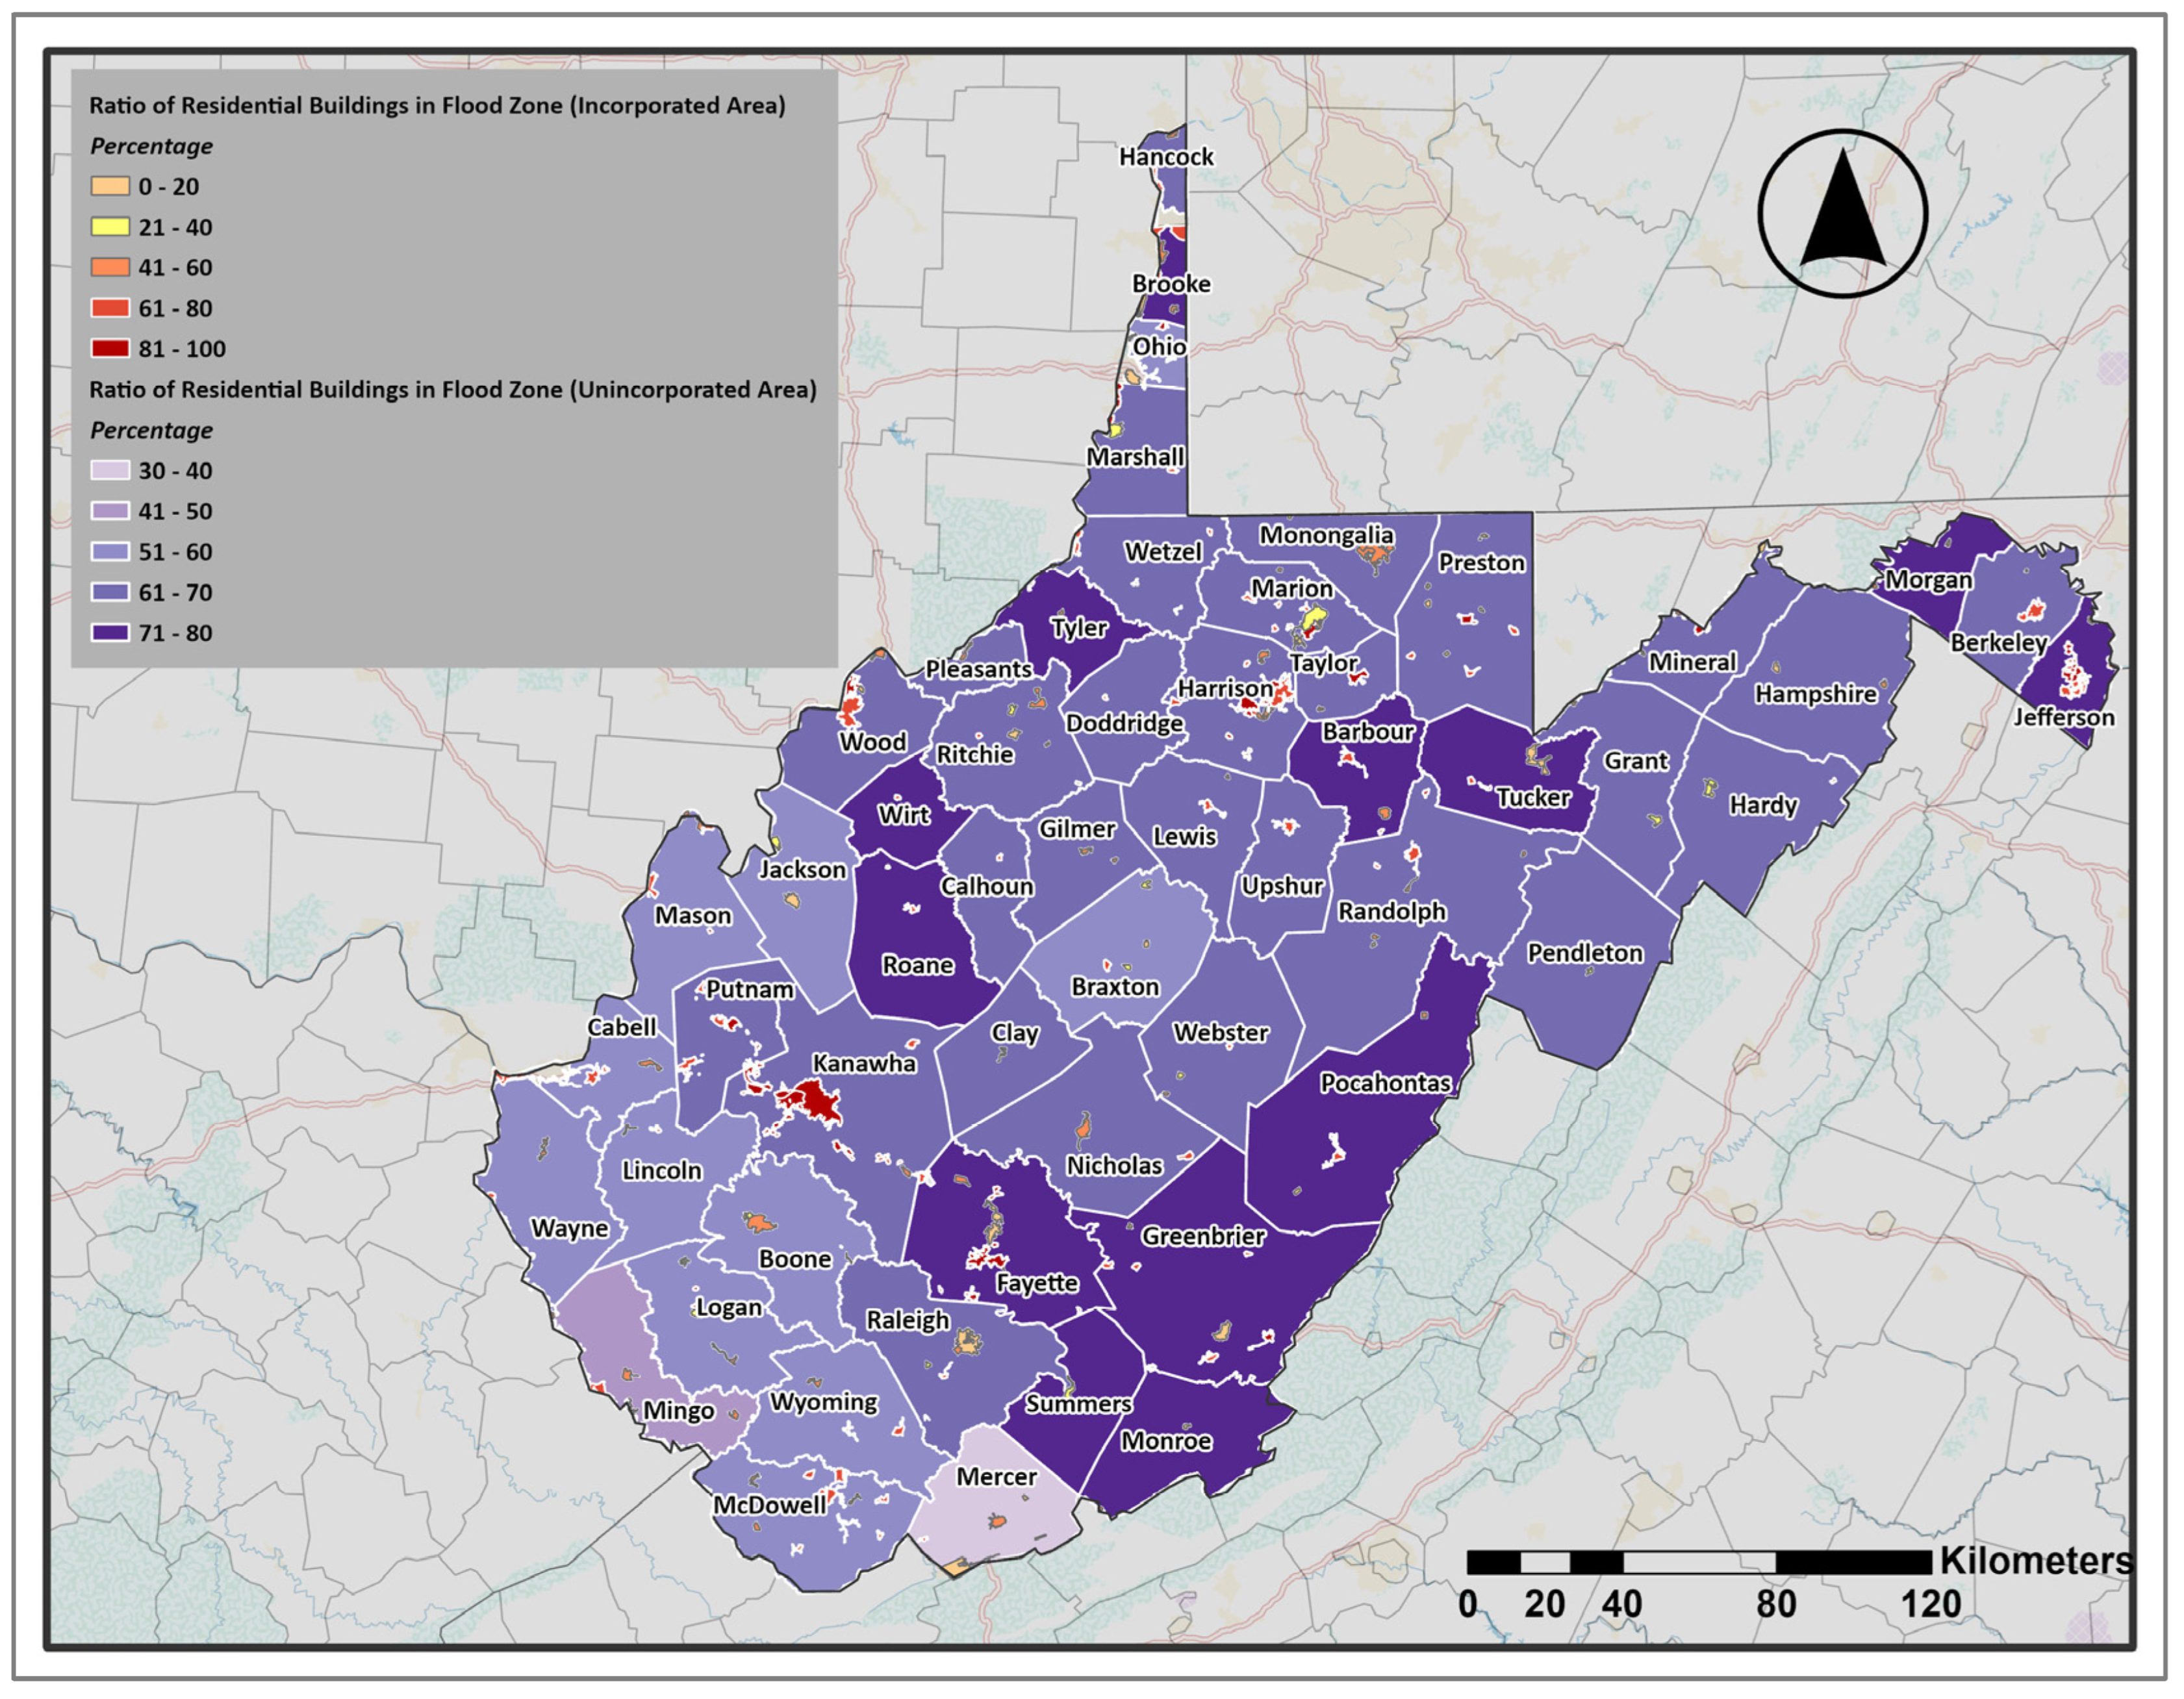
The ratio of residential buildings (Figure 4) illustrates the proportion of residential structures within the 100-year flood zone relative to all buildings in the flood zone. By residential buildings, we mean all the residential buildings excluding temporary lodgings, institutional dormitories, nursing homes, and manufactured homes. Manufactured homes will be discussed in the next section, and nursing homes will be categorized as essential facilities. In unincorporated areas, the highest concentrations are observed in the eastern counties, with Jefferson, Morgan, and Pocahontas standing out, as well as several central counties, including Fayette and Roane. Conversely, the southern counties, including Mercer and Mingo, show lower ratios, though vulnerability remains. The pattern suggests that residential exposure in unincorporated areas is not random but tends to cluster, especially in the eastern and central regions.
Figure 4.
Ratio of Residential Buildings Located in the Floodplain. (Figures are original and created by the authors).
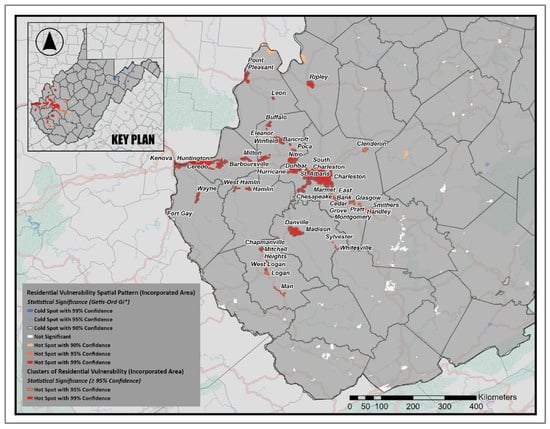
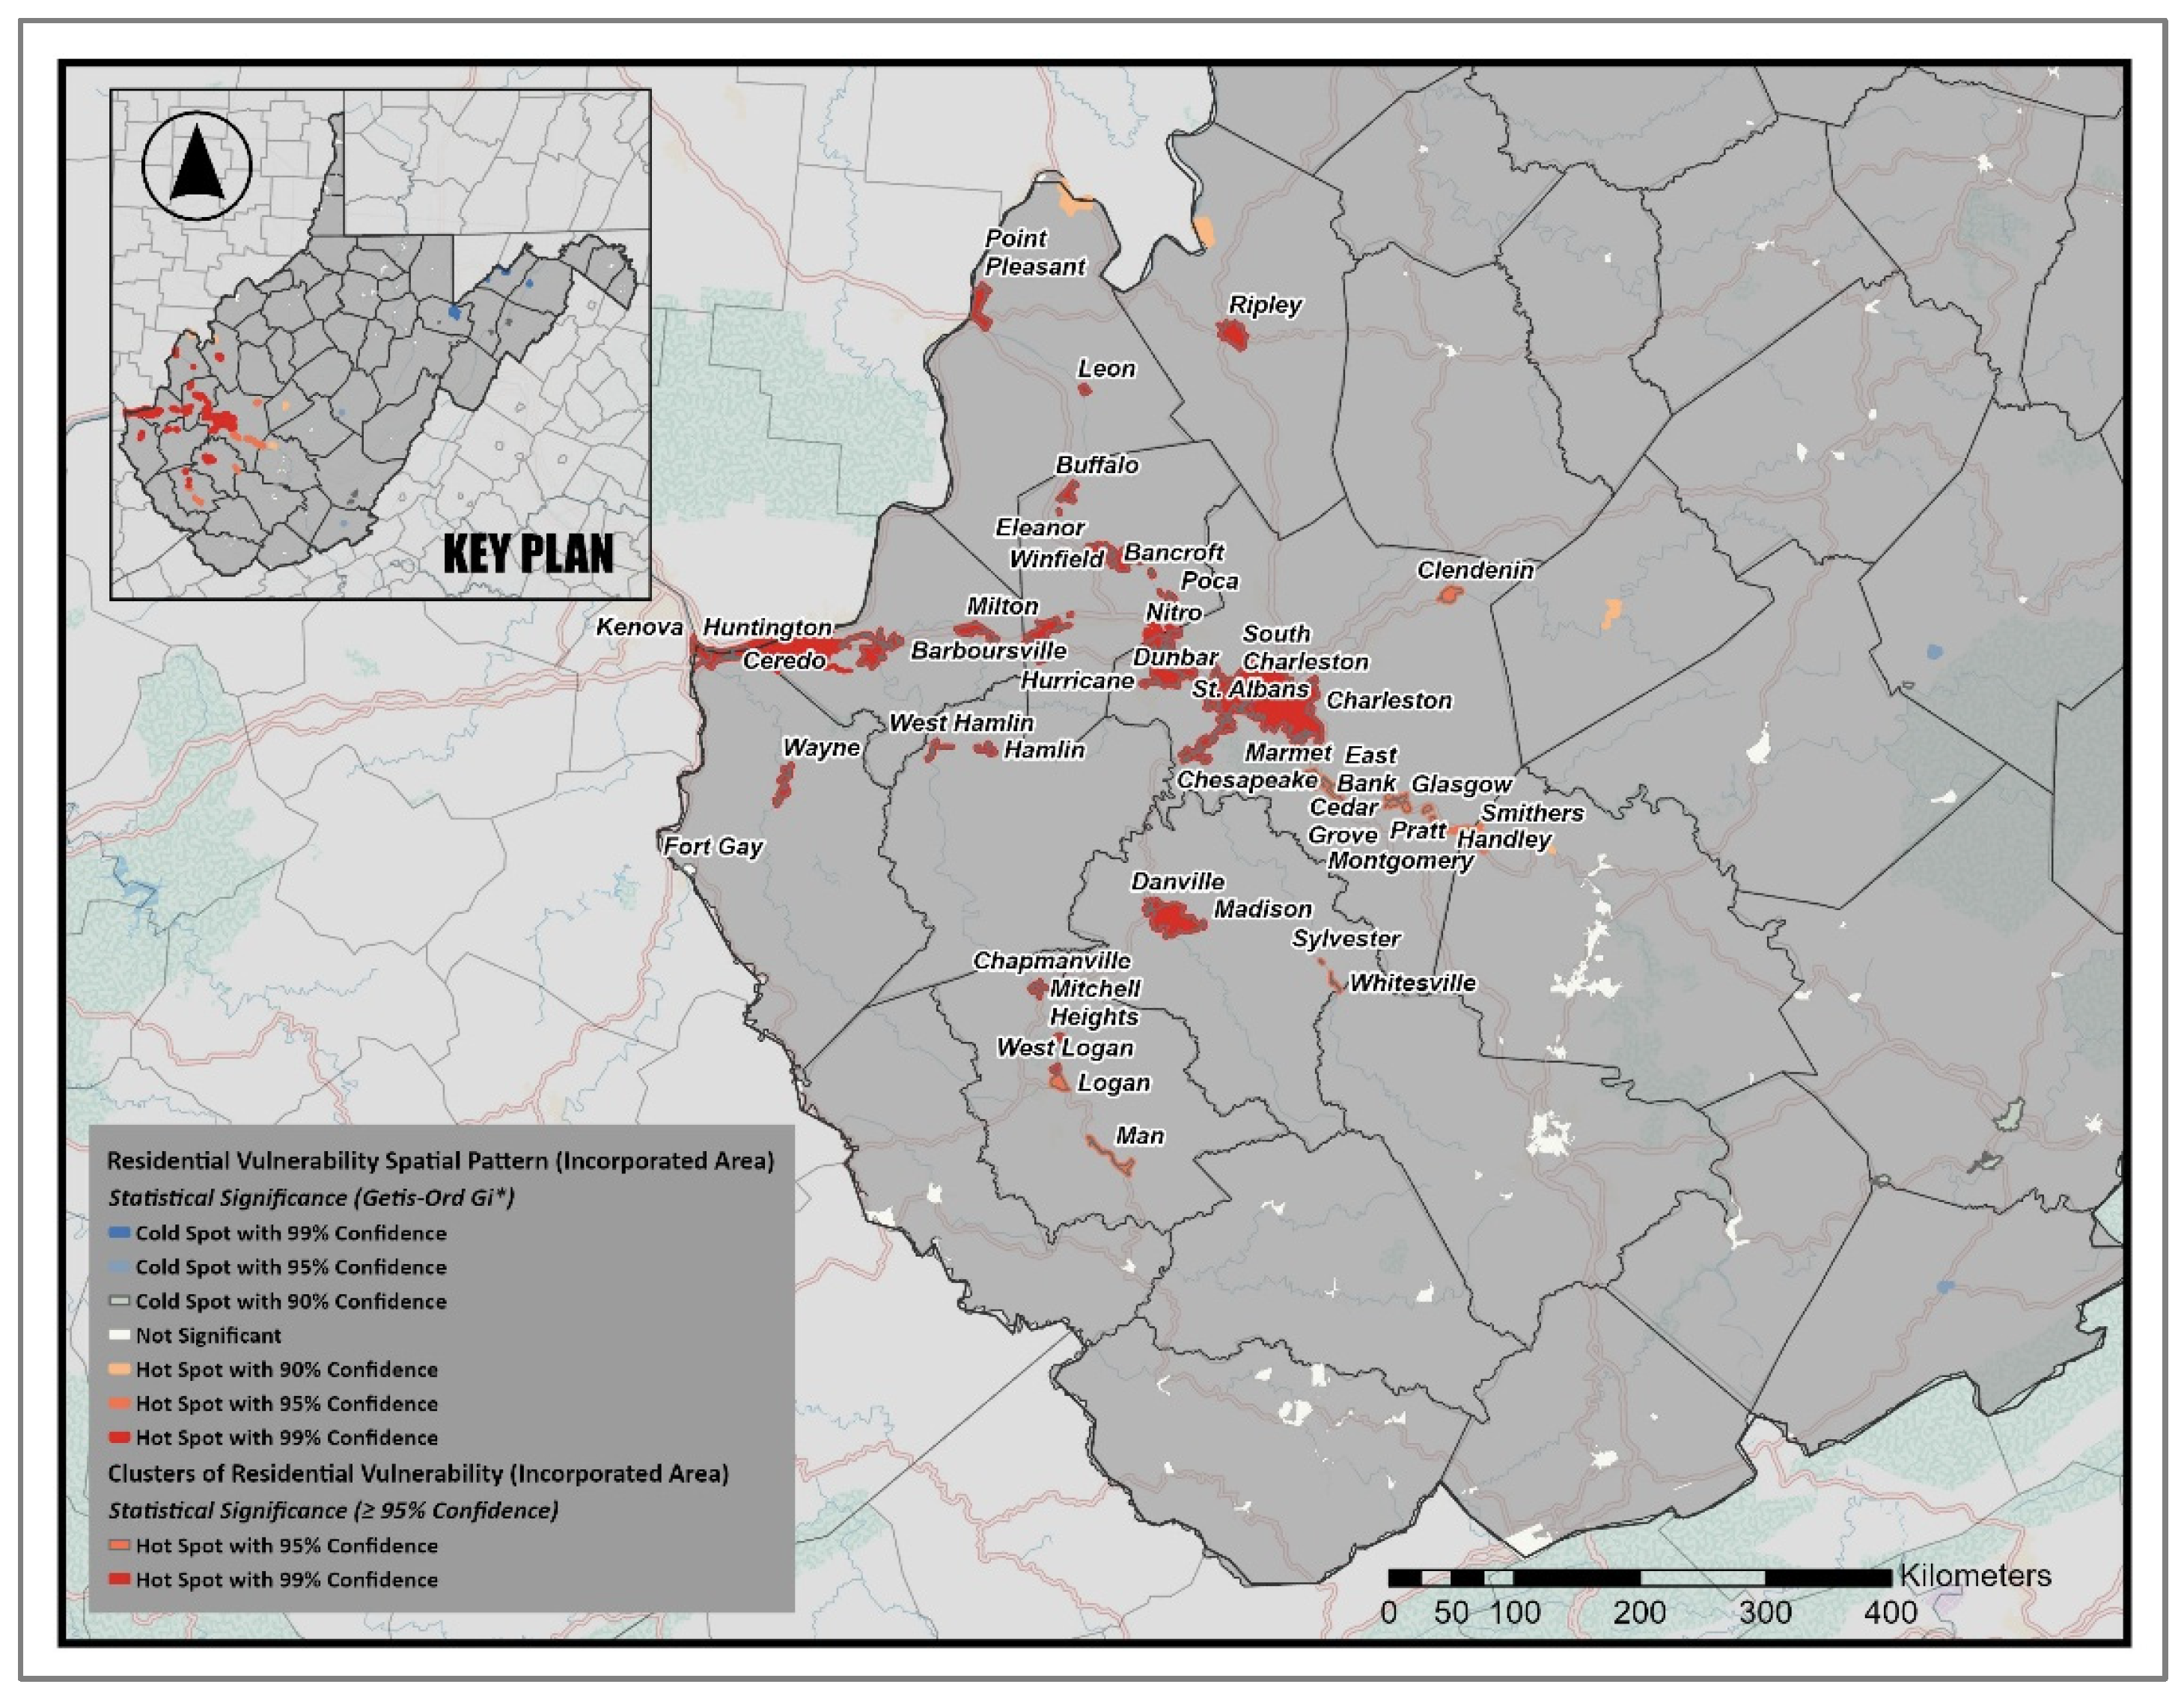
In incorporated areas, the pattern is even more noticeable. Many small towns and cities are nearly entirely located within the mapped floodplain, with ratios approaching 100 percent. To explore the distribution pattern, a Hot Spot Analysis (Getis-Ord Gi*) was employed to identify statistically significant clusters of high and low ratios of residential buildings within the floodplain. This analysis highlights where vulnerability is spatially concentrated (Figure 5). The findings reveal several strong hot spots (95–99% confidence) along the Kanawha, Guyandotte, and Ohio River valleys, highlighting dense clusters of residential flood vulnerability in Charleston, St. Albans, and Huntington. In total, 48 incorporated communities, about 21 percent of all incorporated areas, were identified as statistically significant hot spots at the 95 percent confidence level or higher. Conversely, cold-spot areas, which have notably lower vulnerability levels, are primarily located in higher-elevation counties in central and northeastern West Virginia.
Figure 5.
Statistically Significant Clusters of Residential Flood Vulnerability (Getis-Ord Gi* Hot Spots, 95–99% Confidence). (Figures are original and created by the authors).
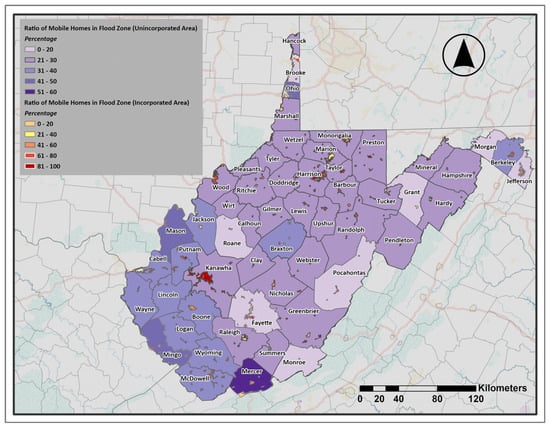
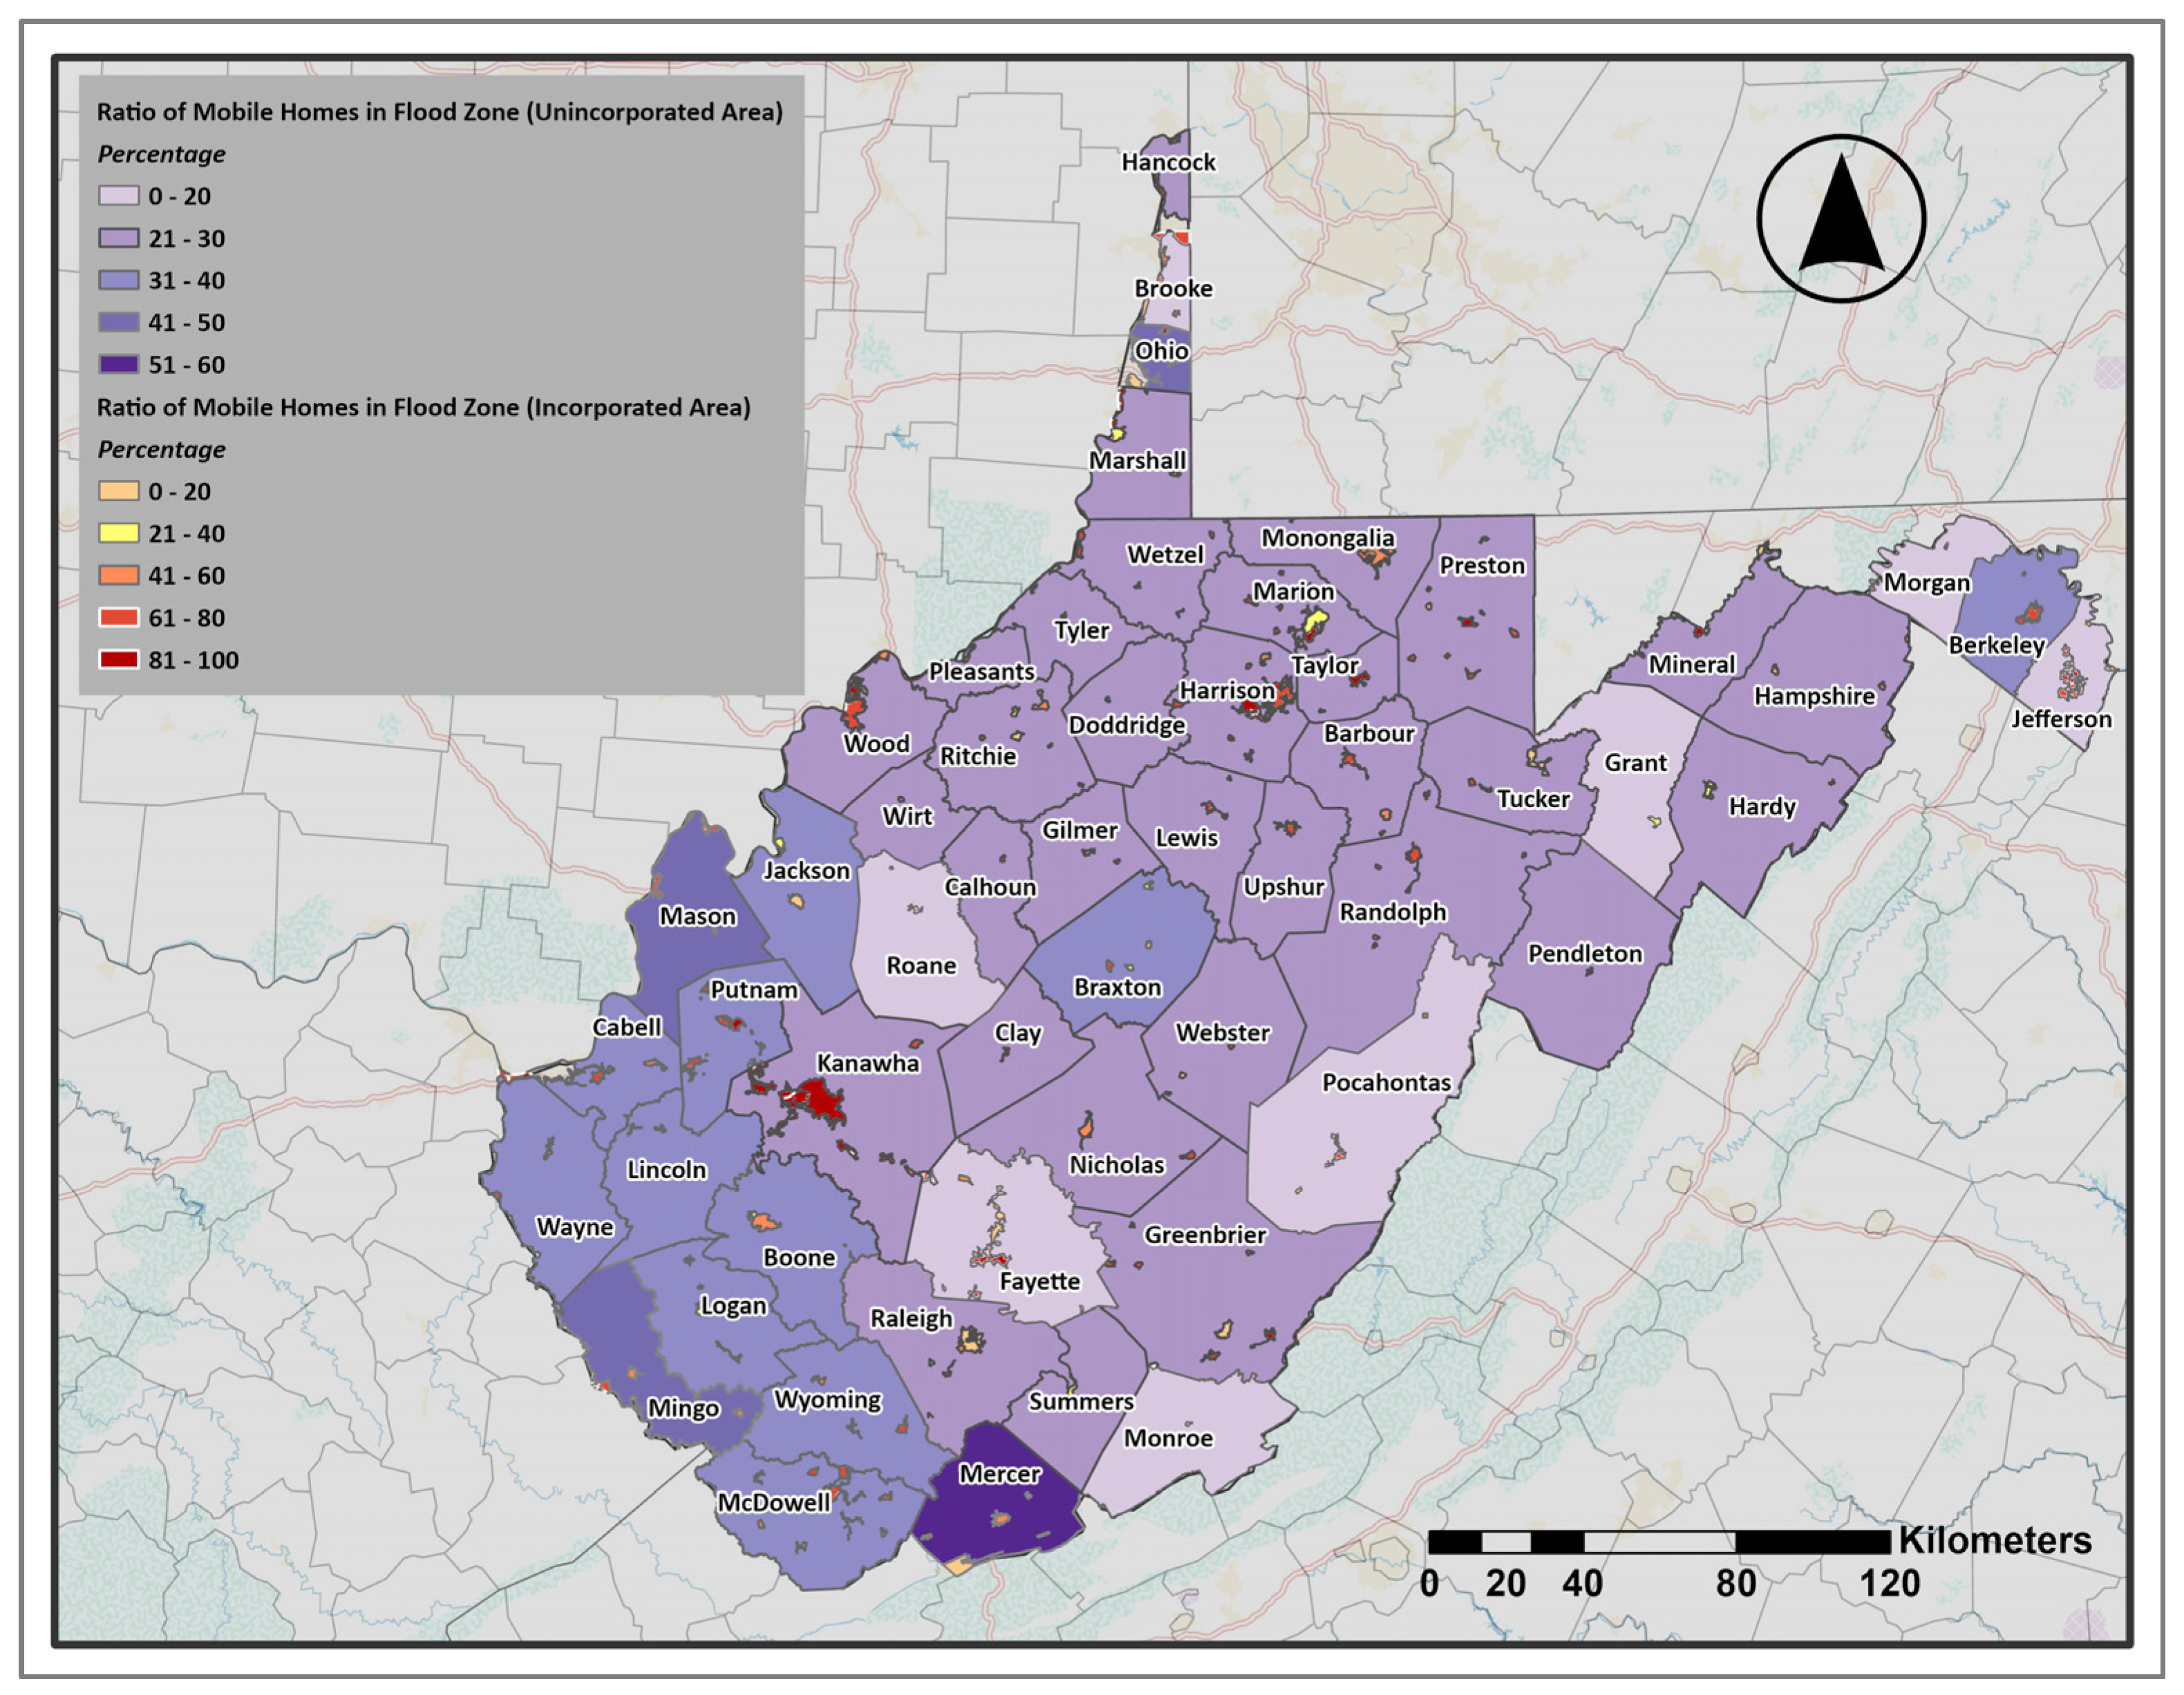
Manufactured homes represent a particularly important housing category in flood vulnerability studies because they are often more susceptible to flood damage and are more prevalent in lower-income and rural areas. Figure 6 shows the ratio of mobile homes to all buildings within the 100-year flood zone. In unincorporated areas, the highest ratios are found in the southern counties, especially Mercer, Mingo, Lincoln, and Mason, where mobile homes account for more than 30 percent of the buildings in the floodplain. In contrast, the eastern and part of the northern counties have lower ratios, often below 20 percent. This pattern indicates that mobile home exposure in the flood zone is mainly concentrated in the southern part of the state. In incorporated areas, the pattern is more scattered and often tied to individual towns. The map shows some places with very high percentages, even above 50 or 60 percent. At the same time, many incorporated places show much lower percentages, below 20 percent. Overall, the results highlight that in incorporated areas, the ratio of mobile homes in the floodplain varies widely from town to town. In contrast, in unincorporated areas, the concentrations are clearly clustered in the south.
Figure 6.
Ratio of Mobile Homes Located in the Floodplain. (Figures are original and created by the authors).
3.3.2. Exposure of Essential Facilities, Community Assets, and Transportation Infrastructure
Some facilities are critical for public safety and emergency response. Therefore, even a small risk of flooding can threaten community safety. According to FEMA [49], important facilities such as hospitals and fire and police stations require special attention when creating floodplain rules and management plans. These facilities must be protected to higher standards because their operation is crucial during and after disasters. Under Executive Order 11988 on Floodplain Management, federal agencies that fund or approve such facilities must either avoid placing them in the 0.2 percent annual chance floodplain (also called the 500-year floodplain) or ensure they are built to handle flooding up to that level. In this research, we included hospitals, schools, nursing homes, fire stations, police stations, and E911 centers as essential facilities.
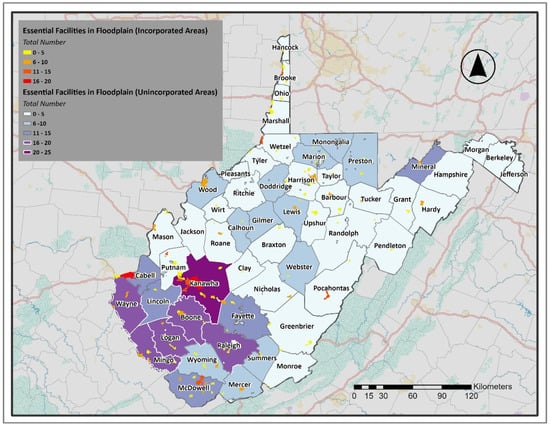
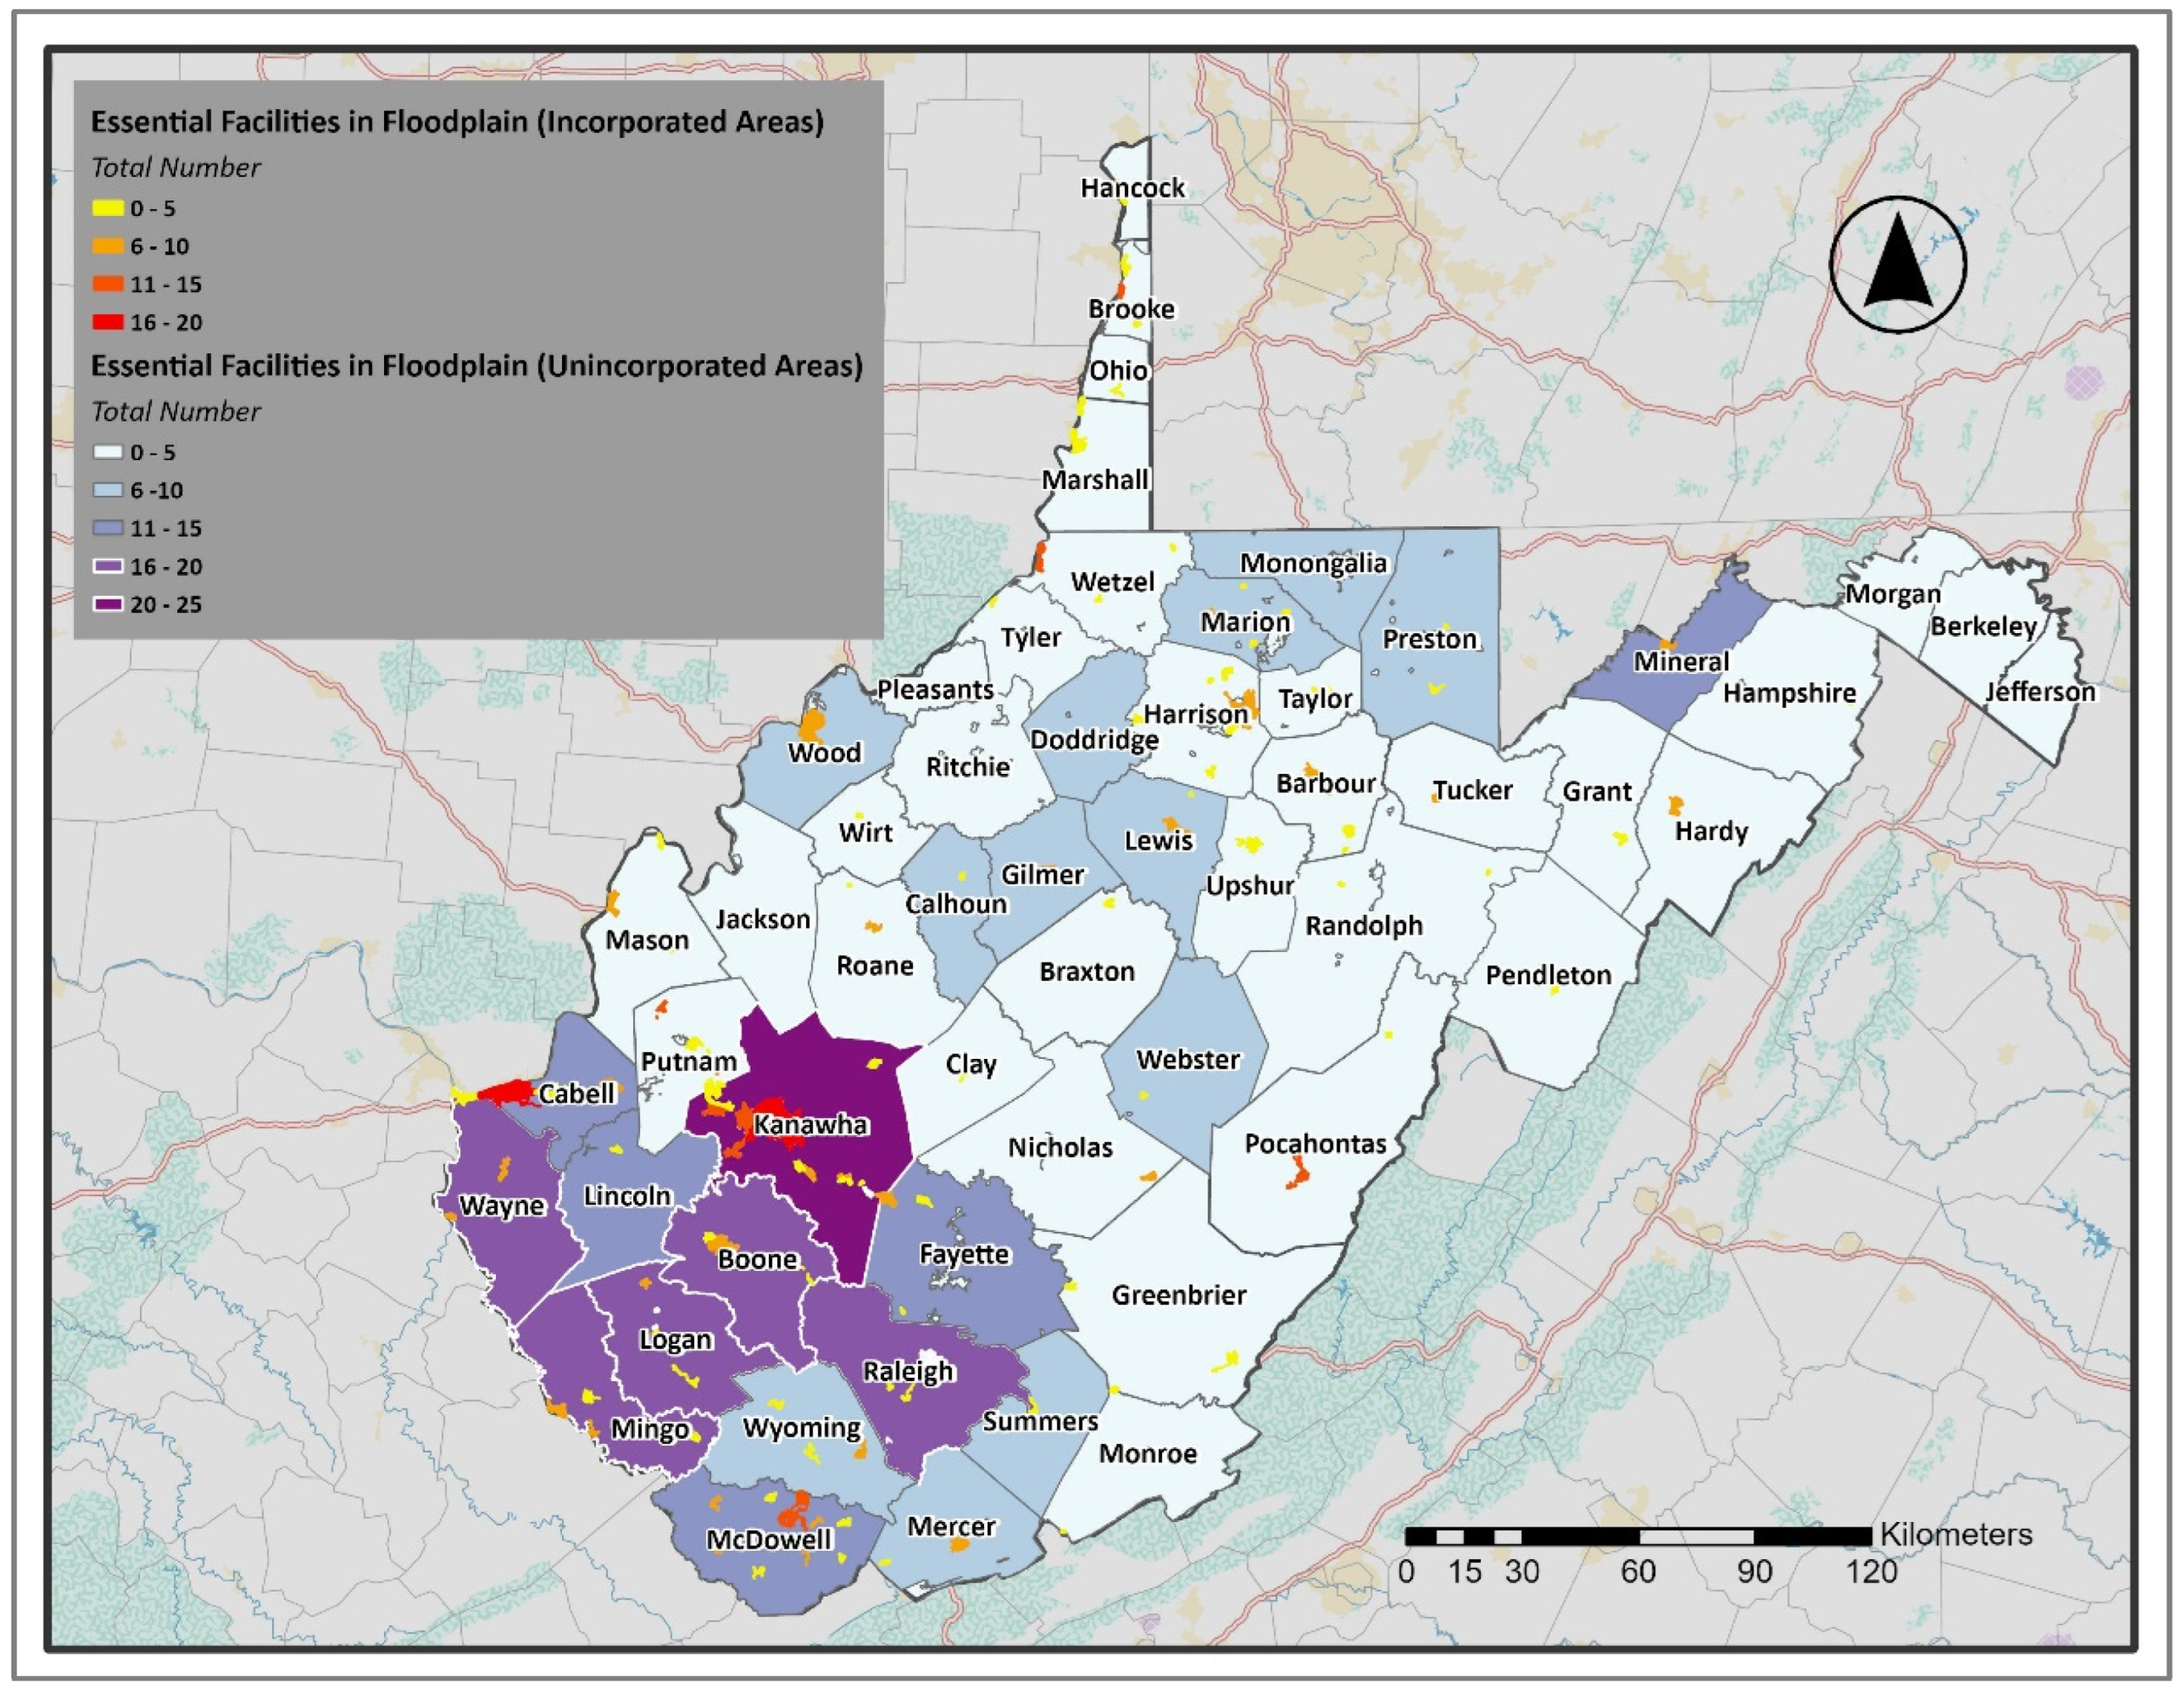
Figure 7 presents the distribution of essential facilities located within the 100-year and 500-year floodplains. In unincorporated areas, the largest concentrations appear in the southwestern counties, particularly Kanawha, Logan, Boone, and Mingo. Kanawha County stands out with more than twenty facilities exposed. In contrast, many of the northern and eastern counties have very few facilities in the floodplain, often fewer than five, which shows a limited number of direct exposures in those regions.
Figure 7.
The Number of Essential Facilities in 100-year and 500-year Flood Zones. (Figures are original and created by the authors).
In incorporated areas, the pattern is scattered but still notable. Larger urban centers, such as Charleston (located in Kanawha County), have a significant number of essential facilities within the mapped floodplain, with around twenty in this area. Other mid-sized towns also show multiple exposed facilities. Smaller incorporated towns generally contain only a handful of facilities in the flood zone; however, even a single critical building, such as a hospital or fire station, can pose a considerable risk during a disaster. Overall, the results demonstrate that the exposure of essential facilities to flooding is not evenly distributed. The highest concentrations are found in southern and southwestern counties and in major incorporated centers, while many rural and eastern counties have limited direct exposure.
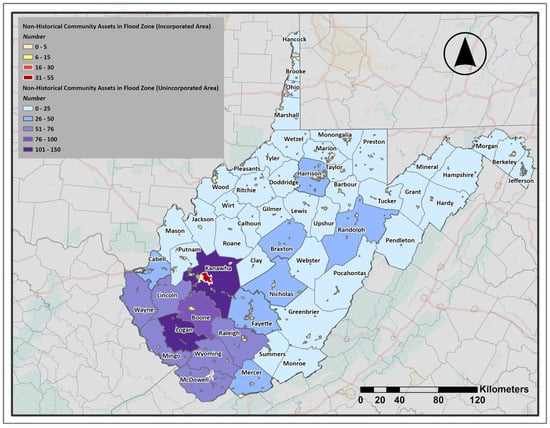
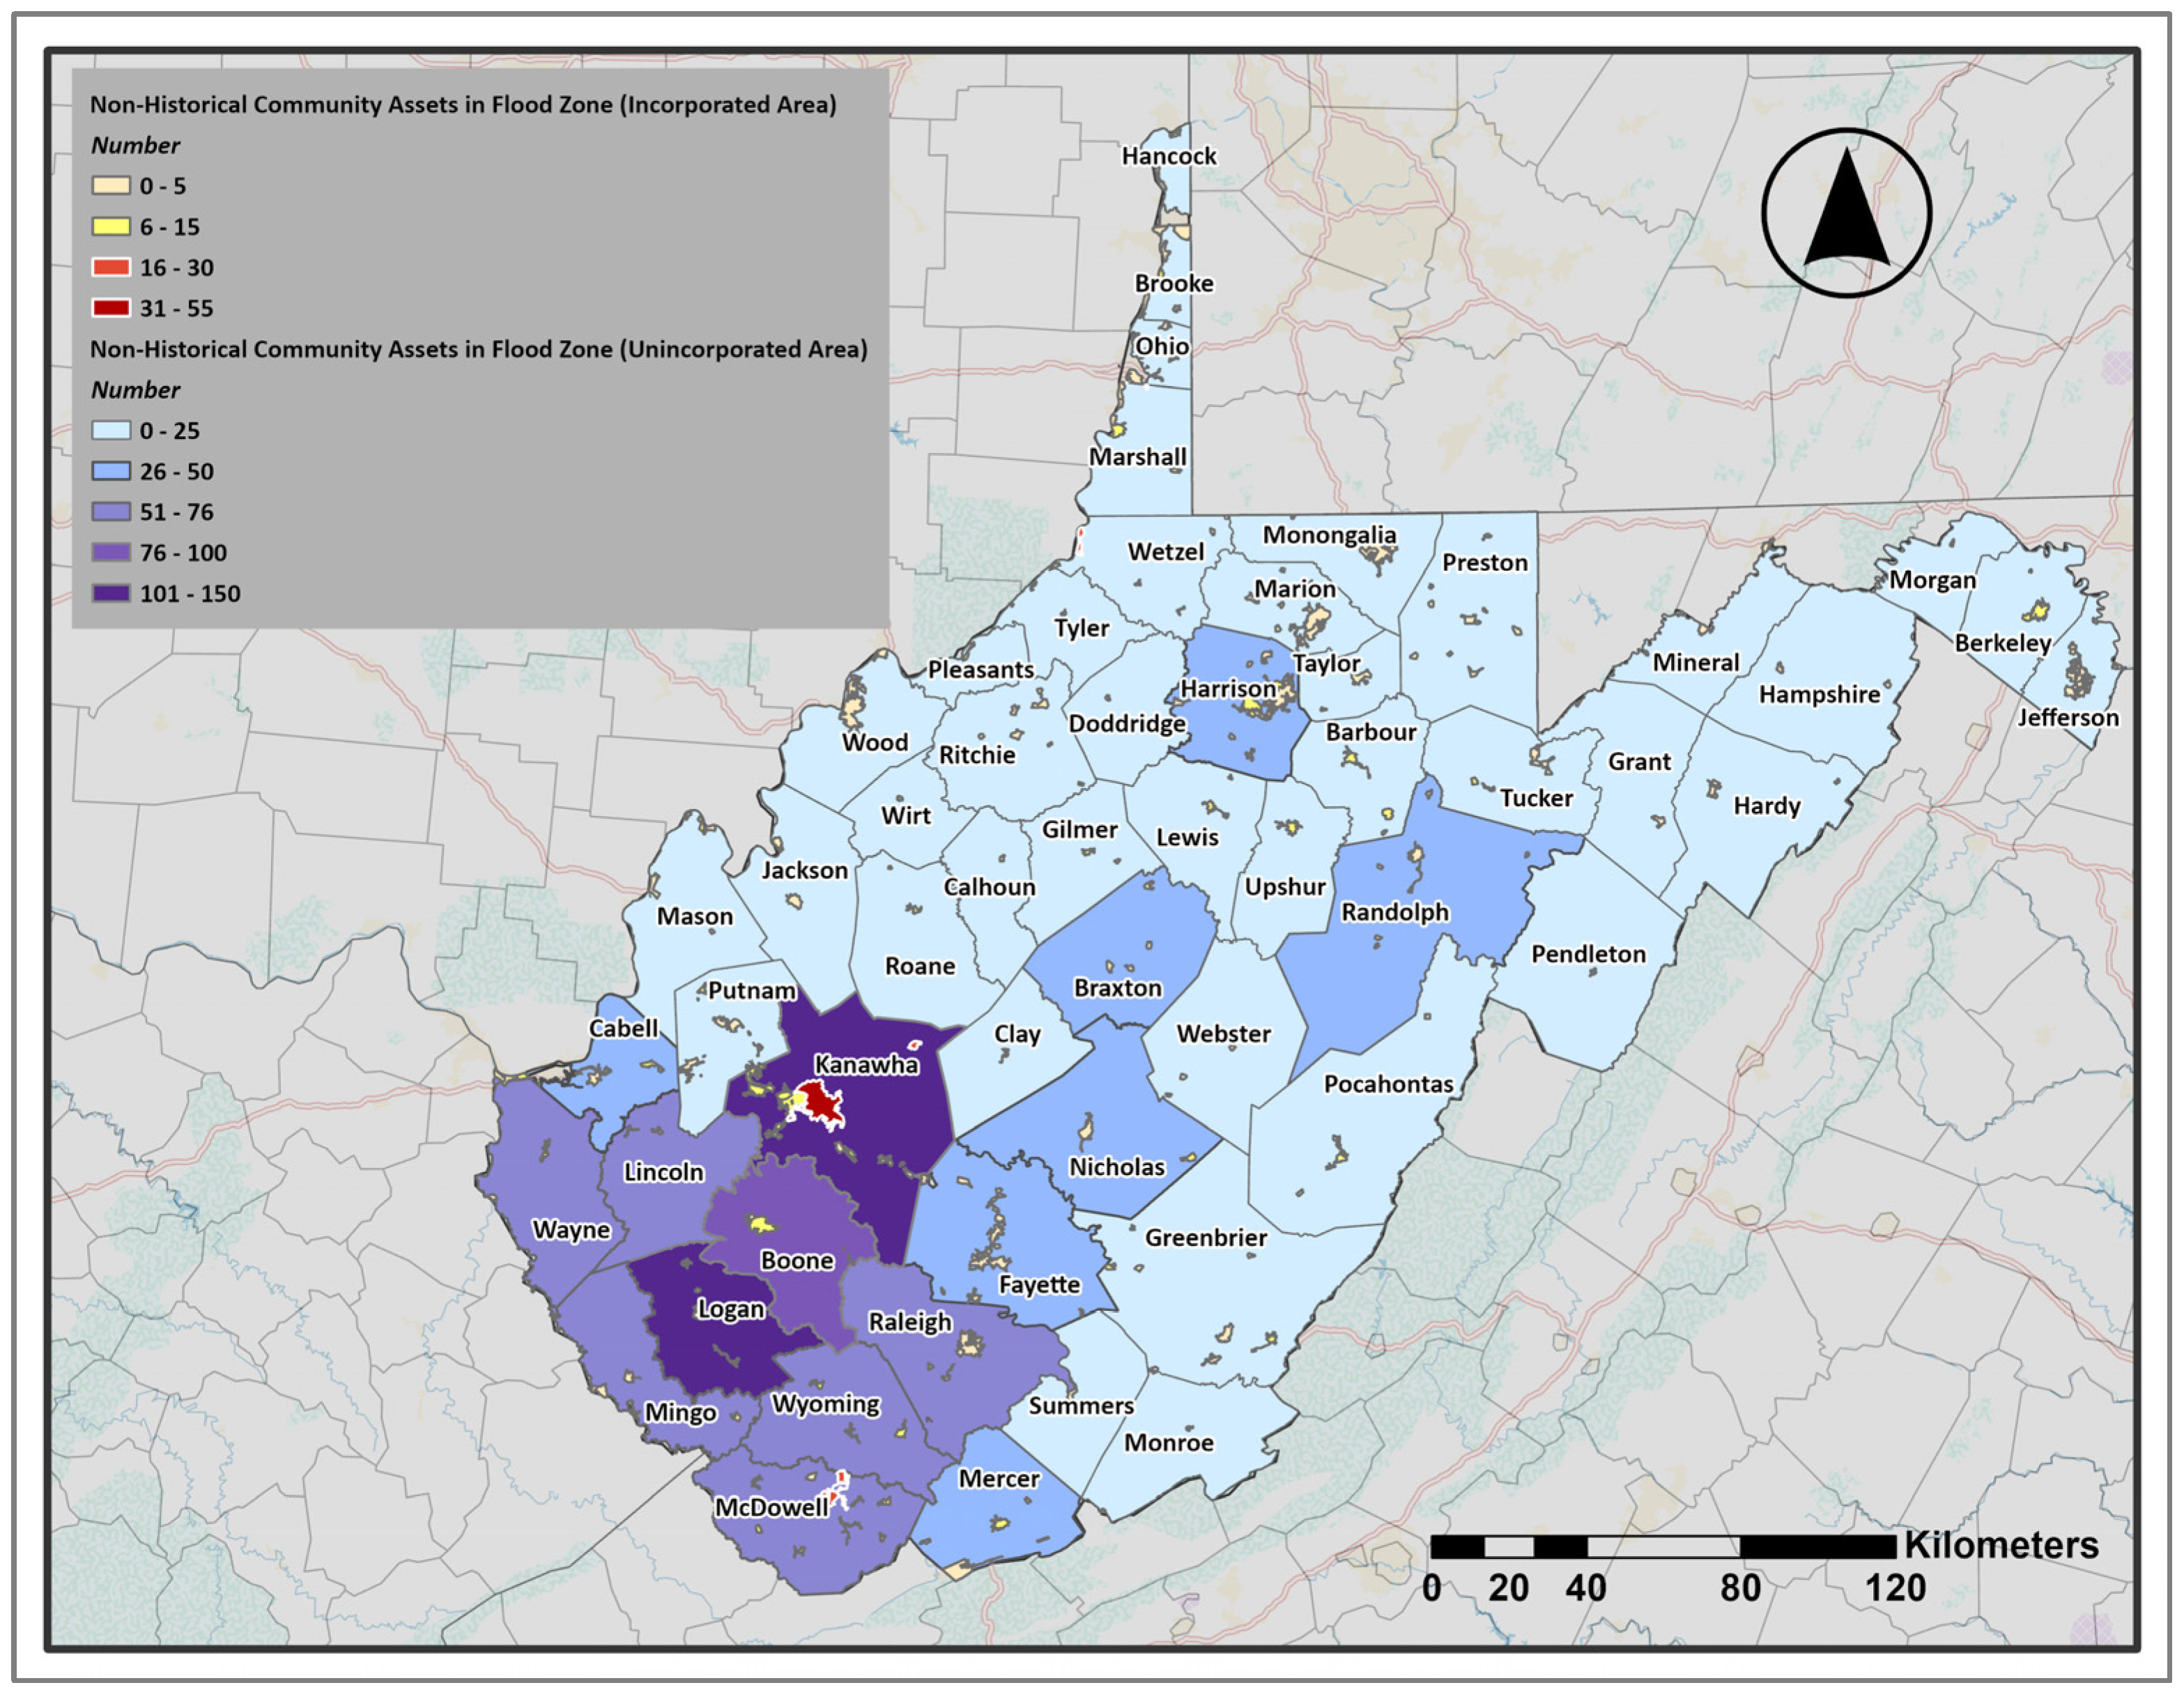
A similar pattern is observed in the distribution of non-historical community assets. In this study, non-historical community assets refer to critical structures that support daily community functions and services but are not considered historic. These include religious organizations, post-secondary educational facilities, government buildings, and utilities. Since these structures are linked to essential social and civic functions, flooding can cause significant disruptions for communities. The distribution of these assets in the floodplain (Figure 8) reveals clear differences between unincorporated and incorporated areas.
Figure 8.
The Number of Non-Historical Community Assets in 100-year Flood Zones. (Figures are original and created by the authors).
In unincorporated areas, the highest counts are mainly found in the southern part of the state. Kanawha County stands out with almost 150 assets in the flood zone. Other southern counties, like Boone and Logan, also have significant concentrations, while much of central and northern West Virginia has relatively few exposed assets. Incorporated communities, on the other hand, show smaller totals, although some individual towns still stand out. Charleston has the highest number, with over 50 assets in the floodplain. Most incorporated towns have smaller numbers, often fewer than ten. The overall pattern indicates that in unincorporated areas, vulnerable community assets are mostly clustered in the south. In contrast, in incorporated areas, the most significant vulnerable assets are associated with a few population centers that have higher concentrations of community facilities.
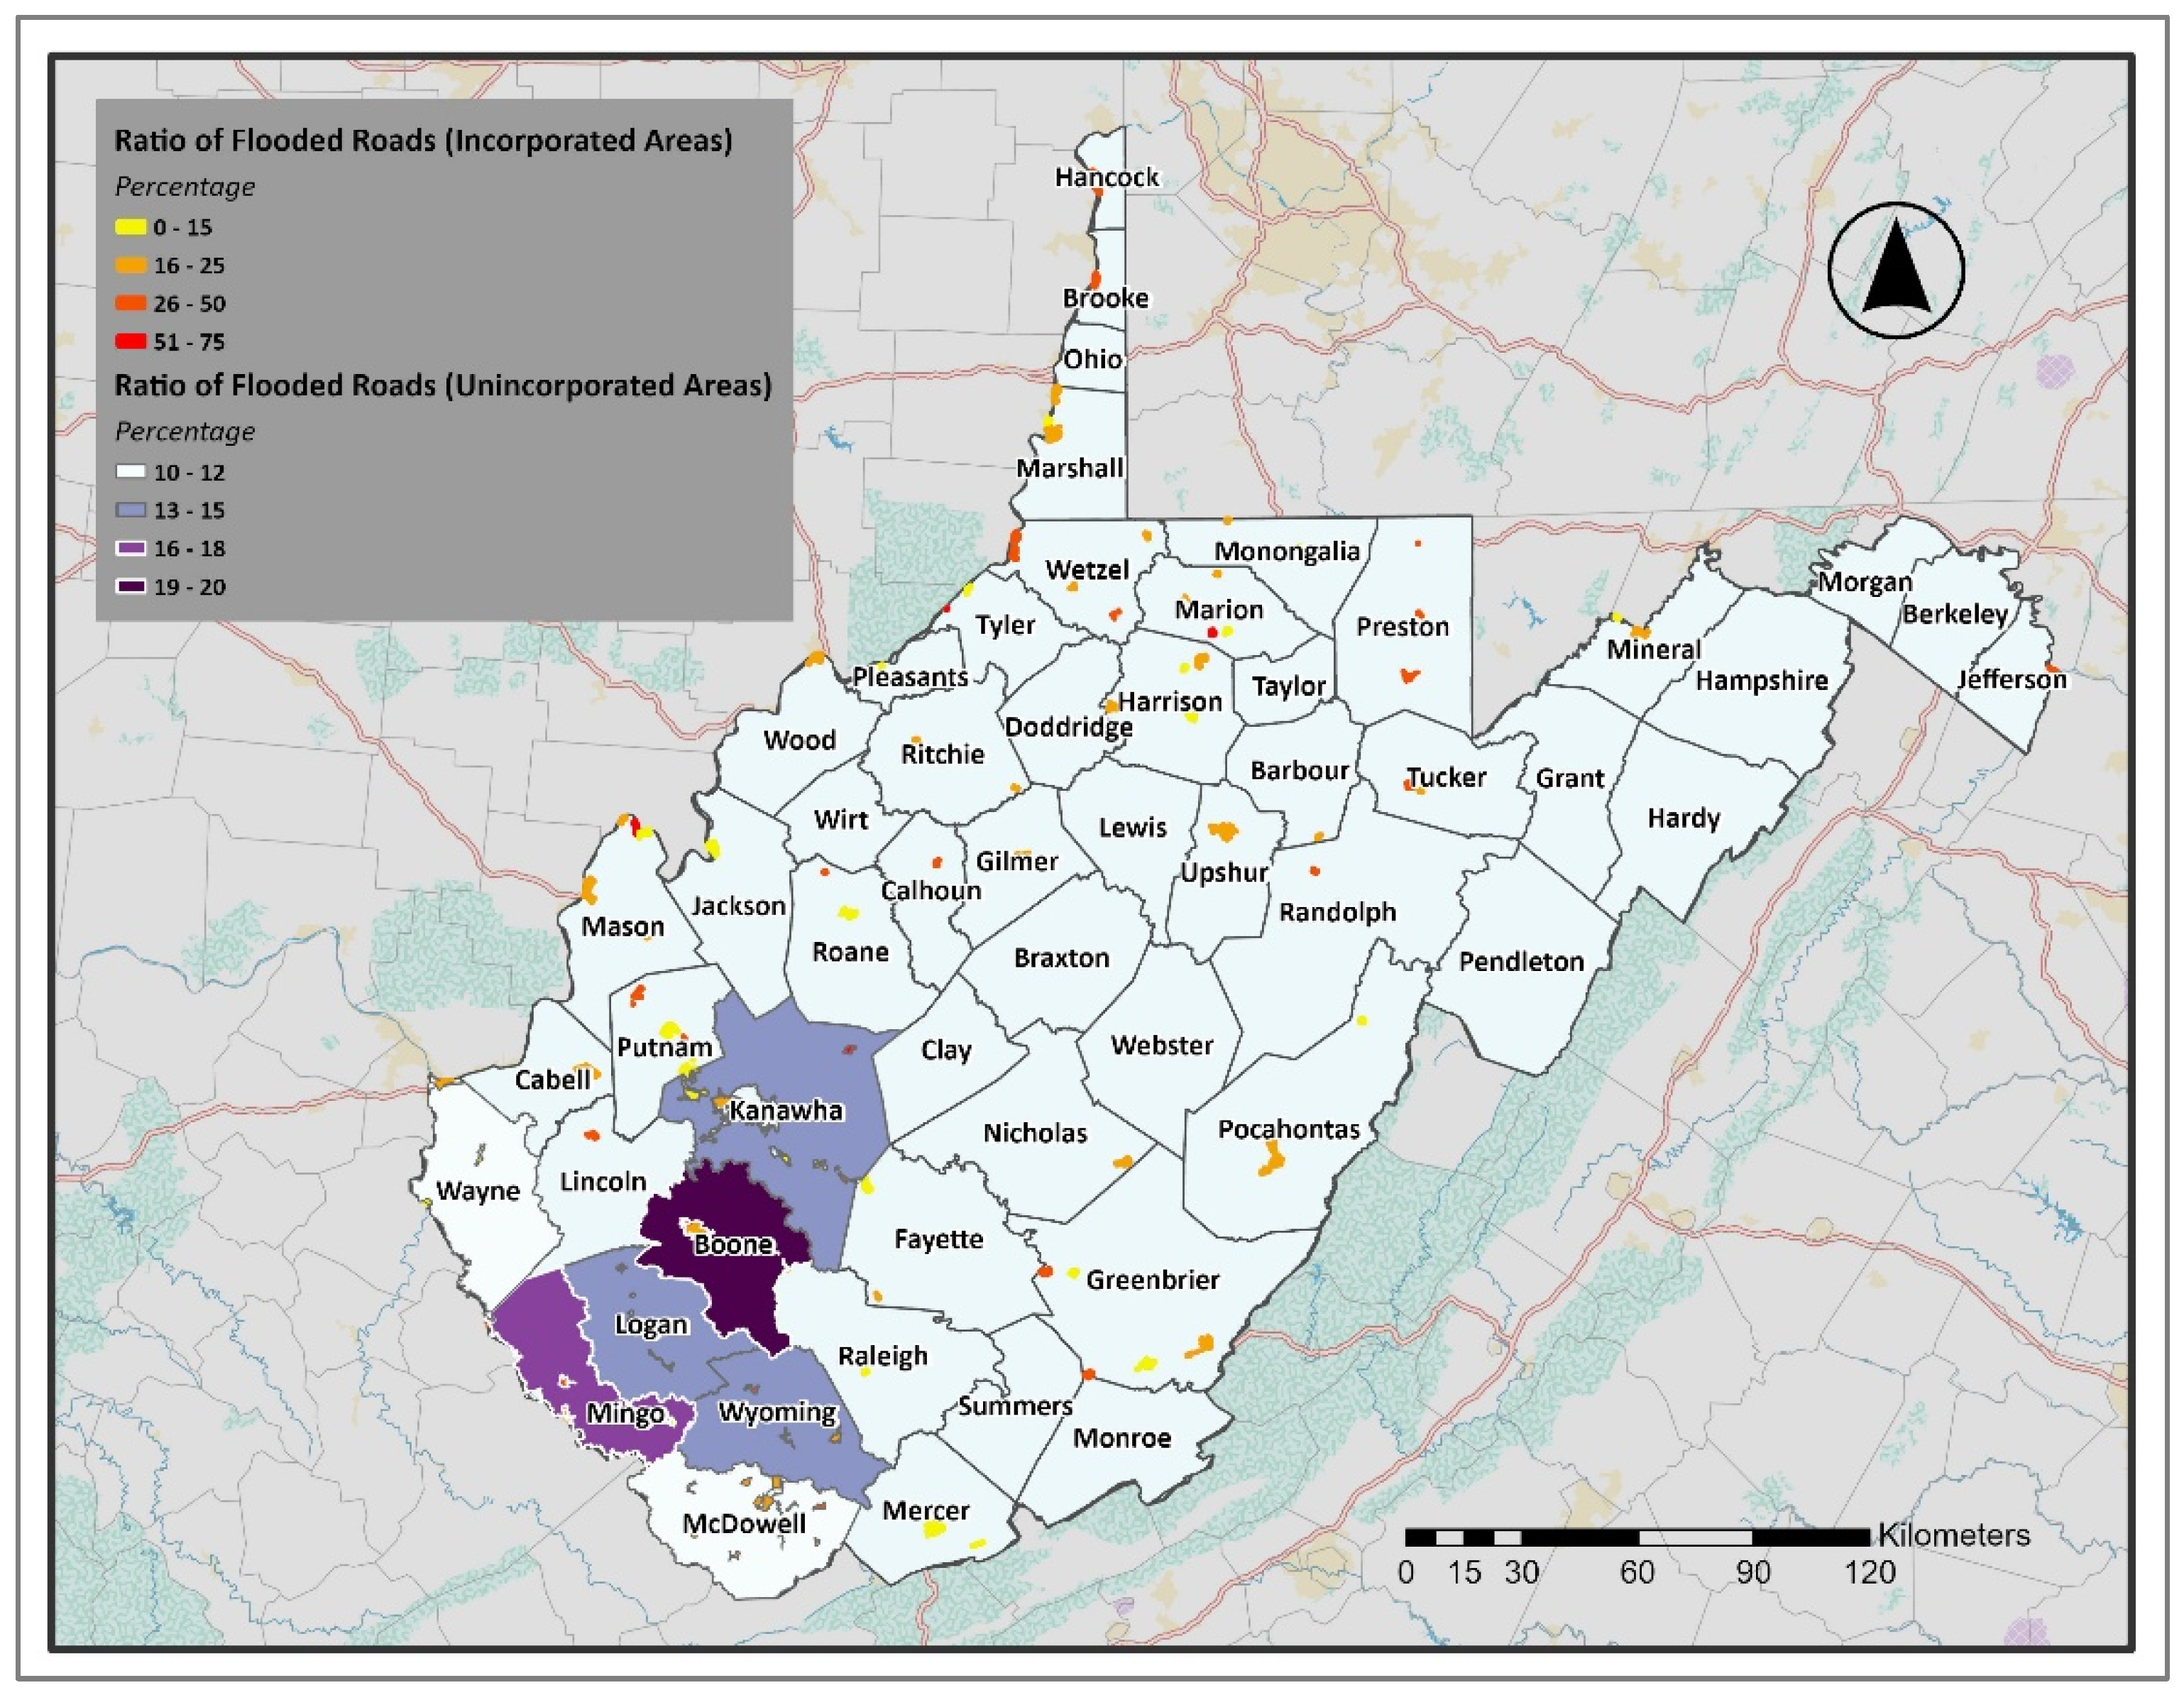
Transportation access provides another important dimension of physical vulnerability because road inundation can isolate communities, delay emergency responses, and interrupt evacuation and recovery operations. The ratio of roads inundated by at least 1 foot of floodwater provides another measure of community vulnerability (Figure 9). The map shows that the highest percentages of flooded roads are concentrated in unincorporated areas of southern West Virginia, especially in Boone and Mingo, where 16% to 19% of the road network is affected. Other southern counties, including Kanawha, Wyoming, and Logan, also show notable exposure, with more than 13 percent of roads flooded. In contrast, most central and northern counties have much lower percentages, with little or no visible flooding on the map.
Figure 9.
Ratio of Roads Inundated by Flood Water of one Foot or more. (Figures are original and created by the authors).
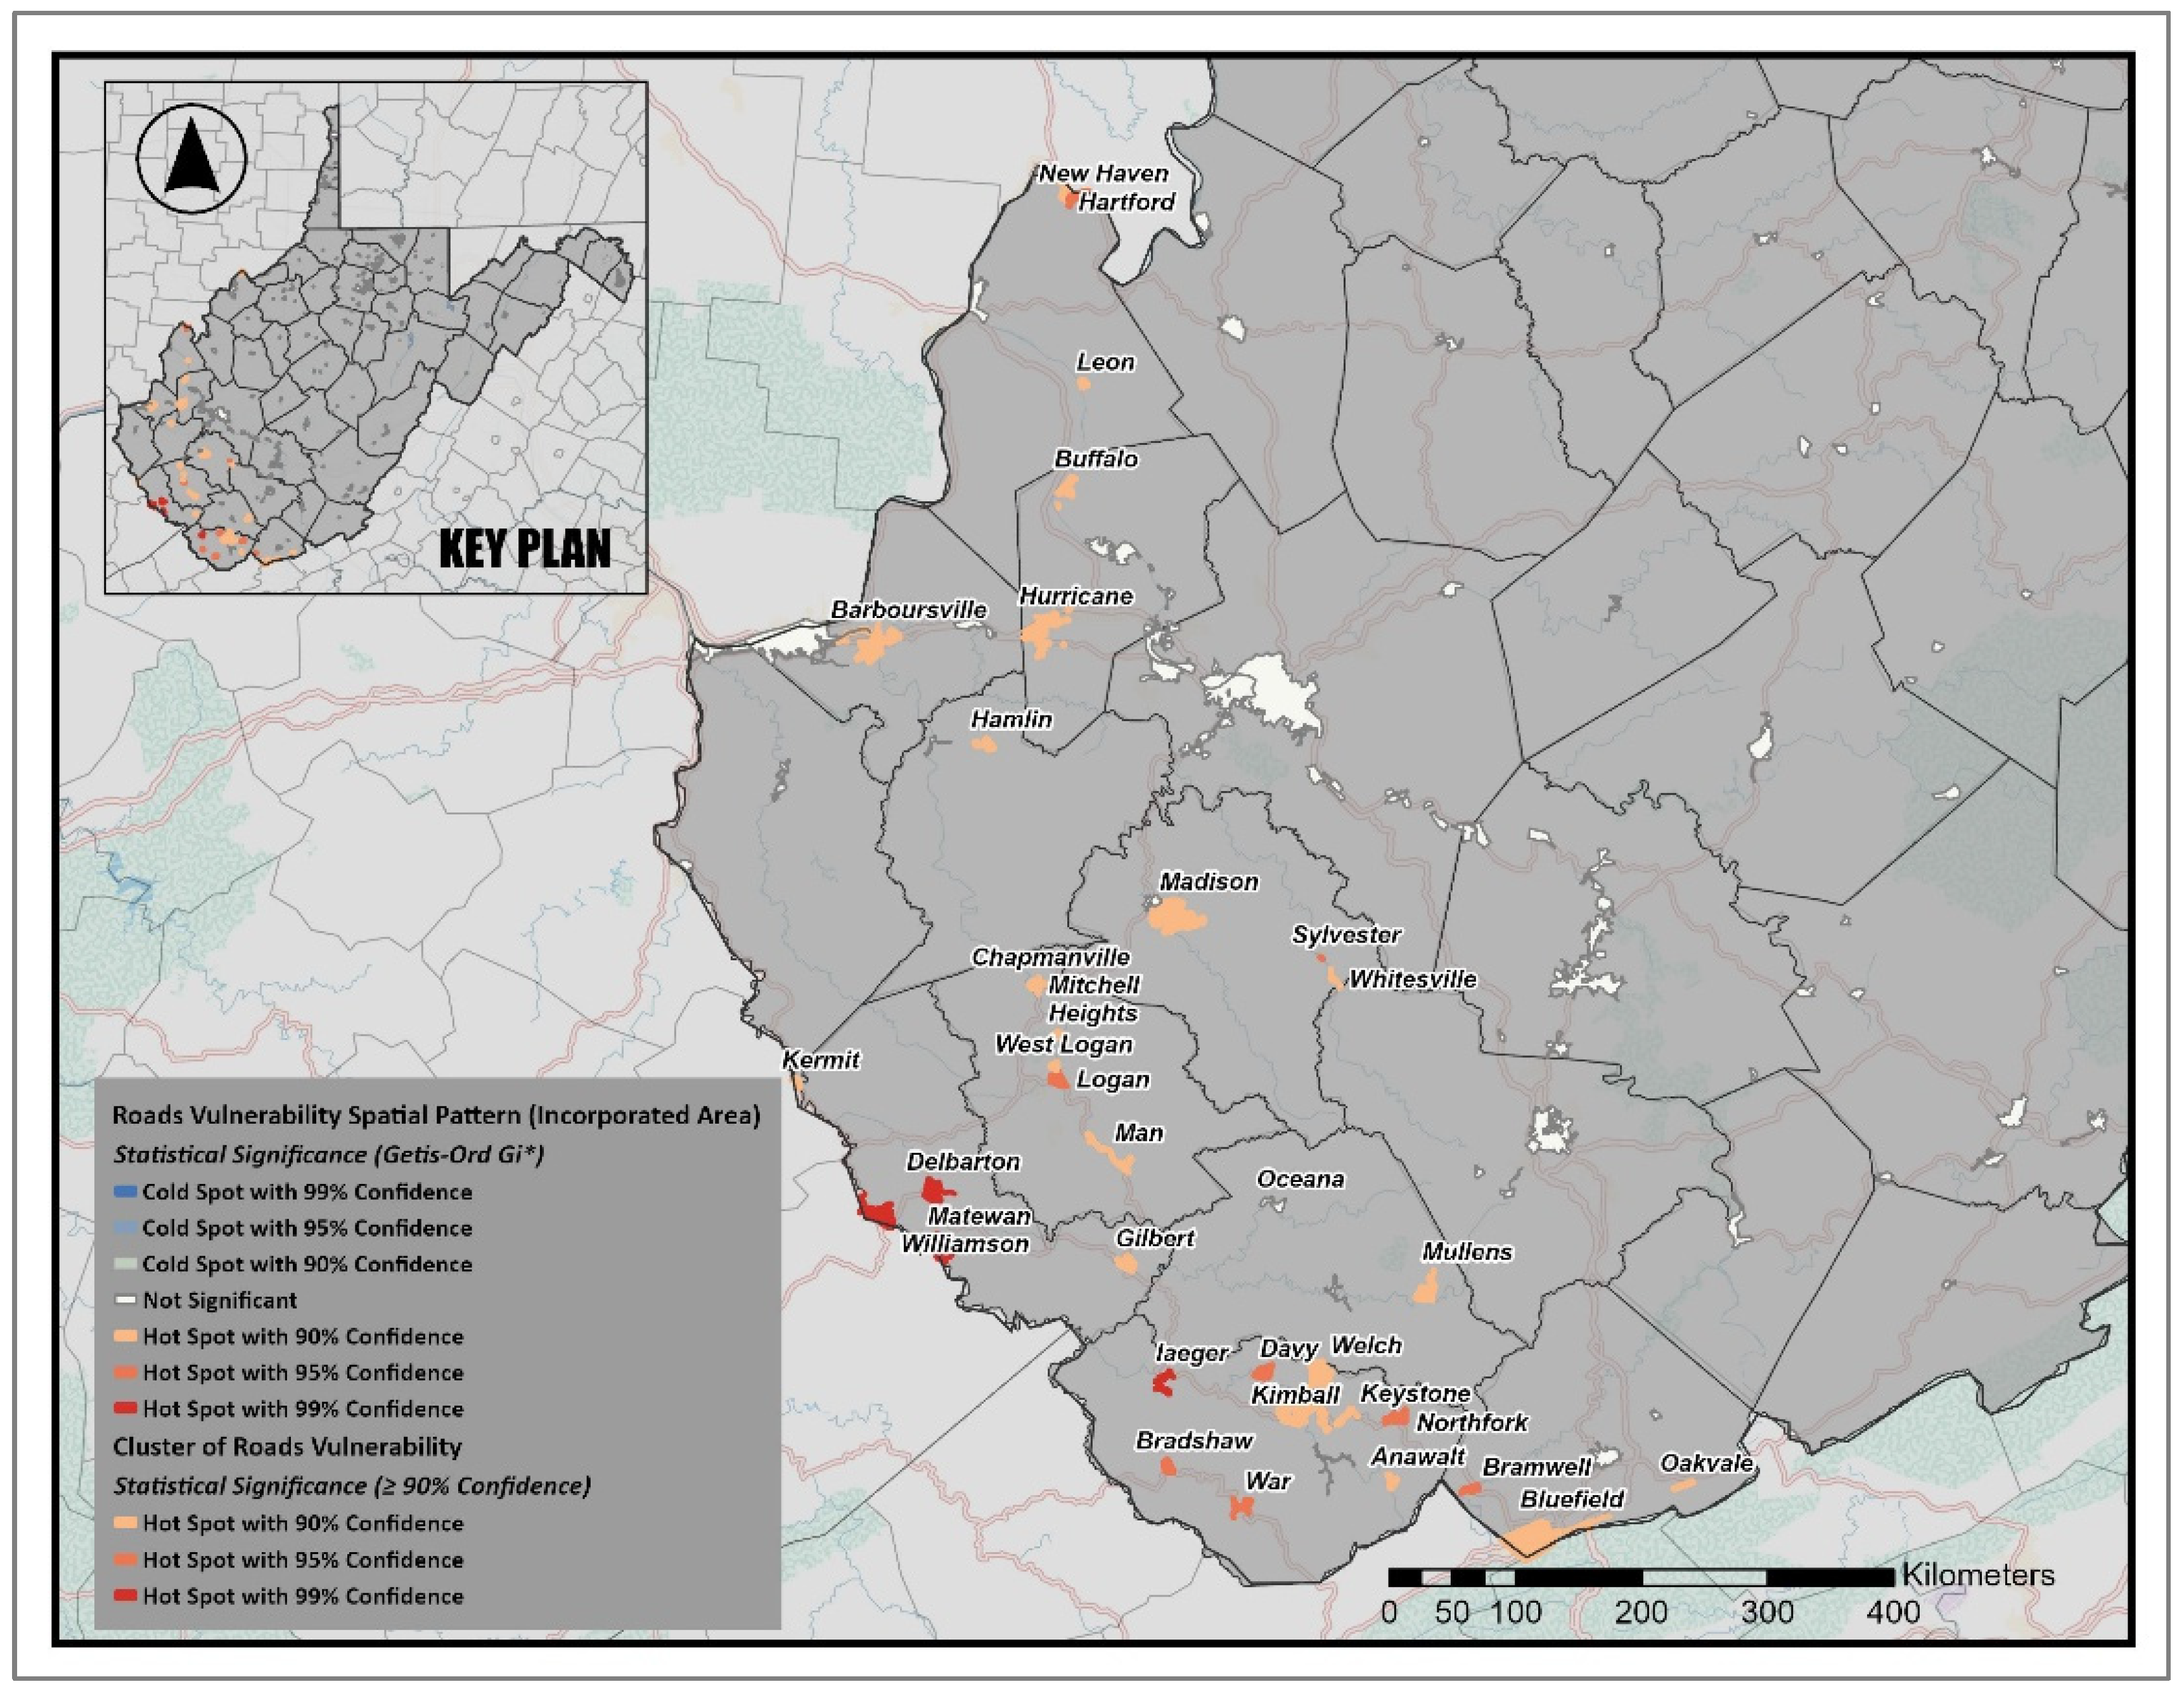
In incorporated communities, road exposure appears more variable. To determine whether these differences are due to random distribution or spatial clustering, we used a Hot Spot Analysis (Getis-Ord Gi*) to identify statistically significant clusters of high and low road-flood ratios (Figure 10). The results show that 11 incorporated areas (approximately 10 percent of the 105 incorporated areas with at least one community asset in the flood zone) were identified as significant hot spots at the 90–95 percent confidence levels, mainly in southern West Virginia. These include communities in McDowell, Logan, and Kanawha counties, where flood-prone valleys and dense transportation networks contribute to higher risk. Meanwhile, eight incorporated areas were classified as cold spots at the 90 percent significance level, indicating communities with many fewer flood-vulnerable roads. The majority of non-significant areas (white zones) elsewhere suggest that high road vulnerability is concentrated in specific areas rather than spread across the entire state.
Figure 10.
Statistically Significant Clusters of Flooded Roads in Incorporated Communities (Getis-Ord Gi* Hot Spots, 90–99% Confidence). (Figures are original and created by the authors).
This demonstrates how flood risk to transportation infrastructure appears differently across settlement types. Overall, the results show a geographic divide in unincorporated areas, with road vulnerability concentrated in the southern counties. In contrast, flood vulnerability in incorporated areas is spread across many small towns, with some cases facing very high levels of road flooding, but in both cases, it presents a significant challenge to community access and emergency response.
3.4. Final Vulnerability Assessment by Integrating Socioeconomic and Physical Indicators
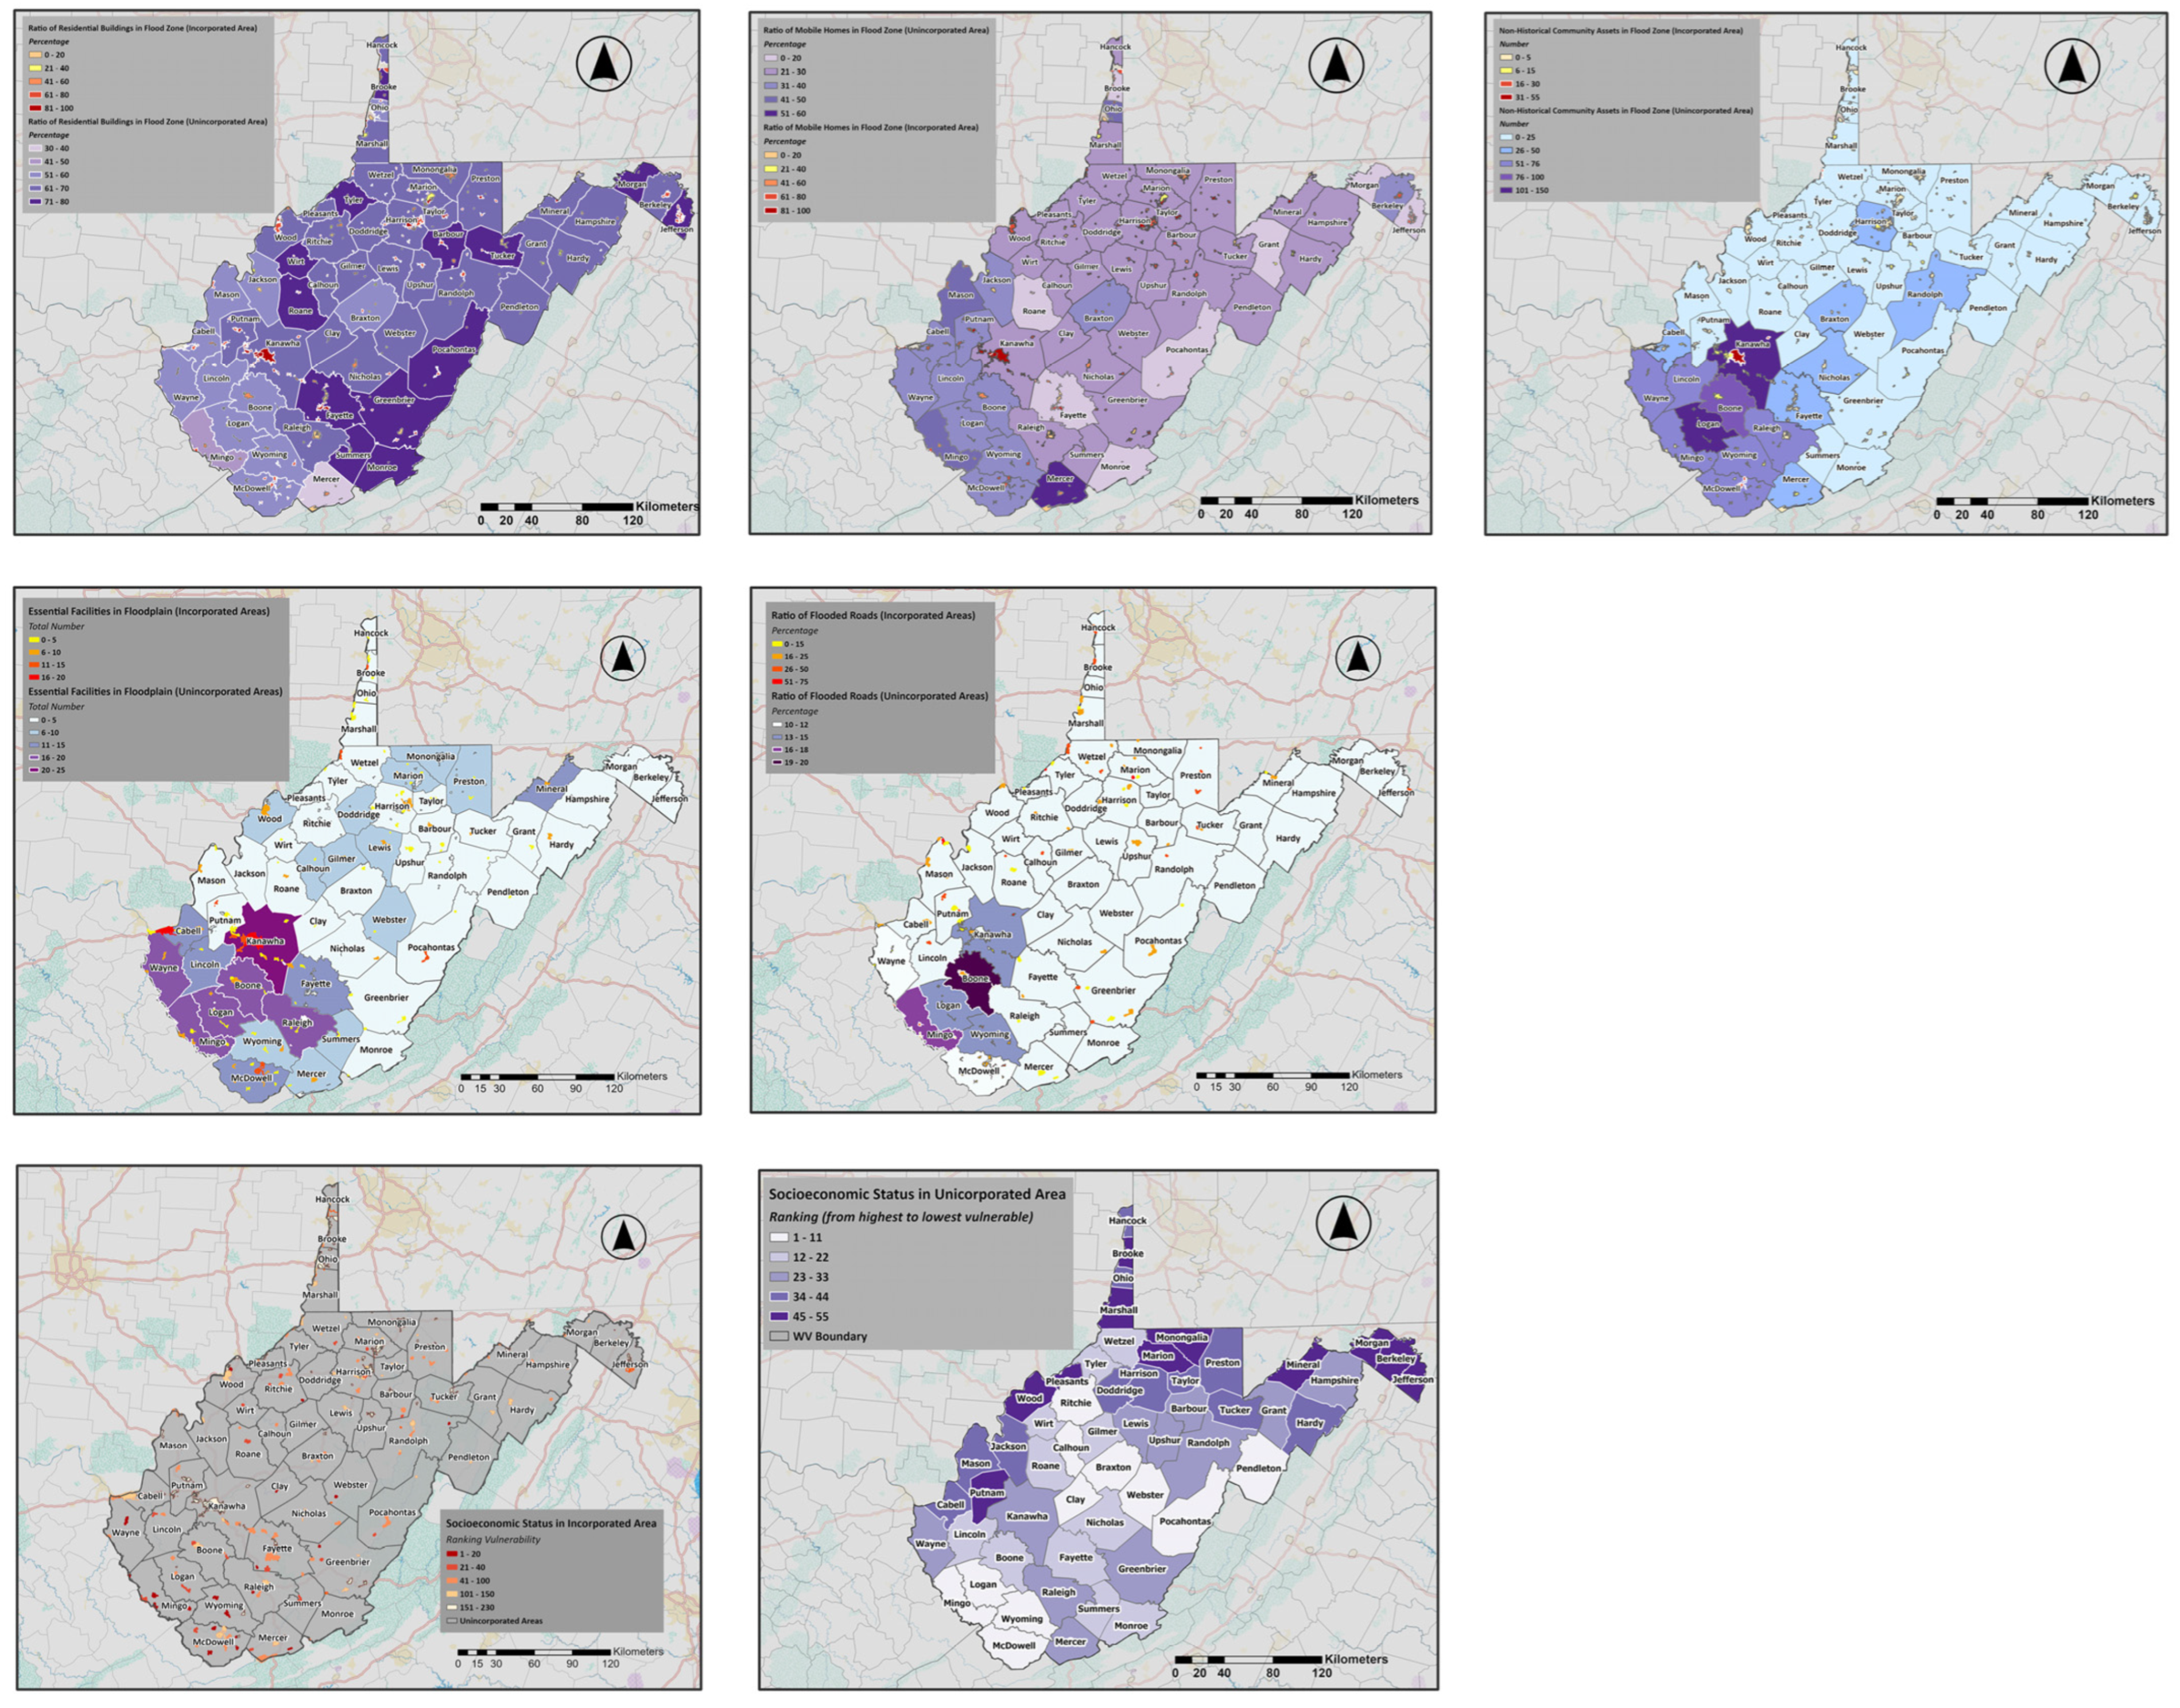
At this stage of the research, we consolidate all the indicators assessed in the previous sections and integrate them into a single framework. Each indicator (socioeconomic vulnerability, residential and mobile homes in the flood zone, essential facilities, community assets, and inundated roads) represents a different dimension of community risk. By overlaying these layers (Figure 11), we can identify how different forms of vulnerability interact and where they converge. This step is not about examining the indicators separately anymore, but about understanding how they overlap spatially to create a more comprehensive picture of final vulnerability. Through this integration, we can assess whether high levels of socioeconomic vulnerability are associated with high physical exposure or whether, in some areas, the patterns diverge. The result allows us to distinguish between communities where risks are concentrated across multiple dimensions and those where vulnerabilities are less aligned.
Figure 11.
Two-dimensional presentation of socioeconomic and selected physical flood vulnerability indicators in West Virginia communities. (Figures are original and created by the authors).
3.4.1. Flood Risk in Socioeconomically Vulnerable Incorporated Areas
To better understand the overlap between social and physical vulnerability, we combined the socioeconomic ranking of incorporated communities with their average flood vulnerability scores (Figure 12). Of the 229 incorporated communities considered, the first quartile (the top 25 percent, or 58 communities) with the highest socioeconomic vulnerability scores. These represent the most disadvantaged places in terms of social and economic capacity. Comparing these high-ranked socioeconomic communities with their average flood vulnerability (measured across the five physical indicators), we found that the pattern is not uniform across the state.
Figure 12.
Overlap of Socioeconomic Vulnerability and Flood Risk in Incorporated Communities. (Figures are original and created by the authors).
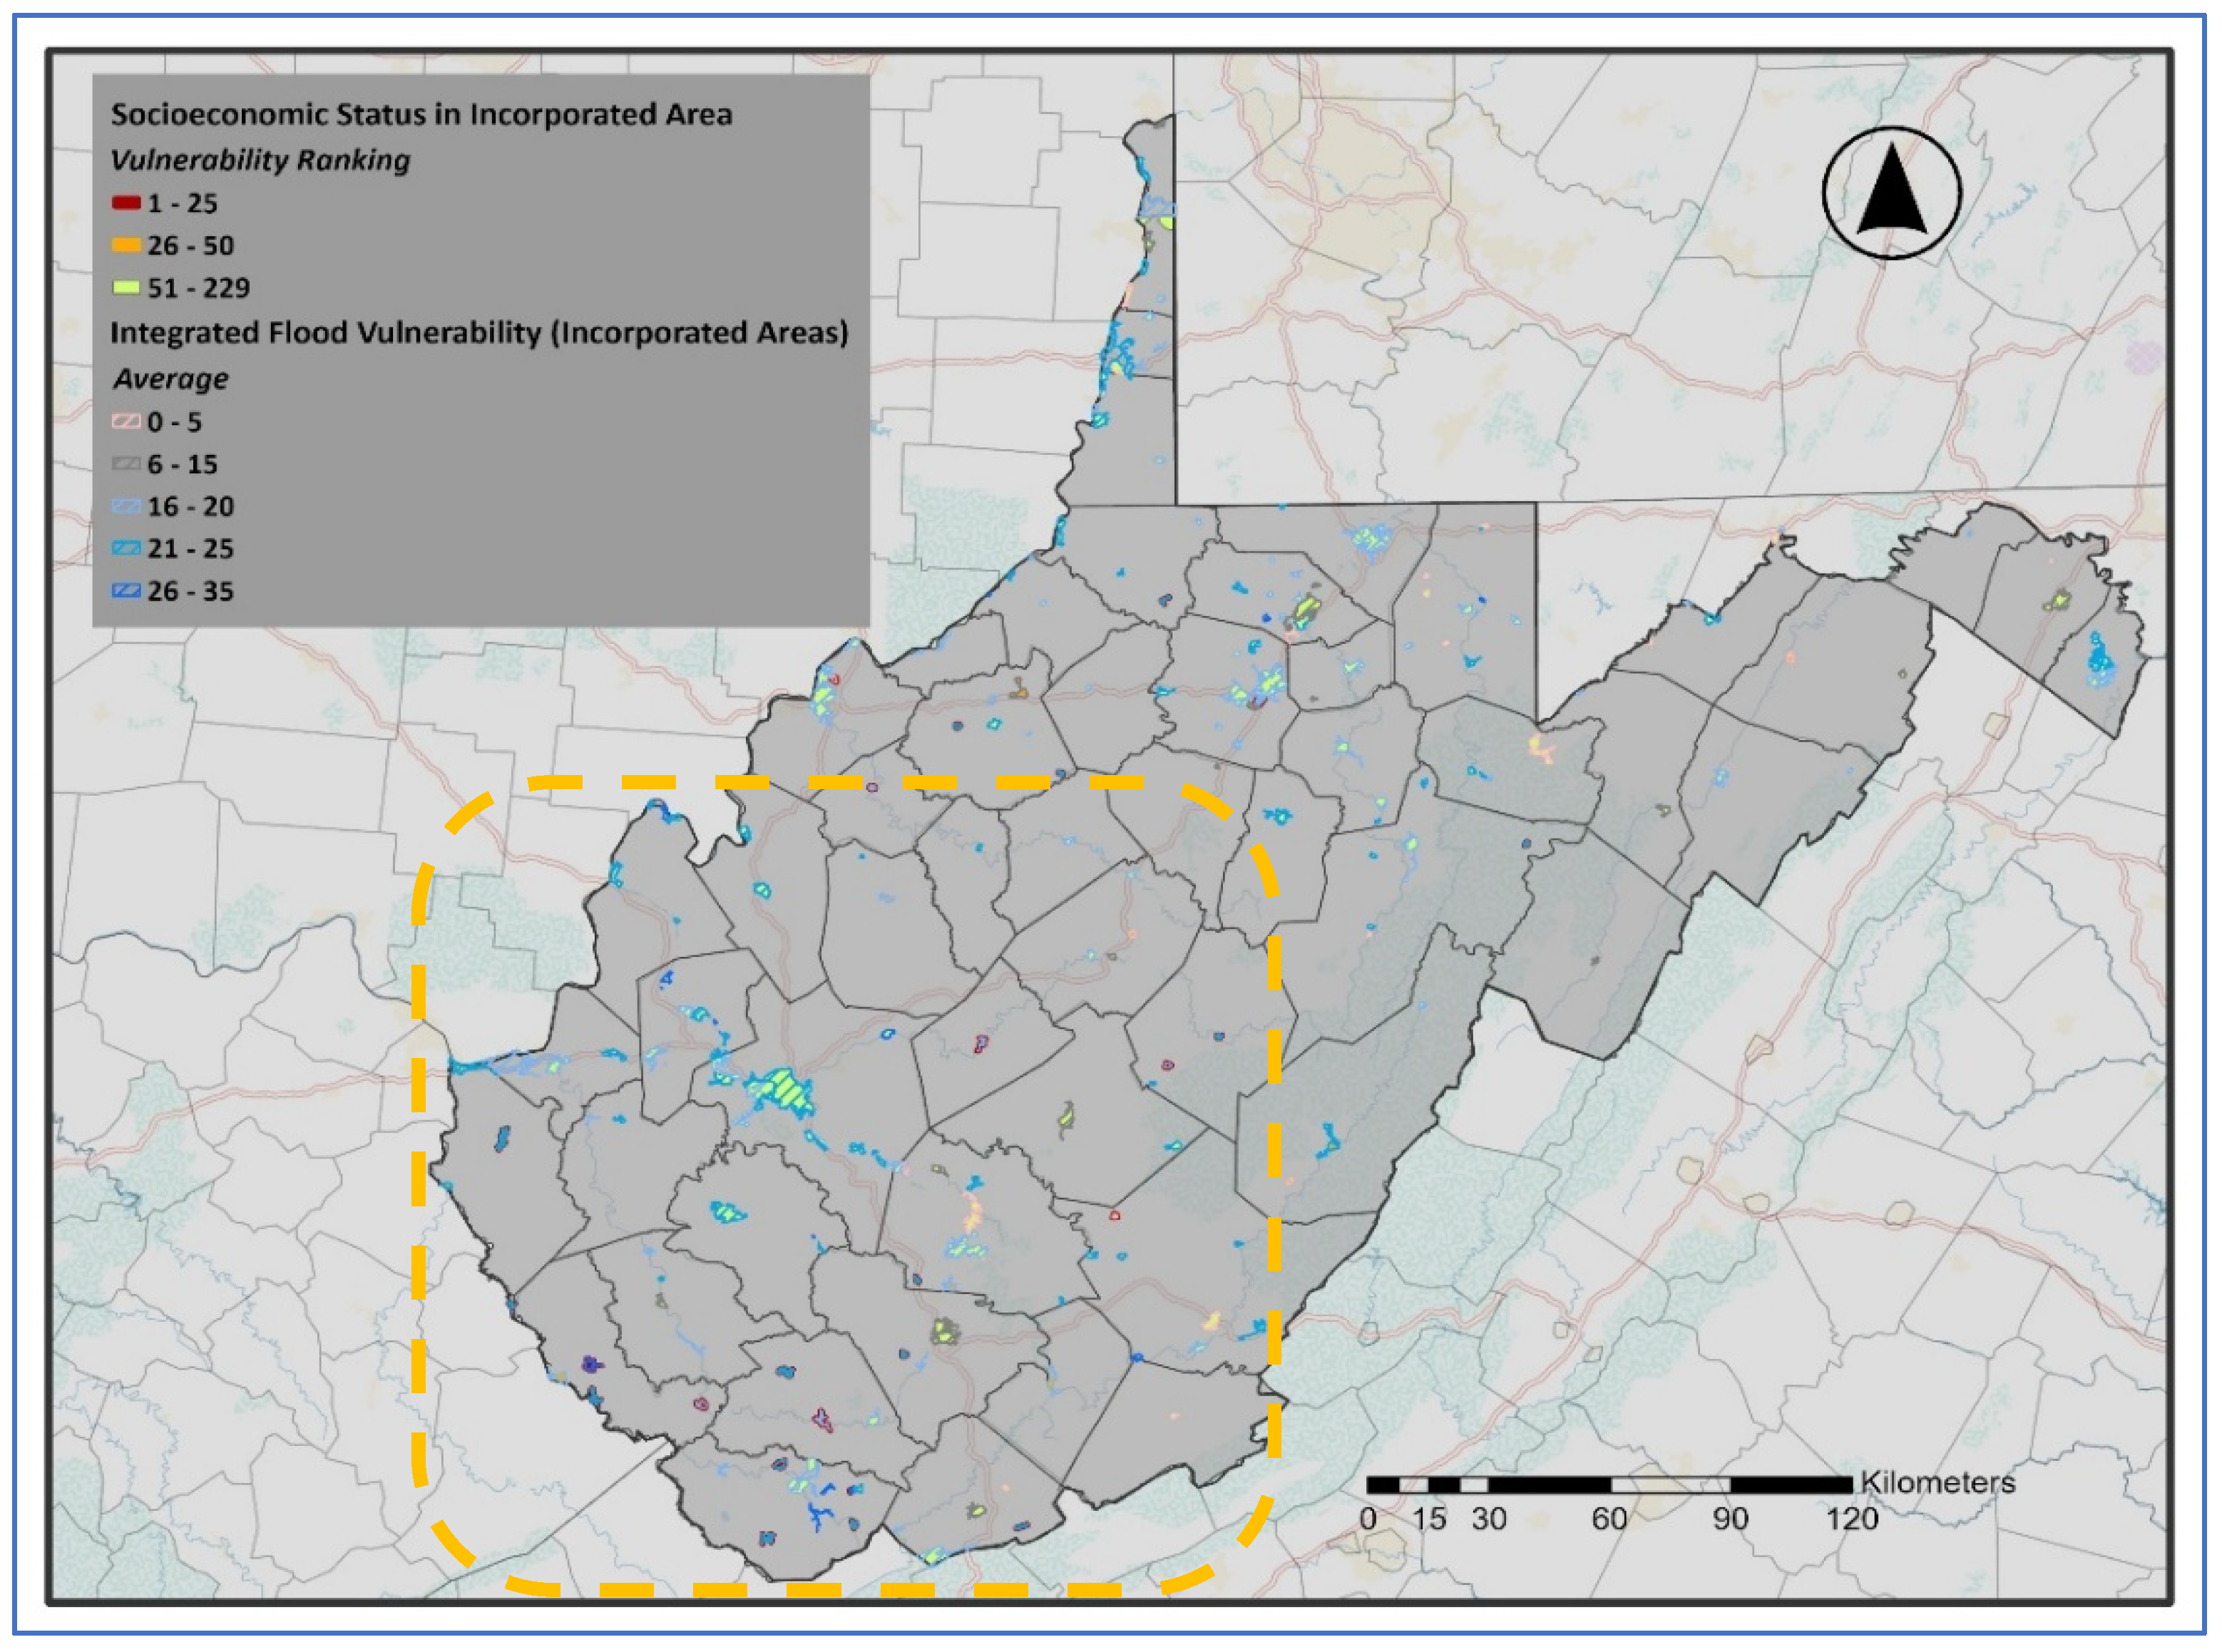
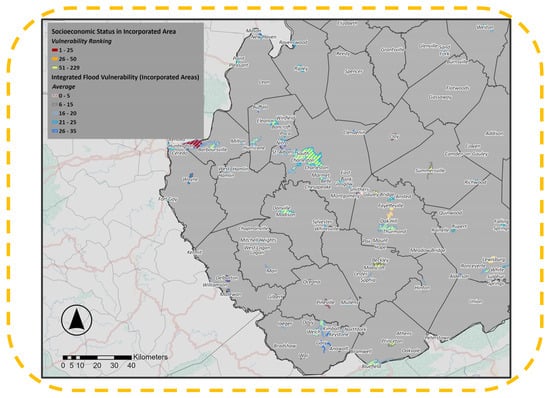
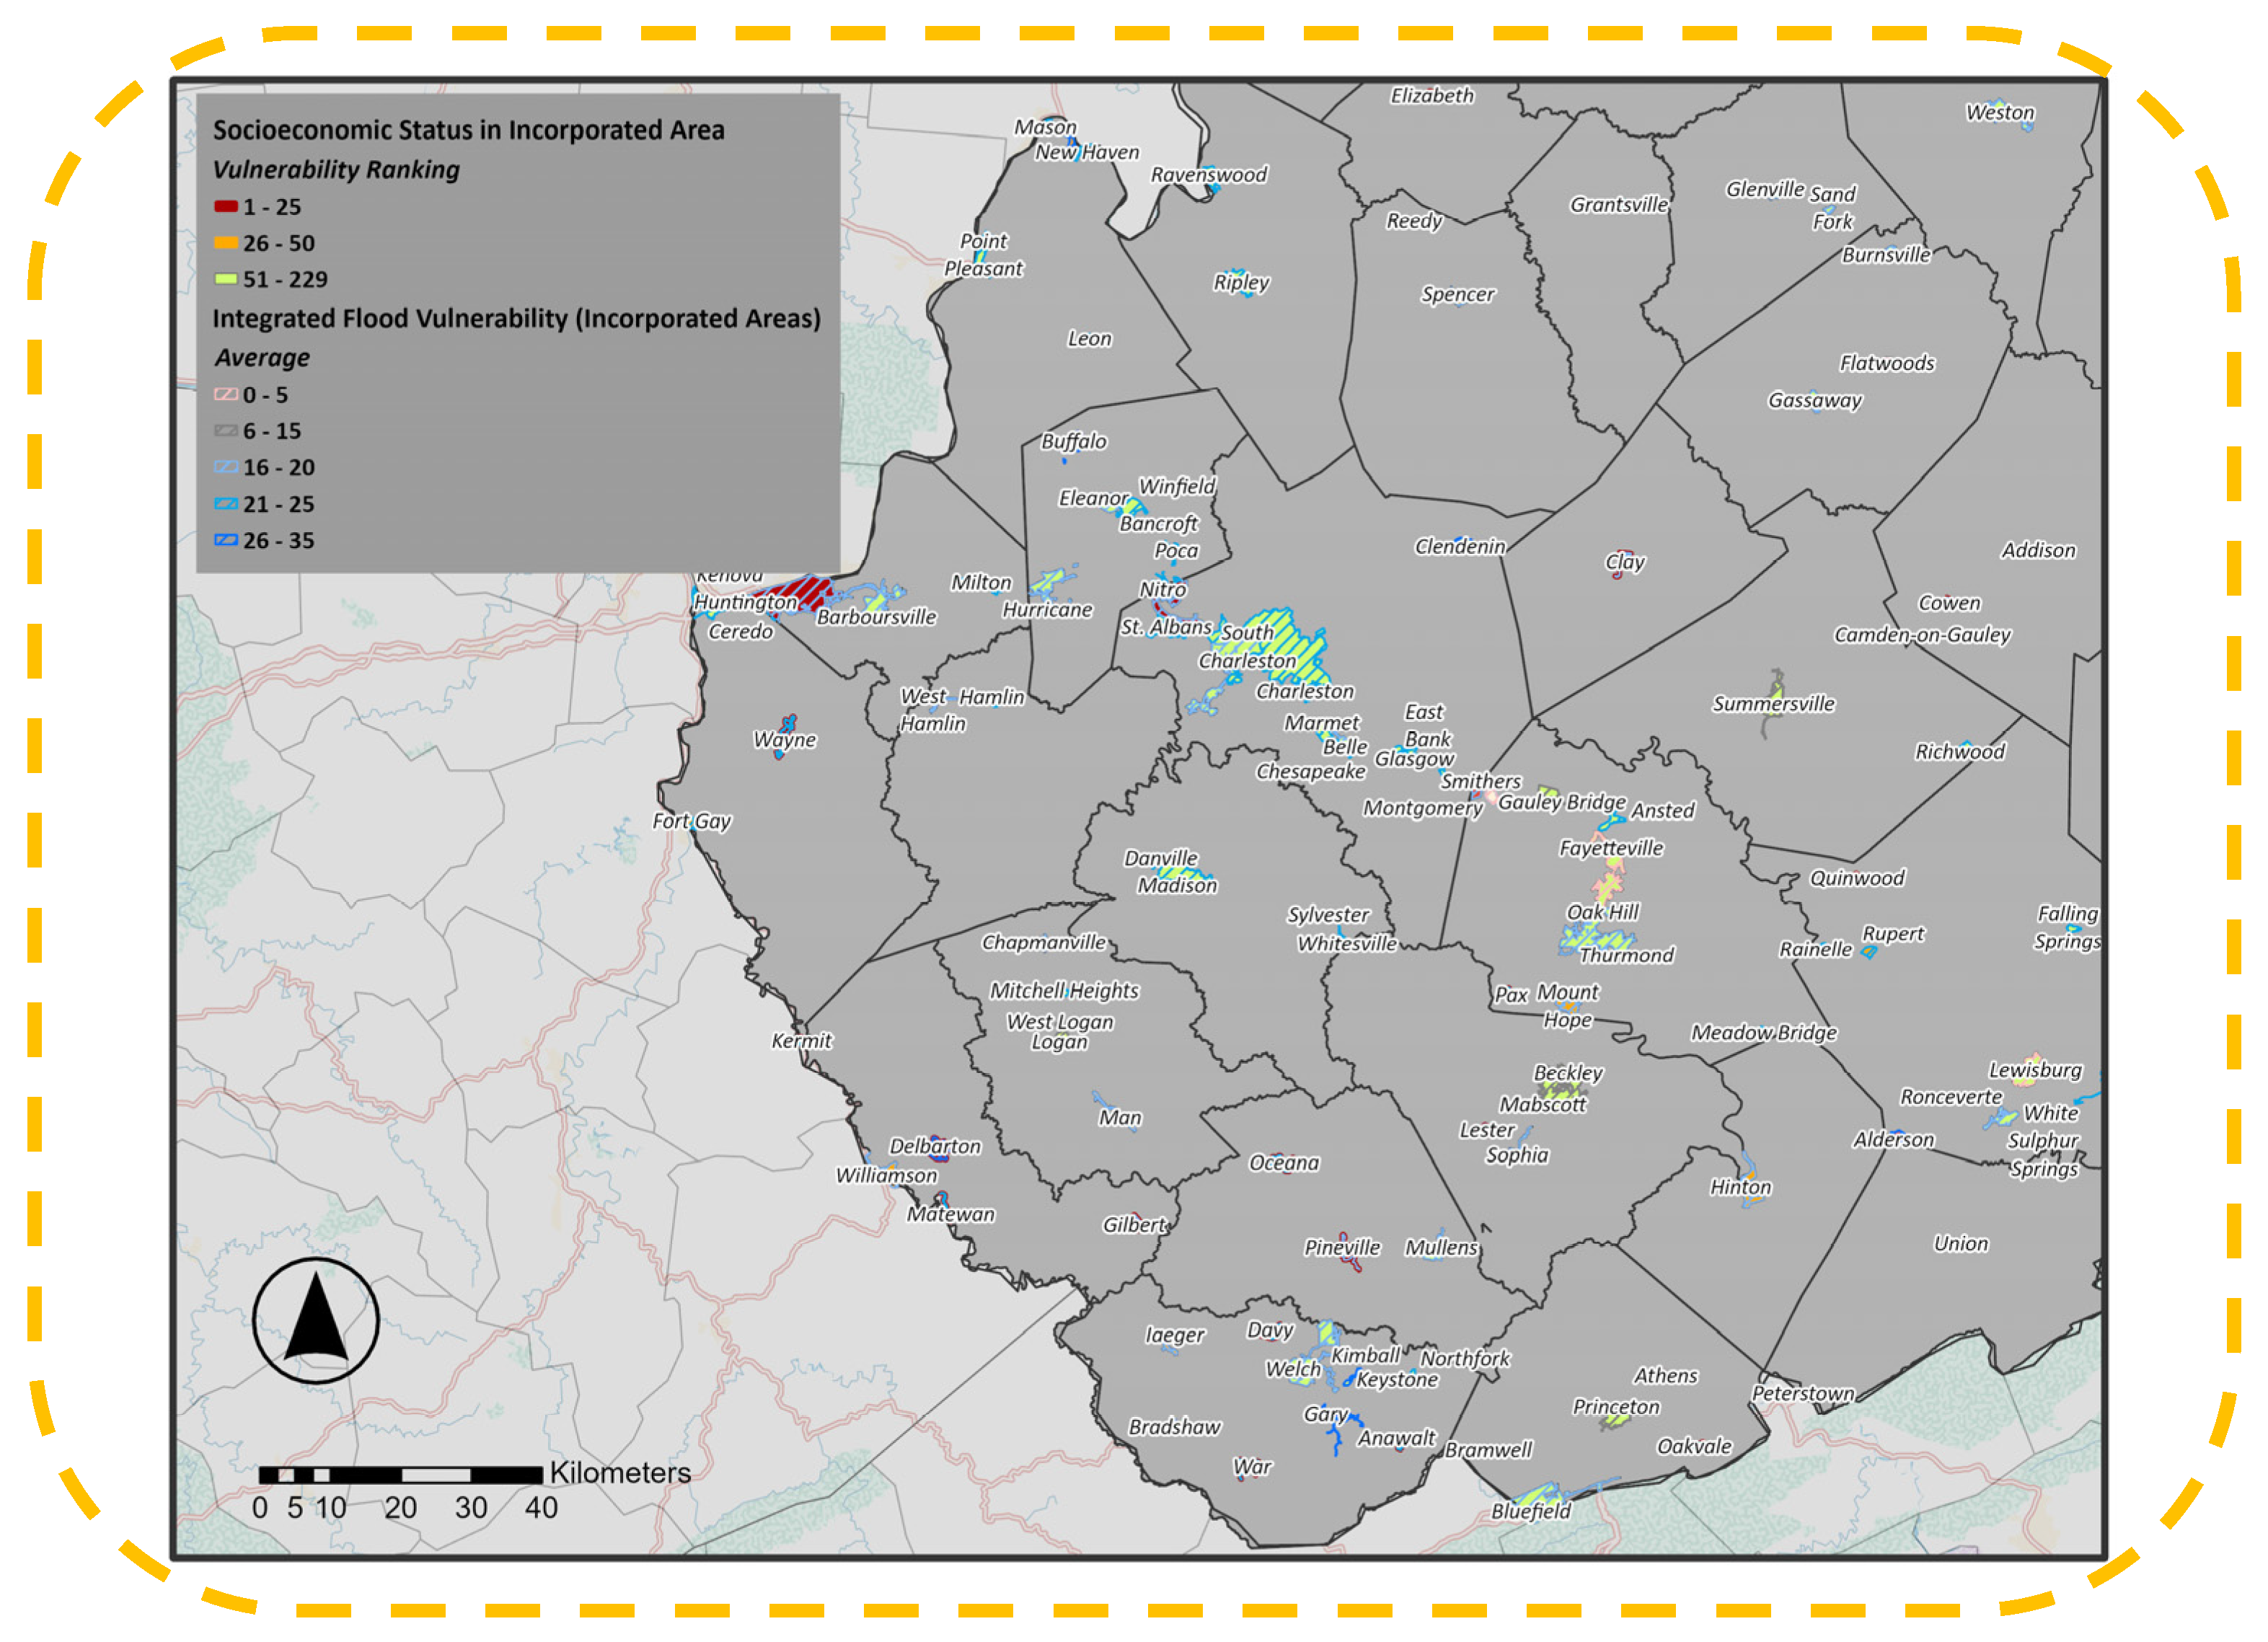
The map (Figure 13) illustrates these findings. A significant portion of the most socioeconomically vulnerable communities, such as Kimball, Gary, Delbarton, Matewan, Oceana, Pineville, Rainelle, and several small river towns in Boone, Mingo, and Putnam counties, also show relatively high flood vulnerability scores. This indicates a compounded risk where limited social capacity overlaps with concentrated flood-prone development.
Figure 13.
Incorporated Areas with Higher Socioeconomic and Flood Vulnerability. (Figures are original and created by the authors).
In contrast, other high-SEVI communities, including Auburn, North Hills, Flatwoods, Marlinton, and Romney, show only moderate or lower flood vulnerability, indicating that their risks are driven more by socioeconomic fragility than by severe physical flood hazards. Overall, this combined analysis highlights a core group of incorporated communities in the southern coalfield region where both socioeconomic and flood vulnerabilities align, making recovery from major flood events particularly challenging. It also reveals socioeconomically vulnerable towns elsewhere that remain at risk even when current flood vulnerability appears less severe.
3.4.2. Flood Risk in Socioeconomically Vulnerable Unincorporated Areas
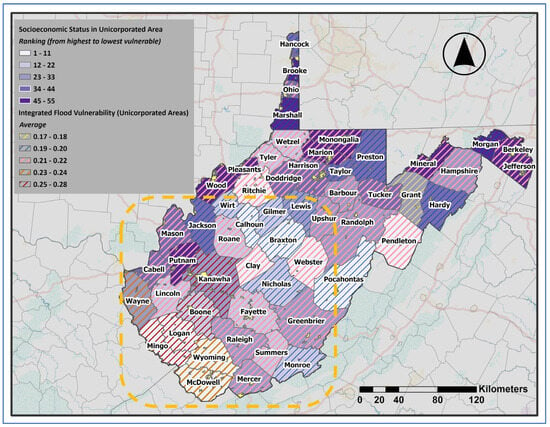
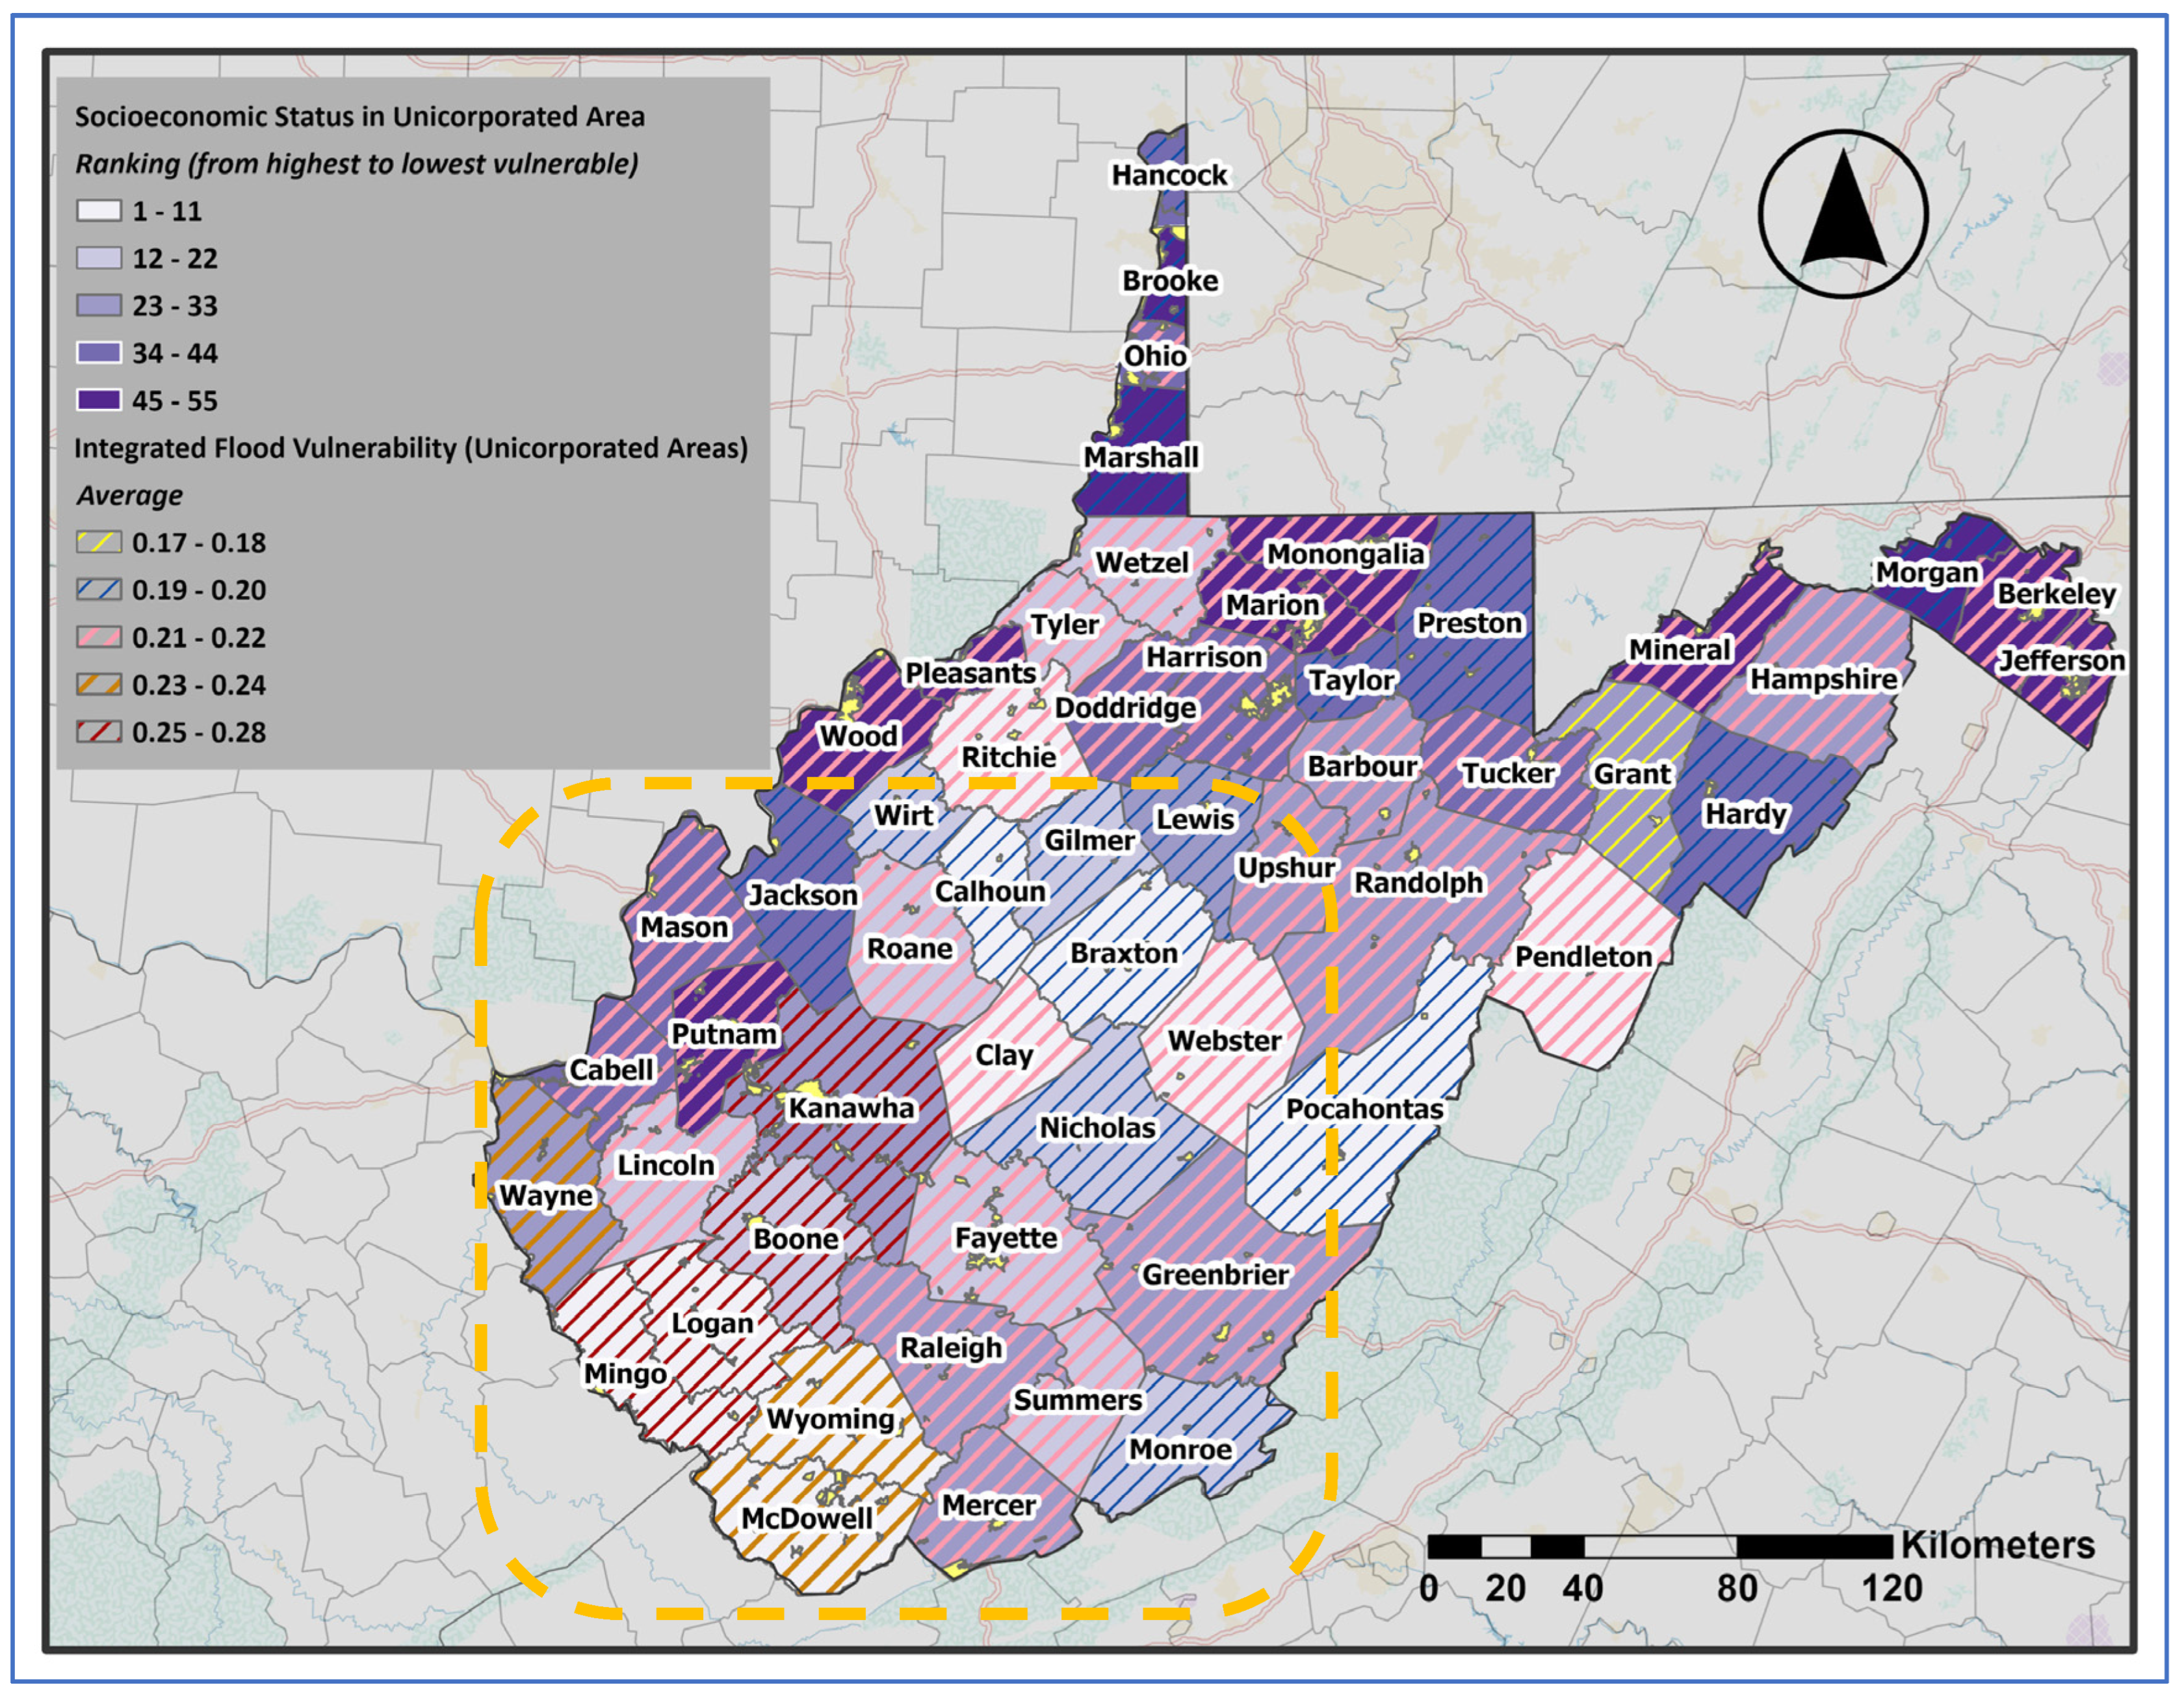
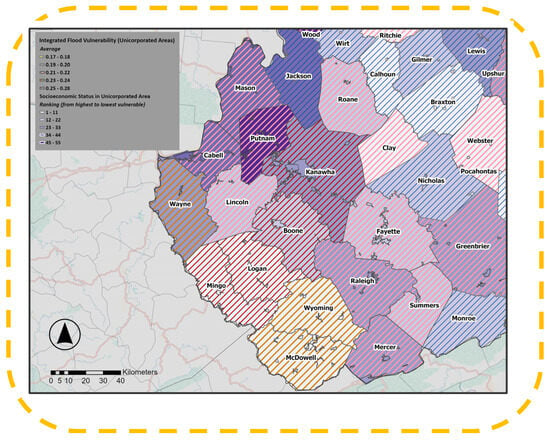
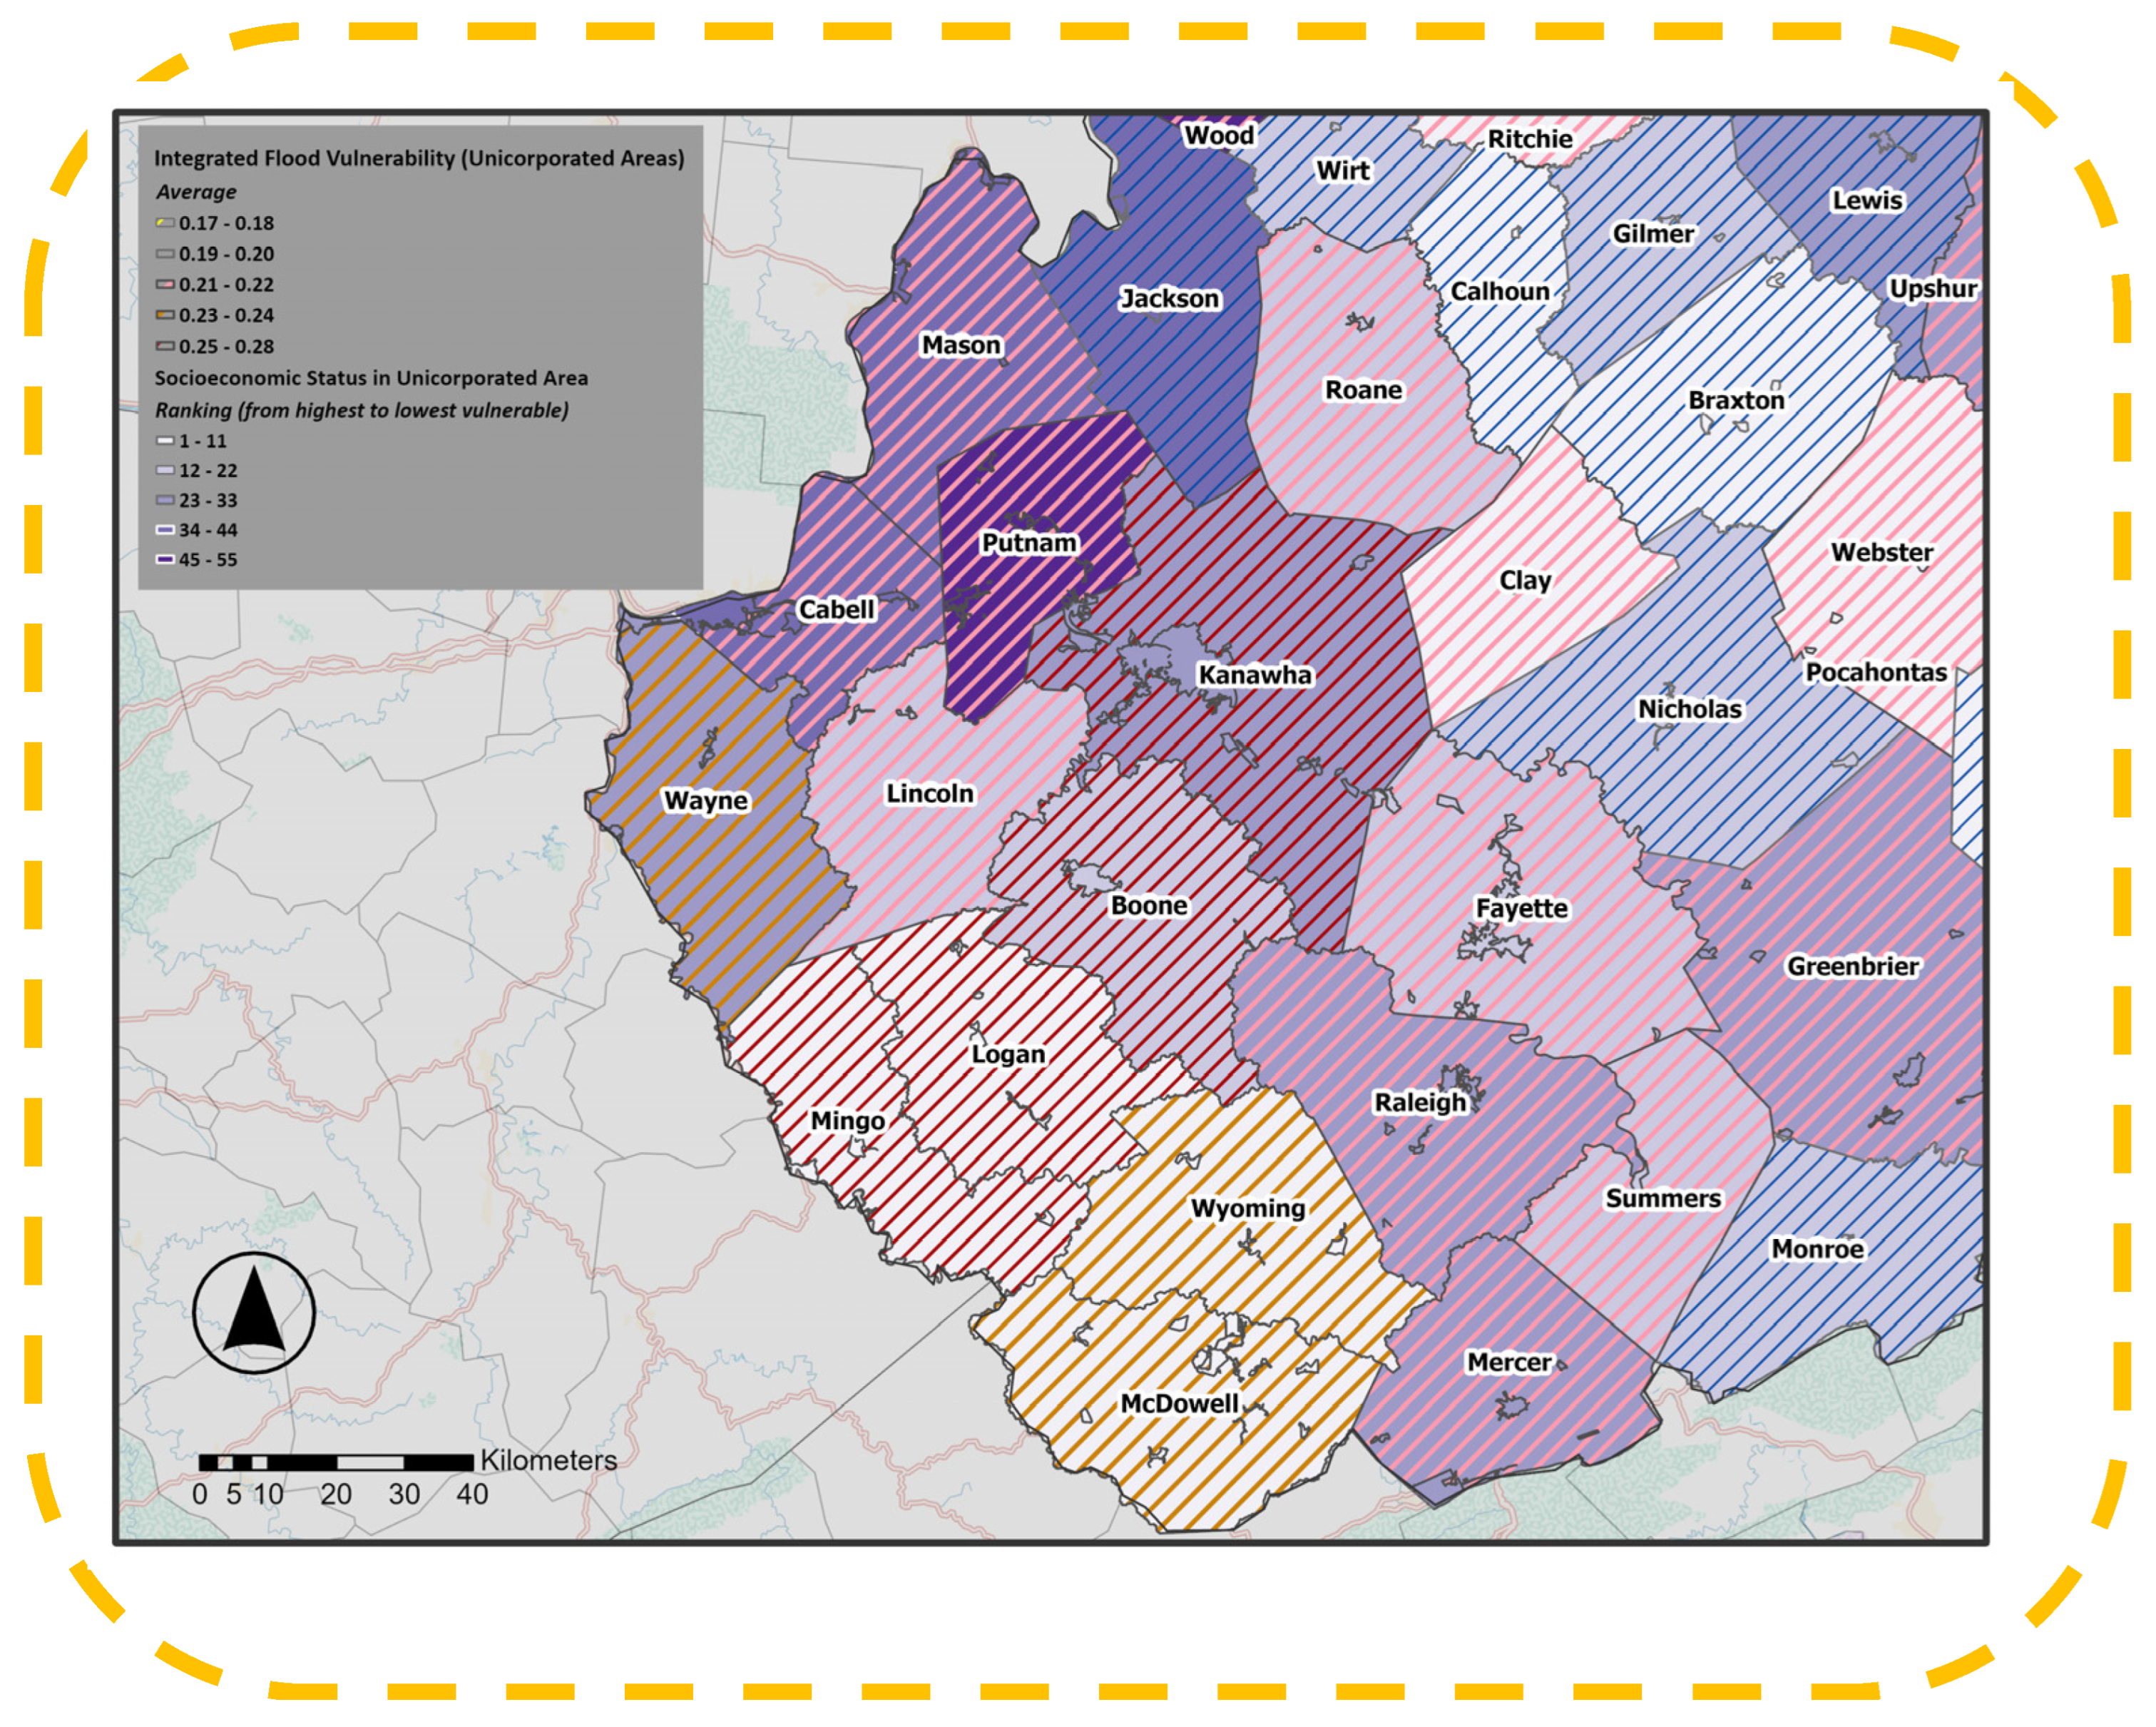
In unincorporated areas, combining socioeconomic vulnerability with flood vulnerability factors reveals a different but equally important pattern (Figure 14). Several counties in southern and central West Virginia, including Boone, Mingo, Logan, and McDowell, stand out for both high socioeconomic vulnerability scores and increased flood susceptibility. As shown in Figure 15, mapping vulnerability at the unincorporated-community scale (using Census-defined place boundaries) provides a more detailed view of which specific settlements face the most significant combined risk.
Figure 14.
Overlap of Flood Vulnerability and Socioeconomic Vulnerability in Unincorporated Areas. (Figures are original and created by the authors).
Figure 15.
Unincorporated Areas with. Higher Socioeconomic and Flood Vulnerability. (Figures are original and created by the authors).
Consistent with the broader county-level results, the highest concentrations of both socioeconomic and flood vulnerability occur in the southern coalfield region. This clustering indicates that unincorporated communities in the southern coalfield region face disproportionate risks. With vulnerabilities that go beyond physical exposure to include economic and social fragility. In contrast, many unincorporated areas in the eastern and northern parts of the state exhibit relatively low flood vulnerability despite higher socioeconomic vulnerability, highlighting a geographic divergence in which social and physical risks do not always coincide. This combined assessment emphasizes that in unincorporated areas, flood risk is not evenly distributed but concentrated in specific regions, where socioeconomic factors will worsen the impacts of physical hazards.
4. Conclusions
This study developed an integrated framework for assessing flood resilience in West Virginia by combining socioeconomic vulnerability with physical flood vulnerability indicators across both incorporated and unincorporated communities. The results show that vulnerability is not evenly distributed across the state; instead, it is concentrated in specific regions, especially in southern West Virginia, where physical flood exposure and socioeconomic disadvantages often overlap. These findings emphasize the importance of moving beyond hazard-only approaches and adopting more place-based, sustainable floodplain planning strategies that consider both the built environment and the social factors influencing recovery capacity. To improve flood resilience in West Virginia, efforts should include not only structural mitigation but also long-term investments in social support, land-use planning, infrastructure adaptation, and community-based recovery strategies.
5. Implications for Policy and Practice
Since so many communities remain inside the mapped floodplain, long-term resilience necessitates both structural and social strategies.
5.1. Structural Needs
It is important to regularly update building codes to reflect new development demands and ensure consistent enforcement, especially for older homes, mobile homes, and low-value properties that repeatedly flood. Elevation programs, home retrofitting, and targeted buyouts for the most flood-prone residential structures can help reduce future losses. Mobile homes, which our results show as highly vulnerable, require special attention: anchoring, elevating, and subsidized retrofitting should be priorities.
Essential facilities, such as fire departments, EMS stations, and water facilities, must be either relocated outside the floodplain or upgraded to withstand major floods. Expanding open space, green areas, and flood buffers in vulnerable zones can reduce damage while improving community quality of life.
Evacuation behavior in rural areas needs special attention. In many unincorporated communities, families refuse to leave their homes because they do not want to abandon farms, livestock, or pets. While FEMA’s insurance plan covers farm equipment, it does not cover animals. Livestock are living beings and also represent economic security for many households, so flood policies should consider their safety as well. In addition, many official shelters, such as Red Cross facilities, do not accept pets. Local shelters, such as churches, schools, and fire stations, should receive support to provide pet-friendly options so families do not have to choose between safety and abandoning their animals.
5.2. Social and Economic Needs
The most significant barrier for many households is Affordable flood insurance, which remains a problem. Programs such as FEMA’s Community Rating System (CRS) should be promoted to reduce premium costs for residents.
Policies should also be helpful in reducing social barriers that limit preparedness and recovery, especially in rural areas, where road closures or bridge failures can isolate people during floods. Community education, clear evacuation plans, and neighborhood-level communication networks are very important.
Targeted subsidies are needed for households that cannot afford elevation or retrofitting, especially for families with elderly members, disabled individuals, or incomes far below the county median. These households face the highest recovery burdens and should receive greater financial assistance.
Finally, long-term resilience planning must consider relocation for the high-risk neighborhoods. These planning committees should include some local residents as consultants when deciding on something important and maybe emotional for residents. These plans must be transparent and supportive, allowing residents to decide for themselves and providing compensation that reflects both economic and emotional ties to the place. Strengthening local economies, improving access to education and healthcare, and creating new opportunities are also part of building long-term resilience.
5.3. Climate Change Considerations in Flood Resilience Planning
Climate change is expected to increase the intensity and frequency of extreme rainfall events across many parts of the United States, including the Appalachian region. As a result, communities already vulnerable to flooding may face increased risks in the future, even in areas currently designated as moderate hazard zones.
In West Virginia, where many settlements are located in narrow river valleys, these changes could further increase flood risk and put more pressure on existing infrastructure. Therefore, flood resilience planning should include long-term climate considerations by promoting adaptive land-use strategies, resilient infrastructure design, and the relocation or retrofitting of highly exposed structures. Integrating climate adaptation into local land-use decisions and floodplain management is therefore essential for sustainable community development in flood-prone regions.
Future research should extend this framework by incorporating dynamic flood-risk scenarios and climate-informed hydrologic modeling to evaluate how community vulnerability may shift under changing environmental conditions.
6. Future Research Directions
This study integrates multiple layers of socioeconomic and flood vulnerability; however, there are some essential research areas that need to be studied in the future:
- ▪
- Suitability Analysis for Relocation and Critical Infrastructure
Future work should expand relocation and suitability analysis for essential facilities and vulnerable housing types, including mobile home parks. Identifying safe and accessible areas for relocating these structures can guide state and local governments. Similar methods can help communities plan green spaces, flood buffers, and open areas to absorb floodwater.
- ▪
- Sensitivity Analysis of Vulnerability Indicators
Future research could further examine the robustness of the Socioeconomic Vulnerability Index (SEVI) by exploring different indicator weighting schemes in more detail. In this study, equal weighting was used to ensure transparency and avoid subjective bias. To assess the stability of this method, principal component analysis (PCA) was applied as an alternative weighting approach, and the results showed a very high level of agreement between PCA-based and equal-weight rankings.
While this finding supports the reliability of the SEVI, future studies could expand this analysis by systematically comparing multiple weighting approaches, such as PCA- or factor-analysis-based methods, across different geographic contexts. Such analyses would provide deeper insights into how variations in indicator importance influence vulnerability patterns and help further validate the stability of composite vulnerability indices.
- ▪
- Split Communities (Communities spanning more than one county)
Although the present study used the footprint ratio as a practical approximation for communities spanning multiple counties, this method does not fully reflect the non-uniform spatial distribution of population and socioeconomic conditions within community boundaries. Future research could improve this step by using population-weighted interpolation, parcel-level data, or other dissymmetric methods to better estimate sub-community variation in transboundary areas.
- ▪
- Hydrological and Geomorphological Analysis
More research is needed on high-risk streams and floodways. Understanding floodway width, capacity, and development pressures can improve zoning and help avoid downstream impacts. Mapping high-risk stream corridors statewide would provide planners with valuable tools.
- ▪
- Better Targeting of Subsidies and Assistance
Economic studies are needed to develop frameworks for flood insurance subsidy assistance based on detailed household characteristics, such as age, disability, and income. Tailored support could make limited resources more effective and help the most vulnerable households recover more quickly.
- ▪
- Environmental Risks Related to Former Coal Mining Areas
In southern West Virginia, many unincorporated communities with high socioeconomic vulnerability are located near historical coal mining sites. Mining has altered slope stability, drainage patterns, and land surfaces. Future studies should evaluate how floodwaters move through or across old mines and whether they may pick up contaminants from abandoned sites. Understanding these interactions could help prevent contamination of drinking water and agricultural areas during floods.
- ▪
- Flood-Resistant Design for Livestock and Pet Safety
More research is needed to develop guidelines for flood-safe livestock structures and emergency animal shelters. Identifying safe locations, retrofitting options, and best practices for barns and enclosures could reduce losses and encourage residents to evacuate earlier and more safely.
Author Contributions
Conceptualization, A.M.; methodology, A.M.; software, A.M.; validation, A.M., M.J.D., P.M.B. and M.P.S.; formal analysis, A.M.; investigation, A.M.; data curation, A.M.; writing—original draft preparation, A.M.; writing—review and editing, A.M., M.J.D., P.M.B. and M.P.S.; visualization, A.M.; supervision, M.J.D., P.M.B. and M.P.S. All authors have read and agreed to the published version of the manuscript.
Funding
This research received no external funding.
Institutional Review Board Statement
Not applicable.
Informed Consent Statement
Not applicable.
Data Availability Statement
The original contributions presented in this study are included in the article. Further inquiries can be directed to the corresponding author.
Conflicts of Interest
The authors declare no conflicts of interest.
Appendix A
A comparison of the top 20 most vulnerable communities based on equal-weight SEVI and PCA-derived rankings is shown in this Appendix (Table A1). The results reveal a very strong agreement between the two methods (Spearman’s rank correlation coefficient ρ = 0.985), suggesting that identifying the most vulnerable communities is consistent regardless of the weighting approach.
Table A1.
Comparison of top 20 vulnerable communities (SEVI vs. PCA).
References
- Armal, S.; Porter, J.R.; Lingle, B.; Chu, Z.; Marston, M.L.; Wing, O.E.J. Assessing property level economic impacts of climate in the US, new insights and evidence from a comprehensive flood risk assessment tool. Climate 2020, 8, 116. [Google Scholar] [CrossRef] [Scilit]
- McClymont, K.; Morrison, D.; Beevers, L.; Carmen, E. Flood resilience: A systematic review. J. Environ. Plan. Manag. 2020, 63, 1151–1176. [Google Scholar] [CrossRef] [Scilit]
- Kuang, D.; Liao, K.-H. How does flood resistance affect learning from flood experiences? A study of two communities in Central China. Clim. Change 2022, 173, 6. [Google Scholar] [CrossRef] [Scilit]
- Wang, L.; Cui, S.; Li, Y.; Huang, H.; Manandhar, B.; Nitivattananon, V.; Fang, X.; Huang, W. A review of the flood management: From flood control to flood resilience. Heliyon 2022, 8, e11763. [Google Scholar] [CrossRef] [Scilit]
- Zevenbergen, C.; Fu, D.; Pathirana, A.; Gersonius, B. Flood Resilience: A Review of the State of Science; International Risk Governance Council: Lausanne, Switzerland, 2020; Available online: https://beta.irgc.org/wp-content/uploads/2018/09/Zevenbergen-Flood-Resilience-2.pdf (accessed on 16 December 2024).
- Federal Emergency Management Agency (FEMA); National Flood Insurance Program (NFIP). What Is Riverine Flooding and Why Does It Matter to You? FloodSmart; Federal Emergency Management Agency: Washington, DC, USA, 2023. Available online: https://agents.floodsmart.gov/articles/what-riverine-flooding-and-why-does-it-matter-you (accessed on 2 February 2026).
- National Severe Storms Laboratory (NSSL). Floods. Available online: https://www.nssl.noaa.gov/education/svrwx101/floods/ (accessed on 5 February 2026).
- Kender, C.; Smith, J.; Riebe, E.; Ward, B. Mountain State Legacy: West Virginia Statewide Historic Preservation Plan (2020–2024); West Virginia State Historic Preservation Office, West Virginia Department of Arts, Culture and History: Charleston, WV, USA, 2020; Available online: https://wvculture.org/wp-content/uploads/2021/10/2020-2024-WV-Statewide-Historic-Preservation-Plan.pdf (accessed on 2 February 2026).
- Grafton, W.N. The Environment; (e-WV) The West Virginia Encyclopedia: Charleston, WV, USA, 2026; Available online: https://www.wvencyclopedia.org/entries/2146 (accessed on 2 February 2026).
- West Virginia Department of Commerce. West Virginia Community Development Block Grant Disaster Recovery Action Plan; West Virginia Department of Commerce: Charleston, WV, USA, 2017; Available online: https://wvfloodrecovery.com/wp-content/uploads/resources/WV-Action-Plan-hyperlinked_final_submission-to-HUD-042117.pdf (accessed on 2 February 2026).
- National Research Council. Disaster Resilience: A National Imperative; The National Academies Press: Washington, DC, USA, 2012. [Google Scholar] [CrossRef] [Scilit]
- Aldrich, D.P.; Meyer, M.A. Social capital and community resilience. Am. Behav. Sci. 2015, 59, 254–269. [Google Scholar] [CrossRef] [Scilit]
- Cutter, S.L. The landscape of disaster resilience indicators in the USA. Nat. Hazards 2016, 80, 741–758. [Google Scholar] [CrossRef] [Scilit]
- Cutter, S.L.; Barnes, L.; Berry, M.; Burton, C.; Evans, E.; Tate, E.; Webb, J. A place-based model for understanding community resilience to natural disasters. Glob. Environ. Change 2008, 18, 598–606. [Google Scholar] [CrossRef] [Scilit]
- Norris, F.H.; Stevens, S.P.; Pfefferbaum, B.; Wyche, K.F.; Pfefferbaum, R.L. Community resilience as a metaphor, theory, set of capacities, and strategy for disaster readiness. Am. J. Community Psychol. 2008, 41, 127–150. [Google Scholar] [CrossRef] [Scilit]
- Pastor-Escuredo, D.; Torres, Y.; Martínez-Torres, M.; Zufiria, P.J. Rapid Multi-Dimensional Impact Assessment of Floods. Sustainability 2020, 12, 4246. [Google Scholar] [CrossRef] [Scilit]
- Pastor-Escuredo, D.; Morales-Guzmán, A.; Torres-Fernández, Y.; Bauer, J.M.; Wadhwa, A.; Castro-Correa, C.; Romanoff, L.; Lee, J.G.; Rutherford, A.; Frias-Martinez, V.; et al. Flooding through the lens of mobile phone activity. In Proceedings of the IEEE Global Humanitarian Technology Conference (GHTC 2014), San Jose, CA, USA, 10–13 October 2014; pp. 279–286. [Google Scholar]
- Geneva Association. Flood Risk Management in the United States; Geneva Association: Zürich, Switzerland, 2020; Available online: https://www.genevaassociation.org/sites/default/files/flood-risk-management-usa.pdf (accessed on 5 February 2026).
- Turner, B.L.; Kasperson, R.E.; Matson, P.A.; McCarthy, J.J.; Corell, R.W.; Christensen, L.; Eckley, N.; Kasperson, J.X.; Luers, A.; Martello, M.L.; et al. A framework for vulnerability analysis in sustainability science. Proc. Natl. Acad. Sci. USA 2003, 100, 8074–8079. [Google Scholar] [CrossRef] [Scilit] [PubMed]
- UNISDR. 2009 UNISDR Terminology on Disaster Risk Reduction; United Nations International Strategy for Disaster Reduction: Geneva, Switzerland, 2009; Available online: https://www.undrr.org/publication/2009-unisdr-terminology-disaster-risk-reduction (accessed on 25 March 2026).
- Cutter, S.L.; Ash, K.D.; Emrich, C.T. The geographies of community disaster resilience. Glob. Environ. Change 2014, 29, 65–77. [Google Scholar] [CrossRef] [Scilit]
- Fekete, A. Social vulnerability (re-)assessment in context to natural hazards: Review of the usefulness of the spatial indicator approach and investigations of validation demands. Int. J. Disaster Risk Sci. 2019, 10, 220–232. [Google Scholar] [CrossRef] [Scilit]
- Adger, W.N.; Hughes, T.P.; Folke, C.; Carpenter, S.R.; Rockström, J. Social-ecological resilience to coastal disasters. Science 2005, 309, 1036–1039. [Google Scholar] [CrossRef] [Scilit]
- Cutter, S.L.; Boruff, B.J.; Shirley, W.L. Social Vulnerability to Environmental Hazards. In Hazards Vulnerability and Environmental Justice; Taylor & Francis Group: London, UK, 2003; Volume 84, pp. 242–261. [Google Scholar] [CrossRef] [Scilit]
- Wisner, B.; Blaikie, P.; Cannon, T.; Davis, I. At Risk: Natural Hazards, People’s Vulnerability and Disasters, 2nd ed.; Routledge: London, UK, 2004. [Google Scholar]
- Manyena, S.B. The concept of resilience revisited. Disasters 2006, 30, 434–450. [Google Scholar] [CrossRef] [Scilit]
- Folke, C. Resilience: The emergence of a perspective for social–ecological systems analyses. Glob. Environ. Change 2006, 16, 253–267. [Google Scholar] [CrossRef] [Scilit]
- LaLone, M.B. Neighbors helping neighbors: An examination of the social capital mobilization process for community resilience to environmental disasters. J. Appl. Soc. Sci. 2012, 6, 209–237. [Google Scholar] [CrossRef] [Scilit]
- Mah, J.C.; Penwarden, J.L.; Pott, H.; Theou, O.; Andrew, M.K. Social vulnerability indices: A scoping review. BMC Public Health 2023, 23, 1253. [Google Scholar] [CrossRef] [Scilit] [PubMed]
- Mason, K.; Lindberg, K.; Haenfling, C.; Schori, A.; Marsters, H.; Read, D.; Borman, B. Social Vulnerability Indicators for Flooding in Aotearoa New Zealand. Int. J. Environ. Res. Public Health 2021, 18, 3952. [Google Scholar] [CrossRef] [Scilit]
- Chakraborty, L.; Rus, H.; Henstra, D.; Thistlethwaite, J.; Scott, D. A place-based socioeconomic status index: Measuring social vulnerability to flood hazards in the context of environmental justice. Int. J. Disaster Risk Reduct. 2020, 43, 101934. [Google Scholar] [CrossRef] [Scilit]
- Flanagan, B.E.; Gregory, E.W.; Hallisey, E.J.; Heitgerd, J.L.; Lewis, B. A Social Vulnerability Index for Disaster Management. J. Homel. Secur. Emerg. Manag. 2011, 8, 3. [Google Scholar] [CrossRef] [Scilit]
- Davino, C.; Gherghi, M.; Sorana, S.; Vistocco, D. Measuring Social Vulnerability in an Urban Space Through Multivariate Methods and Models. Soc. Indic. Res. 2021, 157, 1179–1201. [Google Scholar] [CrossRef] [Scilit] [PubMed]
- Wang, S.; Zhang, M.; Huang, X.; Hu, T.; Sun, Q.C.; Corcoran, J.; Liu, Y. Urban–rural disparity of social vulnerability to natural hazards in Australia. Sci. Rep. 2022, 12, 13665. [Google Scholar] [CrossRef] [Scilit]
- Holling, C.S. Resilience and stability of ecological systems. Annu. Rev. Ecol. Syst. 1973, 4, 460–482. [Google Scholar] [CrossRef] [Scilit]
- Klein, R.J.T.; Nicholls, R.J.; Thomalla, F. Resilience to natural hazards: How useful is this concept? Glob. Environ. Change Part B Environ. Hazards 2003, 5, 35–45. [Google Scholar] [CrossRef]
- Alexander, D.E. Resilience and disaster risk reduction: An etymological journey. Nat. Hazards Earth Syst. Sci. 2013, 13, 2707–2716. [Google Scholar] [CrossRef] [Scilit]
- Cutter, S.L.; Burton, C.G.; Emrich, C.T. Disaster resilience indicators for benchmarking baseline conditions. J. Homel. Secur. Emerg. Manag. 2010, 7, 51. [Google Scholar] [CrossRef] [Scilit]
- R: A Language and Environment for Statistical Computing, version 4.4.1. R Core Team. R Foundation for Statistical Computing: Vienna, Austria, 2024. Available online: https://www.R-project.org/ (accessed on 5 February 2026).
- Prall, M.C.; Brandt, U.S.; Halvorsen, N.S.; Hansen, M.U.; Dahlberg, N.; Andersen, K.J. A comprehensive approach for assessing social flood vulnerability and social flood risk: The case of Denmark. Int. J. Disaster Risk Reduct. 2024, 111, 104686. [Google Scholar] [CrossRef] [Scilit]
- Tierney, K. Social inequality, hazards, and disasters. In On Risk and Disaster: Lessons from Hurricane Katrina; Daniels, R.J., Kettl, D.F., Kunreuther, H., Eds.; University of Pennsylvania Press: Philadelphia, PA, USA, 2006; pp. 109–128. [Google Scholar] [CrossRef] [Scilit]
- Adger, W.N. Social and ecological resilience: Are they related? Prog. Hum. Geogr. 2000, 24, 347–364. [Google Scholar] [CrossRef] [Scilit]
- Magis, K. Community resilience: An indicator of social sustainability. Soc. Nat. Resour. 2010, 23, 401–416. [Google Scholar] [CrossRef] [Scilit]
- Berkes, F.; Ross, H. Community resilience: Toward an integrated approach. Soc. Nat. Resour. 2013, 26, 5–20. [Google Scholar] [CrossRef] [Scilit]
- Fothergill, A.; Peek, L.A. Poverty and disasters in the United States: A review of recent sociological findings. Nat. Hazards 2004, 32, 89–110. [Google Scholar] [CrossRef] [Scilit]
- Brunkard, J.; Namulanda, G.; Ratard, R. Hurricane Katrina deaths, Louisiana, 2005. Disaster Med. Public Health Prep. 2008, 2, 215–223. [Google Scholar] [CrossRef] [Scilit]
- West Virginia Conservation Agency (WVCA). Executive Summary, West Virginia Statewide Flood Protection Plan; West Virginia Conservation Agency: Charleston, WV, USA, 2004; Available online: https://www.wvca.us/flood/pdf/00_Executive_Summary.pdf (accessed on 2 February 2026).
- ArcGIS Pro, version 3.4. Esri. Environmental Systems Research Institute: Redlands, CA, USA, 2024. Available online: https://www.esri.com/en-us/arcgis/products/arcgis-pro/ (accessed on 5 February 2026).
- Federal Emergency Management Agency (FEMA). Substantial Damage Determinations; FEMA: Washington, DC, USA, 2021. Available online: https://www.fema.gov/fact-sheet/substantial-damage-determinations (accessed on 25 March 2025).
- Ahsan, M.N.; Warner, J. The Socioeconomic Vulnerability Index: A pragmatic approach for assessing climate-change led risks—A case study in the south-western coastal Bangladesh. Int. J. Disaster Risk Reduct. 2014, 8, 32–49. [Google Scholar] [CrossRef] [Scilit]
- Centers for Disease Control and Prevention/Agency for Toxic Substances and Disease Registry (CDC/ATSDR). Social Vulnerability Index (SVI) Data & Documentation; CDC/ATSDR: Atlanta, GA, USA, 2024. Available online: https://www.atsdr.cdc.gov/place-health/php/svi/svi-data-documentation-download.html?CDC_AAref_Val=https://www.atsdr.cdc.gov/placeandhealth/svi/data_documentation_download.html (accessed on 16 December 2024).
- Rufat, S.; Tate, E.; Burton, C.G.; Maroof, A.S. Social vulnerability to floods: Review of case studies and implications for measurement. Int. J. Disaster Risk Reduct. 2015, 14, 470–486. [Google Scholar] [CrossRef] [Scilit]
- Tate, E. Social vulnerability indices: A comparative assessment using uncertainty and sensitivity analysis. Nat. Hazards 2012, 63, 325–347. [Google Scholar] [CrossRef] [Scilit]
- Peacock, W.G.; Van Zandt, S.; Zhang, Y.; Highfield, W.E. Inequities in long-term housing recovery after disasters. J. Am. Plan. Assoc. 2014, 80, 356–371. [Google Scholar] [CrossRef] [Scilit]

Disclaimer/Publisher’s Note: The statements, opinions and data contained in all publications are solely those of the individual author(s) and contributor(s) and not of MDPI and/or the editor(s). MDPI and/or the editor(s) disclaim responsibility for any injury to people or property resulting from any ideas, methods, instructions or products referred to in the content. |
© 2026 by the authors. Licensee MDPI, Basel, Switzerland. This article is an open access article distributed under the terms and conditions of the Creative Commons Attribution (CC BY) license.