


Abstract
Land use change has direct human impacts and profoundly alters the structure and function of terrestrial ecosystems. Numerous studies have explored land use change dynamics in the context of socio-economics, often overlooking the influence of climate change on the potential suitability of land use. To address this gap, we propose an integrated framework combining CLUE-S and MaxEnt models to analyze how land use in Tai’an City, Shandong Province, China, responds to future socio-economic and climate change scenarios. The CLUE-S model, based on land demand, and the MaxEnt model, based on suitability assessment, can effectively explore the trends of land change under the influence of human activities and global warming. This study maps the spatial distributions of land use under socio-economic development and four climate change pathways. Overall, the AUC values of the CLUE-S model were all greater than 0.7, and those of the MaxEnt model were all greater than 0.5, indicating that the results of both are relatively reliable. Our study reveals that, within the baseline development (BL) scenario, cultivated land, forest land, grassland, and unused land are projected to decrease between 2020 and 2040. Conversely, the expansion of water bodies and built land will keep growing. In addition, climate change is expected to enhance the suitability of cultivated land between 2020 and 2040, while reducing that of forest land, grassland, unused land, and built land, with only minimal effects on water bodies. Finally, our framework projected that the most widespread priority areas are cultivated land, followed by forest, grassland, water, built land, and unused land. These priority areas are largely determined by human activities, while the influence of climate change is relatively small. Our research framework has broad applicability to the other regions. Considering the MaxEnt model within the framework is beneficial for excluding unsuitable distribution areas of land use types in the CLUE-S model, which will provide new insights for the sustainable use of land resources.
1. Introduction
As a critical spatial carrier for socio-economic activities and ecological civilization, land plays a key role in global change. Land use change refers to the process by which human activities alter natural landscapes or transform the use of land [1]. Land use change, arising from the interaction between political, economic, cultural, technological, and natural driving forces and their respective actors, represents a pivotal process of global change [2,3]. Changes in forests, cultivated land, water, and air are driven by human need such as food, fiber, water, and shelter [4]. Land use change allows humans to re-allocate and appropriate these resources and is, therefore, substantially affected by human activities and climate change. Thus, sustaining land use has become crucial in the industrialization and urbanization processes in different countries [5,6].
Promoting sustainable land use requires rational planning informed by multiple disciplines. Experts in geography, ecology, climatology, and management advocate for an objective-driven approach to land resource allocation [7]. Central to this approach are plans that address critical goals: ensuring food security and reducing the impacts of climate change [8]. For instance, some scholars advocated for a holistic landscape approach to sustainable land use in the tropics [9]. They emphasize that agricultural intensification is key to reconciling food production with climate change mitigation. Similarly, from the perspective of “production-living-ecological space,” some studies have proposed establishing land use evaluation index systems at both administrative and grid scales [10]. In many countries, remote sensing technology and geographic information systems are used to assess urban spatial expansion and land use changes [11,12]. Models such as CA-Markov, CULUE-S, and LUMOCAP have attracted considerable attention from scholars and play significant roles in urban planning and the simulation of land use changes [13,14,15]. In addition, conservation biologists have recently underscored the urgent need to prioritize the impacts of land use change on biodiversity [16]. They advocate for treating biodiversity as a paramount indicator in land use planning [17]. Consequently, the rational allocation of forest and grassland is garnering significant traction as a critical focus area. To sustainably meet human food requirements, the adequate protection of forests is foundational, with integrated conservation and farming being a cornerstone strategy [18,19,20]. A crucial oversight in this discourse, however, is the effect of climatic factors on land use changes. Climate change impacts terrestrial ecosystems temporally and spatially through shifts in temperature and precipitation. These changes alter the suitability of lands for agriculture or forestry, necessitating that managers identify and adopt the most suitable crops or tree species for projected climate conditions [21]. Global warming is driving numerous species to migrate toward higher latitudes to find new ecological niches, and their original habitats will become increasingly unsuitable [22,23]. This redistribution directly affects the suitability of land for different uses, thus transforming existing land use patterns [16]. Additionally, variations in temperature and precipitation may influence various human-dominated land use decisions, such as the redistribution and conversion of cultivated land, forest land, and grassland [24,25]. Over time, this will inevitably have profound impacts on human well-being and social sustainability. This underscores the necessity of predicting land use responses to a changing climate.
Since the implementation of China’s reform and opening-up policies, the country’s rapid shift from a planned economy to a market economy has accelerated urbanization and triggered significant transformations in land use patterns [26,27]. These changes have, in turn, led to critical socio-environmental challenges, including cultivated land loss, a rise in landless farmers, and abandoned villages [28,29]. Protecting arable land resources, ensuring food security, and achieving sustainable land use have garnered significant attention in both political and academic circles [30]. Land use change carries direct socio-economic implications, poses ecological challenges, and profoundly alters the structure and function of terrestrial ecosystems [31,32]. For example, the large-scale reclamation of forests and grasslands for agriculture, driven by population growth, has triggered severe soil erosion and increased the frequency of sandstorms [33,34]. Such natural disasters, including floods and droughts, now pose significant threats to human life and productive activities [35,36,37]. Therefore, in 2002, the Chinese government issued the “Several Opinions on Further Improving the Policy and Measures on Returning Farmland to Forests” and fully launched the “Returning Cultivated Land to Forest” program [38]. Guided by the principle of planting trees, shrubs, and grasses in suitable areas according to local conditions, China has worked to restore its forest and grassland vegetation [39]. As of 2020, with a central government investment of 535.3 billion yuan, 522 million mu of cultivated land had been returned to forest and grassland, leading to substantial ecological improvement [40]. Thus, balancing land use allocation with the continual improvement of land ecosystem functions has become a critical imperative.
This study examined the significant impacts of human activities and climate change on different land use types using Tai’an City in northern China as a case study. Since the onset of China’s reform and opening-up, substantial land use changes in Tai’an City have triggered a range of ecological and environmental challenges. In recent years, the urbanization process in Tai’an City has accelerated, with the scale of cities, towns, and villages continuously expanding [41,42]. However, insufficient study on land use suitability in Tai’an City has resulted in a certain degree of waste of land resources [43,44]. Therefore, this study proposed an integrated modeling framework by coupling the CLUE-S (the Conversion of Land Use and its Effects at Small regional extent) and MaxEnt (Maximum Entropy) models to predict land use changes and achieve reasonable land allocation under current and future climate change. Currently, the Cellular Automata (CA) model, InVEST model, multi-agent model, and the CLUE-S model have been used to simulate the change in land use and its effects [45,46]. Among these, CLUE-S model is the most commonly used to simulate high-resolution land use changes on a continental or regional scale [47]. Due to its strong predictive performance, high precision, and short running time, the MaxEnt model is widely favored by many scholars for simulating species habitat suitability under climate change [48]. Through our research framework, we aimed to: (1) quantify and map the extent to which climate change alters spatial land use patterns, (2) identify differences in land use change under different climate change scenarios, and (3) predict future change trends in land use patterns.
2. Materials and Methods
2.1. Research Design
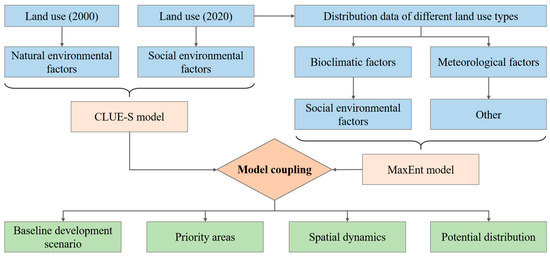
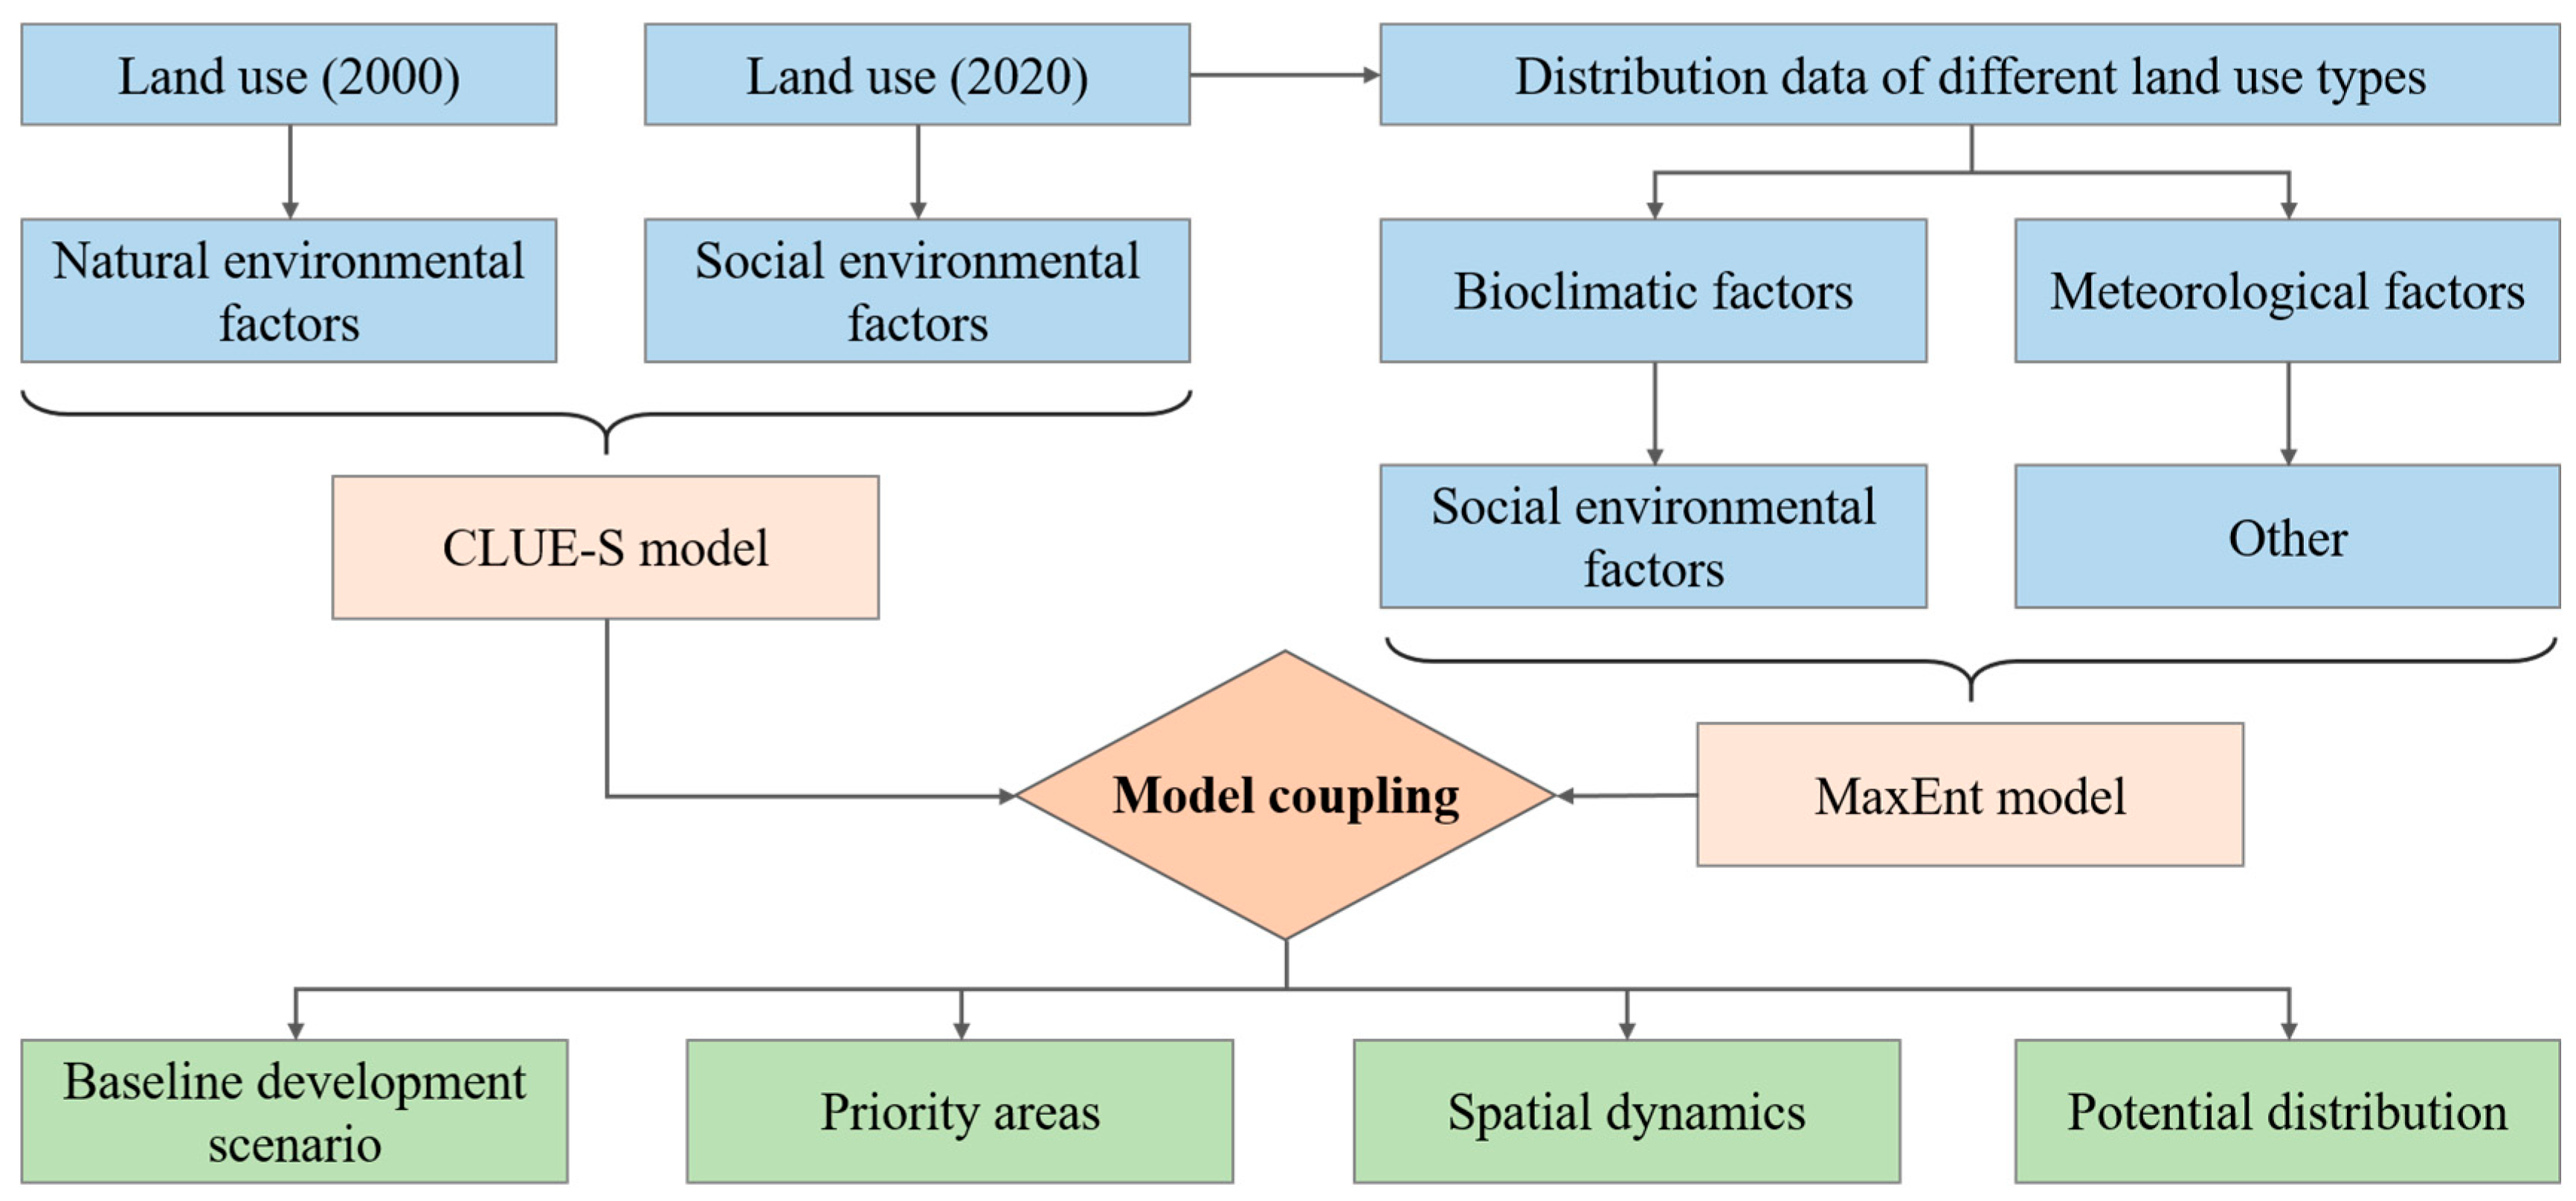
Due to its distinct geographical and ecological characteristics, Tai’an City in China was selected as the study area (Figure S1). The impacts of climate change on local land use types were explored using a coupled modeling approach integrating the CLUE-S and MaxEnt models (Figure 1). First, we explored land use changes and the driving factors in Tai’an City between 2000 and 2020 based on the CLUE-S model. After a reliable accuracy evaluation by using the area under the receiver operating characteristic (ROC) curve (AUC), we then used this model to predict the changes in land use patterns between 2020 and 2040 (Figure 1). Subsequently, the MaxEnt model was used to simulate the suitability distribution of cultivated land, forest, grassland, water, built land, and unused land in Tai’an City, and to evaluate the climate change affecting the distribution of various land types. Finally, the results of the CLUE-S and MaxEnt models were integrated to map the projected distribution and habitat suitability of six land use types (cultivated land, forest, grassland, water bodies, built land, and unused land) under multiple climate change scenarios.
Figure 1.
Integrated framework coupling the SLUE-S and MaxEnt models.
2.2. Simulating the Spatial Patterns of Land Use
2.2.1. Land Use and Environmental Data
Land use data for 2000 and 2020 (Figure 2), sourced from the Resource and Environment Data Cloud Platform of the Chinese Academy of Sciences (https://www.resdc.cn/; accessed on 1 December 2022) with an original resolution of 30 × 30 m, were employed to explore land use change in Tai’an City. The simulation of land use change in this study was based on natural and social environmental factors, which can reflect the land use change in Tai’an City as much as possible. Except for annual mean temperature and annual precipitation, which were obtained from CHELSA v.1.2 (http://www.paleoclim.org/, accessed on 15 December 2022), all other data were sourced from the Resource and Environment Data Cloud Platform of the Chinese Academy of Sciences (https://www.resdc.cn/, accessed on 20 December 2022). The natural environmental factors comprised altitude, aspect, annual mean temperature, annual precipitation, net primary productivity, normalized difference vegetation index, and slope. The social environmental factors include distance to the expressways, county highways, national roads, provincial roads, railways, and rivers; night-time lighting data; gross domestic product; and population density. Among them, distance to the expressways, county highways, national roads, provincial roads, railways, and rivers were determined through the vector data of those features, respectively, using the Euclidean distance method in ArcGIS 10.4. Finally, all environmental data were adjusted to a 200 × 200 m resolution to balance the model run time and reduce discrepancies with the MaxEnt model data. All environmental data are presented in Table S1 with named sc1gr0.fil–sc1gr15.fil.
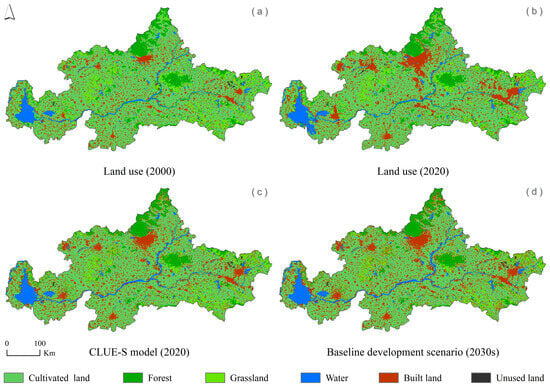
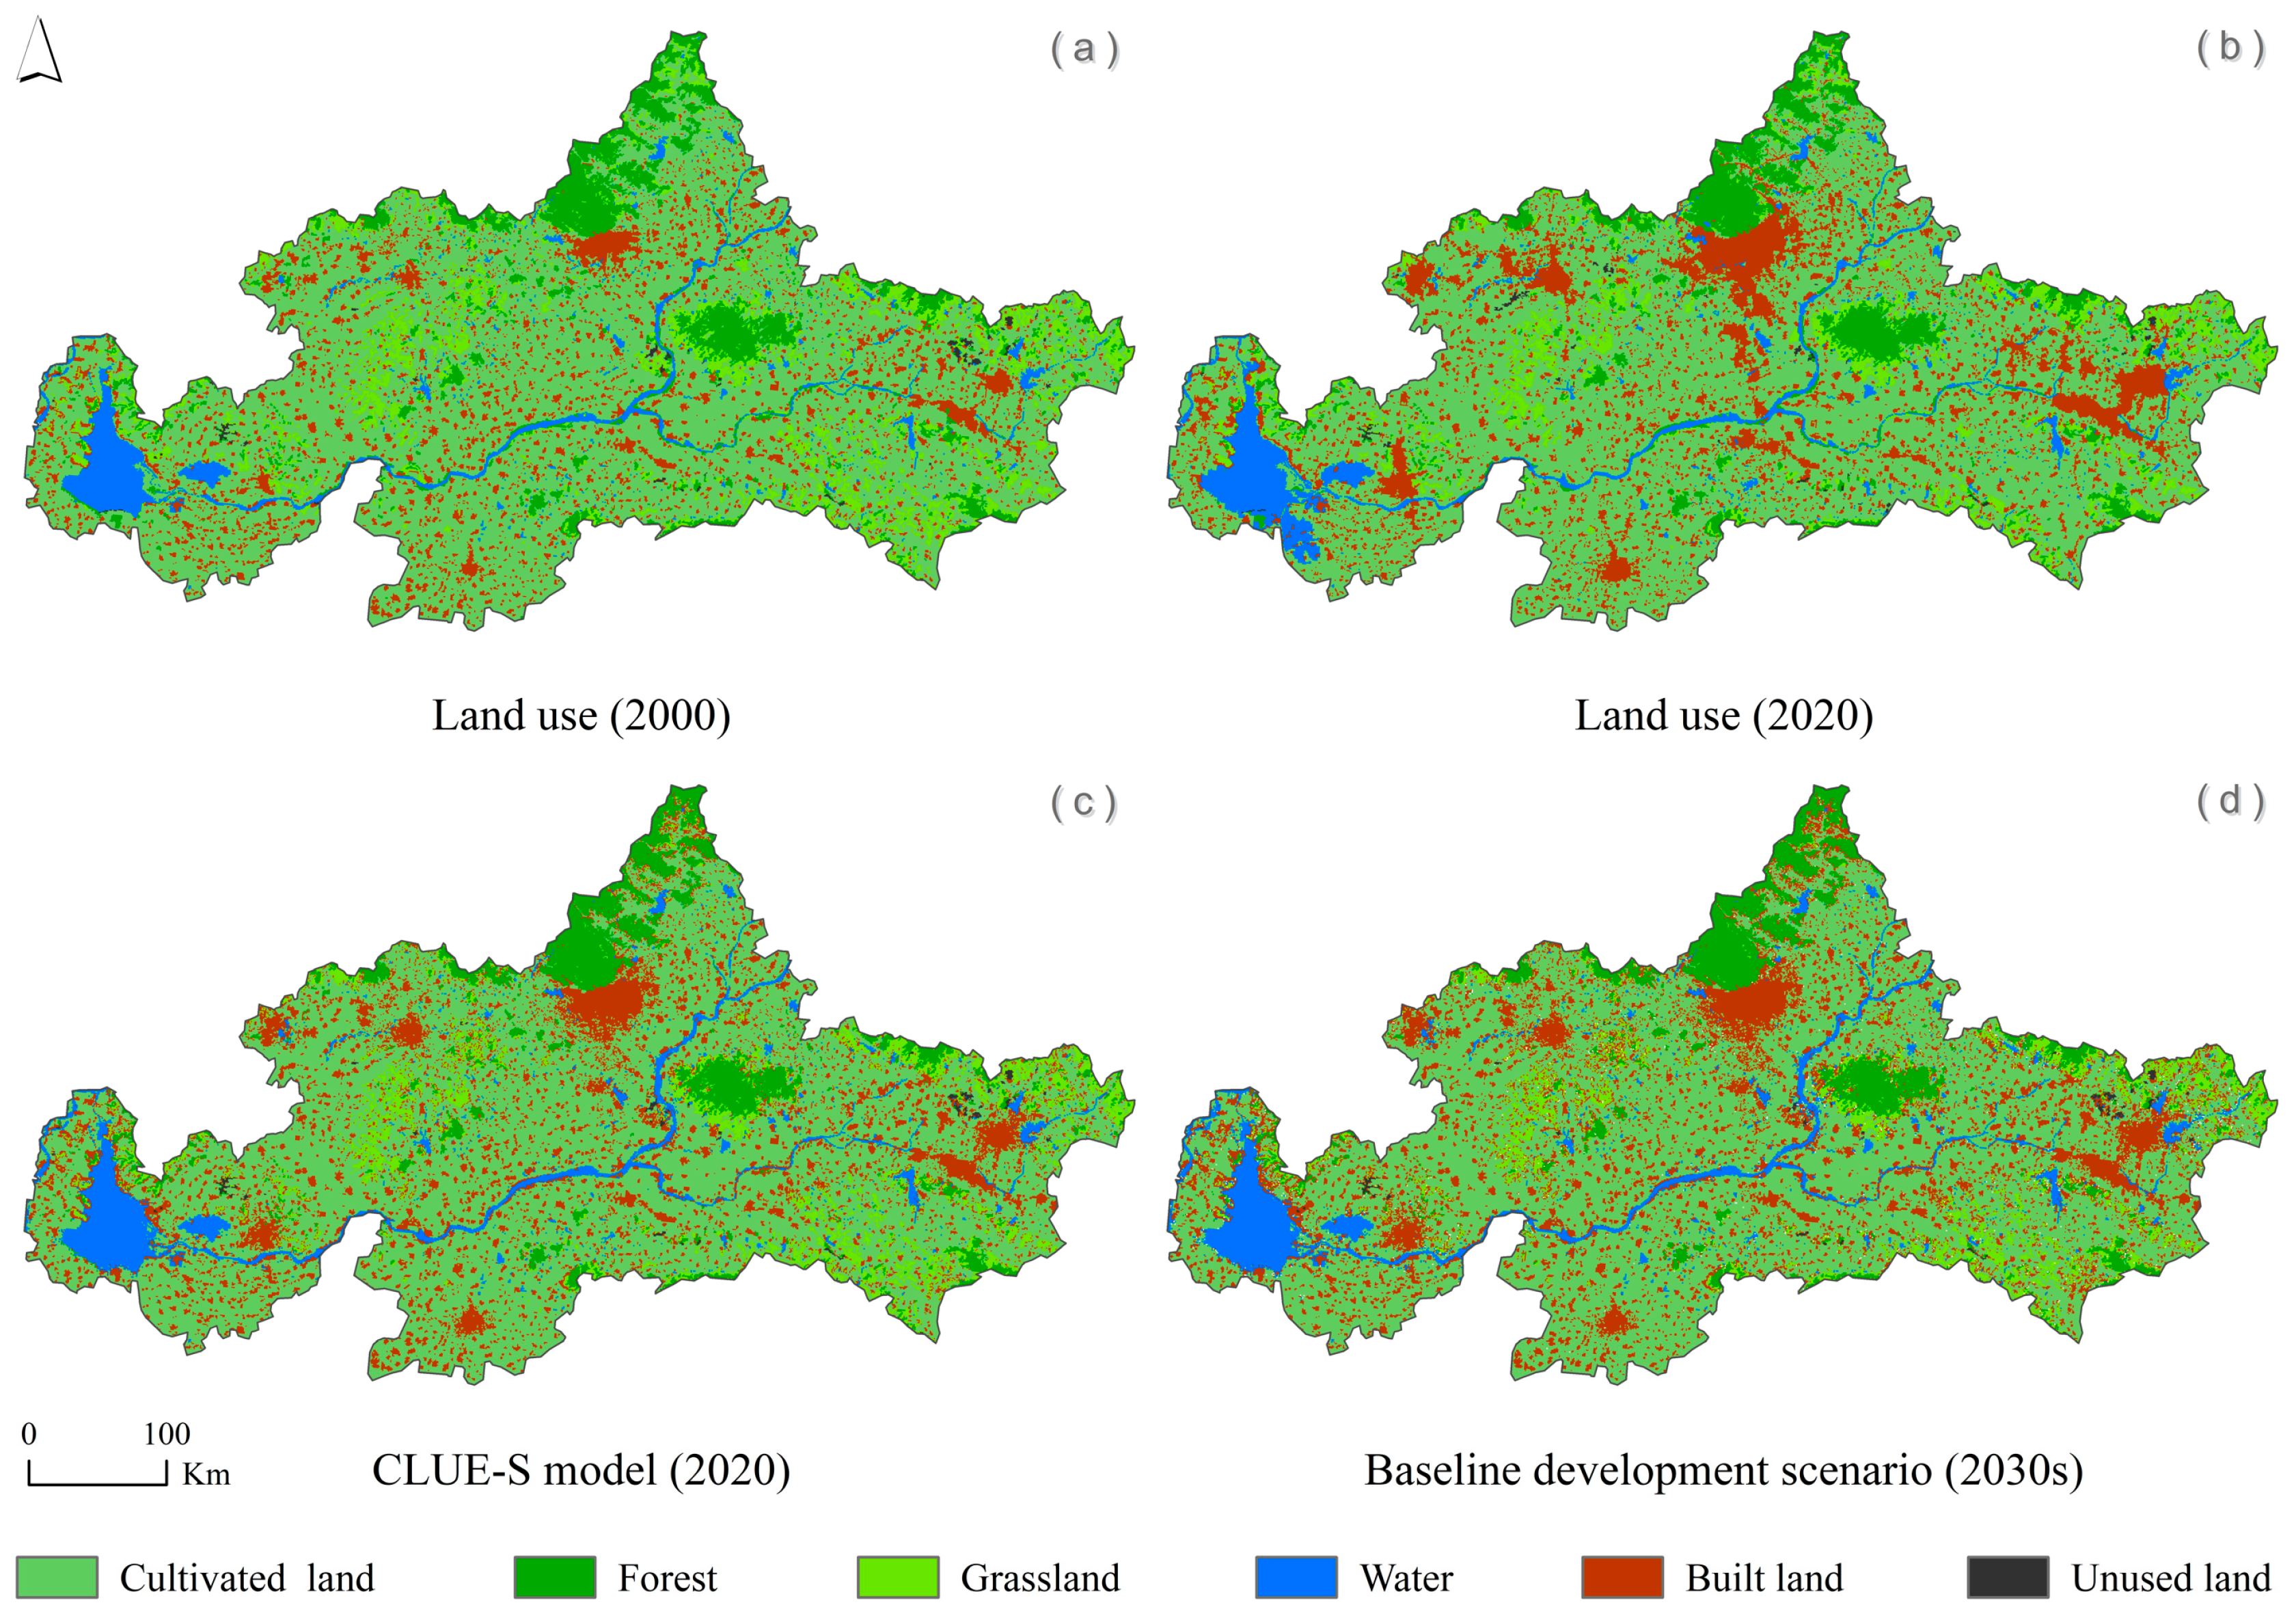
Figure 2.
Different land uses under distinct conditions. (a) Different land use types in 2000, (b) Different land use types in 2020, (c) Different simulation of land use types in 2020 by CLUE-S model, (d) Different simulation of land use types in 2030 by CLUE-S model.
2.2.2. Constructing Future Development Scenarios for Land Use
Comprising a non-spatial (demand) module and a spatial allocation module, the CLUE-S model (the Dyna-CLUE version 2.0) simulates land-use change in a two-stage process [49,50]. Initially, the demand module projects the quantitative requirements for various land use types. Subsequently, the spatial module distributes this projected demand to specific geographical locations at the grid level. This simulation framework is defined by four key components.
The projection of land use changes in Tai’an City was conducted using a Baseline Development (BL) scenario. This scenario models the continuation of the city’s established historical and current development trajectories, consistent with principles of land use demand prediction [51,52].
To reflect real-world urban development constraints, major river channels and reservoirs are incorporated into the CLUE-S simulation as restricted areas. These zones are defined as immutable constraints, preventing any simulated land use change, in line with best practices for preserving critical hydrological features.
Land use change involves transforming land categories based on a transition matrix. In the CLUE-S model, a conversion elasticity coefficient is assigned to each land use type, ranging from 0 to 1. A coefficient of 0 means change occurs readily, while a coefficient of 1 means change is forbidden. Thus, values closer to 1 indicate increasingly difficult change.
The CLUE-S model estimates the likelihood of specific land use types by calculating spatial distribution probabilities. These probabilities are based on statistical relationships between land use patterns and their drivers. Firstly, 16 natural and socio-economic driving factors (files sc1gr0.fil–sc1gr15.fil) were integrated to project spatial land use distributions in 2020, based on the actual land use distribution in both 2000 and 2020. We established a logistic regression model to predict spatial probabilities of land use. The model’s discriminatory power was assessed using the AUC value. Following the convention, an AUC approaching 1 signifies high accuracy, while an AUC near 0.5 suggests a model with little predictive ability [53]. A higher AUC value indicates a smaller difference between the land use in 2020 predicted by the CLUE-S model and the actual land use in 2020 [54]. Based on this validation, we then proceeded to apply the same data to simulate land use changes in Tai’an City from 2020 to 2040 under the Baseline (BL) scenario. Data for each year was exported in “ASC” format, and the average for the 20-year period was calculated with ArcGIS 10.4.
2.3. Modeling the Suitability Distribution of Land Use
2.3.1. Occurrence Data
The land use suitability simulation was based on high-resolution 2020 land use data for Tai’an City (Figure 2). Using ArcGIS 10.4, we overlaid a 200 × 200 m fishnet grid over the study area. The central point coordinates of each grid cell were subsequently calculated and spatially overlaid with the land use classification layer. Through this overlay analysis, the final distribution dataset was derived, containing 138,735 points for cultivated land, 15,734 for forest, 13,858 for grassland, 11,715 for water, 36,704 for built land, and 598 for unused land.
2.3.2. Environmental Data
The environmental data used in the land suitability simulation were classified into four categories: bioclimatic, meteorological, social environmental, and other factors. Current bioclimatic factors (BIO1–BIO19) were obtained from the CHELSA v.1.2 (http://www.paleoclim.org/, accessed on 5 January 2023). For future climate scenarios, corresponding bioclimatic factors were obtained from the World Climate Database (https://www.worldclim.org/, accessed on 8 January 2023). Meteorological factors were derived from ground observation data from the National Meteorological Center. We used ArcGIS 10.4 for Kriging interpolation to cover the study area with a resolution of 30 × 30 m (MFs1–MFs17). Social environmental factors were obtained from the Resource and Environment Data Cloud Platform of the Chinese Academy of Sciences (https://www.resdc.cn/, accessed on 9 January 2023) and included distances to expressways, county highways, national roads, provincial roads, railways, and rivers, as well as nighttime lighting data, gross domestic product, land use, and population density. Among them, the distance to the expressways, county highways, national roads, provincial roads, railways, and rivers were the same as those in the CLUE-S model. Other variables, including altitude, aspect, slope, net primary productivity, and normalized difference vegetation index, were obtained from the Resource and Environment Data Cloud Platform of the Chinese Academy of Sciences (https://www.resdc.cn/, accessed on 20 January 2023). All data were clipped to the study area and resampled to a 200 × 200 m resolution using ArcGIS 10.4.
Future bioclimatic factors (BIO1–BIO19) in a global climate model (BCC-CSM2-MR) were derived from the sixth phase of the Coupled Model Intercomparison Project (CMIP6) [55]. Then, four representative concentration pathways (SSP1-2.6, SSP2-4.5, SSP3-7.0, and SSP5-8.5) for 2021–2040 were used to simulate future suitability of land use. Among them, SSP1-2.6 will assume a “sustainable” development model, moderate population growth and green policies, while SSP5-8.5 will represent a high level of greenhouse gas emissions [56,57]. To compare the dynamic changes with the current distribution, we constructed four habitat suitability models (SSP1-2.6-2030s, SSP2-4.5-2030s, SSP3-7.0-2030s, and SSP5-8.5-2030s) for each land use type.
For 19 bioclimatic factors, 17 meteorological factors, and 10 social environmental factors, we applied a Pearson’s correlation filter with a threshold of |r| = 0.8 in R 4.3.1 to avoid multicollinearity [58]. We retained only one factor from any pair with a correlation coefficient > 0.8, while keeping both when correlation was below this threshold (Figures S2–S4). This procedure ensured a parsimonious set of independent variables for constructing robust MaxEnt models for the six target land types: cultivated land, forest, grassland, water, built land, and unused land (Tables S2 and S3).
2.3.3. Current and Future MaxEnt Modeling Processes
To enhance the predictive performance of models for six land use types under current and future climate changes, habitat suitability modeling was conducted using MaxEnt 3.4.3 software. For each land type, we used 75% of the occurrence points for model training and reserved the remaining 25% as a test set to evaluate model performance [48]. The analysis employed the following parameters: a maximum number of 500 iterations, convergence threshold of 10−5, and up to 10,000 background points [59].
Finally, we utilized the average predictions from 10 replicate runs under the cloglog output format as the final results. The accuracy of the MaxEnt model was evaluated using the AUC metric [60]. Model performance was classified with reference to standard AUC thresholds: 0.9–1.0 for “excellent”, 0.8–0.9 for “very good”, 0.7–0.8 for “average”, and below 0.7 for “poor” [48].
To assess the impacts of global warming on species distribution, we conducted future projections using MaxEnt. We employed four future climate scenarios (SSP1-2.6-2030s, SSP2-4.5-2030s, SSP3-7.0-2030s, and SSP5-8.5-2030s) as bioclimatic inputs. We kept all the model parameters identical to those used for simulating the current potential distribution. This design allowed us to specifically attribute changes in habitat suitability to climate variables. All model outputs were mapped in ArcGIS 10.4 and reclassified into four suitability categories based on natural breaks: highly suitable, moderately suitable, poorly suitable, and not suitable [61]. These four levels represent the degrees of habitat suitability for different land use types.
2.4. Identifying the Priority Areas for Land Use
To guide sustainable land use allocation, we overlaid land use projections with suitable areas for six land use types under multiple climate and urban development scenarios. Thus, we first identified priority areas for cultivated land, forest, grassland, water, built land, and unused land. Subsequently, these results were compared with the CLUE-S model’s projected land use for 2030 to analyze the dynamics of each land use type. The findings provide a forward-looking framework for rational land-use planning over the coming 20 years.
3. Results
3.1. Model Validation and Accuracy
The CLUE-S model accurately simulated land-use change, as validated by two key metrics. First, the AUC values from the logistic regression were all above 0.74, ranging from 0.749 for built land to 0.941 for water. Second, the spatial pattern of the simulated 2020 land use map, projected from 2000 to 2020, showed strong alignment with the actual 2020 distribution, with no significant spatial differences (Figure 2, Table 1). This finding confirms the robustness of both the selected environmental drivers and the model itself.
Table 1.
Different land use area under distinct conditions.
The AUC values from the ROC analysis of the MaxEnt model were 0.512 (cultivated land), 0.691 (forest), 0.700 (grassland), 0.723 (water), 0.612 (built land), and 0.960 (unused land) (Figure S5). This indicates that while the modeling accuracy was relatively low for cultivated land, it was good for the other land use types, with outstanding performance for unused land. The high level of human interference determines the poor performance and low credibility of the modeling of cultivated land suitability.
3.2. Spatial Patterns Under Distinct Conditions
The land use change in Tai’an City from 2000 to 2040 is diverse. Figure 2 shows the spatial pattern of land use in Tai’an City under the actual distribution and predicted results. Between 2000 and 2040, the differences between various land types are relatively high (Figure 2, Table 1). Among them, the areas of cultivated land, forest, grassland, and unused land will continue to decrease, while the areas of water bodies and built land will continue to increase. Specifically, from 2000 to 2020 and from 2020 to 2040, the reduction in cultivated land accounted for 5.13% and 3.06%, respectively; the reduction in forest accounted for 7.35% and 4.76%, respectively; the reduction in grassland accounted for 23.61% and 16.36%, respectively; the increase in water areas accounted for 17.95% and 8.7%, respectively; the increase in built land accounted for 44.12% and 14.97%, respectively; and the reduction in unused land accounted for 33.33% and 0%, respectively. Additionally, the land use areas for 2020 predicted by the CLUE-S model are almost identical to the actual land use data for 2020, with only minor differences in water bodies.
3.3. Current and Future Suitability Distribution
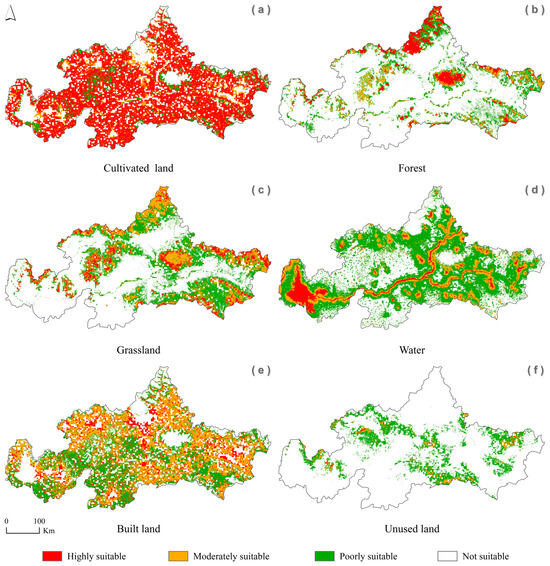
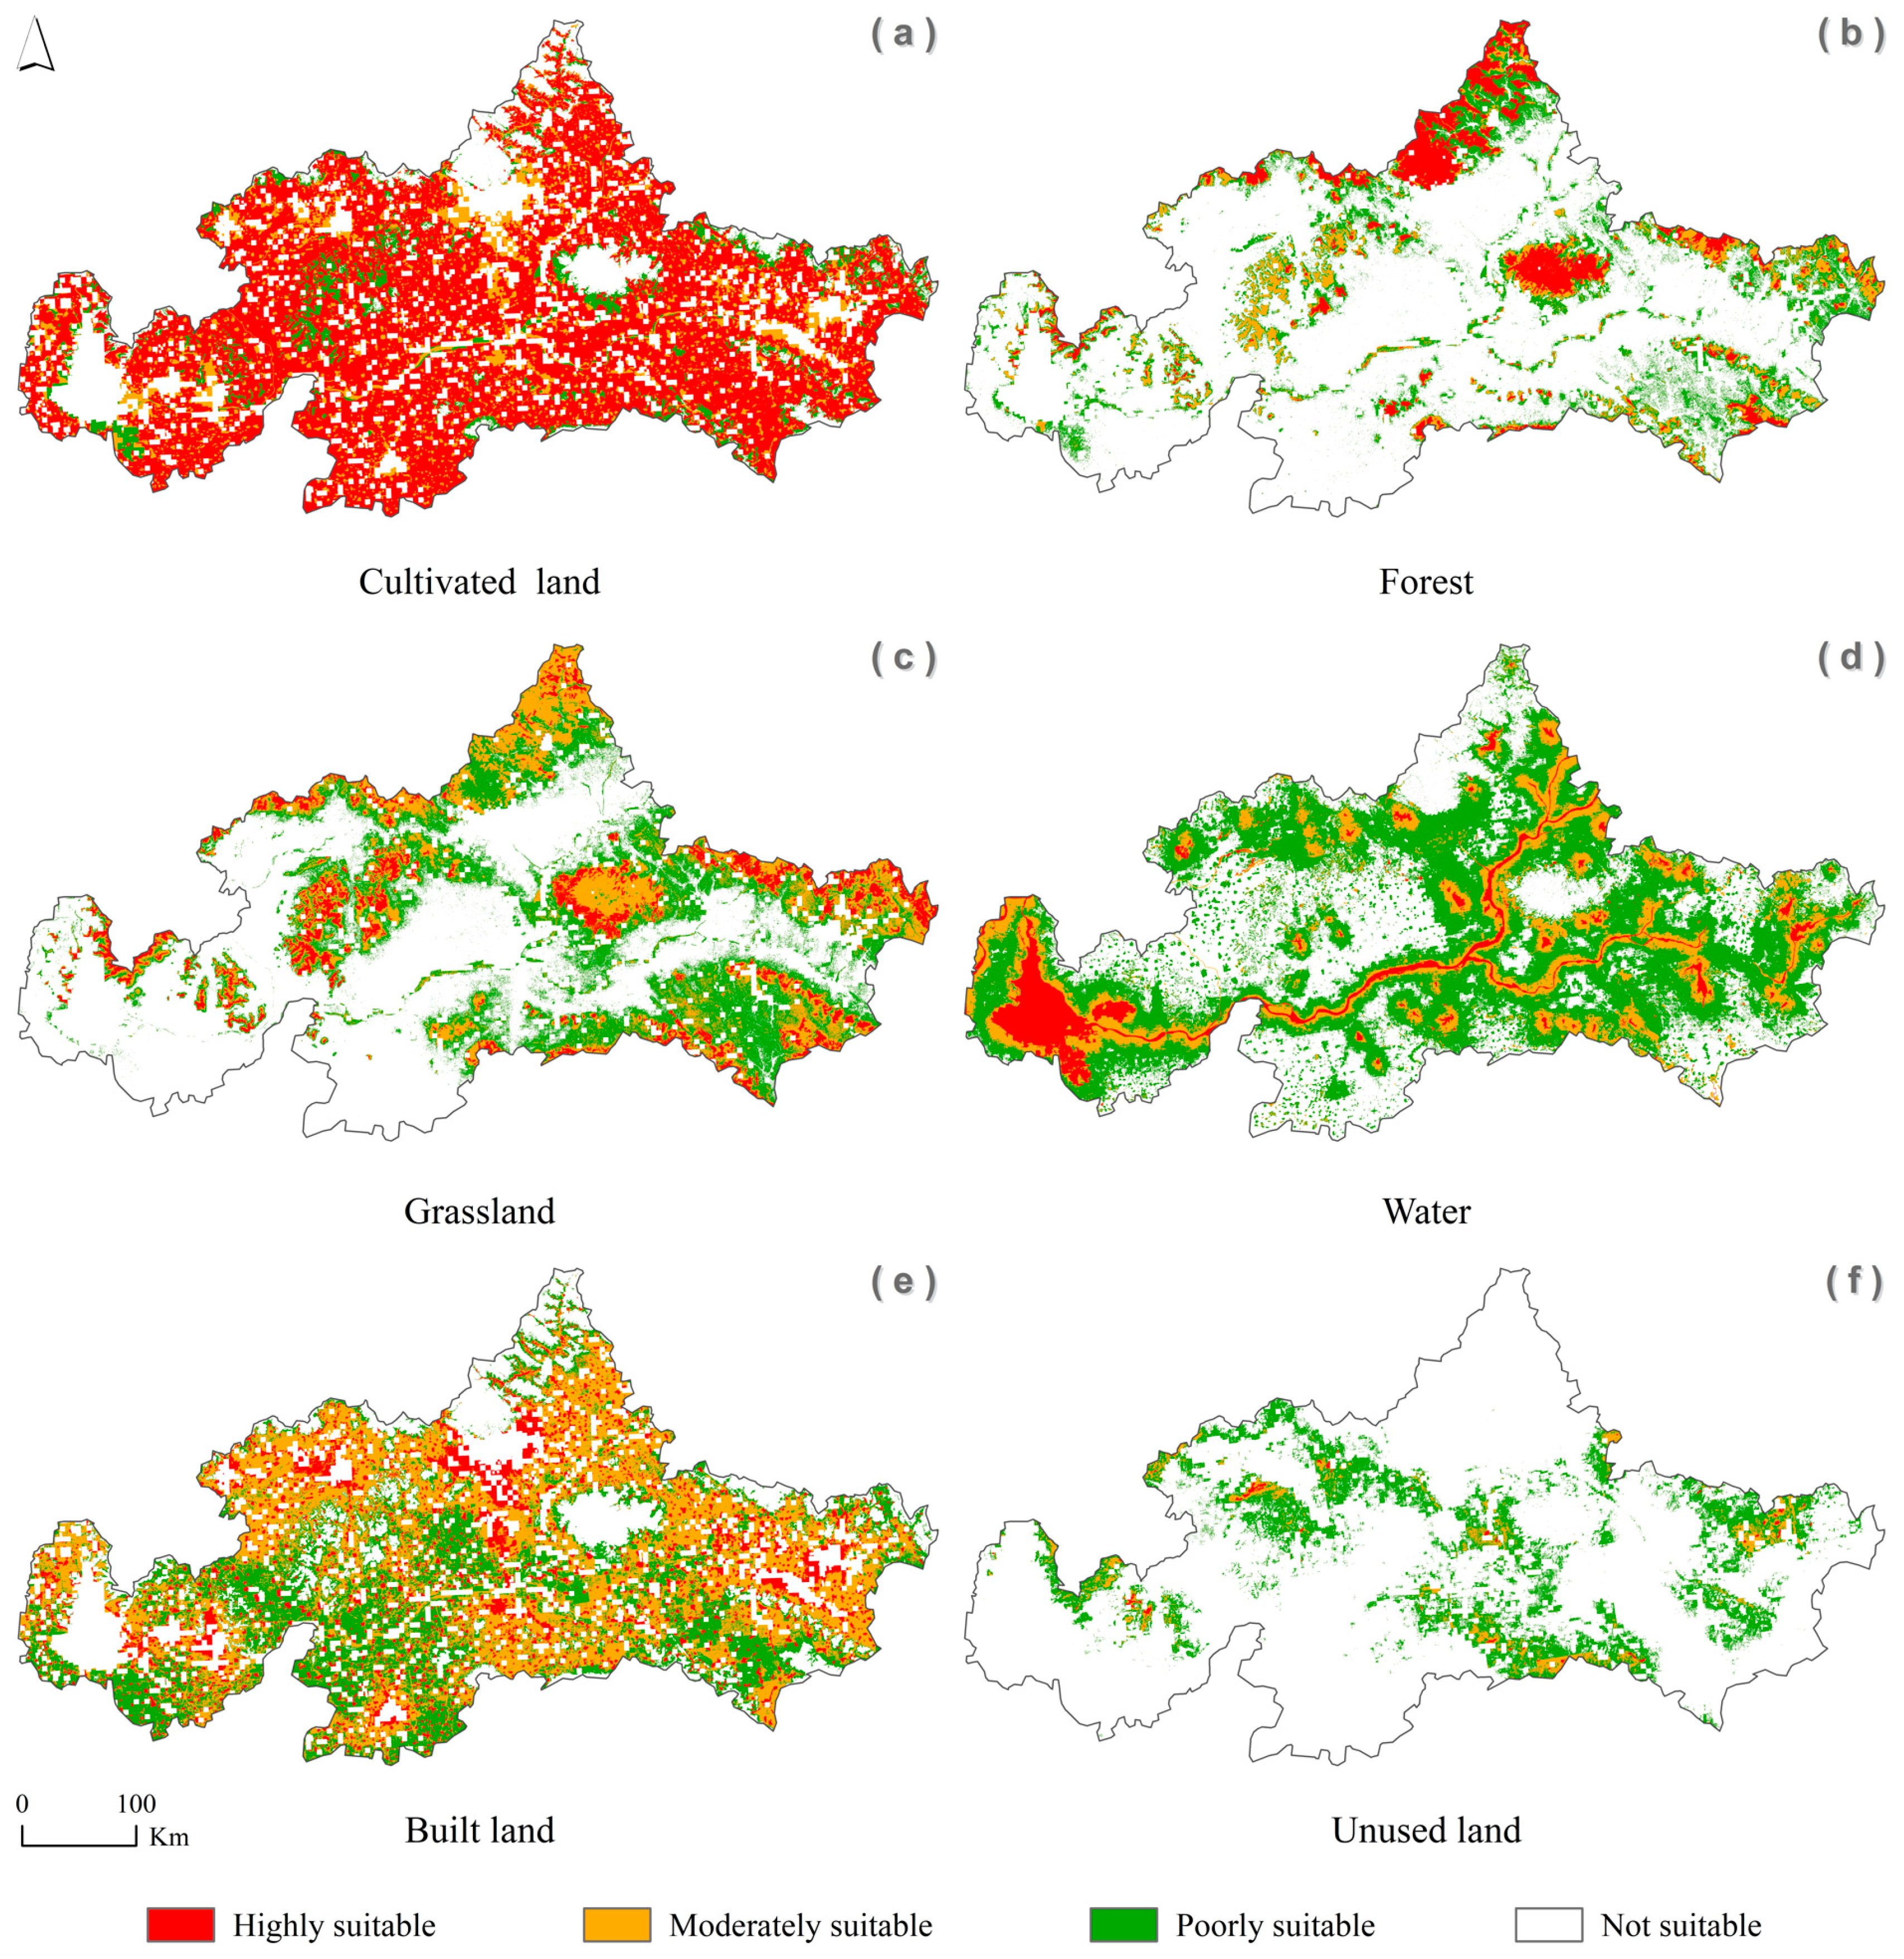
Compared with the actual land use distribution area of Tai’an City in 2020, the results of the MaxEnt model indicated that a large number of potential suitable habitats for six land use types were identified. For cultivated land, we identified the largest area as highly suitable, followed by as moderately suitable, and the smallest area as poorly suitable. Under current climate conditions, this study identified 127.49 × 10³ km2 of land suitable for cultivated land, of which 93.78 × 10³ km2 are highly suitable, 21.97 × 10³ km2 are moderately suitable, and 11.74 × 10³ km2 are poorly suitable. For forest, the largest area was identified as poorly suitable, followed by highly suitable, and the smallest area as moderately suitable. Under current climate conditions, we identified 45.2 × 10³ km2 of land suitable for forest land, of which 11.28 × 10³ km2 is highly suitable, 9.71 × 10³ km2 is moderately suitable, and 24.21 × 10³ km2 is poorly suitable. For grassland, we identified 70.87 × 10³ km2 of land suitable for grassland under current conditions, of which the smallest area (10.94 × 10³ km2) is highly suitable, 23.38 × 10³ km2 is moderately suitable, and the largest area (36.55 × 10³ km2) is poorly suitable. Additionally, for water bodies and unused land, the area change patterns are similar to those of grassland. For instance, under current climate conditions, we identified 106.4 × 10³ km2 and 28.29 × 10³ km2 of land suitable for water bodies and unused land, respectively, with highly suitable areas covering only 9.72 × 10³ km2 and 0.41 × 10³ km2, while poorly suitable areas are approximately 72.5 × 10³ km2 and 23.87 × 10³ km2, respectively. For built land, we identified 118.73 × 10³ km2 of land suitable under current climate conditions, of which the smallest area (19.76 km2) is highly suitable, the largest area (56.02 × 10³ km2) is moderately suitable, and 42.95 × 10³ km2 is poorly suitable.
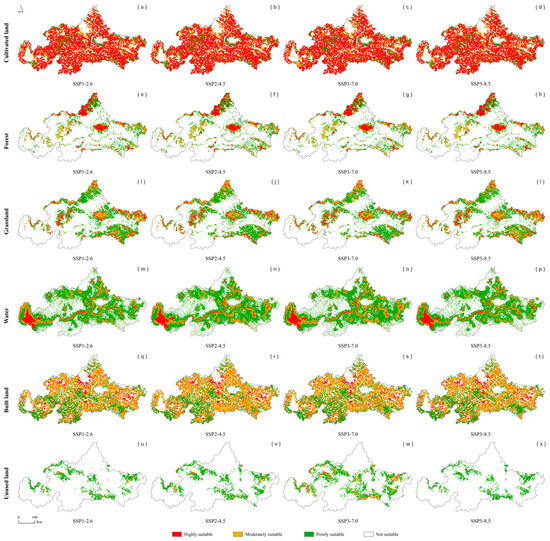
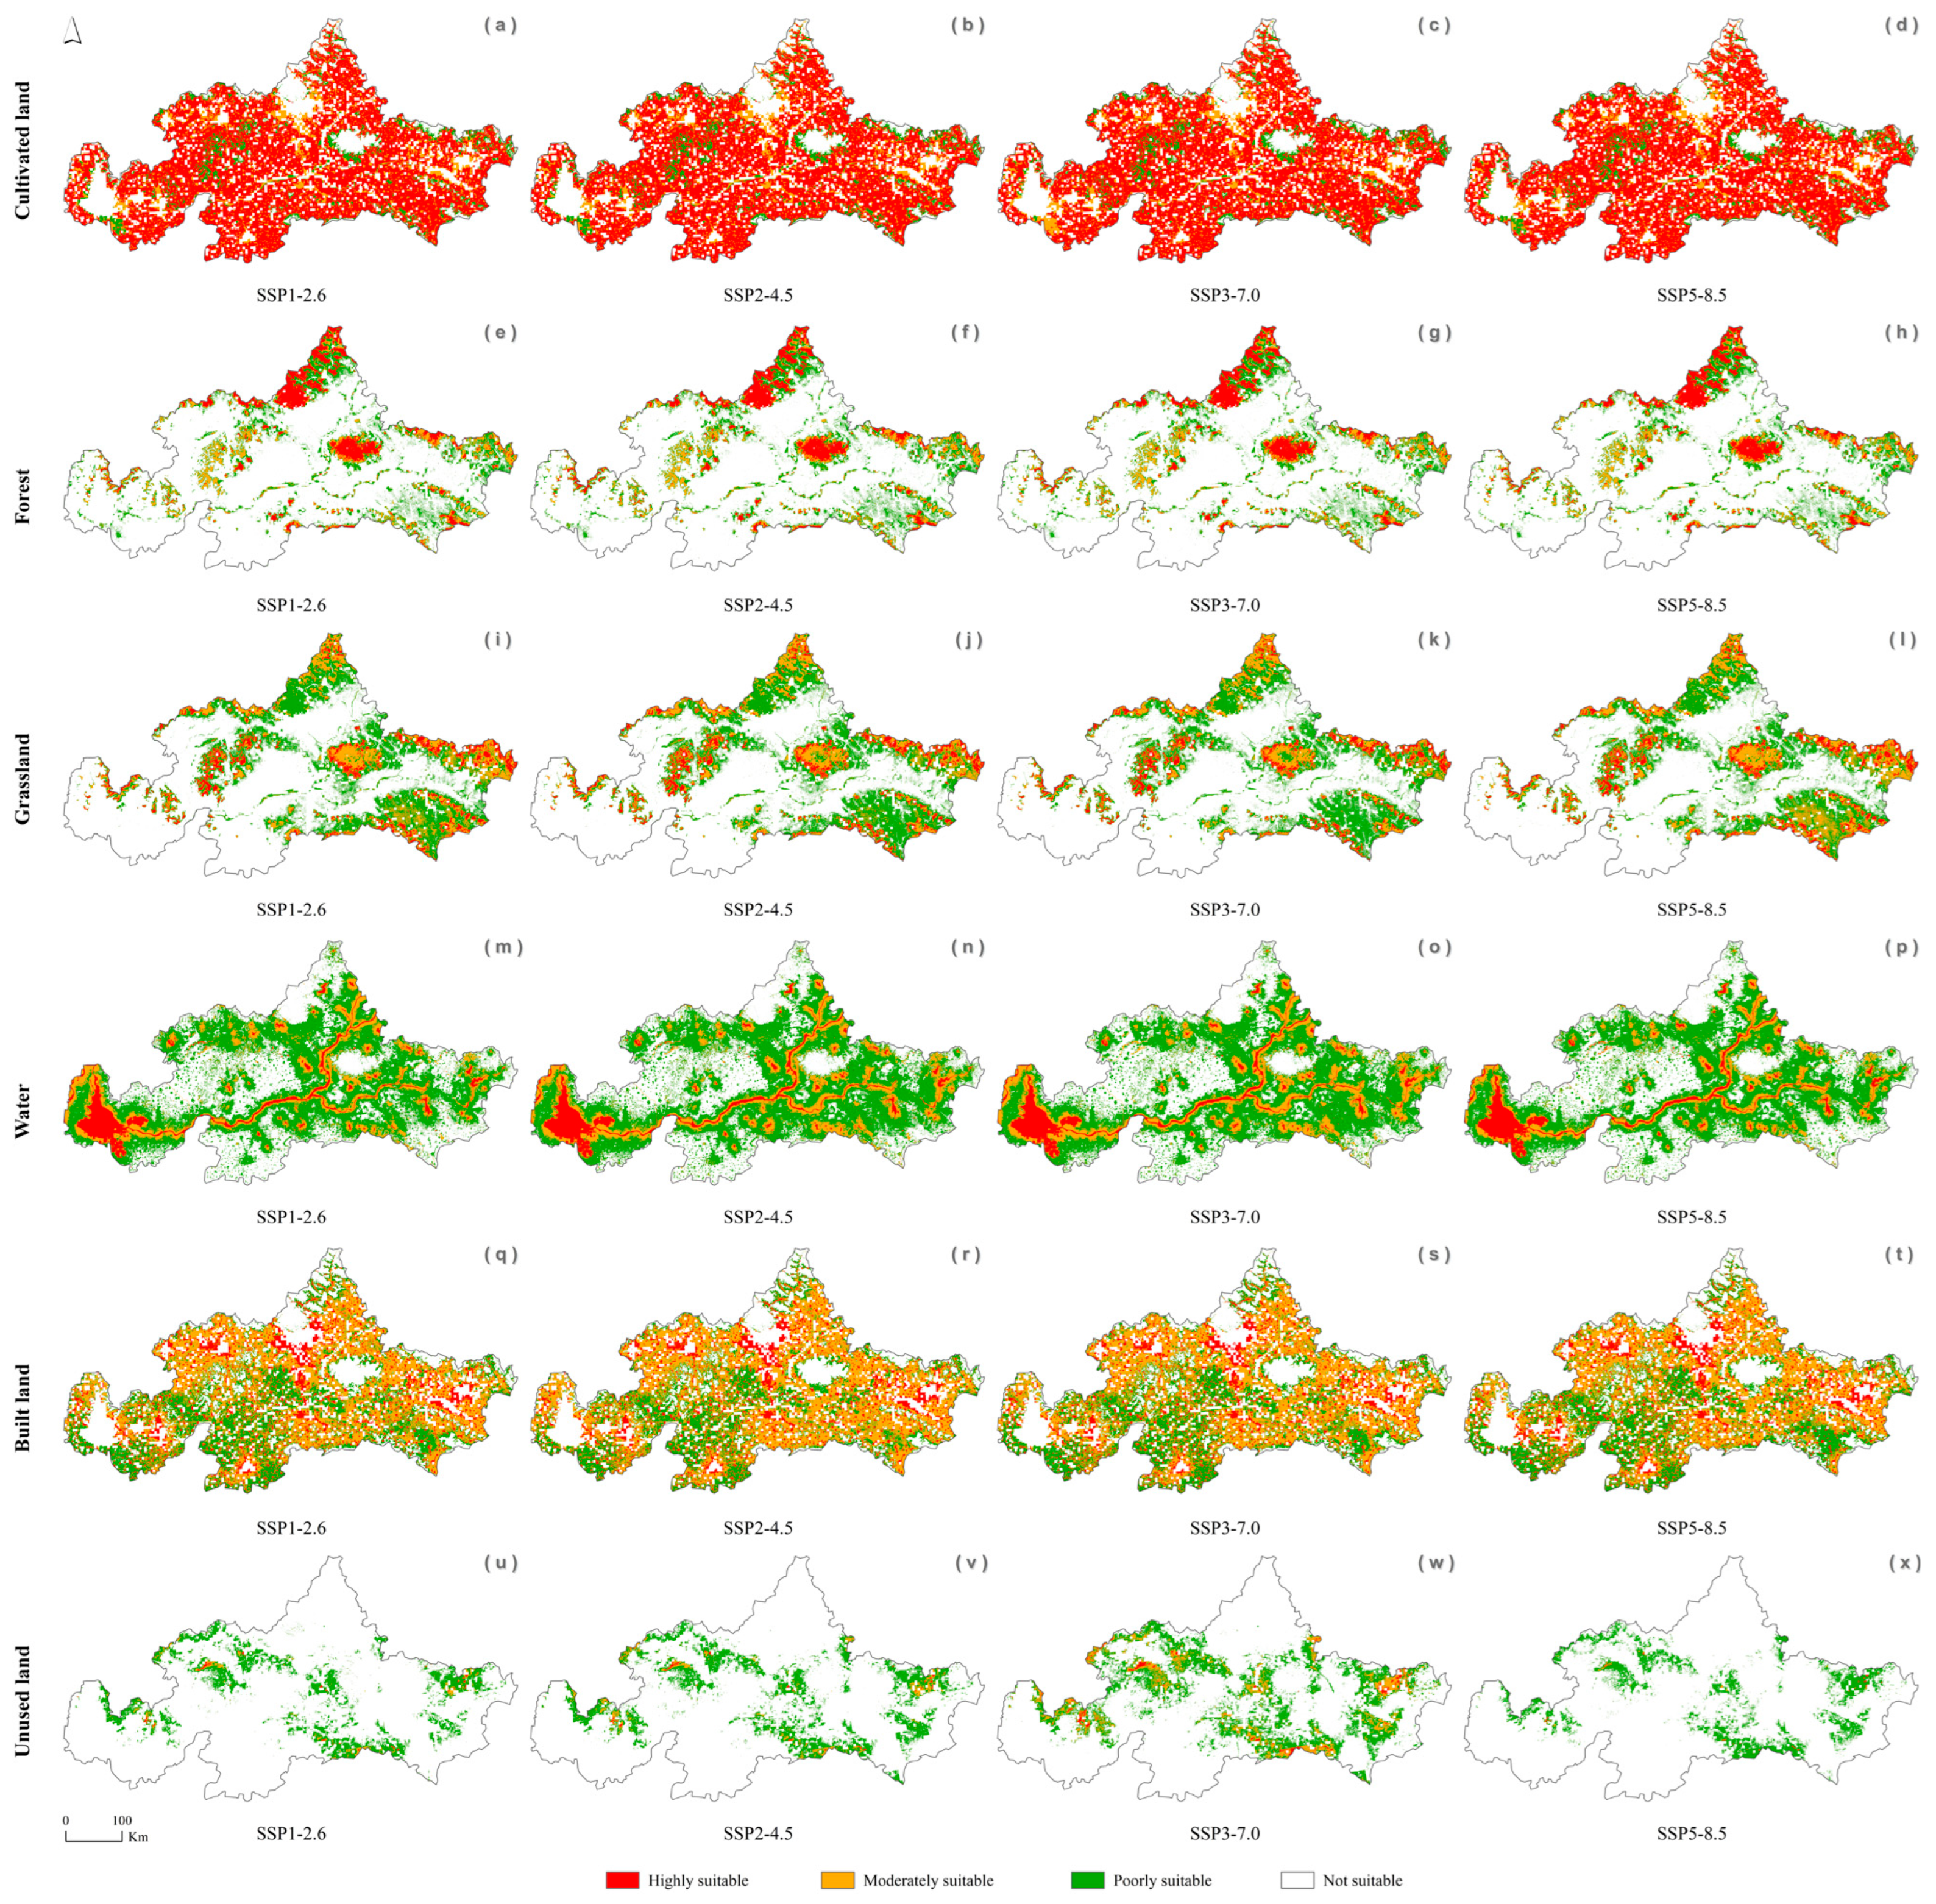
From the current time to the future, different land use types exhibit distinct change patterns (Figure 3 and Figure 4, Table S4). Overall, cultivated land will increase due to climate change, while forest, grassland, unused land, and built land will decrease. For water bodies, the suitable habitat areas remain relatively stable under the four climate change scenarios for 2030s, with some increases and decreases. Specifically, for cultivated land, the suitable areas obtained under the SSP1-2.6, SSP2-4.5, SSP3-7.0, and SSP5-8.5 scenarios in this study are 128.09 × 10³ km2, 128.97 × 10³ km2, 129.17 × 10³ km2, and 128.24 × 10³ km2, respectively. Therefore, under the SSP1-2.6, SSP2-4.5, SSP3-7.0, and SSP5-8.5 scenarios, approximately 0.47%, 1.16%, 1.32%, and 0.59% of the areas would increase, respectively. For forest land, we found that approximately 5.24%, 2.08%, 4.73%, and 6.44% of the suitable areas under the four climate change scenarios would decrease, respectively. For grassland, we identified that 10.2%, 11.51%, 16.81%, and 9.71% of suitable areas would decrease under the four climate change scenarios. For water bodies, we found that suitable habitats would decrease by 2.15% and 4.13% under the SSP1-2.6 and SSP5-8.5 scenarios, while approximately 4.78% and 3.05% of suitable areas would increase under the SSP2-4.5 and SSP3-7.0 scenarios. For built land, we found that suitable habitats would increase by 0.69% under the SSP2-4.5 scenario, but decrease by 0.88%, 0.3%, and 0.35% under the SSP1-2.6, SSP3-7.0, and SSP5-8.5 scenarios, respectively. For unused land, with the exception of an increase of 36.87% under the SSP3-7.0 scenario, habitats would decrease by 27.78%, 9.97%, and 34.5% under the SSP1-2.6, SSP2-4.5, and SSP5-8.5 scenarios, respectively.
Figure 3.
Current potential distribution of land use types in Tai’an City. (a–f) represent the potential habitat suitability of different land use types in Tai’an City.
Figure 4.
Future potential distribution of land use types in Tai’an City in the 2030s. (a–d) represent the potential habitat suitability of cultivated land in Tai’an City; (e–h) represent the potential habitat suitability of forest in Tai’an City; (i–l) represent the potential habitat suitability of grass land in Tai’an City; (m–p) represent the potential habitat suitability of water bodies in Tai’an City; (q–t) represent the potential habitat suitability of built land in Tai’an City; (u–x) represent the potential habitat suitability of unused land in Tai’an City.
3.4. Future Priority Areas and Spatial Dynamics of Different Land Use Types
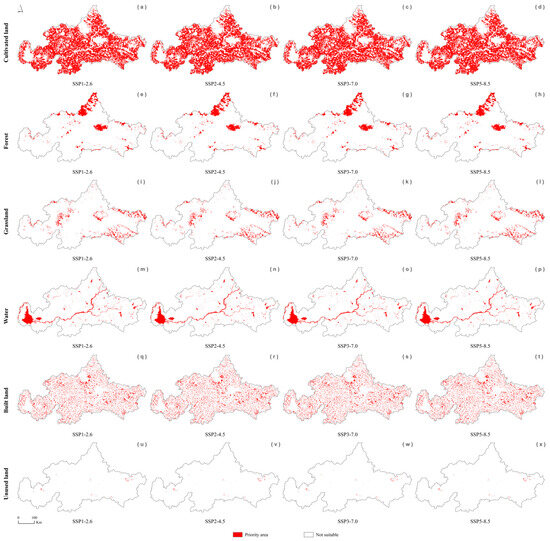
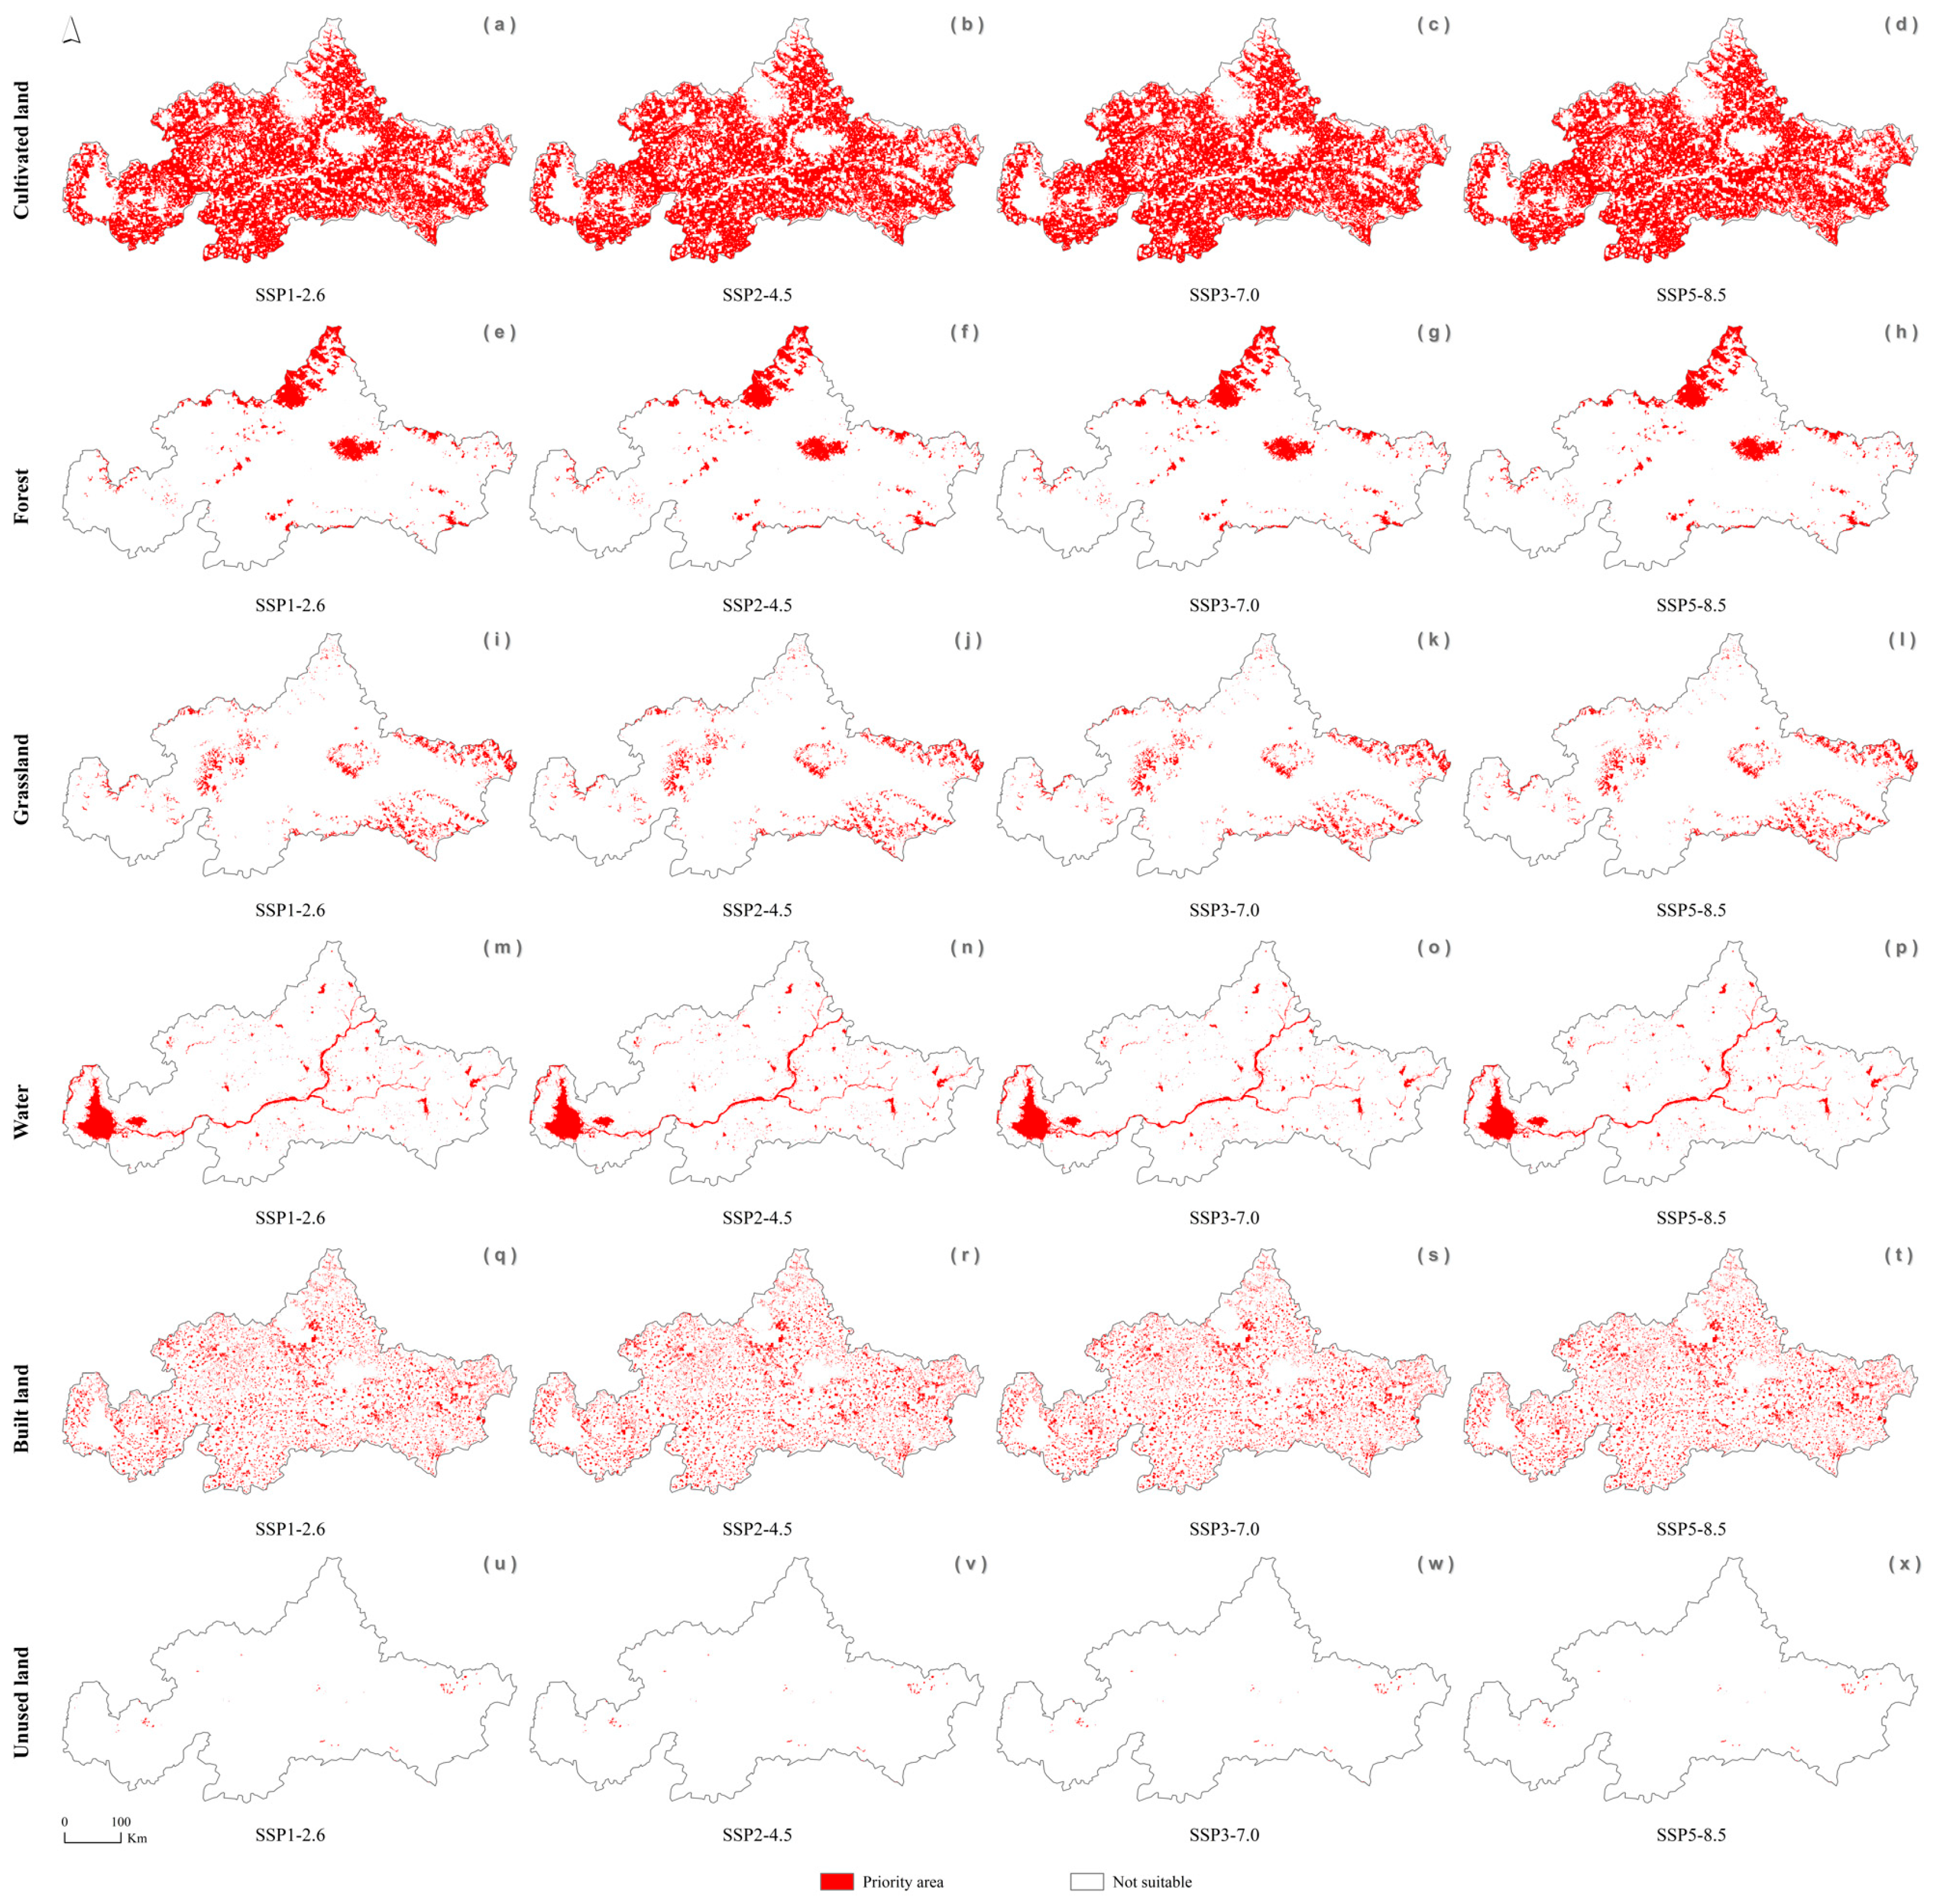
Under future EP development and climate change scenarios, we identified priority areas for each land use type by coupling CLUE-S model and MaxEnt model (Figure 5, Table 2). Overall, the priority areas for different land use types in Tai’an City are as follows: cultivated land, forest, grassland, water, built land, and unused land. Compared to the predictions results by of CLUE-S model in the 2030s, the priority area distribution of the six land use types is smaller, indicating that the role of the MaxEnt model is to reduce the unsuitable areas predicted by the CLUE-S model. Therefore, the impact of climate change on the priority areas is minimal. Significantly, the highest reduced proportion is for built land, followed by unused land, cultivated land, grassland, forest, and water. Specifically, under the SSP1-2.6, SSP2-4.5, SSP3-7.0, and SSP5-8.5 climate change scenarios, the priority area for cultivated land remains at 4.59 × 10³ km2 (with a reduction percentage of approximately 14.68%). For forest, the priority areas are mainly concentrated in the northern part of Tai’an City, with a coverage area of 0.57 × 10³ km2 under the four climate change scenarios (with a reduction percentage of approximately 5%). For grassland, the priority areas are primarily distributed in the western and eastern part of Tai’an City, with areas of 0.43 × 10³ km2, 0.42 × 10³ km2, 0.42 × 10³ km2, and 0.43 × 10³ km2 under the four climate change scenarios, respectively. Thus, under the SSP1-2.6, SSP2-4.5, SSP3-7.0, and SSP5-8.5 climate scenarios, the reduction in grassland is approximately 6.52%, 8.7%, 8.7%, and 6.52%, respectively. For water, the priority area under different climate change scenarios is 0.49 × 10³ km2 (with a reduction percentage of approximately 2%), and it is mainly located in the western part of Tai’an City and existing river basins. The priority areas for built land are 1.02 × 10³ km2, 1.05 × 10³ km2, 1.03 × 10³ km2, and 1.03 × 10³ km2, respectively, with reduction ratios of approximately 39.69%, 37.87%, 39.05%, and 39.05%. In addition, priority areas for built land are scattered throughout Tai’an City. For unused land, the distribution of priority areas is highly sparse, with areas of 1.01 × 10³ km2 (with a reduction percentage of approximately 50%) under the four climate change scenarios.
Figure 5.
Future priority areas of land use types in Tai’an City under the baseline development (BL) scenario and different climate change levels in the 2030s. (a–d) represent the priority areas of cultivated land in Tai’an City; (e–h) represent the priority areas of forest in Tai’an City; (i–l) represent the priority areas of grass land in Tai’an City; (m–p) represent the priority areas of water bodies in Tai’an City; (q–t) represent the priority areas of built land in Tai’an City; (u–x) represent the priority areas of unused land in Tai’an City.
Table 2.
Priority areas of different land use types between 2021 and 2040.
4. Discussion
4.1. Usefulness of the Framework and Overall Results
To achieve optimal land use configuration, this study proposes a novel analysis framework leveraging the CLUE-S and MaxEnt models. This framework is designed to simulate and project the spatial distribution dynamics of land use types under social development pathways and diverse climate change scenarios. As a typical empirical model, the CLUE-S framework simulates land use change by analyzing the dynamic interactions between land use competition and spatial drivers. Its effectiveness in modeling urban expansion and land use transitions has been demonstrated in numerous recent studies [49,62]. For the CLUE-S model, we achieved high AUC values, demonstrating that the simulation can effectively predict land use changes in Tai’an City from 2020 to 2040. Climate change is rapidly altering land use suitability. The MaxEnt model applies maximum entropy theory to assess the influence of environmental variables on distribution probabilities of species [63]. Although the AUC values for the six land use types are not high, particularly the very low AUC value for cultivated land (AUC = 0.512), this is an inevitable result of the high-precision environmental data in a small region [64]. Additionally, the current and future suitable areas predicted by the MaxEnt model are significantly larger than the actual distribution of the six land use types in 2020. However, the land use change trend obtained by the CLUE-S model is relatively small. Therefore, the priority areas derived from the overlay of the CLUE-S model and MaxEnt model results are primarily dominated by the CLUE-S model. The role of the MaxEnt model is to reduce the unsuitable areas in the predictions of the CLUE-S model for six land use types. This effect is beneficial to improving the sustainable use of land.
Under the BL scenario, spatial land use changes in Tai’an City are varied: cultivated land, forest land, grassland, and unused land will keep shrinking, while water bodies and built land will keep expanding. From current to future, MaxEnt projections indicate that future climate changes will most significantly affect the habitat suitability of cultivated land, which also demonstrates higher suitability than forest or grassland. The suitability of forest, grassland, and unused land is expected to decline. This study further identifies cultivated land as the highest-priority land type across various socio-development and climate scenarios, followed by forest, grassland, water bodies, built land, and unused land. The ranking of the six land use types by area is primarily determined by the original distribution of each land type, whereas climate change only affects the distribution area of each land type. Among them, the most severely affected is built land, followed by unused land, cultivated land, grassland, forest land, and water bodies. Therefore, although climate change has the greatest influence on cultivated land, it has a limited impact on the overall ranking of six land use types. These results offer a scientific foundation for rational land-resource utilization in Tai’an City and serves as a reference for land use planning in other regions.
4.2. Spatial Dynamics and Drivers of Land Use Changes
This study showed that the influence of socio-economic factors on various land types is greater than that of climate change. We identified numerous areas for cultivated land, forest, grassland, water, built land, and unused land, which should be prioritized for future land use planning. Following the market economy reforms, population growth and economic development have driven significant changes in the areas of both construction land and cultivated land [65,66]. Large forest or grassland areas were gradually converted into cultivated land. However, over the past 20 years, the city has undergone rapid development. The migration of the rural population to cities significantly influences this phenomenon. The loss of farmland clusters around villages, highlighting a pattern of encroachment primarily around settlements [44]. Thus, cultivated land, forest land, and grassland are projected to continue shrinking. Meanwhile, rapid urbanization will lead to a rise in floor space and hydraulic engineering causing an increase in water bodies and built land, and a corresponding decrease in unused land. These conclusions are consistent with findings reported in other studies [67,68]. In Europe, key drivers of change include economic, technological, institutional, and locational factors [69]. In contrast, early 21st-century regional development strategies like China’s “Western Development” are considered as crucial factors driving land change [70]. These human activities drive continuous changes in land use types.
However, climate change will alter the suitability of different land use types due to their sensitivity to climate. Several studies have shown that climate change will affect species suitability, thereby affecting biodiversity and vegetation cover, which will cause habitat fragmentation and increase the likelihood of change between land types [71,72]. The more fragile and unstable the land types, the more likely they are to be affected and converted into other types [73,74]. Numerous studies have shown that global warming will prompt the migration of plants and animals northward to find new suitable habitats [23]. Therefore, in Tai’an City, we predict that the potential distribution of forests and grasslands will gradually decrease. These reduced forest and grassland regions may be converted into cultivated land, increasing the suitability of such land due to human selection. Of course, unused land, due to its high degree of fragmentation, is also sensitive to climate change and can easily be converted into other land use types. As for built land, it is primarily regulated by human activities, so the impact of climate change on it is minimal, with very low levels of change. Additionally, Tai’an City is home to numerous mountains and rivers, such as Mount Tai and the Dawen River, which serve as excellent reservoirs of water resources. Therefore, global warming will have minimal influence on water resources in Tai’an City. Generally, forest land and grassland cannot be overlooked. An appropriate increase in forest and grassland resources is conducive to maintaining local biodiversity, improving ecosystem functions, and increasing carbon sequestration capacity. Although future climate change may be unfavorable for the expansion of forests and grasslands in Tai’an City over the next 20 years, appropriate human measures will compensate for this drawback.
4.3. Impacts of Land Use Change on Management
The complexity of land use makes its simulation a challenging endeavor. In response, this study introduces an integrated framework based on geographical and ecological principles. Consistent with prior studies emphasizing the need to incorporate ecosystem functions and tailor land use to local contexts in urban and resource planning [75,76,77], our research identifies priority areas for cultivated land, forest, grassland, water, built land, and unused land under both ecological protection and climate change scenarios (Figure 5, Table 2). These areas should be regarded as crucial for guiding land allocation over the next two decades.
Expanding forests, grasslands, and water bodies requires timely adjustments in land use to maximize both economic and ecological value. Concurrently, land fragmentation is a critical factor in land use planning [78,79]. As major drivers of worldwide species decline, landscape alteration and habitat fragmentation present a profound risk to global biodiversity [80,81]. Therefore, connecting habitats to create ecological corridors is an effective strategy for conserving fragmented land use patches [82,83]. In forests and grasslands, enhancing species diversity and planting different types of trees and understory plants are essential measures for habitat protection. During the process of forest land and grassland conservation, focusing on highly suitable areas is a beneficial protection measure (Figure 3 and Figure 4). Strengthening forest and grassland management, connecting fragmented habitats, and converting medium- and low-suitability lands into high-suitability lands are significant conservation measures. When delineating ecological protection red lines, an effective measure is to prioritize highly suitable areas for forests or grasslands, as these areas are ideal for plant growth (Figure 3 and Figure 4). Since cultivated land in Tai’an City is excessively fragmented and scattered, connecting these patches could threaten surrounding forests and grasslands. The fragmentation of cultivated land is largely driven by the dispersion of the rural population. Thus, keeping the areas of these priority cultivated lands unchanged may be reasonable. Meanwhile, surplus cultivated land and unused land should, where feasible, be converted into water bodies. Of course, when constructing water conservancy facilities, it is essential to select sites adjacent to existing water bodies to enhance overall connectivity [84].
In conclusion, our results highlight the future distribution of land use suitability in Tai’an City, which will provide a scientific basis for effective land use management. We believe that collaboration between land managers and scientists will optimize land resource allocation. Our study also has some limitations. In theory, the rational allocation of land use should consider land suitability and further account for changes within the system. For example, since the implementation of China’s reform and opening-up policies, the demand for land by enterprises of different ownership types has increased rapidly, encroaching on much agricultural lands. In addition, considering comprehensive impacts of multiple ecological niche models, distinct climate change patterns, and various climatic zones will enhance the robustness of the results. Accordingly, to improve the study framework, subsequent research will account for the influence of institutional management, multi-model approaches, and multiple climate patterns.
Supplementary Materials
The following supporting information can be downloaded at https://www.mdpi.com/article/10.3390/su18073313/s1.
Author Contributions
Conceptualization, P.H. and W.Z.; methodology, P.H.; software, Y.L.; validation, Y.L. and Y.X.; formal analysis, P.H., Y.L. and Y.X.; investigation, Y.L. and Y.X.; resources, Y.X.; data curation, P.H., Y.L. and Y.X.; writing—original draft preparation, P.H.; writing—review and editing, P.H. and W.Z.; visualization, P.H. and Y.L.; supervision, Y.L.; project administration, W.Z.; funding acquisition, W.Z. All authors have read and agreed to the published version of the manuscript.
Funding
This research was supported by the National Key R&D Program of China (2023YFC3205600): Green Watershed Evaluation Index System and Method.
Institutional Review Board Statement
Not applicable.
Informed Consent Statement
Not applicable.
Data Availability Statement
We confirm that the data supporting the results of this study are freely accessible in Figshare (https://doi.org/10.6084/m9.figshare.28130423.v2, accessed on 3 January 2025).
Conflicts of Interest
The authors declare no conflicts of interest.
Correction Statement
This article has been republished with a minor correction to the Funding statement. This change does not affect the scientific content of the article.
References
- Lambin, E.F.; Geist, H.J.; Lepers, E. Dynamics of land-use and land-cover change in tropical regions. Annu. Rev. Environ. Resour. 2003, 28, 205–241. [Google Scholar] [CrossRef] [Scilit]
- Foley, J.A.; DeFries, R.; Asner, G.P.; Barford, C.; Bonan, G.; Carpenter, S.R.; Snyder, P.K. Global consequences of land use. Science 2005, 309, 570–574. [Google Scholar] [CrossRef] [Scilit]
- Song, X.P.; Hansen, M.C.; Stehman, S.V.; Potapov, P.V.; Tyukavina, A.; Vermote, E.F.; Townshend, J.R. Global land change from 1982 to 2016. Nature 2018, 560, 639–643. [Google Scholar] [CrossRef] [Scilit]
- Veldkamp, A.; Lambin, E.F. Predicting land use change. Agric. Ecosyst. Environ. 2001, 85, 1–6. [Google Scholar] [CrossRef] [Scilit]
- Dale, V.H. The relationship between land-use change and climate change. Ecol. Appl. 1997, 7, 753–769. [Google Scholar] [CrossRef]
- Liu, C.; Deng, C.; Li, Z.; Liu, Y.; Wang, S. Optimization of spatial pattern of land use: Progress, frontiers, and prospects. Int. J. Environ. Res. Public Health 2022, 19, 5805. [Google Scholar] [CrossRef] [Scilit]
- Kuusaana, E.D.; Eledi, J.A. Customary land allocation, urbanization and land use planning in Ghana: Implications for food systems in the Wa Municipality. Land Use Policy 2015, 48, 454–466. [Google Scholar] [CrossRef] [Scilit]
- Hurlimann, A.; Moosavi, S.; Browne, G.R. Urban planning policy must do more to integrate climate change adaptation and mitigation actions. Land Use Policy 2021, 101, 105188. [Google Scholar] [CrossRef] [Scilit]
- Defries, R.; Rosenzweig, C. Toward a whole-landscape approach for sustainable land use in the tropics. Proc. Natl. Acad. Sci. USA 2010, 107, 19627–19632. [Google Scholar] [CrossRef] [Scilit]
- Fu, J.; Bu, Z.; Jiang, D.; Lin, G.; Li, X. Sustainable land use diagnosis based on the perspective of production–living–ecological spaces in China. Land Use Policy 2022, 122, 106386. [Google Scholar] [CrossRef] [Scilit]
- AbdelRahman, M.A. An overview of land degradation, desertification and sustainable land management using GIS and remote sensing applications. Rend. Lincei Sci. Fis. Nat. 2023, 34, 767–808. [Google Scholar] [CrossRef] [Scilit]
- Rozenstein, O.; Karnieli, A. Comparison of methods for land-use classification incorporating remote sensing and GIS inputs. Appl. Geogr. 2011, 31, 533–544. [Google Scholar] [CrossRef] [Scilit]
- Hamad, R.; Balzter, H.; Kolo, K. Predicting land use/land cover changes using a CA-Markov model under two different scenarios. Sustainability 2018, 10, 3421. [Google Scholar] [CrossRef] [Scilit]
- Tahir, Z.; Haseeb, M.; Mahmood, S.A.; Batool, S.; Abdullah-Al-Wadud, M.; Ullah, S.; Tariq, A. Predicting land use and land cover changes for sustainable land management using CA-Markov modelling and GIS techniques. Sci. Rep. 2025, 15, 3271. [Google Scholar] [CrossRef] [Scilit]
- Britz, W.; Verburg, P.H.; Leip, A. Modelling of land cover and agricultural change in Europe: Combining the CLUE and CAPRI-Spat approaches. Agric. Ecosyst. Environ. 2011, 142, 40–50. [Google Scholar] [CrossRef] [Scilit]
- Newbold, T.; Hudson, L.N.; Hill, S.L.; Contu, S.; Lysenko, I.; Senior, R.A.; Purvis, A. Global effects of land use on local terrestrial biodiversity. Nature 2015, 520, 45–50. [Google Scholar] [CrossRef] [Scilit] [PubMed]
- Oliver, T.H.; Morecroft, M.D. Interactions between climate change and land use change on biodiversity: Attribution problems, risks, and opportunities. Wiley Interdiscip. Rev.-Clim. Change 2014, 5, 317–335. [Google Scholar] [CrossRef] [Scilit]
- Mwavu, E.N.; Witkowski, E.T.F. Land-use and cover changes (1988–2002) around Budongo forest reserve, NW Uganda: Implications for forest and forest sustainability. Land Degrad. Dev. 2008, 19, 606–622. [Google Scholar] [CrossRef] [Scilit]
- Armenteras, D.; Murcia, U.; González, T.M.; Barón, Ó.J.; Arias, J.E. Scenarios of land use and land cover change for NW Amazonia: Impact on forest intactness. Glob. Ecol. Conserv. 2019, 17, e00567. [Google Scholar] [CrossRef] [Scilit]
- Renetzeder, C.; Schindler, S.; Peterseil, J.; Prinz, M.A.; Mücher, S.; Wrbka, T. Can we measure ecological sustainability? Landscape pattern as an indicator for naturalness and land use intensity at regional, national and European level. Ecol. Indic. 2010, 10, 39–48. [Google Scholar] [CrossRef] [Scilit]
- Popp, A.; Krause, M.; Dietrich, J.P.; Lotze-Campen, H.; Leimbach, M.; Beringer, T.; Bauer, N. Additional CO2 emissions from land use change—Forest conservation as a precondition for sustainable production of second generation bioenergy. Ecol. Econ. 2012, 74, 64–70. [Google Scholar] [CrossRef] [Scilit]
- Cuesta, F.; Tovar, C.; Llambí, L.D.; Gosling, W.D.; Halloy, S.; Carilla, J.; Pauli, H. Thermal niche traits of high alpine plant species and communities across the tropical Andes and their vulnerability to global warming. J. Biogeogr. 2020, 47, 408–420. [Google Scholar] [CrossRef] [Scilit]
- La Sorte, F.A.; Jetz, W. Tracking of climatic niche boundaries under recent climate change. J. Anim. Ecol. 2012, 81, 914–925. [Google Scholar] [CrossRef] [Scilit] [PubMed]
- Liu, X.; Liang, X.; Li, X.; Xu, X.; Ou, J.; Chen, Y.; Pei, F. A future land use simulation model (FLUS) for simulating multiple land use scenarios by coupling human and natural effects. Landsc. Urban Plan. 2017, 168, 94–116. [Google Scholar] [CrossRef] [Scilit]
- Zhang, M.; Gao, Y.; Ge, J. Different responses of extreme and mean precipitation to land use and land cover changes. npj Clim. Atmos. Sci. 2025, 8, 175. [Google Scholar] [CrossRef] [Scilit]
- Liu, Y.; Fang, F.; Li, Y. Key issues of land use in China and implications for policy making. Land Use Policy 2014, 40, 6–12. [Google Scholar] [CrossRef] [Scilit]
- Lu, Y.; Zhang, Y.; Cao, X.; Wang, C.; Wang, Y.; Zhang, M.; Zhang, Z. Forty years of reform and opening up: China’s progress toward a sustainable path. Sci. Adv. 2019, 5, eaau9413. [Google Scholar] [CrossRef] [Scilit]
- Li, Y. Urban-rural interaction in China: Historic scenario and assessment. China Agric. Econ. Rev. 2011, 3, 335–349. [Google Scholar] [CrossRef] [Scilit]
- Long, H.; Li, Y.; Liu, Y.; Woods, M.; Zou, J. Accelerated restructuring in rural China fueled by ‘increasing vs. decreasing balance’ land use policy for dealing with hollowed villages. Land Use Policy 2012, 29, 11–22. [Google Scholar] [CrossRef] [Scilit]
- Sun, X.; Xiang, P.; Cong, K. Research on early warning and control measures for arable land resource security. Land Use Policy 2023, 128, 106601. [Google Scholar] [CrossRef] [Scilit]
- Metzger, M.J.; Rounsevell, M.D.; Acosta-Michlik, L.; Leemans, R.; Schröter, D. The vulnerability of ecosystem services to land use change. Agric. Ecosyst. Environ. 2006, 114, 69–85. [Google Scholar] [CrossRef] [Scilit]
- Hasan, S.S.; Zhen, L.; Miah, M.G.; Ahamed, T.; Samie, A. Impact of land use change on ecosystem services: A review. Environ. Dev. 2020, 34, 100527. [Google Scholar] [CrossRef] [Scilit]
- Agarwal, P.; Sahoo, D.; Parida, Y.; Paltasingh, K.R.; Chowdhury, J.R. Land use changes and natural disaster fatalities: Empirical analysis for India. Ecol. Indic. 2023, 154, 110525. [Google Scholar] [CrossRef] [Scilit]
- Su, Q.; Chen, K.; Liao, L. The impact of land use change on disaster risk from the perspective of efficiency. Sustainability 2021, 13, 3151. [Google Scholar] [CrossRef] [Scilit]
- Shaw, R.; Banba, M. Land use management in disaster risk reduction: An overview. In Land Use Management in Disaster Risk Reduction: Practice and Cases from a Global Perspective; Springer: Tokyo, Japan, 2017; pp. 3–12. [Google Scholar] [CrossRef] [Scilit]
- Kato, S.; Huang, W. Land use management recommendations for reducing the risk of downstream flooding based on a land use change analysis and the concept of ecosystem-based disaster risk reduction. J. Environ. Manag. 2021, 287, 112341. [Google Scholar] [CrossRef] [Scilit]
- Hao, L.; van Westen, C.; Rajaneesh, A.; Sajinkumar, K.S.; Martha, T.R.; Jaiswal, P. Evaluating the relation between land use changes and the 2018 landslide disaster in Kerala, India. Catena 2022, 216, 106363. [Google Scholar] [CrossRef] [Scilit]
- Li, W.; Wang, W.; Chen, J.; Zhang, Z. Assessing effects of the Returning Farmland to Forest Program on vegetation cover changes at multiple spatial scales: The case of northwest Yunnan, China. J. Environ. Manag. 2022, 304, 114303. [Google Scholar] [CrossRef] [Scilit] [PubMed]
- Lichtenberg, E.; Ding, C. Assessing farmland protection policy in China. Land Use Policy 2008, 25, 59–68. [Google Scholar] [CrossRef] [Scilit]
- Gao, Y.; Liu, Z.; Li, R.; Shi, Z. Long-term impact of China’s returning farmland to forest program on rural economic development. Sustainability 2020, 12, 1492. [Google Scholar] [CrossRef] [Scilit]
- Han, S.; Han, X.F. Implementing a New Urbanization Strategy, Enhancing Tai’an’s Tourist Soft Power and Quickening Economic Development. Appl. Mech. Mater. 2012, 226, 2454–2457. [Google Scholar] [CrossRef] [Scilit]
- Huang, D.; Lang, Y.; Liu, T. The evolving structure of rural construction land in urbanizing China: Case study of Tai’an prefecture. Land 2021, 10, 65. [Google Scholar] [CrossRef] [Scilit]
- Zhang, W.; Peng, S.; Yang, J.; Cheng, P.; Zhang, A. Research of Land Use Change in Tai’An City Based on RS and GIS. In 2010 International Conference on Multimedia Technology; IEEE: New York, NY, USA, 2010; pp. 1–3. Available online: https://ieeexplore.ieee.org/abstract/document/5631220 (accessed on 1 October 2022).
- Huang, D.; Chen, Y.; Liu, T.; Liu, M. A GIS-based typological interpretation of cultivated land loss: A spatiotemporal analysis of Tai’an prefecture in the North China Plain. Land 2023, 12, 372. [Google Scholar] [CrossRef] [Scilit]
- Xu, Q.; Zhu, A.X.; Liu, J. Land-use change modeling with cellular automata using land natural evolution unit. Catena 2023, 224, 106998. [Google Scholar] [CrossRef] [Scilit]
- Filatova, T.; Verburg, P.H.; Parker, D.C.; Stannard, C.A. Spatial agent-based models for socio-ecological systems: Challenges and prospects. Environ. Model. Softw. 2013, 45, 1–7. [Google Scholar] [CrossRef] [Scilit]
- Peng, K.; Jiang, W.; Deng, Y.; Liu, Y.; Wu, Z.; Chen, Z. Simulating wetland changes under different scenarios based on integrating the random forest and CLUE-S models: A case study of Wuhan Urban Agglomeration. Ecol. Indic. 2020, 117, 106671. [Google Scholar] [CrossRef] [Scilit]
- Barber, R.A.; Ball, S.G.; Morris, R.K.; Gilbert, F. Target-group backgrounds prove effective at correcting sampling bias in Maxent models. Divers. Distrib. 2022, 28, 128–141. [Google Scholar] [CrossRef] [Scilit]
- Huang, D.; Huang, J.; Liu, T. Delimiting urban growth boundaries using the CLUE-S model with village administrative boundaries. Land Use Policy 2019, 82, 422–435. [Google Scholar] [CrossRef] [Scilit]
- Kiziridis, D.A.; Mastrogianni, A.; Pleniou, M.; Tsiftsis, S.; Xystrakis, F.; Tsiripidis, I. Improving the predictive performance of CLUE-S by extending demand to land transitions: The trans-CLUE-S model. Ecol. Model. 2023, 478, 110307. [Google Scholar] [CrossRef] [Scilit]
- Jiang, W.; Chen, Z.; Lei, X.; Jia, K.; Wu, Y. Simulating urban land use change by incorporating an autologistic regression model into a CLUE-S model. J. Geogr. Sci. 2015, 25, 836–850. [Google Scholar] [CrossRef] [Scilit]
- Wang, H.; Zhang, C.; Yao, X.; Yun, W.; Ma, J.; Gao, L.; Li, P. Scenario simulation of the tradeoff between ecological land and farmland in black soil region of Northeast China. Land Use Policy 2022, 114, 105991. [Google Scholar] [CrossRef] [Scilit]
- Braimoh, A.K.; Onishi, T. Spatial determinants of urban land use change in Lagos, Nigeria. Land Use Policy 2007, 24, 502–515. [Google Scholar] [CrossRef] [Scilit]
- Akın, A.; Erdoğan, N.; Berberoğlu, S.; Çilek, A.; Erdoğan, A.; Donmez, C.; Şatir, O. Evaluating the efficiency of future crop pattern modelling using the CLUE-S approach in an agricultural plain. Ecol. Inform. 2022, 71, 101806. [Google Scholar] [CrossRef] [Scilit]
- Cao, B.; Bai, C.; Wu, K.; La, T.; Su, Y.; Che, L.; Li, G. Tracing the future of epidemics: Coincident niche distribution of host animals and disease incidence revealed climate-correlated risk shifts of main zoonotic diseases in China. Glob. Change Biol. 2023, 29, 3723–3746. [Google Scholar] [CrossRef] [Scilit]
- Cao, Z.; Zhang, L.; Zhang, X.; Guo, Z. Predicting the potential distribution of Hylomecon japonica in China under current and future climate change based on Maxent model. Sustainability 2021, 13, 11253. [Google Scholar] [CrossRef] [Scilit]
- Ali, S.; Makanda, T.A.; Umair, M.; Ni, J. MaxEnt model strategies to studying current and future potential land suitability dynamics of wheat, soybean and rice cultivation under climatic change scenarios in East Asia. PLoS ONE 2023, 18, e0296182. [Google Scholar] [CrossRef] [Scilit]
- He, P.; Guo, L.; Liu, Y.; Meng, F.; Peng, C. Spatial dynamic simulation of important cash crops based on phenology with Scutellaria baicalensis Georgi as an example. Eur. J. Agron. 2023, 144, 126748. [Google Scholar] [CrossRef] [Scilit]
- He, P.; Li, Y.; Xu, N.; Peng, C.; Meng, F. Predicting the suitable habitats of parasitic desert species based on a niche model with Haloxylon ammodendron and Cistanche deserticola as examples. Ecol. Evol. 2021, 11, 17817–17834. [Google Scholar] [CrossRef] [Scilit]
- Kramer-Schadt, S.; Niedballa, J.; Pilgrim, J.D.; Schröder, B.; Lindenborn, J.; Reinfelder, V.; Wilting, A. The importance of correcting for sampling bias in MaxEnt species distribution models. Divers. Distrib. 2013, 19, 1366–1379. [Google Scholar] [CrossRef] [Scilit]
- Zhao, Y.; Deng, X.; Xiang, W.; Chen, L.; Ouyang, S. Predicting potential suitable habitats of Chinese fir under current and future climatic scenarios based on Maxent model. Ecol. Inform. 2021, 64, 101393. [Google Scholar] [CrossRef] [Scilit]
- Druga, M.; Minár, J. Cost distance and potential accessibility as alternative spatial approximators of human influence in LUCC modelling. Land Use Policy 2023, 132, 106840. [Google Scholar] [CrossRef] [Scilit]
- Schmitt, T.; Habel, J.C.; Rödder, D.; Louy, D. Effects of recent and past climatic shifts on the genetic structure of the high mountain Yellow-spotted ringlet butterfly Erebia manto (Lepidoptera, Satyrinae): A conservation problem. Glob. Change Biol. 2014, 20, 2045–2061. [Google Scholar] [CrossRef] [Scilit]
- Low, B.W.; Zeng, Y.; Tan, H.H.; Yeo, D.C. Predictor complexity and feature selection affect Maxent model transferability: Evidence from global freshwater invasive species. Divers. Distrib. 2021, 27, 497–511. [Google Scholar] [CrossRef] [Scilit]
- Deininger, K. Land markets in developing and transition economies: Impact of liberalization and implications for future reform. Am. J. Agric. Econ. 2003, 85, 1217–1222. [Google Scholar] [CrossRef] [Scilit]
- Zhou, Y.; Li, X.; Liu, Y. Rural land system reforms in China: History, issues, measures and prospects. Land Use Policy 2020, 91, 104330. [Google Scholar] [CrossRef] [Scilit]
- Meyfroidt, P.; Lambin, E.F.; Erb, K.H.; Hertel, T.W. Globalization of land use: Distant drivers of land change and geographic displacement of land use. Curr. Opin. Environ. Sustain. 2013, 5, 438–444. [Google Scholar] [CrossRef] [Scilit]
- Alexander, P.; Rounsevell, M.D.; Dislich, C.; Dodson, J.R.; Engström, K.; Moran, D. Drivers for global agricultural land use change: The nexus of diet, population, yield and bioenergy. Glob. Environ. Change 2015, 35, 138–147. [Google Scholar] [CrossRef] [Scilit]
- Van Vliet, J.; de Groot, H.L.; Rietveld, P.; Verburg, P.H. Manifestations and underlying drivers of agricultural land use change in Europe. Landsc. Urban Plan. 2015, 133, 24–36. [Google Scholar] [CrossRef] [Scilit]
- Liu, J.; Zhang, Z.; Xu, X.; Kuang, W.; Zhou, W.; Zhang, S.; Jiang, N. Spatial patterns and driving forces of land use change in China during the early 21st century. J. Geogr. Sci. 2010, 20, 483–494. [Google Scholar] [CrossRef] [Scilit]
- Pielke, R.A., Sr. Land use and climate change. Science 2005, 310, 1625–1626. [Google Scholar] [CrossRef] [Scilit] [PubMed]
- De Chazal, J.; Rounsevell, M.D. Land use and climate change within assessments of biodiversity change: A review. Glob. Environ. Change 2009, 19, 306–315. [Google Scholar] [CrossRef] [Scilit]
- Abdullah, S.A.; Nakagoshi, N. Forest fragmentation and its correlation to human land use change in the state of Selangor, peninsular Malaysia. For. Ecol. Manag. 2007, 241, 39–48. [Google Scholar] [CrossRef] [Scilit]
- Semper-Pascual, A.; Burton, C.; Baumann, M.; Decarre, J.; Gavier-Pizarro, G.; Gómez-Valencia, B.; Kuemmerle, T. How do habitat amount and habitat fragmentation drive time-delayed responses of biodiversity to land-use change? Proc. R. Soc. B 2021, 288, 20202466. [Google Scholar] [CrossRef] [Scilit]
- DeFries, R.S.; Foley, J.A.; Asner, G.P. Land-use choices: Balancing human needs and ecosystem function. Front. Ecol. Environ. 2004, 2, 249–257. [Google Scholar] [CrossRef]
- Long, H.; Liu, Y.; Hou, X.; Li, T.; Li, Y. Effects of land use transitions due to rapid urbanization on ecosystem services: Implications for urban planning in the new developing area of China. Habitat Int. 2014, 44, 536–544. [Google Scholar] [CrossRef] [Scilit]
- Liu, W.; Zhan, J.; Zhao, F.; Yan, H.; Zhang, F.; Wei, X. Impacts of urbanization-induced land use changes on ecosystem services: A case study of the Pearl River Delta Metropolitan Region, China. Ecol. Indic. 2019, 98, 228–238. [Google Scholar] [CrossRef] [Scilit]
- Lam, N.S.N.; Cheng, W.; Zou, L.; Cai, H. Effects of landscape fragmentation on land loss. Remote Sens. Environ. 2018, 209, 253–262. [Google Scholar] [CrossRef] [Scilit]
- Ntihinyurwa, P.D.; de Vries, W.T.; Chigbu, U.E.; Dukwiyimpuhwe, P.A. The positive impacts of farm land fragmentation in Rwanda. Land Use Policy 2019, 81, 565–581. [Google Scholar] [CrossRef] [Scilit]
- Wilson, M.C.; Chen, X.Y.; Corlett, R.T.; Didham, R.K.; Ding, P.; Holt, R.D.; Yu, M. Habitat fragmentation and biodiversity conservation: Key findings and future challenges. Landsc. Ecol. 2016, 31, 219–227. [Google Scholar] [CrossRef] [Scilit]
- Fahrig, L.; Arroyo-Rodríguez, V.; Bennett, J.R.; Boucher-Lalonde, V.; Cazetta, E.; Currie, D.J.; Watling, J.I. Is habitat fragmentation bad for biodiversity? Biol. Conserv. 2019, 230, 179–186. [Google Scholar] [CrossRef] [Scilit]
- Keeley, A.T.; Basson, G.; Cameron, D.R.; Heller, N.E.; Huber, P.R.; Schloss, C.A.; Merenlender, A.M. Making habitat connectivity a reality. Conserv. Biol. 2018, 32, 1221–1232. [Google Scholar] [CrossRef] [Scilit]
- Driscoll, D.A.; Armenteras, D.; Bennett, A.F.; Brotons, L.; Clarke, M.F.; Doherty, T.S.; Wevill, T. How fire interacts with habitat loss and fragmentation. Biol. Rev. 2021, 96, 976–998. [Google Scholar] [CrossRef] [Scilit] [PubMed]
- Beger, M.; Grantham, H.S.; Pressey, R.L.; Wilson, K.A.; Peterson, E.L.; Dorfman, D.; Possingham, H.P. Conservation planning for connectivity across marine, freshwater, and terrestrial realms. Biol. Conserv. 2010, 143, 565–575. [Google Scholar] [CrossRef] [Scilit]

Disclaimer/Publisher’s Note: The statements, opinions and data contained in all publications are solely those of the individual author(s) and contributor(s) and not of MDPI and/or the editor(s). MDPI and/or the editor(s) disclaim responsibility for any injury to people or property resulting from any ideas, methods, instructions or products referred to in the content. |
© 2026 by the authors. Licensee MDPI, Basel, Switzerland. This article is an open access article distributed under the terms and conditions of the Creative Commons Attribution (CC BY) license.