


Abstract
Drought is a complex natural hazard with severe impacts on ecosystems, agriculture, water resources, and socio-economic stability. Understanding its spatiotemporal evolution is critical for effective drought monitoring and prevention. This study analyzed drought characteristics in Henan province from 1961 to 2023 using the Standardized Precipitation Evapotranspiration Index (SPEI), calculated from daily meteorological data at 111 meteorological stations. Drought was examined at annual and seasonal scales across multiple time scales, including the 1-month time scale (SPEI1), 3-month time scale (SPEI3), and 12-month time scale (SPEI12), and future trends were assessed using Theil–Sen Median and Hurst exponent analyses. Key findings revealed the following: (1) Drought frequency showed a non-significant increasing trend overall, but drought intensity increased significantly, with severe and extreme droughts becoming more frequent. Most areas are projected to continue aridification. (2) Winter recorded the highest frequency and occurrence of droughts, followed by autumn and summer. Except for summer, moderate and severe droughts increased across all seasons. Extreme droughts increased significantly across all seasons, especially in spring and autumn. (3) High annual drought frequency was concentrated in the northwest, north, and east. Spatial patterns varied by drought severity: slight droughts were more common in the north, moderate droughts in the central–east, severe droughts in the west and south, and extreme droughts in the southwest and north. (4) Empirical Orthogonal Function (EOF) analysis revealed three main spatial modes: a uniform regional pattern, a southeast–northwest contrast, and a central–eastern opposition. Shorter time scales provided more detailed spatial patterns, while longer scales better reflected interannual characteristics of drought and flood variations. This study offers valuable insights for improving drought assessment and supporting risk management and policy decisions.
1. Introduction
Global environmental changes have led to frequent occurrences of extreme climate events, resulting in increasingly severe meteorological disasters and a gradual rise in disaster risks [1]. According to data from the World Meteorological Organization, approximately 70% of natural disasters are triggered by meteorological events, with droughts being the primary type of meteorological disaster, accounting for about half of the total [2]. Globally, drought is widely recognized as one of the most severe and widespread natural disasters [3,4]. Global warming has caused abnormal atmospheric circulation, leading to extreme precipitation events, and increased water vapor content also heightens the likelihood of surface drought events [5,6].
Driven by global warming, droughts are trending toward greater frequency, wider extent, and higher intensity [7,8,9]. Drought is one of the most severe meteorological disasters threatening China’s food security, economic development, and ecological safety, and the areas affected by drought disasters continue to expand [10]. Since the 1990s, drought frequency has notably increased across the whole China, particularly in northern China, with drought intensity also significantly intensifying [11]. Although droughts cannot be prevented, given the severity of their impacts and the critical situation, quantitatively characterizing the spatiotemporal features of droughts and uncovering their development patterns have become urgent requirements for drought prevention, disaster mitigation, and ensuring the healthy development of agriculture. Quantitative drought indices correlate meteorological factors with drought severity, providing objective characterization of drought features. They can be used to measure the spatial extent, intensity, and onset time of drought events. Substantial scholarly effort over recent decades has been dedicated to developing indices for the monitoring and quantification of drought. Commonly used indices include the Palmer Drought Severity Index (PDSI) [12], the Standardized Precipitation Index (SPI) [13], and the Standardized Precipitation Evapotranspiration Index (SPEI). PDSI and SPI are the most popular drought studies worldwide; however, they have some limitations [14]. The SPEI proposed by Vicente-Serrano et al. (2010) [15] not only accounts for the influence of temperature changes on potential evapotranspiration as in PDSI but also incorporates the multi-temporal scale and spatial comparability features of SPI, which considers the advantages of both PDSI and SPI [16]. Consequently, it better indicates droughts across different regions and time periods and can more accurately characterize drought conditions at regional and global scales [17]. Therefore, the SPEI has been widely adopted worldwide [18,19,20,21].
As a transitional area between subtropical and warm temperate zones, Henan province experiences both highly uneven precipitation and regularly high temperatures. Droughts occur frequently in Henan, with localized droughts appearing almost every year, while large-scale and province-wide severe droughts also occur periodically [22,23,24].
From 1951 to 2009, the cumulative drought-affected area in Henan province was 9573.52 × 104 hm2, with an average annual drought-affected area of 162.26 × 10⁴ hm2. The cumulative drought-damaged area was 6010.06 × 104 hm2, with an average annual drought-damaged area of 101.87 × 10⁴ hm2, accounting for 21.76% and 13.66% of the province’s total cultivated land, respectively. The multi-year average drought damage rate was 62.78% [22]. As a major agricultural province in China, droughts in Henan directly affect crop growth, leading to reductions in grain yield. Droughts in Henan have long been a subject of significant concern. Some researchers, based on the collection and organization of historical records, have studied the classification and spatiotemporal characteristics of drought disasters during historical periods (primarily 1271–1911 AD). They noted that drought variability exhibits certain cyclical patterns, with northern Henan experiencing the most frequent drought disasters [23,25]. Several researchers have pointed out that since 1961, the climate in Henan has gradually become drier [26,27], and the overall frequency of droughts has shown an upward trend [28]. However, other studies indicate that over the 56-year period from 1961 to 2016, the SPEI values in Henan showed a slight trend toward wetter conditions across all time scales [29], particularly in recent years (2015–2020), where most areas in Henan were in a normal state, with very few classified as wet or dry. Additionally, drought variability in Henan exhibits certain cyclical patterns and seasonal differences [30]. In terms of the spatial distribution of droughts, northern and western Henan experience higher drought intensity, while eastern and southern Henan experience lower drought intensity. However, some researchers have noted that eastern Henan has a high frequency of drought occurrences [31] and drought-prone areas are mainly distributed in central Henan [32]. The discrepancies among these studies may be related to differences in data precision, time series, and research methodologies. An overview of existing research reveals that the number of meteorological stations used has generally been limited, and the study periods have often been insufficiently long, which may affect the understanding of the spatiotemporal patterns of drought in Henan. Based on the high density meteorological stations, this study further deepened and expanded the understanding of the long-term evolution trends, spatial differences, and future change trends of drought. In addition, it revealed the spatiotemporal patterns of drought at different time scales and the spatiotemporal variability in the drought evolution process.
Therefore, this study calculates the SPEI based on meteorological data from 111 meteorological stations in Henan province from 1961 to 2023. By accurately characterizing the interannual and seasonal drought patterns in Henan, the study analyzes the spatial extent, intensity, and frequency of droughts in the region. The Empirical Orthogonal Function (EOF) decomposition method is employed to investigate the temporal variation patterns and dominant spatial modes from multiple time scales (SPEI1, SPEI3, and SPEI12). Finally, the future drought trends in the study area are projected based on Theil–Sen Median trend analysis and the Hurst exponent. The findings are expected to provide references for drought evaluation, monitoring, and forecasting in the region.
2. Materials and Methods
2.1. Study Area
Henan province (31°23′–36°22′ N, 110°21′–116°39′ E) is characterized by higher terrain in the west and lower terrain in the east. The western part consists of hilly and mountainous areas formed by the remaining ranges of the Funiu and Taihang Mountains, while the central and eastern regions comprise the vast Huang–Huai–Hai Plain. Located in central–eastern China, it experiences a continental monsoon climate that transitions from the northern subtropical zone to the warm temperate zone. Additionally, the climate shifts from a plain climate in the east to a hilly and mountainous climate in the west. The distribution of precipitation is highly uneven and often accompanied by high temperatures, leading to frequent meteorological disasters [30]. Among these, drought is one of the most frequent natural disasters, with the longest duration and the widest affected area. Annual precipitation ranges from 500 to 1400 mm. From north to south, the annual average temperature varies between 9.5 °C and 15.7 °C, while precipitation decreases from southeast to northwest, with annual rainfall ranging from 550 to 1295 mm. Precipitation from June to August accounts for 45% to 67% of the annual total, and the annual sunshine duration ranges from 1740 to 2310 h. In recent years, rising temperatures and decreased precipitation have exacerbated the deterioration of the water resource environment in the region. Therefore, under the background of global climate change, it is particularly important to analyze the spatiotemporal characteristics of droughts in different periods in Henan province.
2.2. Data Source
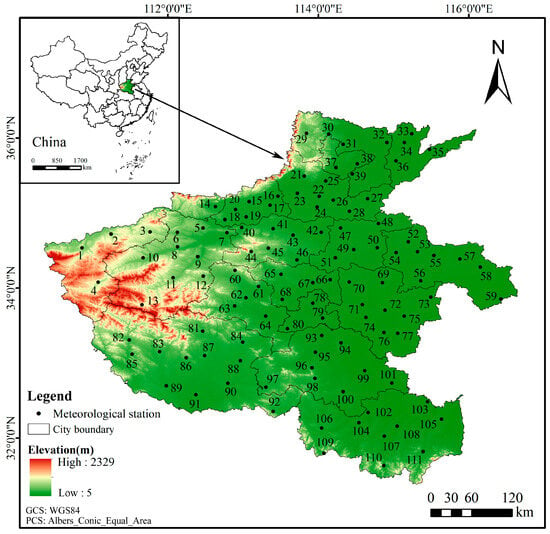
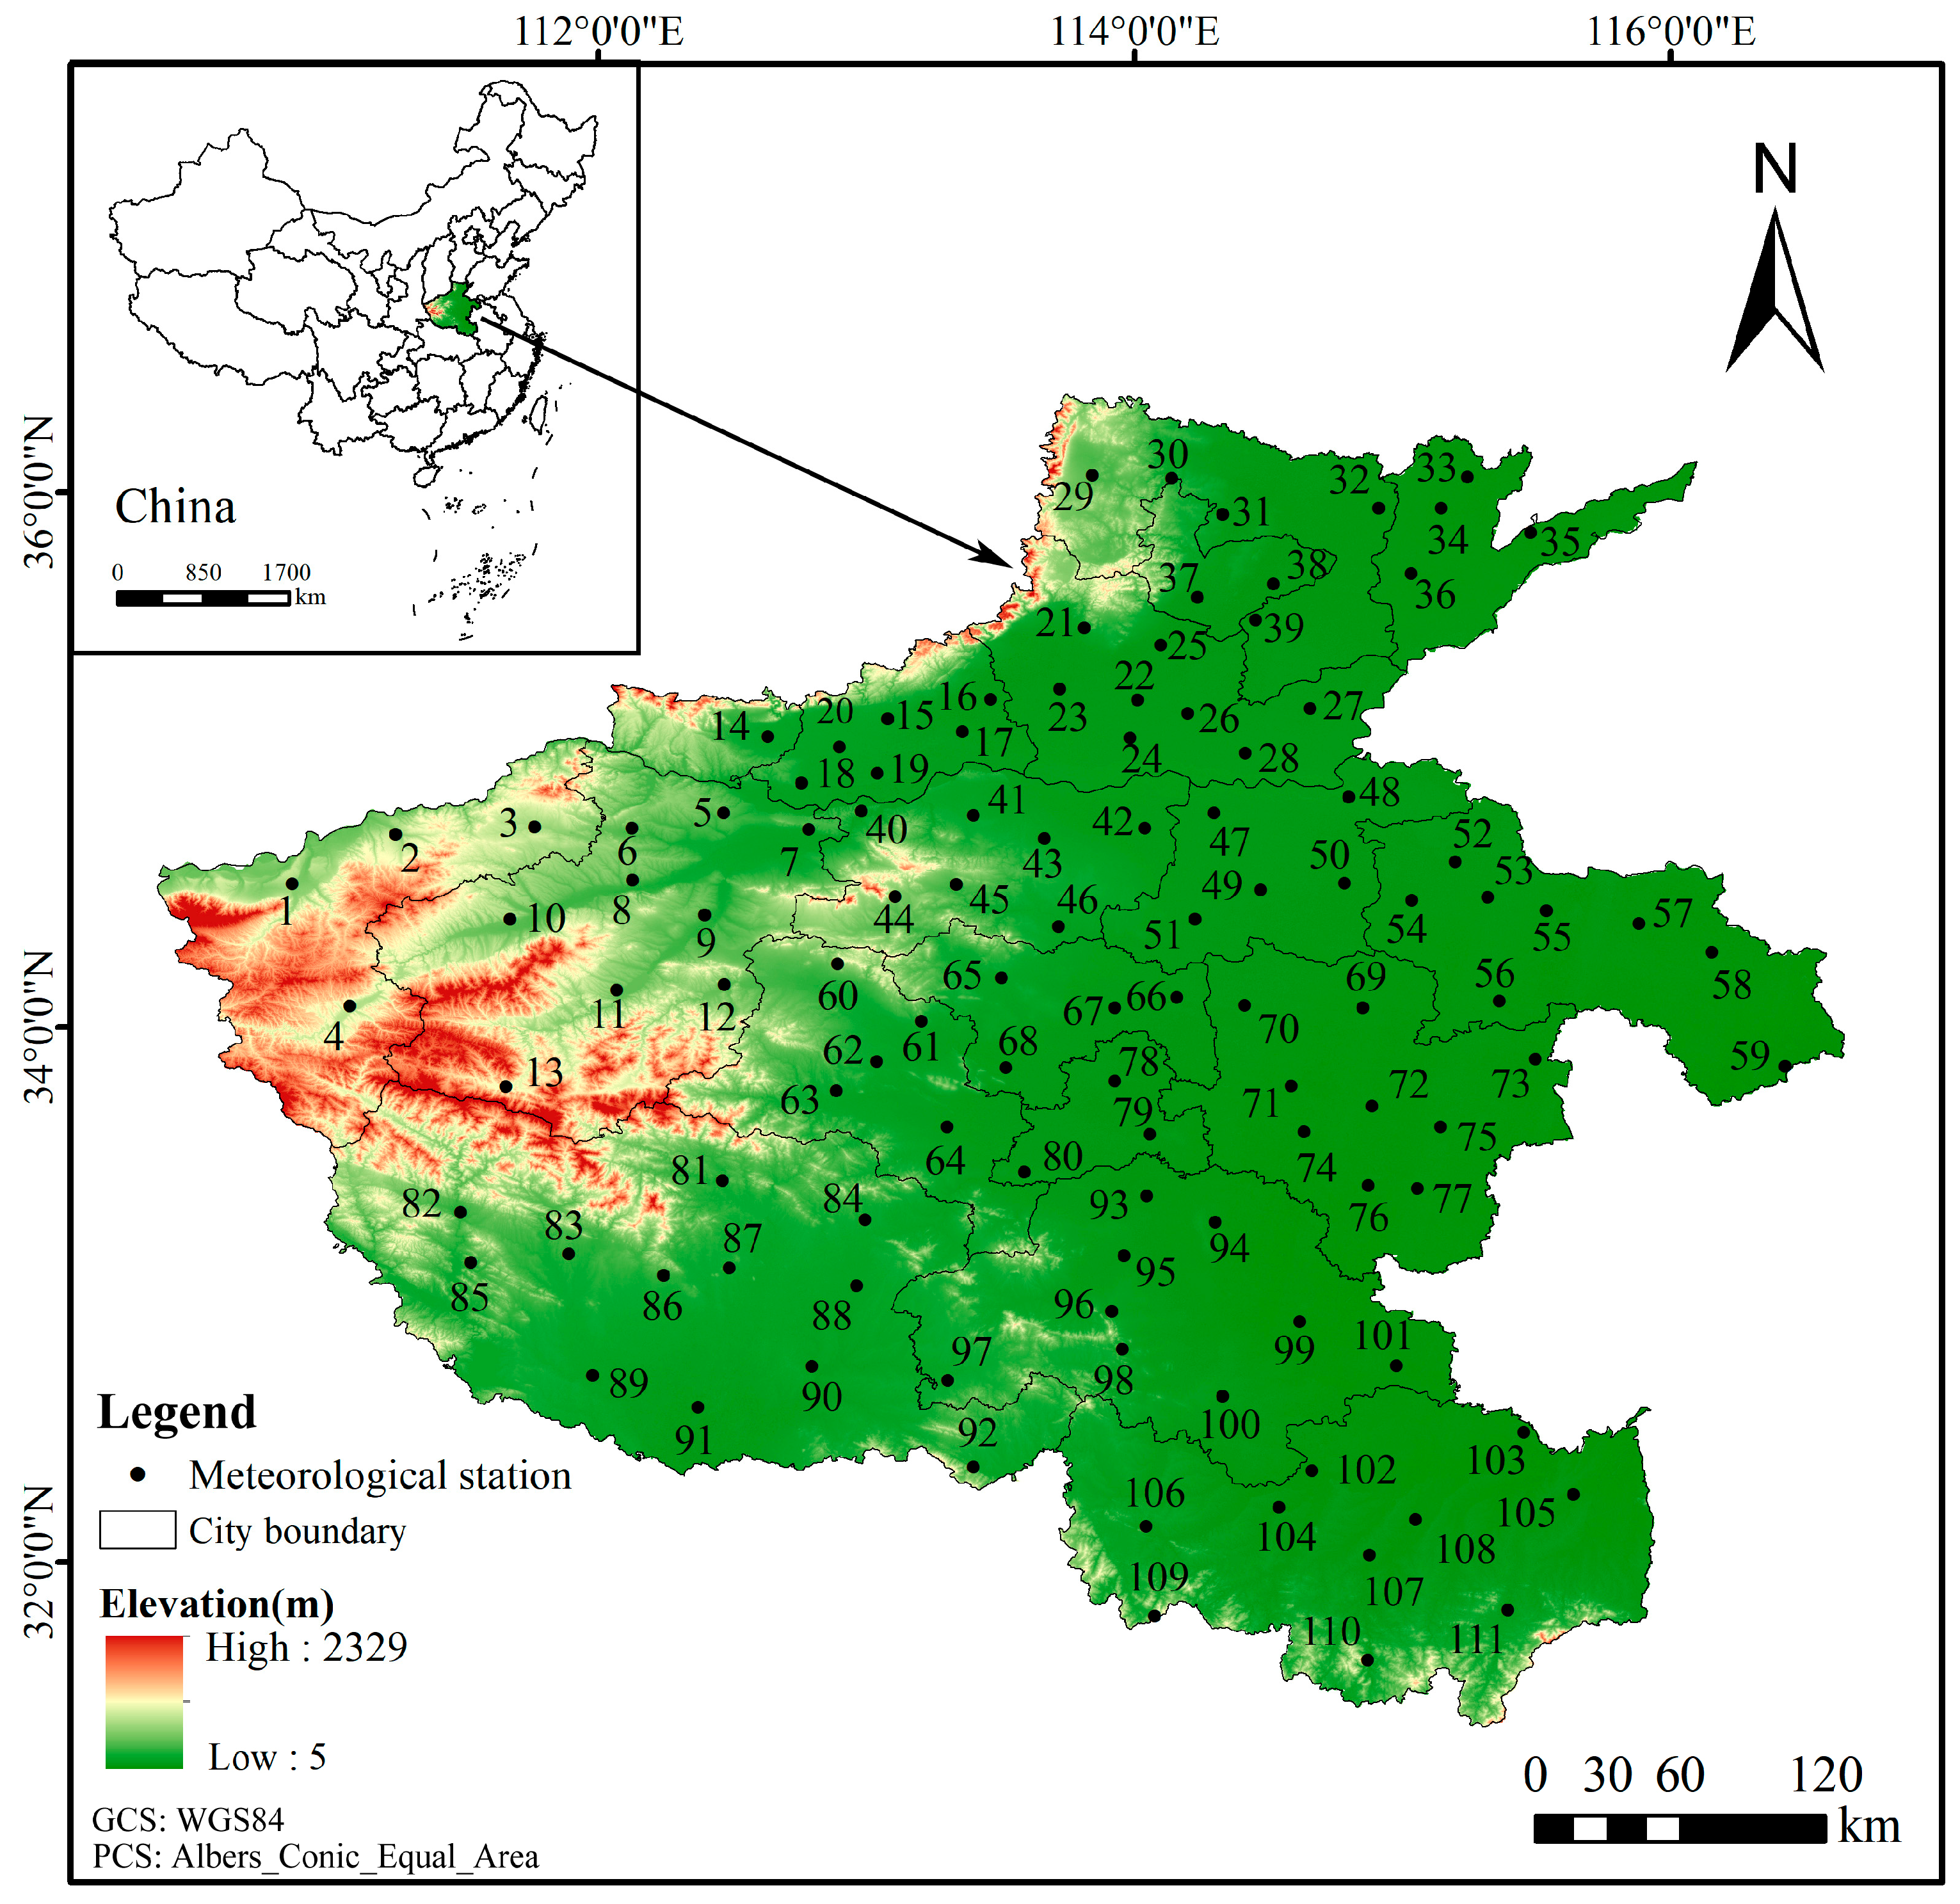
The meteorological observation data used in this study were obtained from the China Surface Climate Daily Dataset V3.0 (http://cdcc.ma.gov.cn/, accessed on 16 May 2025) compiled by the National Meteorological Science Data Center. This dataset has undergone rigorous quality control and homogenization correction, ensuring continuous and complete data collection with data availability and accuracy rates for all elements exceeding 99%. It meets the precision requirements for research and reliably reflects natural climate variation trends. This study selected meteorological station data from Henan province spanning 1961 to 2023, including daily mean temperature, maximum temperature, minimum temperature, precipitation, relative humidity, sunshine duration, wind speed, and other observational records. To ensure data completeness, temporal continuity, and spatial representativeness, stations with incomplete records were excluded, and any missing meteorological data in the time series were interpolated using values from neighboring stations with strong correlations. This process resulted in the final selection of data from 111 meteorological stations in Henan province with complete records. The spatial distribution of these meteorological stations is illustrated in Figure 1. The codes in Figure 1 are meteorological station numbers, and the corresponding names of the meteorological stations are shown in Table 1.
Figure 1.
The study area and spatial distribution of meteorological stations.
Table 1.
Table of corresponding meteorological station names and codes.
2.3. Calculation of SPEI
Against the backdrop of global warming, the impact of rising temperatures on drought is becoming increasingly evident. The SPEI takes into account the influence of temperature changes on drought. Potential evapotranspiration (PET) is a key variable in calculating the SPEI drought index. Data from 1961 to 2023 were used to calculate SPEI at monthly, seasonal, and annual scales (SPEI1, SPEI3, SPEI12). SPEI1 is calculated based on the difference between monthly precipitation and potential evapotranspiration. SPEI3 is calculated based on the cumulative difference between precipitation and potential evapotranspiration for the current month and the previous two months. SPEI12 is calculated by accumulating the difference between precipitation and potential evapotranspiration for the current month and the previous 11 months. SPEI1 reflects monthly drought conditions, SPEI3 reflects seasonal drought conditions, and SPEI12 reflects annual drought conditions. PET refers to the maximum quantity of water vapor that can be evaporated and transpired from a land surface with an adequate supply of moisture. A distinctive approach to estimating PET is the Thornthwaite method [33], which relies solely on an empirical relationship with mean monthly temperature. In this study, the Thornthwaite method was adopted to calculate PET, as detailed below:
where T is the monthly mean temperature, N represents the maximum possible sunshine hours, NDM denotes the number of days in the month, and I is the annual heat index, obtained by summing the monthly heat indices of the year. The annual heat index is calculated as follows:
m is a coefficient related to I, which can be derived using the formula:
The Thornthwaite method for calculating PET is widely adopted due to its requirement of few input variables and its straightforward, easy-to-implement procedure.
- The climatic water balance
Di is defined as the difference between precipitation (Pi) and potential evapotranspiration (PETi).
- 2.
- Establish cumulative sequences of climate water balance at different time scales:
- 3.
- The data series was established by fitting it with the logistic probability density function.
- 4.
- The cumulative probability density is transformed to a standard normal distribution to obtain the corresponding SPEI time series.
W is a parameter, with a value of . P is the probability that the determined water balance is exceeded. When P ≤ 0.5, P = 1 − F(x). When P > 0.5, P = 1 − P, and the sign of SPEI is reversed. The other constant terms in the formula are C0 = 2.515517, C1 = 0.802853, C2 = 0.010328, d1 = 1.432788, d2 = 0.189269, d3 = 0.001308.
2.4. Drought Classification
Drought is classified based on the drought grade criteria outlined in the National Standard GB/T 20481-2017 (Grades of Meteorological Drought) [34], as shown in Table 2.
Table 2.
Drought classifications based on SPEI.
2.5. Statistical Analysis of Drought
2.5.1. Percentage of Drought-Affected Stations
The percentage of drought-affected stations is defined as the ratio of the number of meteorological stations experiencing drought within a region during the study period (m) to the total number of meteorological stations (M), expressed as:
2.5.2. Frequency of Drought
Based on the drought index SPEI1 and the meteorological drought classification criteria specified in the National Standard GB/T 20481-2017, this study calculated the frequency of drought occurrence from 1961 to 2023. This analysis yields the likelihood and probability of various drought types at each meteorological station in Henan province. The formula for calculating the frequency of a specific drought category i and grade j at a single station is as follows:
where i is the type of drought, i = 1, 2, 3, 4, 5, representing spring drought, summer drought, autumn drought, winter drought, and annual-scale drought, respectively. j is the intensity level of drought, j = 1, 2, 3, 4, 5, representing no drought, slight drought, moderate drought, severe drought, and extreme drought, respectively. m is the number of occurrences of drought of type i and intensity level j at a single station during the statistical period, including the drought events at level j. M is the number of years in the statistical period.
2.5.3. Frequency of Type I Drought at a Single Station
In the formula, Pi is the frequency of type i drought at a single meteorological station, calculated as the sum of occurrences of drought events of type i across all intensity levels j at that station during the statistical period, and M is the number of years in the statistical period.
2.6. Empirical Orthogonal Function Analysis
EOF analysis is a commonly used spatiotemporal decomposition method in the field of climate change [35]. EOF analysis decomposes a time-varying variable field into time-invariant spatial functions (EOFs) and time-dependent coefficients (principal components), a process also known as spatiotemporal decomposition. Its principle involves representing the observational data of a climate variable field in matrix form (where m is the number of observation stations, and n is the length of the time series):
The variable Xm×n is regarded as a linear combination of p spatial eigenvectors and their corresponding temporal weight coefficients:
where T represents the temporal coefficients, and V represents the spatial eigenvectors, also known as spatial modes. This process concentrates the primary information of the variable field into a few typical eigenvectors. To study the temporal variation patterns and spatial modes of drought, this paper applies EOF decomposition to the annual mean variable field of the multi-scale SPEI. The main spatial modes and their corresponding temporal coefficients are extracted to reveal the spatiotemporal variation patterns of drought.
2.7. Inverse Distance Weighting (IDW) Interpolation Method
The SPEI1, SPEI3, and SPEI12 were utilized as indicators to differentiate drought phenomena of varying intensities and classify their severity levels. Subsequently, the spatial distribution characteristics of these drought-affected areas were further analyzed. Finally, the drought frequency and spatial feature vectors of SPEI were transformed into visualized spatial distribution maps by means of the IDW interpolation method.
2.8. Theil–Sen Median Trend Analysis and Mann–Kendall Test
This study applied the Theil–Sen trend analysis and the Mann–Kendall test [36,37] to the analysis of SPEI time series, which can reveal significant long-term trends in drought variation. Before the Mann–Kendall test, autocorrelation analysis of the time series was performed.
The Sen’s slope estimator () is calculated as follows:
where xj and xi represent the SPEI time series. When < 0, it indicates a decreasing trend in the SPEI time series. When > 0, it indicates an increasing trend. The significance of the trend is tested using the Mann–Kendall test.
2.9. Hurst Exponent
The Hurst exponent method, proposed by British hydrologist Hurst (1951) [38] and improved by Mandelbrot and Wallis (1969) [39], is a method for detecting the sustainability of time series data. The Hurst exponent, a critical metric based on the Rescaled Range (R/S) analysis method, quantifies the long-term memory and persistence of time series data, enabling the prediction of future trends using long-term historical records. The main calculation process is as follows:
where S is the standard deviation, H is the Hurst exponent, is the time series, and is the mean of the time series over a specific analysis period. The Hurst exponent is a statistic (H) used to measure the long-term correlation of a time series. Its value ranges between 0 and 1, reflecting the degree of self-similarity in the series. A value close to 0.5 indicates randomness; a value greater than 0.5 suggests that the SPEI time series possesses long-term positive correlation characteristics, meaning the process exhibits persistence; a value less than 0.5 indicates that the SPEI time series data exhibits anti-persistence, where past variables are negatively correlated with future trends.
3. Results
3.1. Temporal Variation Characteristics of Drought
3.1.1. Interannual Variation Characteristics
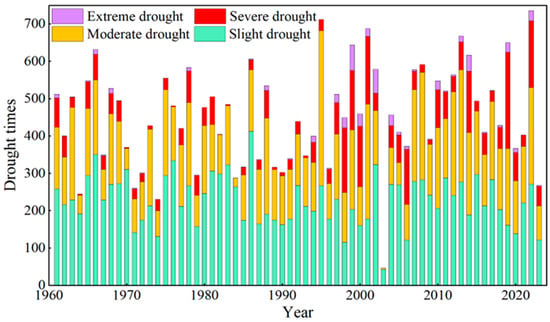
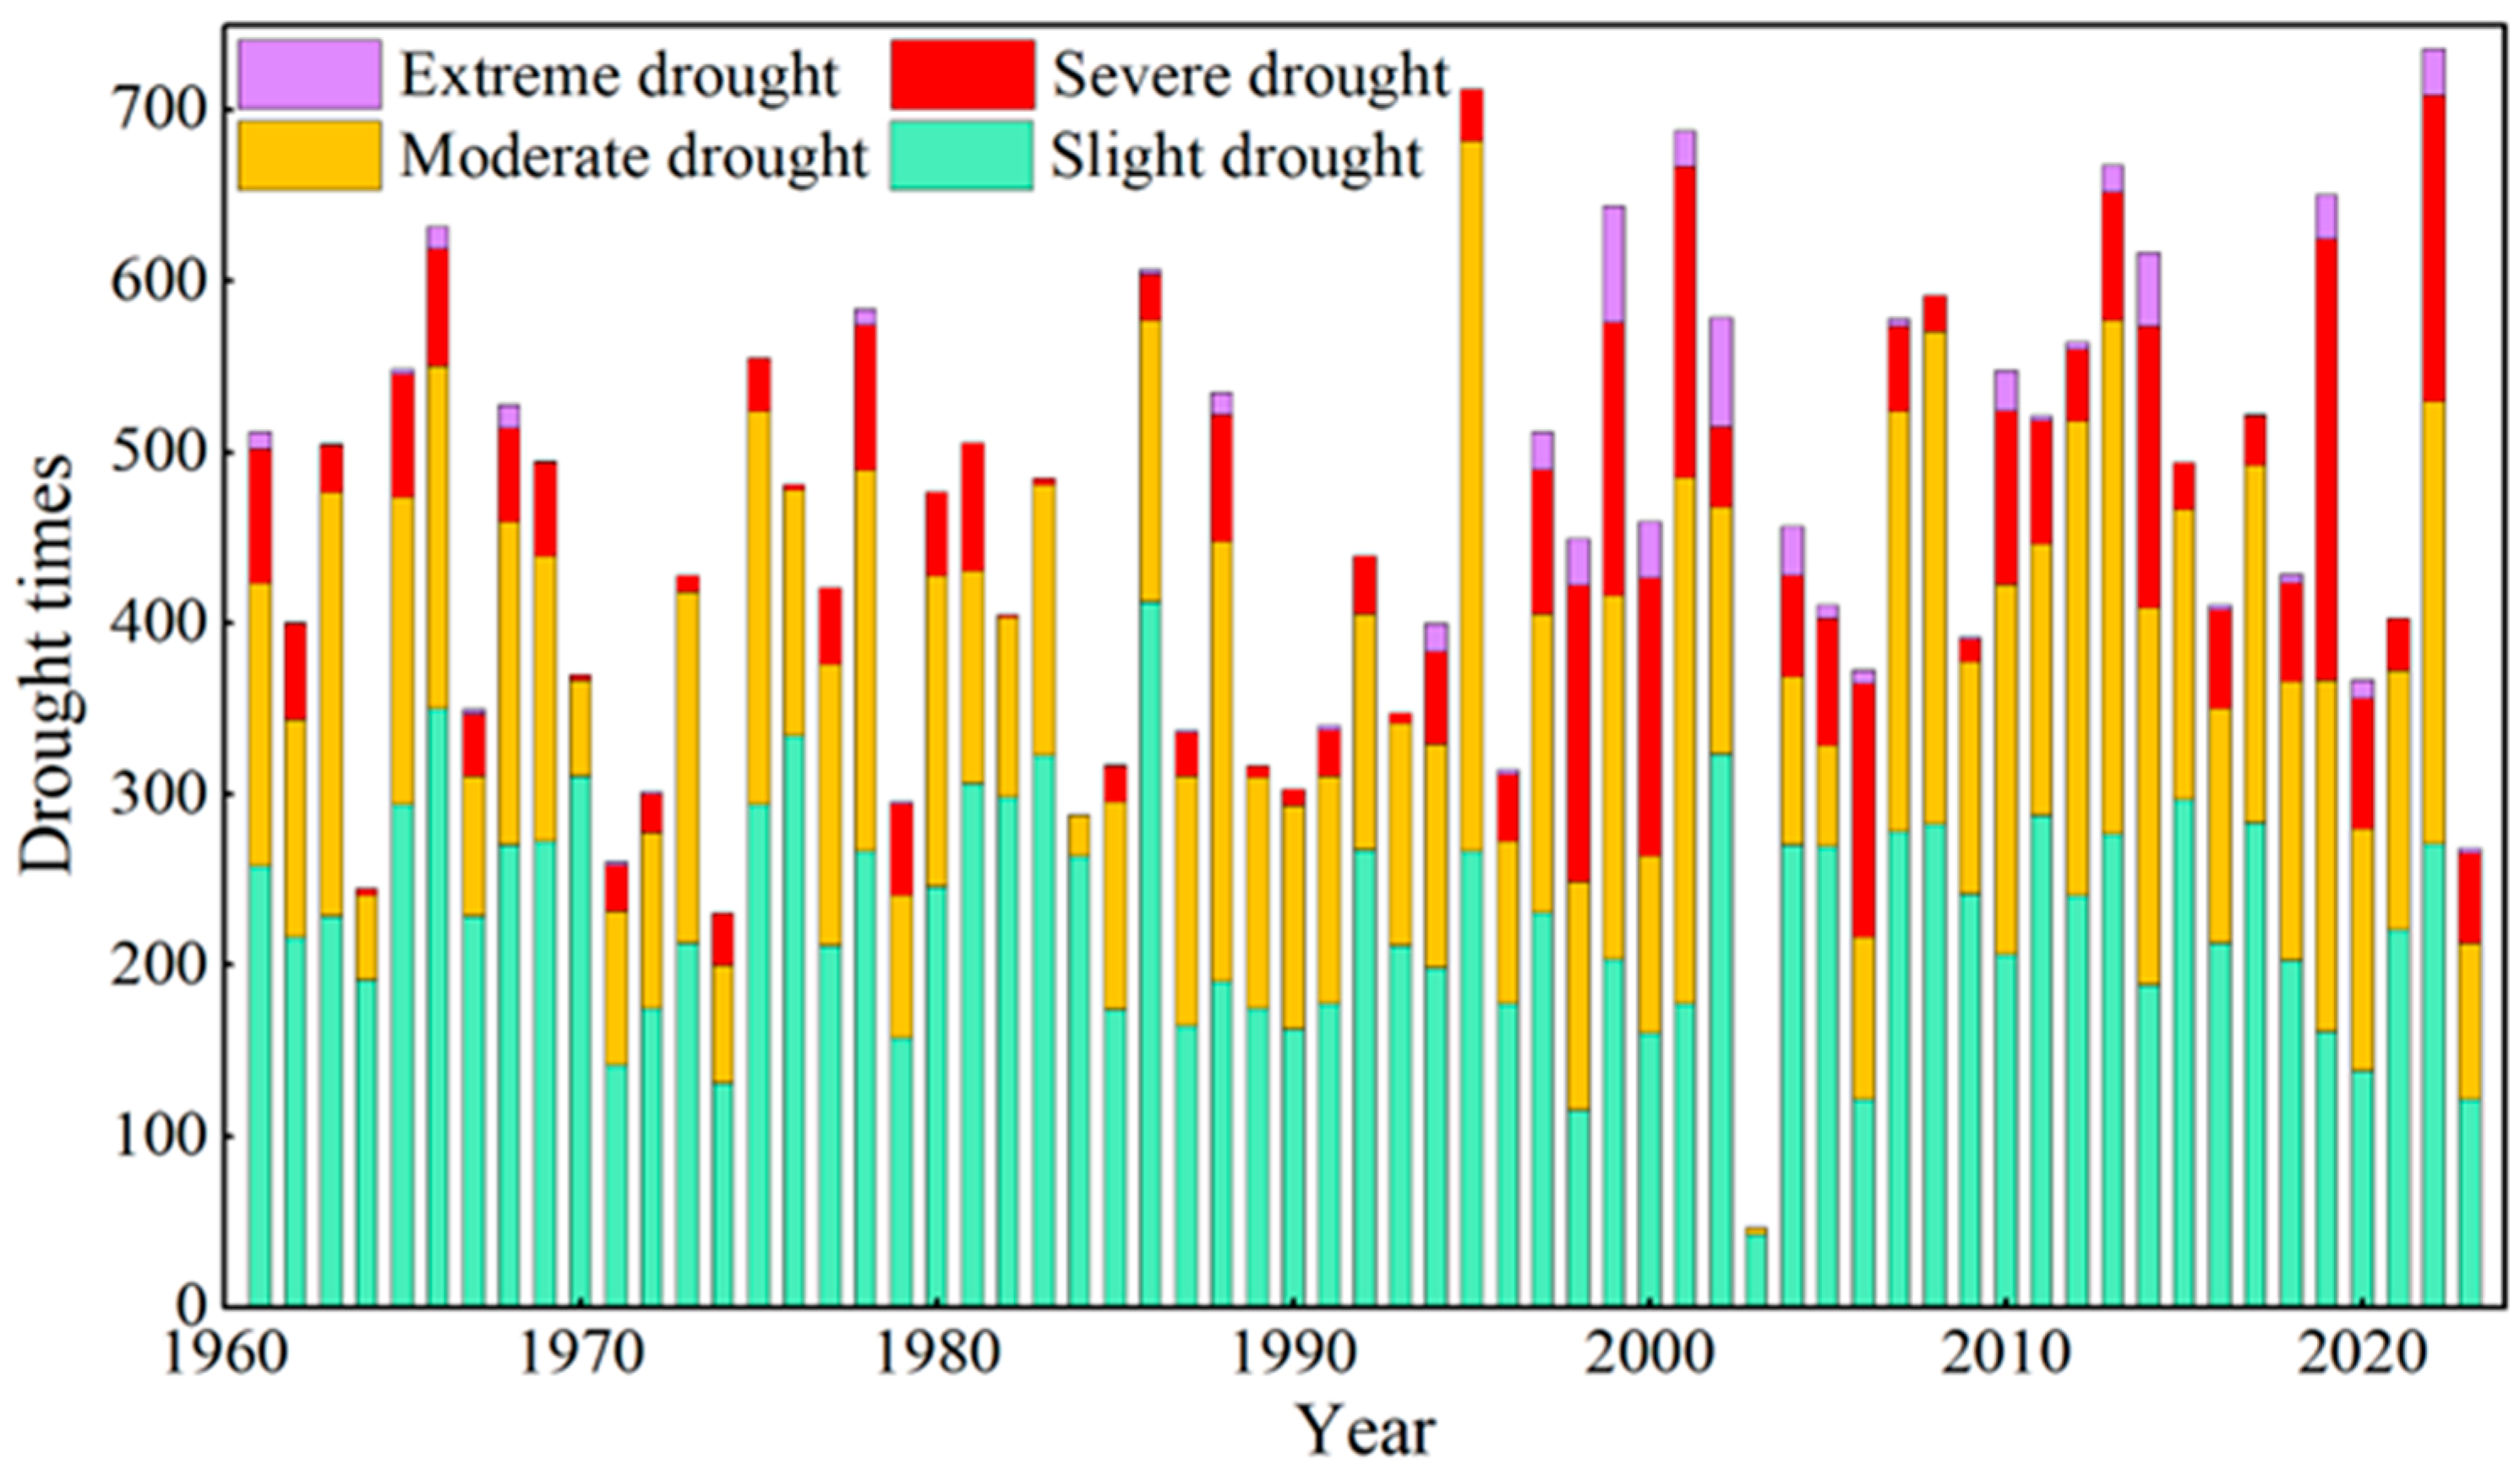
Frequency of each drought grade in Henan province from 1961 to 2023 is shown in Figure 2. The drought frequency exhibits fluctuating interannual variability. Autocorrelation analysis of the time series showed no significant correlation in the time series data, indicating that it does not substantially affect our subsequent analysis. Results from the Mann–Kendall test indicate an increasing trend in the annual total drought frequency, although this trend is not statistically significant (p > 0.05). Over the study period, the annual drought count ranged from 47 times per year (in 2003) to 736 times per year (in 2022), with a mean of 455 times per year and a standard deviation of 134 times per year. Drought count is the sum of the number of drought occurrences at all meteorological stations during the statistical period. Based on its temporal trajectory, the time series can be broadly divided into two distinct periods, with the division point located around the year 1995. The average annual drought count was 419 times per year before 1995, increasing to 496 times per year after 1995. Regarding different drought severity grades, the mean annual occurrences were 229 times per year for slight drought, 160 times per year for moderate drought, 57 times per year for severe drought, and 9 times per year for extreme drought. The highest annual count of severe drought (258 times per year) was recorded in 2019, followed by 181 times per year in 2001 and 179 times per year in 2022. Years with severe drought counts exceeding 100 totaled nine, all occurring after 1998. For extreme drought, the peak annual frequency was 68 times per year in 1999, followed by 64 times per year in 2002 and 43 times per year in 2014. There were eight years with extreme drought counts greater than 25 times per year, all also post-1998. Results of the Mann–Kendall test reveal distinct trends for different drought grades: a non-significant decreasing trend for slight drought (p > 0.05), a non-significant increasing trend for moderate drought (p > 0.05), and significant increasing trends for both severe drought and extreme drought (p < 0.05).
Figure 2.
Interannual variation in the counts of each grade of drought.
3.1.2. Seasonal Variation Characteristics
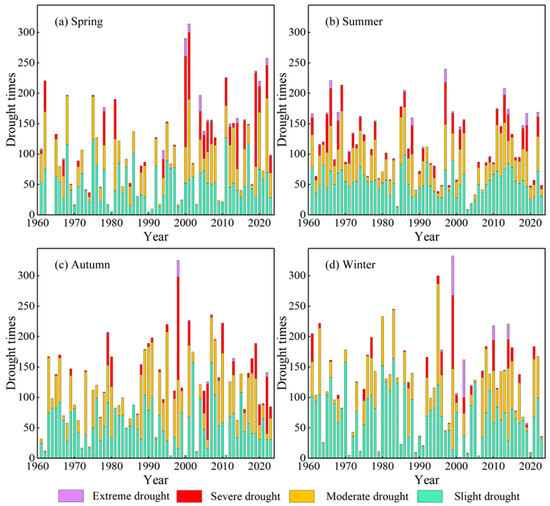
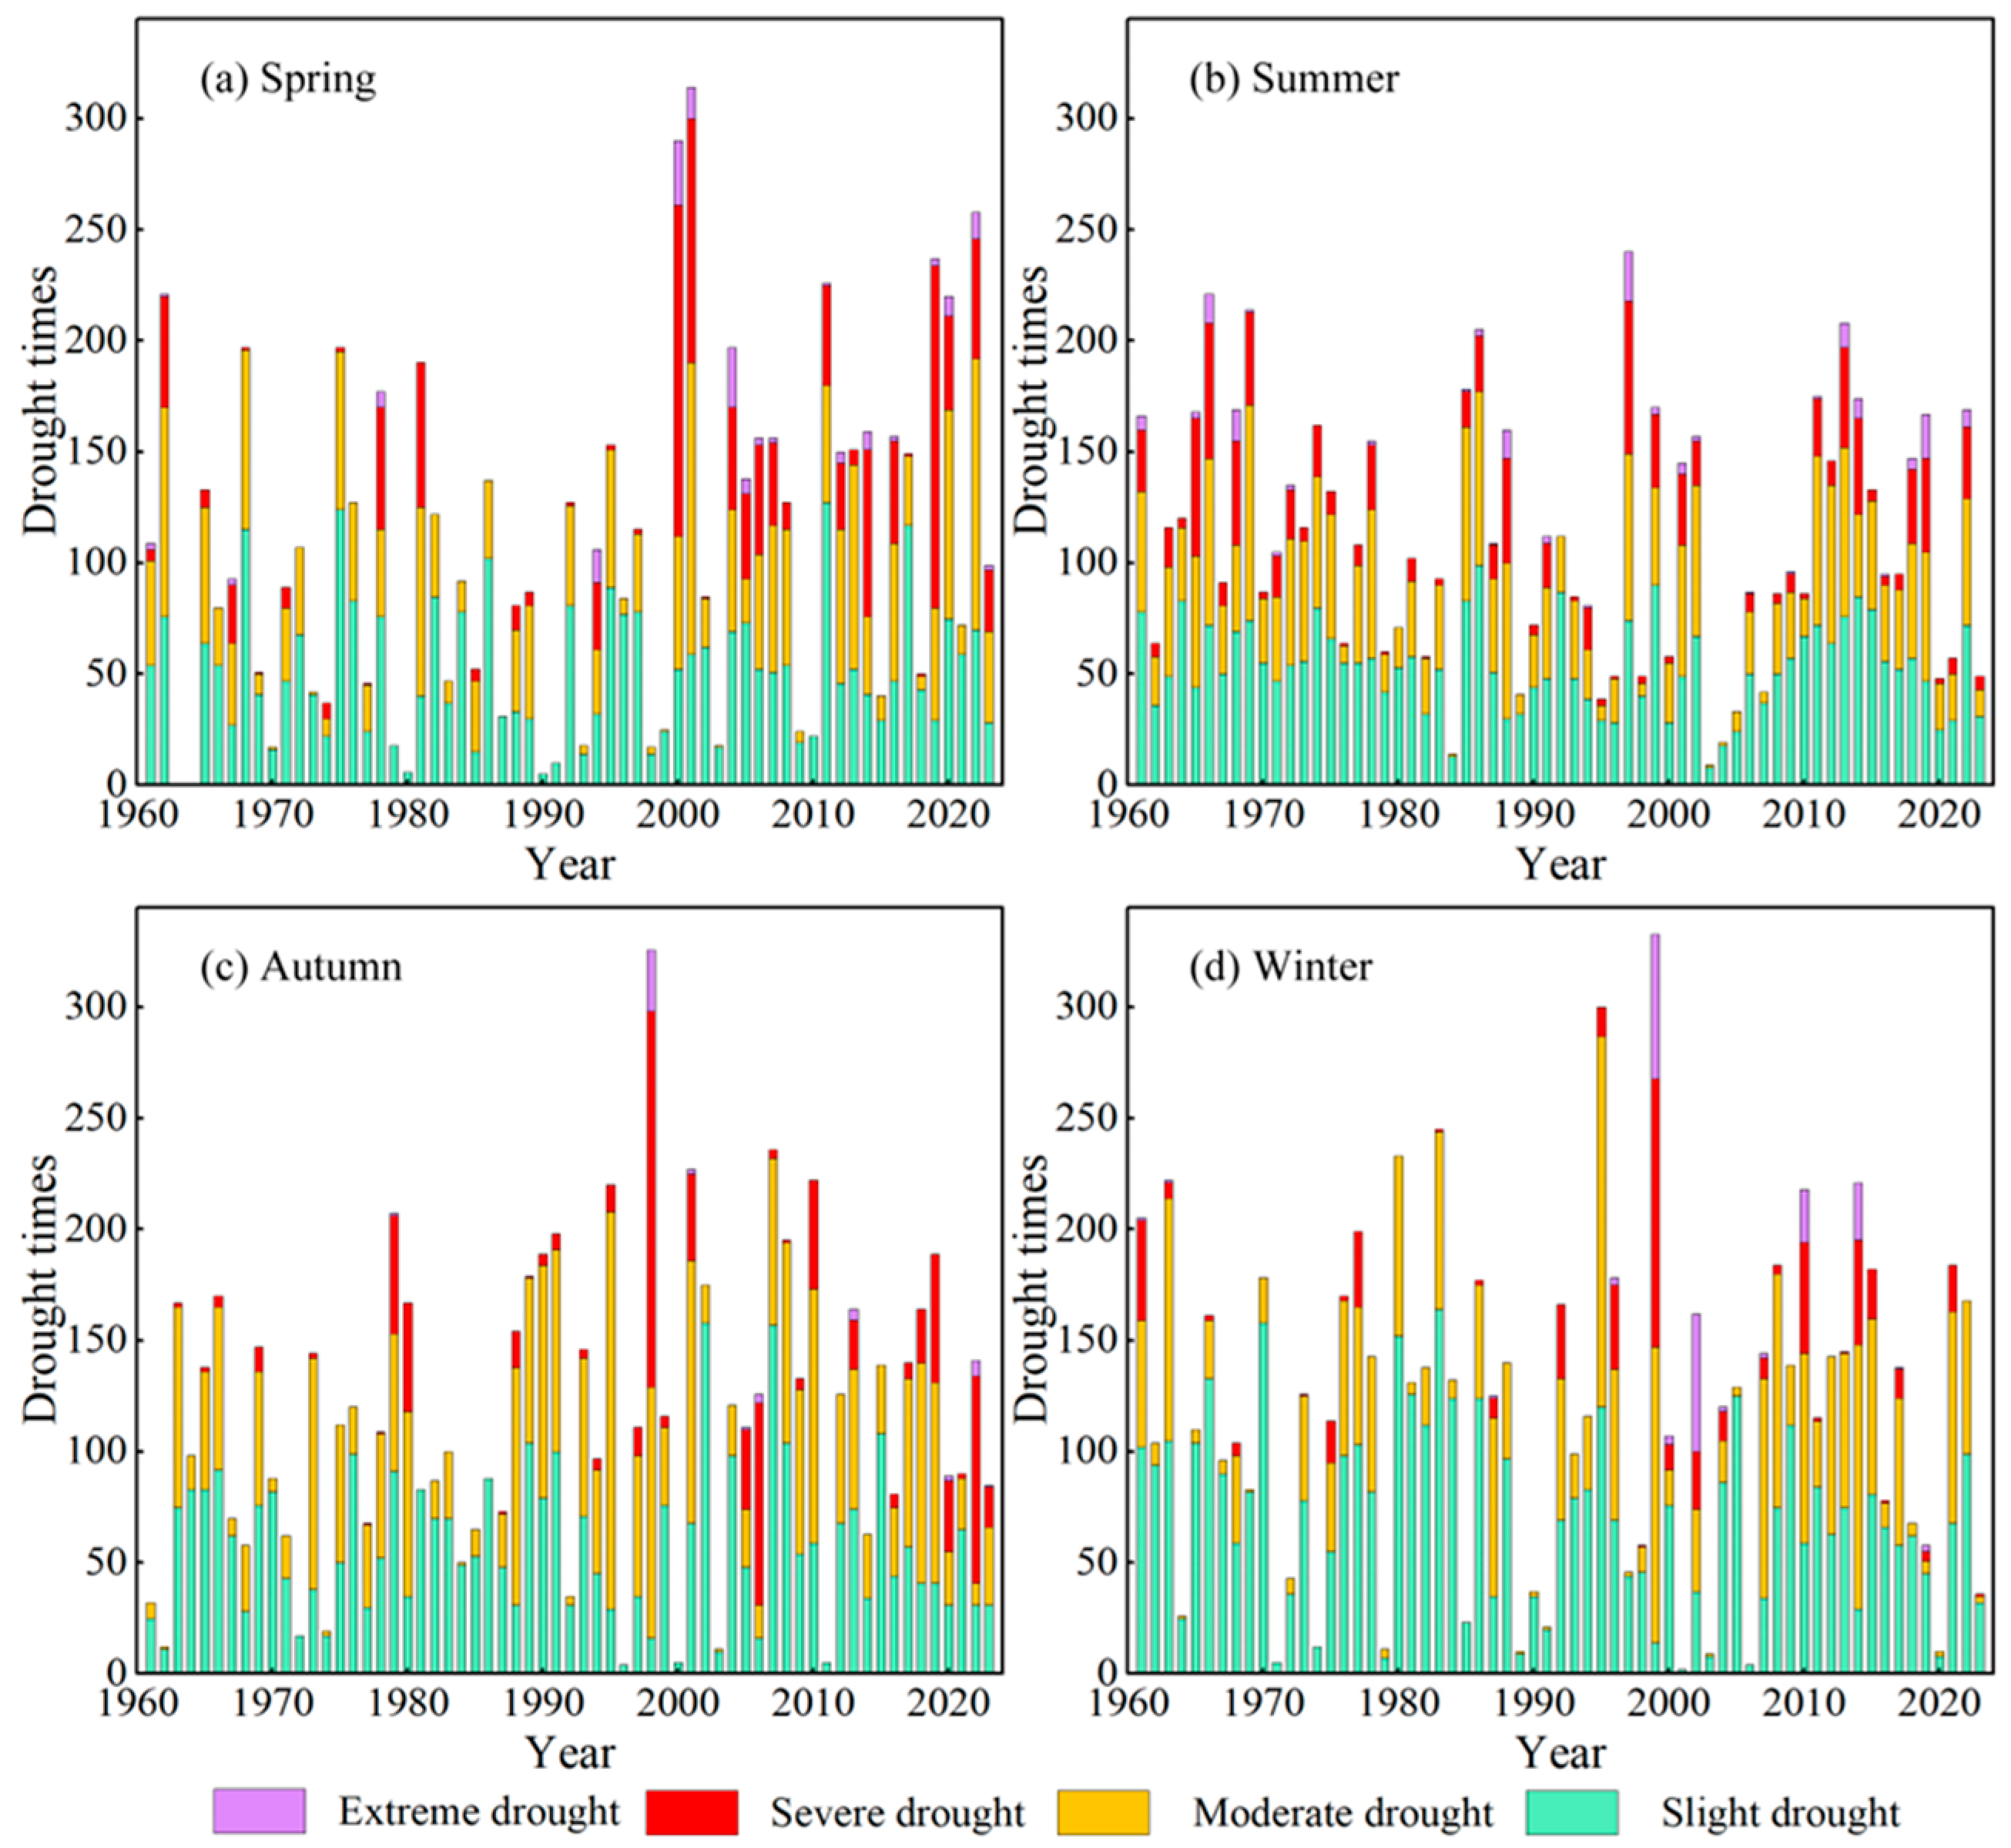
The seasonal frequencies of different drought grades in Henan province from 1961 to 2023 are shown in Figure 3. The total drought across seasons did not differ substantially, with winter recording the highest (120 times per year), followed by autumn (117 times per year) and summer (111 times per year), while spring had the lowest (107 times per year). The Mann–Kendall test revealed a significant increasing trend in spring drought frequency during 1961–2023 (p < 0.05). Based on the interannual variation in spring drought, the series can be divided around the year 2000: the mean frequency was 83 times per year before 2000 and increased to 146 times per year after 2000 (Figure 3a). Summer drought showed a non-significant decreasing trend (p > 0.05) (Figure 3b), while autumn and winter drought exhibited non-significant increasing trends (p > 0.05). Slight drought occurred predominantly in winter (70 times per year) (Figure 3d) and autumn (57 times per year) (Figure 3c). During the study period, slight drought in spring showed a non-significant increasing trend (p > 0.05), while slight drought in summer and autumn showed non-significant decreasing trends (p > 0.05), and slight drought in winter showed a significant decreasing trend (p < 0.05). Moderate drought in spring, autumn, and winter exhibited non-significant increasing trends (p > 0.05), whereas moderate drought in summer showed a non-significant decreasing trend (p > 0.05). Severe drought in spring and autumn demonstrated highly significant increasing trends (p < 0.01). Severe drought in winter showed a non-significant increasing trend (p > 0.05), while severe drought in summer displayed a non-significant decreasing trend (p > 0.05). Extreme drought in summer and winter showed a non-significant increasing trend (p > 0.05), whereas extreme drought in spring showed a significant increasing trend (p < 0.05), and extreme drought in autumn showed a highly significant increasing trend (p < 0.01).
Figure 3.
Interannual variations in the occurrence counts of each grade drought in spring (a), summer (b), autumn (c), and winter (d).
The analysis above indicates that although the total drought counts showed some decrease over the study period, drought intensity has intensified. Except for summer, moderate and severe droughts increased across seasons, while extreme droughts increased in all seasons, with particularly significant increases in spring and autumn.
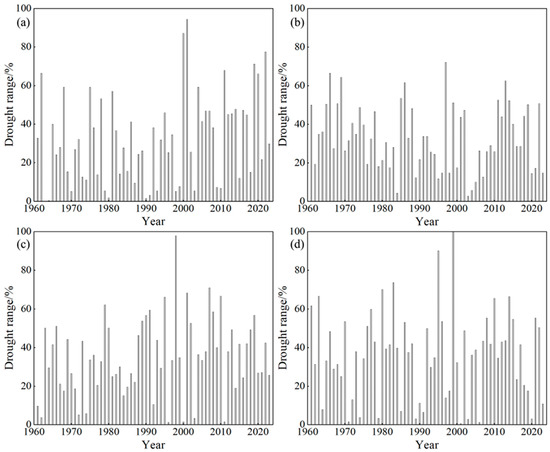
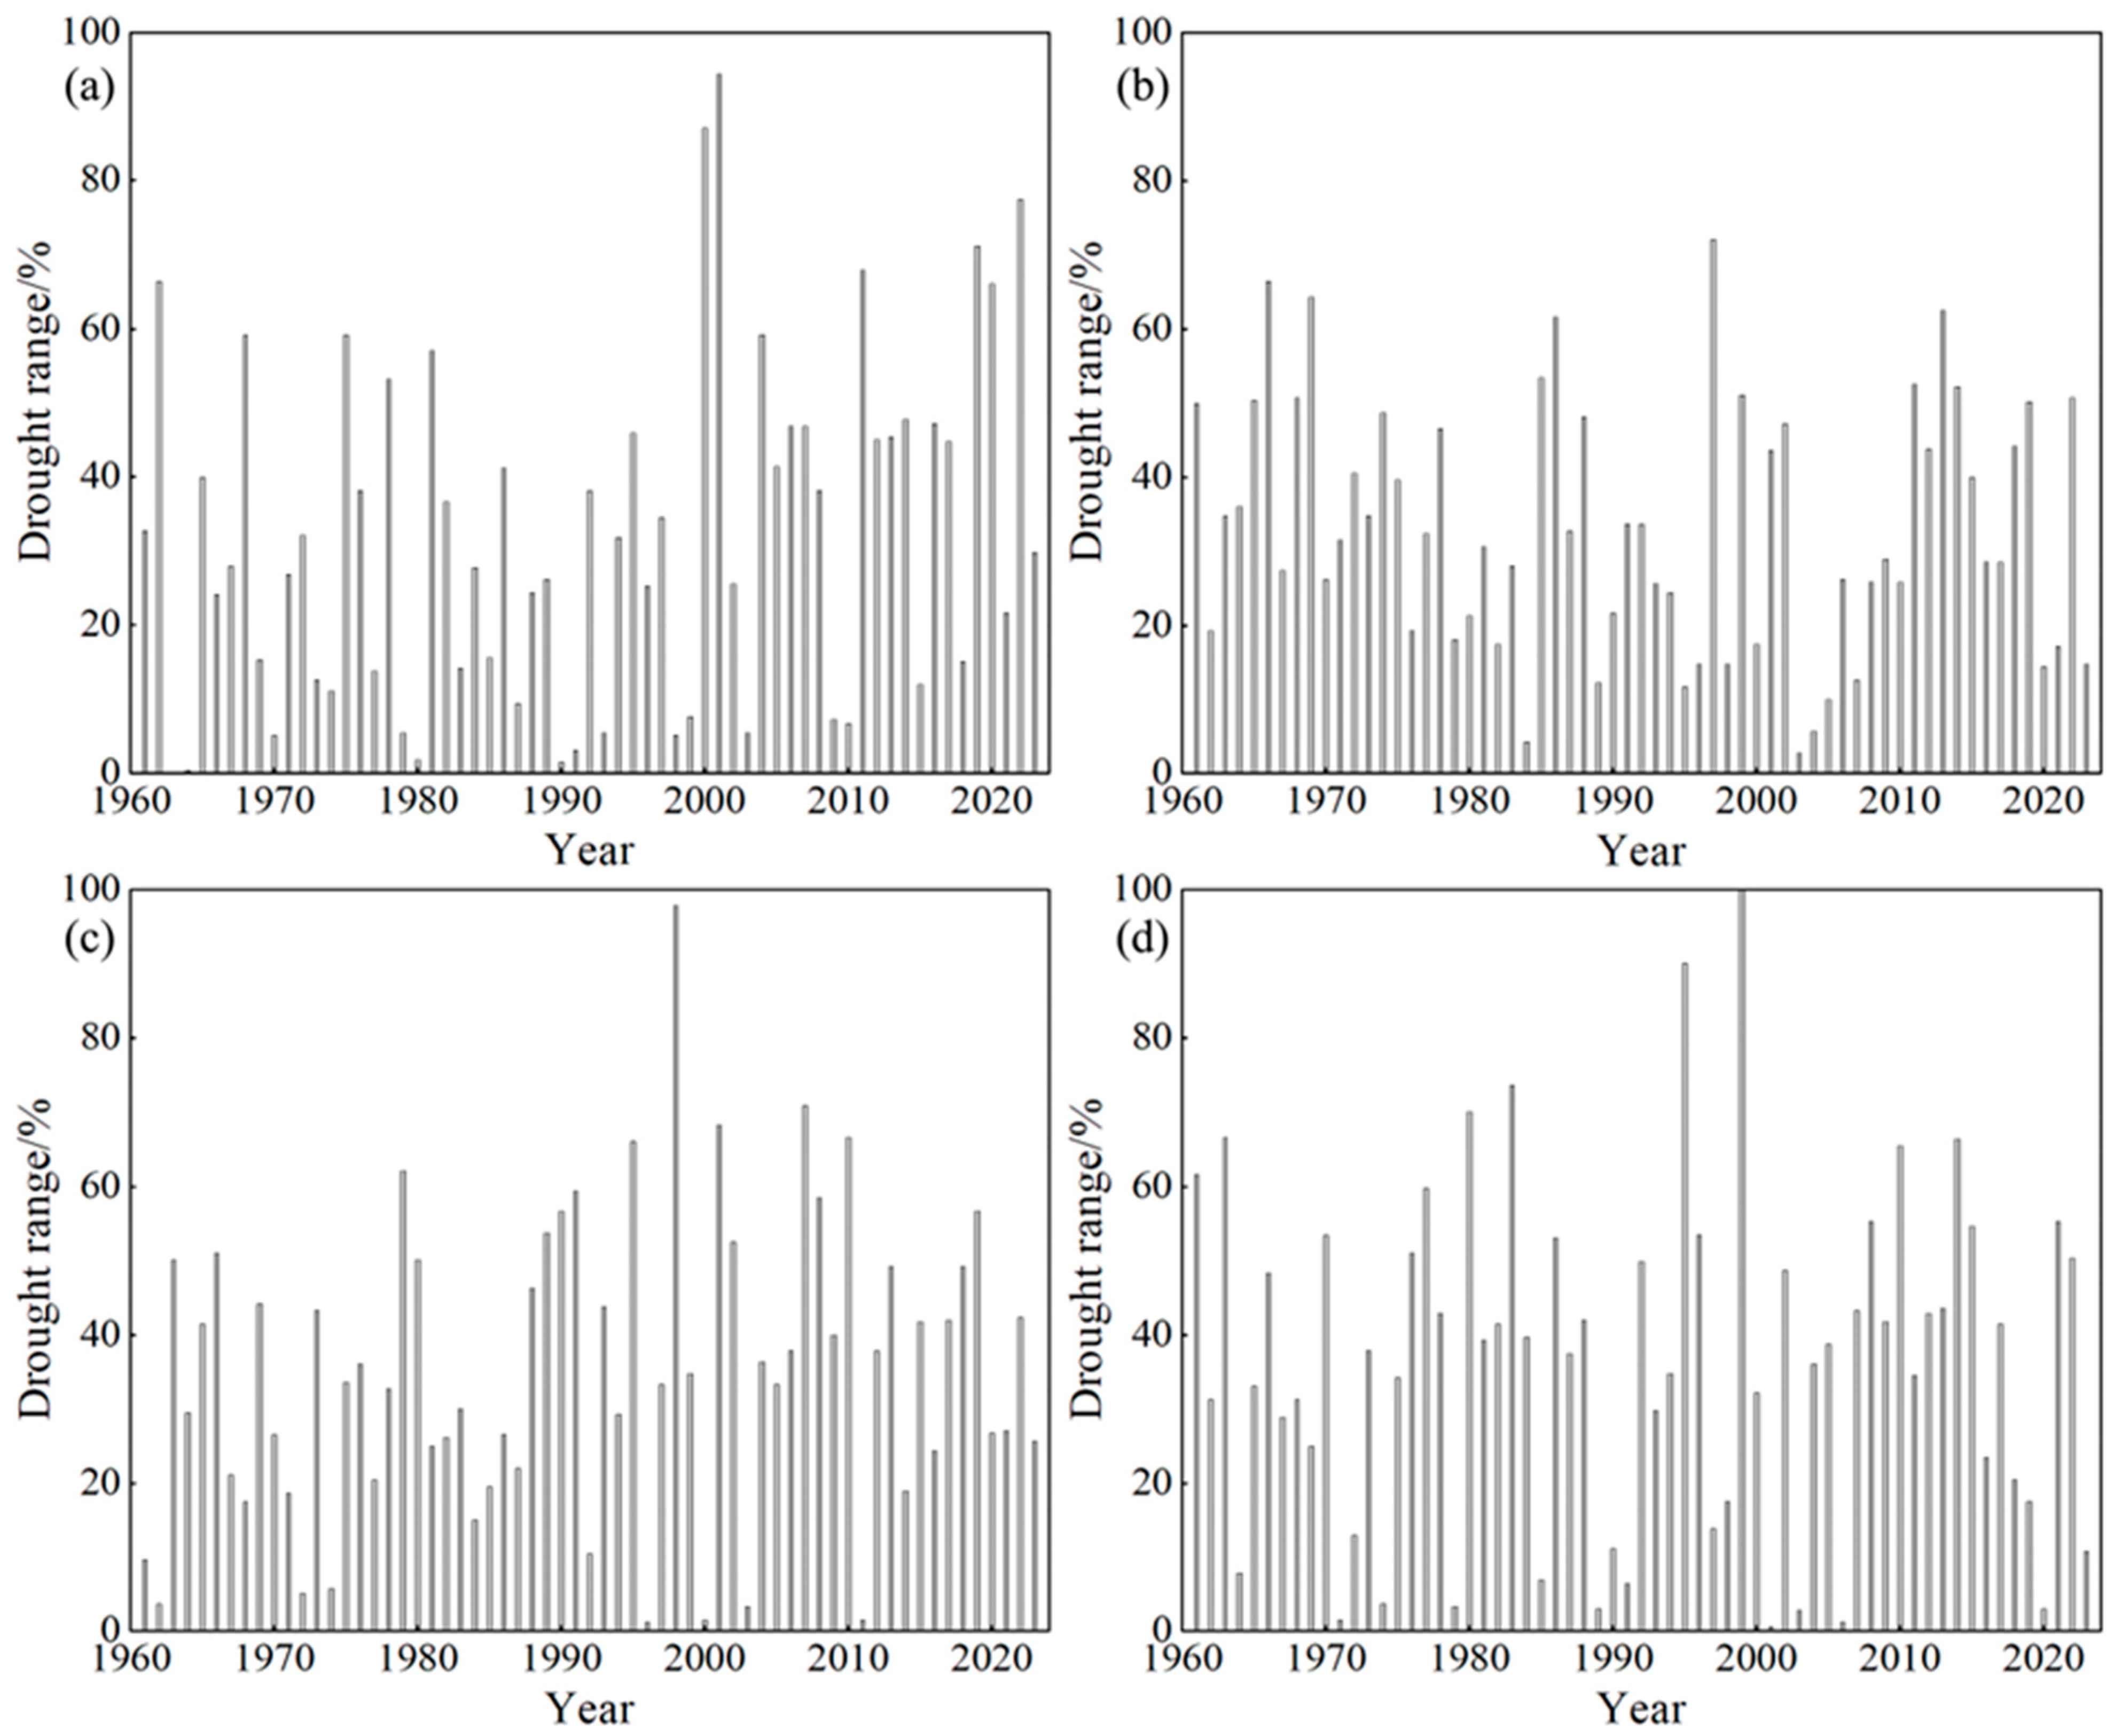
Seasonal differences in the percentage of stations affected by drought within the study area are presented in Figure 4. On average, winter had the highest percentage of affected stations at 36.15%, followed by autumn (35.10%) and summer (33.24%), while spring recorded the lowest percentage at 32.14%. For the spring season, the peak annual percentage was 94.29%, occurring in 2001, with subsequent highs of 87.09% in 2000 and 77.48% in 2022 (Figure 4a). The percentage exceeded 50% in 12 years, accounting for 19.05% of the study period. In summer, the highest percentage was 72.07% in 1997, followed by 66.37% in 1966 and 64.26% in 1969 (Figure 4b). There were 13 years in which the percentage surpassed 50%, representing 20.63% of the period. During autumn, the maximum percentage reached 97.90% in 1998, with other notable peaks at 70.87% in 2007 and 68.17% in 2001 (Figure 4c). The percentage exceeded 50% in 15 years, constituting 23.81% of the study period. For winter, the peak annual percentage reached 100% in 1999, followed by 90.09% in 1995 and 73.57% in 1983 (Figure 4d). The percentage surpassed 50% in 17 years, accounting for 26.98% of the period.
Figure 4.
Interannual variation of the drought range in different seasons ((a): Spring, (b): Summer, (c): Autumn, (d): Winter).
3.2. Spatial Distribution Characteristics of Drought Frequency
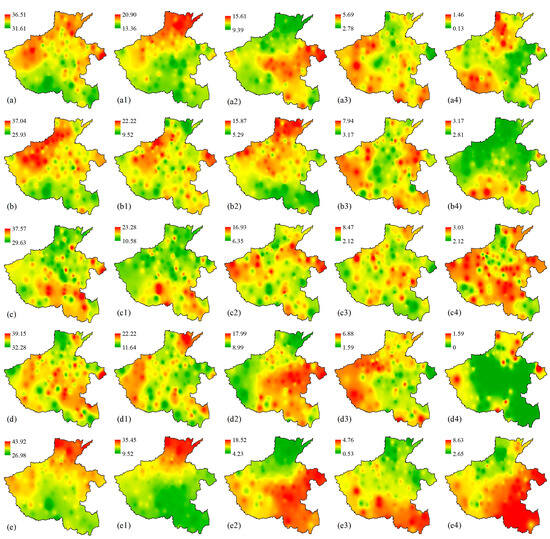
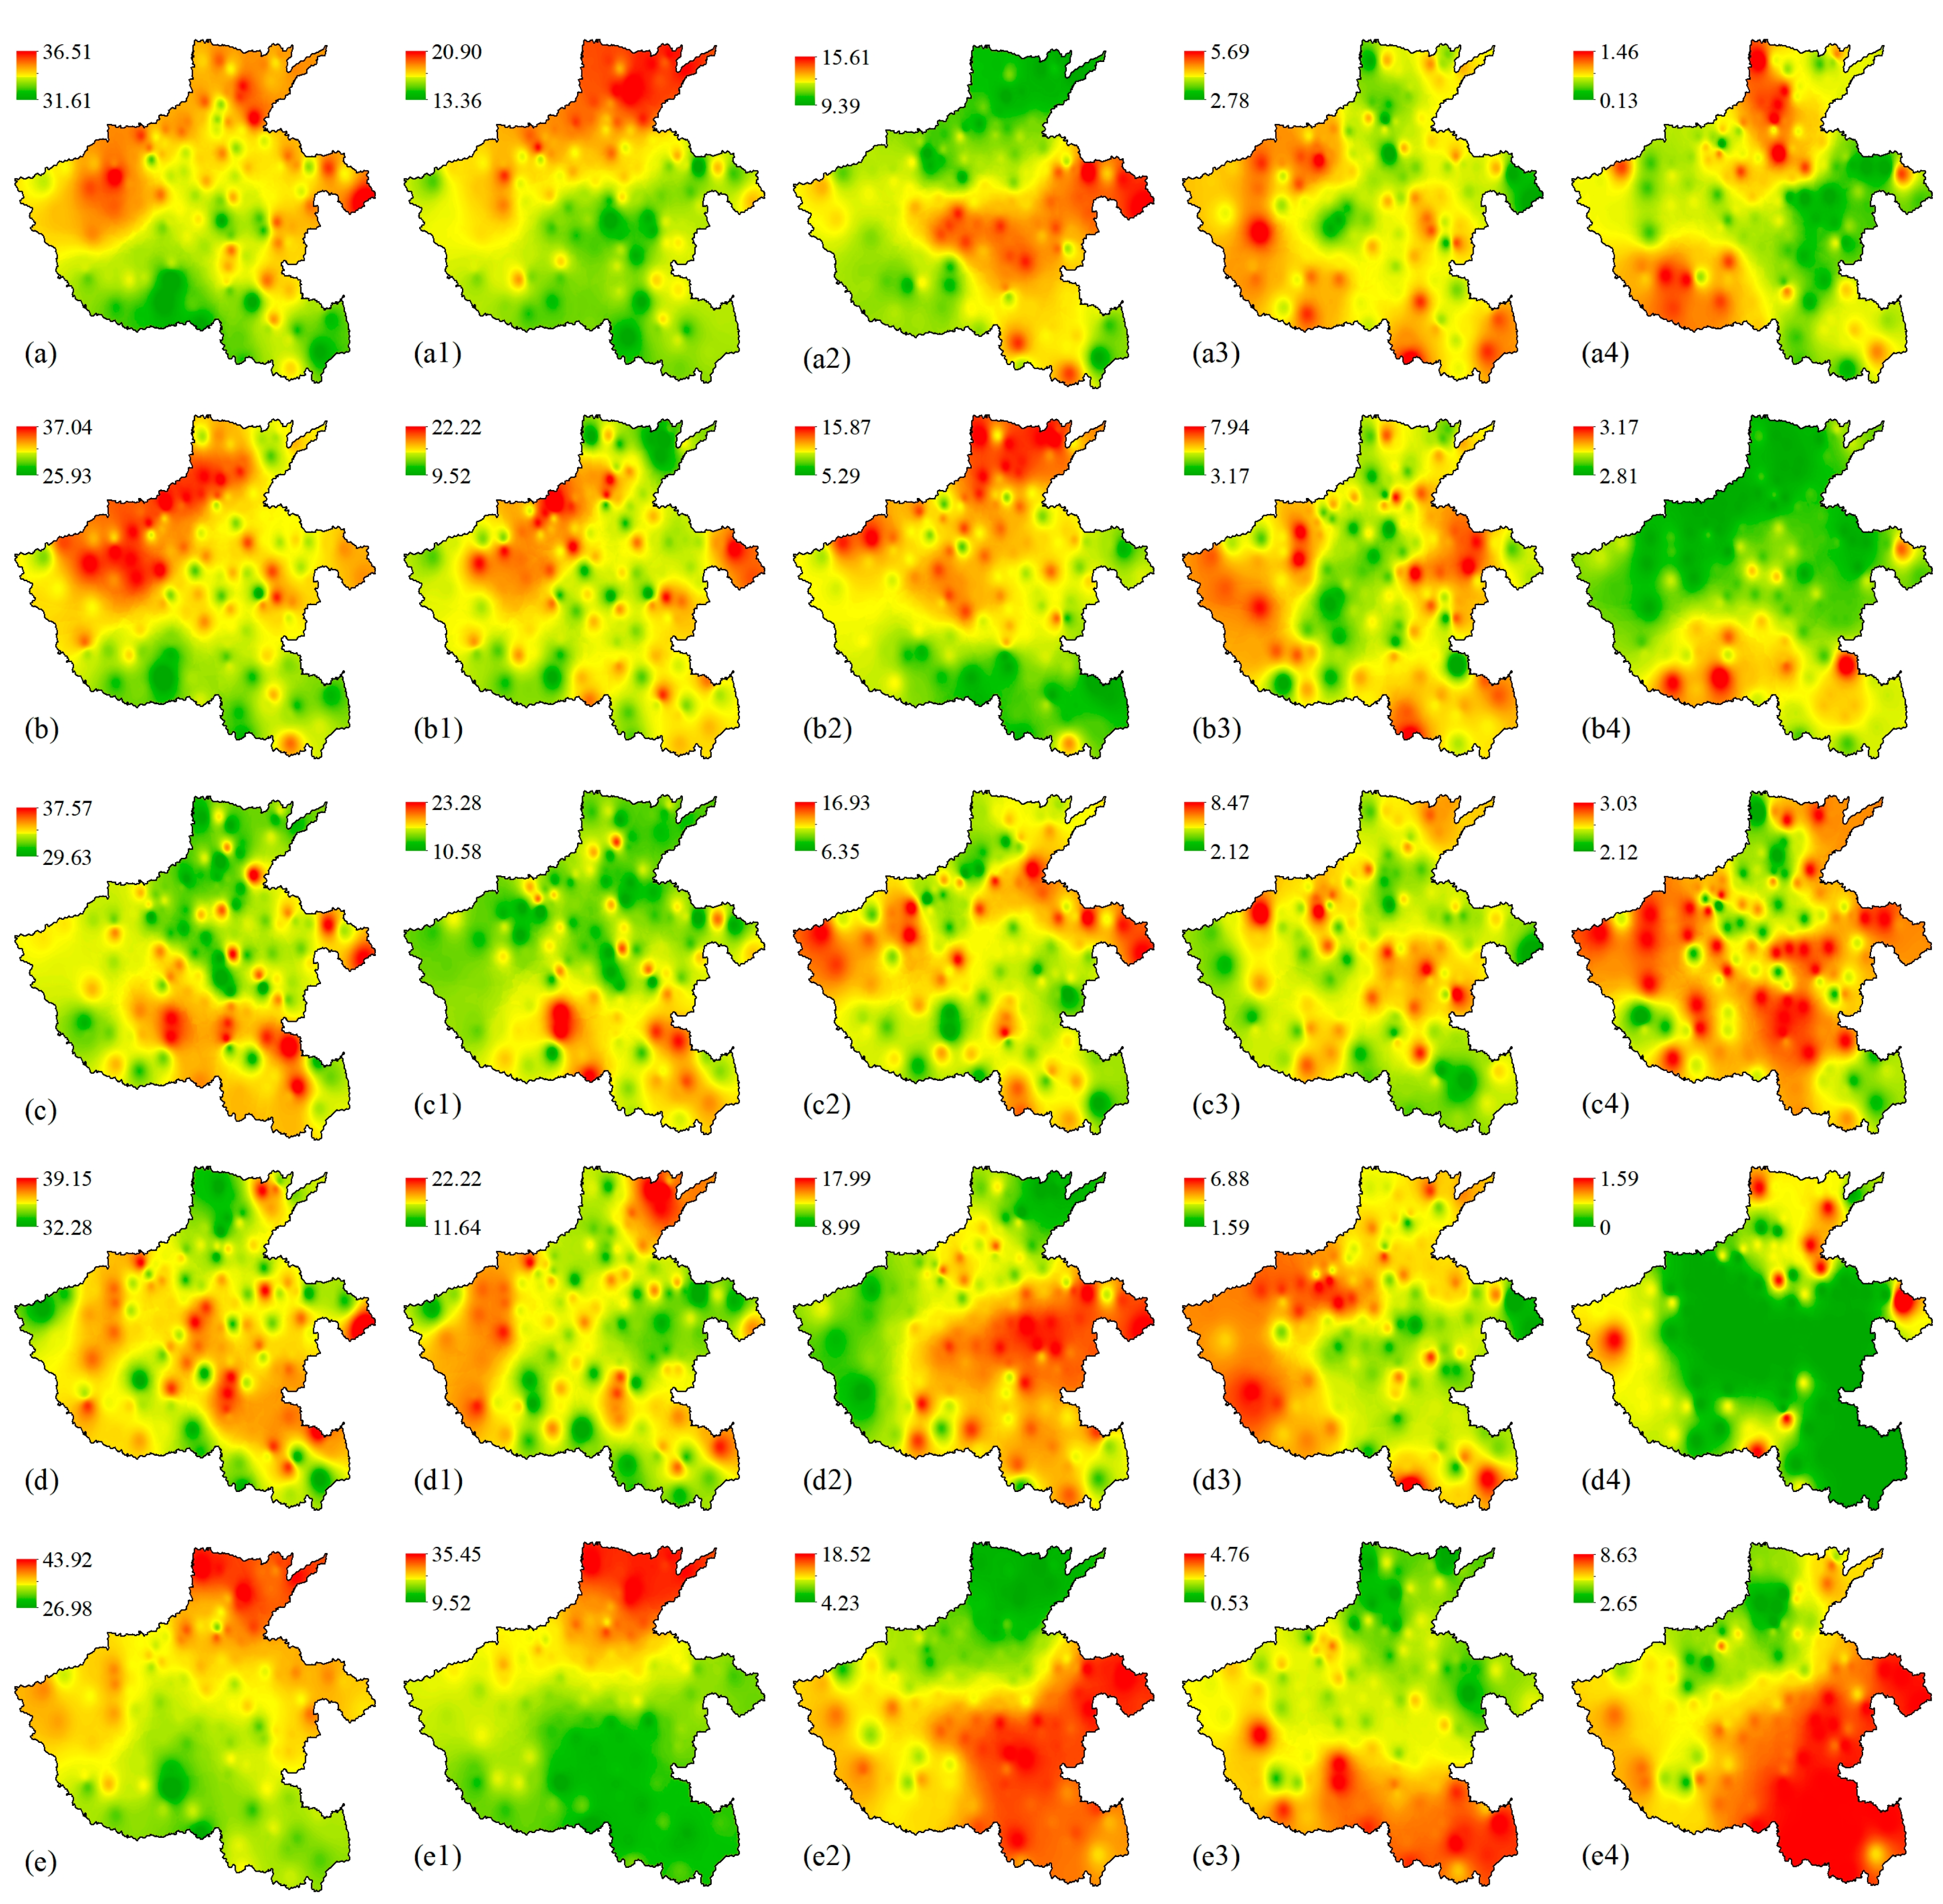
The spatial distribution of drought frequency based on SPEI1 is shown in Figure 5. Overall, the annual drought frequency in Henan province ranges from 31.61% to 36.51% (Figure 5a), with a mean value of 34.16% (Table 3). High annual drought frequency is primarily distributed in the northwestern, northern, and eastern parts of the province. Drought centers are mainly located in Luoning, Songxian, Yiyang in the northwest, Changyuan and Huaxian in the north, and Yongcheng in the east. The frequency of slight drought is higher in northern Henan than in the south, roughly demarcated by the Minquan–Luanchuan line (Figure 5(a1)). Moderate drought frequency is higher in the central–eastern regions (Figure 5(a2)). The frequency of severe drought is elevated in the western and southern areas compared to other regions (Figure 5(a3)). The frequency of extreme drought across Henan is relatively low, averaging 0.66%. Higher frequencies of extreme drought are observed in the southwestern and northern parts of the province (Figure 5(a4)), with Neixiang and Zhenping in the southwest, and Xinxiang and Weihui in the north, acting as focal centers for high extreme drought frequency.
Figure 5.
Spatial distribution of drought frequency (%) of annual, spring, summer, autumn, and winter from 1961 to 2023: (a) annual drought, (a1) annual slight drought, (a2) annual moderate drought, (a3) annual severe drought, (a4) annual extreme drought, (b) spring drought, (b1) spring slight drought, (b2) spring moderate drought, (b3) spring severe drought, (b4) spring extreme drought, (c) summer drought, (c1) summer slight drought, (c2) summer moderate drought, (c3) summer severe drought, (c4) summer extreme drought, (d) autumn drought, (d1) autumn slight drought, (d2) autumn moderate drought, (d3) autumn severe drought, (d4) autumn extreme drought, (e) winter drought, (e1) winter slight drought, (e2) winter moderate drought, (e3) winter severe drought, and (e4) winter extreme drought.
Table 3.
Average drought frequency (%) of annual and seasonal difference at different meteorological stations from 1961 to 2023.
Regarding the seasonal distribution of drought frequency, winter and autumn exhibit higher frequencies than summer and spring. While the quantitative differences in drought frequency across severity grades within each season are not large (Table 2), their spatial distributions show significant variation (Figure 5). The northwestern part of Henan is more prone to drought in the spring (Figure 5b). The southwestern region is more susceptible in the summer (Figure 5c). During autumn, drought frequency is relatively high across the entire study area (Figure 5d), whereas in winter, higher frequencies are concentrated in the northern regions (Figure 5e). In the spring, except for minor areas in the northeast and southwest, the entire region is prone to slight drought. Most northern areas exhibit high frequencies of moderate drought. The frequency of severe drought is higher in other regions compared to the central area. Extreme drought is more likely to occur in small parts of southwestern Henan, with Dengzhou and Tanghe serving as frequency centers. In the summer, southern Henan shows a higher frequency of slight drought. Western and eastern areas are more prone to moderate drought. Severe drought is distributed relatively uniformly across the province. Extreme drought frequency is higher in northern areas, Xixia and Neixiang in the southwest, and Shangcheng and Huangchuan in the southeast. In the autumn, slight drought occurs more frequently in the northwestern and northeastern parts of the province. The frequency of moderate drought is higher in the southeast and lower in the northwest, while the spatial pattern for severe drought is the opposite (higher in the northwest, lower in the southeast). Extreme drought frequency is lowest in autumn, with western and northern areas experiencing higher frequencies than other regions. In the winter, small northern areas exhibit a higher frequency of slight drought, while the remaining regions show higher frequencies of moderate drought. Severe drought frequency is elevated in the southwestern and southern areas, whereas extreme drought frequency is higher in the northwestern and northern regions.
3.3. Spatiotemporal Mode Analysis of Drought at Multiple Scales
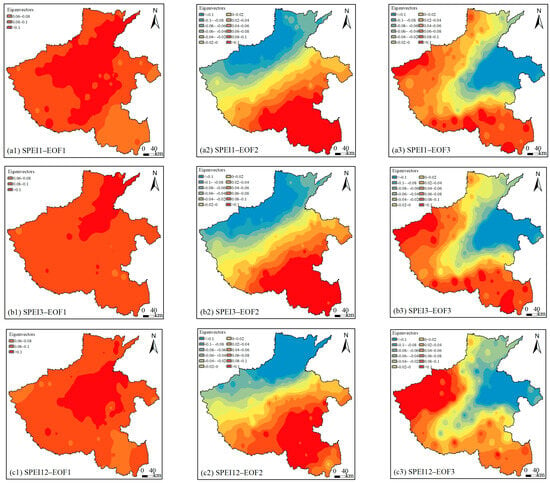
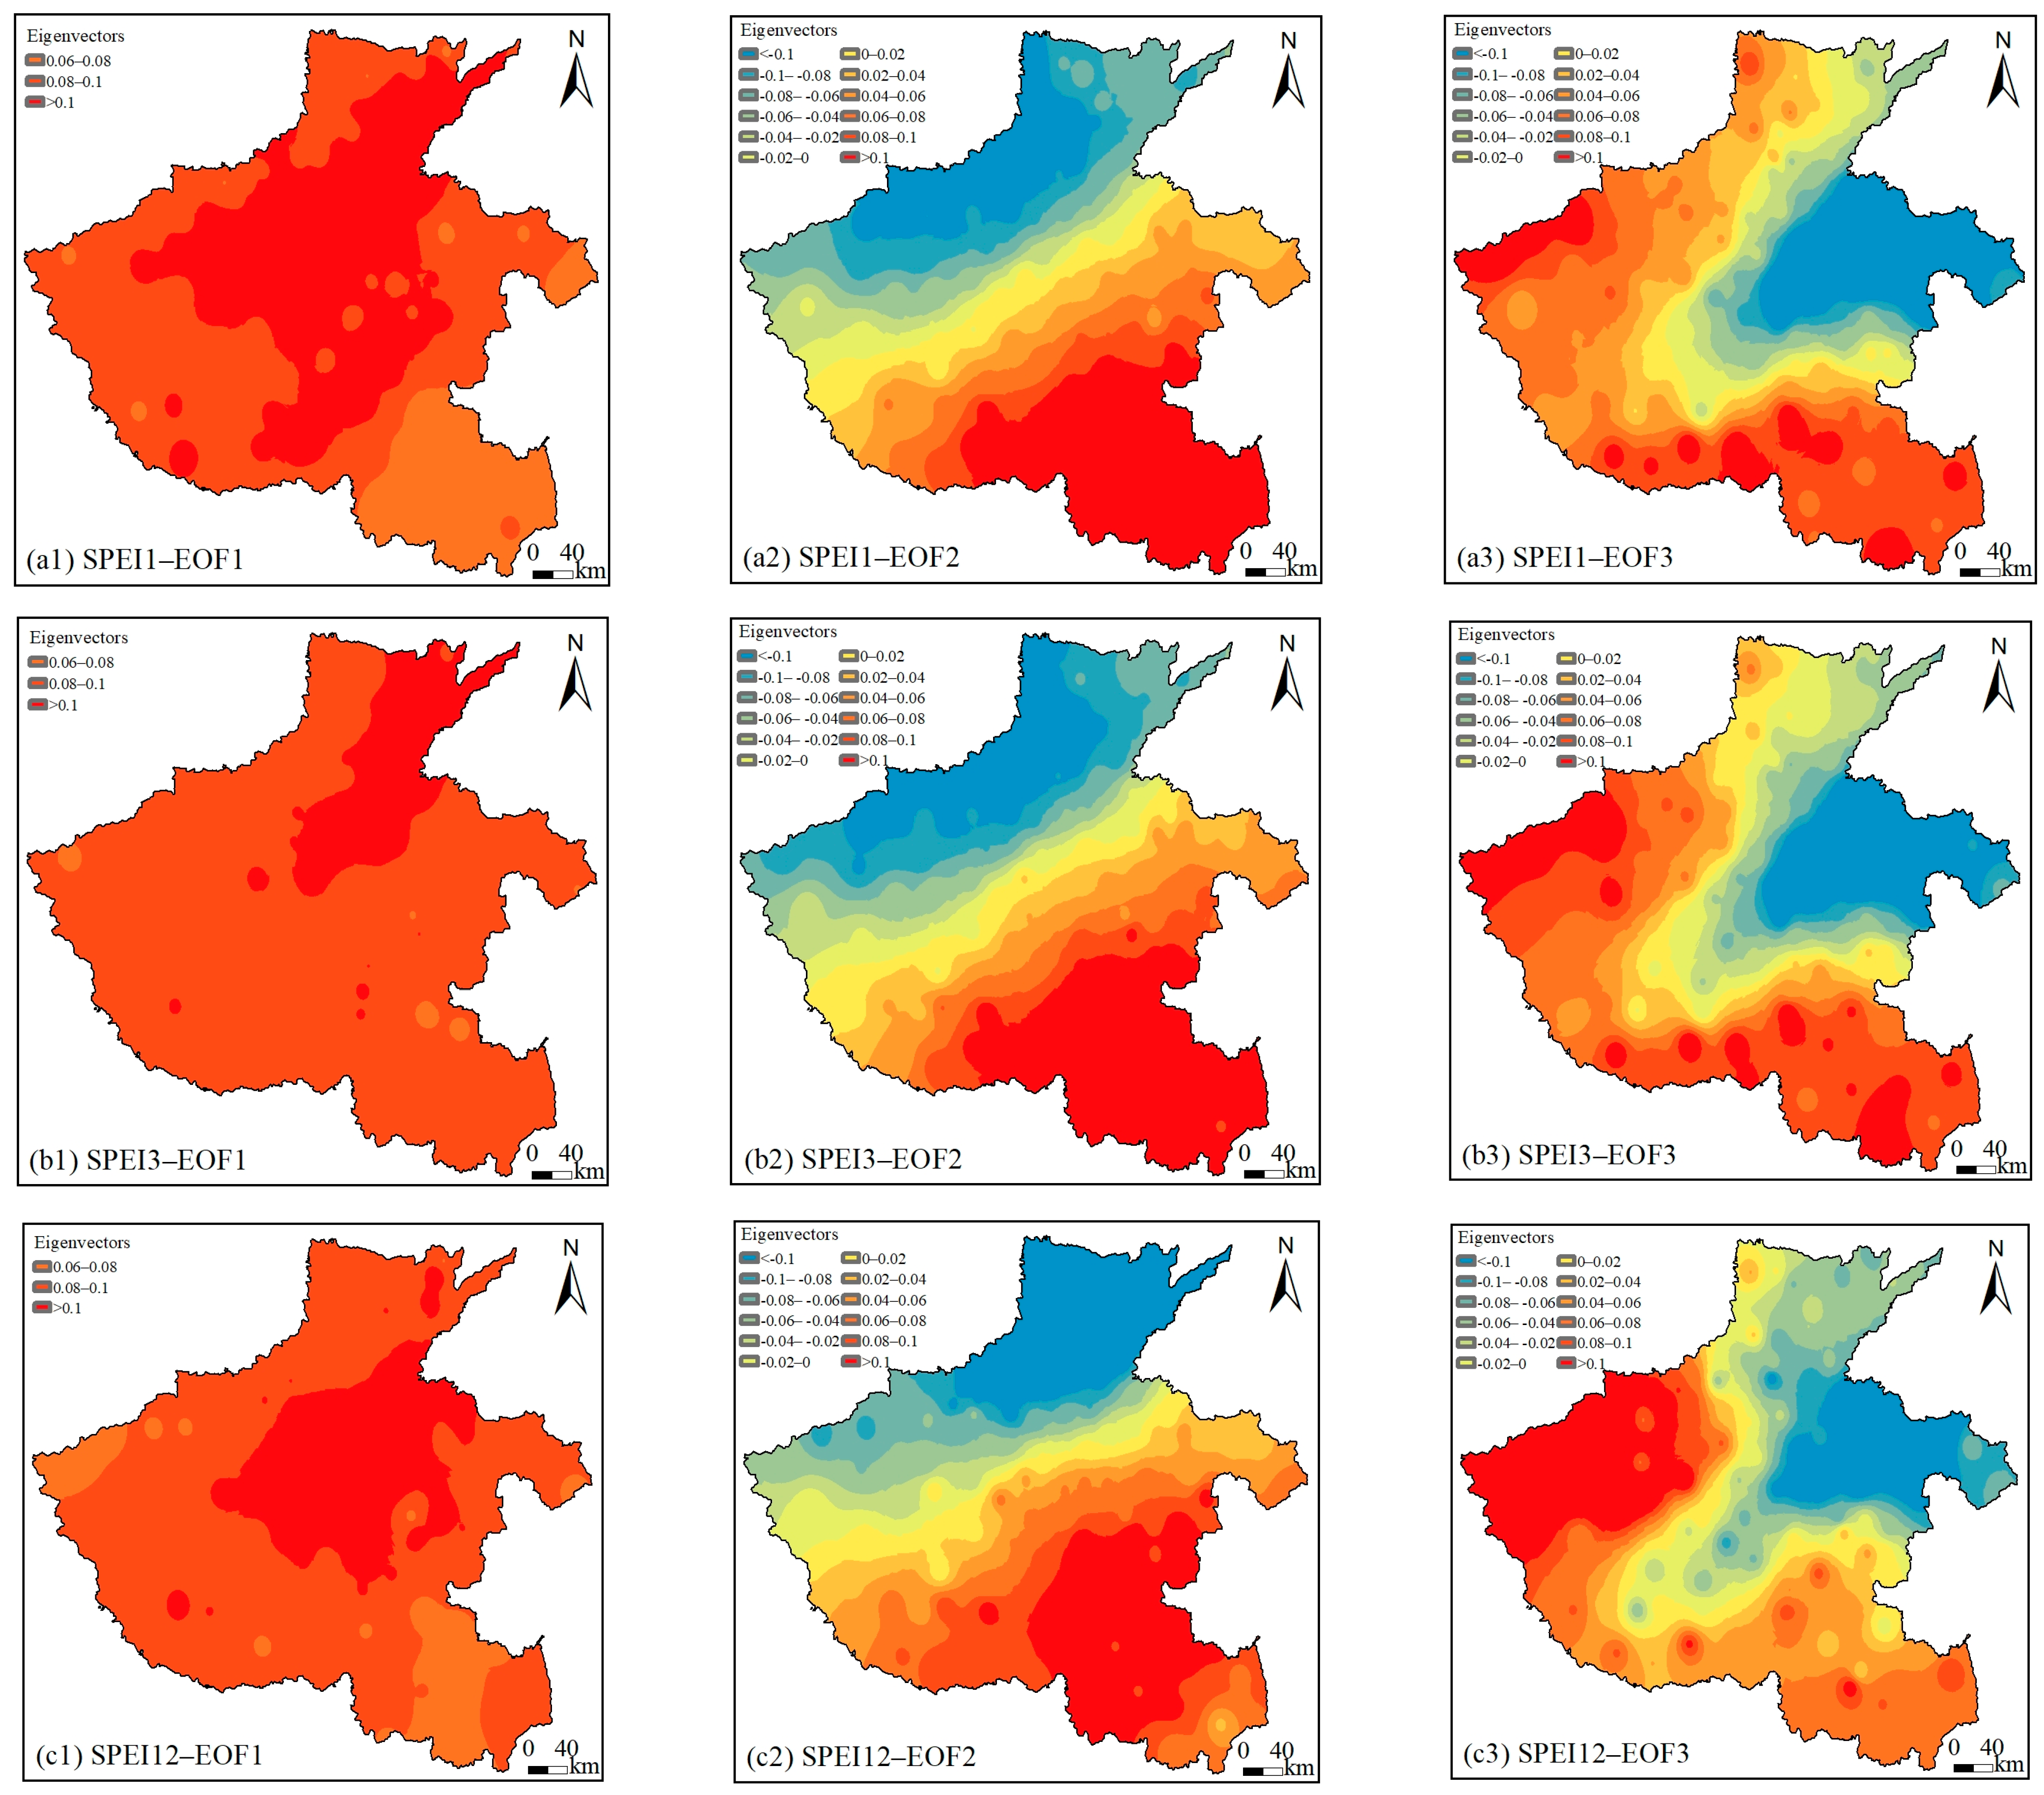
The results of EOF decomposition based on the annual mean SPEI variable fields (SPEI1, SPEI3, SPEI12) show that the spatial modes of SPEI derived at the three temporal scales exhibit generally similar overall patterns, though with some regional differences (Figure 6). Across the three scales, the cumulative variance contribution rates of the first three principal eigenvectors are 80.89%, 77.63%, and 70.35%, respectively (Table 4).
Figure 6.
The first three EOF eigenvectors of the averaged SPEI1 (a1–a3), SPEI3 (b1–b3), and SPEI12 (c1–c3).
Table 4.
Explained variance of the dominant EOF modes of multiscale averaged SPEI.
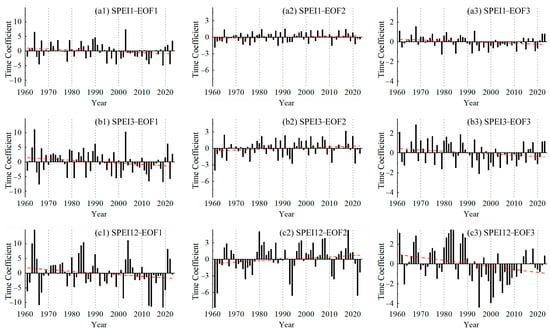
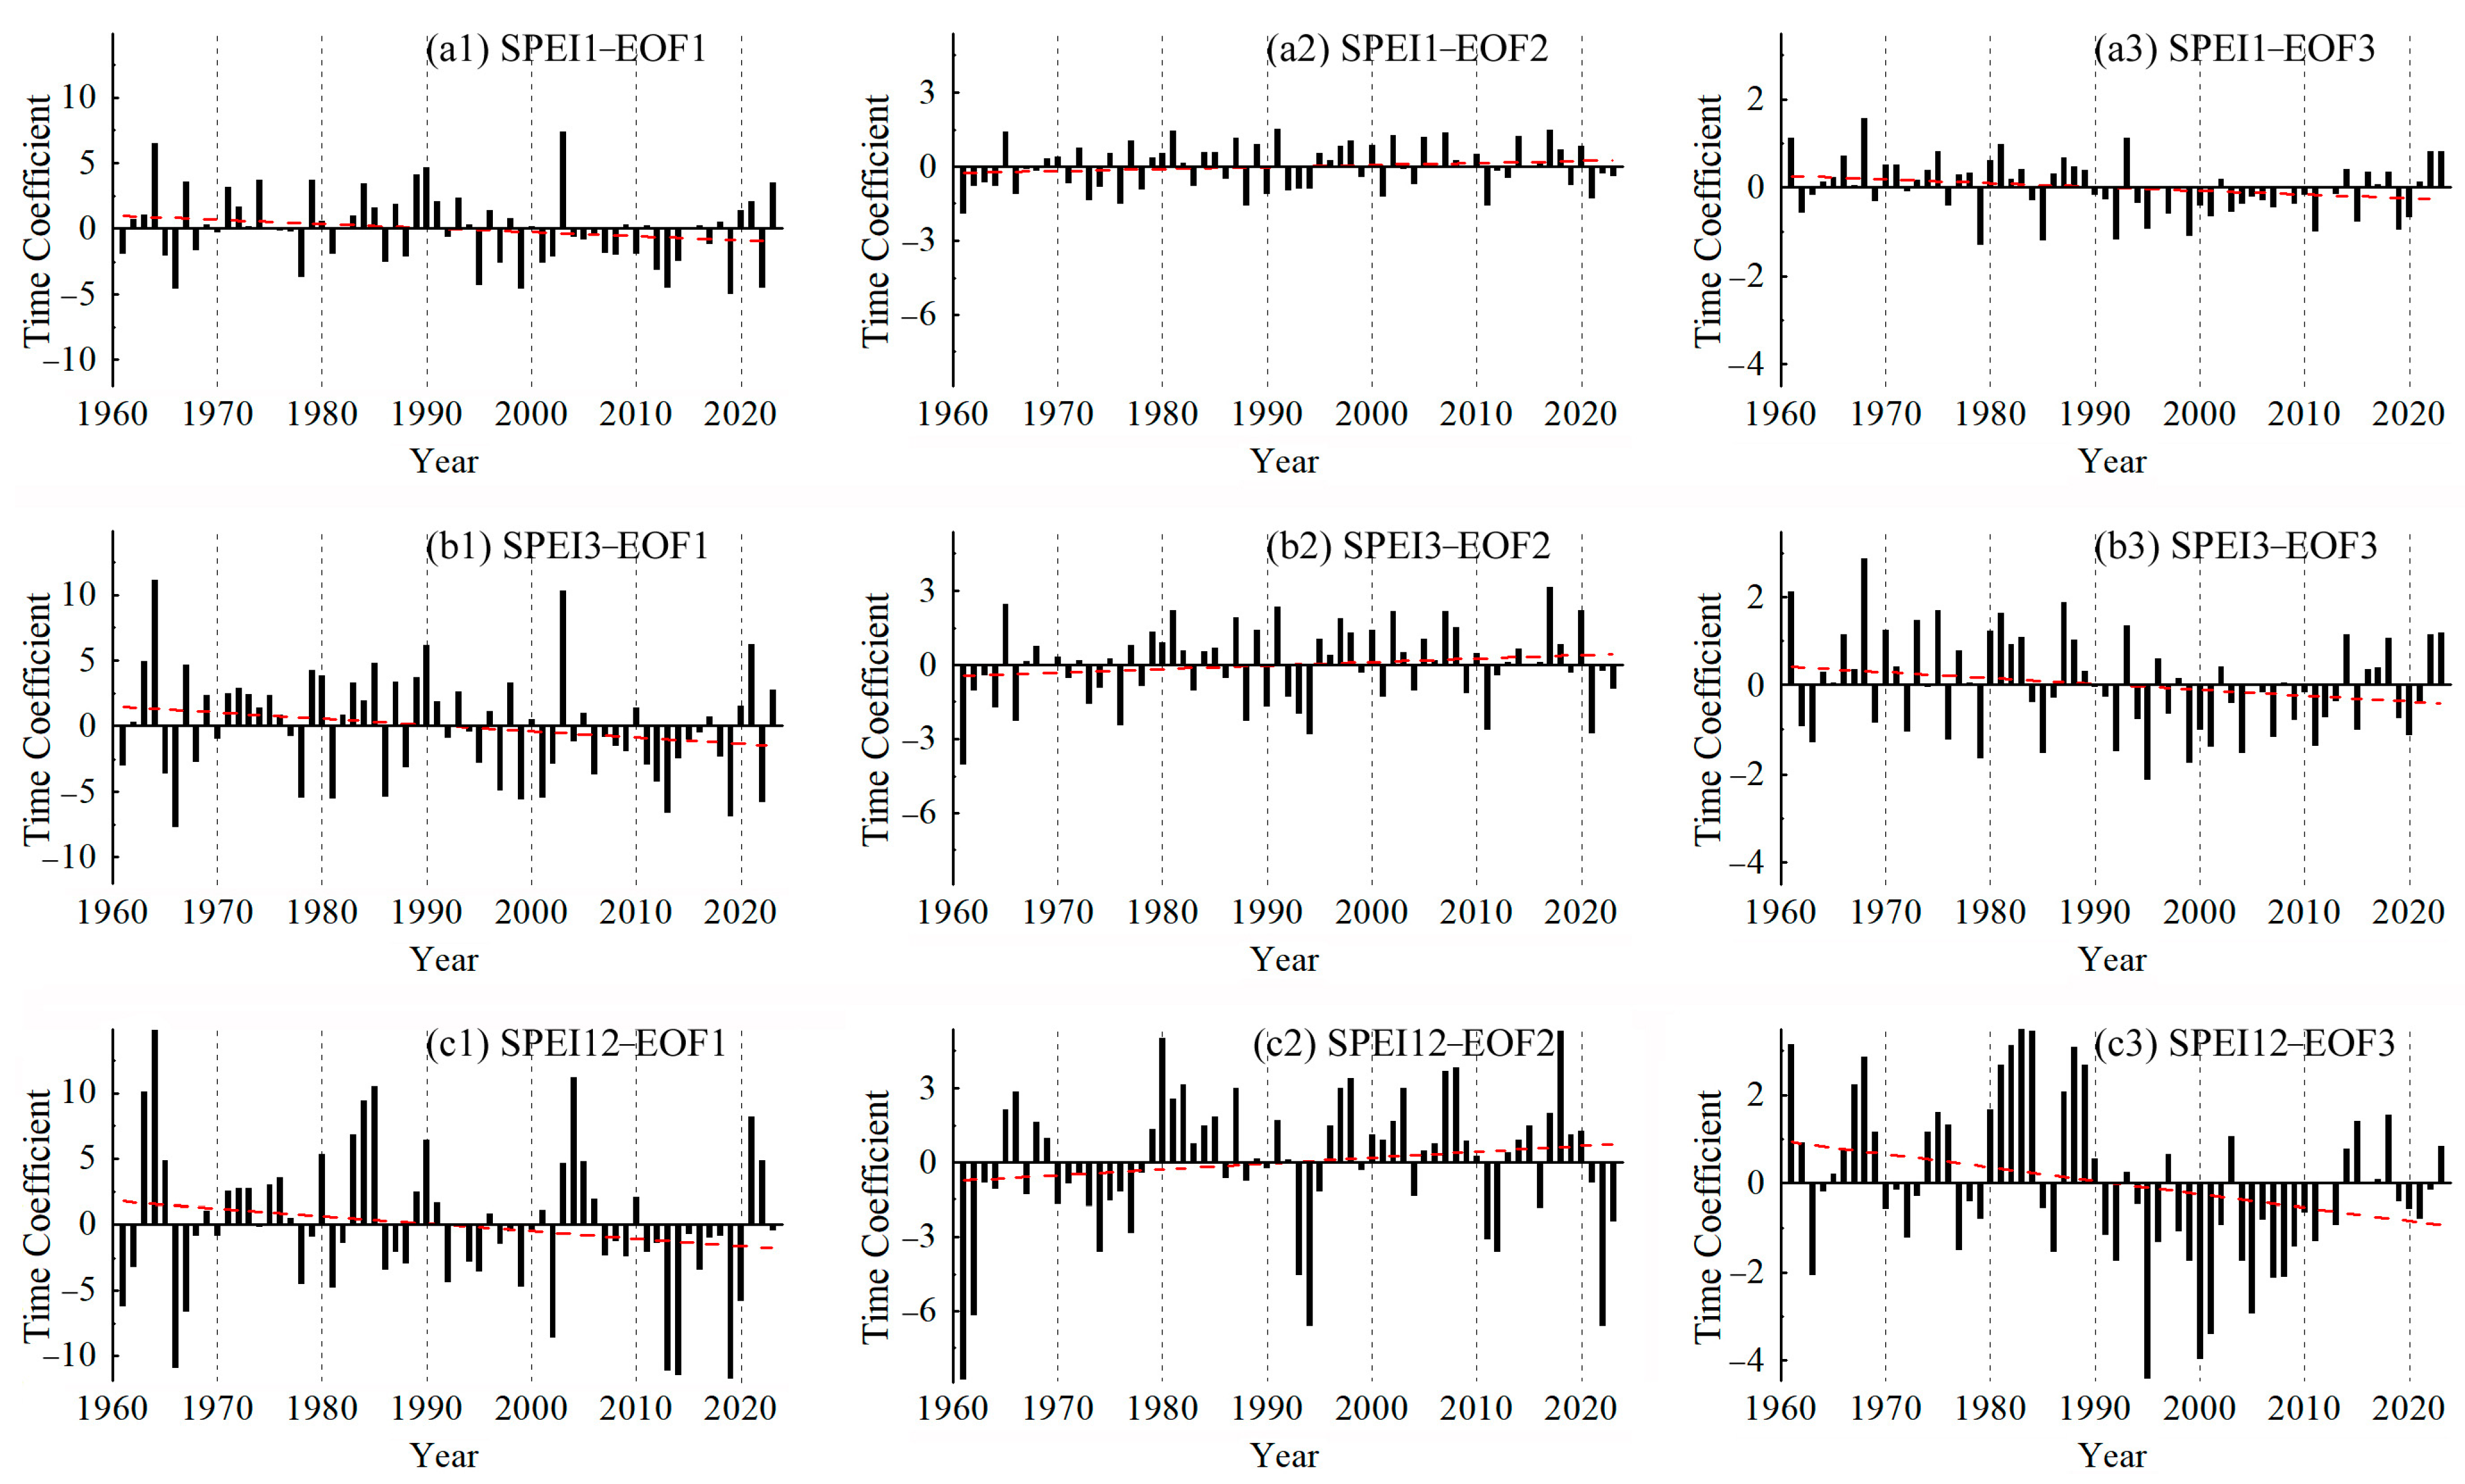
The EOF decomposition based on SPEI reveals that the first mode is the dominant spatial distribution pattern of drought in Henan province, with explained variances of 69.33%, 63.68%, and 51.56% for SPEI1, SPEI3, and SPEI12, respectively. The loadings of the first mode are uniformly positive across the study area, indicating a spatially coherent pattern in the primary drought mode. The high-value centers for SPEI1 are located in the central–northeastern region (Ruyang–Changyuan), for SPEI3 in the northeastern region (Yuzhou–Fanxian), and for SPEI12 in the central region (Baofeng–Lankao). These areas represent sensitive zones for drought occurrence. The temporal coefficient corresponding to the first mode of SPEI1 generally exhibits a decreasing trend (Figure 7(a1)). However, after 1995, the coefficient has been predominantly negative in most years, reflecting a shift from wetter to drier conditions in this mode. Similarly, the time coefficients for the first modes of SPEI3 and SPEI12 also show overall declining trends, indicating a consistent transition toward drier conditions in their respective first modes.
Figure 7.
Time coefficient of the first three eigenvectors of SPEI1 (a1–a3), SPEI3 (b1–b3), and SPEI12 (c1–c3). Note: The red dotted line is linear trend.
EOF decomposition based on SPEI1, SPEI3, and SPEI12 indicates that the explained variances of the second mode are 7.93%, 9.13%, and 13.21%, respectively. Overall, this mode exhibits a spatial pattern characterized by opposite anomalies between the southeastern and northwestern parts of Henan province, roughly demarcated by a line from Luanchuan to Lankao. For SPEI1 and SPEI3, the high-value center in the southeast is located at the southeastern corner of Henan, while the high-value center in the northwest extends from Mianchi to Qixian. For SPEI12, the high-value center in the southeast is situated in the Luohe to Guangshan area, and the high-value center in the northwest is located in the northern part of the province. The time coefficients corresponding to the second mode of SPEI1 and SPEI3 show an overall increasing trend (Figure 7(a2, b2)). Before 1995, the coefficients were negative in more years than positive, but after 1995, they have been positive in more years than negative. This indicates a shift in Henan province from a pattern of “wetter northwest and drier southeast” before 1995 to one of “drier northwest and wetter southeast” thereafter. The time coefficient for the second mode of SPEI12 also displays an overall increasing trend, suggesting a post-1995 tendency toward “wetter southern areas and drier northern areas”. EOF decomposition based on SPEI1, SPEI3, and SPEI12 further shows that the explained variances of the third mode are 3.63%, 4.82%, and 5.58%, respectively. This mode represents the third most important regional drought pattern in Henan province, exhibiting a spatial structure in which the central–eastern region is opposite to other areas (Figure 6(a3, b3, c3)). The time coefficients for the third mode of SPEI1 and SPEI3 show decreasing trends, while the coefficient for SPEI12 exhibits a significant decreasing trend (p < 0.05). Before 1990, the coefficients were positive in more years than negative, but after 1990, they have been negative in more years than positive. This reflects a transition in Henan province from a pre-1990 pattern of “drier central–eastern region and wetter other regions” to a post-1990 pattern of “wetter central–eastern region and drier other regions”.
A comparison of EOF decompositions across multiple time scales reveals that the shorter the time scale, the greater the explanatory power of the first mode for the spatial distribution of drought, and the clearer the details of drought patterns. Conversely, longer time scales yield more defined spatial regularity in drought distribution. The influence of time scale on EOF decomposition is also evident in the variation in time coefficients. As shown in Figure 7, the amplitude of time coefficient fluctuations gradually increases with longer time scales. This indicates that SPEI at longer time scales responds more slowly to climatic variations, thereby more clearly reflecting the interannual characteristics of drought and flood variability.
3.4. Prediction of Future Drought Trends
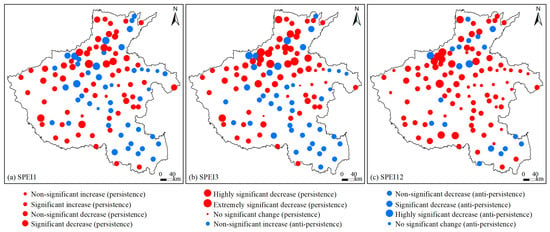
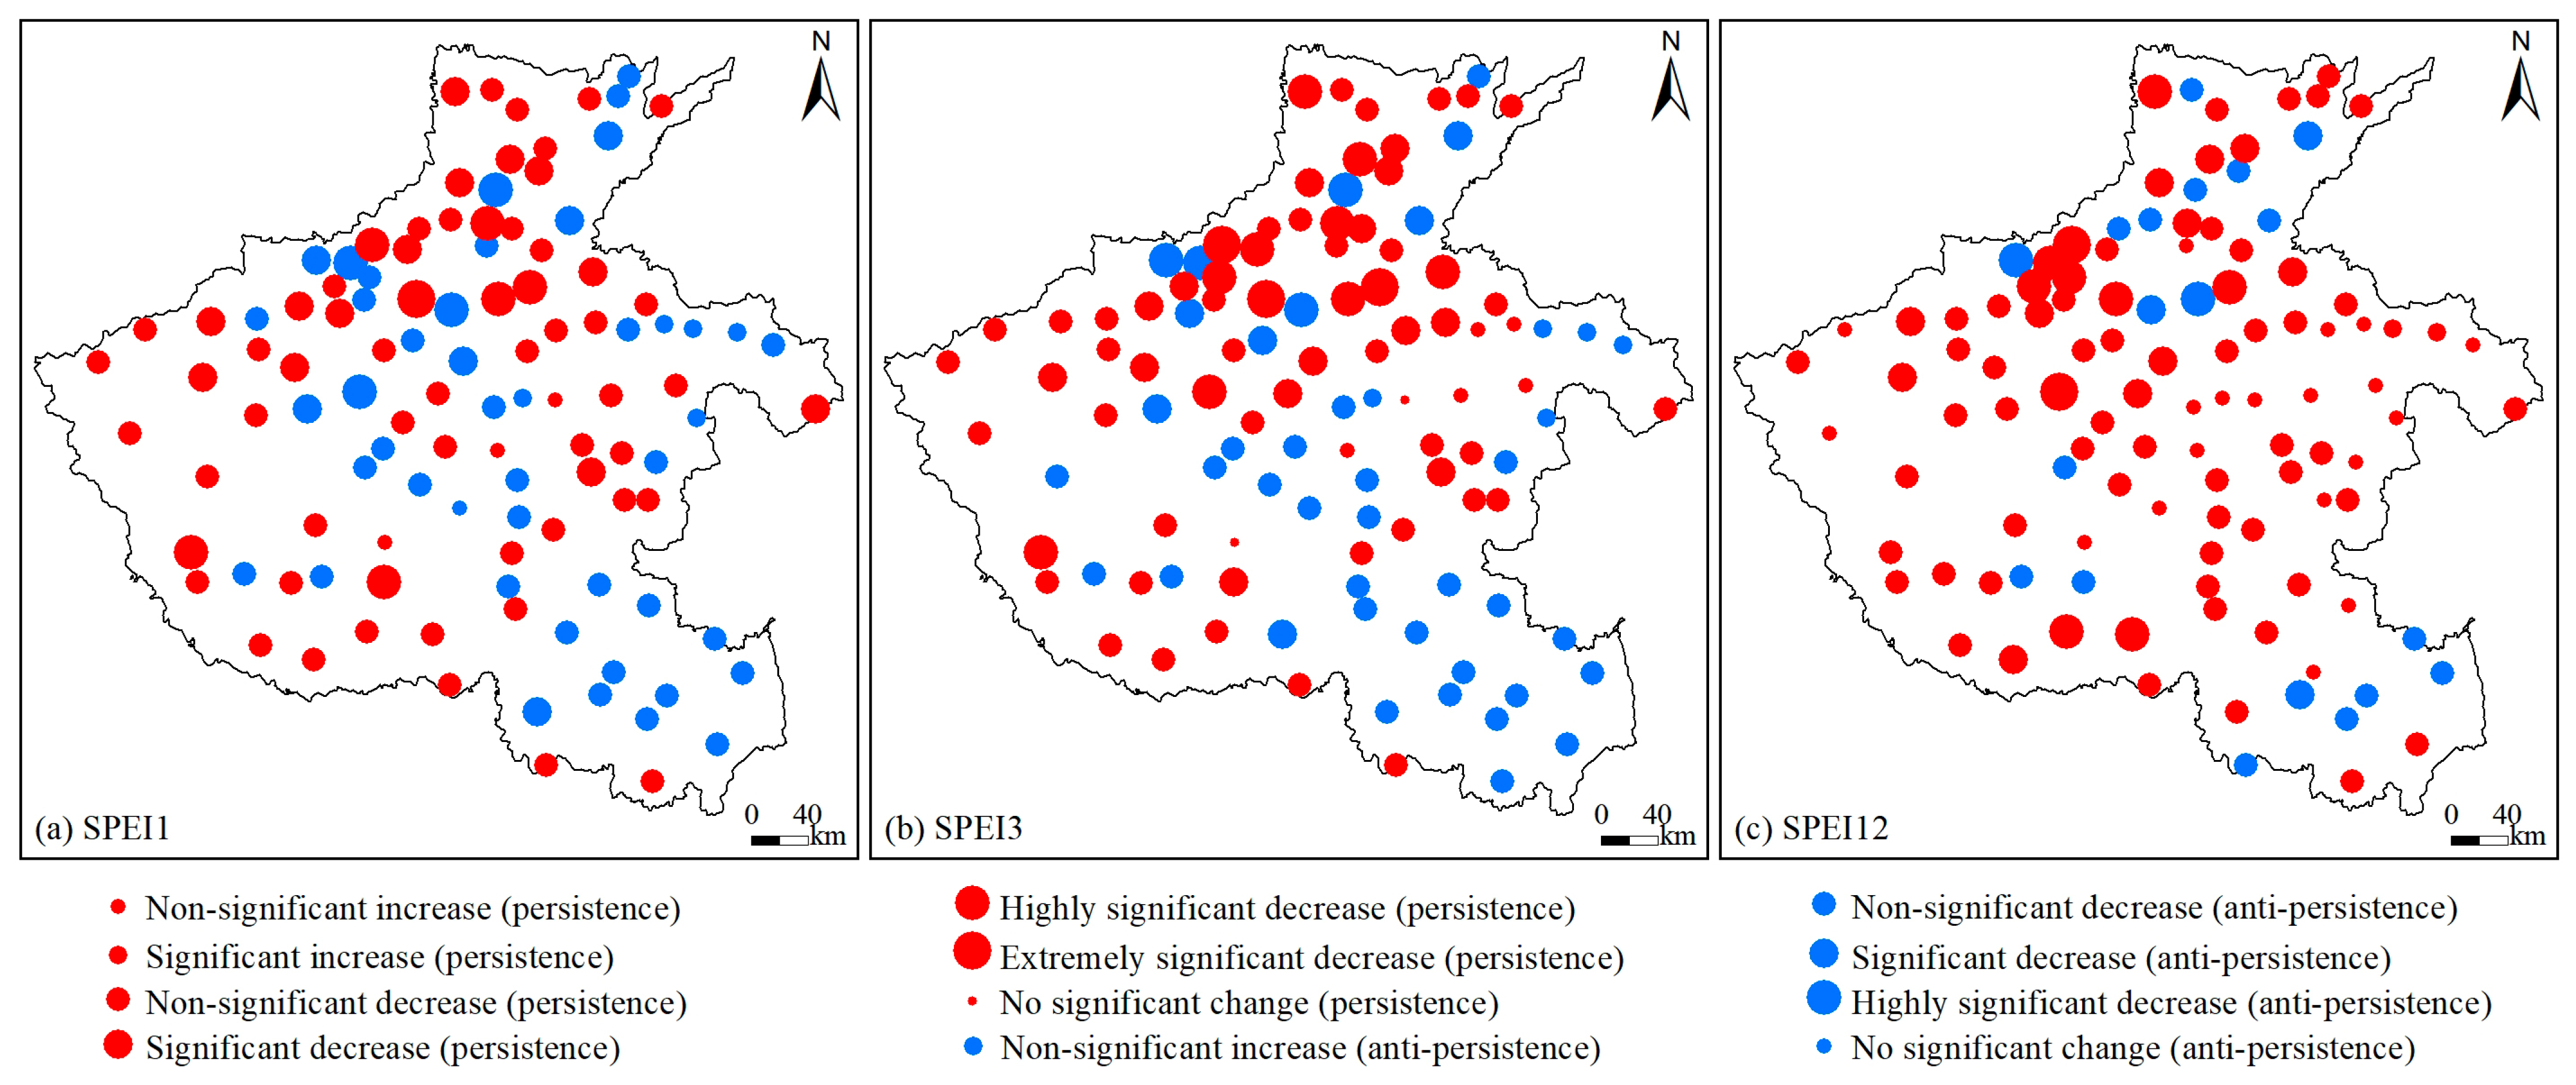
By overlaying the significance test results of the Sen’s slope estimator for SPEI with the calculated Hurst exponent, a coupled map of drought increase, decrease, and future persistence in the study area was obtained (Figure 8). The Sen’s trend analysis across SPEI1, SPEI3, and SPEI12 scales shows that the proportions of stations with declining SPEI trends are 91.89%, 89.19%, and 81.08%, respectively, indicating that drought has intensified at the vast majority of stations during the study period. As shown in Figure 8, the proportion of stations exhibiting future drought persistence exceeds that showing anti-persistence, especially for results based on SPEI12, where stations with persistent drought account for as high as 82.88%. Stations with anti-persistence are sporadically distributed in small parts of southern and northern Henan (Figure 8c). This suggests that future drought changes in Henan province will continue the trend of gradual aridification observed in the past. Based on SPEI1, stations with persistent decrease SPEI account for 56.76%, indicating that drought conditions will worsen in most areas of Henan in the future. Among these, stations showing persistent significant (p < 0.05), highly significant (p < 0.01), and extremely significant (p < 0.001) decrease trends account for 18.02% and are mainly distributed in northern Henan, as well as in Xixia and Sheqi in the southwest (Figure 8a). Results based on SPEI3 show that stations with persistent decrease SPEI account for 55.86%, suggesting that drought conditions will intensify across most of Henan in the future. Among these, stations exhibiting persistent significant (p < 0.05), highly significant (p < 0.01), and extremely significant (p < 0.001) decrease trends account for 23.42% and are primarily located in northern Henan, as well as in Xixia and Sheqi in the southwest (Figure 8b). Based on SPEI12, the proportion of stations with persistent decrease SPEI is even larger, at 63.06%, indicating a more pronounced intensification of drought across most of Henan in the future. Among these, stations showing persistent significant (p < 0.05), highly significant (p < 0.01), and extremely significant (p < 0.001) decrease trends account for 18.92% and are mainly distributed in northern Henan, as well as in Xinye, Tanghe, and Biyang in the southwest (Figure 8c). A persistent increase in SPEI indicates drought alleviation and a trend toward wetter conditions. Based on the results of SPEI1, SPEI3, and SPEI12, the numbers of meteorological stations exhibiting such changes are 3, 5, and 19, respectively, primarily concentrated in eastern Henan. However, the persistent increasing trends at these stations are all non-significant (p > 0.05).
Figure 8.
Spatial distribution of drought persistence based on Sen trend analysis and Hurst exponent.
4. Discussion
The results of this study indicate that the counts of drought occurrence in Henan province showed a non-significant increasing trend from 1961 to 2023 (p > 0.05). This is consistent with findings from existing research. SPEI values effectively reflect drought variations in Henan, and over the recent 53-year period (1961–2013), the overall frequency of drought in the province exhibited an upward trend [28]. Previous study also found that drought conditions in Henan generally intensified gradually during 1987–2020 [31]. Similarly, Hao et al. (2013) [26] reported an overall increasing trend in drought from 1960 to 2010. Sen’s trend analysis across multiple time scales (SPEI1, SPEI3, and SPEI12) further reveals that drought intensified at the vast majority of stations during the study period, with only a small number of stations showing slight wetting trends, mainly concentrated in eastern Henan. However, some studies have presented different conclusions. For instance, Chen et al. (2017) [29] suggested that SPEI values across all time scales in Henan exhibited a slight wetting trend during the 56-year period from 1961 to 2016. Although the overall increase in drought across Henan is not statistically significant, drought intensity has notably intensified. For example, this study shows that the moderate drought displayed a non-significant increasing trend (p > 0.05), while the severe drought and extreme drought both exhibited significant increasing trends (p < 0.05).
Winter recorded the highest frequency and occurrence of drought, followed by autumn and summer, while spring had the lowest frequency. During 1961–2023, spring and summer drought frequency showed increasing trends, whereas autumn and winter drought frequency exhibited non-significant increasing trends (p > 0.05). These findings are consistent with existing research. For example, Hao et al. (2013) [26] reported that both drought intensity and the percentage of stations affected increased for spring and autumn droughts, while summer and winter droughts showed some alleviation. Additionally, Shang et al. (2021) [30] observed that over the past 45 years (1970–2014), summer droughts in Henan were mostly regional, whereas spring and autumn droughts tended to be widespread across the entire province. This study further reveals that severe drought frequency in both spring and autumn showed highly significant increasing trends (p < 0.01). Therefore, drought conditions during spring and autumn in Henan province deserve particular attention.
Based on EOF decomposition, the spatial distribution of drought in Henan province exhibits three dominant modes. The first mode shows a spatially coherent pattern across the entire region. The second mode displays opposite anomalies between the southeastern and northwestern regions, while the third mode reveals an inverse spatial pattern between the central–eastern region and other areas. The EOF decomposition method effectively extracts mutually orthogonal spatiotemporal modes from complex drought variable fields, accurately capturing both the temporal variations and spatial patterns of drought. It serves as a powerful tool for decomposing drought characteristics, and the resulting spatiotemporal framework demonstrates strong regularity and identifiability.
The results of this study indicate that high annual drought frequency is primarily distributed in the northwestern, northern, and eastern regions of Henan. However, the frequency of severe drought is higher in the western and southern parts of the province compared to other areas. Existing research corroborates certain aspects of these findings. For example, Lu et al. (2022) [27] reported that northwestern Henan experienced significant drought, while the southeast remained relatively wet during 1970–2019. Similarly, Luo and Li (2023) [40] found that northern and eastern Henan had higher drought frequencies, and southern regions were prone to persistent drought. Another study noted that in recent years (2015–2020), most parts of Henan exhibited normal conditions, with only small areas classified as wet or dry, and drought-prone regions mainly concentrated in central Henan [32]. The present study further reveals that moderate drought frequency is higher in the central–eastern regions. Moreover, spatial distribution patterns vary across seasons: spring droughts are more likely in the northwestern region, summer droughts in the southwestern region, and autumn droughts show relatively high frequencies across the entire study area.
This study also has certain limitations. The assessment of spatiotemporal patterns of meteorological drought in this research is primarily based on meteorological data. Little analysis has been conducted on influencing factors such as soil moisture, vegetation, and atmospheric circulation, which limits the applicability of the findings to agricultural production practices. Therefore, integrating atmospheric circulation, land use, irrigation, and other relevant aspects into future drought studies will help to better reveal the spatiotemporal evolution of drought and provide support for drought mitigation and sustainable agricultural development.
5. Conclusions
This study calculates the SPEI based on daily meteorological data from stations in Henan province from 1961 to 2023, analyzing attributes such as the extent and frequency of annual and seasonal droughts. The temporal variation patterns and dominant spatial modes are explored from a multi-time-scale perspective (SPEI1, SPEI3, and SPEI12). Finally, future drought trends in the study area are predicted using the Theil–Sen median trend analysis and the Hurst exponent. The main conclusions are as follows:
- (1)
- From 1961 to 2023, the counts of drought in Henan province exhibited fluctuating changes, showing an overall non-significant increasing trend. However, drought intensity intensified. The counts of slight drought showed a non-significant decreasing trend, while moderate drought showed a non-significant increasing trend. In contrast, severe drought and extreme drought exhibited significant increasing trends. Sen’s trend analysis across the time scales of SPEI1, SPEI3, and SPEI12 indicates that drought intensified at the vast majority of stations during the study period. In the future, drought conditions in most areas of Henan are expected to continue the trend of gradual aridification observed in the past. Only a few stations, mainly concentrated in eastern Henan, show a trend toward wetter conditions, but these trends are not statistically significant.
- (2)
- Seasonal differences in drought in Henan province are also quite obvious. Winter recorded the highest frequency and occurrence of drought, followed by autumn and summer, while spring had the lowest frequency. From 1961 to 2023, spring and summer drought frequencies showed increasing trends, whereas autumn and winter drought frequencies exhibited non-significant increasing trends. Severe drought frequencies in both spring and autumn showed highly significant increasing trends, as did extreme drought frequency in autumn (p < 0.01). Except for summer, moderate and severe droughts increased across all seasons, while extreme droughts increased in every season, with particularly significant increases in spring and autumn.
- (3)
- High annual drought frequencies are primarily distributed in the northwestern, northern, and eastern regions of Henan. Slight drought frequency is higher in northern Henan than in the south. Moderate drought frequency is elevated in the central–eastern regions, while severe drought frequency is higher in the western and southern parts of the province. Extreme drought frequency is notably higher in the southwestern and northern regions. Spatially, spring droughts are more likely in the northwestern region, summer droughts in the southwestern region, autumn droughts show relatively high frequencies across the entire study area, and winter droughts are more frequent in the northern region.
- (4)
- EOF decomposition based on SPEI reveals that the first mode is the dominant spatial pattern of drought in Henan, exhibiting regional coherence and a shift from wetter to drier conditions. The second mode shows opposite anomalies between the southeastern and northwestern regions, while the third mode displays an inverse spatial pattern between the central–eastern region and other areas. A comparison of EOF decompositions across multiple time scales indicates that shorter time scales provide greater explanatory power for drought spatial distribution and finer details, whereas longer time scales reveal more defined spatial regularity. As the time scale increases, the amplitude of temporal coefficient fluctuations gradually intensifies, reflecting a slower response of long-term SPEI to climatic variations and a clearer representation of interannual drought and flood variability.
Author Contributions
Conceptualization, J.Y. and Z.G.; methodology, Z.G.; software, S.Z.; validation, X.L.; formal analysis, G.X.; investigation, M.R.; resources, J.Y.; data curation, T.Z.; writing—original draft preparation, J.Y.; writing—review and editing, Z.G. and S.Z.; visualization, S.Z.; supervision, M.R.; project administration, J.Y.; funding acquisition, J.Y. All authors have read and agreed to the published version of the manuscript.
Funding
This research was funded by the Key R&D and Promotion Project (Soft Science Research) in Henan Province, China, grant number 252400411087, and Innovation Training Program for College Students in Henan Province, grant number 202510477032. The funders had no role in study design, data collection and analysis, decision to publish, or preparation of the manuscript.
Institutional Review Board Statement
Not applicable.
Informed Consent Statement
Not applicable.
Data Availability Statement
The relevant data are within the manuscript. Not all data of the analysis are provided. We are willing to share our data if other scholars are interested in accessing it. The data are available on request from the corresponding author, Z.G., upon reasonable request.
Conflicts of Interest
The authors declare no conflicts of interest.
References
- West, H.; Quinn, N.; Horswell, M. Remote sensing for drought monitoring & impact assessment: Progress, past challenges and future opportunities. Remote Sens. Environ. 2019, 232, 111291. [Google Scholar]
- Fan, X.; Qin, Y.Y.; Gao, X. Interpretation of the Main Conclusions and Suggestions of IPCC AR6 Working Group I Report. Environ. Prot. 2021, 49, 44–48. [Google Scholar]
- IPCC. Summary for policymakers. In Climate Change 2021: The Physical Science Basis. Contribution of Working Group I to the Sixth Assessment Report of the Intergovernmental Panel on Climate Change; IPCC: Geneva, Switzerland, 2021. [Google Scholar]
- Ji, G.; Lai, Z.; Yan, D.; Wu, L.; Wang, Z. Spatiotemporal patterns of future meteorological drought in the Yellow River Basin based on SPEI under RCP scenarios. Int. J. Clim. Change Str. 2022, 14, 39–53. [Google Scholar] [CrossRef] [Scilit]
- Dai, A.G. Increasing drought under global warming in observations and models. Nat. Clim. Change 2013, 3, 52–58. [Google Scholar] [CrossRef] [Scilit]
- Zambrano, F.; Vrieling, A.; Nelson, A.; Meroni, M.; Tadesse, T.A. Prediction of drought-induced reduction of agricultural productivity in Chile from MODIS, rainfall estimates, and climate oscillation indices. Remote. Sens. Environ. 2018, 219, 15–30. [Google Scholar] [CrossRef] [Scilit]
- Trenberth, K.E.; Dai, A.; Van Der Schrier, G.; Jones, P.D.; Barichivich, J.; Briffa, K.R.; Sheffield, J. Global warming and changes in drought. Nat. Clim. Change 2014, 4, 17–22. [Google Scholar] [CrossRef] [Scilit]
- Naidu, C.V.; Raju, A.D.; Satyanarayana, G.C.; Kumar, P.V.; Chiranjeevi, G.; Suchitra, P. An observational evidence of decrease in Indian summer monsoon rainfall in the recent three decades of global warming era. Glob. Planet. Change 2015, 127, 91–102. [Google Scholar] [CrossRef] [Scilit]
- Mishra, A.K. Quantifying the impact of global warming on precipitation patterns in India. Meteorol. Appl. 2018, 26, 153–160. [Google Scholar] [CrossRef] [Scilit]
- Liu, Z.Q.; She, D.X.; Xia, J.; Zhang, L.P.; Li, J.Y.; Qi, G.Z. Impacts of meteorological drought on vegetation and their dynamic pattern evolutions on the Loess Plateau. Sci. Geogr. Sin. 2023, 43, 1659–1671. [Google Scholar]
- Chen, H.P.; Sun, J.Q. Changes in drought characteristics over China using the standardized precipitation evapotranspiration index. J. Clim. 2015, 28, 5430–5447. [Google Scholar] [CrossRef] [Scilit]
- Palmer, W.C. Meteorological Drought; US Department of Commerce, Weather Bureau: Washington, DC, USA, 1965; Volume 30, pp. 45–58. [Google Scholar]
- McKee, T.B.; Doesken, N.J.; Kleist, J. The relationship of drought frequency and duration to time scales. In Proceedings of the 8th Conference on Applied Climatology, Anaheim, CA, USA, 17–22 January 1993; Volume 17, pp. 179–183. [Google Scholar]
- Wang, Q.F.; Zeng, J.Y.; Qi, J.Y.; Zhang, X.S.; Zeng, Y.; Shui, W.; Xu, Z.H.; Zhang, R.R.; Wu, X.P.; Cong, J. A multi-scale daily SPEI dataset for drought characterization at observation stations over mainland China from 1961 to 2018. Earth Syst. Sci. Data 2021, 13, 331–341. [Google Scholar] [CrossRef] [Scilit]
- Vicente-Serrano, S.M.; Beguería, S.; López-Moreno, J.I. A multiscalar drought index sensitive to global warming: The standardized precipitation evapotranspiration index. J. Clim. 2010, 23, 1696–1718. [Google Scholar] [CrossRef] [Scilit]
- Pei, W.; Hao, L.; Fu, Q.; Ren, Y.T.; Li, T.X. The standardized precipitation evapotranspiration index based on cumulative effect attenuation. J. Hydrol. 2024, 635, 131148. [Google Scholar] [CrossRef] [Scilit]
- Wang, Q.; Wu, J.; Lei, T.; He, B.; Wu, Z.; Liu, M.; Mo, X.; Geng, G.; Li, X.; Zhou, H.; et al. Temporal-spatial characteristics of severe drought events and their impact on agriculture on a global scale. Quat. Int. 2014, 349, 10–21. [Google Scholar] [CrossRef] [Scilit]
- Hernandez, E.A.; Uddameri, V. Standardized precipitation evaporation index (SPEI)-based drought assessment in semi-arid south Texas. Environ. Earth Sci. 2014, 71, 2491–2501. [Google Scholar] [CrossRef] [Scilit]
- Gumus, V. Evaluating the effect of the SPI and SPEI methods on drought monitoring over Turkey. J.Hydrol. 2023, 626, 130386. [Google Scholar] [CrossRef] [Scilit]
- Mwinjuma, M.; Wang, R.; Mtupili, M.; Twaha, M. Comparisons of SPI and SPEI in capturing drought dynamics: A Global assessment across arid and humid regions. Atmos. Res. 2025, 329, 108475. [Google Scholar] [CrossRef] [Scilit]
- Tiwari, A.; Chakravorthy, S.; Nanjundan, P.; Ranjan Kumar, R.; Karmakar, A.; Bishoyi Ratna, S. Multi-dimensional changes in drought patterns across India. Clim. Change 2026, 179, 11. [Google Scholar] [CrossRef] [Scilit]
- Zhu, Y.Y.; Pan, P.; Kuang, X.Y. Changing Characteristics and Causes Analysis of Drought Disaster in Henan Province. Chin. J. Agrometeorol. 2011, 32, 311–316. [Google Scholar]
- Zhang, C.G.; Xing, W.; Niu, X.Y. emporal and Spatial Changes of Drought Disasters in Henan Province in Ming and Qing Dynasties. J. Xinyang Norm. Univ. 2021, 34, 88–92. [Google Scholar]
- Shi, B.; Zhu, X.; Hu, Y.; Yang, Y. Drought characteristics of Henan province in 1961-2013 based on Standardized Precipitation Evapotranspiration Index. J. Geogr. Sci. 2017, 27, 311–325. [Google Scholar] [CrossRef] [Scilit]
- Xiao, T.K.; Peng, F.C.; Li, C.F.; Zhou, B.F.; Sheng, F.K.; Zhang, H.B. On the droughts occurring in historical period of honan province. Sci. Geogr. Sin. 1964, 30, 259–276. [Google Scholar]
- Hao, X.P.; Zhang, Z.W.; Ma, J.Q.; Liu, X.J.; Peng, G.H. Space-time Evolution Rule Analysis of Drought in Henan Province Based on Standardized Precipitation Index. Water Resour. Power 2013, 31, 4–7. [Google Scholar]
- Lu, J.Q.; Gan, R.; Yang, F. Drought Characteristics and Its Correlation with Circulation Index in Henan Province Based on SPEI Index. China Rural Water Hydropower 2022, 4, 17–24. [Google Scholar]
- Shi, B.; Zhu, X.; Hu, Y.; Yang, Y. Spatial and temporal variations of drought in Henan province over a 53-year period based on standardized precipitation evapotranspiration index. Geogr. Res. 2015, 34, 1547–1558. [Google Scholar]
- Chen, S.D.; Zhang, L.P.; Tang, R.X.; Yang, K.; Huang, Y.Q. Analysis on temporal and spatial variation of drought in Henan Province based on SPEI and TVDI. Trans. Chin. Soc. Agric. Eng. 2017, 33, 126–132. [Google Scholar]
- Shang, D.Y.; Zhang, Z.H.; Yue, Y.; Hu, C.D.; Wang, Q. Drought characteristics analysis of Henan Province based on standardized precipitation index in recent 45 years. ARAA 2021, 39, 162–170. [Google Scholar]
- Li, L.S. Analysis and Prediction of Spatiotemporal Evolution of Drought in Henan Province Based on Gray Modeling. Master’s Thesis, North China University of Water Resources and Electric Power, Zhengzhou, China, 2024. [Google Scholar]
- Chang, L.L. Analysis of Spatial-Temporal Characteristics of Drought in Henan Province Based on TVDI and SPCI. GSIT 2024, 47, 43–47. [Google Scholar]
- Thornthwaite, C.W. An approach toward a rational classification of climate. Geogr. Rev. 1948, 38, 55–94. [Google Scholar] [CrossRef] [Scilit]
- GB/T20481-2017; Grades of Meteorological Drought. Standardization Administration of the People’s Pepublic of China: Beijing, China, 2017. Available online: https://www.cma.gov.cn/zfxxgk/gknr/flfgbz/bz/202209/t20220921_5098974.html (accessed on 21 September 2022).
- Wei, F.Y. Modern Climatic Statistical Diagnosis and Prediction Technology; China Meteorological Press: Beijing, China, 2007. [Google Scholar]
- Mann, H.B. Nonparametric tests against trend. Econometrica 1945, 13, 245–259. [Google Scholar] [CrossRef] [Scilit]
- Kendall, M.G. Rank Correlation Methods, 4th ed.; Griffin: London, UK, 1975. [Google Scholar]
- Hurst, H.E. Long–term storage capacity of reservoirs. Trans. Am. Soc. Civ. Eng. 1951, 116, 770–799. [Google Scholar] [CrossRef] [Scilit]
- Mandelbrot, B.B.; Wallis, J.R. Robustness of the rescaled range R/S in the measurement of noncyclic long run statistical dependence. Water Resour. Res. 1969, 5, 967–988. [Google Scholar] [CrossRef] [Scilit]
- Luo, D.; Li, L. Spatiotemporal evolution analysis and prediction of drought in Henan Province based on standardized precipitation evapotranspiration index. Water Supply 2023, 23, 410–427. [Google Scholar] [CrossRef] [Scilit]

Disclaimer/Publisher’s Note: The statements, opinions and data contained in all publications are solely those of the individual author(s) and contributor(s) and not of MDPI and/or the editor(s). MDPI and/or the editor(s) disclaim responsibility for any injury to people or property resulting from any ideas, methods, instructions or products referred to in the content. |
© 2026 by the authors. Licensee MDPI, Basel, Switzerland. This article is an open access article distributed under the terms and conditions of the Creative Commons Attribution (CC BY) license.