


Abstract
This study examined how policy synergy in cleaner production regulation affects firms’ capacity utilization in China. Using firm-level panel data, this study empirically examined the impact of policy synergy in cleaner production regulation—operationalized through the coordination between the incentive and constraint instruments—on the enterprises’ capacity utilization (CU). The results showed that higher levels of policy synergy significantly enhanced the capacity utilization, with stronger effects observed in state-owned enterprises, firms in competitive industries, high-R&D investment firms, and regions with lower public environmental attention. The mechanism analysis indicated that policy synergy improved capacity utilization primarily by enhancing the resource allocation efficiency. Further, the analyst attention positively moderated this relationship, amplifying the effect of coordinated policy instruments. Overall, this study clarifies the mechanisms and boundary conditions through which the policy synergy under a dual-incentive governance framework affects the firms’ capacity utilization, thereby offering theoretical insights into policy coordination and practical guidance for the design of cleaner production regulation.
1. Introduction
Over the past few decades, rapid industrialization has intensified the tension between the economic expansion and environmental capacity in both emerging and developed economies. Extensive production patterns characterized by high energy consumption, intensive resource use, and rising pollution emissions have increasingly constrained the sustainable industrial development. A large body of literature has examined how environmental regulations affect firms’ environmental performance and economic outcomes, yet the conclusions remain contested. While some studies suggest that well-designed regulation can stimulate innovation and enhance competitiveness [1,2], others have documented compliance costs, productivity losses, or defensive production responses under the regulatory pressure [3,4]. These mixed findings indicate that firms’ responses to environmental regulation are multifaceted and depend not only on regulatory stringency but also on how the policy instruments shape firms’ production decisions.
Within this broader debate, the pollution-oriented environmental regulation has attracted growing scholarly attention as a governance approach that directly intervenes in firms’ production processes. Pollution control policies regulate resource use, production technologies, and operational behavior at the firm level. As a result, such policies are closely linked to the firms’ short-run production choices, including output adjustment, process reorganization, and capacity deployment [5,6]. Pollution-oriented regulation directly constrains or incentivizes production activities. This makes it an ideal context for studying how environmental governance reshapes firms’ production decisions. Specifically, this study examined changes in capacity utilization—the extent to which firms realize potential output from existing inputs. This reshaping occurs primarily by influencing firms’ incentives to optimize processes and allocate resources more efficiently, rather than through technological innovation or long-term productivity gains [7].
Despite extensive research on environmental regulation, the existing studies predominantly focus on technological innovation, emissions reduction, or total factor productivity. Comparatively little attention has been paid to firms’ short- to medium-term production responses under the regulatory pressure, particularly how they adjust output relative to existing production capacity when multiple policy instruments operate simultaneously [8]. Capacity utilization captures the extent to which firms realize potential output from given inputs and therefore reflects production deployment decisions rather than technological efficiency improvements, allowing us to distinguish the compliance-induced output contraction from genuine efficiency changes [9]. From a decision-making perspective, environmental regulation confronts firms with a fundamental trade-off between environmental compliance and production efficiency. When policy signals are ambiguous or poorly coordinated, firms may adopt conservative strategies—such as output reduction or idle capacity—to mitigate the regulatory risk. In contrast, coherent and well-coordinated policy instruments may stabilize expectations, align environmental objectives with production incentives, and encourage firms to use existing capacity more effectively. However, the mechanism by which such coordination mechanisms operate in practice remains insufficiently understood.
China offers a salient empirical setting for examining these issues. Over four decades of rapid industrialization, China’s economic growth has increasingly encountered ecological and environmental constraints, making the tension between pollution control and industrial performance particularly pronounced. In response, China has progressively strengthened the pollution-oriented environmental regulation, with cleaner production emerging as a central policy instrument. Clean production standards have been incorporated into the regulatory framework, marking a shift from the end-of-pipe treatment toward front-end prevention. According to the Law of the People’s Republic of China on Promoting Cleaner Production (revised in 2012), clean production aimed to conserve energy, reduce resource consumption, lower pollution emissions, and enhance production efficiency [10]. This regulatory orientation has been further reinforced by national policy initiatives, including the “14th Five-Year Plan for the Promotion of Clean Production” issued in 2021 [11]. Importantly, China’s cleaner production regulation relies on a combination of the reward-based instruments—such as subsidies, tax incentives, and green credit—and penalty-based instruments, including fines, production suspension orders, and market access restrictions. The joint application of these tools provides a unique institutional environment for examining how the coordinated incentive–constraint mechanisms influence firms’ production behavior.
Against this background, this study investigated whether and how the reward–penalty policy synergy in cleaner production regulation affects firms’ capacity utilization. We argued that the interaction between rewards and penalties constitutes a governance structure that shapes firms’ expectations and production strategies. When the reward and penalty instruments are well coordinated, firms may be more likely to reorganize production processes and improve capacity utilization rather than resorting to defensive output contraction. This study addressed two research questions: Does reward–penalty policy synergy in cleaner production regulation significantly affect firms’ capacity utilization? Through what mechanisms does policy synergy reshape firms’ production decisions under environmental regulation? By focusing on capacity utilization as a key production outcome, this paper contributes to the literature in two ways. First, it extends the research on environmental regulation by highlighting firms’ production-scale responses, complementing the existing studies centered on innovation and productivity. Second, it advances the policy synergy literature by examining how the coordinated incentive–constraint instruments influence production decisions rather than solely environmental performance. The remainder of the paper proceeds as follows. Section 2 provides literature review. Section 3 provides theoretical analysis and research hypotheses. Section 4 describes the research design and data. Section 5 presents the empirical results. Section 6 provides further analyses, including heterogeneity and mechanism tests. Section 7 concludes with discussion and conclusion.
2. Literature Review
2.1. Divergent Effects of Environmental Regulation on Firm Behavior: Evidence from Cleaner Production
The existing literature exhibits conflicting findings regarding the policy effects of cleaner production regulations. Most studies have predominantly focused on pollution reduction, technological innovation, and production efficiency improvements. Some research has suggested that cleaner production policies can have a positive environmental and economic impact, confirming their role in improving resource utilization efficiency [12], energy conservation [13], total factor productivity [14], and enterprise energy efficiency [15], as well as driving green technological progress [16]. However, other studies have indicated that the actual impact of cleaner production regulations has been limited, raising questions about their effectiveness. Li et al. [17] argued that cleaner production regulations would raise total pollution emissions while having little effect on improving firms’ environmental conduct. Some researchers have argued that in reaction to environmental rules requiring cleaner output, businesses were more likely to select gradual technological transformation pathways such as installing pollution control equipment, accelerating capital renewal, or modifying energy structure [18]. Furthermore, Xu et al. [19] found that heterogeneous regulatory content in cleaner production policies would give rise to the ruler effect. Beyond productivity and innovation outcomes, these heterogeneous firm responses to policy also suggest potential adjustments in production and capacity utilization decisions. Faced with cleaner production mandates, firms may respond not only by upgrading technology, but also by scaling down production, idling excess capacity, or delaying capacity expansion, thereby influencing capacity utilization dynamics.
This discrepancy indicates that the effectiveness of cleaner production regulations remains an open empirical question, calling for more in-depth exploration of the underlying mechanisms. In this setting, focusing on a single aspect of the policy may not be sufficient to disclose its underlying mechanism. The majority of existing research on cleaner production emphasizes the mandatory binding effect while overlooking the incentive effect of cleaner production policies [20,21,22]. In fact, cleaner production strategies include incentives and limits. The incentive effect of these policies are of equal importance. The clean production policy encourages firms to adopt clean manufacturing through multifaceted incentive systems. On the one hand, the system of commendation and prizes is designed to give honorary incentives to help firms improve their reputation and create prospective market prospects. On the other hand, significant economic incentives are created through measures such as financial subsidies, special funds for small- and medium-sized businesses, and tax breaks to effectively ease companies’ resource and cost restrictions in the implementation of cleaner manufacturing. Overall, the system design integrates both reputational and economic incentive functions, which jointly enhance firms’ motivation to adopt cleaner production through reputational effects and resource assurance. Such incentive-constraint arrangements not only influence firms’ incentives for cleaner production, but also reshape their operational decisions regarding whether to fully utilize existing capacity, upgrade production facilities, or temporarily reduce output under regulatory pressure. Given that the clean production policy has both incentive and constraint characteristics, it is necessary to examine it from a policy coordination standpoint, focusing on the coupling and synergistic effect of the policy synergy mechanism, in order to better understand its impact on firms’ production behavior and performance outcomes, including CU and capacity utilization.
2.2. Policy Synergy and the Coordination of Incentive–Constraint Instruments
In recent years, policy synergy has emerged as a frontier topic in the literature [23,24,25], encompassing horizontal interdepartmental coordination [26], intergovernmental alignment [27], temporal dynamics [28], and other multidimensional dimensions of policy interaction. When assessing the impacts of clean production regulations, it is essential to account for the synergistic interaction between incentive-based and constraint-based policy instruments. The existing research has documented that synergies among policy instruments shape policy effectiveness [29,30,31]. However, the effects of policy synergy may vary across different firm-level outcomes. In particular, well-aligned incentive- and constraint-based instruments may not only encourage efficiency-enhancing adjustments, but also trigger conservative production strategies—such as output curtailment or capacity idling—when regulatory pressure exceeds firms’ adjustment capacity. Some studies have highlighted the incentive logic of combining policy rigidity and flexibility, implying that the reward and penalty mechanisms can work together to improve the environmental governance outcomes [32].
2.3. Research Gaps
Taken together, the existing literature has extensively examined the effects of cleaner production regulation and policy synergy on firm behavior. However, the empirical findings remain inconclusive: some studies document that cleaner production regulation promotes firm productivity and performance [12,13,14,15,16], while others reveal a significantly negative or inhibitory effect [17,18]. Against this background, it is particularly necessary to revisit the impact of cleaner production policies from the perspective of policy synergy. By focusing on the synergistic features of regulatory instruments, this study can provide a more consistent explanation for the heterogeneous effects of environmental regulation, thus deepening the understanding of the underlying mechanisms of cleaner production policies.
Currently, academic research on policy synergy has been extensively discussed from multiple mechanisms and perspectives. Specifically, it includes: synergy at the policy instrument level [30,31], where existing studies mainly focus on the combination and complementary effects of different types of policy instruments, exploring how to improve policy implementation efficiency through instrument synergy; policy synergy between governments at different levels [24,27], which focuses on analyzing the policy connection, division of powers and responsibilities, and collaborative promotion paths between the central and local governments, as well as between local governments at all levels; and policy synergy between governments in different regions [26], whose core concern is the coordination and linkage of policies between regions to address issues such as unbalanced regional development and policy fragmentation.
However, on the whole, research on the synergy of dual incentive mechanisms (reward and penalty) remains relatively scarce, especially the lack of empirical studies exploring how reward–penalty synergy affects firms’ production behavior from the perspective of reward–penalty coordination. Although policy synergy has been widely discussed, empirical evidence on how coordinated reward–penalty mechanisms shape firms’ production behavior remains scarce.
Given that cleaner production regulation inherently combines incentive and constraint instruments, examining it from a policy synergy perspective is necessary for a more comprehensive understanding of its production-related effects. In particular, capacity utilization provides a useful lens through which to observe firms’ revealed production decisions when balancing environmental compliance and operational efficiency. Therefore, this study aims to bridge these gaps by investigating how reward–penalty policy synergy influences firm production performance, through the channel of capacity utilization decisions, and by unveiling the underlying resource allocation mechanism.
3. Theoretical Analysis and Research Hypotheses
3.1. Policy Synergy and Enterprises’ CU
Prior research on environmental policy instruments emphasizes that combinations of regulatory “sticks” and “carrots” can influence firms’ behavioral responses and performance outcomes [33]. From a decision-making perspective, enterprises engage in dynamic trade-offs between environmental compliance and production-oriented efficiency under regulatory constraints, weighing compliance costs, potential benefits, and policy expectations.
When the reward and penalty signals are poorly coordinated, the clarity of policy signals deteriorates, leading firms to face ambiguity in balancing environmental investment and production decisions. On the one hand, reward-oriented policies require firms to increase upfront expenditures to obtain subsidies or preferential treatment, while penalty-oriented policies impose compliance and governance costs. When the relative strength of rewards and penalties is imbalanced, policy signals become ambiguous, prompting firms to adopt defensive production strategies that prioritize risk avoidance over efficiency enhancement. Such strategies often manifest as delayed capacity adjustment or capacity underutilization, ultimately undermining operational performance. On the other hand, uneven reward and penalty signals increased firms’ uncertainty regarding future regulatory orientation, leading enterprises to prioritize short-term compliance responses rather than long-term production planning. Empirical evidence shows that economic policy uncertainty significantly affects firms’ investment decisions and may induce firms to postpone or reduce investment under uncertainty [34]. Such uncertainty-driven conservatism may translate into lower capacity utilization.
In contrast, a higher degree of policy synergy integrates negative constraints with positive incentives, thereby reshaping firms’ environmental–production trade-offs. Penalty mechanisms clearly define compliance boundaries and deter opportunistic behavior, while reward mechanisms provide forward-looking guidance that reduces uncertainty surrounding environmental investment. Together, the coordinated reward and penalty signals encourage firms to shift from defensive, compliance-oriented strategies toward proactive, efficiency-enhancing production decisions. By stabilizing institutional expectations and aligning environmental objectives with production incentives, policy synergy promotes cleaner production practices and the fuller utilization of production capacity, resources, and energy, thereby enhancing firms’ capacity utilization and overall production efficiency. Albrizio et al. provide cross-industry evidence that well-designed environmental policies are not necessarily detrimental to productivity growth and may even stimulate productivity improvements [35]. Guo and Yuan further show that different types of environmental regulations exert heterogeneous effects on energy efficiency [36], suggesting that regulatory design matters for firms’ resource utilization outcomes.
Importantly, capacity utilization captures firms’ revealed production decisions under environmental regulation, reflecting whether enterprises respond to regulatory pressure by passively constraining output and delaying capacity adjustment or by proactively reorganizing production to improve efficiency and fully exploit the existing capacity. Prior research indicates that technological and regulatory adjustments can influence firms’ overcapacity and capacity utilization dynamics [37]. Thus, if policy synergy reshapes firms’ environmental–production trade-offs and encourages proactive production strategies, it should be directly reflected in higher capacity utilization. Accordingly, we propose the following hypothesis:
H1:
Policy synergy has a significant positive impact on enterprises’ capacity utilization.
3.2. The Mechanism of Resource Allocation Efficiency
Policy synergy can improve firms’ resource allocation efficiency, thereby shaping their capacity utilization decisions. Efficient resource allocation enhances production performance by reducing waste and redundancy and improving factor utilization efficiency. Empirical evidence shows that resource misallocation significantly reduces total factor productivity and energy efficiency, whereas improved allocation efficiency enhances firm performance [38,39]. This mechanism primarily operates through a dual incentive structure combining rewards and penalties, whereas either instrument alone is often insufficient to achieve the intended effect. If penalties are emphasized while rewards are absent, firms may reduce productive activities after exiting inefficient sectors due to limited incentives for transformation, thereby leading to capacity idleness. Conversely, if rewards are emphasized while penalties are weak, firms may engage in opportunistic behavior to capture subsidies while retaining inefficient capacity, resulting in resource misallocation. In contrast, a high level of policy synergy can provide an incentive effect by combining negative limitations and positive direction. Penalty defines the bounds of resource flow and prohibits the retention of inefficient factors. For example, Zhang et al. find that new energy policies significantly promote green technological innovation and reallocation toward cleaner production, indicating that regulatory constraints can reshape firms’ resource allocation decisions [40]. Rewards indicate the direction of resource flow and minimize the risk of green investment. Prior research finds that cleaner production practices can promote inner resource allocation optimization, which in turn strengthens incentives for green investment and resource reallocation [15].
When there is a high level of policy synergy, enterprises can more accurately identify the policy guidance and risk expectations, make reasonable resource allocation arrangements, optimize the use of production factors, and reduce the resource waste and repeated investment. Enterprise resource allocation decisions are subject to both bottom-line constraints and goal incentives in order to avoid capacity idleness and the misallocation of resource elements while also promoting the overall enterprise operational efficiency [41].
Given that prior studies demonstrate that resource misallocation leads to productivity losses and inefficient capacity use, improving allocation efficiency should directly affect firms’ production decisions and capacity utilization. Taken together, these arguments suggest that resource allocation efficiency serves as an important mechanism through which policy synergy affects firms’ capacity utilization. Therefore, we propose Hypothesis 2.
H2:
Policy synergy can improve enterprises’ capacity utilization via the resource allocation impact.
3.3. The Moderating Role of Analyst Attention
From the perspective of multi-actor supervision, the effectiveness of coordinated policy signals depends on the strength of external monitoring faced by firms. Analyst attention represents an important source of market-based supervision that can discipline firms’ responses to policy signals.
According to agency theory, separation of ownership and control gives rise to agency costs and managerial opportunism, which require external monitoring mechanisms to mitigate inefficiencies [42]. Empirical evidence further supports the monitoring role of analysts. Yu finds that firms followed by more analysts engage in significantly less earnings management, suggesting that analyst coverage serves as an effective external governance mechanism that constrains managerial discretion [43]. In addition, Tang and Huang show that corporate philanthropy is associated with lower analyst forecast error, particularly for firms with higher information exposure, indicating that analyst attention enhances information transparency and market scrutiny [44].
Through continuous earnings forecasts and investment evaluations, analysts expose firms’ production organization and resource allocation decisions to market comparison and accountability, thereby constraining managerial opportunism and operational inertia. Stronger external monitoring increases firms’ incentives to respond proactively to stable and coordinated policy signals and to translate the institutional guidance embedded in policy synergy into concrete adjustments in production organization and capacity allocation, ultimately improving capacity utilization.
In contrast, when analyst attention is low, external monitoring and market discipline are relatively weak, limiting firms’ incentives to adjust production decisions in response to policy synergy. Consequently, the positive effect of policy synergy on enterprises’ capacity utilization is expected to be attenuated. Based on this reasoning, we propose the following hypothesis:
H3:
Analyst attention positively moderates the relationship between policy synergy and enterprises’ capacity utilization, such that the positive effect of policy synergy on capacity utilization is stronger for firms with higher levels of analyst attention.
3.4. Integrated Theoretical Framework
Building on the preceding hypotheses, this study integrates the direct effect, mediating mechanism, and boundary condition into a unified theoretical framework. As illustrated in Figure 1, the framework posits that reward–penalty policy synergy enhances enterprises’ capacity utilization (CU) primarily through improving resource allocation efficiency, and that this effect is further strengthened under higher levels of external monitoring from financial analysts. It provides a systematic lens for understanding how macro-level policy design is translated into micro-level production performance through firms’ internal allocation processes and external governance pressures.
Figure 1.
Theoretical Framework Diagram.
Accordingly, the empirical analysis proceeds in three steps: first, testing the baseline effect of policy synergy on CU; second, examining resource allocation efficiency as a key transmission mechanism; and third, assessing the moderating role of analyst attention. The following section presents the research design and empirical strategy used to operationalize and test this integrated model.
4. Models and Variables
4.1. Sample Selection and Data Sources
This paper’s initial research sample consisted of listed Chinese A-share businesses from 2014 to 2023. The data originated from: (1) The data of listed companies came from CSMAR and WIND databases; (2) the annual report data of relevant listed companies came from the official website of Juchao; (3) the relevant data of provincial-level variables in instrumental variables and control variables came from the National Bureau of Statistics; (4) the policy data were primarily collected from the PKU Law database and supplemented by searches on the relevant official government portals; and (5) PM2.5 data were derived from the China High-Resolution High-Quality Near-Surface Air Pollutant Dataset (CHAP).
According to previous research, this paper processed the data as follows: (1) eliminate companies that appear ST/PT; (2) eliminate abnormal data such as asset-liability ratios less than 0 or greater than 1; (3) eliminate data with significant missing values; and (4) subject all continuous variables to 1% tailing processing.
4.2. Introduction to Variables and Descriptive Statistics
1. The dependent variable was enterprises’ capacity utilization (CU). Capacity utilization was commonly used to measure the efficiency with which firms used their existing production factors. Its core idea was to compare a firm’s actual output with its potential maximum output under given resource constraints. In the context of environmental regulation, capacity utilization was particularly suitable for capturing firms’ production responses, as it reflected short- to medium-term adjustments in output and capacity deployment without conflating technological efficiency improvements with compliance-driven production constraints.
Following Du Yong et al. [45] and Li Xuesong et al. [46], this study estimated the firm-level capacity utilization using the stochastic frontier production function approach (SFA). The SFA could effectively separate random statistical noise from structural technical inefficiency, thereby more accurately measuring the gap between a firm’s actual output and its potential maximum output under given inputs. Specifically, using operating income as output, and total assets and the number of employees as capital and labor inputs, we constructed a logarithmic Cobb–Douglas production frontier, assuming that the technical inefficiency term followed a half-normal distribution. Based on the model estimation, the firm-level capacity utilization index was calculated for the subsequent empirical analysis.
2. Explanatory variable: Reward–Penalty Policy Synergy (RPPS). This variable was constructed based on the full set of policy documents issued between 2013 and 2022. We chose 2013 as the starting year for policy observation based on two considerations. First, the institutional foundation was mature. By around 2010, the cleaner production standard system covering major industries was basically established, providing an operational technical prerequisite for the subsequent policy synergy based on unified standards. Second, the policy synergy was strengthened. The 2012 revision of the Law on Promotion of Cleaner Production clarified corporate responsibilities, expanded the scope of mandatory audits, and established assessment and acceptance mechanisms, marking the transition of cleaner production from the standard-setting stage to a stage of strict enforcement and incentivization [10]. Meanwhile, considering the lag in policy signal transmission and firm behavioral adjustment, this study lagged the policy variable by one period in the empirical analysis; thus, the empirical sample period was 2014–2023.
The identification is typically conducted in the following three steps:
The first step is to clarify the concept. The primary independent variable in this study is RPPS, which consists of two fundamental concepts. Policy rewards and penalties refer to the dual incentive attributes of policy rewards and penalties, while synergy denotes the dynamic matching and structural balance of reward and penalty mechanisms. The dual incentive mechanism of policy rewards and penalties does not function in isolation, but rather influences policy outcomes through interactive linkages. Overall, RPPS refers to the dynamic interplay and joint effect of the dual incentive tools of policy incentives and penalties in policy design. The two must form an adaptive equilibrium in terms of incentive impact. If there is an imbalance in which one side is overly strong and the other is overly weak, the equilibrium relationship between the two is disrupted, resulting in a substantial decline in the degree of RPPS. Only when the two achieve effective alignment and coordination in policy design and implementation will they be able to overcome the limitations of a single policy tool’s diminishing marginal effect, form stronger and more stable policy signals, and enhance enterprises’ sensitivity and responsiveness to policy guidance.
The second step is policy coding. Policy documents were coded using content analysis, with reference to signal measurement methods from existing literature and in combination with the characteristics of policy documents. (1) Our collection of provincial policy documents is based on the PKU Law database(beida fabao) [47]. This database is widely recognized as an authoritative electronic resource for Chinese central and local regulations and policies, and its validity as a reliable data source has been widely acknowledged [48]. We searched for policy documents issued by provincial governments between 2013 and 2022 using the specific keyword “cleaner production” in the PKU Law database and on government websites such as the provincial Department of Ecology and Environment and the provincial Department of Industry and Information Technology, yielding a total of 616 documents. Examples of representative policy documents by province are reported in Supplementary Table S1. (2) The creation of the coding table: To quantify the policy signal qualities contained in the policy text, the policy text is rigorously coded using different dimensions of policy characteristics. Appendix A displays the scoring criteria for the policy reward and penalty characteristics derived from a structured coding table. Specifically, this paper uses the clarity of reward measures and the clarity of penalty measures in the policy text as proxies to measure the intensity and interpretability of positive incentives and negative constraints, respectively, and then constructs the RPPS index. Appendix A contains the scoring criteria, which serve as the foundation for further empirical investigation. (3) Conduct a pilot test. First, 50 documents were randomly selected, and coder 1 encoded each document one by one according to the coding table to analyze the operability of the coding table, that is, whether the manual can accurately score, prevent the coding items from being ambiguous, and at the same time ensure that the scoring items can cover all situations, identify omissions and refine the coding scheme, and update and improve the coding table. (4) Text analysis and statistics were conducted on all policies using the coding table. The coding procedure involved two coders, and text analysis was primarily done manually. Coder 1 coded all samples, whereas coder 2 coded the randomly selected sample 154 (about 25% of the proportion) for secondary coding. Cohen’s Kappa coefficient was utilized to determine the consistency of the two coding findings. The Cohen’s Kappa statistic for all indicators above 80%, and coding reliability was strong.
Third step is to determine the measurement approach. When measuring the synergy of reward and penalty policies at the provincial-year level, we use Yang et al.’s coupling coordination degree measurement method [49]. The specific procedure is as follows. First, integrate the policy texts. For various policies in the same province and year, the reward clarity (RC) and penalty clarity (PC) are aggregated to calculate the total reward clarity (TRC) and total penalty clarity (TPC) for that province and year. Second, a standardization procedure was used to construct comparable reward and penalty indicators. Specifically, the total reward clarity and total penalty clarity scores were normalized to the [0, 1] interval using a pooled min–max standardization across the full sample of province–year observations. This approach helps mitigate scale differences arising from the accumulation of policy clauses while preserving both cross-sectional and temporal variation in policy signals. Finally, the RPPS score is derived by creating indications in three components: The first component is to compute the coupling degree between policy rewards and penalties, using the calculation procedure stated in Formula (1):
In the formula, is the standardized reward index, is the standardized penalty index, and a minimum value (1 × 10⁻⁶) is added to prevent the denominator from becoming zero.
Second, calculate the comprehensive evaluation index , using Formula (2):
According to Lu et al. [29], equivalent weights were utilized to combine standardized reward and penalty intensities while investigating the synergy between two types of policies.
Third, calculate the , which is a comprehensive measure of synergy. The computation formula is given below (3):
This indicator’s value range is the interval [0, 1]. The variable definition of RPPS is presented in Table 1 below.
Table 1.
The variable definition of RPPS.
3. Control variables [50,51]. Control variables include those at the enterprise, industry, and province levels. Table 2 displays the definitions and measurements of variables used in this paper. Table 3 shows descriptive statistics.
Table 2.
Definition and Measurement of Main Variables.
Table 3.
Descriptive Statistics.
4.3. Model Setting
The benchmark regression model developed in this paper is as follows:
where represents the capacity utilization of the i firm in t year, denotes the one-year lagged level of RPPS in province j, The lagged specification reflects the fact that policy signals require time to be perceived and translated into firms’ operational adjustments, and helps mitigate potential reverse causality. represents a series of control variables, is a random error term, and represents the time fixed effect and the enterprise fixed effect. β is the main parameter to be estimated. All regressions include firm and year fixed effects, and standard errors are clustered at the enterprise level.
5. Empirical Analysis Results
5.1. Benchmark Regression Results
Table 4 reports the regression results based on the full sample, with all specifications controlling for enterprise and year fixed effects. Column (1) presents the baseline results, showing that the estimated coefficient of RPPS was significantly positive at the 1% level. According to the estimates in Column (1), a one-unit increase in RPPS increased capacity utilization by 0.30 percentage points.
Table 4.
Benchmark Regression Results and Robustness Test Results.
The findings highlight the impact of RPPS on enterprises’ capacity utilization. In the context of cleaner production regulation, when RPPS was low, firms tended to face operational decision-making dilemmas caused by an imbalance between incentives and constraints. On the one hand, the short-term cost pressure induced by cleaner production investment lacked effective compensation, while policy rewards were insufficient in terms of timeliness and relevance; on the other hand, the deterrent effect and coverage of penalty enforcement were limited, making it difficult to form stable and credible constraints. As a result, enterprises were more likely to adopt conservative production strategies and tolerate idle capacity, rather than actively adjusting production intensity or improving the utilization of existing production facilities. Policy synergy effectively alleviated this problem by establishing a balanced incentive–constraint mechanism. Under a governance structure with coordinated rewards and penalties, firms were encouraged to actively adjust and optimize production practices, make fuller use of existing capacity, and reduce idle resources, thereby improving a positive impact on enterprises’ capacity utilization and operational efficiency.
5.2. Robustness Test
The robustness test is primarily carried out in three areas: high-dimensional fixed effect, decreasing the sample time window, and overcoming the endogenous problem.
1. High-dimensional fixed effects. The time-enterprise double fixed effect is replaced by a triple fixed effect based on industry. According to the results in model (2) of Table 4, the estimated coefficients of RPPS and CU of firms are favorably significant at the 1% level, and the regression results are strong.
2. Excluding the influence of National Ecological Civilization Pilot Zones. Although the benchmark regression has confirmed the positive effect of RPPS based on the national sample, considering that the four National Ecological Civilization Pilot Zones—Fujian, Jiangxi, Guizhou, and Hainan—enjoy special authority to pilot new policies and initiatives, their policy implementation modes and intensities may systematically differ from ordinary provinces. To test whether the core conclusion relies excessively on these special samples and to ensure the general applicability of the research findings, this section performs a regression after excluding the samples from the aforementioned pilot zones. The results (shown in model (1) of Table 5) indicate that after excluding the pilot zones, the coefficient of the core explanatory variable RPPS remains significantly positive at the 5% level. The decrease in the coefficient value may precisely reflect the larger marginal effect possessed by pilot zones due to stronger policy execution capabilities. This test fully demonstrates that the promoting effect of RPPS on capacity utilization revealed by the benchmark regression is not driven by a few special policy regions, and the conclusion possesses robust explanatory power for the vast majority of ordinary provinces.
Table 5.
Robustness Test: Controlling for Other Policies.
3. Controlling for the concurrent influence of Central Environmental Protection Inspections. As an authoritative, exogenous, and mandatory enforcement action, the stationing of Central Environmental Protection Inspections may generate independent and significant short-term shocks to firms’ production decisions, thereby confounding the effects with the gradually internalized RPPS of local governments. To control for this potential interference, this paper constructs a dummy variable for Central Environmental Protection Inspections; if an inspection team was stationed in a province in a given year, the value is 1, otherwise it is 0, and this is included in the benchmark regression model. The regression results (shown in model (2) of Table 5) indicate that after controlling for this high-intensity, short-pulse policy shock, the coefficient of the core explanatory variable RPPS remains significantly positive at the 5% level. This indicates that the policy synergy effect identified in this paper is not driven by campaign-style enforcement, but reflects a governance influence mechanism with more sustainable and institutionalized characteristics, thereby enhancing the robustness and causal explanatory power of the research conclusions.
4. Endogeneity test for instrumental variables
Following the study by Cheng et al. [52], this paper selects terrain undulation degree as an instrumental variable for testing. Its validity is as follows: On the one hand, the instrumental variable is theoretically correlated with the endogenous variable RPPS. A lower terrain undulation degree (gentler terrain) usually implies better transportation and industrial foundations, which enhances the ability and willingness of local governments to implement policies such as environmental protection. At the same time, the national environmental protection word frequency measures the annual exogenous shock of the central government’s emphasis on environmental protection, which directly drives changes in the intensity of local policy synergy, satisfying the relevance requirement. On the other hand, as a long-term geographical endowment, terrain undulation degree generally does not directly affect capacity utilization, satisfying the exogeneity requirement. Furthermore, since terrain undulation degree is a time-invariant variable, this paper multiplies the terrain undulation degree by the frequency of words related to environmental protection in the annual Report on the Work of the Government to obtain the “Terrain Undulation Degree × National Environmental Protection Word Frequency” instrumental variable, converting it into a time-varying variable.
As presented in Table 6, The first-stage regression results show a significantly negative relationship between the instrumental variable and the endogenous explanatory variable, indicating strong instrument relevance. In the under-identification test, the Kleibergen–Paap rk LM statistic is 120.817 (p = 0.0000), which significantly rejects the null hypothesis of under-identification and suggests that the model is properly identified. In the weak instrument test, the Kleibergen–Paap rk Wald F statistic is 260.859, which is well above the Stock–Yogo critical value of 16.38 for a 10% maximal IV bias. This result indicates that weak instrument concerns are unlikely. The second-stage estimation results show that RPPS has a positive and statistically significant effect on capacity utilization at the 10% level. It provides further support for the main hypothesis of this study.
Table 6.
Instrumental Variable Test.
6. Further Analysis
6.1. Heterogeneity Analysis
6.1.1. Heterogeneity by Ownership Type
This article classifies the sample into state-owned enterprises and non-state-owned enterprises. Table 7 presents the estimation results in Columns (1) and (2). Column (1) refers to the sample of non-state-owned enterprises, while Column (2) presents the results for state-owned enterprises. The significantly positive effect of RPPS on enterprises’ capacity utilization is found only for state-owned firms, while the effect is not statistically significant for non-state-owned firms.
Table 7.
Results of heterogeneity test by Ownership Type and Industry Characteristics.
This heterogeneity suggests the comparative advantages of state-owned enterprises in reacting to policy signals and converting policy arrangements into operational adjustments. Specifically, state-owned enterprises generally exhibit higher policy awareness and a stronger sense of responsibility within the institutional framework, and their operational objectives extend beyond profit maximization to include broader social responsibilities. In a policy environment with high RPPS, state-owned enterprises are thus more likely to respond promptly to regulatory signals by adjusting production intensity and better utilizing existing capacity, suggesting that policy synergy plays a more important role in enhancing capacity utilization.
In contrast, non-state-owned enterprises not only face more limited resource support, but also face barriers in accessing policy-related resources, which makes it difficult for them to effectively internalize external reward–penalty incentives into internal adjustments in the utilization of production capacity. As a result, RPPS does not exert a significant impact on capacity utilization among non-state-owned enterprises.
6.1.2. Heterogeneity by Industry Characteristics
The industries are classified as competitive or regulated [53], and a heterogeneity test is conducted to assess the impact of RPPS on enterprises’ capacity utilization across different industry types. The results of the heterogeneity analysis are presented in columns (3) and (4) of Table 7, which correspond to the subsamples for competitive and regulated industries, respectively. The results indicate that RPPS has a positive and statistically significant effect on enterprises’ capacity utilization only in competitive industries, while the effect is not significant in regulated industries.
The underlying reason is that competitive industries are characterized by a greater marketization and heightened competition among firms. Strong survival and development pressures compel enterprises to reduce idle capacity, adjust production intensity, and gain competitive advantages by improving the utilization of existing production capacity when facing a policy environment with strong reward–penalty synergy. In this context, the reward mechanism encourages firms to actively undertake green investments and optimize production arrangements, while the penalty mechanism imposes effective constraints on non-compliant behavior. The synergistic effect of rewards and penalties therefore substantially enhances enterprises’ capacity utilization in competitive industries.
By contrast, regulated industries are typically subject to strict administrative controls and high entry barriers, and firms already operate under relatively rigid institutional constraints. In such settings, additional policy synergy exerts only a limited marginal influence on firms’ production decisions, making it difficult to significantly alter production intensity or reduce idle capacity. As a result, policy synergy does not have a statistically significant impact on enterprises’ capacity utilization in regulated industries.
6.1.3. Heterogeneity by R&D Intensity
The benchmark regression results revealed the average impact of RPPS, but its governance effect may vary depending on the firm’s technological foundation. Therefore, this paper measures R&D investment intensity using the ratio of a firm’s annual R&D expenditure to total assets [54], and divides the sample into a high R&D investment group and a low R&D investment group based on the median, performing regression analysis respectively. The results, as shown in Table 8 (Columns 1 and 2), indicate that the positive effect of RPPS is mainly reflected in high R&D investment firms (the coefficient is 0.0021, marginally significant at the 10% level), while no significant impact is observed in low R&D investment firms.
Table 8.
Results of heterogeneity test by R&D Intensity and Regional Characteristics.
These results suggest that the RPPS effect relies heavily on firms’ technology absorption and innovation capabilities. Compared to firms with weaker R&D foundations, high R&D investment firms are more capable of understanding and responding to multi-dimensional policy signals, internalizing environmental and industrial policy requirements into production process optimization and efficiency improvements. This finding suggests that in the process of promoting policy synergy to guide the green transformation of enterprises, implementing supporting policy tools that promote corporate R&D investment and technology diffusion could help amplify the actual governance effect of policy synergy.
6.1.4. Heterogeneity by Regional Characteristics
To characterize Public Attention to Environmental Issues at the regional level, this paper uses the annual search index for the keyword “environmental pollution” as a proxy variable. Search behavior can reflect the intensity of public concern and risk perception regarding environmental issues [55].
The results (as shown in Columns 3 and 4 of Table 8) indicate that the positive effect of RPPS is more significant in regions with lower public environmental attention. This result suggests that there may be a substitution relationship between government-led policy synergy and public supervision at the societal level. In regions with relatively weak public environmental awareness and limited social supervision constraints, policy synergy from the government system constitutes a crucial institutional constraint on corporate environmental behavior, allowing its governance effect to be more fully exerted. By contrast, in regions with higher public environmental attention, firms have long faced multiple pressures from the media, public opinion, and social organizations, and have often already undertaken a certain degree of preemptive adjustment. Consequently, the marginal governance effect brought about by additional RPPS is relatively limited. This finding implies that the design and implementation of environmental policies need to fully consider differences in the regional social supervision foundation: in regions with weak public supervision, strengthening policy synergy at the government level has more critical governance significance, whereas in regions with strong public supervision, it is necessary to focus on the synergy and complementarity mechanisms between formal policy tools and social forces.
6.2. Analysis of the Mechanism of Resource Allocation Efficiency
Basic regression analysis and robustness tests have confirmed that RPPS has a positive influence on the improvement of enterprises’ CU. However, it is worthwhile to investigate further how RPPS promotes the improvement of enterprises’ CU. This work builds on Dell [56] and employs a two-step approach to conduct the mechanism test. The mechanism test is performed utilizing model (5)’s regression model, based on the the benchmark model (4).
M is the mechanism variable, which includes the efficiency of enterprise resource allocation, RPPS is reward-penalty policy synergy, is the random error term, year and stkcd represents the time and enterprise fixed effect, respectively, and the control variable is consistent with the benchmark model (4). Model (5)’s reflects the impact of RPPS on business resource allocation efficiency (RAE). If the is significant, it suggests that there is a mechanism for improving resource allocation efficiency.
RPPS will affect enterprises’ resource allocation efficiency, whereas the RPPS will address the uncertainty surrounding technological advancement investment. The reward measures describe the projected advantages of firms’ environmental protection investments [41], while the penalty measures specify the potential costs of enterprises’ green compliance efforts. The appropriate coordination of regulatory rewards and penalties will allow businesses to limit the input of elements into inefficient, high-pollution production units while shifting resources to efficient and clean production departments [51]. This resource allocation optimization not only lowers compliance costs, but it also encourages the intensive use of production factors, improves the intensive use of existing capital and production factors, allows enterprises to allocate resources more efficiently [14,49], and, ultimately, supports higher capacity utilization [38]. As a result, this paper adopts Shen et al.’s measurement method [57], using the ratio of operational revenue to total assets to represent resource allocation efficiency for mechanism analysis.
According to the regression results of model (1) in Table 9, the estimated coefficient of RPPS is positive and statistically significant at the 1% level, indicating that RPPS improves the efficiency of enterprise resource allocation.
Table 9.
Mechanism and Moderation Test Results.
6.3. Moderating Effect of Analyst Attention
This study uses analyst attention as the moderating variable. Analyst attention is measured by whether financial institutions issue earnings forecasts and investment rating reports for listed firms. Following Yu [43], the number of analysts is defined as the number of institutions track a listed company. According to Model (2) in Table 9, PRS exhibits a significantly positive effect on enterprises’ capacity utilization in the baseline specification without interaction terms. The estimated coefficient is 0.0029 and is significant at the 5% level, indicating that a higher degree of PRS is associated with improved capacity utilization, controlling for other factors.
To examine the moderating role of analyst attention, an interaction term between PRS and analyst attention is introduced in Model (3) of Table 9. The regression results show that the coefficient of the interaction term (PRS × Analyst Attention) is positive and statistically significant at the 10% level. This finding suggests that analyst attention enhances the positive effect of PRS on enterprises’ capacity utilization, thus supporting the proposed moderating mechanism.
The results indicate that RPPS does not exert uniform effects across all firms. Its positive impact is mainly observed in firms with higher levels of analyst attention. When firms have stronger capabilities to identify, analyze, and respond to information, the institutional signals conveyed by RPPS are more likely to be accurately interpreted and effectively absorbed. These signals can then be translated into efficiency improvements in production organization and resource allocation. In contrast, under conditions of lower analyst attention, the effect of RPPS on enterprises’ capacity utilization is relatively limited.
From the perspective of multi-actor supervision, analyst attention strengthens the effect of RPPS on enterprises’ capacity utilization by reinforcing external monitoring and market discipline, thereby increasing firms’ responsiveness to policy signals. As important external monitors in the capital market, analysts’ continuous tracking and evaluation expose firms’ strategic decisions and resource allocation behaviors to market comparison and accountability. This process helps restrain managerial opportunism and inertia in operational adjustments. When analyst attention is high, firms are more inclined to translate the coordinated and stable institutional signals conveyed by RPPS into concrete adjustments in production organization and optimization of capacity allocation, in order to respond to sustained monitoring pressure from the capital market. In contrast, when analyst attention is low, external monitoring constraints are relatively weak, firms’ incentives to respond to RPPS are limited, and its promoting effect on capacity utilization is correspondingly reduced. Therefore, analyst attention, as a multi-actor external monitoring mechanism, plays a significantly positive moderating role in the relationship between RPPS and enterprises’ capacity utilization.
To provide a more intuitive illustration of the moderating role of analyst attention in the relationship between RPPS and enterprises’ capacity utilization, Figure 2 is further plotted. Based on the predicted marginal effects from the regression model, the figure depicts the change in capacity utilization as RPPS increases from a low to a high level under low and high analyst attention conditions, respectively.
Figure 2.
The moderating role of analytical attention on the relationship between RPPS and capacity utilization.
As shown in the figure, under low analyst attention (blue solid line), increases in RPPS lead to only limited improvements in capacity utilization, as indicated by a relatively flat slope. In contrast, under high analyst attention (red dashed line), the positive effect of RPPS on capacity utilization is much stronger, exhibiting a steeper upward trend. This result indicates that analyst attention strengthens the transformation of RPPS into improvements in firms’ production efficiency, making RPPS more likely to result in actual gains in capacity utilization in high-attention environments.
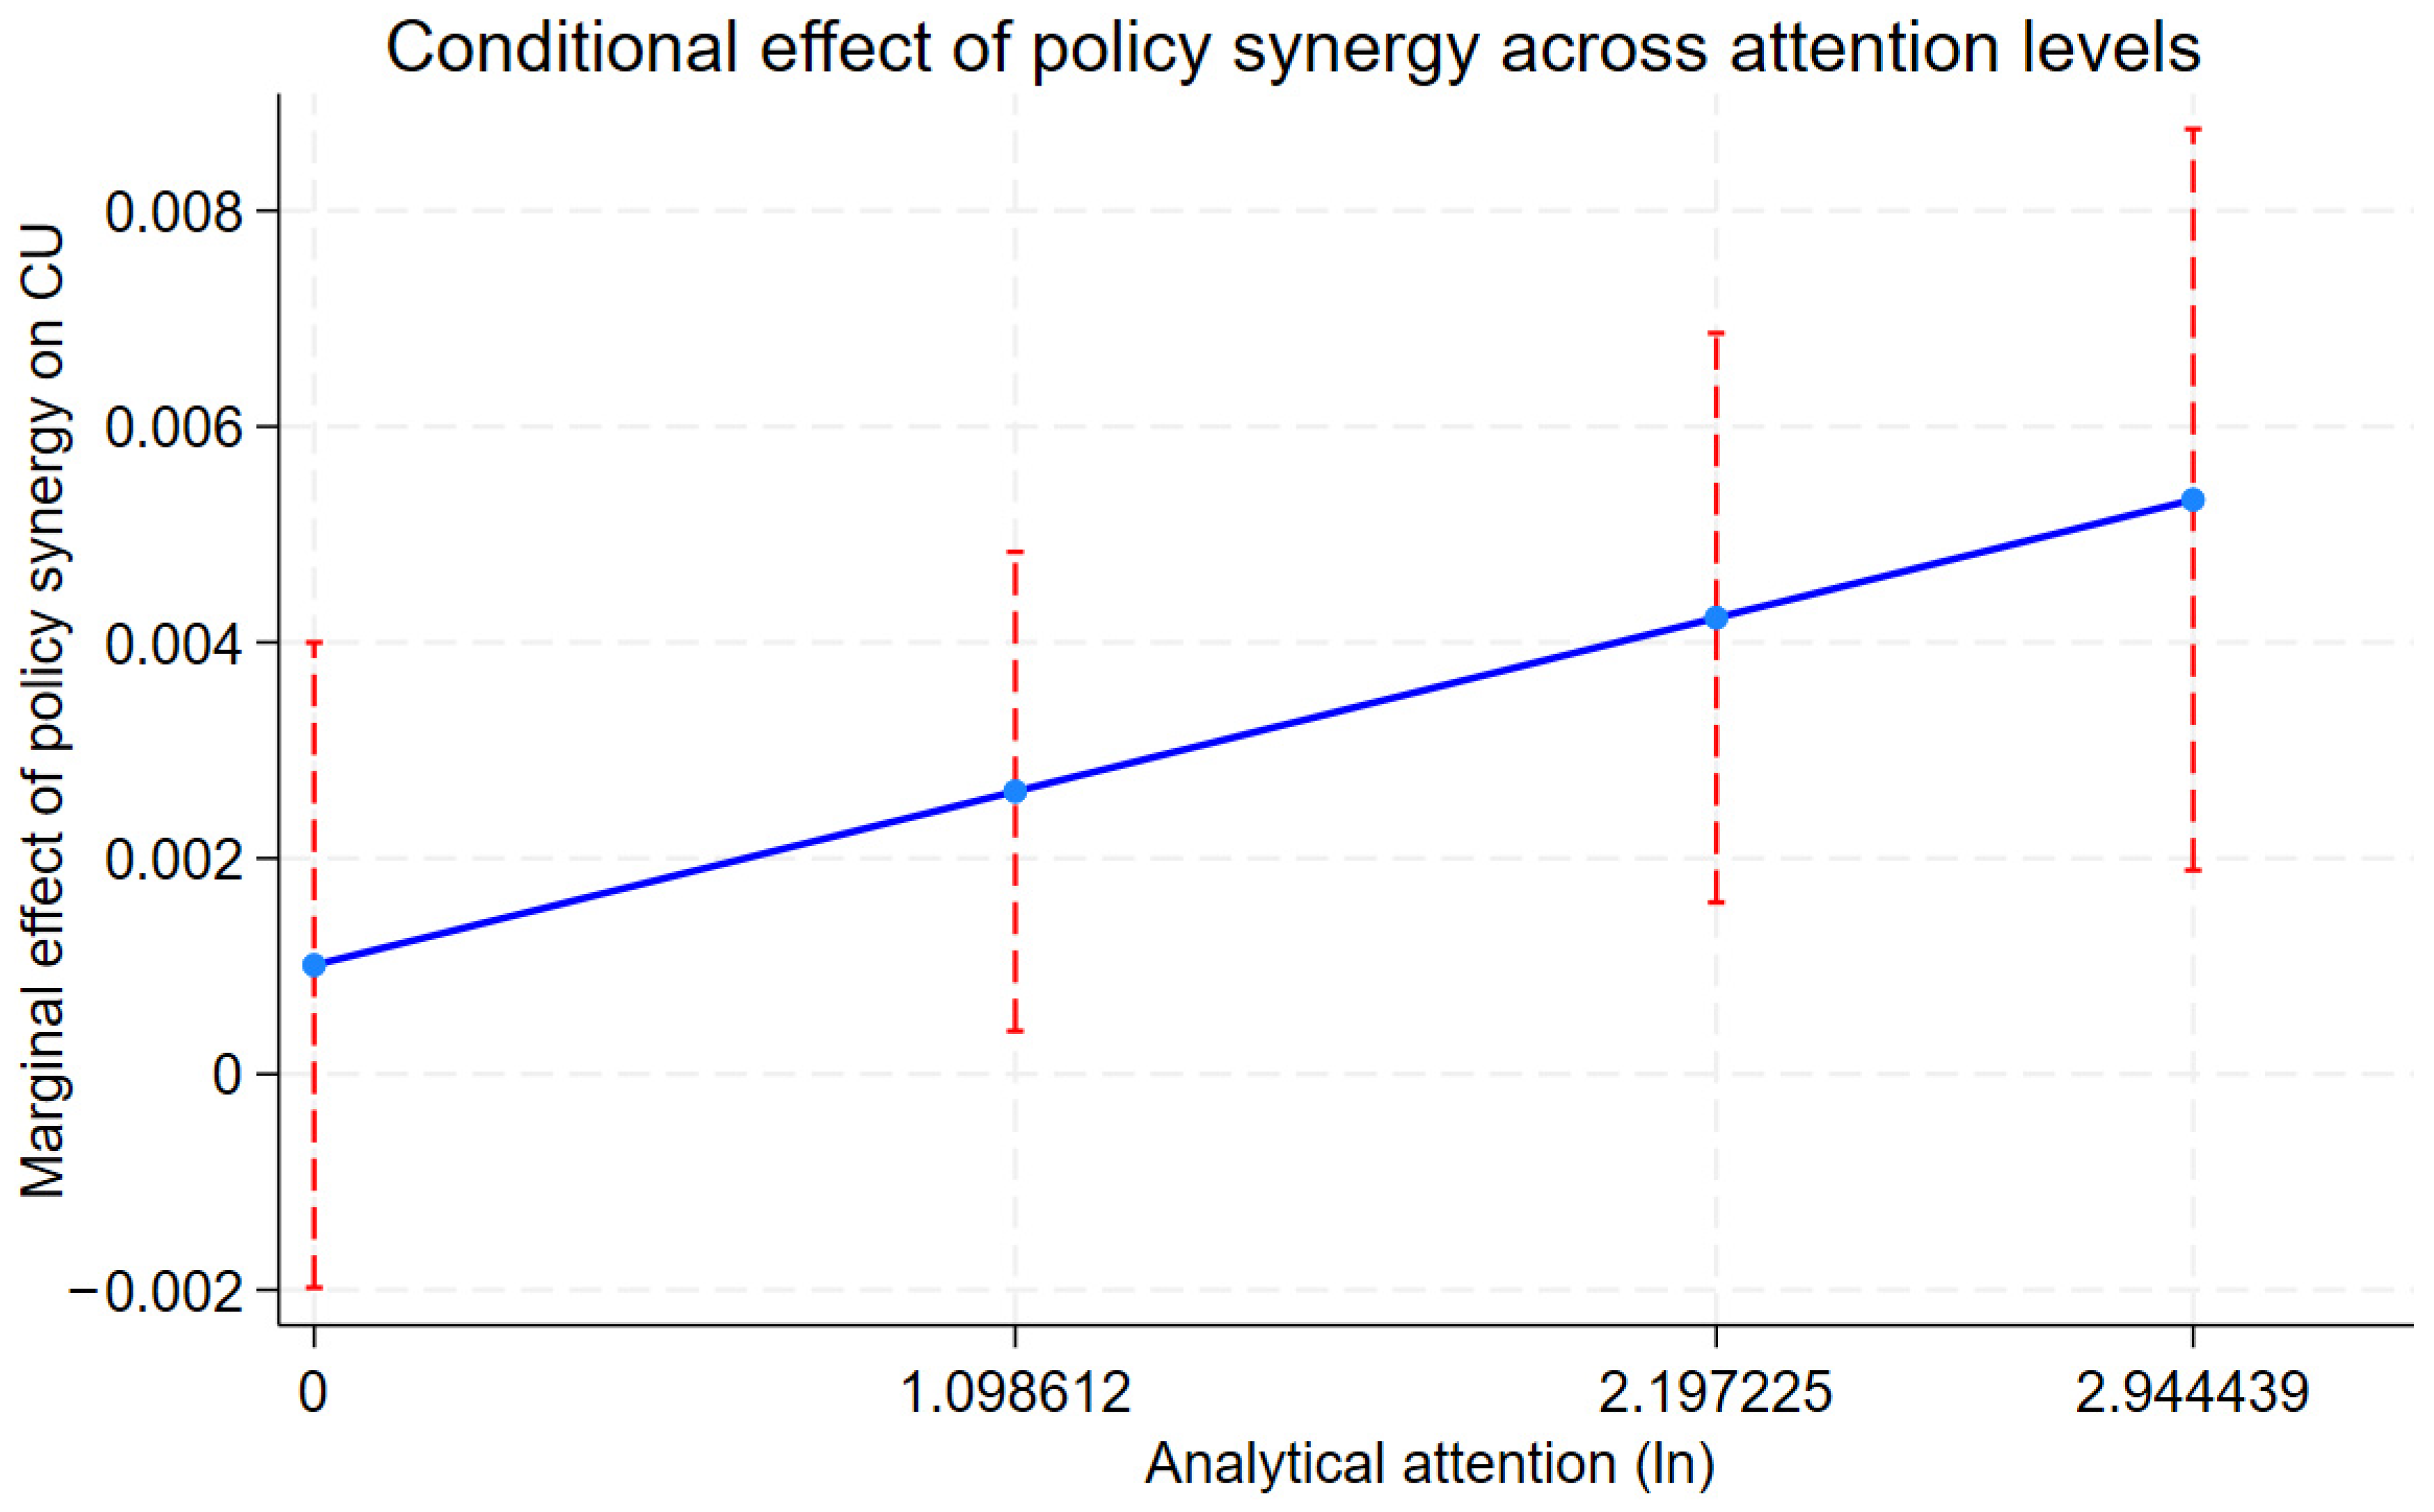
This visualization result is consistent with the significant interaction term identified in the regression analysis, further confirming the positive moderating role of analyst attention in the relationship between RPPS and enterprises’ capacity utilization. Consistent with the interaction plot, the marginal effect of RPPS rises monotonically with analyst attention (see Figure A1 in Appendix B).
7. Discussion
7.1. Discussion of Results
This study examines how reward-penalty policy synergy affects enterprise capacity utilization under China’s cleaner production regulation. The baseline results show that policy synergy exerts a significant positive effect on capacity utilization, which is consistent with our theoretical expectation. Specifically, our study demonstrates that policy synergy significantly enhances enterprises’ capacity utilization (CU). This effect stems from the synergy impact of multiple policy instruments, which not only balance compliance costs with transformation incentives, but also actively steer firms towards optimizing resource allocation in the short to medium term. The mechanism analysis confirms that policy synergy improves CU primarily through enhancing the efficiency of resource allocation, rather than by inducing long-term technological innovation. These findings extend the prior research on firm responses to environmental regulation by highlighting an operational adjustment pathway that complements the traditional focus on innovation.
A large body of earlier work has investigated the economic consequences of environmental policies, yet no consensus has been reached regarding their net impact on enterprises. A strand of literature identifies notable improvements in productivity and operational efficiency following the implementation of environmental regulation, as these studies show that such regulation can improve resource utilization, energy conservation, total factor productivity, energy efficiency, and promote green technological progress [12,13,14,15,16]. By contrast, other studies document adverse or insignificant impacts on firm performance, arguing that cleaner production regulations have limited effectiveness, may even increase total pollution emissions, and only lead to incremental technological transformations rather than substantial improvements [17,18]. These contradictory conclusions are also reflected in typical empirical studies at both international and domestic levels. For instance, Berman and Bui examine stringent air quality regulations in U.S. oil refineries and find that despite substantial compliance costs, environmental regulation is associated with higher total factor productivity rather than efficiency losses, challenging the conventional view that regulation necessarily hinders production performance [5]. In contrast, recent sector-level evidence from China’s manufacturing industry suggests that general environmental regulation tends to exert a negative effect on capacity utilization, mainly by reducing equipment utilization rather than technical efficiency [6].
These conflicting findings imply that the effect of environmental regulation is not universal but contingent on the type, intensity, and design of policy instruments, as well as the institutional context. In particular, the mixed results largely stem from the fact that most prior studies treat environmental regulation as a single policy rather than a combination of multiple instruments. Such divergent evidence indicates that a singular focus on the stringency or existence of regulation may not adequately capture its real effects. To understand why the effects of environmental regulation differ so widely, it is useful to examine not just regulation itself, but the structure and combination of policy instruments.
By shifting attention to the collaborative nature of reward and penalty instruments, this paper helps reconcile conflicting findings in earlier work and presents a more consistent interpretation of how regulatory arrangements shape corporate production choices. Prior analyses of policy synergy have covered several important dimensions: the matching and complementarity among different policy instruments [30,31], vertical coordination between central and local governments [24,27], and regional coordination across jurisdictions [26]. While these perspectives advance our understanding of policy synergy, they seldom concentrate on the internal coordination between reward and penalty mechanisms within the same regulatory framework. Pacheco-Vega categorized environmental governance policy instruments into three types: regulatory (sticks), economic (carrots), and information-based (sermons), and further pointed out that the combination of heterogeneous policy instruments has become a mainstream trend in environmental governance [33]. Inspired by this insight, this study analyzes policy synergy from the perspective of rewards and penalties, and empirically examines the impact of the internal coordination of reward-penalty mechanisms on corporate capacity utilization (CU).
This study fills this gap by showing that aligned incentives can reduce uncertainty, motivate proactive operational adjustments, and ultimately improve capacity utilization. Capacity utilization reveals how enterprises balance environmental obligations and operational efficiency in real production decisions. When policy signals are fragmented or inconsistent, firms often adopt cautious, short-term behaviors such as delaying capacity adjustments or holding excess idle resources. By contrast, high policy synergy creates stable and predictable institutional expectations, enabling enterprises to optimize production plans and employ existing resources more efficiently. The positive influence of policy synergy identified in this study therefore validates our theoretical predictions and enhances the micro-level evidence linking environmental policy coordination to real production outcomes.
7.2. Limitations and Future Research
This study provides evidence on how policy synergy affects capacity utilization, yet several limitations warrant attention. First, the observed heterogeneity may reflect unmeasured firm-level factors. For example, stronger effects in state-owned enterprises may be influenced by political ties or social mandates, and R&D intensity may proxy for managerial quality or strategic flexibility. Incorporating measures of governance, leadership, or informal networks could better isolate these influences. Second, the focus on China limits the generalizability. State ownership and centralized coordination are distinctive features of the institutional context. Comparative studies in other economies would reveal whether similar policy synergy effects hold elsewhere and whether their effectiveness is institutionally contingent.
8. Conclusions and Recommendations
Our study demonstrates that policy synergy significantly enhances the enterprises’ capacity utilization (CU). This positive effect is not universal but contingent on firm and contextual factors. The benefit is pronounced in state-owned enterprises and competitive industries, but insignificant in non-state-owned firms and regulated sectors, highlighting the roles of the institutional embeddedness and market discipline. Furthermore, firms with strong internal capabilities, such as high R&D investment, respond more effectively, as their absorptive capacity enables more flexible process reconfiguration under regulatory pressure. Policy synergy exerts a stronger effect in regions with lower public environmental attention. Simultaneously, the analyst coverage amplifies the synergy’ s impact, revealing a complementary role for financial market monitoring in enhancing transparency and reputational incentives.
Building on these insights, we propose the following targeted recommendations:
First, the policy design must be differentiated and capability-sensitive. A uniform reward–penalty system is suboptimal. For SOEs and competitive industries, maintaining and refining the coordinated incentives is effective. For non-state-owned or low-R&D firms, complementary supportive measures—such as simplified procedures, technical assistance, and enhanced information dissemination—are essential to build the responsive capacity. In regulated industries, policy efforts should focus on improving the inter-instrument coordination and developing sector-specific benchmarks to align incentives with efficiency gains. These differentiated and capability-sensitive measures not only enhance capacity utilization but also contribute to sustainable industrialization (SDG 9) by promoting more efficient and greener production processes.
Second, policymakers should strategically leverage the external oversight to amplify the policy impact. Our finding that the analyst coverage strengthens the effect of policy synergy suggests that transparency and market scrutiny are force multipliers. Measures such as mandating enhanced environmental disclosure, integrating green performance into corporate ratings, and fostering active engagement from the investment community can significantly increase firms’ responsiveness to the regulatory incentives. Leveraging external oversight to amplify policy effects also supports responsible consumption and production (SDG 12) by encouraging transparency and environmentally accountable corporate behavior.
Third, the implementation should be prioritized based on heterogeneity. High-capability firms in competitive sectors can serve as “first movers” or demonstration cases. For regions with weak public environmental awareness, robust and clearly communicated policy synergy becomes even more critical to achieve compliance and efficiency goals in the absence of strong societal monitoring.
Overall, implementing policy synergy in a differentiated, oversight-informed, and heterogeneity-aware manner advances China’ s cleaner production objectives while aligning with global sustainability goals.
Supplementary Materials
The following supporting information can be downloaded at: https://www.mdpi.com/article/10.3390/su18062841/s1, Table S1: Policy Documents Table (with Chinese Titles Retained).
Author Contributions
Conceptualization, J.Z.; methodology, J.Z.; software, X.L.; validation, J.Z.; formal analysis, J.Z.; investigation, J.Z.; resources, J.Z.; data curation, J.Z.; writing—original draft preparation, J.Z.; writing—review and editing, J.Z. and X.L.; visualization, X.L.; supervision, J.Z. and X.L.; project administration, X.L.; funding acquisition, J.Z. All authors have read and agreed to the published version of the manuscript.
Funding
(1) This research was funded by “the Postgraduate Innovative Research Fund of University of International Business and Economics”, 202592. (2) This research was funded by “the Basic Scientific Research Funds for Central Universities” in UIBE, SZQH05.
Institutional Review Board Statement
Not applicable.
Informed Consent Statement
Not applicable.
Data Availability Statement
The original contributions presented in this study are included in the article/Supplementary Material. Further inquiries can be directed to the corresponding author.
Conflicts of Interest
The authors declare no conflicts of interest.
Appendix A
Table A1.
Scoring criteria.
Appendix B
Figure A1.
Conditional marginal effect of RPPS across analytical attention levels. Note: The blue solid line depicts the marginal effect of policy synergy on CU at different levels of analytical attention. The red dashed lines represent the 95% confidence intervals for each marginal effect estimate.
References
- Porter, M.E.; van der Linde, C. Toward a new conception of the environment–competitiveness relationship. J. Econ. Perspect. 1995, 9, 97–118. [Google Scholar] [CrossRef] [Scilit]
- Ambec, S.; Cohen, M.A.; Elgie, S.; Lanoie, P. The porter hypothesis at 20: Can environmental regulation enhance innovation and competitiveness? Rev. Environ. Econ. Policy 2013, 7, 2–22. [Google Scholar] [CrossRef] [Scilit]
- Jaffe, A.B.; Peterson, S.R.; Portney, P.R.; Stavins, R.N. Environmental regulation and the competitiveness of u.s. manufacturing: What does the evidence tell us? J. Econ. Lit. 1995, 33, 132–163. [Google Scholar]
- Greenstone, M.; List, J.A.; Syverson, C. The Effects of Environmental Regulation on the Competitiveness of U.S. Manufacturing; MIT Center for Energy and Environmental Policy Research: Cambridge, MA, USA, 2012; Available online: http://www.jstor.org/stable/resrep34723 (accessed on 1 January 2026).
- Berman, E.; Bui, L.T.M. Environmental regulation and productivity: Evidence from oil refineries. Rev. Econ. Stat. 2001, 83, 498–510. [Google Scholar] [CrossRef] [Scilit]
- Gray, W.B.; Shadbegian, R.J. Plant vintage, technology, and environmental regulation. J. Environ. Econ. Manag. 2003, 46, 384–402. [Google Scholar] [CrossRef] [Scilit]
- Xie, B.; Yang, C.; Song, W.; Song, L.; Wang, H. The impact of environmental regulation on capacity utilization of china’s manufacturing industry: An empirical research based on the sector level. Ecol. Indic. 2023, 148, 110085. [Google Scholar] [CrossRef] [Scilit]
- Wang, H.; Ye, S.; Chen, H.; Yin, J. The impact of carbon emission trading policy on overcapacity of companies: Evidence from China. Energy Econ. 2023, 126, 106929. [Google Scholar] [CrossRef] [Scilit]
- Du, W.; Wang, F.; Li, M. Effects of environmental regulation on capacity utilization: Evidence from energy enterprises in China. Ecol. Indic. 2020, 113, 106217. [Google Scholar] [CrossRef] [Scilit]
- National People’s Congress of the People’s Republic of China. Law of the People’s Republic of China on Promoting Cleaner Production (Revised in 2012) [EB/OL]. 29 February 2012. Available online: https://www.mee.gov.cn/ywgz/fgbz/fl/201904/t20190428_701287.shtml (accessed on 1 February 2026).
- National Development and Reform Commission. Notice on Issuing the “14th Five-Year Plan for the Promotion of Clean Production” [EB/OL]. 29 October 2021. Available online: https://www.gov.cn/zhengce/zhengceku/2021-11/10/content_5650026.htm (accessed on 1 February 2026).
- Fader, M.; Cranmer, C.; Lawford, R.; Engel-Cox, J.E. Toward an Understanding of Synergies and Trade-Offs Between Water, Energy, and Food SDG Targets. Front. Environ. Sci. 2018, 6, 112. [Google Scholar] [CrossRef] [Scilit]
- Chirambo, D. Towards the Achievement of SDG7 in Sub-Saharan Africa: Creating Synergies Between Power Africa, Sustainable Energy for All and Climate Finance in Order to Achieve Universal Energy Access before 2030. Renew. Sustain. Energy Rev. 2018, 94, 600–608. [Google Scholar] [CrossRef] [Scilit]
- Zhou, R.H.; Yang, X.M.; Han, Y. Cleaner Production and Total Factor Productivity of Polluting Enterprises. J. Clean. Prod. 2023, 423, 138827. [Google Scholar] [CrossRef] [Scilit]
- Chen, Z.; Zhou, L.; Jia, C.; Guo, X. To Pick (or Not to Pick) the High-Hanging Fruits: Cleaner Production Audits and Firm Total Factor Energy Efficiency. Renew. Sustain. Energy Rev. 2023, 186, 113661. [Google Scholar] [CrossRef] [Scilit]
- Laurent, A.; Molin, C.; Owsianiak, M.; Fantke, P.; Dewulf, W.; Herrmann, C.; Hauschild, M. The Role of Life Cycle Engineering (LCE) in Meeting the Sustainable Development Goals—Report from a Consultation of LCE Experts. J. Clean. Prod. 2019, 230, 378–382. [Google Scholar] [CrossRef] [Scilit]
- Li, Z.; Wu, B.J.; Wang, D.Y.; Tang, M.G. Government Mandatory Energy-Biased Technological Progress and Enterprises’ Environmental Performance: Evidence from a Quasi-Natural Experiment of Cleaner Production Standards in China. Energy Policy 2022, 162, 112779. [Google Scholar] [CrossRef] [Scilit]
- Gray, W.B.; Shadbegian, R.J. Environmental Regulation, Investment Timing, and Technology Choice. J. Ind. Econ. 1998, 46, 235–256. [Google Scholar] [CrossRef] [Scilit]
- Xu, L.; Yang, L.; Li, D.; Shao, S. Asymmetric Effects of Heterogeneous Environmental Standards on Green Technology Innovation: Evidence from China. Energy Econ. 2023, 117, 106479. [Google Scholar] [CrossRef] [Scilit]
- Li, J.; Zhang, Y.; Shao, S.; Zhang, S.; Ma, S. Application of Cleaner Production in a Chinese Magnesia Refractory Material Plant. J. Clean. Prod. 2016, 113, 1015–1023. [Google Scholar] [CrossRef] [Scilit]
- Bai, Y.; Yin, J.; Yuan, Y.; Guo, Y.; Song, D. An Innovative System for Promoting Cleaner Production: Mandatory Cleaner Production Audits in China. J. Clean. Prod. 2015, 108, 883–890. [Google Scholar] [CrossRef] [Scilit]
- Chen, Z.; Zhou, L.; Jia, C.; Guo, X. Effect of Mandatory Cleaner Production Audits on Manufacturing Firms’ Environmental Efficiency in China: Renovation or Innovation? J. Clean. Prod. 2023, 417, 137855. [Google Scholar] [CrossRef] [Scilit]
- Rio, P.D. On Evaluating Success in Complex Policy Mixes: The Case of Renewable Energy Support Schemes. Policy Sci. 2014, 47, 267–287. [Google Scholar]
- Liao, Y.; Wang, J.; Liao, L.; Shu, X.; Peng, T. Policy Synergy on Stock Price Crash Risk: An Intergovernmental Perspective. Financ. Res. Lett. 2024, 67, 105744. [Google Scholar] [CrossRef] [Scilit]
- Wang, X.; Qiu, L.; Yuan, B.; Li, H.; Li, L. The Effect of Environmental Regulation Policy Synergy on Ecological Welfare Performance: Evidence from County Data in the Yellow River Basin of China. J. Clean. Prod. 2025, 524, 146470. [Google Scholar] [CrossRef] [Scilit]
- Zhang, P.; Peng, B.; Lin, Z.; Du, H. The Impact of Latent Policy Synergy Between Cities on Air Pollution: An Empirical Analysis from China’s 12,764 Air Policies. J. Environ. Manag. 2024, 370, 122549. [Google Scholar] [CrossRef] [Scilit] [PubMed]
- Liu, D.; Wang, D.; Mao, J. Study on Policy Synergy Strategy of the Central Government and Local Governments in the Process of Coal De-Capacity: Based on a Two-Stage Evolutionary Game Method. Resour. Policy 2023, 80, 103132. [Google Scholar] [CrossRef] [Scilit]
- Yang, C. Government Policy Change and Evolution of Regional Innovation Systems in China: Evidence from Strategic Emerging Industries in Shenzhen. Environ. Plan. C-Gov. Policy 2015, 33, 661–682. [Google Scholar] [CrossRef] [Scilit]
- Lu, W.; Wu, H.; Yang, S.; Tu, Y. Effect of Environmental Regulation Policy Synergy on Carbon Emissions in China Under Consideration of the Mediating Role of Industrial Structure. J. Environ. Manag. 2022, 322, 116053. [Google Scholar] [CrossRef] [Scilit]
- Greco, M.; Germani, F.; Grimaldi, M.; Radicic, D. Policy Mix or Policy Mess? Effects of Cross-Instrumental Policy Mix on Eco-Innovation in German Firms. Technovation 2022, 117, 102194. [Google Scholar] [CrossRef] [Scilit]
- Martin, B.R. R&D Policy Instruments—A Critical Review of What We Do and Don’t Know. Ind. Innov. 2016, 23, 157–176. [Google Scholar] [CrossRef] [Scilit]
- Zhang, W.; Cui, J.; Li, X.; Hou, X.; Li, Y.; Burgio, M.S.; Li, H.; Yang, Q.; Liu, G. Understanding Policy-Volition Interactions in Urban Ecological Governance: A Simulation Framework Based on SD-ABM Coupling. J. Clean. Prod. 2025, 524, 146479. [Google Scholar] [CrossRef] [Scilit]
- Pacheco-Vega, R. Environmental Regulation, Governance, and Policy Instruments, 20 Years After the Stick, Carrot, and Sermon Typology. J. Environ. Policy Plan. 2020, 22, 620–635. [Google Scholar] [CrossRef] [Scilit]
- Kong, Q.; Li, R.; Wang, Z.; Peng, D. Economic Policy Uncertainty and Firm Investment Decisions: Dilemma or Opportunity? Int. Rev. Financ. Anal. 2022, 83, 102301. [Google Scholar] [CrossRef] [Scilit]
- Albrizio, S.; Kozluk, T.; Zipperer, V. Environmental Policies and Productivity Growth: Evidence Across Industries and Firms. J. Environ. Econ. Manag. 2017, 81, 209–226. [Google Scholar] [CrossRef] [Scilit]
- Guo, R.; Yuan, Y. Different Types of Environmental Regulations and Heterogeneous Influence on Energy Efficiency in the Industrial Sector: Evidence from Chinese Provincial Data. Energy Policy 2020, 145, 111747. [Google Scholar] [CrossRef] [Scilit]
- Wang, Z.; Zheng, C. Is technological innovation the cure for overcapacity? exploring mediating and moderating mechanisms. J. Bus. Res. 2022, 147, 348–361. [Google Scholar] [CrossRef] [Scilit]
- Hao, Y.; Gai, Z.; Wu, H. How Do Resource Misallocation and Government Corruption Affect Green Total Factor Energy Efficiency? Evidence from China. Energy Policy 2020, 143, 111562. [Google Scholar] [CrossRef] [Scilit]
- Sun, H.; Edziah, B.K.; Kporsu, A.K.; Sarkodie, S.A.; Taghizadeh-Hesary, F. Energy Efficiency: The Role of Technological Innovation and Knowledge Spillover. Technol. Forecast. Soc. Change 2021, 167, 120659. [Google Scholar] [CrossRef] [Scilit]
- Zhang, Z.; Luo, C.; Zhang, G.; Shu, Y.; Shao, S. New Energy Policy and Green Technology Innovation of New Energy Enterprises: Evidence from China. Energy Econ. 2024, 136, 107743. [Google Scholar] [CrossRef] [Scilit]
- Garel, A.; Petit-Romec, A. Investor Rewards to Environmental Responsibility: Evidence from the COVID-19 Crisis. J. Corp. Financ. 2021, 68, 101948. [Google Scholar] [CrossRef] [Scilit]
- Jensen, M.C.; Meckling, W.H. Theory of the firm: Managerial behavior, agency costs and ownership structure. J. Financ. Econ. 1976, 3, 305–360. [Google Scholar] [CrossRef] [Scilit]
- Yu, F. Analyst coverage and earnings management. J. Financ. Econ. 2008, 88, 245–271. [Google Scholar] [CrossRef] [Scilit]
- Tang, J.; Huang, C. Corporate philanthropy and analyst forecast accuracy: Evidence from China. Asia-Pac. J. Financ. Stud. 2022, 51, 682–708. [Google Scholar] [CrossRef] [Scilit]
- Du, Y.; Sun, F.; Hu, H.Y. Common Institutional Ownership and Corporate Capacity Utilization. J. Financ. Res. 2022, 48, 49–63+168. [Google Scholar] [CrossRef]
- Li, X.S.; Zhao, C.Y.; Nie, J. Outward Foreign Direct Investment and Firm-Specific Heterogeneous Capacity Utilization. J. World Econ. 2017, 5, 73–97. [Google Scholar] [CrossRef]
- Peking University Law Database (PKU Law Database). China Legal Information Retrieval System [EB/OL]. Available online: https://www.pkulaw.com/ (accessed on 1 January 2026).
- Xiao, S.; Zhu, X. Bureaucratic control and strategic compliance: How do subnational governments implement central guidelines in China? J. Public Adm. Res. Theory 2022, 32, 342–359. [Google Scholar] [CrossRef] [Scilit]
- Yang, T.; Sun, Z.; Du, M.; Du, Q.; Li, L.; Shuwaikh, F. The Impact of the Degree of Coupling Coordination Between Green Finance and Environmental Regulations on Firms’ Innovation Performance: Evidence from China. Ann. Oper. Res. 2023, 331, 173–195. [Google Scholar] [CrossRef] [Scilit]
- Zheng, X.; Zou, F.; Liu, Z.; Nepal, R. How Does Digitalization Affect Capacity Utilization in the Energy Sector? Evidence from China. Energy Econ. 2025, 144, 108337. [Google Scholar] [CrossRef] [Scilit]
- Feng, Q.; Hu, X.; Deng, X.; Lu, J. Anti-Corruption Campaign and Capacity Utilization of State-Owned Enterprises: Evidence from China’s Central Committee Inspection. Econ. Anal. Policy 2023, 80, 319–346. [Google Scholar] [CrossRef] [Scilit]
- Cheng, Z.; Wang, L.; Zhang, Y. Does Smart City Policy Promote Urban Green and Low-Carbon Development? J. Clean. Prod. 2022, 379, 134780. [Google Scholar] [CrossRef] [Scilit]
- Jiang, M.D.; Yu, X.X.; Xu, J.R.; Wu, Z.P.; Shen, X.M.; Zhong, G.Y. Exploring the Emission Spillover Effects in Production Networks Under Carbon Trading Market: Insights into Complementary and Competitive Industries. Environ. Impact Assess. Rev. 2025, 110, 107720. [Google Scholar] [CrossRef] [Scilit]
- Kong, D.M.; Xu, M.L.; Kong, G.W. Internal pay gap within enterprises and innovation. Econ. Res. J. 2017, 52, 144–157. Available online: https://kns.cnki.net/kcms2/article/abstract?v=esvOG1ozB-iYha8dZw5t_S_zP5pm4C6pD1SXVpYUpRuR93603S3ASMvpI9yFcyrB9z2KWHw4zQQqm-QF9ffgDUhEE1vb2Cy5l1FmP70kv2G2LA7L7T4W5lmCYkganECp8_cyge2fyEa2KAaxVt2EAx8XDg2TTNBP0nC1z_CVkISWsp9wgz4T4w==&uniplatform=NZKPT&language=CHS (accessed on 1 January 2026).
- Lan, Z.R.; Liu, B.L. The impact of public environmental attention on ecological total factor productivity: Evidence from China’s major urban agglomerations. East China Econ. Manag. 2025, 39, 63–72. [Google Scholar] [CrossRef]
- Dell, M. The Persistent Effects of Peru’s Mining Mita. Econometrica 2010, 78, 1863–1903. [Google Scholar] [CrossRef] [Scilit]
- Shen, K.R.; Qiao, G.; Lin, J.W. Intelligent Manufacturing Policies and the High-Quality Development of Chinese Enterprises. J. Quant. Tech. Econ. 2024, 41, 5–25. [Google Scholar] [CrossRef]
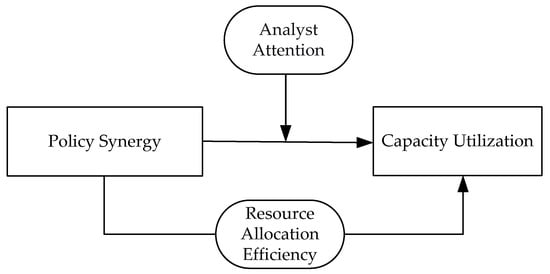
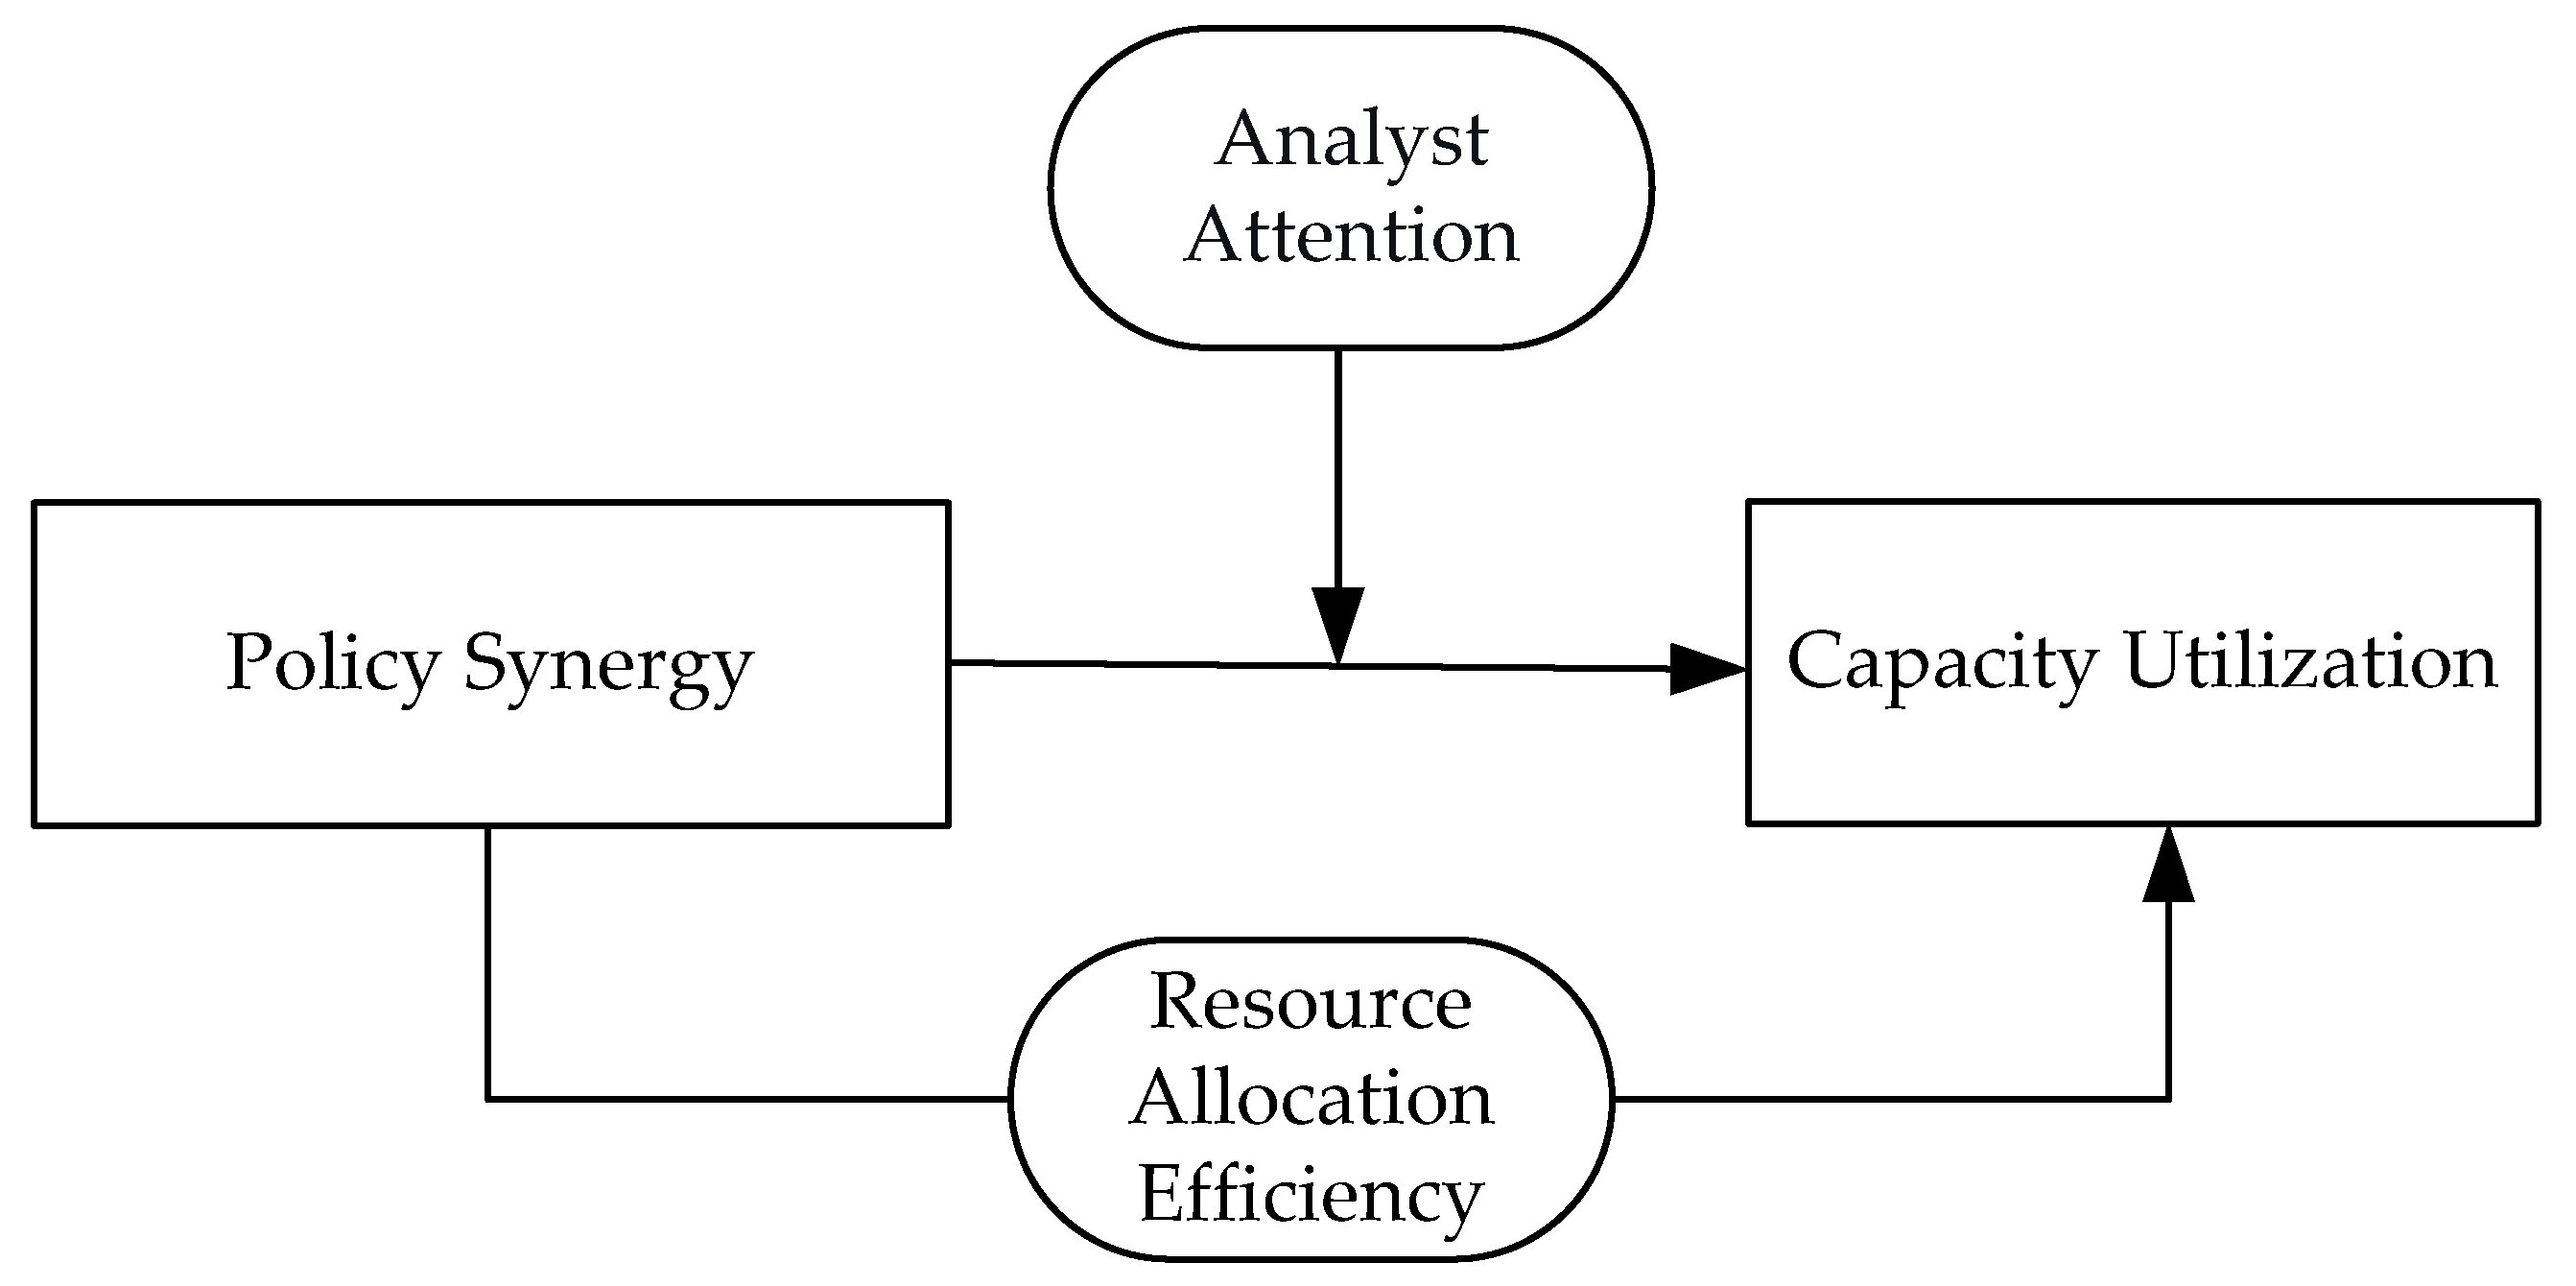
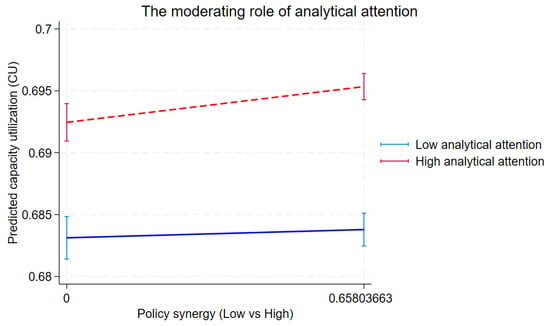
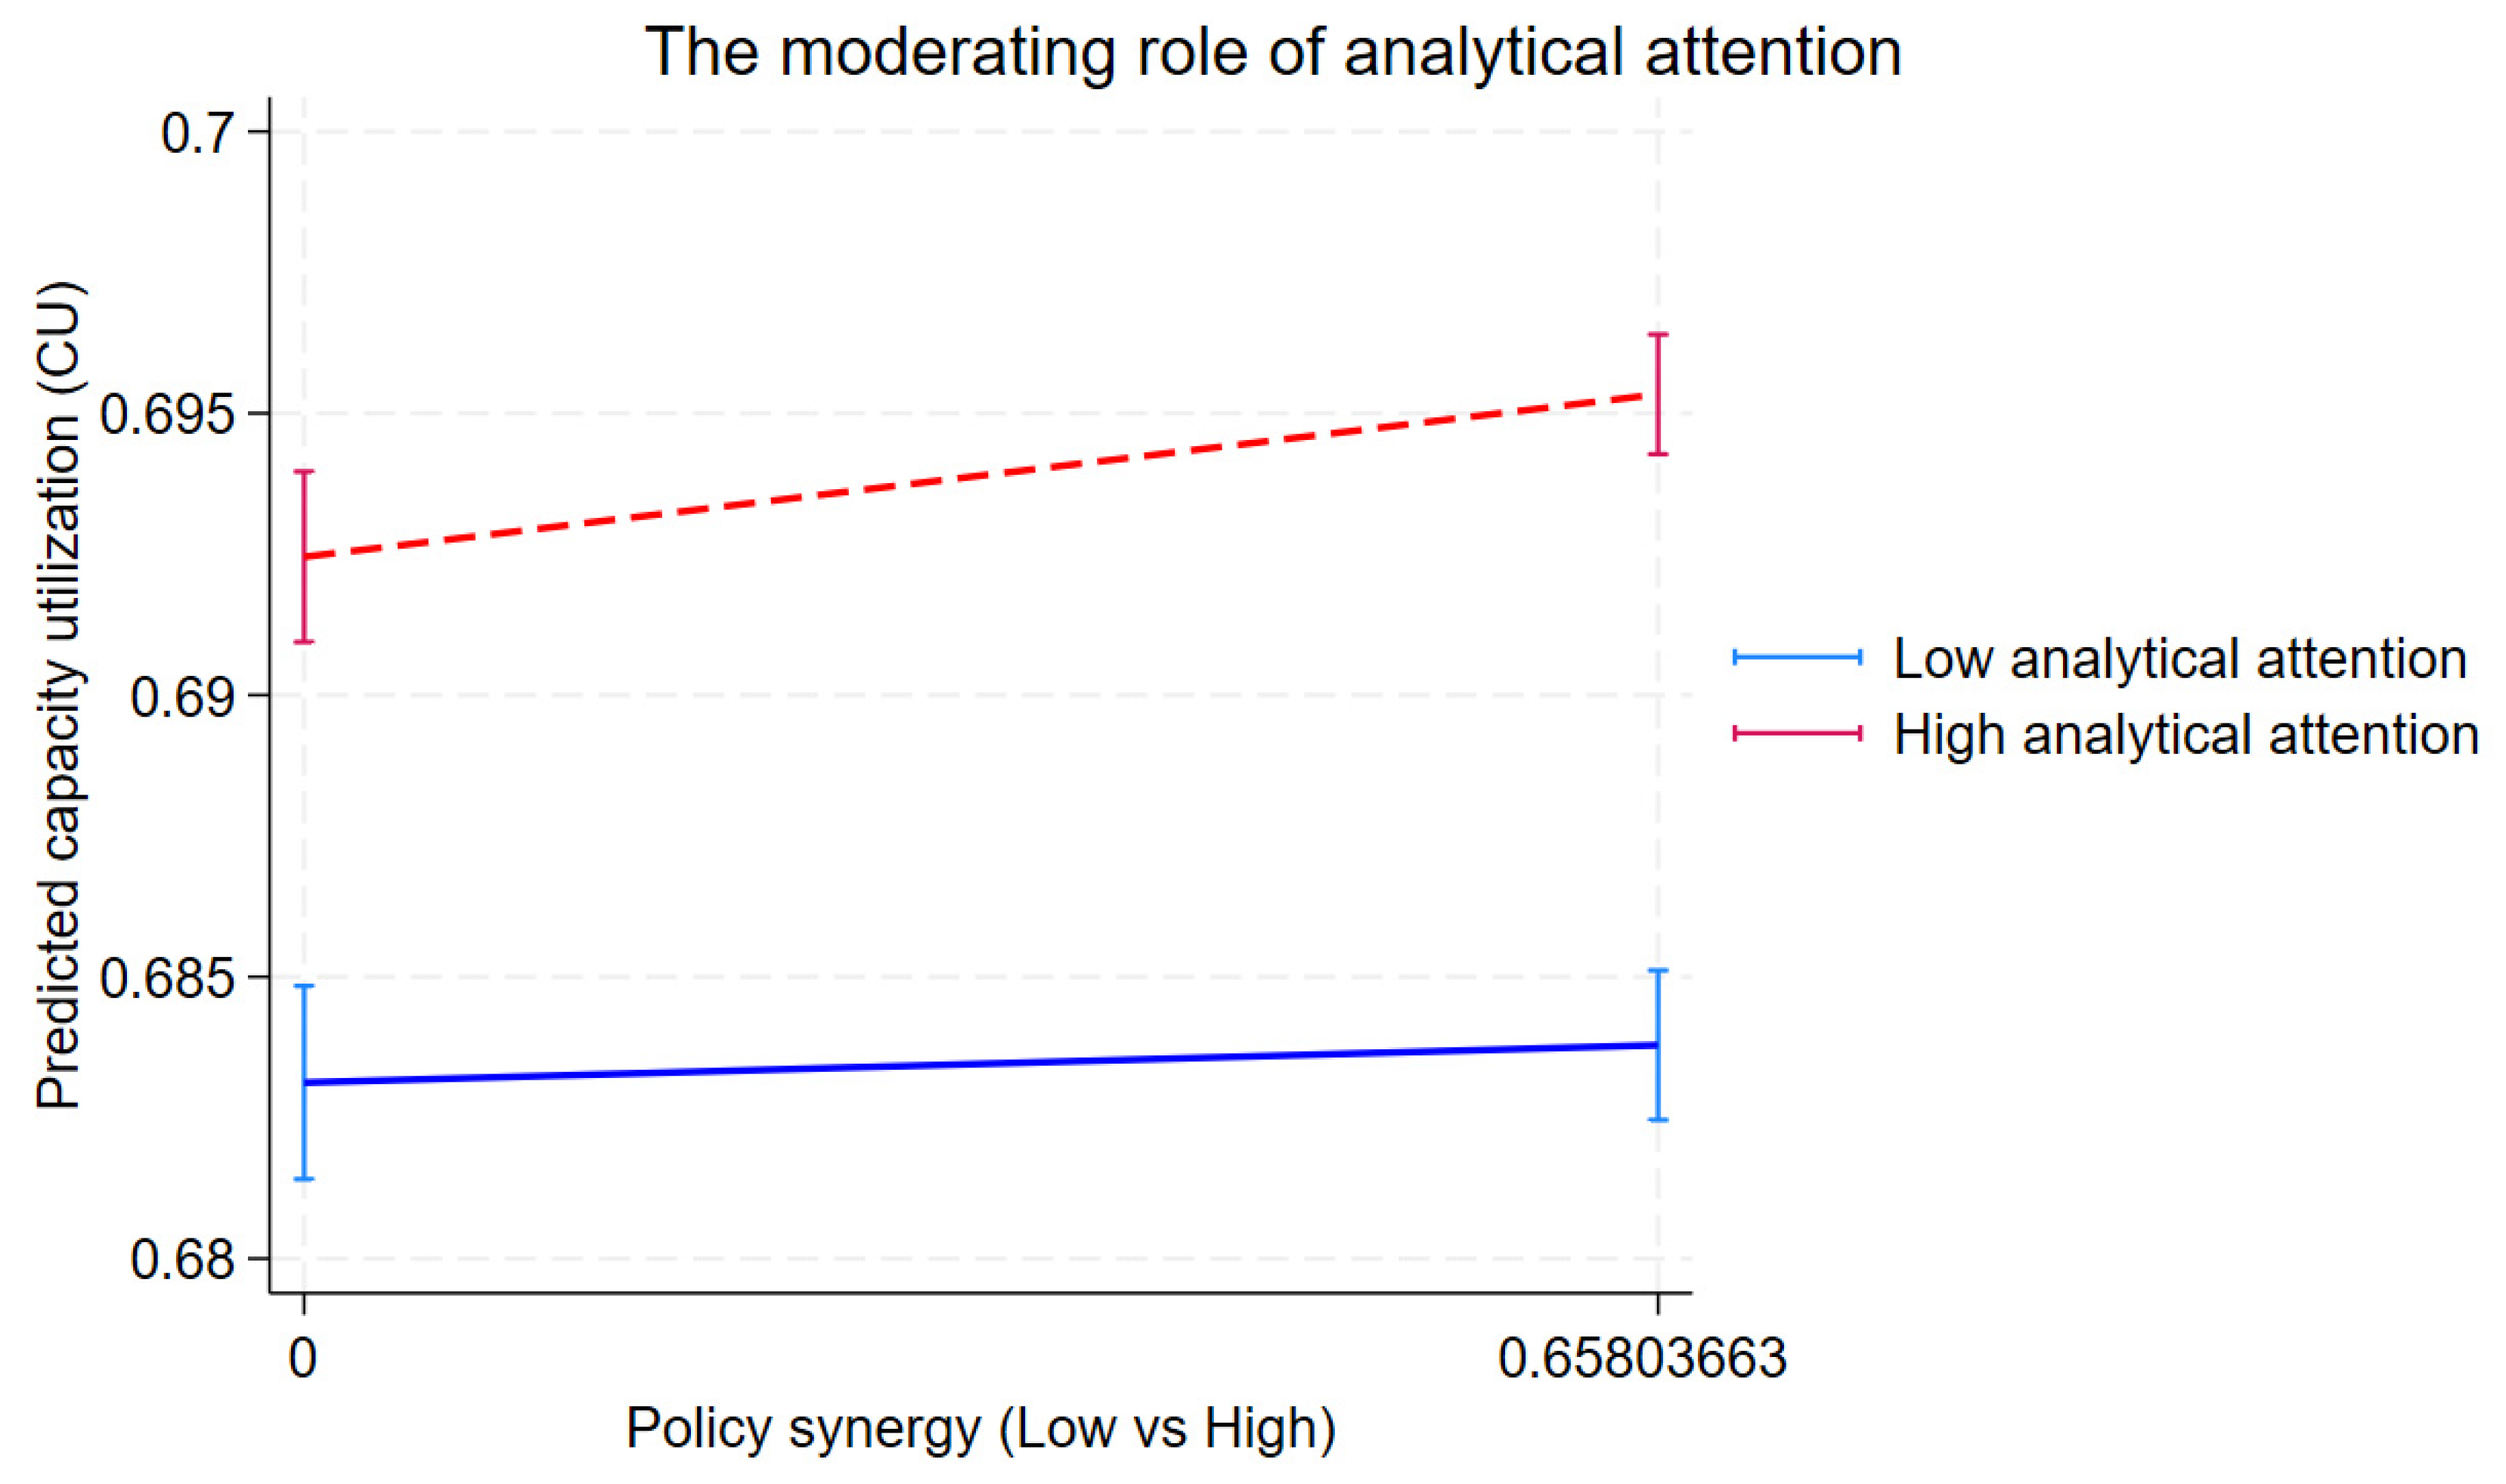

Disclaimer/Publisher’s Note: The statements, opinions and data contained in all publications are solely those of the individual author(s) and contributor(s) and not of MDPI and/or the editor(s). MDPI and/or the editor(s) disclaim responsibility for any injury to people or property resulting from any ideas, methods, instructions or products referred to in the content. |
© 2026 by the authors. Licensee MDPI, Basel, Switzerland. This article is an open access article distributed under the terms and conditions of the Creative Commons Attribution (CC BY) license.