


Abstract
While sustainability is set as a goal by a broad range of international organizations, its definition varies, and there is still a lack of practical criteria for product designers to evaluate the degree of (un)sustainability in the design phase. Life cycle assessment (LCA) can allow quantification of the environmental impacts of a product but is often carried out post-design, when the manufacturing process is already settled. Finally, while significant advances have been made towards standardizing LCA calculations by providing product category rules, large uncertainties remain in the calculation results due to a lack of transparency regarding the choices of databases, system boundaries, allocation, cut-off rules, and level of data granularity. A practical way to improve in those areas is to share with the semiconductor community a parametrizable life cycle inventory (LCI) model based on a target device to (1) identify knowledge gaps in LCA methods for such products, (2) identify the main process variables, and (3) provide a starting point for LCA calculations by the designers themselves. With this aim, a parametrizable cradle-to-gate manufacturing LCI model was developed based on the peer-reviewed process flow of a trench field-stop silicon insulated gate bipolar transistor (IGBT) semiconductor power device. The model allows computation of the environmental impacts of the IGBT manufacturing process based on different tunable parameters such as die size, wafer diameter, manufacturing yield, abatement efficiency, wafer fab throughput, wafer fab location, and associated electricity mix. Embedding a high level of data granularity, it helps identify, at elementary process levels, key environmental hotspots and associated technical levers for their reduction. Analysis of the IGBT manufacturing process tends to demonstrate the importance of an impact assessment approach considering multiple environmental categories, going beyond the sole focus on greenhouse gas emissions and accounting for potential transfers of impact. With an open-source mindset and in a continuous improvement prospective, the manufacturing inventory model and its associated tools are freely available from a public GitHub repository and open for comments and consolidation from users.
1. Introduction
Although they are considered to be key enablers of the transition towards a more electrified and less fossil-dependent society, power semiconductors used for electrical power conversion tend to induce a transfer of environmental impacts from direct greenhouse gas emissions towards mineral and water resource depletion and indirectly associated emissions. Those impacts must be precisely quantified to identify the levers for their potential reduction and to provide consolidated figures to support an electrification trend which can be beneficial to the environment.
Life cycle analysis (LCA) is an internationally standardized methodology which can constitute a powerful tool to compute the environmental impacts of products throughout their life cycle, including the extraction of resources (minerals, water, energy) to produce them, their manufacturing, usage, and end of life (EoL) [1,2]. The standard methodology for LCA analysis is an iterative process which includes four stages: (1) goal and scope definition, (2) inventory analysis, (3) impact assessment, and (4) results analysis and interpretation.
Applied to the field of power electronics, LCA can help design ‘fit-for-need’ systems with limited environmental impacts, reduce dependence on critical raw materials, anticipate legal and competitive pressure regarding environmental product declarations (EPDs), and raise awareness of the non-negligible ecological footprint of power semiconductors, which are highly material- and energy-intensive to produce [3,4,5]. In the end, LCA should be used as a tool to evaluate material and energy efficiency, as well as impacts on the biosphere, in the frame of the vast deployment of power semiconductors in the current electrification efforts and in the context of a continuously evolving regulatory framework [6,7].
LCA, however, typically suffers from several limitations. It is an ISO-standardized methodology, but its system boundaries remain at the discretion of the LCA practitioner (which limits the comparability between studies). The consistency of the results it provides heavily depends on the relevance of the input data, which can be scarce and/or inaccurate, especially in the semiconductor industry, which, for reasons of competitiveness, is careful to maintain a high level of secrecy and confidentiality regarding its production processes. LCA also suffers from significant discrepancies from one database to another [8], and the methodology to properly consider potential circularity strategies in the EoL stage still needs to be consolidated. Given those limits, LCA practitioners should clearly state the frame in which their impact assessment results have been obtained, including its strengths but also potential weak spots, in order not to use LCA as a tool for misdeclarations which could potentially damage its scientific relevance [9]. It is also worth mentioning that the deployment of standardized and reproducible life cycle analyses requires the definition of product-specific rules (PSRs) defining the system boundaries to be applied when carrying out LCA of a specific type of product. To the knowledge of the authors, such PSRs have not been clearly defined and broadly accepted yet for semiconductors, but initiatives are currently on-going to find a consensus within the industrial community [10].
It is in this context that, based on literature resources and technical exchanges with external parties (suppliers, experts, parts manufacturers), Mitsubishi Electric R&D Centre Europe (MERCE) develops life cycle impact assessment (LCIA) models as research tools dedicated to a variety of subcomponents embedded in power electronic systems, such as power semiconductors. Such models can be useful to both designers, either in the pre- or post-development phase, and users to accurately quantify the environmental impacts of power electronic equipment and identify strategies for their mitigation. Accurate models also allow the generic semiconductor datasets in existing databases, which tend to misestimate the impacts of power devices due to mismatch or irrelevance of the dataset scope, to be bypassed. In the end, a detailed manufacturing inventory can allow the user to increase the level of confidence in its impact assessment results and identify key levers for environmental impact reduction.
In the frame of this strategy, MERCE also developed the power electronics life cycle assessment (PELCA) open-source software to simulate the environmental impacts of a power electronic system throughout its life cycle, including both manufacturing and use phases [11,12,13], and in which such inventory models can be used to assess the impacts of the initial manufacturing phase.
This paper deals with a first manufacturing inventory model dedicated to silicon insulated gate bipolar transistor (IGBT) power devices, named PELCA IGBT designer and based on an ultrathin trench field-stop IGBT technology. Rather than focusing on the communication of precise and deterministic values of environmental impacts, which are, by construction, moving figures depending on the impact assessment method, system boundaries, manufacturing hypotheses, and environmental database used, this paper aims to present the capabilities of the impact assessment tool and distribute the associated resources (parametrizable manufacturing inventory Excel file, Python script, GitHub repository) as tools freely accessible to potential users and open for comments for future improvements.
The motivations of the authors for the open-source diffusion of such resources are diverse: to strengthen and promote data sharing among LCA practitioners from the semiconductor research and industry, to encourage consolidation of databases, and to better understand the relationships between power device design, conditions of production, and resulting environmental impacts.
This study lies in the frame of a rich background of literature references dealing with life cycle assessment of semiconductors and power devices. The pioneering work from S. Boyd [14,15] and N. Krishnan [16] paved the way for the application of LCA to semiconductor manufacturing by providing comprehensive and in-depth analysis of methods used to model the inputs and outputs of semiconductor fabrication processes, point-of-use systems, and cleanroom facilities and infrastructures. They focused on various types of devices: CMOS logic integrated circuits, flash memories, and DRAM integrated circuits. Especially, they developed models to scale a manufacturing inventory to different technological nodes and publicly disclosed their data through a detailed library of material and energy models for a complete set of manufacturing processes. Murphy et al. [17,18] also contributed to the infancy of LCA applied to semiconductor manufacturing by publishing concise, ready-to-use parametric material, energy, and emission inventories for different wafer fabrication process steps and LCA models of semiconductor wafer fab with relevant system boundaries.
More recently, regarding studies investigating the environmental impacts of power semiconductors, Musil et al. [19] published an article about the relative environmental impacts of solar inverters based either on silicon IGBT or silicon carbide MOSFET power modules, providing useful quantitative figures on their respective carbon footprints. In a similar fashion, Spejo et al. [20] provided a valuable contribution by publishing life cycle cumulative electrical energy demands of high-voltage semiconductor power modules with embedded silicon IGBTs or silicon carbide MOSFETs for railway traction applications. Their study relies on actual top-down production data from Hitachi Energy in Switzerland, which produces the two types of power devices, and is a noticeable contribution regarding data sharing with other LCA practitioners. However, the published results only regard electricity consumption, without evaluation of the environmental impacts. The work by Spejo et al. has been used in a recent study by Radwan et al. [21], who presented a tool for cradle-to-gate environmental impact assessment of power modules based on Si IGBTs and SiC MOSFETs. Vauche et al. [22] published a detailed study on a cradle-to-gate manufacturing LCA for a gallium nitride (GaN) power semiconductor device, benefiting from the in-house wafer fabrication capability of CEA-Leti to accurately assess the impacts of the wafer process steps and cleanroom infrastructures and considering a wide scope of impact categories. Finally, considering the broader field of LCA applied to power electronic systems, Nordelöf et al. from Chalmers University provided valuable contributions in the form of publicly available and scalable manufacturing inventory models dedicated to power electronic systems such as automotive inverters [23] and electric motors [24]. The inventory model published in this study, as in previous work by Baudais et al. [11], took inspiration from those works in terms of the structure of the inventory model, data collection approach, and open-source diffusion of the associated resource.
While the literature in the field of LCA of semiconductors and power electronics is already rich and gaining consistency throughout the years, the open-source diffusion of ready-to-use manufacturing inventory models dedicated to power semiconductor devices is still hindered by confidentiality aspects and by the sensitivity of the production data in the hands of manufacturers. In this frame, this study attempts to provide a contribution in the form of an open-access manufacturing LCI model dedicated to IGBT power devices and consolidated based on literature sources and disclosable technical exchanges with engineers and researchers from Fraunhofer IISB in Germany and CEA-Leti in France.
2. Impact Assessment Scope and Methods
The inventory model published in this study allows to carry out life cycle analysis (LCA) and life cycle impact assessment (LCIA) of the manufacturing of a silicon IGBT power device following the ISO 14040 and ISO 14044 international standards [1,2].
2.1. Goal and Scope Definition
The goal of this inventory model is to provide a process- and material-based parametrizable tool allowing identification of environmental hotspots of IGBT manufacturing and scaling relationships between manufacturing hypotheses and environmental impacts.
The system boundaries of the inventory model rely on a cradle-to-gate approach and include the process steps used to produce one wafer of an IGBT power device, from raw mineral extraction up to the exit gate of the wafer fab. The use phase of the device and its potential end-of-life scenarios are not included in the scope of this study, which focuses solely on the impacts of the IGBT power die manufacturing. The functional unit (FU) considered in the frame of this study is the following: to produce 1 cm2 of a singulated and electrically functional ultrathin field-stop trench silicon IGBT power device with a 750 V voltage rating and a 270 A current rating in a wafer fab in 2026.
The manufacturing inventory model includes three main activity categories:
- The production of the raw silicon semiconductor-grade wafer used as substrate (labeled as ‘raw wafer production’);
- The wafer process steps carried out in the wafer fab to produce the IGBT device, including the front-end of line (FEoL) and back-end of line (BEoL) process steps up to the delivery of singulated, electrically tested, IGBT power die (labeled as ‘wafer process steps’);
- The consumption and emissions of the infrastructures and facilities of the cleanroom in which the wafer processing steps are carried out (labeled as ‘cleanroom facilities and infrastructures’).
Figure 1 provides a schematic view of the system boundaries of the IGBT manufacturing model and the different exchanges among those three main activities:
Figure 1.
System boundaries of the cradle-to-gate IGBT manufacturing inventory model, including ‘raw wafer production’ (dark blue), ‘wafer process steps’ (orange), and ‘cleanroom facilities and infrastructures’ (light green).
The wafer fab perimeter includes the process steps to produce the IGBT power devices onto the silicon substrates (detailed in Section 2.5.2) and the cleanroom facilities and infrastructures (detailed in Section 2.5.3) operating during wafer production. The construction of the wafer fab itself and the production of the different tools and equipment used to produce the IGBT wafer are not included in the scope of the impact assessment.
The ‘raw wafer production’ activity (detailed in Section 2.5.1) is considered as external to the wafer fab; it uses inflows from the technosphere as inputs (energy, water, chemicals, and materials) and produces outputs in the form of raw silicon wafer substrates, directed towards the wafer fab as inputs, and emissions to the biosphere (i.e., to the environment). The wafer process steps uses inflows from the technosphere as inputs (energy, water, chemicals, and materials) and produces outputs in the form of technosphere emissions (wastes) directed towards the wafer fab facilities and infrastructures. The wafer fab facilities and infrastructures use inflows from the technosphere as inputs to treat those wastes and convert them into treated emissions, either in the form of emissions directly to the biosphere or to the technosphere (i.e., to a subsequent treatment facility located outside of the system boundaries). As much as possible, the emissions to the technosphere and to the biosphere resulting from the treatment activities included in the ‘cleanroom and infrastructures’ category are allocated to each ‘wafer process step’ category responsible for the emissions to be treated. This approach provides a higher level of data disaggregation, allowing the user to precisely investigate the impacts of IGBT production at the level of each wafer process step.
The energy input feeding the different activities included in the inventory model is assumed to be 100% electrical energy, based on the electricity mix associated with the wafer fab location.
Having no access to ‘top-down’ wafer fab-level data in the frame of this study, the data collection approach is fully ‘bottom-up’, consisting of building up each activity from bottom to top by making manufacturing hypotheses based on teardown analysis, literature sources, and internal experience when available and by consolidating those hypotheses with the help of external experts when possible.
2.2. Impact Assessment Methodology
Figure 2 provides an overview of the software architecture underlying the impact assessment methodology and of the different environmental impact categories considered in the frame of the chosen impact assessment method.
Figure 2.
Description of the software architecture of the PELCA IGBT designer tool and of the 16 environmental impact categories assessed in the frame of the product environmental footprint (PEF) impact assessment method.
Based on an in-depth teardown analysis of the targeted device and its wafer manufacturing process flow, a detailed cradle-to-gate manufacturing inventory is built in the form of an Excel file. This file includes several sheets dedicated to the modeling of each activity considered in the frame of the IGBT wafer manufacturing process and summarizes all associated input and output exchanges (energy, materials, chemicals, processes). The different exchanges included in the manufacturing inventory are either ‘technosphere’ flows (exchanges from or within the technosphere) or ‘biosphere’ flows (emissions to the environment). Those exchanges correspond to existing reference flows (or datasets) of the ecoinvent database (version 3.9.1, ecoSpold2 format) [25] and of the Biosphere database (version 3), respectively.
Environmental databases composed of a variety of ‘ready-to-use’ datasets and already embedding the underlying upstream exchanges associated with each dataset allow LCA practitioners to capture more exhaustive pictures of the environmental impacts they try to assess. The scientific validity of such databases is, however, limited by the representativeness of the existing datasets, which may be far from the targeted scope of the study, or by its number of datasets, which are non-exhaustive and may not cover the whole spectrum of the analysis. By default, existing ‘technosphere’ datasets from the ecoinvent database are used in the inventory to model the different chemicals and materials used. If the targeted dataset does not exist in ecoinvent, a proxy is used when relevant. If none of those options are available, the input chemical or material is constructed by hand by using different existing datasets or proxies. As a baseline approach, the ecoinvent datasets used in the manufacturing inventory are ‘market’ datasets. Those datasets account for the transportation of a finished good or product up to the production facility and for the potential material or energy losses occurring during transportation. ‘Market’ datasets also describe the geographical market distribution shares of the item produced at a certain time. They are used to model the procurement at the production facility of all materials and chemicals needed to produce the device and not produced on-site. By order of preference, the datasets used in the inventory are located in ‘global’ {GLO} then ‘rest-of-the-world’ {RoW} geographies to represent globally averaged datasets. The user is, however, free to adjust, in the inventory Excel file, the geographical location of the datasets according to the manufacturing hypotheses to obtain impact assessment results corresponding to their own supply chain.
The execution of a Python script (version 3.11) based on the open-access Brightway impact assessment library (version 2) allows extraction of the exchanges summarized in the inventory Excel file and computation of the environmental impacts of the manufacturing process based on the data from the ecoinvent and Biosphere databases. Following execution of the script, an output results Excel file is generated, indicating the respective contribution of all activities listed in the inventory to the targeted environmental impacts.
In this study, the chosen impact assessment method is the product environmental footprint method (PEF, version 3.1 no long term (LT)) developed by the Joint Research Center (JRC) of the European Commission [26]. The PEF method allows assessment of environmental impacts based on 16 midpoint indicators, thus spotlighting not only the global warming potential (GWP) impact, but also impact categories such as eutrophication, ecotoxicity, human toxicity, fossil resource depletion, water depletion, and mineral resource depletion. Such an approach with multiple impact categories protects the analysis from environmental blind spots induced by the sole focus on greenhouse gas emissions, which may lead to neglecting other potentially significant impacts of semiconductor fabrication [27].
Finally, an open-access GitHub repository, owned and maintained by MERCE, gathers the different resources (manufacturing inventory Excel file, Python script, instructions on how to use the model) and makes them freely accessible and open for comments and reviews [13]. This GitHub approach has the major advantages of easing the versioning, enabling continuous improvement of the inventory model, and making its latest version freely available online at any time.
The LCA system model used in this study is ‘allocation, cut-off by classification’, which makes the analysis attributional rather than consequential. The cut-off system model allocates the burdens of wastes and their treatment to the producer of the product rather than to the consumer or user of the product. Similarly, the cut-off system considers that by-products of the listed activities that could potentially be re-used in other activities do not provide any credit for their production. It should be finally noted that, in the ecoinvent database, for most multi-output activities generating several non-waste valuable products (such as it is often the case in chemicals and materials value chains), impact allocation is based on economic value (price), although for some activities (secondary energy), energy quality factors are used. The reader should refer to the respective flows listed in the provided inventory to examine the allocation factors and methods used.
Brightway is an open-source LCA library coded in Python that allows impact assessment calculations and is frequently used as an LCA research tool due to the high degree of freedom it provides in terms of programming, regarding both the types of computation it allows and the output graphic visualizations it provides (contribution analyses, sensitivity analyses, Sankey diagrams for flows visualization, statistical impact distributions) [28]. Brightway, however, requires minimal skills in Python programming, which may be an obstacle to its broader diffusion among LCA practitioners. Given this potential drawback, the conceptors of Brightway have designed a graphical user interface called activity browser (AB), thought of as a more visual and easy-to-use software extension of the Python library [29]. The software architecture proposed in this study thus allows standard deterministic LCA providing discrete environmental impact values or statistical impact assessment through Monte Carlo simulations to be carried out. Such a stochastic LCA approach is considered by MERCE as a valuable complement to the standard deterministic method of evaluating the impact of data uncertainties on the impact assessment results.
Therefore, the life cycle analysis carried out in this study is linear, thus not taking into account potential circularity scenarios in the end-of-life stages; static, in the sense that it does not account for the potential temporality of the reference flows and associated datasets from the database; and attributional, rather than consequential, in the way it allocates the impacts of the different listed exchanges to the wafer production activity.
2.3. IGBT Device Used as Reference
The manufacturing inventory model has been built based on the preliminary teardown analysis and in-depth technical reviews of the process flow of a commercially available ultrathin (70 µm thick) micropattern trench field-stop silicon IGBT power die with voltage and current ratings of 750 V and 270 A, respectively, produced by a major semiconductor manufacturer [30]. This device is approximately 100 mm2 and exhibits a surface current density of 2.7 A/mm2.
There are several reasons why this device was selected as a baseline for the IGBT manufacturing inventory model. First, its teardown analysis report was accessible to the authors, providing useful insights into the structure of the internal device and allowing better understanding of the step-by-step process flow followed by the IGBT wafer. Second, it is a high-current power device that can be used in a broad range of power applications, from industrial equipment to automotive inverters. Its design features (trench gate topology, narrow switching cell, field-stop backside implant) are also widespread among many IGBT power devices, making this device a baseline of technological relevance and providing a certain level of genericity to the inventory model.
One limitation of this reference device is that it was launched in 2015, which limits its temporal relevance as of the date of publishing this study, especially in regards to the fast-evolving semiconductor environment. However, it should be emphasized that the reference IGBT device should only be considered as a technological baseline for the construction of the parametrizable manufacturing inventory. In that view, the inventory can be fine-tuned to match similar power devices by adding or subtracting selected sub-process steps (photolithography, implants) in the ‘process recap’ sheet of the inventory Excel file, thus making the inventory and the resulting environmental impacts adaptable to other silicon-based semiconductor devices.
Figure 3 provides a schematic view of the cross-section of the reference IGBT power device in both active and die edge areas. The device is assumed to be produced either on a Float Zone (FZ) N-type 200 mm diameter wafer or on a magnetic Czochralski (m-CZ) N-type 300 mm diameter wafer with sufficiently low levels of residual carbon and oxygen to be compatible with the production of this device. More details about the data used to model the production of the raw silicon wafer substrate are given in Section 2.5.1.
Figure 3.
Cross-section of the active (left) and the die edge (right) area of the IGBT power device used as reference for the construction of the parametrizable manufacturing inventory model.
The transistor gate topology is of trench type, with a width-over-depth aspect ratio of 1:5. The elementary switching cell of the transistor is composed of one active trench and one dummy trench connected to the gate potential separated by two dummy trenches connected to the emitter potential (see Figure 3). The switching cell pitch (from gate to gate) is in the 10 µm range, and the mesa width is in the submicron range. The high-quality gate oxide layer is thermally grown in a dry thermal oxidation furnace. All trenches are assumed to be filled with N-doped polysilicon (PolySi) through a low-pressure chemical vapor deposition (LP-CVD) process. On top of the trenches, an interlayer dielectric (ILD) oxide (SiO2) is deposited in a two-steps process composed of a first LP-CVD deposition step and a second plasma-enhanced CVD (PE-CVD) deposition step. The patterning of this ILD oxide layer is assumed to be carried out through dry etching.
The die topside metal contacts are composed of a thin titanium (Ti) metal liner deposited through physical vapor deposition (PVD) and a tungsten (W) metal layer and contact plugs, deposited through LP-CVD, dipping into the N+ and P+ topside implants to create the gate-emitter electrical contacts. A standard salicide process is employed to create intermetallics between the topside Ti metal liner and the P and N contact regions. The topside emitter contact pads are finished with a thick aluminum (Al)-based metallization deposited through PVD and metallurgically compatible with the Al ultrasonic wire-bonding process traditionally employed to interconnect IGBT power devices.
Along the wafer process flow, standard photolithography processes (spin-coating, UV exposure, post-exposure wet chemical development) are employed to pattern the wafer. The spin-coated photoresist (PR) is modeled as a combination of phenolic resin, hexamethyldisilazane (HMDS) as an adhesion promoter, and dipropylene glycol monomethyl ether (PGMEA) as a solvent. Given the minimum pattern dimension of the device of around 250 nm, UV exposure is assumed to be carried out using a KrF-line (248 nm) excimer UV-stepper. Post-exposure development is assumed to be carried out using a tetramethyl ammonium hydroxide (TMAH) alkaline developer. Complementary to those photolithography steps, a successive combination of dry (O2 plasma ashing) and wet (chemical stripping using Piranha etch) processes is assumed to be used to strip the PR and remove potential residues from the wafer after each photolithography step. The first dry stripping step allows to mitigate the dipping time of the wafers into the fast-consuming and expensive Piranha etch solution required to remove all PR residues from the wafer surface.
Die edge termination consists of P-implants guard rings associated with aluminum (Al) metal field plates. The definition of the die active area is carried out through the thermal growth of thick field oxide patterns on the die edge (local oxidation of silicon (LOCOS) process), creating insulating Si/SiO2 interfaces beneath the top silicon surface. A final ring of thick organic passivation, assumed to be photosensitive polyimide (PSPI), covers the die edge area. The target final thickness of the die is 70 µm. The processing of such ultrathin wafers poses challenges in terms of handling due to post-thinning wafer warpage and wafer breakage, which may severely impact the manufacturing yield. It therefore requires the use of a thick carrier bonded to the wafer before backside processing (back-grinding, spin-etching, ion implants, backside metal). This carrier is assumed to be a 1 mm thick glass wafer. The use of such carrier also involves additional wafer bonding and debonding process steps.
After thinning, a combination of backside chemical mechanical polishing (CMP) and chemical spin-etching is assumed to be carried out to release the mechanical stresses induced by back-grinding from wafer backside. The backside of the device is then processed with two successive ion implants: an N+-type as the field-stop backside implant and a P+-type as the collector backside implant. The thermal activation of backside implants and P-N junction is assumed to be carried out through laser annealing, which allows thermal compatibility of those processes with the front side-patterned wafer at this stage of the process flow.
The final wafer backside metallization consists of the successive stack of an aluminum (Al) layer allowing to form the backside ohmic contact, a titanium (Ti) metal liner, a nickel (Ni) diffusion barrier, and a final silver (Ag) wettability layer for die brazeability and compatibility with both standard tin (Sn)-based solder alloys and silver-sintering die-attach processes. All those backside metal layers are assumed to be deposited through physical vapor deposition (PVD). The die backside is connected to the collector potential.
After backside completion, the wafer is mounted onto a metal frame with dicing tape, and the singulation process is carried out through standard step-cut blade dicing. Wafer electrical probing is assumed to be carried out before wafer dicing and individual die electrical probing is assumed to be carried out after dicing through the known good die (KGD) process, which is standard when producing bare die automotive power devices.
The electrical field containment strategy consisting of the combination of the trench gate topology with a dummy trench approach to optimize the confinement of the electric field into the die with the N+ field-stop backside implant allows achievement of an ultrathin IGBT power device with a thinner N base while maintaining high electrical blocking voltage capability and lowering the contribution of the substrate to the overall thermal resistance of the device.
2.4. Inventory Model Structure
The inventory model allows the user to scale it to their own manufacturing use case by fine-tuning several ‘user input’ parameters that have a key influence on the environmental impacts of IGBT power device production:
- The final dimensions of the die and the width of the sawing streets;
- The wafer diameter;
- The manufacturing yield, which includes front-end yield, calculated by the model through the ‘killer’ defect density provided by the user, dicing yield, and probing yield, set as fixed values provided by the user;
- The wafer fab location, associated with a local electricity mix;
- The wafer fab monthly throughput, which conditions the wafer fab area and volume;
- The wafer fab ISO class (level of cleanliness), which conditions the air change rate;
- The abatement efficiency (or destruction removal efficiency), which conditions the ability of the production facility to abate fluorinated emissions (PFCs, HFCs, SF6);
- The wastewater recycling yield, which reflects the ability of the production facility to reuse wastewater on-site and reinject it in the production flow, thus reducing its emissions of wastewater out of the fab.
Figure 4 provides a view of the ‘user inputs’ sheet of the inventory Excel file of the PELCA IGBT designer tool:
Figure 4.
‘User inputs’ sheet of the manufacturing inventory Excel file of the PELCA IGBT designer tool, displaying the user input parameters (green boxes) and model outputs (grey boxes).
Assuming a linear relationship between die area and electrical current rating, the model allows, in a first approach, the inventory to be scaled to any value of current rating of fixed device technology by tuning the die size based on the surface current density of the reference IGBT (2.7 A/mm2). Nevertheless, the inventory model does not yet embed an accurate model of the relationship between the die voltage and current ratings; this improvement is planned to be implemented in the future.
The input and output exchanges of the different processes are calculated on a ‘per-wafer’ basis, and then scaled down to 1 cm2 of ‘good die’ (i.e., to a unit surface of IGBT power die considered to be electrically functional when exiting the wafer fab) by using a scaling factor (cm−2), which is expressed as
where is the usable wafer area (cm2), computed by the model based on the selected wafer diameter and associated edge exclusion width, and is the manufacturing yield (%), expressed as
with the front-end yield (%), indicating the probing yield (%) and indicating the dicing yield (%). Probing and dicing yields are inputs to be directly entered in the ‘user inputs’ sheet of the inventory Excel file by the user. The front-yield is computed by the model based on the wafer defect density indicated, and the front-end yield model is selected by the user. Based on Murphy’s triangular yield model, is for instance expressed as
where is the die area (cm2) and is the wafer defect density (cm−2) indicated by the user.
The scaling factor is inversely proportional to the product of the manufacturing yield and the usable wafer area . The scaling factor therefore tends to decrease when both wafer diameter and manufacturing yield increase. This approach based on the scaling factor allows scaling of the environmental impact () associated with the manufacturing inputs and outputs from a ‘per-wafer’ basis to a ‘cm2 of good die’ basis, taking into account the impact of yield, die size, and wafer diameter on the environmental impacts of the IGBT manufacturing process, through the following relationship:
with indicating the scaling factor (cm−2), indicating the environmental impact at the scale of one wafer, and indicating the environmental impact scaled down to 1 cm2 of good die.
The inventory also includes a model to calculate the die count (i.e., gross die, ) per wafer based on De Vries’ equation [31]:
where is the die area (mm2), is the wafer radius (mm), is an equivalent die dimension, and is a corrective factor equal to 0.51. The equivalent die dimension is given by
with and being the die size in the X and Y directions and and being the sawing street widths in the X and Y directions, respectively. The gross die count per wafer is used to calculate the impacts of die count-dependent wafer processing steps such as dicing and die electrical probing.
Finally, the manufacturing inventory includes a model to estimate the area and volume of the wafer fab based on the wafer throughput indicated by the user as the input parameter and on the type of process tools considered to produce the wafers [32]:
with indicating the area of the wafer fab (m2), indicating the hourly throughput of the fab, calculated based on the monthly throughput indicated by the user, indicating the total process time per wafer in tool , indicating the utilization rate of the tool (set by default to 75%), and indicating the surface footprint of the tool (m2). The surface footprint of each tool is estimated in the inventory file based on data that are publicly available regarding the type of equipment taken as reference for each sub-process step; the tool footprint aims at including both fab- and sub-fab-level footprints [33]. Since the number of tools for each sub-process step depends on the total processing time per wafer in tool , the steps able to process a large batch size require lower tool quantities compared to single-wafer process steps.
The fab area estimated based on Equation (7) is used to calculate the volume of the wafer fab (based on a default fab ceiling height of 5 m), which is then used to assess the impacts of the HVAC infrastructures used to maintain the cleanroom environment in terms of cleanliness (function of the input ISO class indicated by the user), temperature, and humidity. The estimated total number of process tools is also used as input information to assess the impacts of some of the utilities provided by the wafer fab facilities and infrastructures (see Section 2.5.3).
To summarize, Figure 5 provides an overview of the computation architecture of the manufacturing inventory model, showing the dependencies between the different inputs provided by the user and the outputs calculated by the model on that basis.
Figure 5.
Computation structure of the PELCA IGBT designer tool. The user inputs are indicated in the green boxes; the model outputs in the grey boxes.
2.5. Modeling of Processes and Infrastructures
2.5.1. Production of Raw Silicon Wafers
The modeling of the production of the raw silicon wafers used as substrates to produce the IGBT power devices is based on the work from Prakash et al. from Öko Institute [34], which provides a detailed input and output inventory of the production of 1 kg of 300 mm diameter, 775 µm thick, semiconductor-grade, sliced and polished silicon wafer through the magnetic Czochralski (m-CZ) ingot growth process. This inventory from Prakash et al. is based on previous studies from Williams et al. [3,4] and is also referenced in other studies [19,35]. This model to produce raw, semiconductor-grade, silicon wafer includes the following process steps:
- Reduction of quartz (SiO2) into crude silicon powders (98.5 to 99% pure) through a carbothermic process in air using a carbon electrode and forming carbon dioxide (CO2) as by-product;
- Reaction of crude silicon powders with hydrochloric acid (HCl) to form liquid trichlorosilane (SiHCl3) and further distillation to purify it;
- Reduction of the high-purity SiHCl3 in hydrogen (H2) atmosphere to form a high-purity polycrystalline silicon rod (99.9999% pure) (the two previous steps are usually described as the Siemens process);
- Conversion of the polycrystalline silicon rod into a monocrystalline silicon ingot through the m-CZ ingot growth crucible process;
- Ingot slicing into wafers (including kerf losses) using a diamond-wire saw;
- Wafer polishing down to standard 775 µm thickness and wafer cleaning.
In the inventory Excel file, the inputs and outputs of those process steps are translated into corresponding ecoinvent datasets and scaled down to one wafer based on the wafer diameter selected by the user and the associated wafer initial mass. This wafer-level inventory is then scaled down to 1 cm2 of good IGBT die based on the scaling factor, thus accounting for the manufacturing yield in the die-level impact assessment of the raw silicon wafer production.
In agreement with the allocation cut-off LCA methodology, the by-products of the raw silicon wafer production which could be reused, such as the polycrystalline silicon to produce solar cells or the silicon tetrachloride (SiCl4) for the chemical sector, are ignored as potential credits to the modelled wafer production activity.
This model of ‘raw Si wafer production’ is accurate but has one limitation: it describes the production of raw silicon wafers with a diameter up to 300 mm through the m-CZ ingot growth method but does not account for the alternative float zone (FZ) process. The FZ process is a crucible-free alternative ingot growth method leading to silicon wafers with higher purity compared to m-CZ wafers, but with wafer diameter capability currently limited to 200 mm. Given the levels of residual impurities (carbon and oxygen) and electrical resistivity required by power IGBTs, those devices are, up to now, still produced on ultrapure 200 mm diameter FZ-wafers.
The current version of the manufacturing model allows the user to choose among different wafer diameters (150 mm, 200 mm, and 300 mm) to simulate the impact of this parameter on the environmental impacts of the IGBT production process. While the m-CZ and FZ ingot growth methods share many of the process steps described above, those two ingot growth methods may have different energy intensities [36]. This aspect is not accounted for in the current version of the inventory model, which relies on a single model to describe the production of the raw silicon wafer substrate, whatever the chosen diameter. The user is thus invited to select the wafer diameter which best fits their manufacturing use case, keeping in mind that the impact assessment simulation is based on an m-CZ silicon wafer substrate. In addition, it is worth noticing that progress has been made on the potential large-scale production of high-voltage IGBT power devices on 300 mm m-CZ wafers [37], and that initiatives are on-going for the development of 300 mm diameter FZ-wafers for the production of power devices [38]. Based on the potential availability of accurate inventory data regarding those processes, the authors aim at enriching the IGBT manufacturing inventory model with more silicon ingot growth methods in the future.
2.5.2. Wafer Process Steps
The process breakdown structure of the IGBT power die and the models of the associated wafer process steps have been initiated through a teardown analysis of the device [30], consolidated based on literature sources [39,40,41,42,43,44,45,46,47,48,49,50,51], and finally peer-reviewed through technical exchanges and interviews with experts in power semiconductor manufacturing from CEA-Leti in France and Fraunhofer IISB in Germany. The wafer processing steps include both front-end of line (FEoL) and back-end of line (BEoL) process steps, with those two categories corresponding to process steps located before and after the deposition and patterning of the topside metal contacts of the wafer, respectively. Overall, the wafer process steps are discretized in a total of 12 categories:
- Photolithography;
- Wet clean;
- Wet etch;
- Dry etch;
- Ion implant;
- Thermal processes;
- Physical vapor deposition (PVD);
- Chemical vapor deposition (CVD);
- Chemical-mechanical polishing (CMP);
- Thinning;
- Dicing;
- Probing.
Figure 6 provides a schematic view of the model used in the inventory to describe the wafer process steps and their different input and output flows.
Figure 6.
Schematic view of the wafer process step model included in the IGBT manufacturing inventory.
Each wafer process step is modelled as the combination of a process tool, a process recipe, and point-of-use (PoU) complementary systems, such as vacuum pump, chiller, and abatement systems when needed. PoU abatement systems used to neutralize fluorinated gases are assumed to be microwave atmospheric plasma systems. This type of abatement technology is progressively replacing the traditional combustion-based type of installations, which consume hydrocarbon gas and generate emissions with significant environmental impacts [52]. The destruction removal efficiency (DRE) of the abatement systems is set by the user in the ‘user inputs’ sheet of the inventory Excel file, thus conditioning the final level of fluorinated gaseous emissions out of the wafer fab.
The process tool and its complementary PoU systems are fed with several inputs:
- External inputs procured at the wafer production site: electrical power based on the electricity mix associated with the selected wafer fab location, chemicals, and materials;
- Internal inputs provided by the on-site facilities and infrastructures of the wafer fab: ultrapure water (UPW), process-cooling water (PCW), utility and process nitrogen (N2), utility vacuum (VAC), and utility compressed dry air (CDA).
Test run wafers for process monitoring are ignored due to lack of data on that aspect. The impacts of the procured electricity to run the tool and PoU systems, the procured chemicals and materials needed to perform the process step, and the on-site production of UPW and N2 are allocated to each wafer process step category based on estimated consumption. The impacts of the other utilities (PCW, VAC, CDA) are allocated to the ‘cleanroom facilities and infrastructures’ activity, detailed in Section 2.5.3.
For the sake of model precision and to account for the diversity of processes mobilized to produce the IGBT power device, each of the wafer process categories includes several sub-process steps, based on analysis of the wafer process breakdown. The sub-process steps included in each process category are detailed in Table A1 in Appendix A, and the full process breakdown structure is available in the inventory Excel file available on the public GitHub repository. The inventory Excel file includes a dedicated model for each sub-process step in terms of process type, associated equipment, process recipe, associated inputs and outputs, batch size, and electrical power requirement.
Overall, the IGBT wafer manufacturing process flow includes 113 process steps and 11 photomask levels (including 9 at the FEoL level and 2 at the BEoL level). Figure 7 shows the number of process steps that account for each process category.
Figure 7.
Number of process steps per wafer process category.
Given that each photomask level is modeled as the combination of three sub-process steps (spin-coating of photoresist, UV exposure, and post-exposure development), the ‘photolithography’ category includes 33 process steps. One can also notice the relatively large number of ‘dry etch’ steps (16 in total), which includes not only the processing of the deep trenches in the silicon substrate, but also the opening of the silicon nitride (SiN) or silicon dioxide (SiO2) layers used as hard masks and the dry stripping (O2 plasma ashing) of the photoresist to remove residues from the wafer after each photomask level. Wet processes in the ‘wet etch’ and ‘wet clean’ categories include numerous sub-process steps to account for the variety of chemistries used to process the different types of materials involved. The ‘CVD’ and ‘PVD’ categories account for equivalent portions of the deposition process steps. The ‘CVD’ process category includes the LP-CVD and PE-CVD processes used to deposit SiO2 layers employed as interlayer dielectric (ILD), sacrificial hard masks for trench processing, or sacrificial scattering oxide for backside implants, but also to fill up the trenches with doped polysilicon (PolySi) and to deposit the tungsten (W) metal contact plugs and layer. PVD, on the other hand, is used to deposit the topside and backside metal layers (Ti, Ni, Al, Ag), with each deposited metal accounting for one process step. The ’thermal processes’ category includes dry and wet thermal oxidation steps used to grow scattering oxide layers and high-quality gate oxide, and for the thermal growth of the thick field oxide on die edge for active area definition (LOCOS process). It also includes rapid thermal annealing (RTA), furnace annealing, and laser annealing steps used for post-implant activation (PIA) and diffusion, ohmic contact creation, and metal layer structuring. Finally, the hard baking of the topside polyimide passivation is also included in this process category. The ‘CMP’ process category includes both dielectric and metal CMP used to planarize layers of silicon-based materials (PolySi, Si, SiO2) and W, respectively; this process category also includes, after each CMP step, a post-planarization wet brush scrubbing step for wafer decontamination. The ‘thinning’ process category includes wafer bonding to the wafer carrier and wafer back-grinding, while the ‘dicing’ process category includes wafer debonding and mounting on taped metal frame and blade dicing. Finally, the ‘probing’ process category gathers electrical probing step at both wafer-level (accounted for as one wafer probe test step before dicing) and die-level (Known Good Die (KGD) probing step after dicing).
The model therefore embeds a high level of granularity with the aim of being more representative of the actual IGBT wafer manufacturing process flow and increasing the level of confidence in the impact assessment results it leads to. This ‘bottom-up’ inventory approach with a large variety of modeled activities and a high level of data disaggregation also allows the user to modulate the manufacturing inventory by tuning the number of steps in each sub-process, thus not being limited to the process flow of the reference device. Finally, the open diffusion of the inventory, seen as a freely accessible tool box, allows any user to extract, reuse, and refine the sub-process step models to its own appreciation.
The electrical powers required by the wafer process tools and obtained in the frame of the technical interviews carried out in this study could only be nominal powers. Although those electrical power values are consistent, in the sense that they fit with actual production tools and have been validated by external manufacturing parties, they do not consist of actual input power measurements taken directly on the tools during execution of the process recipes. The sole use of those values in the inventory would lead to an overestimate of the electrical energy consumption of the wafer manufacturing process. To cope with this aspect, the authors have introduced a power correction factor (PCF) to be set by the user in the ‘process recap’ sheet of the inventory Excel file. This PCF is set to 2 by default and aims, based on the fixed nominal power values, to more accurately reflect the actual electrical power consumption of the wafer process steps. Also, for each wafer process step in the inventory, an ‘idle mode’ electrical input is accounted for in addition to the ‘process mode’ electrical consumption, with time shares between those two modes of 75% and 25%, respectively [51]. Finally, the electrical consumption of point-of-use (PoU) complementary systems, such as vacuum pumps, chillers, and abatement systems connected to the process tools, are also allocated to the different process steps they support.
2.5.3. Cleanroom Facilities and Infrastructures
Given the significant contribution of the cleanroom facilities and infrastructures to the environmental impacts of semiconductor fabrication, the authors have considered as relevant to include a ‘first approach’ wafer fab model in the IGBT manufacturing inventory, despite having no access to fab-level production data. Therefore, the wafer fab model is purely theoretical, based on a bottom-up data collection approach, and inspired by previous studies published in the literature [32,53,54,55]. Among those sources, Boakes et al. at IMEC have made significant contributions to modeling a large-scale wafer fabrication facility in the frame of the online impact assessment tool they developed and the associated documentation [32].
The model describing the cleanroom facilities and infrastructures includes the following items:
- Heating and venting air conditioning (HVAC) system, composed of three sub-elements: recirculation unit (RCU), make-up air unit (MAU), and exhausts (EXH) connected to all process tools;
- Wet scrubber (SCR), treating the abated gaseous emissions from the process tools and emitting scrubbed gaseous and liquid effluents;
- Ultrafiltration unit (UF), treating the particle-rich slurries emitted by the CMP, thinning and dicing process steps;
- Acid waste neutralization unit (AWN), treating the acid and caustic liquid emissions from wet etch, wet clean, photolithography, and post-CMP wet scrubbing steps;
- Wastewater treatment (WWT), collecting all wastewater drained from UF, AWN, SCR, UPW production, and PCW production and treating it before exiting the boundaries of the wafer fab system;
- Utilities networks: compressed dry air (CDA), vacuum (VAC), nitrogen (N2), process-cooling water (PCW), and ultrapure water (UPW); the impacts of N2 and UPW production being allocated to the wafer process steps based on their respective consumption of those utilities.
Figure 8 provides a schematic view of the model of cleanroom facilities and infrastructures and how their different components interact one with another and with the wafer process line.
Figure 8.
Schematic view of the cleanroom facilities and infrastructures model included in the IGBT manufacturing inventory. HVAC: Heating and venting air conditioning; RCU: recirculation unit; MAU: make-up air unit; EXH: exhaust; SCR: wet scrubber; UF: ultrafiltration unit; AWN: acid waste neutralization unit; WWT: wastewater treatment; CDA: utility compressed dry air; VAC: utility vacuum; N2: utility nitrogen; PCW: utility process-cooling water; UPW: ultrapure water.
The estimation of the electricity consumption of the different units composing the cleanroom facilities and infrastructures is based either on the selected corresponding dataset from the ecoinvent database or the generic energy conversion factors (ECFs) communicated by the SEMI international organization [56]. Although focusing only on electrical energy consumption, the ECFs provided by the SEMI standard are ready-to-use values consolidated between stakeholders of the semiconductor industry and constitute a relevant baseline to estimate the consumption of the wafer fab infrastructure.
Table A2 in Appendix A provides details on the hypotheses made regarding the different facilities and infrastructures included in the cleanroom model. The respective contributions of the different cleanroom units are calculated on the following basis:
- HVAC: based on the wafer fab ISO class selected by the user and on the estimated area and volume of the cleanroom, calculated based on the wafer throughput indicated by the user;
- SCR, UF, AWN, and WWT units: based on the volumes of emissions to be treated by the fab, based on the wafer throughput and wastewater recycling yield indicated by the user;
- N2 and UPW: based on the consumption of each wafer process step; the authors chose to allocate the impacts of the N2 and UPW on-site production and consumption to each of the ‘wafer process steps’ activity they feed rather than to the ‘cleanroom facilities and infrastructures’ activity;
- Other utilities (CDA, VAC, N2, PCW): based on the total number of process tools, estimated based on the wafer throughput indicated by the user and on the utility hypotheses detailed in Table A2.
3. Results
3.1. Contribution Analyses
The manufacturing model allows comprehensive contribution analysis by computing the respective share of each activity listed in the inventory to the 16 environmental impact categories assessed according to the PEF method. It is worth noting that the results communicated in this section aim at illustrating the different types of impact assessments and associated output graphs the inventory model can provide, rather than communicating fixed graphical outputs or definitive environmental impact values, which both strongly depend on the manufacturing hypotheses made by the user in the inventory model. For each graph presented, the manufacturing hypotheses made to compute the assessed environmental impacts are indicated in the figure caption.
First, it is interesting to consider the respective contribution of the production of the raw silicon wafer, of the wafer process steps, and of the cleanroom infrastructures and facilities to the 16 environmental impacts assessed. Figure 9 provides a view of those contributions in the form of a normalized bar graph.
Figure 9.
Normalized contribution analysis including ‘raw wafer production’ (dark blue), ‘wafer process steps’ (orange), and ‘cleanroom infrastructures and facilities’ (light green), according to the 16 impact categories of the PEF method. Calculation hypotheses: IGBT die size: 100 mm2, wafer diameter: 200 mm, wafer defect density: 0.1 cm−2, manufacturing yield: 83.8%, abatement efficiency: 95%, wastewater recycling yield: 50%, throughput: 100,000 wafers/month, ISO 4 wafer fab, located in Japan.
One visible result from this graphical output is the limited contribution of the raw wafer production process to the different environmental impacts assessed. A second remarkable result is the significant contribution of the cleanroom facilities and infrastructures to many different environmental impact categories, including human toxicity (HT and HTNC), acidification (TAP), terrestrial, freshwater, and marine eutrophication (TE, FE, and ME), ecotoxicity freshwater (FET), and fossil resource depletion (FD). A finer analysis of the elementary flows contributing to those impacts with the AB software showed that they are induced, first, by the amount of electrical energy required to operate the different cleanroom facilities and infrastructures and second, by the allocation to the ‘cleanroom facilities and infrastructures’ activity of the wastes and treatment of wastes generated in the frame of the IGBT production process which were not allocated to individual wafer process steps.
As the wafer fab is located in Japan in this example, the electricity mix feeding the production site heavily relies on fossil resources such as oil, natural gas, and hard coal, which leads to significant environmental impacts in several categories [57]. On the other hand, the collection and subsequent treatment of wastewaters generated during wafer production is shown to have strong environmental impacts in the eutrophication (terrestrial (TE), freshwater (FE), and marine (ME)), ecotoxicity (FET), and human toxicity (HT, HTNC) categories.
As a complement, it is also possible, using the inventory model, to plot the respective contributions of those three major activity blocks to the total amount of electrical energy required to produce one IGBT wafer and 1 cm2 of IGBT good die, with respect to the different wafer diameter selected by the user, as shown in Figure 10.
Figure 10.
Respective contribution of ‘raw wafer production’ (dark blue), ‘wafer process steps’ (orange), and ‘cleanroom facilities and infrastructures’ (light green) to the total electrical energy input for wafer diameters of 150 mm, 200 mm, and 300 mm: (a) per wafer; (b) per cm2 of good die. Calculation hypotheses: IGBT die size: 100 mm2, wafer defect density: 0.1 cm−2, manufacturing yield: 83.8%, abatement efficiency: 95%, wastewater recycling yield: 50%, throughput: 100,000 wafers/month, ISO 4 wafer fab, located in Japan.
The above electrical energy breakdown structure is available in the IGBT manufacturing inventory Excel file in the form of a dedicated ‘bill-of-energy’ (BoE) sheet. Those values are also compared to other similar published results in Section 4. One can notice from Figure 10 the significant amount of electrical energy required by the IGBT manufacturing process (e.g., 497.1 kWh/wafer to produce the targeted IGBT device on 200 mm diameter wafers, with the manufacturing hypotheses indicated in the figure caption). Figure 10 also shows different trends in the evolution of the electrical input required by the production process as a function of wafer diameter. When considering wafer-based electricity consumption, the absolute contributions of all three categories tend to increase with increasing wafer diameter. This is because the production and processing of larger wafers is more energy-intensive. The energy required to produce larger raw silicon wafers (in dark blue) through the m-CZ ingot growth process increases with increasing wafer mass and diameter. Similarly, the contribution of the wafer processing steps (in orange) tends to increase with wafer diameter. Indeed, the material and energy intensity of several process steps are either wafer diameter-dependent (wet etch, wet clean, photolithography, PVD, wafer thinning and planarization) or die count per wafer-dependent (wafer dicing, wafer probing). Finally, the energy contribution required by the cleanroom environment (in light green) also increases with increasing wafer diameter, since the model takes into account, to a certain extent, the fact that the footprint of the process tools increases with increasing wafer diameter, which leads to an increase in wafer fab area and volume to be maintained in conditions of operation.
On the other hand, those trends are logically inverted when considering the die level electricity consumption metrics, since the die count allowed per wafer increases with increasing wafer diameter and therefore offsets the increased electricity budget of higher wafer diameters. The respective energy contributions of the raw wafer production, wafer processing steps, and cleanroom environment per cm2 of ‘good die’ therefore diminishes along with the increase in wafer substrate diameter.
Similar trends, at both the wafer and die levels, are observed when considering the environmental impacts. As an example, the respective share of raw wafer production, wafer processing steps, and cleanroom environment to the GWP impact of IGBT manufacturing is plotted in Figure 11 below and shows the major impact of an increase in wafer diameter on the climate change impact of the cradle-to-gate IGBT production process at constant production volume.
Figure 11.
Respective contribution of ‘raw wafer production’ (dark blue), ‘wafer process steps’ (orange), and ‘cleanroom facilities and infrastructures’ (light green) to the climate change (GWP) impact for wafer diameters of 150 mm, 200 mm, and 300 mm: (a) per wafer; (b) per cm2 of good die. Calculation hypotheses: IGBT die size: 100 mm2, wafer defect density: 0.1 cm−2, manufacturing yield: 83.8%, abatement efficiency: 95%, wastewater recycling yield: 50%, throughput: 100,000 wafers/month, ISO 4 wafer fab, located in Japan.
The above GWP results show that, based on how the manufacturing inventory model is constructed, and especially the scaling factor linking the impacts at the wafer level and the good die level, the climate change impact of the IGBT power die is significantly reduced by an increase in wafer diameter. Switching from 200 mm to 300 mm wafer substrates leads to an increase in GWP impact per wafer of about 22% (from 674 kg CO2 eq./wafer to 826 kg CO2 eq./wafer) but a decrease in GWP impact per cm2 of 50% (from 2.89 kg CO2 eq./cm2 to 1.45 kg CO2 eq./cm2). It can also be seen from Figure 11 that the wafer process steps represent the major part of the overall GWP impact of the IGBT production process, whatever the wafer diameter. This is explained by the allocation to each ‘wafer process step’ category of its respective input consumptions (chemicals, materials, electricity) and respective output emissions and associated treatment activities.
Secondly, it is interesting to focus on the wafer process steps and to analyze the respective contributions of the different process categories to the 16 environmental impacts assessed, as shown in Figure 12. Several observations can be drawn from this output bar graph. The dry etch process category has a significant impact on many impact categories, including global warming potential (GWP), ozone depletion (OD), and human toxicity (HT and HTNC). Those major contributions from dry etch originate from the large number of dry etching process steps (16 in total) involved in the wafer process flow to etch Si, SiN, and SiO2 materials, but also for dry stripping of the organic photoresist (PR) as a complement to wet stripping for PR removal. Apart from the PR dry stripping, which is modeled as an oxygen (O2)-based plasma ashing process, all other dry etching steps have been modeled as being based on fluorinated chemistry (including sulfur hexafluoride (SF6) and trichloromethane (CHF3) gases). The level of post-process abated emissions from the dry etching steps is conditioned by the abatement efficiency indicated by the user in the ‘user inputs’ sheet of the inventory Excel file. Therefore, the impacts of dry etch induced by the use of fluorinated gases originate from the production and procurement of those gases, but also from the level of residual unabated fluorinated emissions out of the wafer fab and allocated to this process category. The impacts of dry etch are also due to the significant amount of electrical power required by those tools (see Figure 13), which is exacerbated by the fact that dry etching steps are single-wafer process steps, which tend to increase the impacts at both wafer and die scales.
Figure 12.
Normalized contribution analysis of the different ‘wafer process steps’ listed in the manufacturing inventory according to the 16 impact categories of the PEF method. Calculation hypotheses: IGBT die size: 100 mm2, wafer diameter: 200 mm, wafer defect density: 0.1 cm−2, manufacturing yield: 83.8%, abatement efficiency: 95%, wastewater recycling yield: 50%, throughput: 100,000 wafers/month, ISO 4 wafer fab, located in Japan.
Figure 13.
Electrical input breakdown of the wafer process steps showing the respective contribution of each wafer process category to the overall electrical energy input.
Wet process steps including wet etch, CMP, wafer thinning, and wafer dicing represent a limited share of the total electrical power consumption but are observed to have a major impact in the eutrophication, freshwater (FE) category due to the extensive use of ultrapure water (UPW) that they require. The ecoinvent dataset used to model UPW production (see Table A2) includes a certain production yield and numerous material- and energy-intensive purification process steps, leading to significant impact in this category.
The wet etch process steps also have a significant environmental impact in the ecotoxicity, freshwater (FET) category due to the production and use of various acids and caustics in the frame of the IGBT production process. Especially, the production and use of dimethyl sulfoxide (DMSO) for the wet stripping of the topside metals during the lift-off process step appears to be impactful. It should also be noted that the wet etch and wet clean process steps carried out in dip wet benches have been modeled to account for a renewal of each tank content after 150 wafers have been processed, to be more representative of the procedures in the semiconductor industry.
The PVD deposition steps have a major impact on the mineral resource depletion (MRD) category. Analysis of the associated reference flows demonstrates the overwhelming impact of the thin silver (Ag) layer deposited on the wafer backside as a brazeability layer for further die-attach processes. The severe impacts of the extraction and production of noble, high-purity metals such as silver (Ag), gold (Au), or platinum (Pt) is well documented [58]. In addition to the dominating environmental impacts of the extraction phases (mining and refinement) for raw materials used to produce high-purity PVD targets, the impacts of the PVD deposition process steps are further degraded by the poor material deposition efficiency (MDE) of the sputtering PVD deposition process (set to 5% in the inventory, see Table A1) due to its poor selectivity, to the limited use of the metal targets (usually discarded when reaching 50% of their total thickness to prevent non-uniformity of the metal deposits), and to the low collection and recovery rates of the raw metals sputtered on the walls of the PVD chamber. Those key aspects of PVD impacts have also been pointed out by Vauche et al. [22]. A key lever to reduce MRD environmental impacts is thus optimizing precious material deposition efficiency and recovery during and after PVD.
Photolithography and thermal processes tend to make similar contributions to the different impact categories, which originate from their significant share of the total electrical power consumption required by the IGBT production process, as shown in Figure 13. This result highlights the key importance of the composition of the electricity mix feeding the production facility and its level of dependency on fossil resources (see also Section 3.2.3). It should also be mentioned that the spin-coating and post-exposure development process steps generate large amounts of solid (spin-coating sludge) and liquid (developer and solvent mixture) waste, of which treatment and disposal are allocated to the ‘photolithography’ category.
The impacts of CVD process steps, despite being an energy-intensive process category, are mitigated by their lower electrical power input requirements and the ability of LP-CVD to process large batch sizes (see Table A1), which tends to mitigate its impacts per wafer and per die. Nevertheless, the impact of CVD process steps on water depletion (WD) is noticeable, due to the production and use of gaseous precursors such as silicon tetrahydride (SiH4) and tungsten hexafluoride (WF6) or cleaning gas such as nitrogen trifluoride (NF3) used to clean the chamber after each PE-CVD deposition step.
On the other hand, it is observed from this contribution analysis that process steps such as the wet clean, thinning, dicing, and probing steps appear to have limited environmental impact in all of the assessed categories thanks to their limited number of iterations and their limited use of chemicals (for thinning, dicing, and probing) or to the large number of wafers processed per iteration (for wet clean).
3.2. Sensitivity Analyses
Complementary to contribution analyses, it is possible to use the inventory model to carry out sensitivity analyses to investigate the effect of different parameters on the environmental impact assessment results. Such complementary sensitivity analysis is recommended in the frame of LCA studies to identify the parameters with the highest influence on the results and capture the most relevant levers to reduce the impacts.
3.2.1. Impact of Die Size and Wafer Diameter at Constant Wafer Defect Density
Figure 14 shows the result of a sensitivity analysis focusing on the impact of the die size (mm2) at a fixed wafer defect density (0.1 cm−2) on the climate change impact per cm2 of good die (GWP, kg CO2 eq./cm2) and on the manufacturing yield (%) of the modeled IGBT production process, aggregating the ‘raw wafer production’, ‘wafer process steps’, and ‘cleanroom facilities and infrastructures’ activities.
Figure 14.
Plot showing the influence of die size on the climate change (GWP) impact per cm2 of good die and on the manufacturing yield of the IGBT production process for 150 mm (red line), 200 mm (orange line), and 300 mm diameter (blue line) wafers at a fixed defect density. Calculation hypotheses: IGBT die size: 1–400 mm2, wafer defect density: 0.1 cm−2, abatement efficiency: 95%, wastewater recycling yield: 50%, throughput: 100,000 wafers/month, ISO 4 wafer fab, located in Japan.
Similar to Figure 11, which showed the wafer- and die-level climate change impact breakdown of the IGBT manufacturing process for different wafer diameters, Figure 14 highlights the major influence of wafer diameter on the assessed GWP impact. At equivalent production volume and wafer defect density, the increase in wafer diameter significantly reduces the environmental impact per cm2 of good die thanks to the higher die count per wafer allowed by larger wafers.
The GWP impact increases for die sizes below 10 mm2, reaches an optimum low GWP value when the die size is 25 mm2, and then increases again with die sizes up to 400 mm2. The increase in climate change impact at die sizes below 10 mm2 can be explained by the higher electrical energy demand, at low die size, of die count-dependent wafer process steps such as dicing and die-level probing. On the other hand, the increase in GWP impact after the optimum low value can be explained by the degradation of the manufacturing yield with increasing die size at constant wafer defect density, thus leading to an increase in the scaling factor (note: probing () and dicing () yields are set as fixed values; only the front-end yield () varies with respect to the wafer defect density). The slope of this increase in climate change impact with respect to die area is less pronounced as wafer diameter increases. This is due to the higher GWP impact per cm2 of good die, at fixed die size, induced by smaller wafer diameter (see Figure 11). Thus, the sensitivity of the climate change impact to die size increases as wafer diameter decreases.
Finally, it should be highlighted again that the trends of GWP impact evolution with die area displayed in Figure 14 strongly depend on the manufacturing hypotheses made by the user in terms of wafer defect density (see Section 3.2.2), wafer fab location, and associated electricity mix (see Section 3.2.3).
3.2.2. Impact of Wafer Defect Density and Wafer Diameter at Constant Die Size
Figure 15 shows the results of a sensitivity analysis focusing on the impact of the wafer defect density (cm−2) at a fixed die size (100 mm2) on the climate change impact per cm2 of good die (GWP, kg CO2 eq./cm2) and on the manufacturing yield (%) of the modeled IGBT production process.
Figure 15.
Plot showing the influence of wafer defect density (cm−2) on the climate change (GWP) impact per cm2 of good die and on the manufacturing yield of the IGBT production process for wafers with diameter of 150 mm (red line), 200 mm (orange line), and 300 mm (blue line) at a fixed die size. Calculation hypotheses: IGBT die size: 100 mm2, wafer defect density: 0.01–1 cm−2, abatement efficiency: 95%, wastewater recycling yield: 50%, throughput: 100,000 wafers/month, ISO 4 wafer fab, located in Japan.
Based on Murphy’s model, the front-end and resulting overall manufacturing yields severely decrease when the wafer defect density goes beyond 0.25 cm−2, leading to manufacturing yield values below 70% and significantly increasing the GWP environmental impact per cm2 of good die. This complementary analysis shows that, similarly to its sensitivity to die area, the sensitivity of the climate change impact to wafer defect density decreases as wafer diameter increases due to the higher GWP impact per cm2 of good die, at fixed wafer defect density, induced by smaller wafer diameter (see Figure 11). The ability of a power device manufacturer to accurately control its production process, minimize wafer defect density, and maximize yield is therefore a key aspect to mitigate the environmental impacts.
3.2.3. Impact of Wafer Fab Location and Associated Electricity Mix
Due to the significant share of electrical energy consumption on the environmental impacts of semiconductor fabrication, it is worth investigating the impact of the wafer fab location and of the associated local electricity mix on the impact assessment results. In the ‘user inputs’ sheet of the inventory Excel file, the user can choose from different wafer fab locations, including global {GLO}, Europe without Switzerland {RER}, Japan {JP}, China {CN}, United States {US}, and Switzerland {CH}. The selection of one location by the user automatically parametrizes the inventory with the associated electricity mix from the ecoinvent database for all activities listed in the inventory (i.e., the electrical energy source is assumed to be the same to produce the raw silicon wafers, to carry out the wafer processing steps, and to feed the cleanroom facilities and infrastructures). For locations such as {GLO}, {RER}, {US}, and {CN} that include many different geographical entities (regions or states) with potentially different electricity mixes, the ecoinvent database proposes ready-to-use datasets corresponding to an average electricity mix (labeled as ‘market group for electricity’).
Figure 16 shows a radar chart displaying the assessed environmental impacts of IGBT wafer production with a facility located in different geographical areas and impacts normalized with respect to the global {GLO} dataset, viewed here as a worldwide average electricity mix.
Figure 16.
Normalized radar chart showing the influence of the wafer fab location and associated electricity mix on the 16 environmental impact categories of the PEF method. Calculation hypotheses: IGBT die size: 100 mm2, wafer diameter: 200 mm, defect density: 0.1 cm−2, manufacturing yield: 83.8%, abatement efficiency: 95%, wastewater recycling yield: 50%, throughput: 100,000 wafers/month, ISO 4 wafer fab.
One first remarkable result is the wide spread of the environmental footprint of the IGBT manufacturing process depending on the selected geographical location of the wafer fab. While a facility located in Switzerland will have the lowest environmental impact in all categories except ‘water use’, due to the large amount of hydropower included in its electrical mix, the same production process carried out in China, in the US, or in Japan will exhibit significantly higher impact in other categories, given the composition of their electricity mixes [59].
A second noticeable result is that the electricity mix feeding the wafer fab induce transfer of impacts between categories. This is illustrated by the European (RER) and US electricity mixes, which include a significant portion of nuclear electrical power, leading to higher impacts in the ‘ionizing radiation’ (IR) category in comparison, for instance, with the Chinese (CN) electricity mix, heavily relying on fossil energy sources and therefore strongly impacting the ‘particulate matter formation’ (PMF), ‘photochemical ozone formation’ (POF), ‘terrestrial eutrophication’ (TE), and ‘acidification’ (TAP) categories. The transfer of impact between categories induced by the electricity mix of a wafer fab located in France had also been pointed out by Vauche et al. [22].
Overall, this analysis of model sensitivity towards wafer fab location tends to highlight the primary importance for the energy-intensive semiconductor sector to have access to renewable energy sources to significantly reduce its environmental impacts. It also highlights the necessity, for a rigorous impact assessment of the semiconductor production process, to investigate environmental impacts beyond the sole focus on climate change (GWP) to account for potential transfer of impacts between categories.
3.2.4. Normalization with Respect to Planetary Limits
Based on the results provided by the IGBT manufacturing inventory model, it is also possible to investigate the relative contribution of each of the 16 impact categories assessed with respect to the planetary limits, as per defined by the International Panel on Climate Change (IPCC) and recommended by the JRC [57,60,61]. This approach establishes, for each of the 16 environmental impact categories of the PEF method, normalization factors and weighting factors, allowing the environmental impacts of the IGBT manufacturing process to be scaled with respect to peer-reviewed planetary bounds. Such analysis can be a complement of interest to identify the most prominent environmental impact categories of a product or a process. As a preliminary disclaimer, it should be stated that using normalization methods to establish rankings among environmental impact categories is subject to ethical choices and is a fundamental limitation of such an approach. In fact, in the present example, it is difficult to justify objectively that environmental impact ratios for a product should be the same as planetary limits, and on the other hand, it is not straightforward that the consequences of changing impact ratios at a functional unit level are the same as at the global scale. To prevent any potential conflict of interpretation, only the normalization factors have been used to analyze the relative contributions of the 16 environmental impact categories of the IGBT manufacturing process with respect to the estimated planetary limits, thus leaving aside the weighting factors proposed by the JRC. This analysis is shown in Figure 17.
Figure 17.
Bar chart showing the normalized relative contributions of the 16 environmental impact categories of the PEF method with respect to planetary limits. Calculation hypotheses: IGBT die size: 100 mm2, wafer diameter: 200 mm, wafer defect density: 0.1 cm−2, manufacturing yield: 83.8%, throughput: 100,000 wafers/month, abatement efficiency: 95%, wastewater recycling yield: 50%, ISO 4 wafer fab, located in Japan.
Complementary to the conclusions of the previous section, a straightforward observation that can be drawn from Figure 17 is that climate change (GWP), with a share of 30.2%, is only one of the many environmental categories with a significant impact with respect to the estimated planetary limits. Land use (LU, 31.7%), particulate matter formation (PMF, 5.3%), freshwater eutrophication (FE, 6%), ecotoxicity (FET, 9.7%), mineral resource depletion (MRD, 4.1%), and fossil resource depletion (FD, 8.1%) are also non-negligible contributions to the environmental impacts of the IGBT semiconductor manufacturing process. This key observation tends to question the approach followed by many actors from the semiconductor industry that consist of focusing mostly on the climate change impact category to identify levers for environmental impact reduction. Figure 17 clearly shows that a sole focus on GWP impact ignores many other important environmental impact categories. The impacts of semiconductor fabrication on soil quality (LU), human health (PMF), freshwater (FE, FET), and fossil and mineral resource depletion (FD, MRD) cannot be ignored and should therefore be included in the frame of a rigorous impact assessment of this industrial sector.
3.3. Uncertainty Analysis
Given the lack of consolidated production data available to the authors, construction of the proposed manufacturing inventory model relies on teardown construction analysis, literature references, and technical interviews with external experts in semiconductor fabrication. In this frame, it is important to carry out an uncertainty analysis to better understand how the potential inaccuracies of the datasets and proxies used and of the hypotheses made to model the different activities of the manufacturing process propagate and influence the assessed environmental impacts.
The Python/Brightway framework enables such uncertainty analysis through Monte Carlo simulations. The methodology for this analysis is based on the pedigree matrix approach developed by Weidema et al. [62], which consists in setting, for each datapoint and based on the judgement of the LCA practitioner, data quality indicators on a scale from 1 (best) to 5 (worst) in different categories: reliability (R), completeness (C), temporal correlation (T), geographical correlation (G), and further technological correlation (F). Those indicators then translate into parameters (standard deviations, scale) of the distribution used to model the uncertainty. In this study, as in the ecoinvent database, the lognormal probability distribution is the preferred statistical function to model data uncertainty. The lognormal distribution is therefore applied to all the datapoints included in the manufacturing inventory. The data quality indicators set for each datapoint then allow propagation of their respective levels of uncertainty to global impact assessment of the whole inventory.
Table 1 gathers the data quality indicators set by the authors for the three major activities of the manufacturing inventory: ‘raw wafer production’, ‘wafer process steps’, and ‘cleanroom facilities and infrastructures’. Those respective data quality indicators apply to each datapoint included in the manufacturing inventory, being either technosphere or biosphere flows. The uncertainty levels have been fixed based on the sources of the different datapoints and on their consolidation or not with experts.
Table 1.
Data quality indicators used for ‘raw wafer production’, ‘wafer process steps’, and ‘cleanroom facilities and infrastructures’.
It can be observed that the datapoints from the ‘wafer process steps’ category exhibit the lowest geometric standard deviation (GSD) value, since those points have been the most discussed with technical experts. Nevertheless, their levels of reliability and completeness have been conservatively set to four in order to account for the uncertainties inherent to the hypotheses made in their modeling, some of which could not be confirmed by external parties. The datapoints from the ‘raw wafer production’ category are assumed to be technologically representative but with limited reliability, completeness, and temporal correlation due to the limited scope and number of studies on which is based the modelling of the raw silicon wafer production process. Finally, the datapoints from the ‘cleanroom facilities and infrastructures’ category exhibit the lowest score in all categories due to their high level of uncertainty induced by the lack of access to actual production data and limited consolidation by external experts.
Based on those uncertainty indicators, statistical impact assessment results were generated using the activity browser software. Figure 18 shows the stochastic impact assessment results obtained after 5000 Monte Carlo iterations in different environmental categories (climate change (GWP), water depletion (WD), mineral resource depletion (MRD), particulate matter formation (PMF)).
Figure 18.
Statistical assessment of environmental impacts (GWP, WD, MRD, PMF) of the IGBT manufacturing process based on Monte Carlo simulations (5000 iterations). Calculation hypotheses: IGBT die size: 100 mm2, wafer diameter: 200 mm, wafer defect density: 0.1 cm−2, manufacturing yield: 83.8%, throughput: 100,000 wafers/month, abatement efficiency: 95%, wastewater recycling yield: 50%, ISO 4 wafer fab, located in Japan.
The analysis shows that the data uncertainty inherent to the inventory model tends to induce non-negligible variability in the environmental impacts assessed, with GWP, WD, MRD, and PMF impacts ranging from 2.5 to 4 kg CO2 eq./cm2, 0.44 to 0.75 m3 world eq./cm2, 1 10−5 to 1.6 10−5 kg Sb eq./cm2, and 3.1 10−8 to 1.8 10−7, respectively.
This statistical impact assessment approach, despite being based on arbitrary, and therefore questionable, settings of data quality indicators, provides a valuable complement to the standard deterministic impact assessment methodology by accounting for the data uncertainty and the approximations inherent to any model of inventory. The consolidation of the datapoints through additional referencing, peer reviews, and feedback from potential users of the model should allow improvement of the data quality indicators, thus narrowing the distribution of the assessed environmental impacts.
4. Discussion
To further interpret the published IGBT manufacturing model from the perspective of other studies, it is interesting to compare this study with other works published on the environmental impact of power semiconductor fabrication.
Table 2 shows a non-exhaustive list of LCA studies recently published on this topic, along with their main features in terms of target semiconductor devices, scope, database and impact assessment software used (when relevant), considered environmental impacts, and approach for inventory construction of data collection. In addition, the public accessibility and parametrizability of the inventory, when existing, are indicated.
Table 2.
Comparative overview of different LCA studies investigating the environmental impacts of the production of semiconductor power devices.
Two of those studies (Musil et al. [19], Radwan et al. [21]), whose primary focus is the power module level, tend to rely on generic datasets from environmental databases to compute the impacts of the power semiconductors. This use of potentially non-adapted datasets may affect the level of confidence in the assessed impact results, especially given the significant share of bare die semiconductors in the overall environmental impacts of power modules [11]. Moreover, this approach, when aiming to reduce the environmental impacts of power semiconductor manufacturing, leads to an insufficient level of model refinement, which prevents any analysis at the level of wafer processing steps.
On the other hand, Spejo et al. [20], who also focus on the power module level, based their electrical requirement assessment strategy of power semiconductors on a top-down data collection approach from an actual wafer production facility, which tends to significantly increase the levels of relevance of the results obtained. Nevertheless, this top-down data collection approach still lacks disaggregation, which hinders the ability to precisely identify the most impactful hotspots of power die fabrication.
Wang et al. [63], interestingly, computed top-down data from the publicly-available environmental statements of a large number of semiconductor companies, which provides valuable points of comparison from actual wafer fabrication facilities, but here again the level of data aggregation is high (multiple manufacturers, multiple products, multiple production locations).
Finally, only Vauche et al. [22], who focused on the bare die and packaged die levels, built a custom-made manufacturing inventory fitting the device they targeted. They relied on an R&D-scale wafer fabrication facility and on a hybrid top-down and bottom-up data collection approach including actual production data, which tends to increase the level of confidence in the assessed impact results, but did not publish the associated detailed manufacturing inventory. In addition, it is the only listed study which relies on the PEF method, including 16 midpoints environmental impact categories, while the other listed studies focus primarily on the climate change impact (GWP), thus neglecting a large fraction of the environmental spectrum.
Overall, none of the listed studies provide a publicly available power device manufacturing inventory that could be reused by external parties to check environmental impact values, identify environmental hotspots, or adapt the inventory to other semiconductor technologies. Finally, to the authors’ knowledge, a detailed, parametrizable, and freely accessible manufacturing inventory dedicated to IGBT power device has never been published to date.
Despite the discrepancies in the methods and approaches of the different studies listed, it is worth taking a comparative look at some of the impact assessment figures they provide. Table 3 allows comparison of values of environmental impacts per die area (GWP, kg CO2 eq./cm2; MRD, kg Sb eq./cm2) and electrical requirement values per die area (kWh/cm2) of silicon-based power transistor production from the listed works with those obtained from the inventory published in this study. For each study, the covered scope may include raw wafer production (‘Raw wf.’), wafer process steps (‘Wf proc.’), and cleanroom facilities and infrastructures (‘Clnr’).
Table 3.
Comparison of selected environmental impacts (GWP, kg CO2 eq./cm2; MRD, kg Sb eq./cm2; WD, m3 world eq./cm2) and electrical requirements values (kWh/cm2) from different studies investigating the production of silicon IGBT power devices. For each study, the covered scope may include (X) or not (-) raw wafer production (‘Raw wf.’), wafer process steps (‘Wf proc.’), and cleanroom facilities and infrastructures (‘Clnr’).
A first observation that can be drawn from this table is that the GWP impact values and electrical requirements values from the different studies are of the same order of magnitude. It is no surprise that the GWP impact and electrical requirement values for the production of the raw silicon wafer are all in the same range, since all listed studies in the scope of which it is included rely on similar literature sources [34]. Regarding that aspect, care should be taken by the community to try to diversify its data sources to consolidate assessment of the environmental impact of a key step such as the production of high-purity semiconductor-grade wafer substrate, and it is worth noting that efforts in that sense are on-going [64].
It is also worth taking a closer look at the values provided by Vauche et al. [22]. This work differs from the published study in many ways: target power device and associated wafer process flow, data collection approach, environmental database used, and access of the authors to actual production data. However, it shares with the authors’ work a similar approach of building a custom and refined manufacturing inventory dedicated to a specifically targeted semiconductor power device.
For the production of GaN-on-Si HEMT transistors on 200 mm diameter wafers, in a low-scale wafer fab, with a global {GLO} electricity mix and 75% manufacturing yield, Vauche et al. [22] estimated the GWP impact per die area to be 3.92 kg CO2 eq./cm2 and the electricity consumption of the wafer processing steps and cleanroom combined to be 2 kWh/cm2. The model published in this study leads to a GWP impact value of 2.62 kg CO2 eq./cm2 and an electricity consumption value of 1.65 kWh/cm2 for production of the targeted Si IGBT device on 200 mm diameter wafers using a global {GLO} electricity mix in a large-scale wafer fab with an 83.8% manufacturing yield. Additionally, Vauche et al. [22] also assessed the impact of their production on 15 other midpoint indicators, including mineral and resource depletion (MRD, kg Sb eq.) and water resource depletion (WD, m3 world eq.). Regarding those indicators as well, the impacts assessed by both studies are in the same range (WD impact: 0.60 m3 world eq./cm2 (this study) vs. 0.58 m3 world eq./cm2; MRD impact: 1.19 × 10⁻⁵ kg Sb eq./cm2 (this study) vs. 3.05 × 10⁻⁵ kg Sb eq./cm2). It should be noted that the GaN-on-Si device targeted in the study by Vauche et al. embeds a gold (Au) backside metallization layer, which severely impacts the MRD category for the GaN-on-Si device.
Those values tend to show consistency in the methodology consisting of building up a tailor-made manufacturing inventory fitting the exact process flow of the targeted semiconductor device and using the PEF method to assess the environmental impacts of its production.
However, the proximity between the electrical requirement values published by both studies also tends to suggest that the values published in our study (which assumes a large-scale production facility), despite the introduction of a power correction factor to adjust the nominal powers of the process tools, may be overestimated, since a low-scale production facility tends to demand more energy per area of product due to its lower volume of wafer production. Moreover, the production of GaN-on-Si transistors requires an additional epitaxy process step, which tends to worsen the electrical requirement of such production. The aggregated electrical requirement values published by Wang et al. (1.15 kWh/cm2, including all type of energy sources) and Spejo et al. (who assessed 1.91 kWh/cm2 to produce IGBTs on 150 mm diameter wafers in a large-scale facility with 95% manufacturing yield, compared to 2.90 kWh/cm2 to produce IGBTs on 150 mm diameter wafers in a large-scale facility with 83.8% manufacturing yield assessed by this study) also tend to emphasize that aspect of the published inventory model, which should therefore be improved. The best way to cope with this matter of electrical power requirements is to have access to direct online power measurements of the production process tools.
Finally, the GWP impact value published by Wang et al., averaged based on the environmental statements of multiple large-scale manufacturers and based on the IPCC methodology (including scope 1 (direct) and scope 2 (indirect) greenhouse gas emissions), is the lowest of all the listed studies (0.84 kg CO2 eq./cm2). Despite the low level of disaggregation of this value, which combines multiple semiconductor products, one can notice that it is more than three times lower than the GWP impact value provided by the published model in similar manufacturing conditions (large scale facility, high manufacturing yield) and based on the PEF method (2.62 kg CO2 eq./cm2). This tends to highlight significant discrepancies between those two methods in terms of GWP impact assessment and indicates that the choice of an impact assessment method by an industrial actor may induce minimization of the actual impacts of its activities on the environment.
5. Conclusions
The cradle-to-gate silicon IGBT manufacturing inventory model published in this study attempts to provide an open-source contribution to the field of life cycle assessment (LCA) of semiconductor power devices. The model was built based on an in-depth analysis of the wafer process flow of an ultrathin micropattern trench field-stop IGBT power device, identified as a target of technological relevance with sufficient representativeness to be useful to other LCA practitioners aiming to assess the impacts of IGBT technology. Despite being based on a single device technology, the model is fine-tunable through several parameters that have a key influence on the environmental impacts of the manufacturing process, including die size, wafer diameter, manufacturing yield, wafer fab ISO class, wafer fab throughput, abatement efficiency, wafer fab location and the associated electricity mix. Its software architecture is based on a simple Excel file as inventory and a Python script relying on the open-source Brightway library to assess the environmental impact according to 16 midpoint indicators of the PEF method, allowing the user to go beyond a sole focus on climate change impact and providing a broader picture of the ecological footprint of power device fabrication. The PELCA IGBT designer tool also provides access to a broad range of output figures and graphic visualizations: bill of materials, bill of energy, normalized and absolute contribution bar graphs, radar charts, sensitivity charts. The impact assessment results provided by the manufacturing inventory model can be used as input material in LCA tools such as PELCA [13] to simulate the impacts of power electronic systems with embedded IGBTs (industrial converters, automotive inverters) throughout their life cycle, including their use phase, which is known to be a major contributor to their environmental impacts, given the operation lifetime of those systems (20 years or more).
The inventory model allows identification of several key levers for major reduction of the environmental impacts of semiconductor fabrication: access to a fossil-free renewable electricity supply, reduction of water usage and collection and recovery of wastewater, technical alternatives to fluorinated etchant gases and improvement of abatement technologies, device designs free of noble metals, and collection and recovery of high-purity metals used during the production process. Those means of improvement have long been identified by the semiconductor sector, and progress has been made in implementing them, under combined pressure from competitors, regulators, and resource scarcity. Our work contributes to quantifying the environmental impacts of those improvements. The novelty of this study also lies in the open-source diffusion of a thoroughly peer-reviewed IGBT manufacturing inventory and of the associated resource in a public GitHub repository allowing anyone to use it. This software architecture combines several advantages: latitude in programing through the versatile object-oriented Python language, open accessibility to potential users, ease of versioning, and the possibility of continuously improving the manufacturing inventory model by implementing more accurate data when available.
Nevertheless, the published IGBT inventory model has limits and remains perfectible in several ways:
- It relies on the ecoinvent database, which, despite being a widespread database reference among LCA practitioners, is not an open-source material and requires registration to access;
- It relies on a single environmental database, and may therefore be sensitive to discrepancies between databases;
- It embeds uncertainties regarding numerous datapoints, for which literature-based technical hypotheses had to be made because the authors could not access accurate production data; the authors tried to cope with this lack of actual production datapoints through fruitful (though sometimes limited by confidentiality) technical exchanges with external parties from CEA-Leti in France and Fraunhofer IISB in Germany.
The authors therefore propose several means of improving the PELCA IGBT designer tool:
- By implementing more accurate models or datasets for the high-purity chemicals and materials used in the wafer production process;
- By consolidating the parametrizability of the inventory with respect to die voltage and current ratings, going beyond the basic linear relationship approach between die size and electrical current capability;
- By introducing new impact indicators, allowing for instance quantification of the resource criticality and geopolitical supply risk [65].
- In future work, the authors also plan to widen the scope of such manufacturing inventory models to other power electronic components such as silicon carbide (SiC) metal-oxide semiconductor field-effect transistor (MOSFET) and power electronic modules, still with an open-source mindset.
Author Contributions
Methodology and data curation, T.G., P.-Y.P., and N.D.; software, T.G. and P.-Y.P.; formal analysis, T.G.; investigation, T.G.; writing—original draft preparation, T.G.; writing—review and editing, T.G., P.-Y.P., and N.D.; visualization, T.G.; supervision, N.D. All authors have read and agreed to the published version of the manuscript.
Funding
This research received no external funding.
Institutional Review Board Statement
Not applicable.
Informed Consent Statement
Not applicable.
Data Availability Statement
The different components of the PELCA IGBT designer tool (detailed Excel file of the silicon IGBT wafer manufacturing inventory, associated Python script, and instructions to use it to assess the environmental impacts of the manufacturing process) are available from the open-access PELCA GitHub repository at the following address: https://github.com/merce-fra/PELCA. The authors are open to comments and suggestions of improvements from users.
Acknowledgments
The authors would like to thank Laura Vauche, Murielle Fayolle-Lecocq, and Yannick Rivoira from CEA-Leti and Daniel Joch and Michael Jank from Fraunhofer IISB for their expertise in power semiconductor manufacturing and for providing precious insights and recommendations regarding wafer process steps and wafer fab operation.
Conflicts of Interest
Thomas Guillemet, Pierre-Yves Pichon, and Nicolas Degrenne are employed by Mitsubishi Electric R&D Centre Europe. The authors declare that the research was conducted in the absence of any commercial or financial relationships that could be construed as a potential conflict of interest.
Correction Statement
This article has been republished with a minor correction to the Data Availability Statement. This change does not affect the scientific content of the article.
Appendix A
Table A1.
Description of the wafer processing steps included in the IGBT manufacturing inventory model and the associated process and equipment hypotheses.
Table A2.
Description of the hypotheses and energy conversion factors (ECFs) used to model the cleanroom facilities and infrastructures.
Table A3.
List of abbreviations used in the manuscript and in the manufacturing inventory model.
References
- ISO 14040; Environmental Management. ISO: Geneva, Switzerland, 2006.
- ISO 14044; Environmental Management. ISO: Geneva, Switzerland, 2006.
- Williams, E.D.; Ayres, R.U.; Heller, M. The 1.7 kilogram microchip: Energy and material use in the production of semiconductor devices. Environ. Sci. Technol. 2002, 36, 5504. [Google Scholar] [CrossRef] [Scilit]
- Williams, E.D. Environmental impacts of microchip manufacture. Thin Solid Film. 2004, 461, 2. [Google Scholar] [CrossRef] [Scilit]
- Plepys, A. The environmental impacts of electronics. Going beyond the walls of semiconductor fabs. In Proceedings of the IEEE International Symposium on Electronics and the Environment, Scottsdale, AZ, USA, 10–13 May 2004. [Google Scholar]
- Fang, L.; Turkbay Romano, T.; Rio, M.; Mélot, J.; Crébier, J.C. Enhancing Sustainability in Power Electronics through Regulations and Standards: A Literature Review. Sustainability 2024, 16, 1042. [Google Scholar] [CrossRef] [Scilit]
- Salomez, F.; Helbling, H.; Almanza, M.; Soupremanien, U.; Viné, G.; Voldoire, A.; Allard, B.; Ben-Ahmed, H.; Chatroux, D.; Cizeron, A. State of the Art of Research towards Sustainable Power Electronics. Sustainability 2024, 16, 2221. [Google Scholar] [CrossRef] [Scilit]
- Le Gargasson, P.; Pelcat, M.; Beuve, N.; Pressigout, M.; Morin, L.; Menard, D. PCBnCO: A Carbon Intensity Model of FR-4 Printed Circuit Boards Based on Company Data. In Proceedings of the IEEE Conference on Technologies for Sustainability (SuSTech), Los Angeles, CA, USA, 20–23 April 2025. [Google Scholar]
- Freidberg, S. From behind the curtain: Talking about values in LCA. Int. J. Life Cycle Assess 2018, 23, 1410–1414. [Google Scholar] [CrossRef] [Scilit]
- IEC 63366:2025; Product Category Rules For life Cycle Assessment of Electrical and Electronic Products and Systems. International Electrotechnical Commission: Geneva, Switzerland, 2025.
- Baudais, B.; Ben Ahmed, H.; Jodin, G.; Degrenne, N.; Lefebvre, S. Life Cycle Assessment of a 150 kW Electronic Power Inverter. Energies 2023, 16, 2192. [Google Scholar] [CrossRef] [Scilit]
- Guillemet, T.; Empeyrou, A.; Baudais, B.; Ghersi, T.; Degrenne, N. PELCA, un outil collaboratif open-source pour l’analyse de cycle de vie en électronique. In Proceedings of the Symposium de Génie Electrique (SGE), Toulouse, France, 1–3 July 2025. [Google Scholar]
- PELCA GitHub Repository—Power Electronics Life Cycle Assessment. Available online: https://github.com/merce-fra/PELCA (accessed on 12 February 2026).
- Boyd, S. Life Cycle Inventory of a CMOS Chip. In Proceedings of the IEEE International Symposium on Electronics and the Environment, Scottsdale, AZ, USA, 8–11 May 2006. [Google Scholar]
- Boyd, S. Life Cycle Assessment of Semiconductors; Springer: New York, NY, USA, 2012. [Google Scholar]
- Krishnan, N.; Boyd, S.; Somani, A.; Raoux, S.; Clark, D.; Dornfeld, D. A Hybrid Life Cycle Inventory of Nano-Scale Semiconductor Manufacturing. Environ. Sci. Technol. 2008, 42, 3069. [Google Scholar] [CrossRef] [Scilit]
- Murphy, C.; Laurent, J.P.; Allen, D.T. Life Cycle Inventory Development for Wafer Fabrication in Semiconductor Manufacturing. In Proceedings of the IEEE International Symposium on Electronics and the Environment, Boston, MA, USA, 19–22 May 2003. [Google Scholar]
- Murphy, C.F.; Kenig, G.A.; Allen, D.T.; Laurent, J.P.; Dyer, D.E. Development of Parametric Material, Energy, and Emission Inventories for Wafer Fabrication in the Semiconductor Industry. Environ. Sci. Technol. 2003, 37, 5373–5382. [Google Scholar] [CrossRef] [Scilit]
- Musil, F.; Harringer, C.; Hiesmayr, A.; Schönmayr, D. How Life Cycle Analyses Are Influencing Power Electronics Converter Design. In PCIM Europe 2023; VDE Verlag G.M.B.H.: Berlin, Germany, 2023. [Google Scholar]
- Spejo, L.B.; Akor, I.; Rahimo, M.; Minamisawa, R.A. Life-cycle energy demand comparison of medium voltage Silicon IGBT and Silicon Carbide MOSFET power semiconductor modules in railway traction applications. Power Electron. Devices Compon. 2023, 6, 100050. [Google Scholar] [CrossRef] [Scilit]
- Radwan, M.; Paulasto-Kröckel, M.; Vuorinen, V. Cradle-to-Gate Life Cycle Assessment of Si IGBT and SiC MOSFET Power Modules. In Proceedings of the IEEE Conference on Technologies for Sustainability (SusTech), Los Angeles, CA, USA, 20–23 April 2025. [Google Scholar]
- Vauche, L.; Guillemaud, G.; Lopes Barbosa, J.-C.; Di Cioccio, L. Cradle-to-Gate Life Cycle Assessment (LCA) of GaN Power Semiconductor Device. Sustainability 2024, 16, 901. [Google Scholar] [CrossRef] [Scilit]
- Nordelöf, A.; Alatalo, M. A Scalable Life Cycle Inventory of an Automotive Power Electronic Inverter Unit. Int. J. Life Cycle Assess 2019, 24, 694. [Google Scholar] [CrossRef] [Scilit]
- Nordelöf, A.; Grunditz, E.; Tillman, A.M. A scalable life cycle inventory of an electrical automotive traction machine—Part I: Design and composition. Int. J. Life Cycle Assess 2018, 23, 55. [Google Scholar] [CrossRef] [Scilit]
- Wernet, G.; Bauer, C.; Steubing, B.; Reinhard, J.; Moreno-Ruiz, E.; Weidema, B. The ecoinvent database version 3 (part I): Overview and methodology. Int. J. Life Cycle Assess. 2016, 21, 1218–1230. [Google Scholar] [CrossRef] [Scilit]
- Zampori, L.; Pant, R. Suggestions for Updating the Product Environmental Footprint (PEF) Method; JRC Technical Reports; Publications Office of the European Union: Luxembourg, 2019. [Google Scholar]
- Transparency, Ambition, and Collaboration: Advancing the Climate Agenda of the Semiconductor Value Chain, Semiconductor Climate Consortium, 2023. Available online: https://discover.semi.org/rs/320-QBB-055/images/Transparency-Ambition-and-Collaboration-BCG-SEMI-SCC-20230919.pdf (accessed on 12 February 2026).
- Brightway LCA Software Framework—Brightway Documentation. Available online: https://docs.brightway.dev/en/latest/ (accessed on 12 February 2026).
- Steubing, B.; de Koning, D.; Hass, A.; Mutel, C.L. The Activity Browser—An open source LCA software building on top of the brightway framework. Softw. Impacts 2020, 3, 100012. [Google Scholar] [CrossRef] [Scilit]
- Barbarini, E. Infineon FS820R08A6P2B—HybridPACK Drive 750V IGBT Module, Reverse Costing and Technology Analysis Report, System Plus Consulting, 2017. Available online: https://medias.yolegroup.com/uploads/2019/02/Yole_Infineon_FS820R08A6P2B_HybridPACK_Drive_IGBT_Module_Sample_System_Plus_Consulting_SP17332.pdf (accessed on 12 February 2026).
- De Vries, D.K. Investigation of gross die per wafer formulas. IEEE Trans. Semicond. Manuf. 2005, 18, 136. [Google Scholar] [CrossRef] [Scilit]
- Boakes, L.; Ragnarsson, L.A.; Rolin, C.; Liu, I.Y.; Vanhouche, B.; Schellekens, V. Life Cycle Assessment Methodology for imec.netzero, Version 3.4, 2024. Available online: https://downloads.frame.work/resources/Framework-Life-Cycle-Report.pdf (accessed on 12 February 2026).
- SEMI E72-1016; Specification and Guide for Equipment Footprint, Height, and Weight. SEMI: Milpitas, CA, USA, 2016.
- Prakash, S.; Liu, R.; Schischke, K.; Stobbe, L. Schaffung einer Datenbasis zur Ermittlung ökologischer Wirkungen der Produkte der Informations- und Kommunikationstechnik (IKT); UBA: Berlin, Germany, 2013. [Google Scholar]
- Díaz Triana, A.; Schmidt, S.; Glaser, S.; Makoschitz, M. A “Life Cycle Thinking” Approach to Assess Differences in the Energy Use of SiC- vs. Si Power Semiconductors. In Proceedings of the e.nova 2021 Conference “Green Deal, Energy—Building—Environment”, Pinkafeld, Austria, 1–2 June 2022. [Google Scholar]
- Foroushani, S.; Wintzer, A.; Kiessling, F.M.; Dadzis, K. Heating efficiency and energy saving potential of Czochralski crystal growth furnaces. J. Cryst. Growth 2025, 662, 128106. [Google Scholar] [CrossRef] [Scilit]
- Schulze, H.J.; Öfner, H.; Niedernostheide, F.J.; Lükerman, F.; Schulz, A. Fabrication of IGBTs using 300 mm magnetic Czochralski substrates. IET Power Electron. 2019, 12, 3870–3873. [Google Scholar] [CrossRef] [Scilit]
- FZ300—Next Generation Ultrapure Silicon Wafers for the Green Energy Transition. Available online: https://eudp.dk/en/node/17289 (accessed on 12 February 2026).
- Geng, H. Semiconductor Manufacturing Handbook, 2nd ed.; McGraw Hill Education: Columbus, OH, USA, 2018. [Google Scholar]
- Servin, I.; Teolis, A.; Bazin, A.; Durin, P.; Sysova, O.; Gablin, C.; Saudet, B.; Leonard, D.; Soppera, O.; Leclercq, J.L.; et al. Water-soluble bio-sourced resists for DUV lithography in a 200/300 mm pilot line environment. Micro Nano Eng. 2023, 19, 100202. [Google Scholar] [CrossRef] [Scilit]
- Miura, S.; Hachikubo, Y.; Yamagishi, R.; Ando, M.; Takei, S. Water-Soluble Biomass Resist Materials Based on Polyglucuronic Acid for Eco-Friendly Photolithography. Coatings 2023, 13, 2038. [Google Scholar] [CrossRef] [Scilit]
- Tanjyo, M.; Naito, M. History of Ion Implanter and Its Future Perspective. SEI Tech. Rev. 2011, 73, 22–30. [Google Scholar]
- Pedersen, H.; Barry, S.T.; Sundqvist, J. Green CVD—Toward a sustainable philosophy for thin film deposition by chemical vapor deposition. J. Vac. Sci. Technol. A 2021, 39, 051001. [Google Scholar] [CrossRef] [Scilit]
- Krishnan, M.; Nalaskowski, J.W.; Cook, L.M. Chemical Mechanical Planarization: Slurry Chemistry, Materials, and Mechanisms. Chem. Rev. 2010, 110, 178–204. [Google Scholar] [CrossRef] [Scilit]
- Lee, H.; Park, S.; Jeong, H. Evaluation of environmental impacts during chemical mechanical polishing (CMP) for sustainable manufacturing. J. Mech. Sc. Technol. 2013, 27, 511–518. [Google Scholar] [CrossRef] [Scilit]
- Baptista, A.; Silva, F.; Porteiro, J.; Míguez, J.; Pinto, G. Sputtering Physical Vapour Deposition (PVD) Coatings: A Critical Review on Process Improvement and Market Trend Demands. Coatings 2018, 8, 402. [Google Scholar] [CrossRef] [Scilit]
- Arduino, D.; Stassi, S.; Spano, C.; Scaltrito, L.; Ferrero, S.; Bertana, V. Silicon and Silicon Carbide Recrystallization by Laser Annealing: A Review. Materials 2023, 16, 7674. [Google Scholar] [CrossRef] [Scilit] [PubMed]
- Williams, K.R.; Gupta, K.; Wasilik, M. Etch Rates for Micromachining Processing—Part II. J. Microelectromech. Syst. 2003, 12, 761–778. [Google Scholar] [CrossRef] [Scilit]
- Sharma, P.; Pleil, M.; Jackson, N. Effect of SF6 and C4F8 flow rate on etched surface profile and grass formation in deep reactive ion etching process. In Proceedings of the ASME International Mechanical Engineering Congress and Exposition (IMECE), Columbus, OH, USA, 30 October–3 November 2022. [Google Scholar]
- You, Y.-B.; Lee, Y.-S.; Kim, S.-J.; Cho, C.-H.; Seong, I.-H.; Jeong, W.-N.; Choi, M.-S.; You, S.-J. Influence of Additive N2 on O2 Plasma Ashing Process in Inductively Coupled Plasma. Nanomaterials 2022, 12, 3798. [Google Scholar] [CrossRef] [Scilit] [PubMed]
- Veltkamp, H.-W.; Janssens, Y.L.; de Boer, M.J.; Zhao, Y.; Wiegerink, R.J.; Tas, N.R.; Lötters, J.C. Method for Keyhole-Free High-Aspect-Ratio Trench Refill by LPCVD. Micromachines 2021, 13, 1908. [Google Scholar] [CrossRef] [Scilit]
- Beu, L.; Raoux, S. Electronics Industry Emissions, Chap 6; Volume 3: Industrial Processes and Product Use; 2019 Refinement to the 2006 IPCC Guidelines for National Greenhouse Gas Inventories, 2019. Available online: https://www.ipcc-nggip.iges.or.jp/public/2019rf/pdf/3_Volume3/19R_V3_Ch06_Electronics.pdf (accessed on 12 February 2026).
- Hu, S.C.; Wu, J.S.; Chan, D.Y.L.; Hsu, R.T.C.; Lee, J.C.C. Power consumption benchmark for a semiconductor cleanroom facility system. Energy Build. 2008, 40, 1765–1770. [Google Scholar] [CrossRef] [Scilit]
- Xu, T.; Tschudi, W. Energy Performance of Cleanroom Environmental Systems. In Proceedings of the 48th Annual Technical Meeting and Exposition of the Institute of Environmental Science and Technology (ESTECH), Anaheim, CA, USA, 28 April–1 May 2002. [Google Scholar]
- Liao, P.Y.; Lin, T.; Zargar, O.A.; Hsu, C.J.; Chou, C.H.; Shih, Y.C.; Hu, S.C.; Leggett, G. Energy Consumption and Carbon Emission Reduction in HVAC System of a Dynamic Random Access Memory (DRAM) Semiconductor Fabrication Plant (fab). IEEE Trans. Semicond. Manuf. 2024, 37, 174–184. [Google Scholar] [CrossRef] [Scilit]
- SEMI S23-1021E2; Guide for Energy, Utilities, and Materials Use Efficiency of Semiconductor Manufacturing Equipment. SEMI: Milpitas, CA, USA, 2021.
- Sala, S.; Crenna, E.; Secchi, M.; Sanyé-Mengual, E. Environmental Sustainability of European Production and Consumption Assessed against Planetary Boundaries. J. Environ. Manag. 2020, 269, 110686. [Google Scholar] [CrossRef] [Scilit] [PubMed]
- Nassar, N.T.; Lederer, G.W.; Brainard, J.L.; Padilla, A.J.; Lessard, J.D. Rock-to-Metal Ratio: A Foundational Metric for Understanding Mine Wastes. Environ. Sci. Technol. 2022, 56, 6710–6721. [Google Scholar] [CrossRef] [Scilit]
- Website of the International Energy Agency (IEA). Available online: https://www.iea.org/countries (accessed on 12 February 2026).
- Andreasi, B.S.; Biganzoli, F.; Ferrara, N.; Amadei, A.; Valente, A.; Sala, S.; Ardente, F. Updated Characterisation and Normalisation Factors for the Environmental Footprint 3.1 Method; JRC Publications Repository; Publications Office of the European Union: Luxembourg, 2023. [Google Scholar] [CrossRef]
- Sala, S.; Cerutti, A.K.; Pant, R. Development of a Weighting Approach for the Environmental Footprint; Publications Office of the European Union: Luxembourg, 2018. [Google Scholar] [CrossRef]
- Weidema, B.P.; Bauer, C.; Hischier, R.; Mutel, C.; Nemecek, T.; Reinhard, J.; Vadenbo, C.O.; Wernet, G. Overview and Methodology: Data Quality Guideline for the Ecoinvent Database Version 3; Swiss Centre for Life Cycle Inventories: Dübendorf, Switzerland, 2013. [Google Scholar]
- Wang, Q.; Huang, N.; Chen, Z.; Chen, X.; Cai, H.; Wu, Y.P. Environmental data and facts in the semiconductor manufacturing industry: An unexpected high water and energy consumption situation. Water Cycle 2023, 4, 47–54. [Google Scholar] [CrossRef] [Scilit]
- Available online: https://irtnanoelec.fr/wp-content/uploads/2026/01/END25-26-POSTER-FIDON.pdf (accessed on 12 February 2026).
- Santillan-Saldivar, J.; Gemechu, E.; Muller, S.; Villeneuve, J.; Young, S.B.; Sonneman, G. An improved resource midpoint characterization method for supply risk of resources: Integrated assessment of Li-ion batteries. Int. J. Life Cycle Assess. 2022, 27, 457. [Google Scholar] [CrossRef] [Scilit]
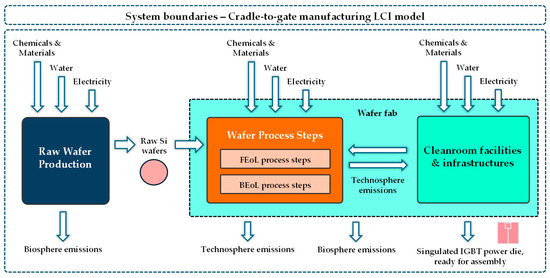
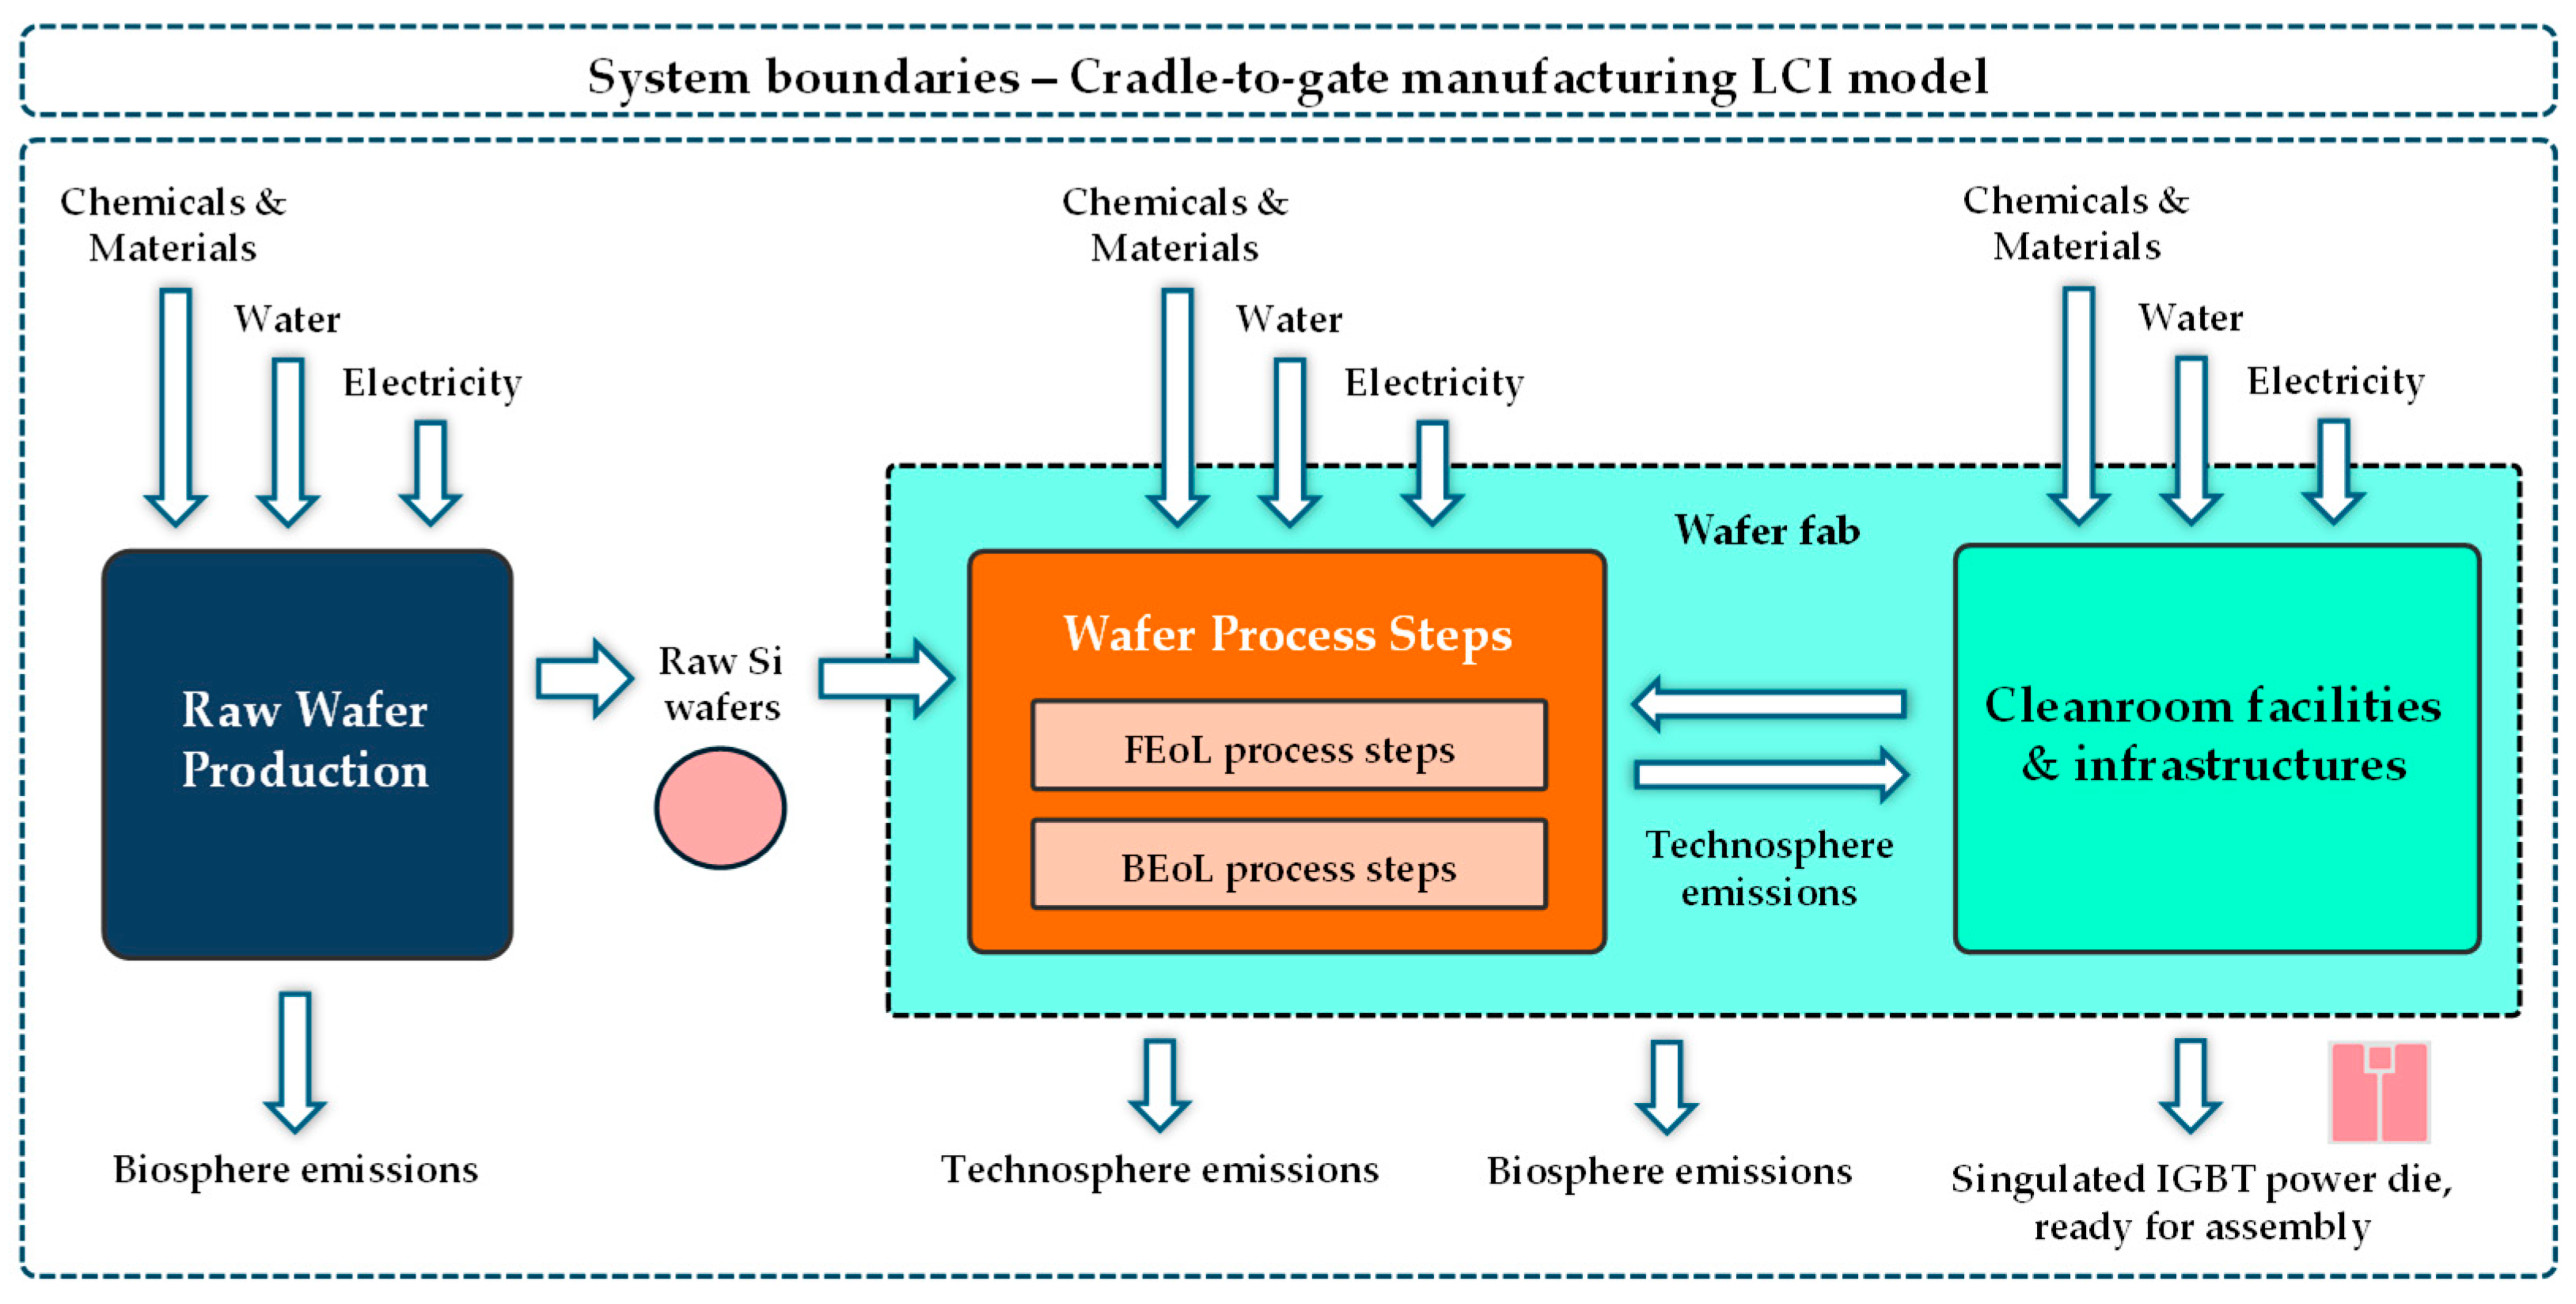
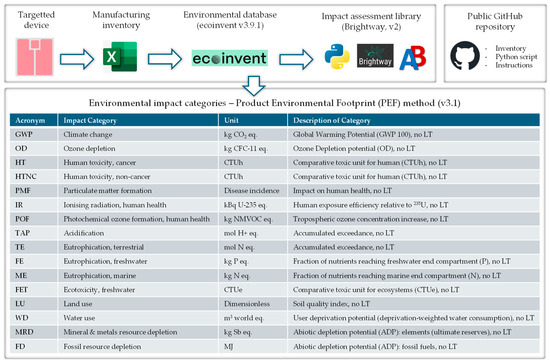
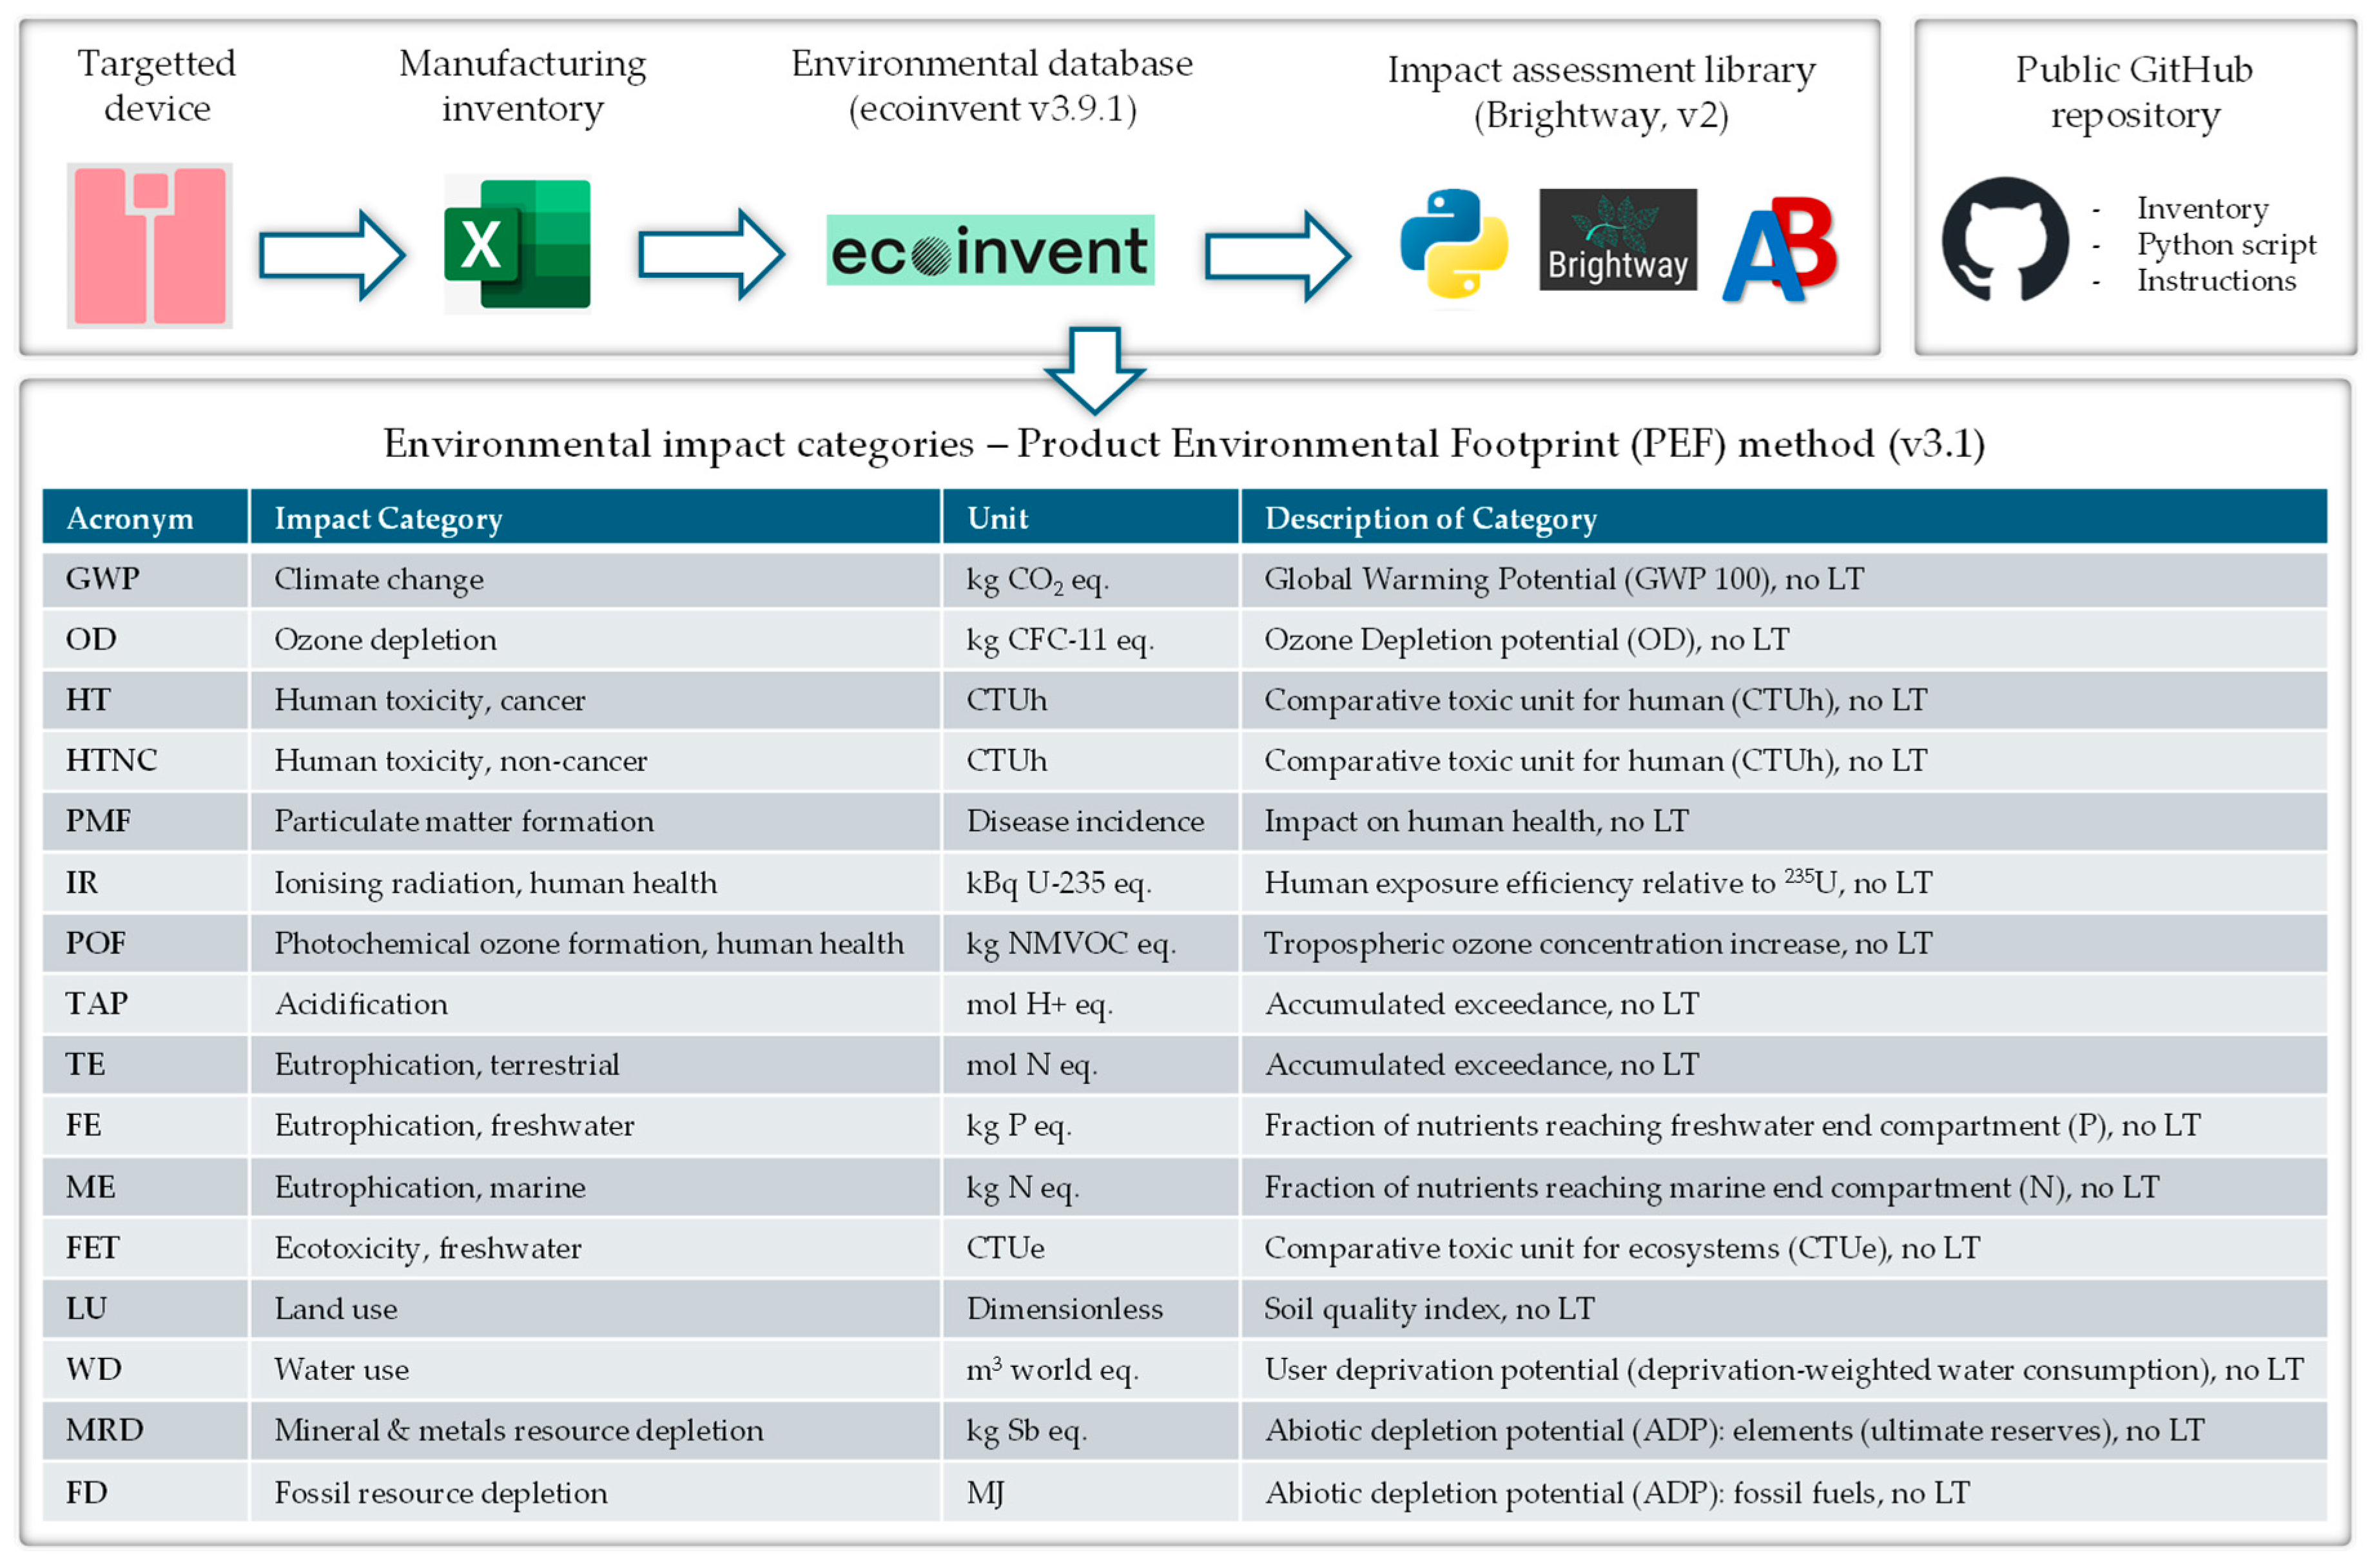
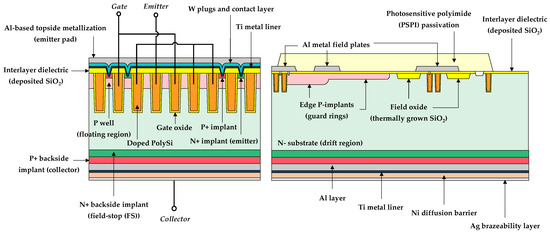
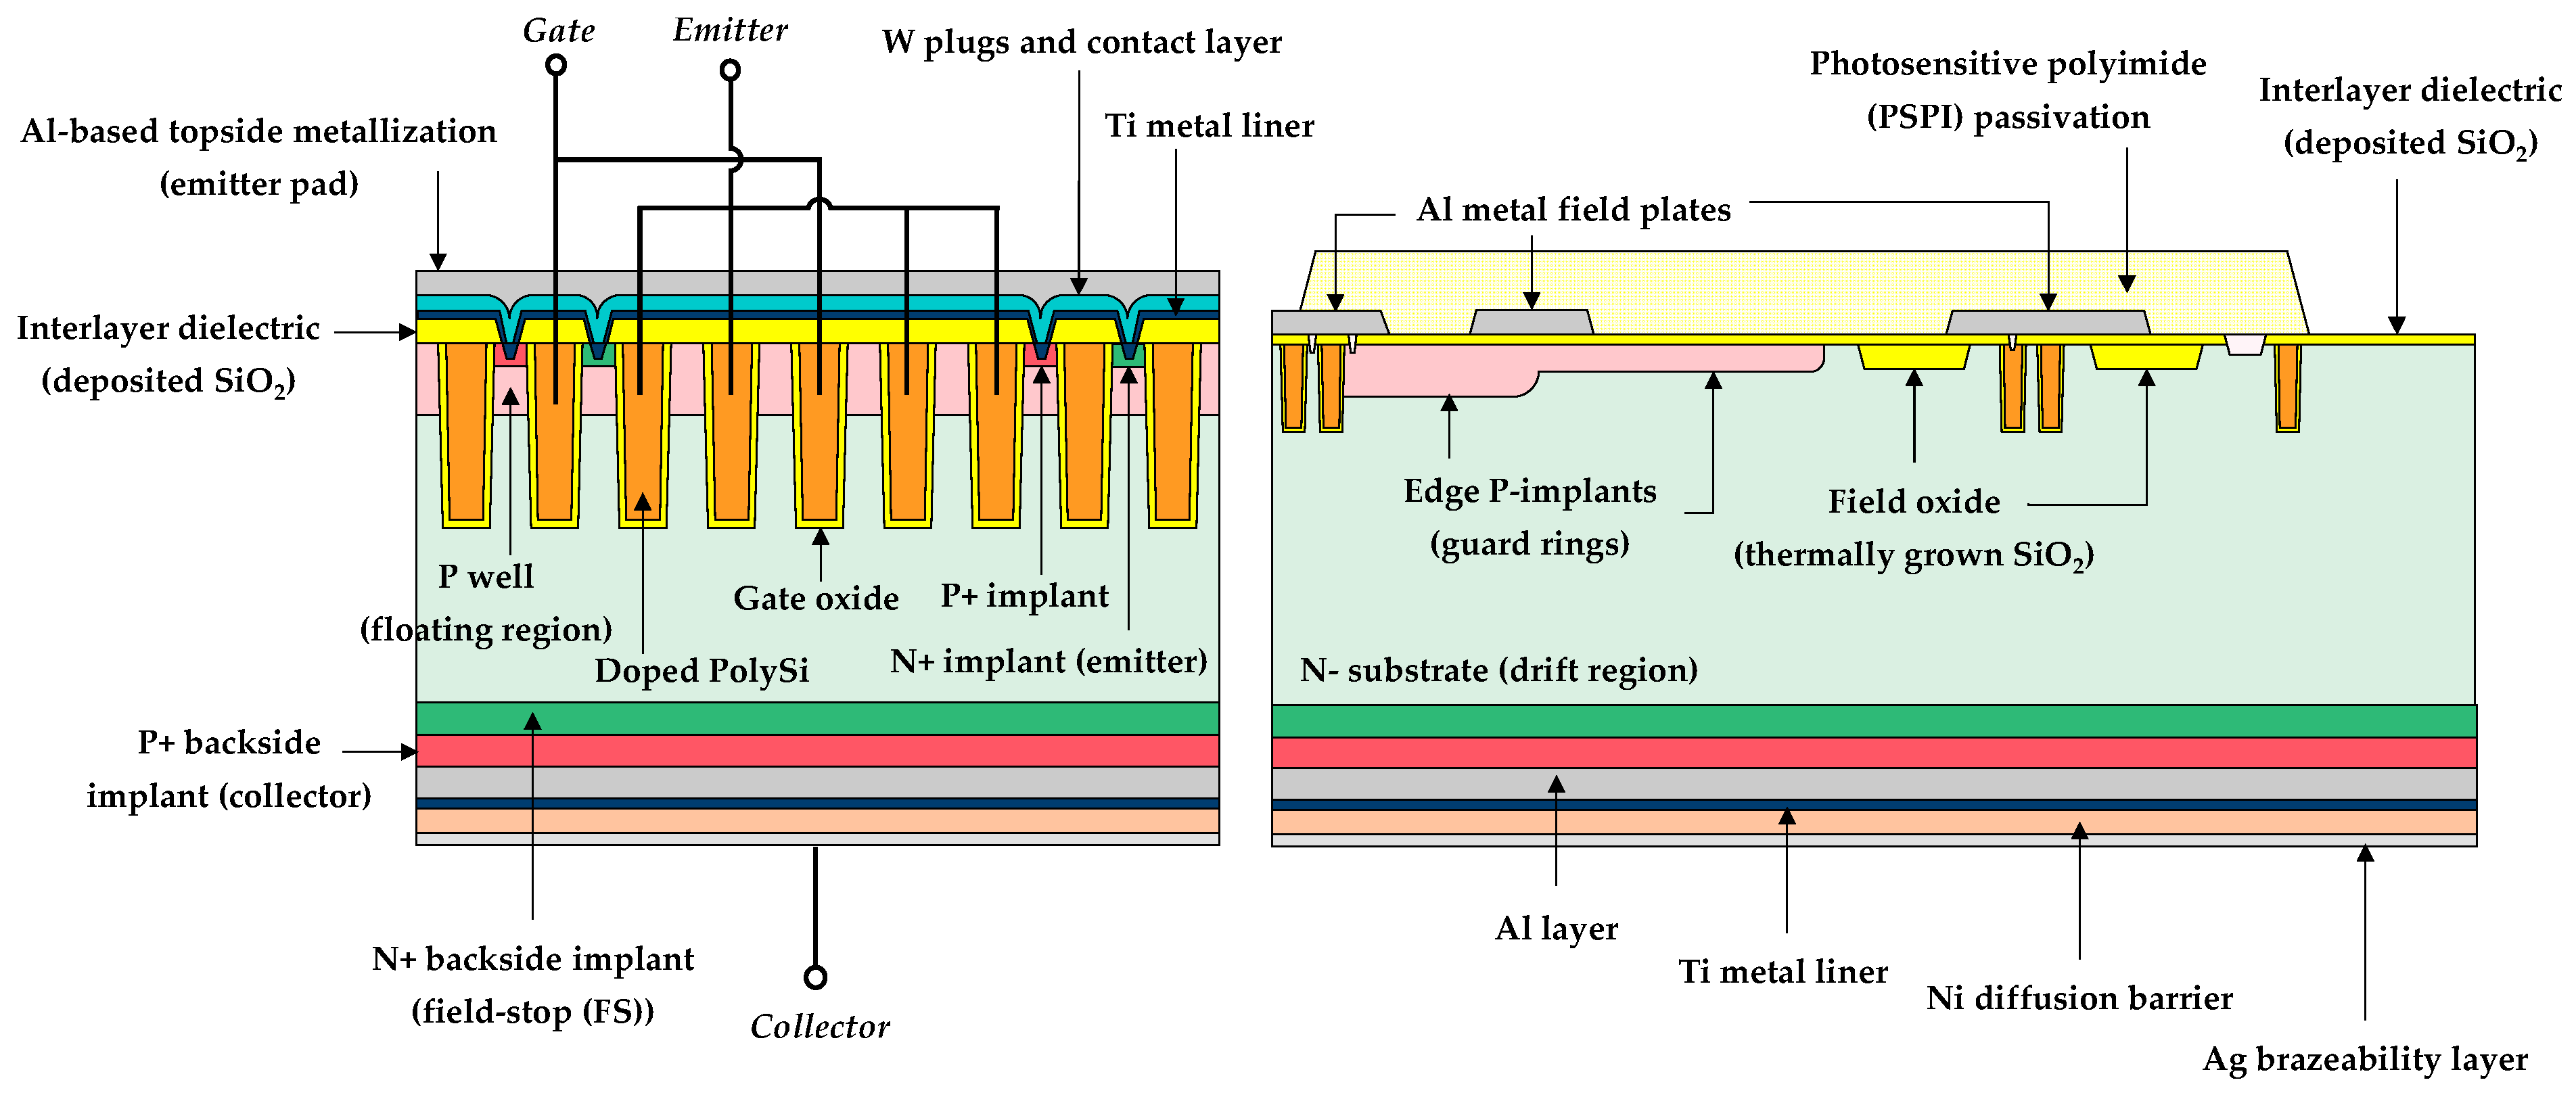
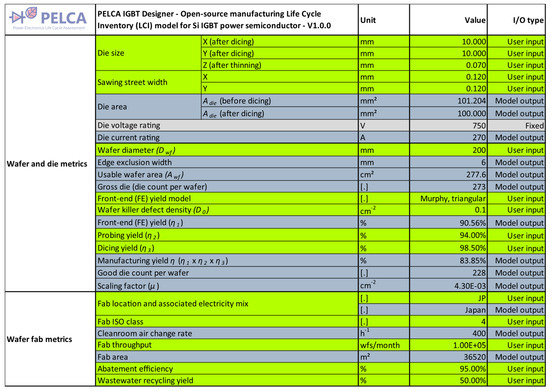
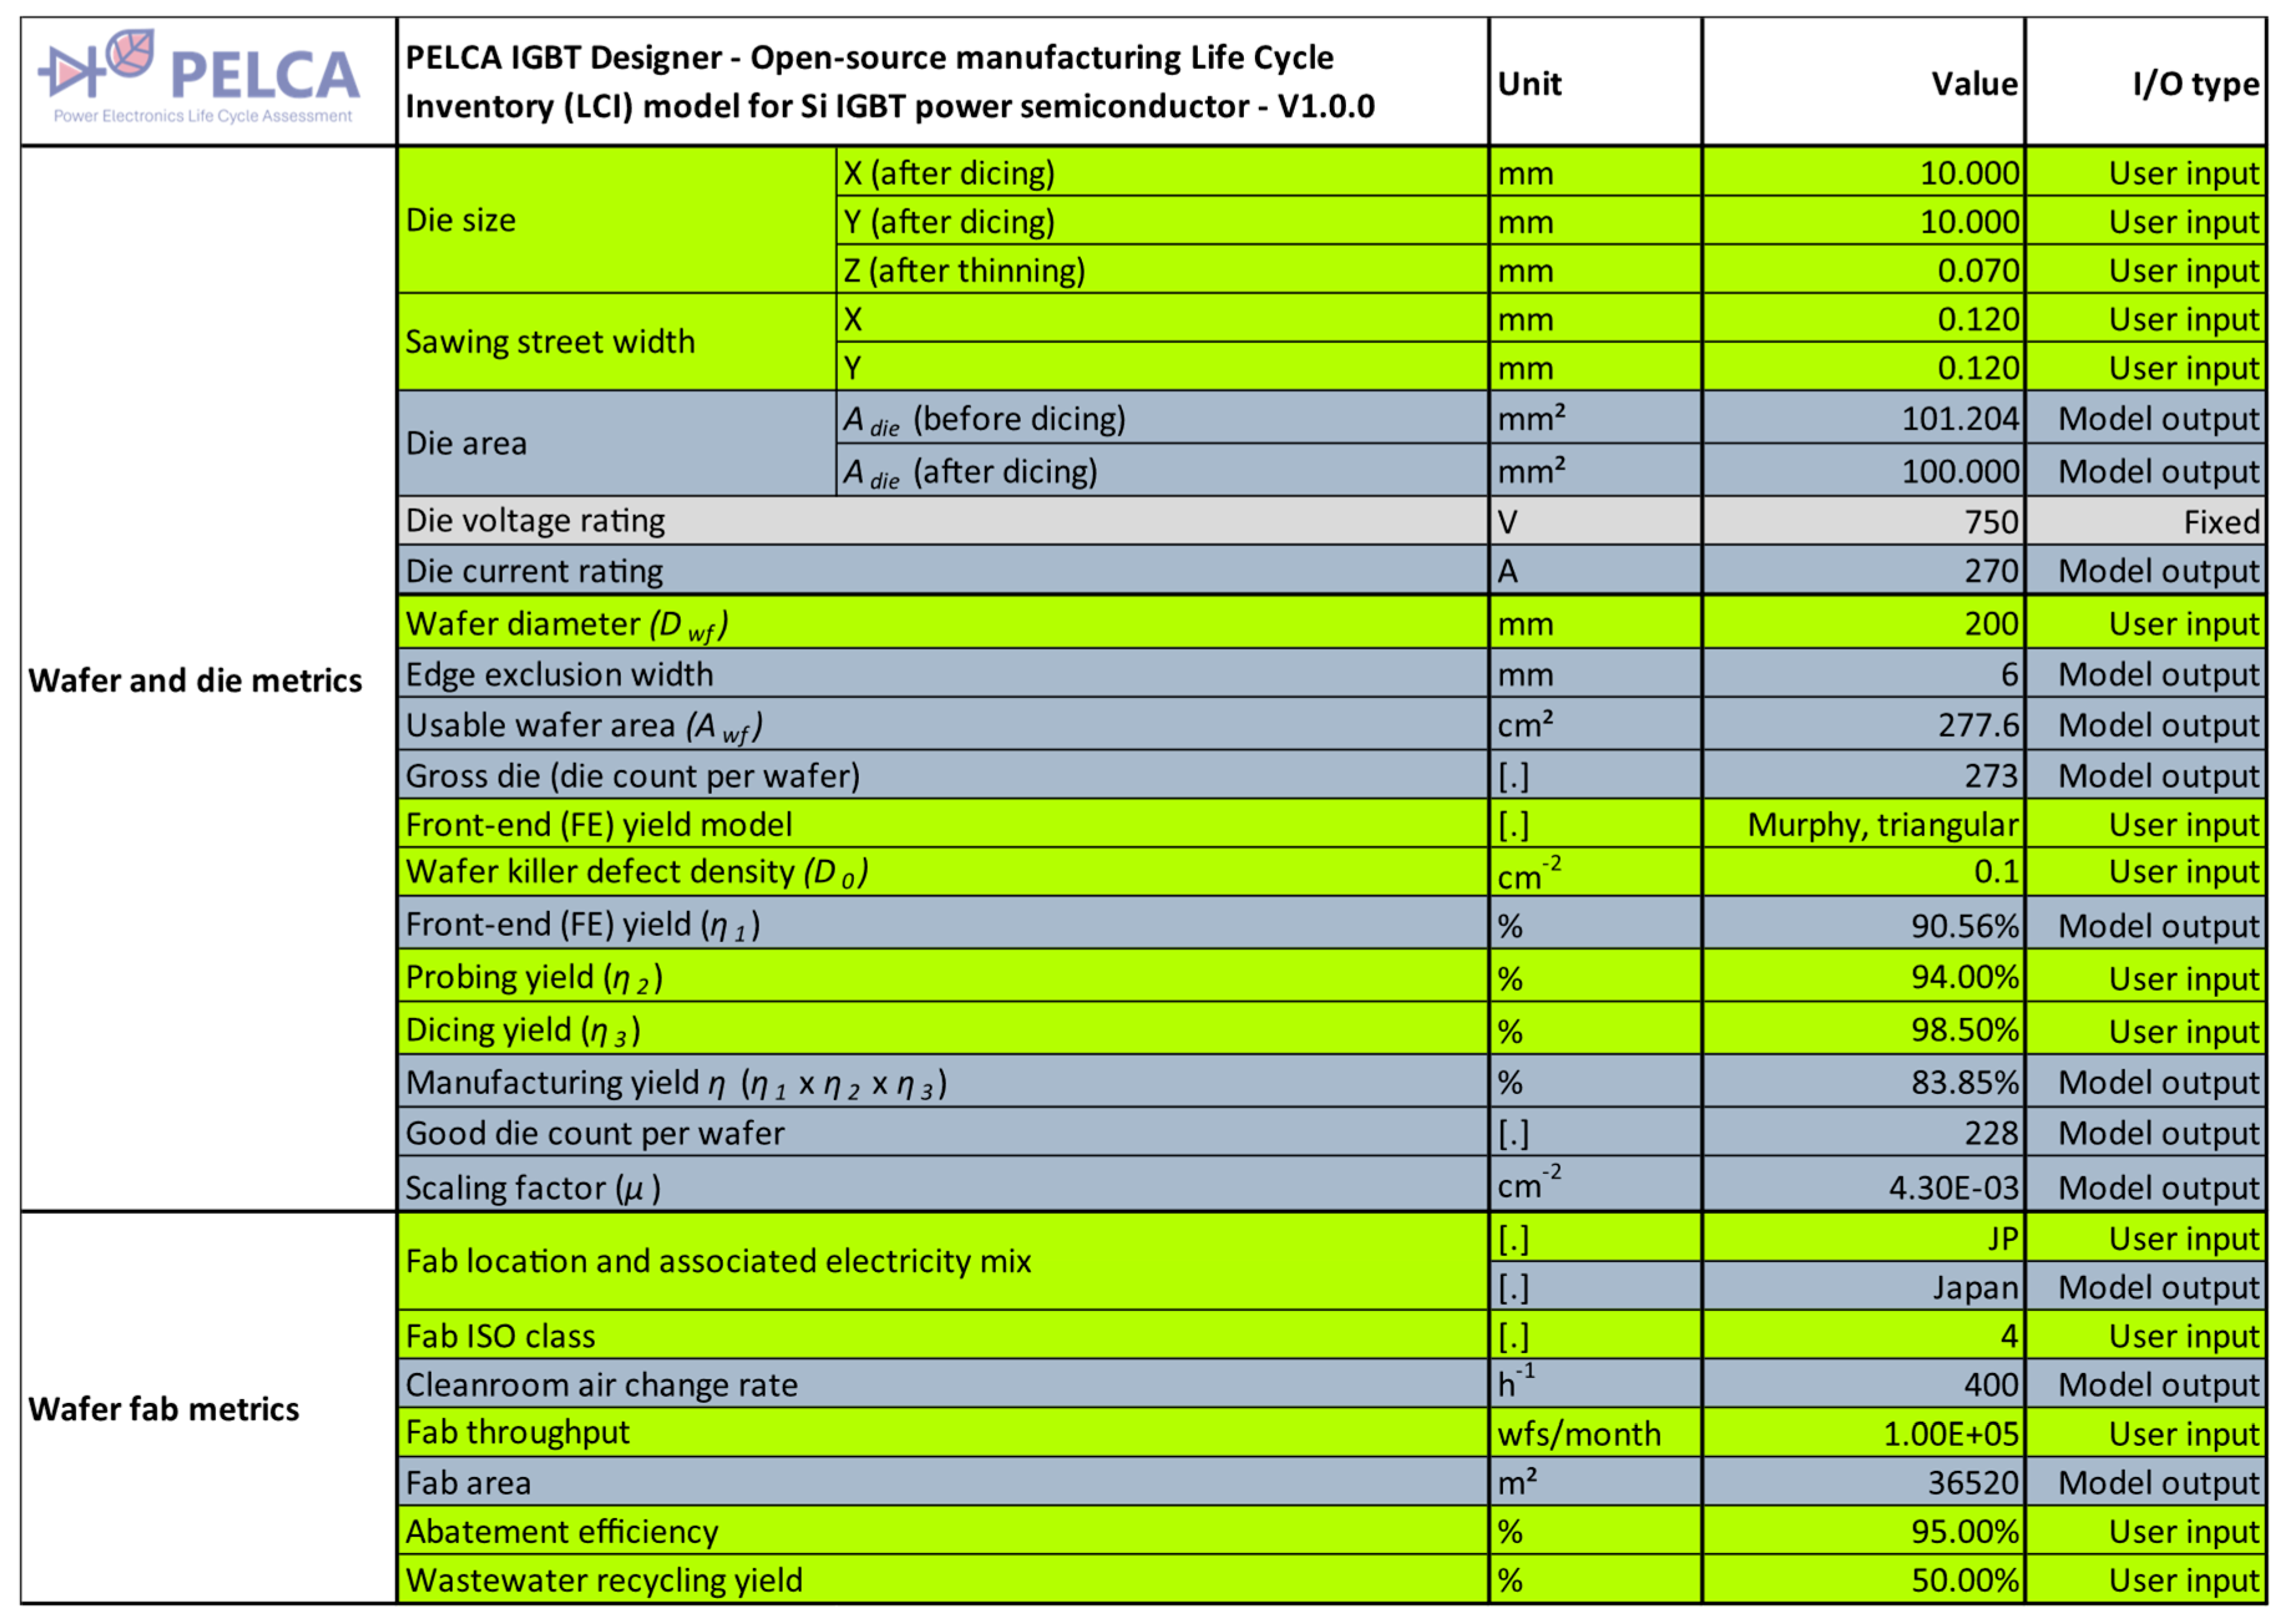
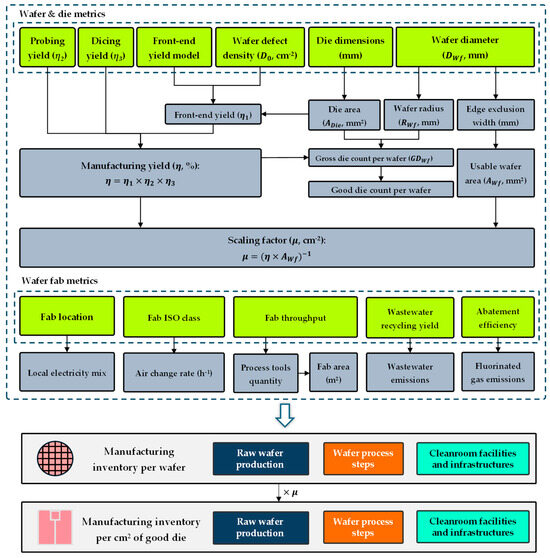
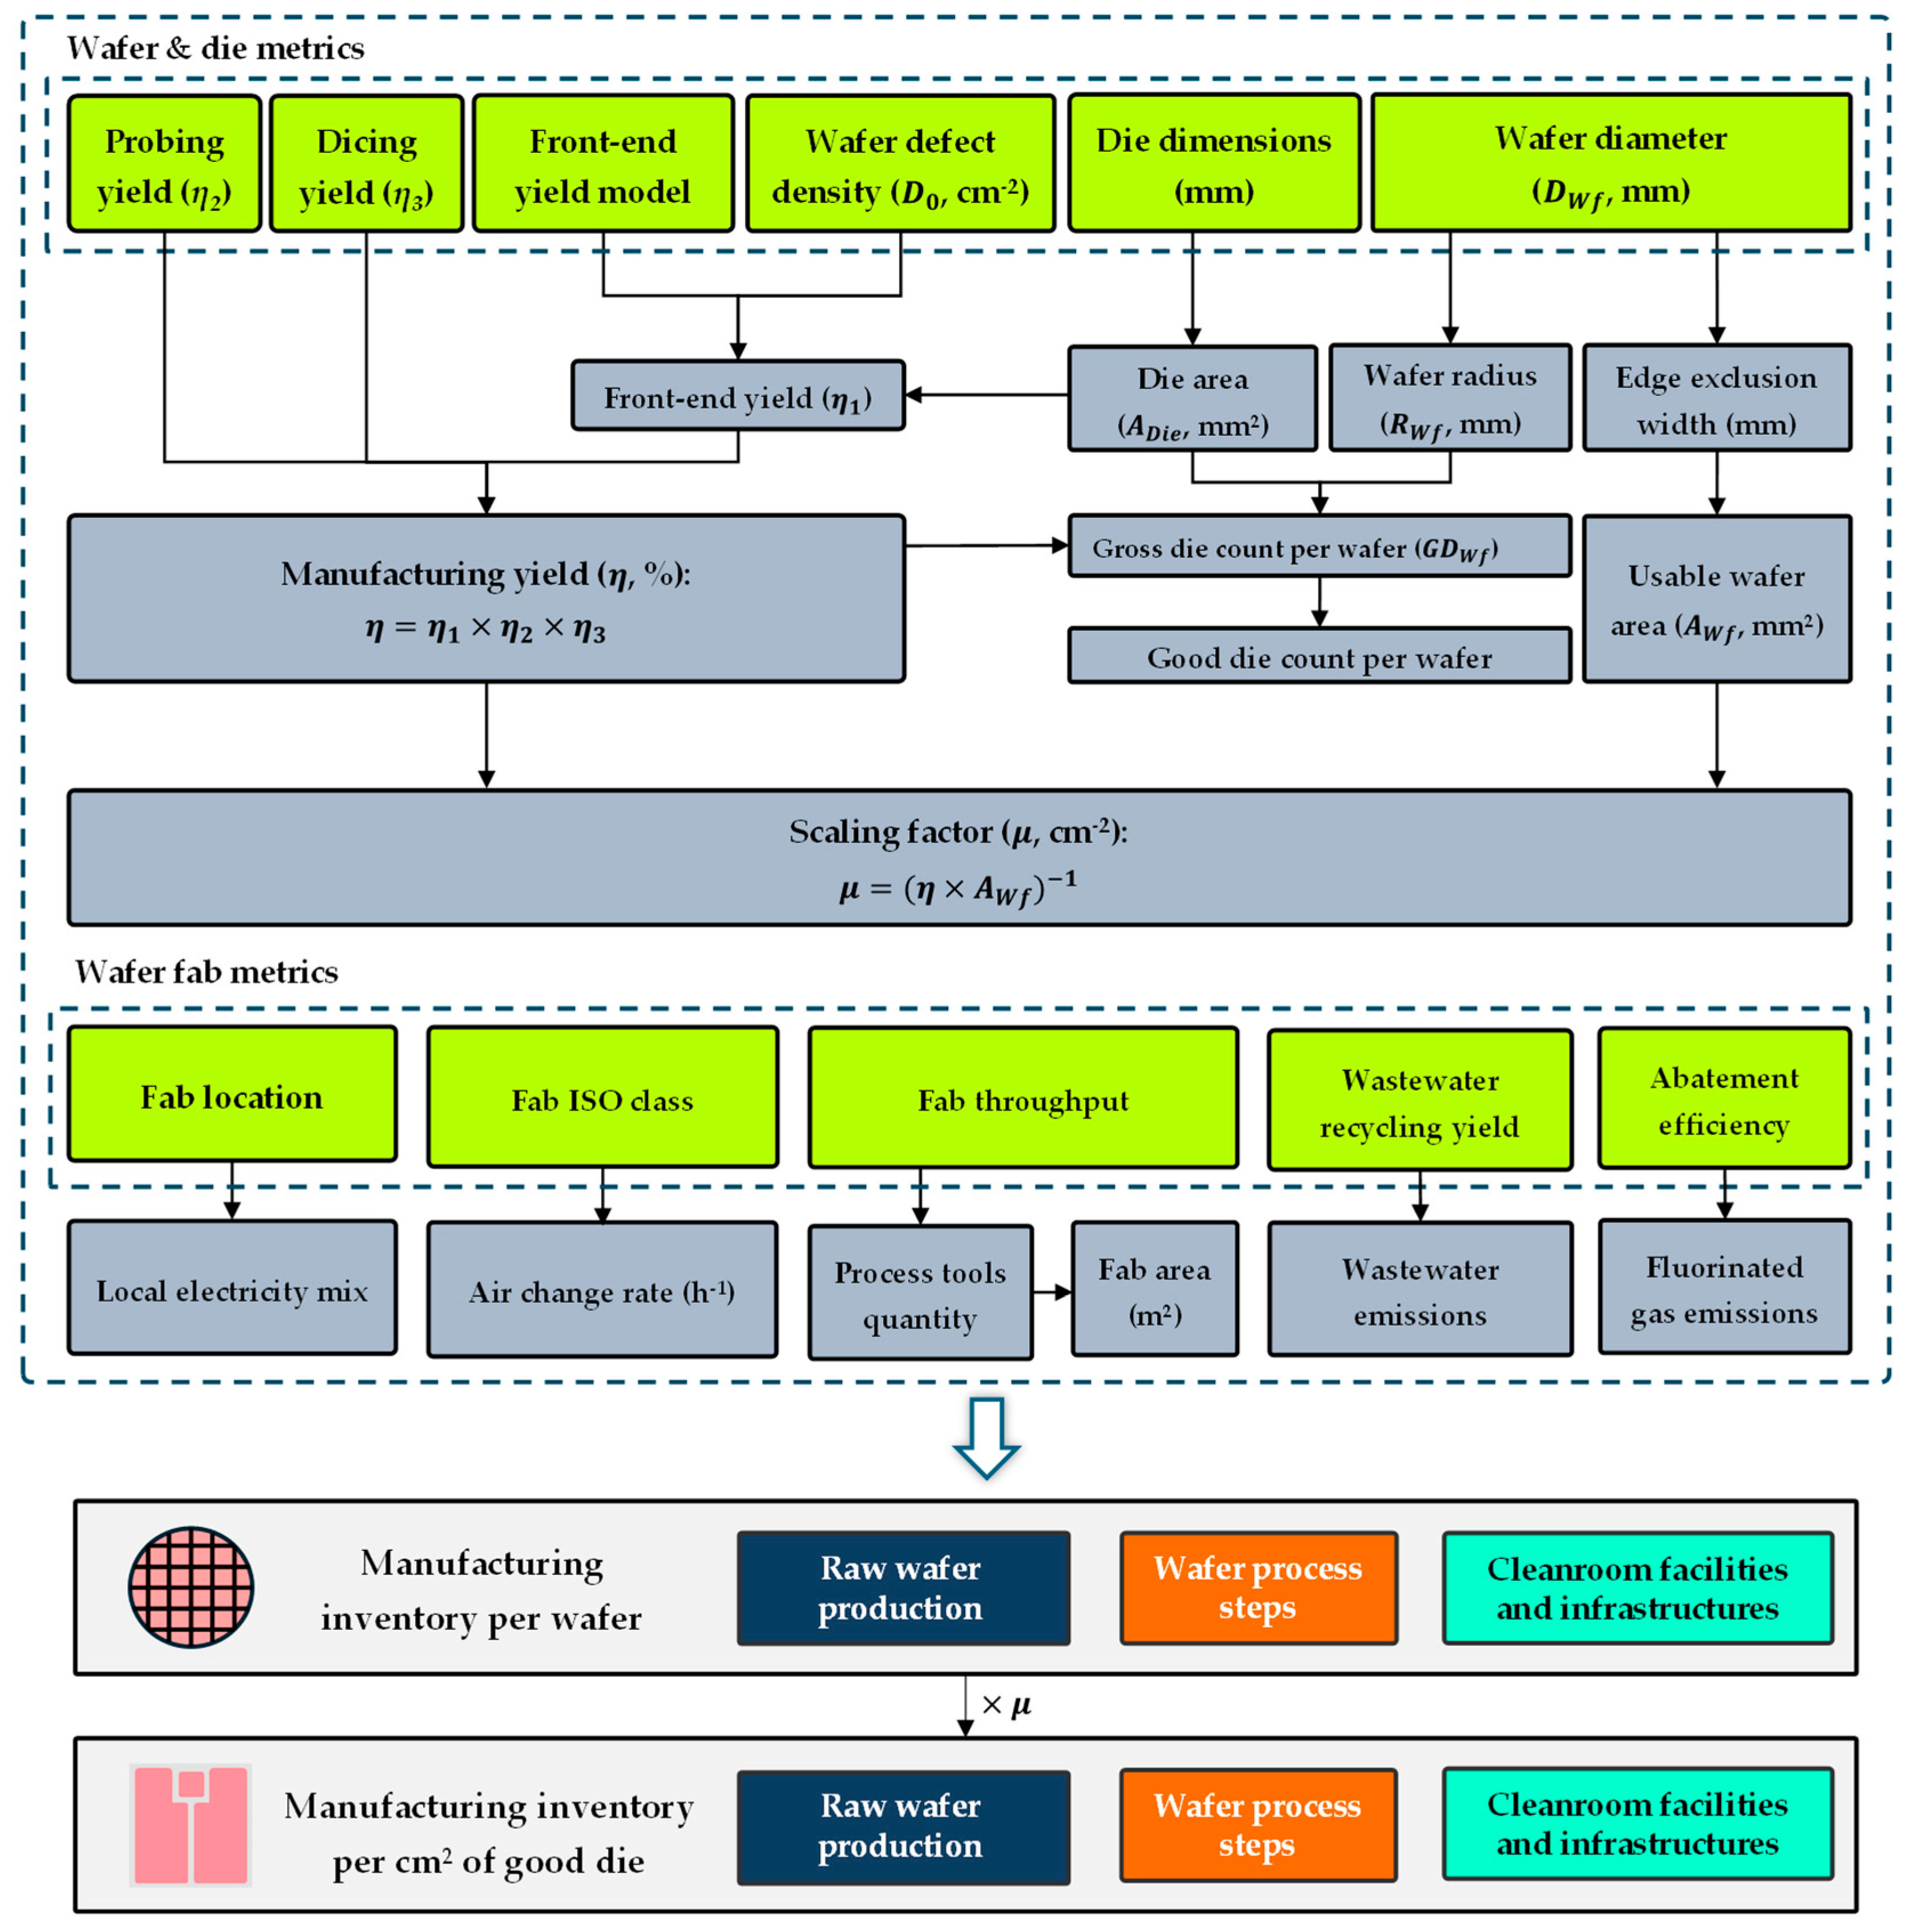
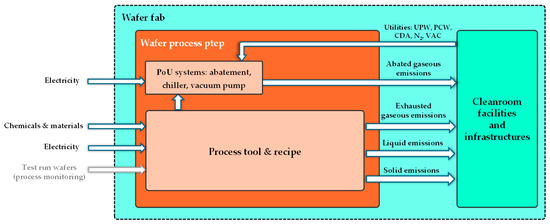
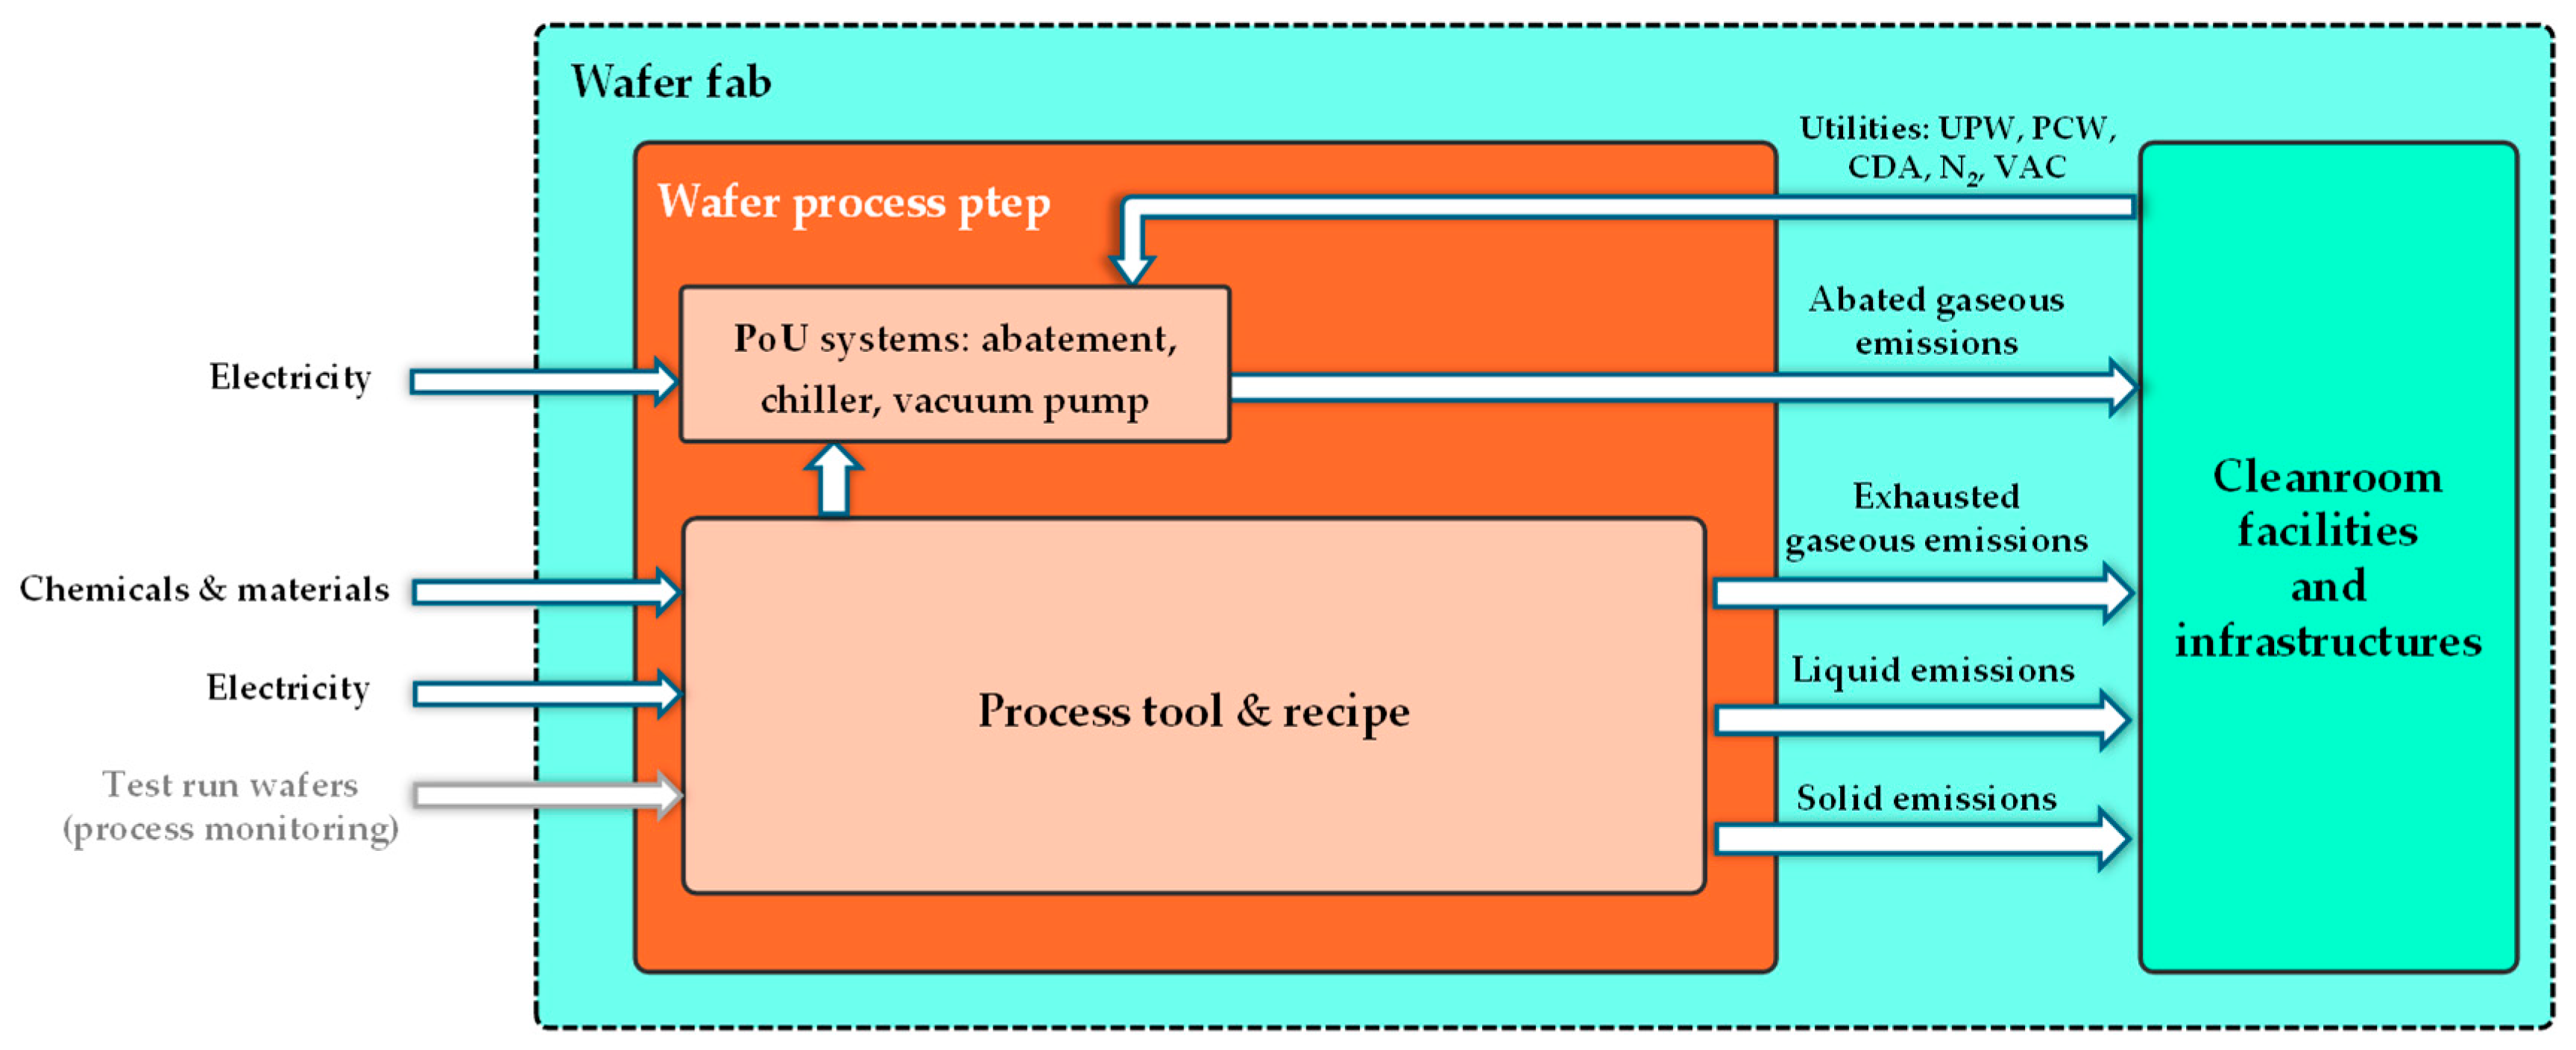
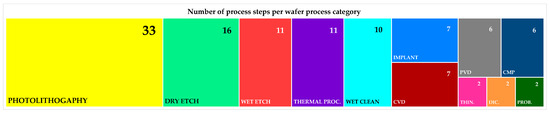
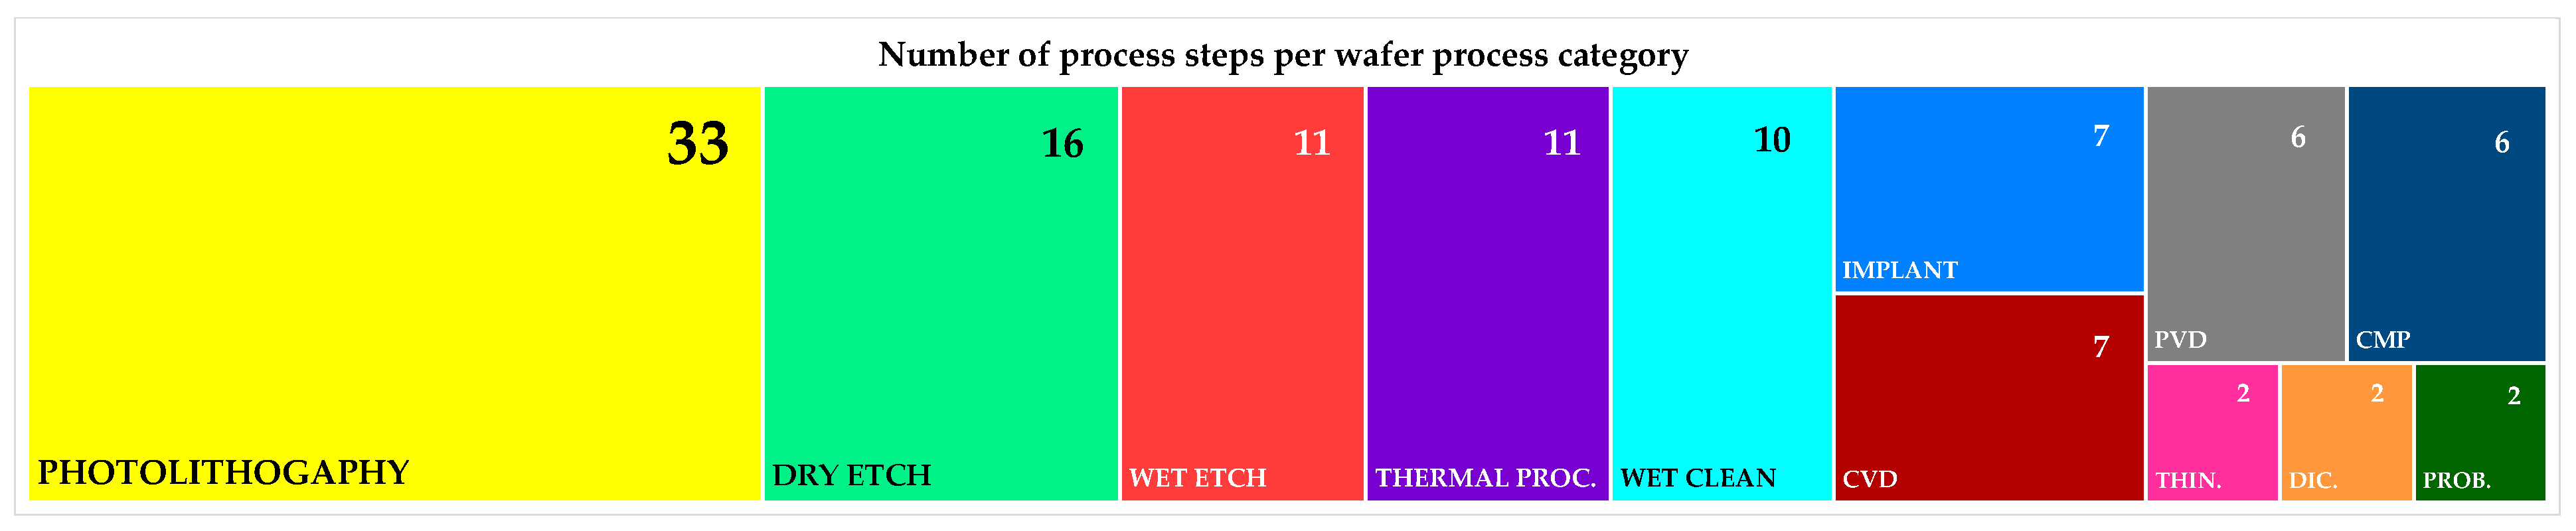
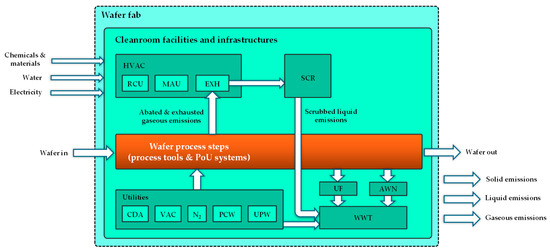
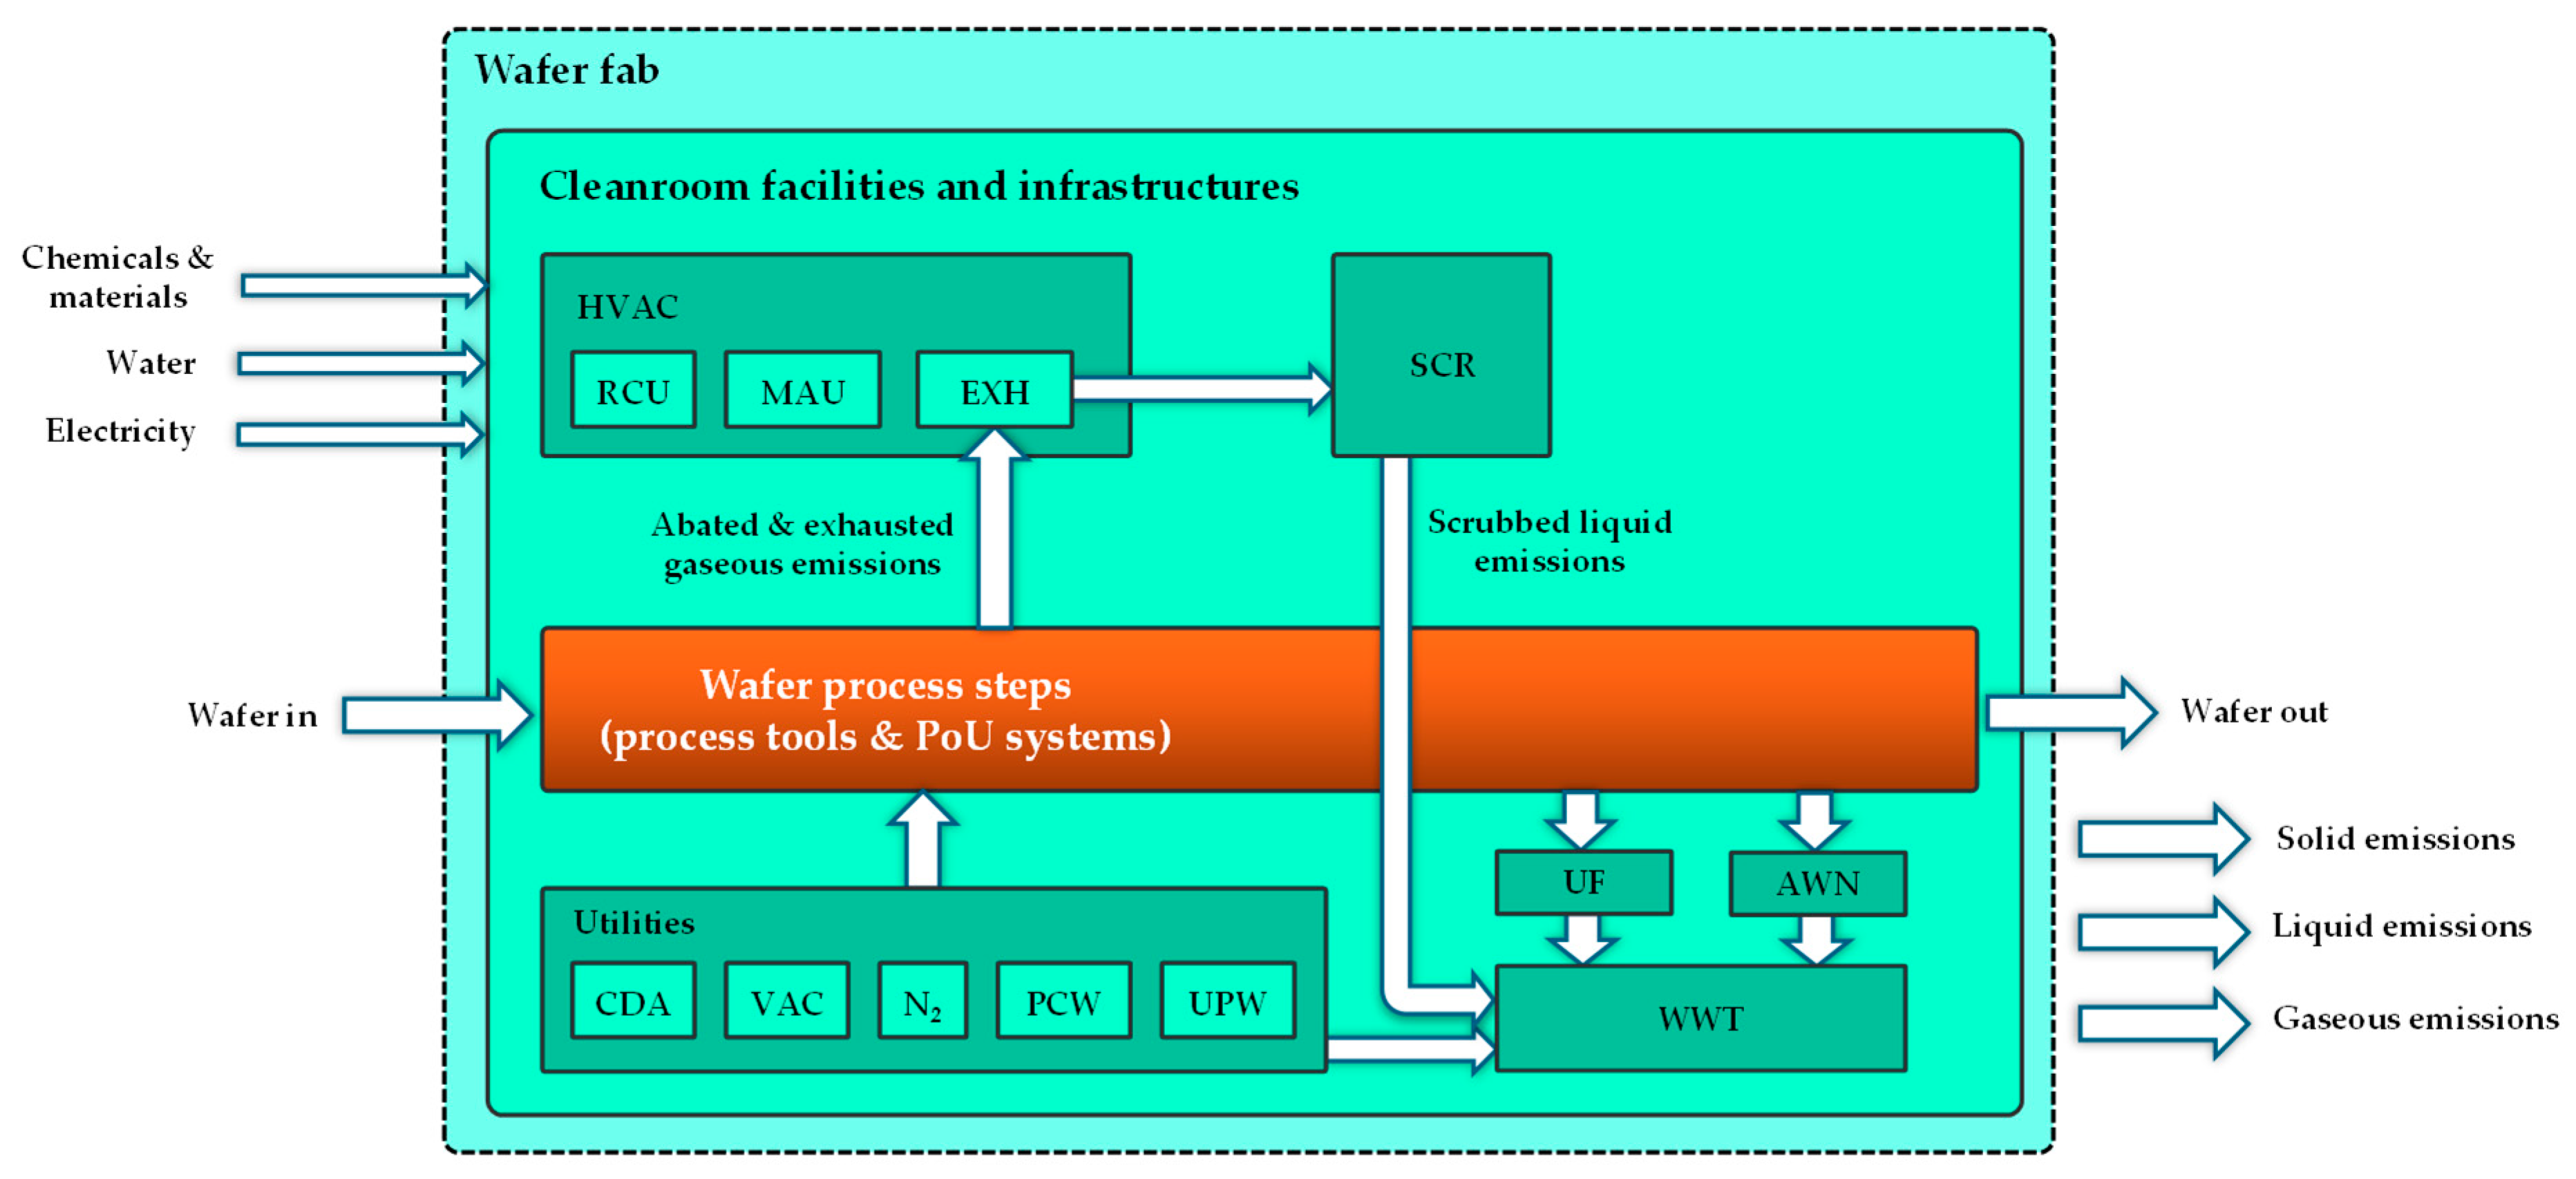
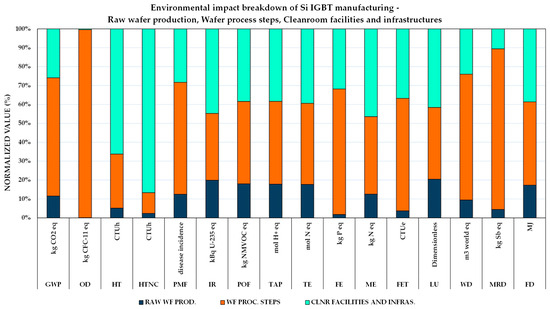
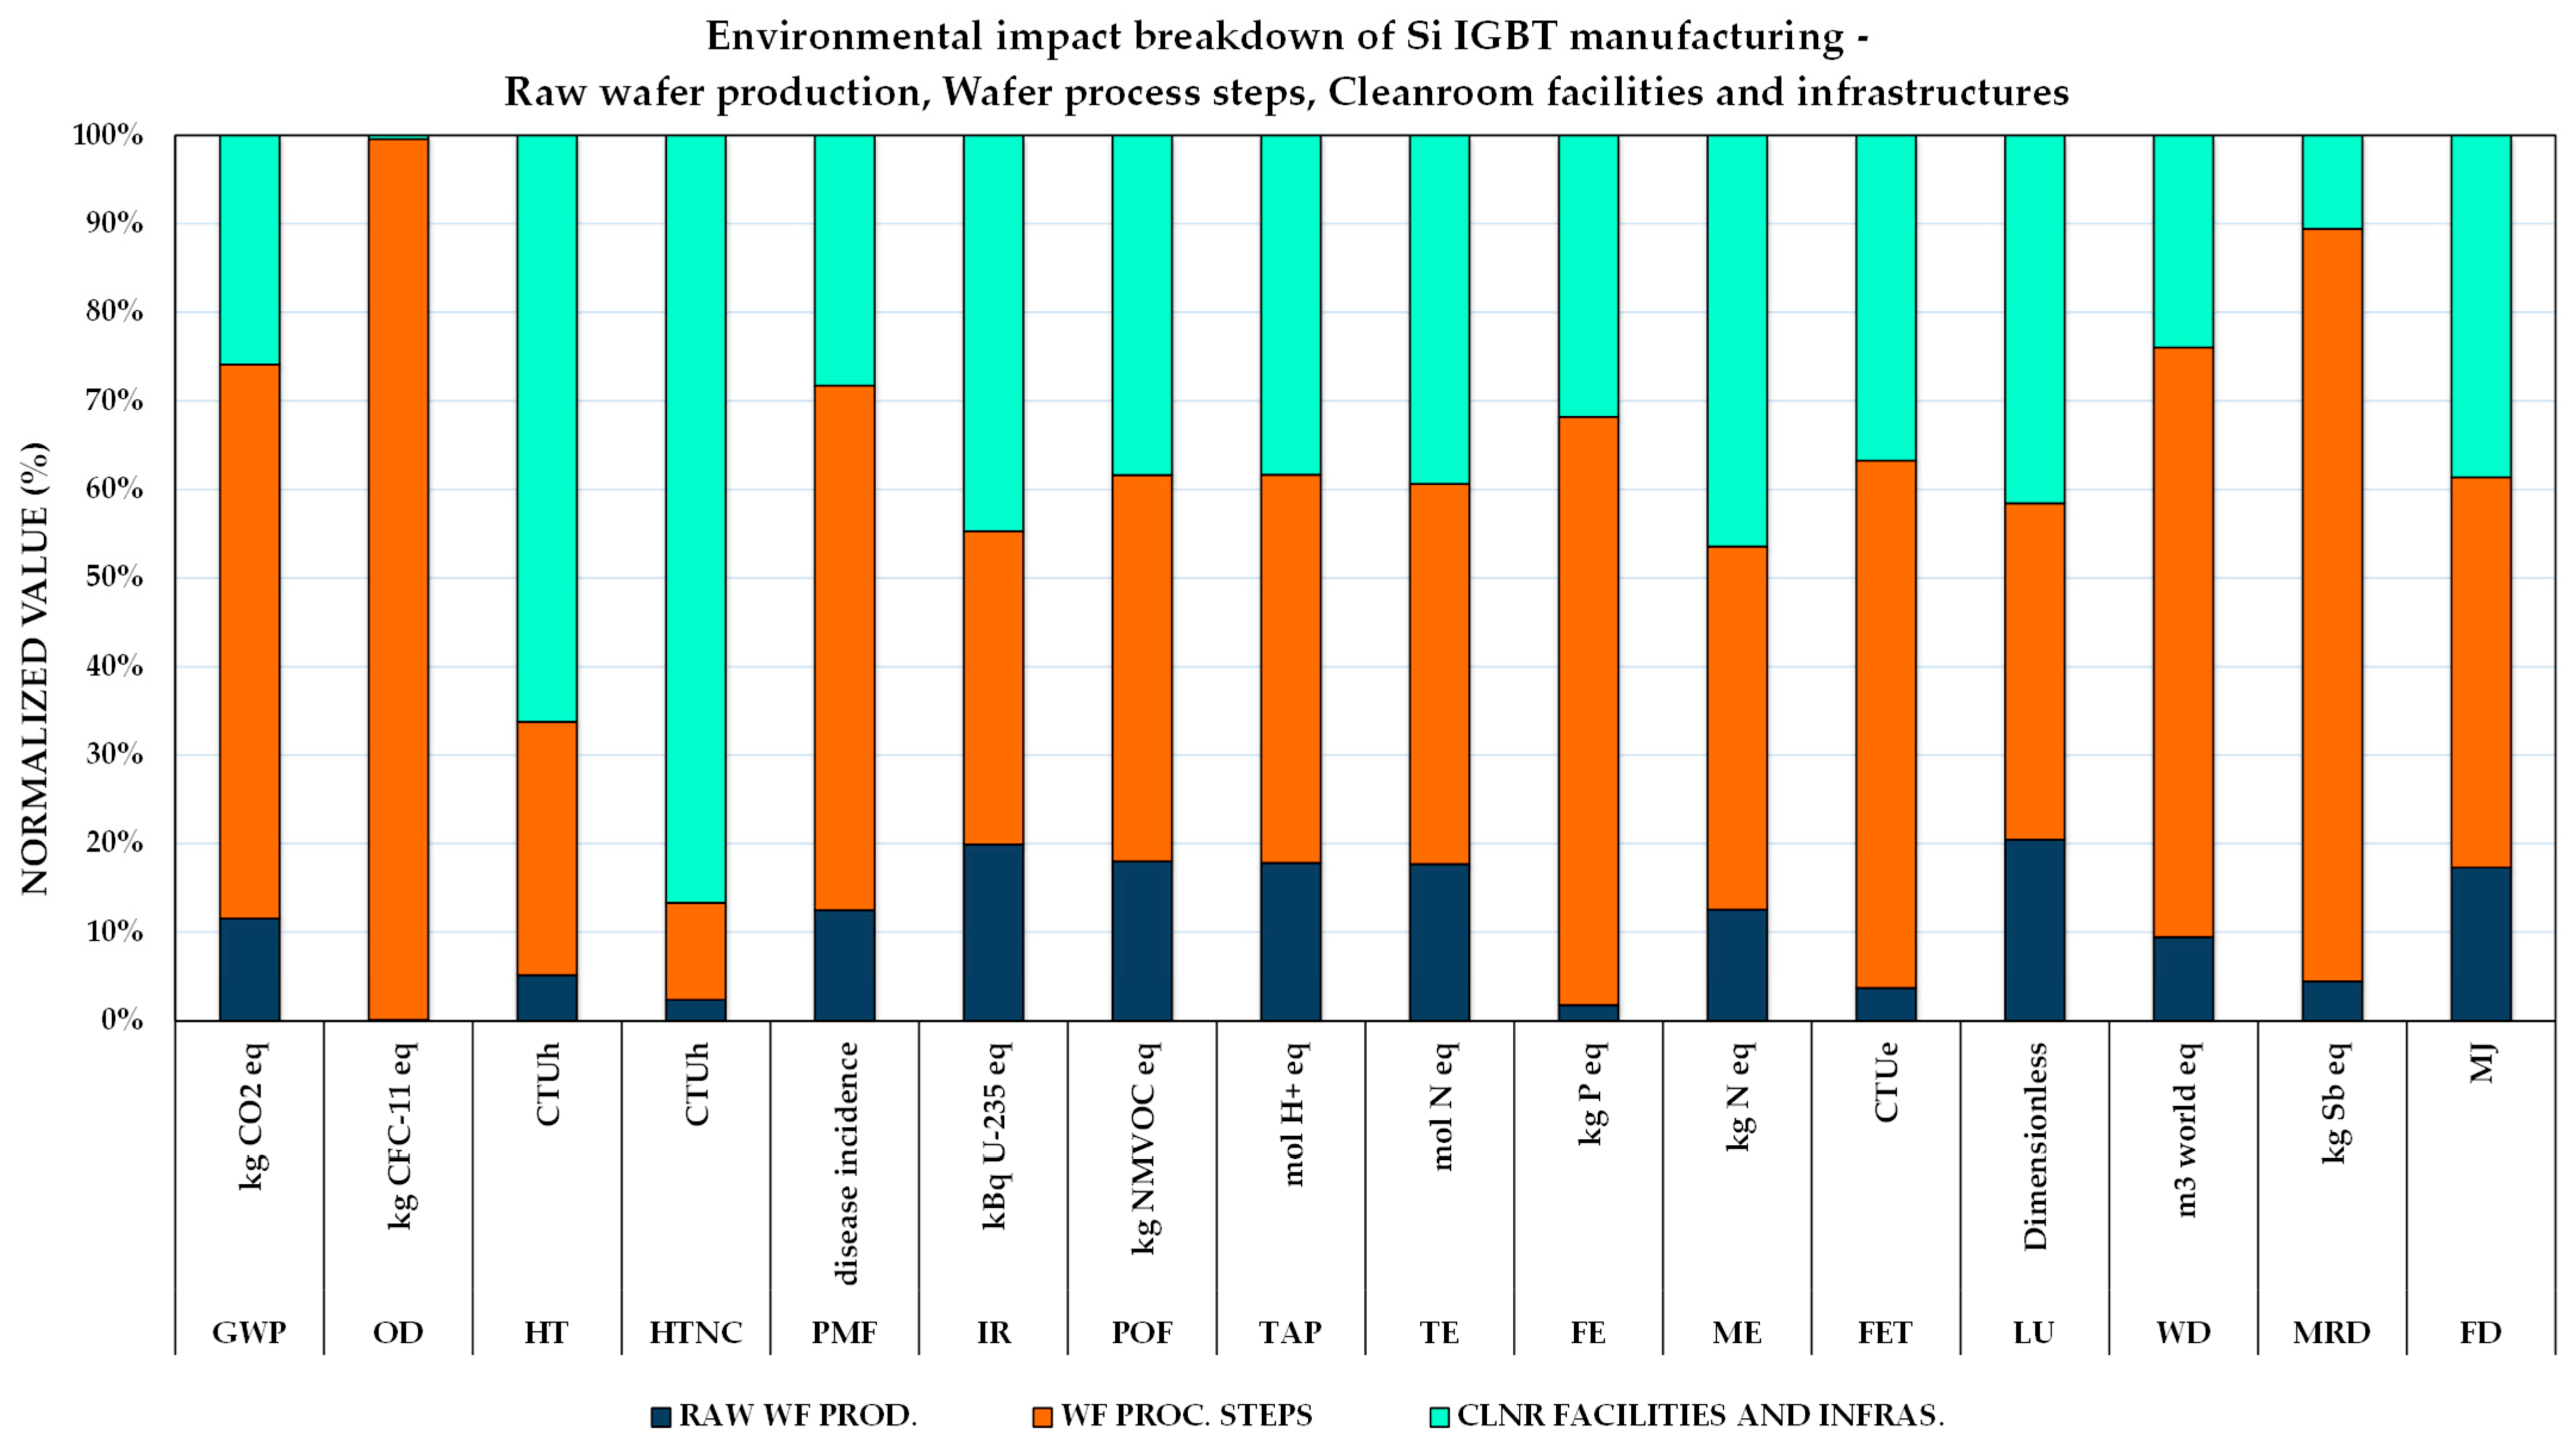
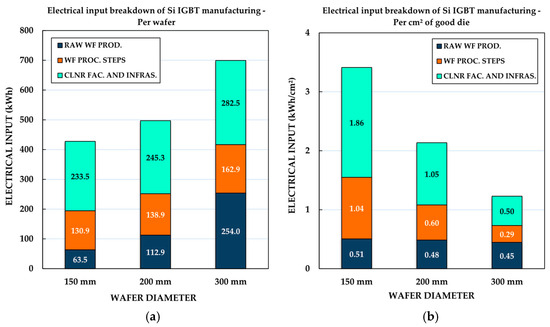
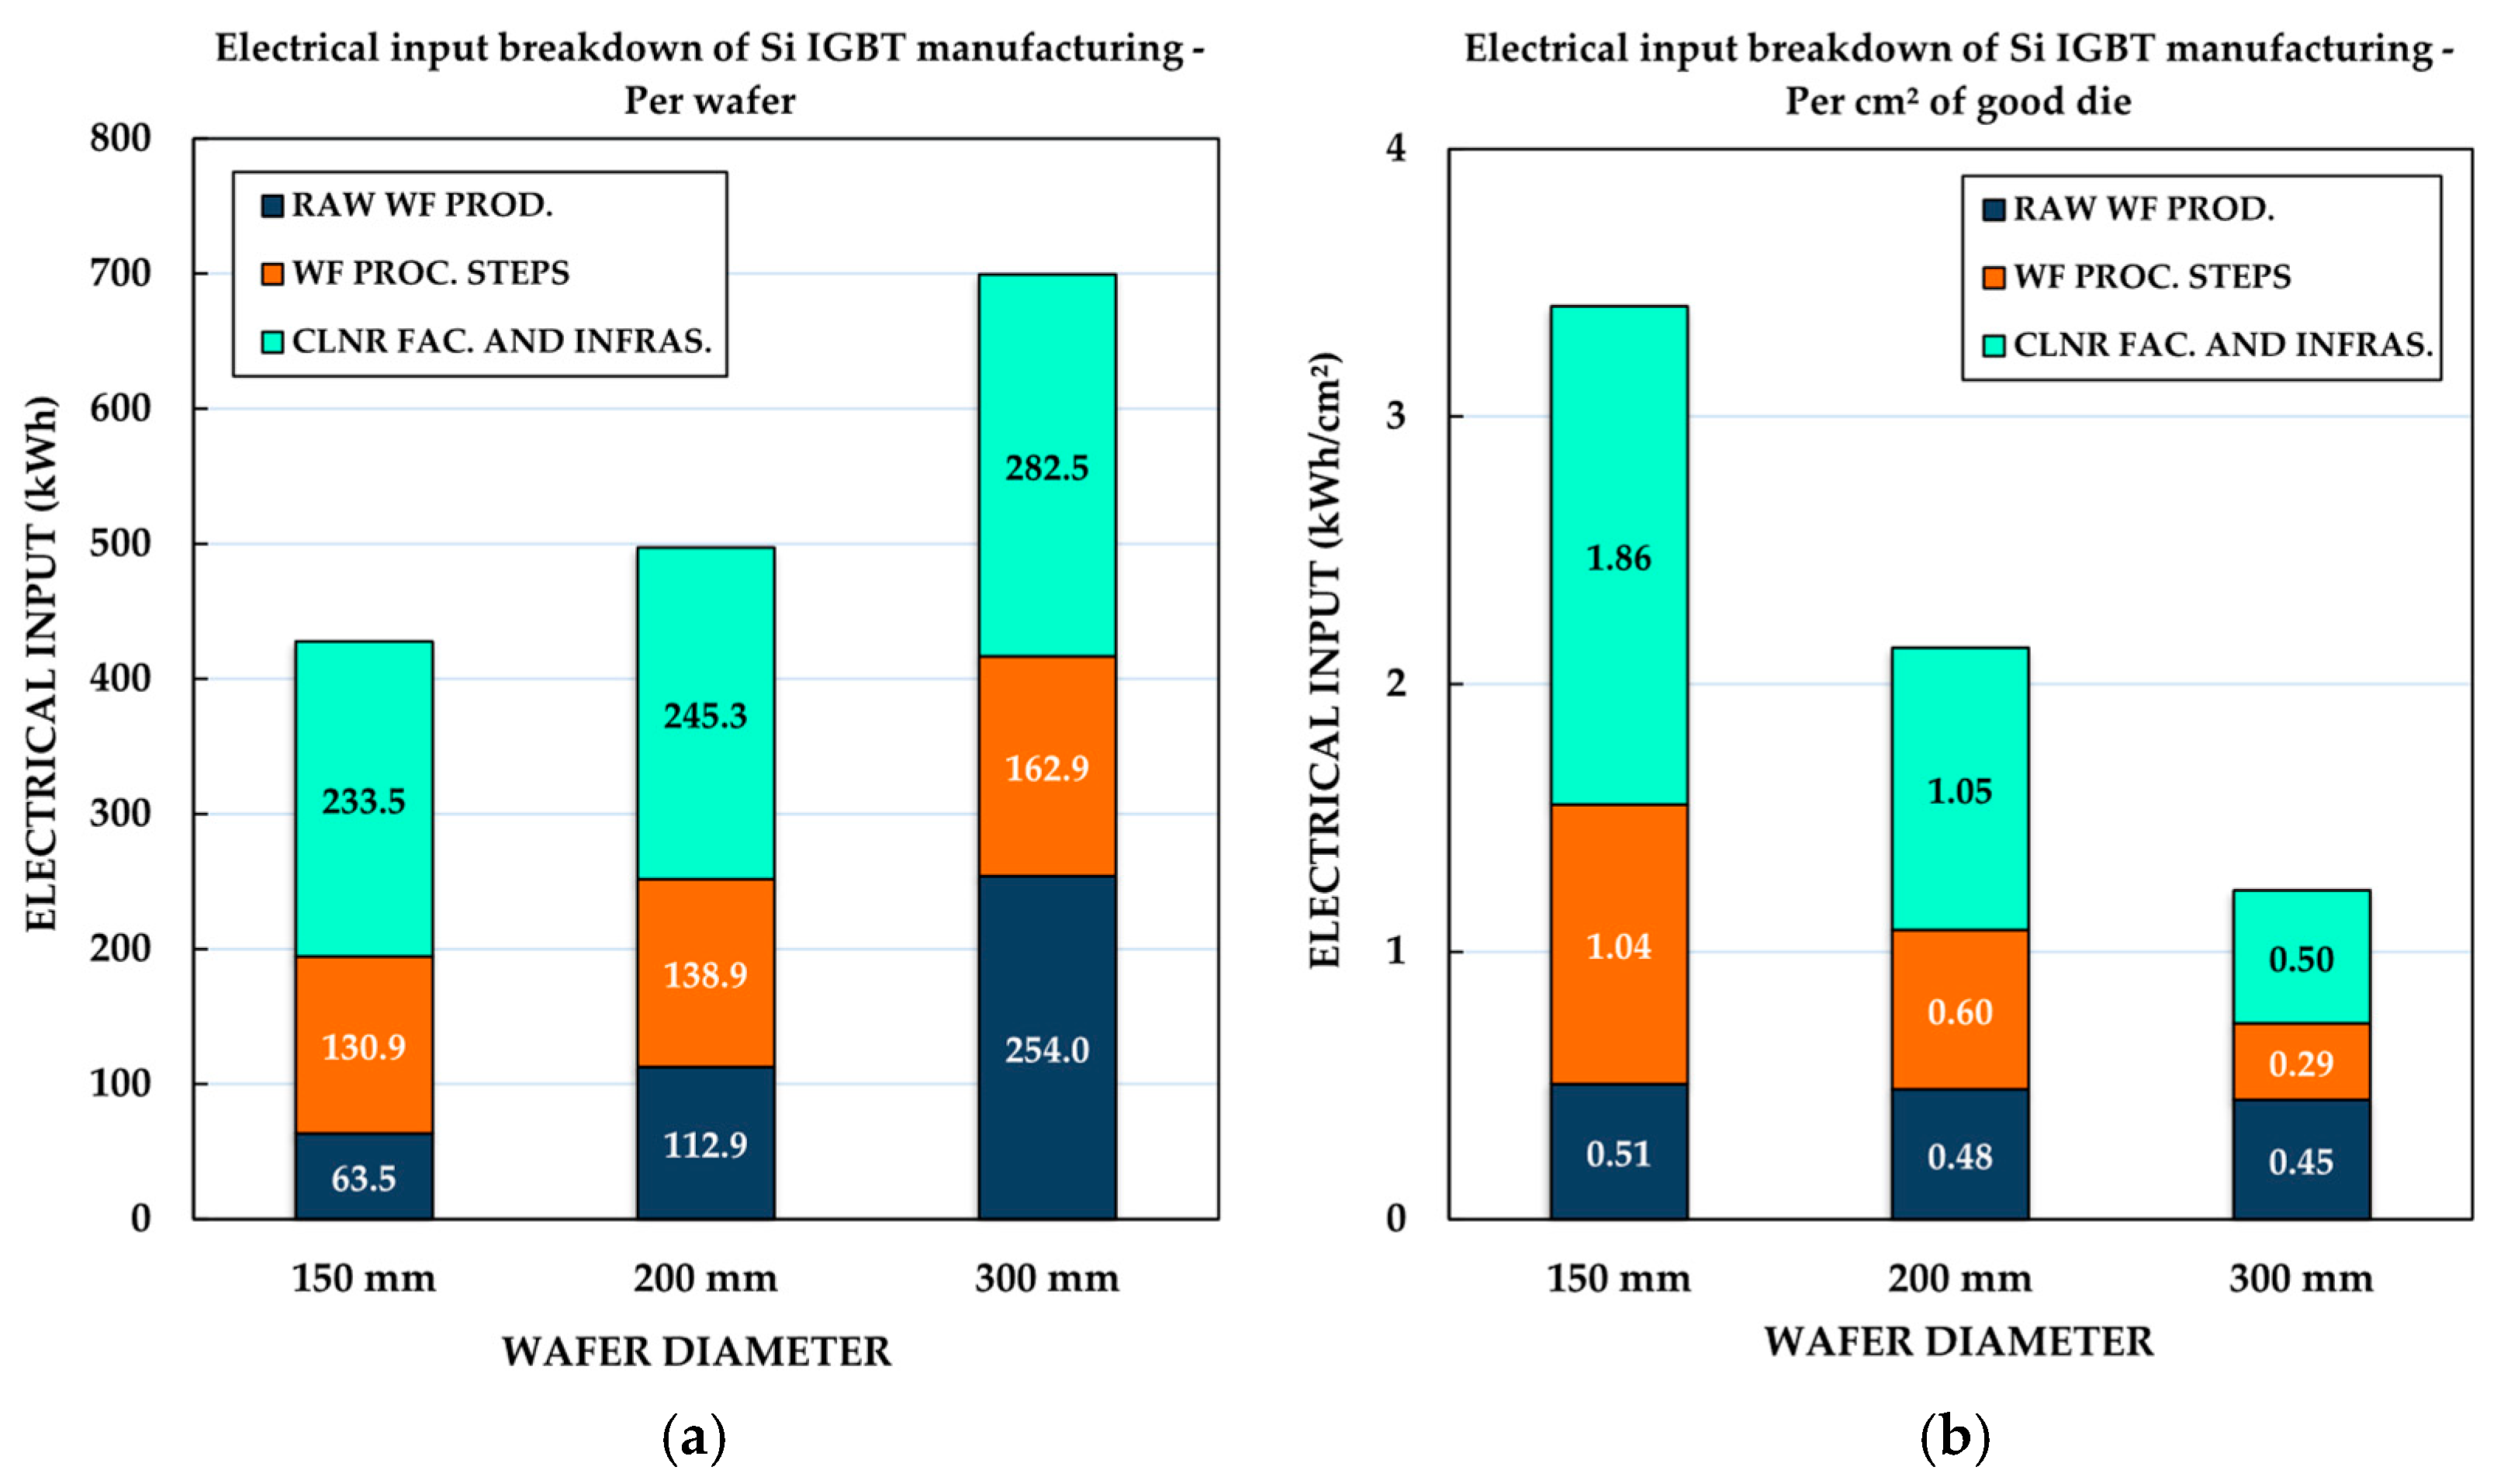
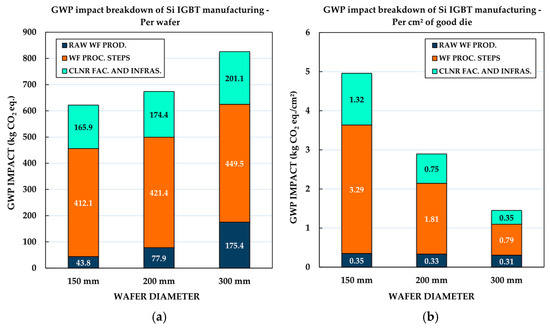
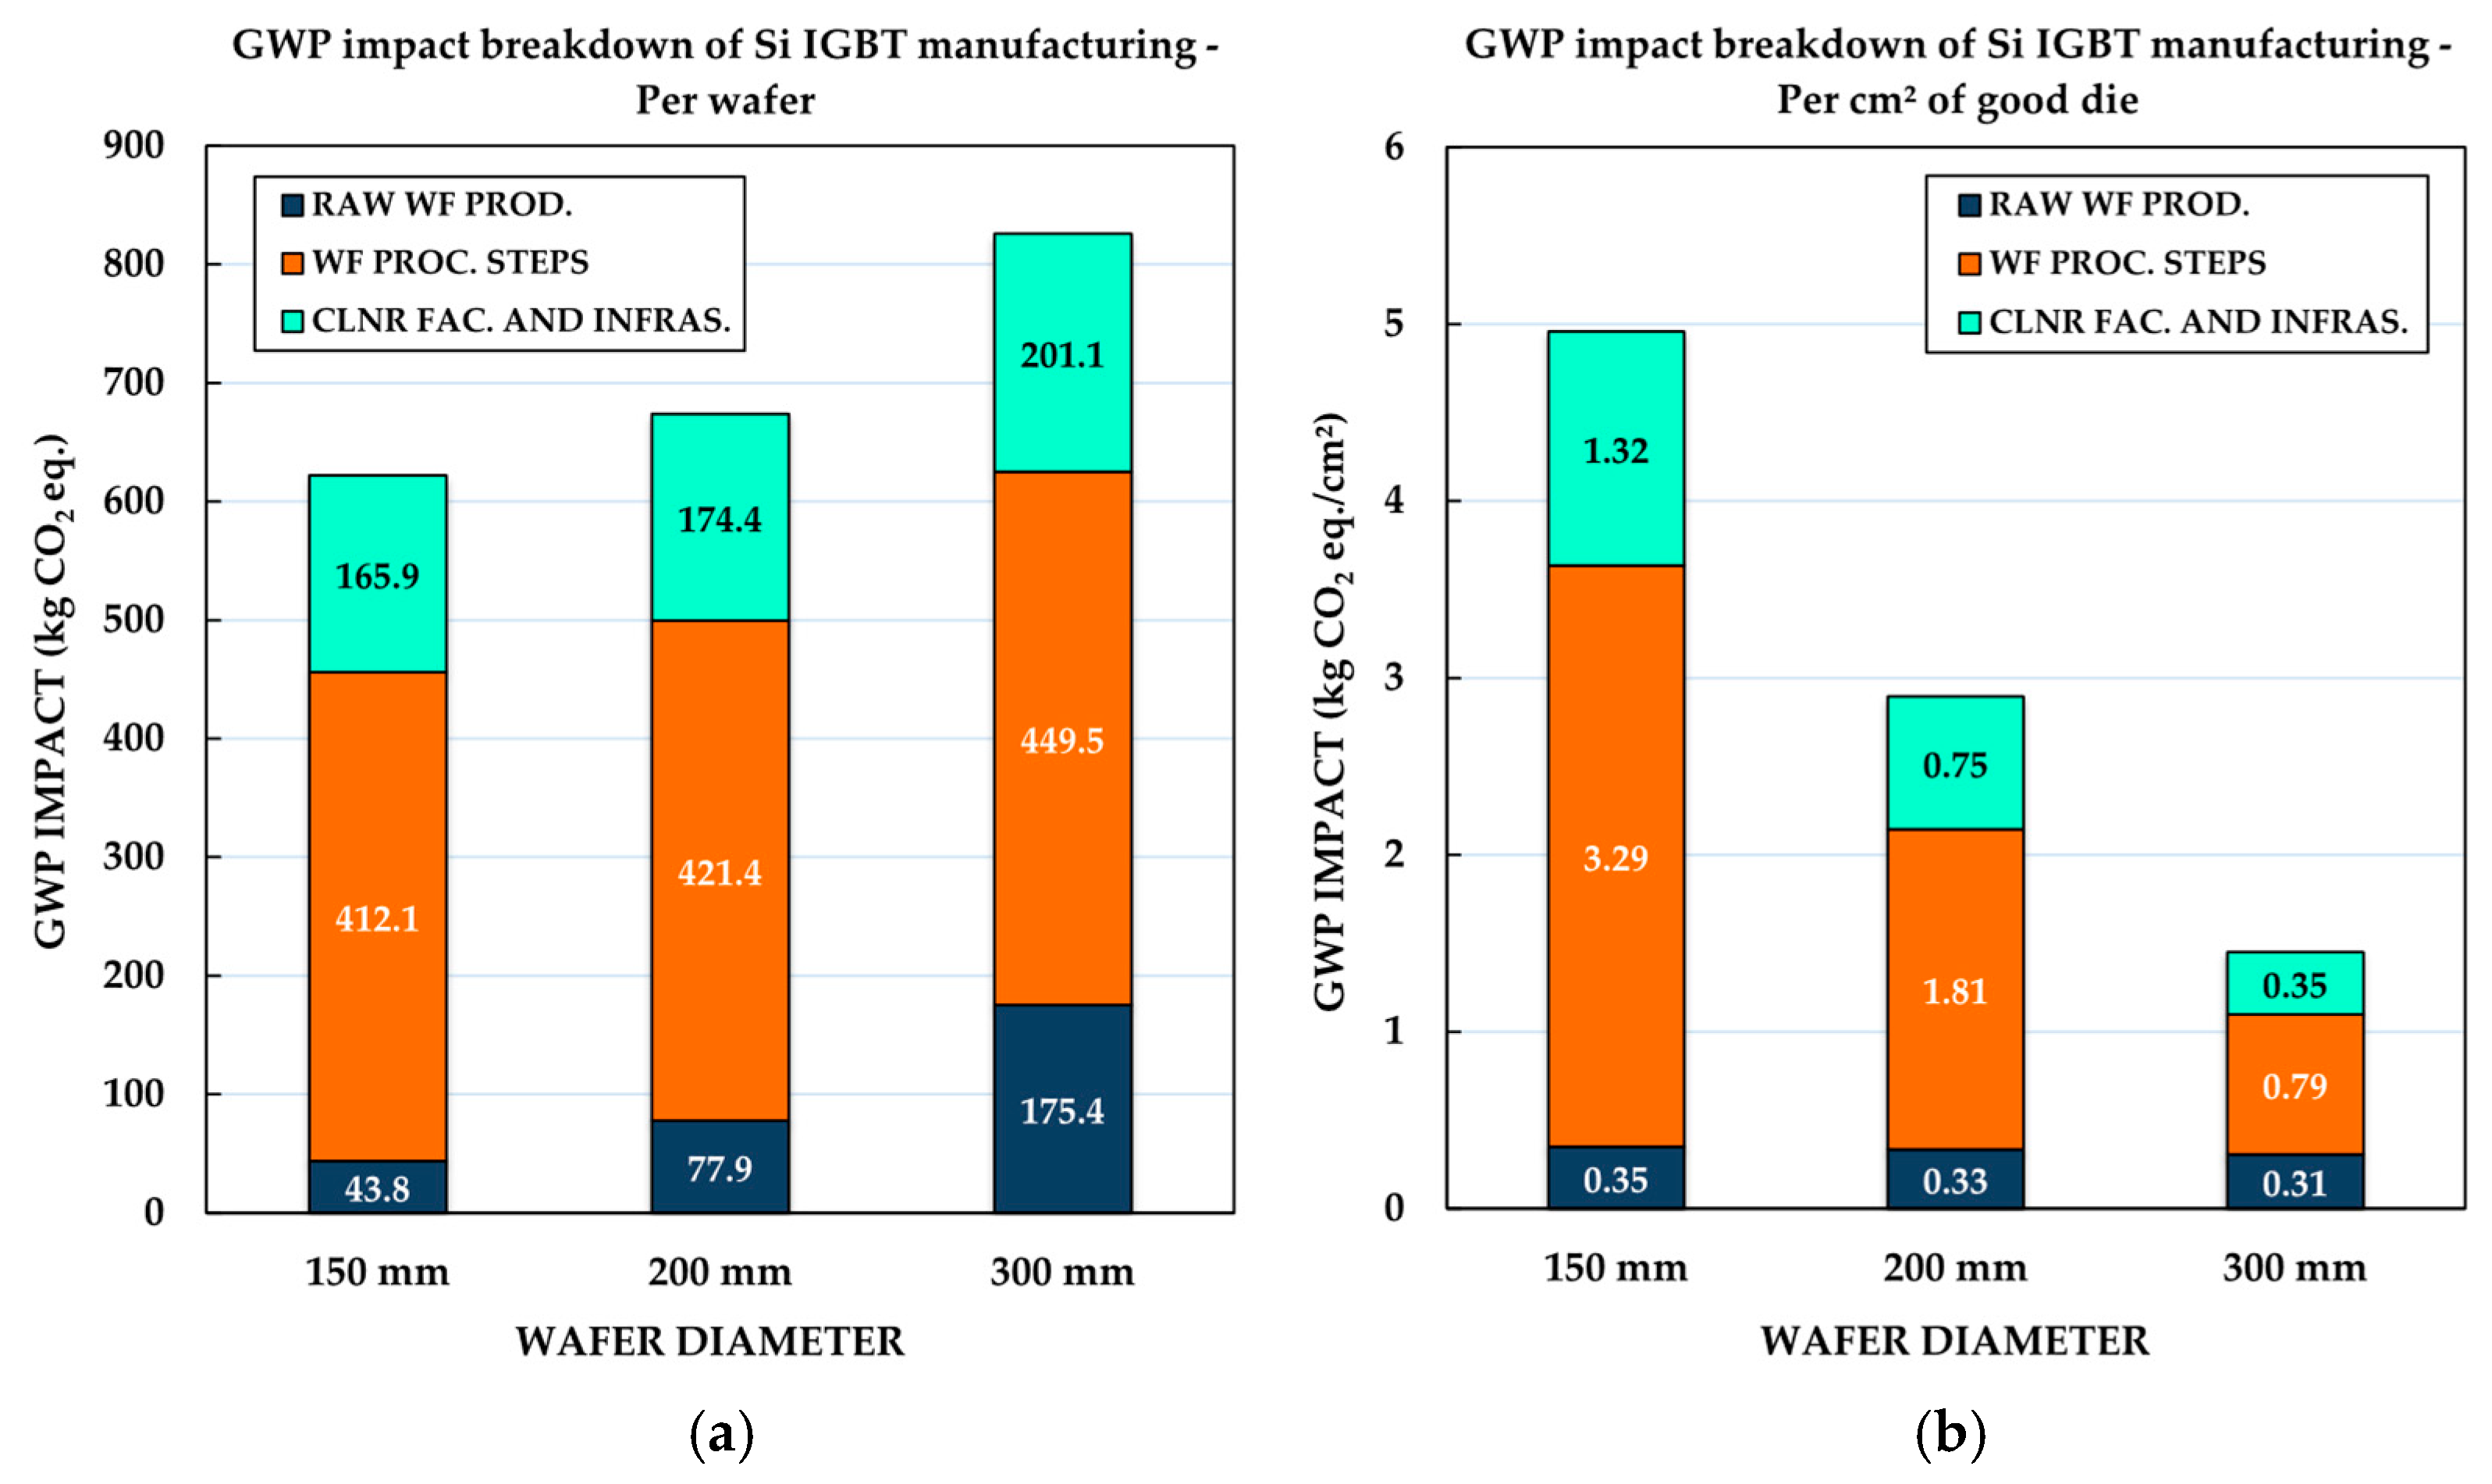
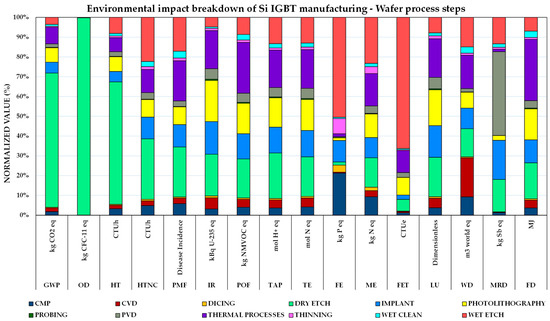
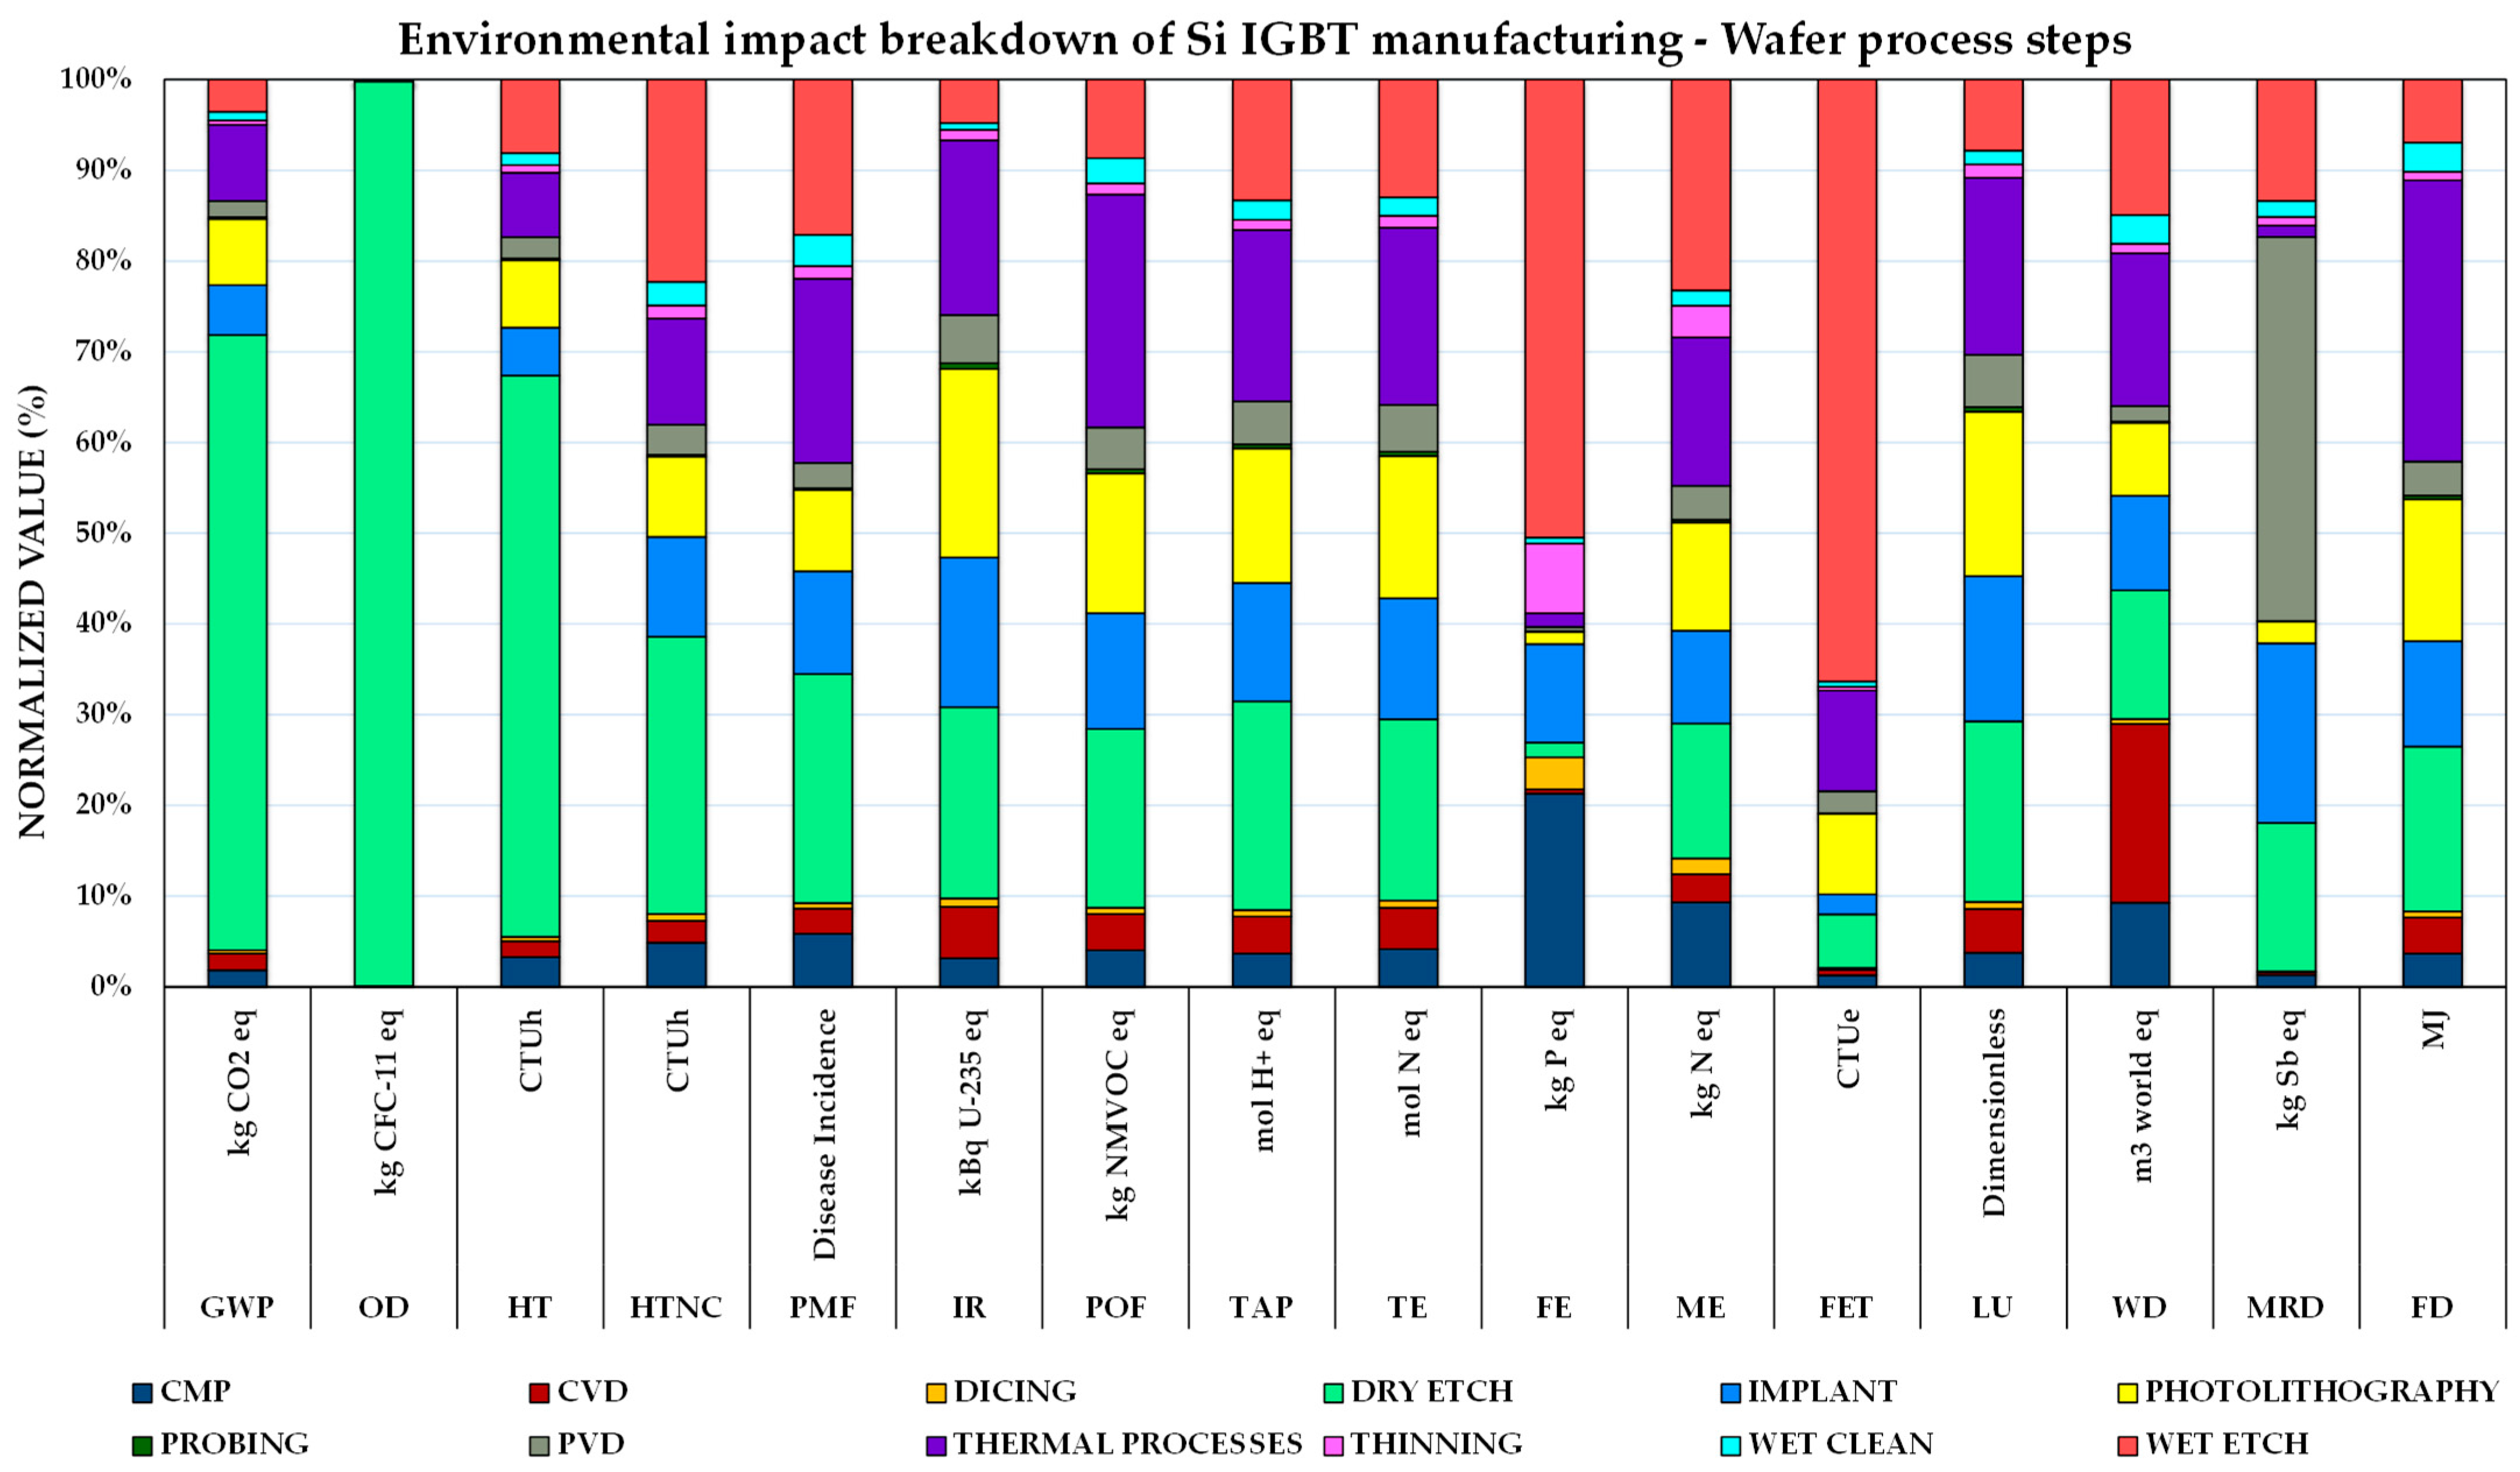
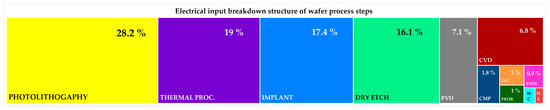

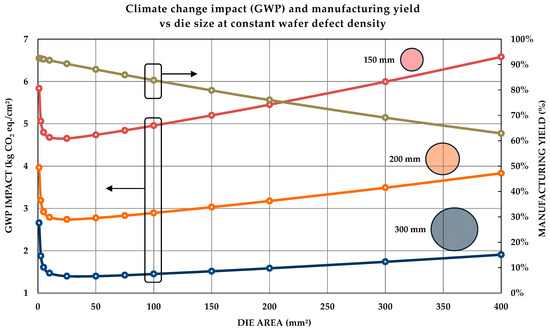
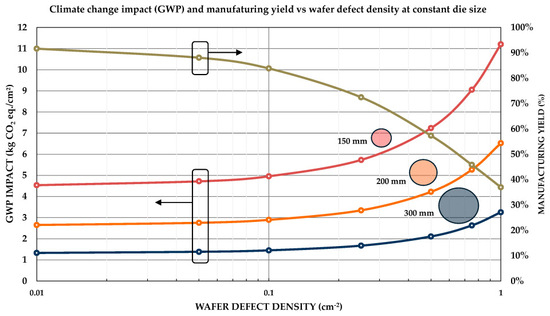
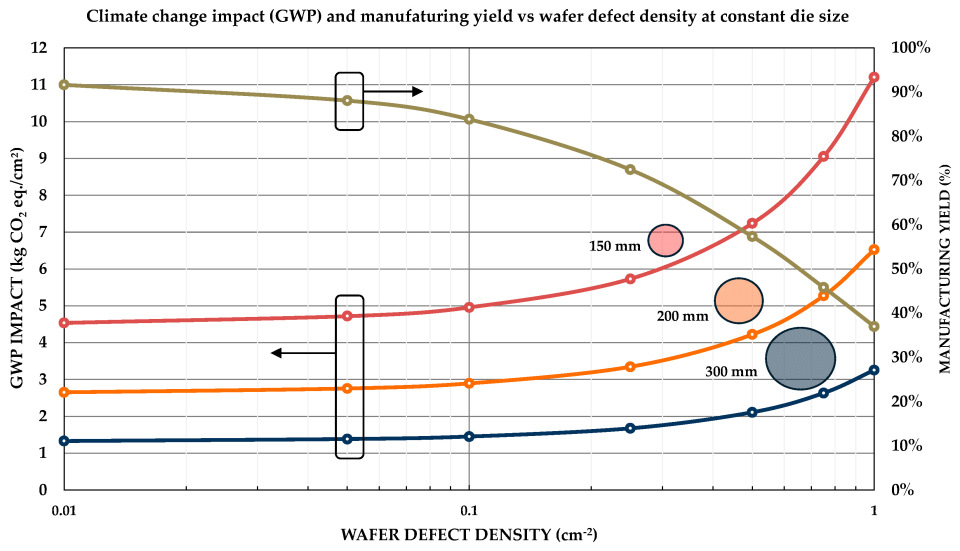
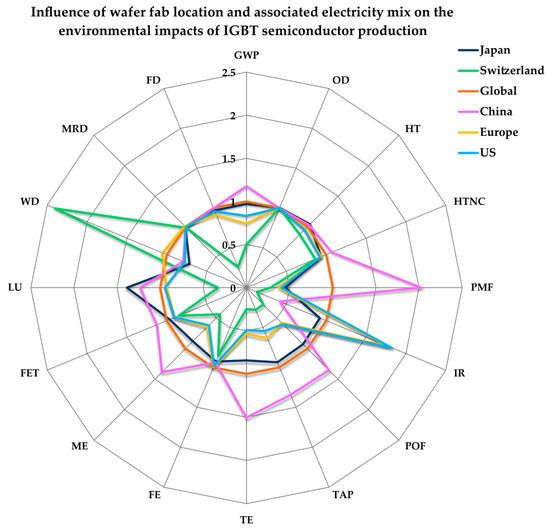
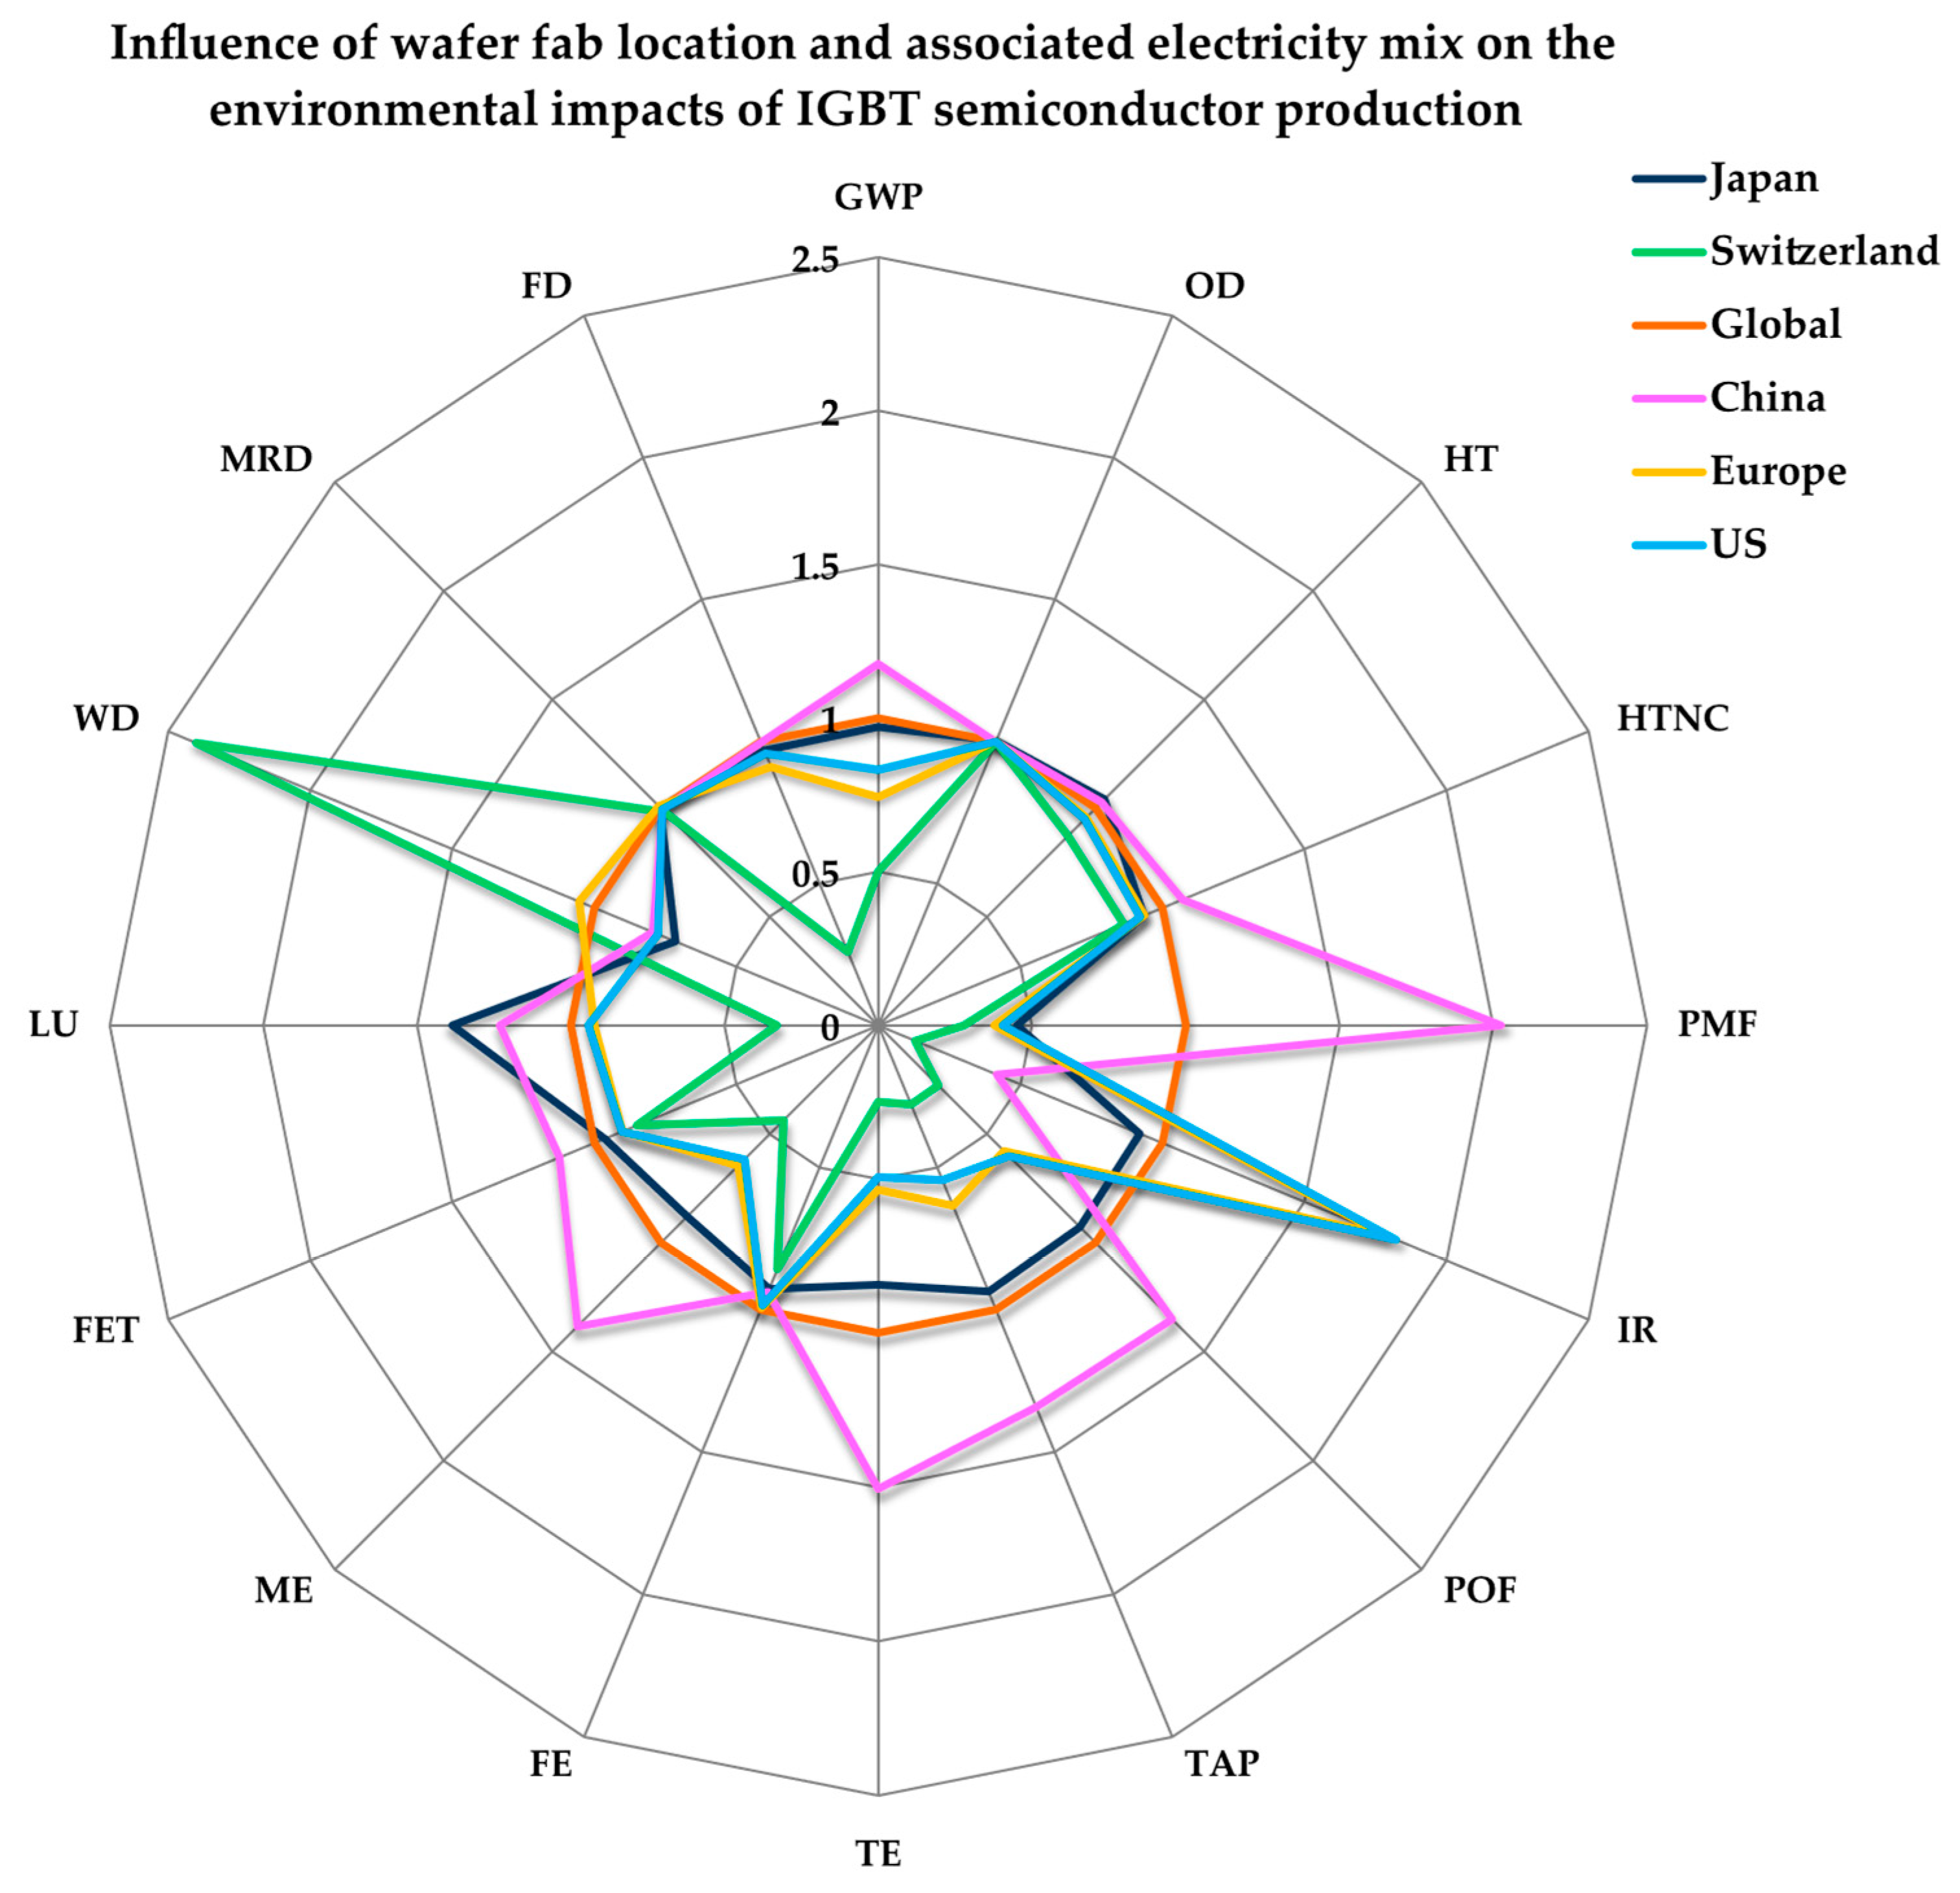
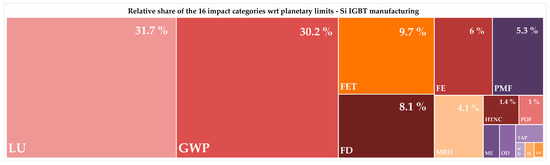
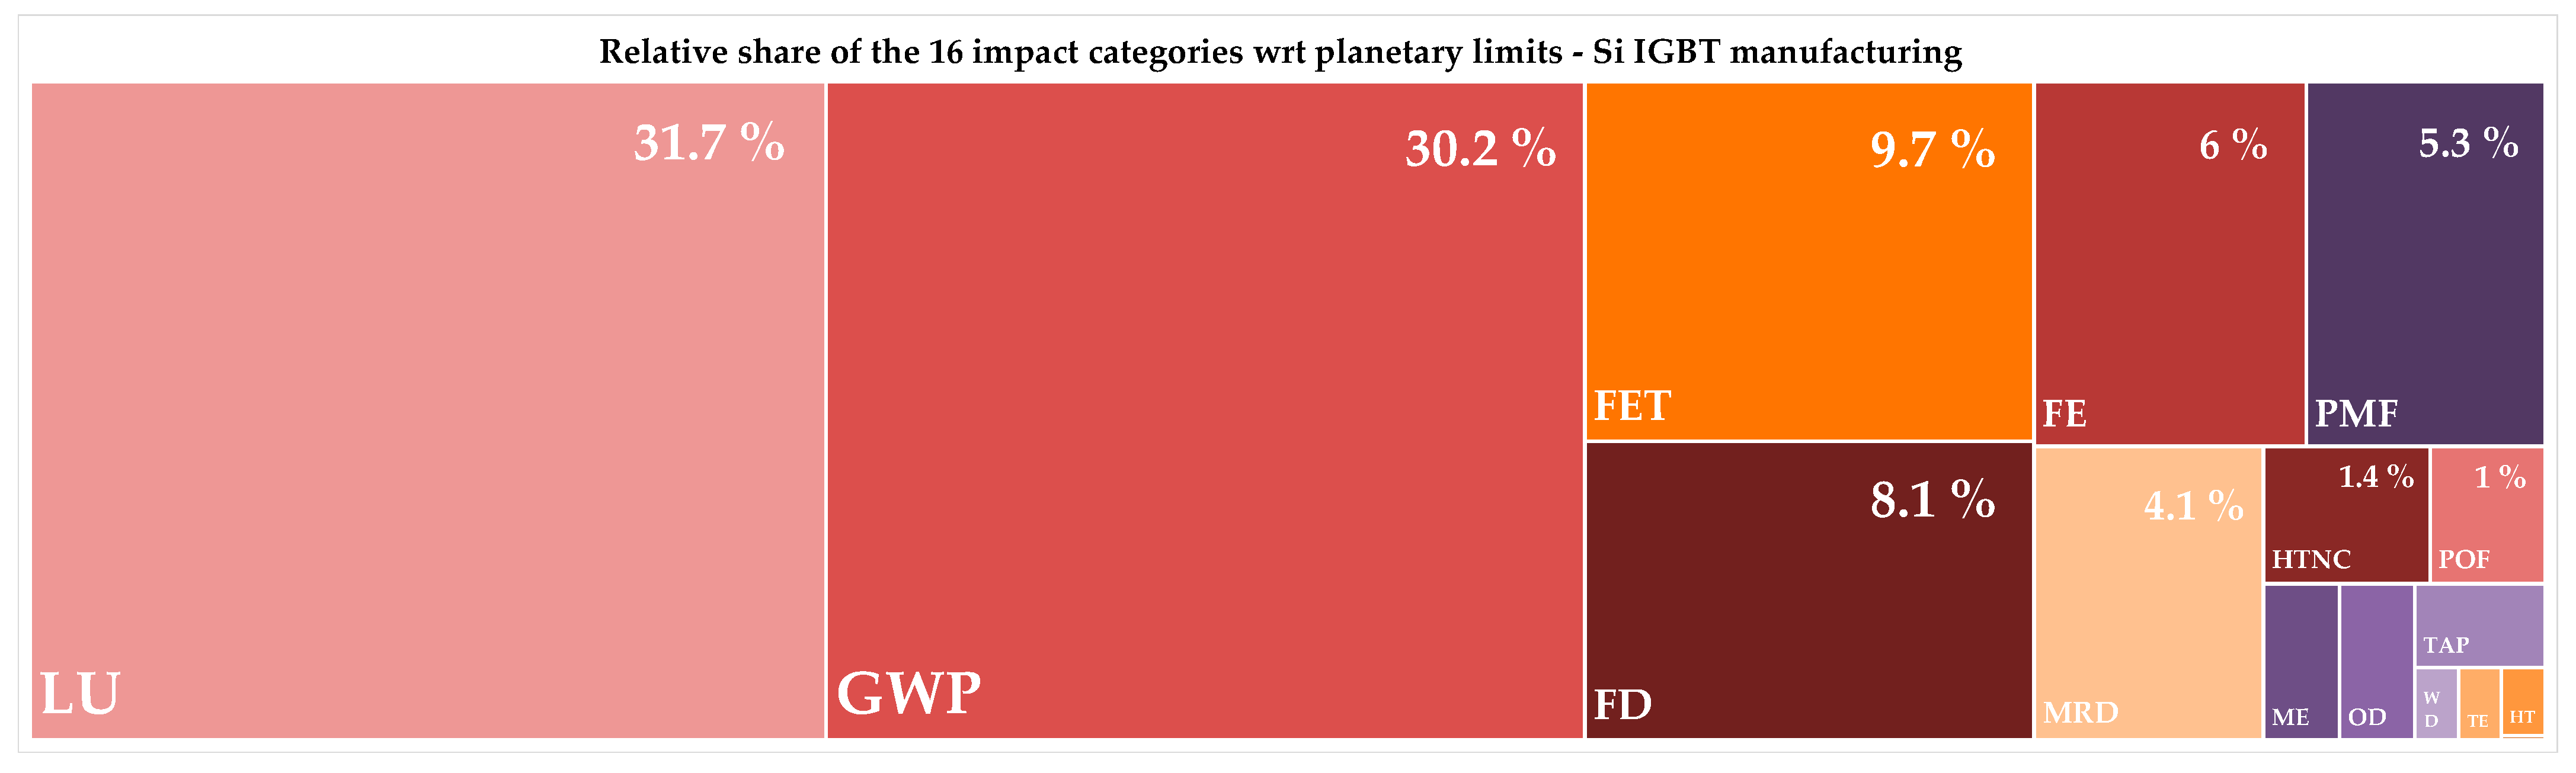
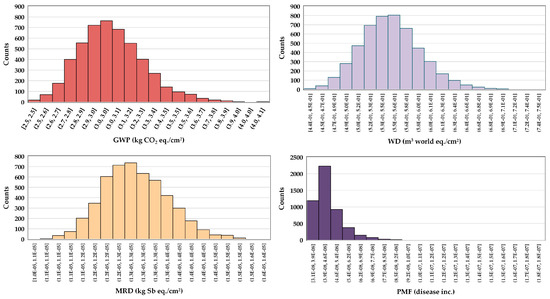
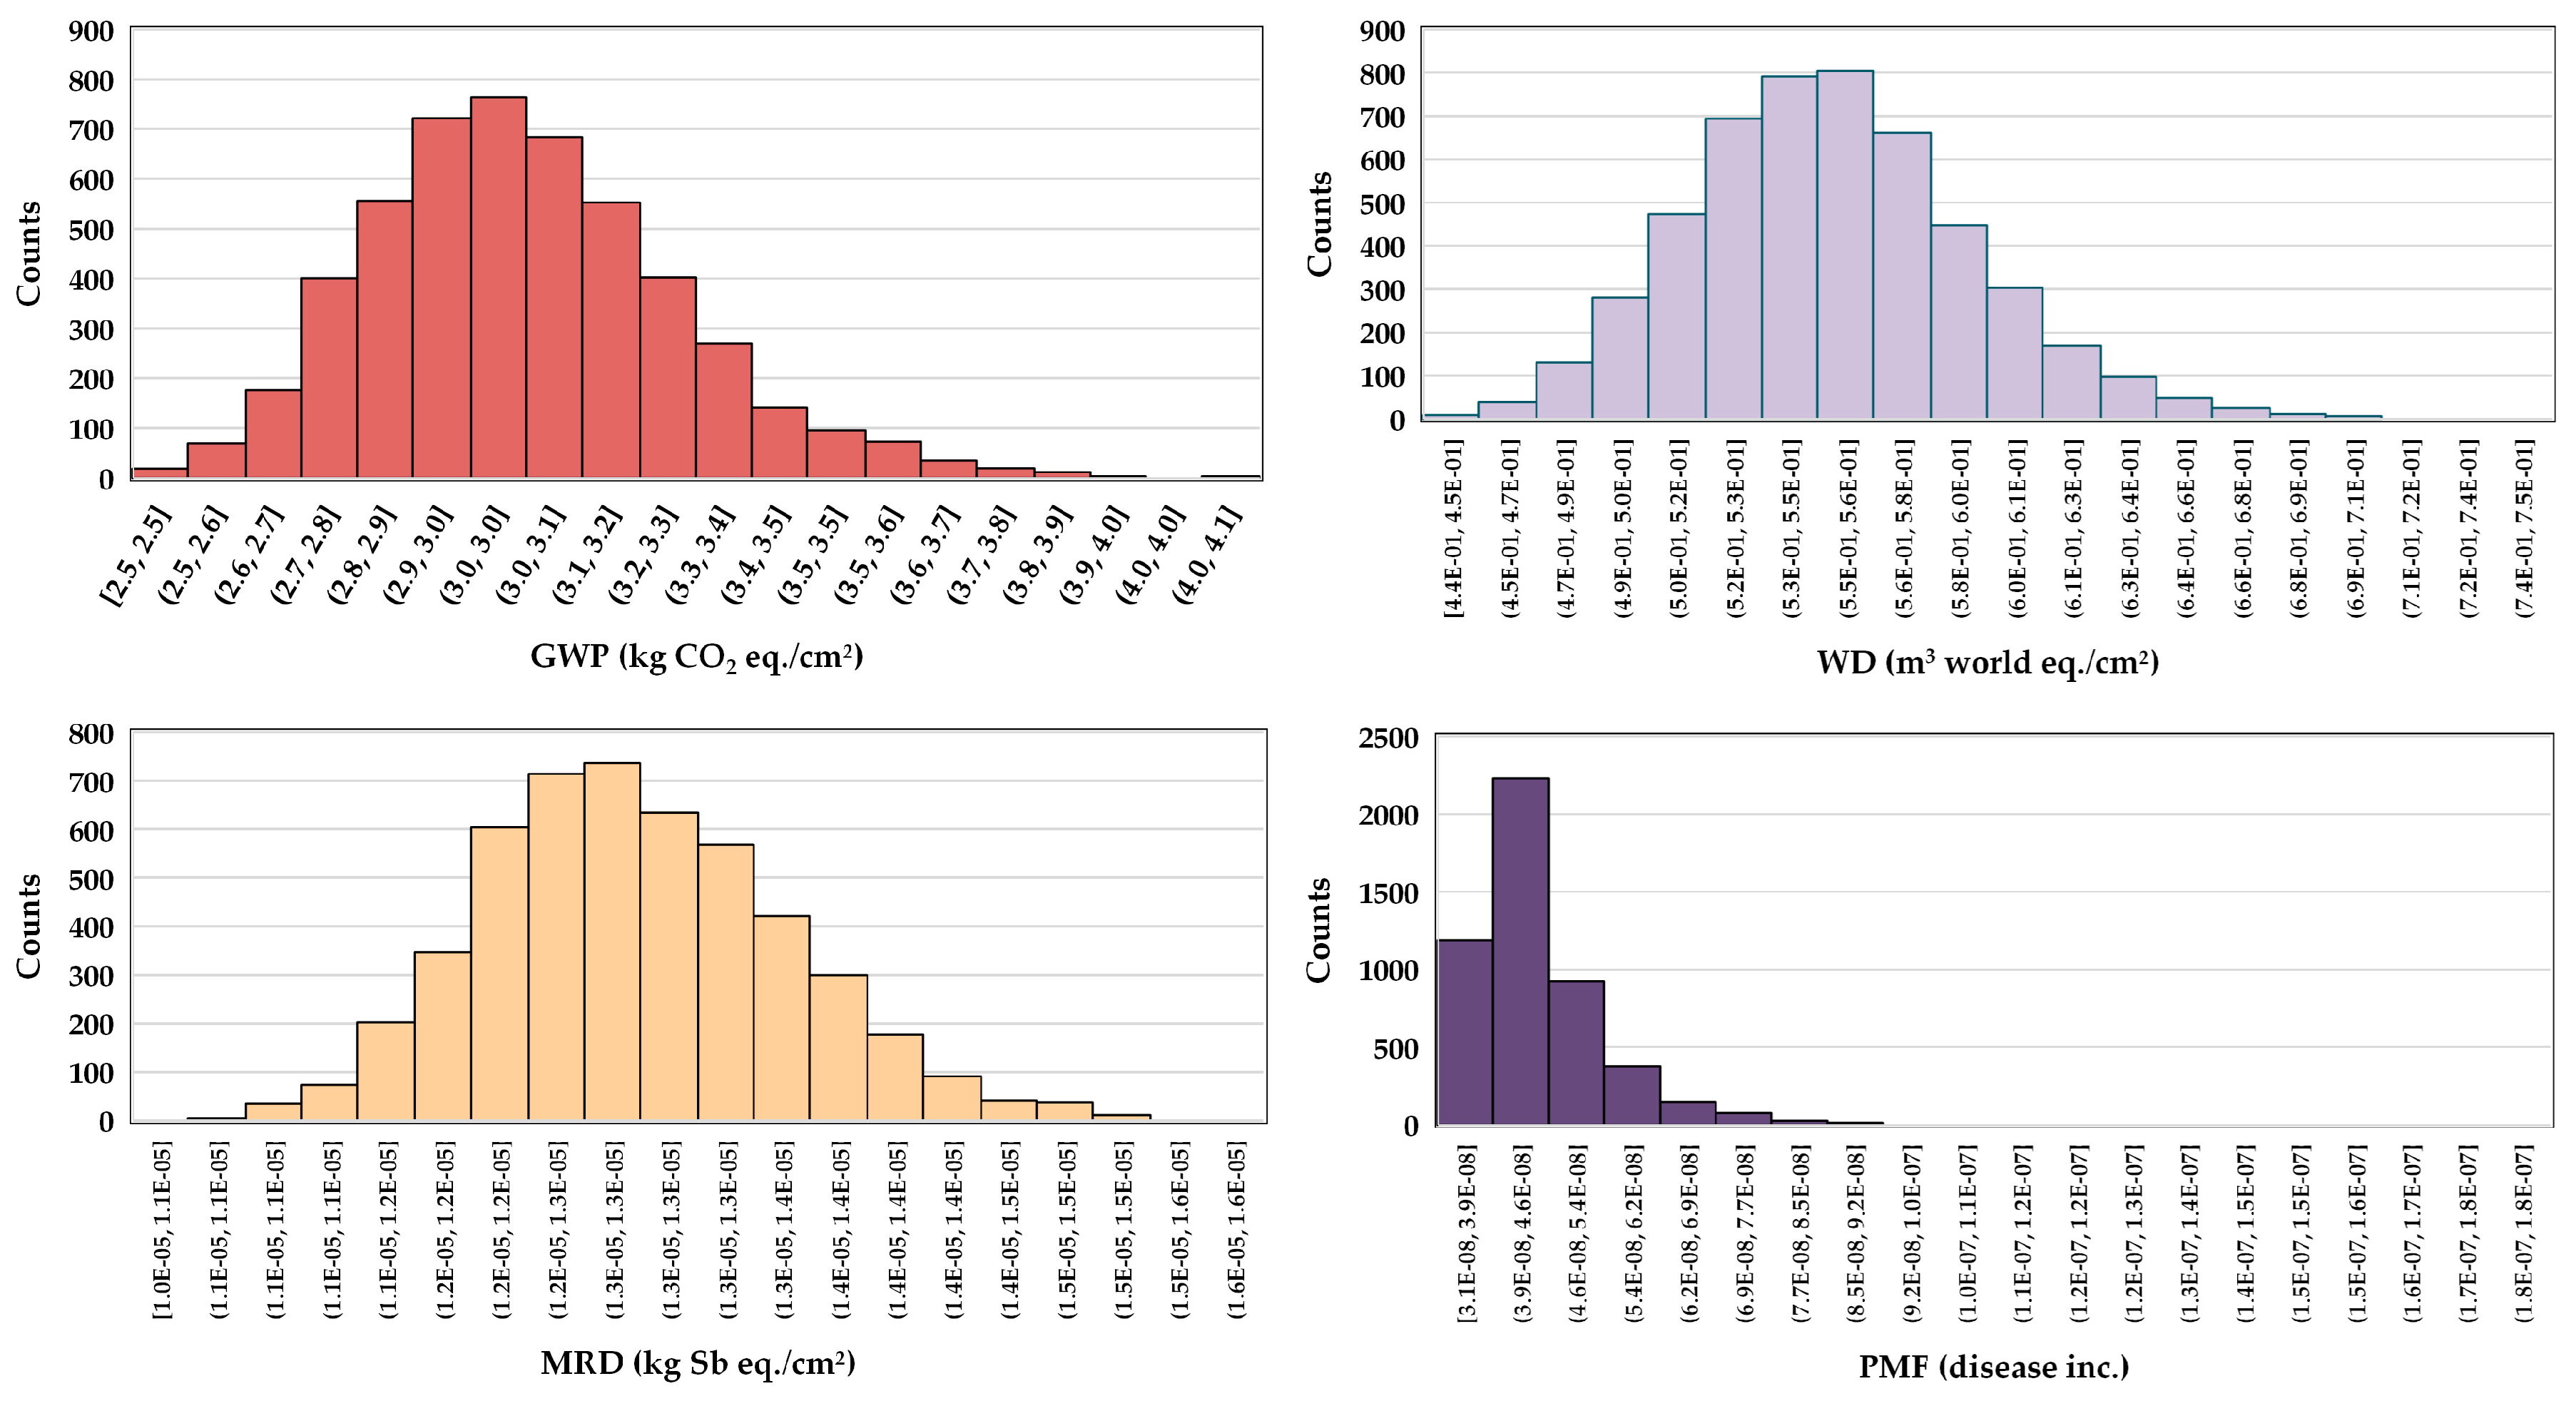

Disclaimer/Publisher’s Note: The statements, opinions and data contained in all publications are solely those of the individual author(s) and contributor(s) and not of MDPI and/or the editor(s). MDPI and/or the editor(s) disclaim responsibility for any injury to people or property resulting from any ideas, methods, instructions or products referred to in the content. |
© 2026 by the authors. Licensee MDPI, Basel, Switzerland. This article is an open access article distributed under the terms and conditions of the Creative Commons Attribution (CC BY) license.