


Abstract
Differentiating between authentic corporate compliance and strategic avoidance is of paramount importance for the evaluation of carbon-emission reduction policies. Leveraging China’s Total Carbon-Emission Control Policy (TCP) as a quasi-natural experiment, the influence of carbon regulations on corporate ESG performance was investigated in this study. Three significant patterns were identified by analyzing data of Chinese non-financial A-share listed companies from 2009 to 2023 through a difference-in-differences (DID) design. First, after the implementation of the TCP, the ESG performance of firms demonstrated an increase of 0.1309 on the Huazheng ESG index, indicating substantial compliance. Second, the positive impact is more obvious in state-owned enterprises, enterprises located in the eastern regions, large-scale enterprises, and industries with high pollution, which possess stronger institutional capacity and enforcement. Third, the mechanism analysis reveals that the TCP exerts opposing forces: it promotes ESG performance via green innovation while simultaneously increasing rent-seeking costs. The net positive effect implies that substantial compliance prevails. These findings passed robustness checks. The results suggest that carbon regulations can propel corporate sustainability when institutional design achieves a balance between targets and transparency, offering insights for the climate policies of emerging economies.
1. Introduction
The ecological crisis triggered by global climate change has reached an unprecedentedly severe level (Zhang et al., 2024) [1] and has made carbon reduction a top priority worldwide (Yang et al., 2025) [2]. Countries are committed to controlling carbon emissions and have introduced various governance policies. The European Union runs the world’s largest carbon trading market (EU ETS), enforces the “Carbon Border Adjustment Mechanism” (CBAM), and levies carbon tariffs on six imported industries such as steel and cement. The United Kingdom has adopted a legally binding “carbon budget” system, setting emission caps every five years and considering exceedance a violation. It has also established a domestic carbon tariff mechanism and integrated it with the EU CBAM. The United States uses tax credits to support enterprises in cutting carbon emissions. Japan promotes “Green Transformation” (GX) bonds, focusing on hydrogen energy and offshore wind power technologies. Canada implements a federal carbon pricing system and combines it with clean fuel regulations to reduce emission intensity. China has the highest carbon emissions globally, accounting for about 28–30% of the world’s total. It is particularly worth noting that at the 75th session of the United Nations General Assembly in 2020, China committed to achieving carbon emissions peaking by 2030 and achieving carbon neutrality by 2060 (Wang et al., 2025; Zhang et al., 2025) [3,4]. This commitment is 5 to 10 years ahead of the carbon neutrality timeline set out in the Paris Agreement, demonstrating China’s determination in the fight against carbon emissions (Shi et al., 2022) [5]. In response to the implementation of the government’s Total Carbon-Emission Control Policy (TCP), enterprises may adopt two completely different approaches: substantive compliance or strategic avoidance.
The interplay between substantive compliance and strategic avoidance is crucial for the effectiveness of environmental regulation (Ma et al., 2024; Zhang, 2022) [6,7]. Substantive compliance occurs when enterprises incorporate regulatory requirements into their core operations and reallocate resources to achieve actual emission reduction (Porter & Vander Linde, 1995) [8]. Conversely, strategic avoidance entails symbolic adoption without operational alteration, encompassing greenwashing and regulatory evasion (Lyon & Maxwell, 2011; Zhang, 2022) [7,9]. Although the existing literature has investigated these responses independently, the theoretical exploration of the co-existence of both behaviors within a single regulatory context remains underdeveloped.
Crucially, empirically differentiating between these behaviors poses challenges. Previous studies have relied on self-reported disclosures or single-dimensional outcomes, which are susceptible to manipulation and unable to capture true compliance. We contend that ESG performance serves as a more robust behavioral proxy for three reasons. First, in contrast to carbon disclosures, ESG ratings integrate multiple dimensions, rendering window-dressing more costly and easier to detect. Second, third-party ESG assessments utilize both hard metrics and soft disclosures, decreasing reliance on unverifiable assertions. Third, recent advancements in ESG rating methodology, such as the Huazheng ESG index, enhance objectivity and alleviate concerns regarding rating reliability. Therefore, ESG performance reveals behavioral patterns: sustained improvement indicates compliance, whereas stagnant or declining performance signals avoidance.
Existing investigations into the efficacy of carbon regulation predominantly adopt a unidirectional framework, either emphasizing the achievements of policies in fostering green innovation (Porter hypothesis) or documenting the failures of regulation attributable to evasion behaviors (Zhang, 2022; Zhang et al., 2024) [1,7]. For instance, studies on China’s carbon trading scheme concentrate on the outcomes of emission reduction (Dong et al., 2022) [10], whereas other research demonstrates the prevalence of greenwashing and rent-seeking under environmental regulations (Ma et al., 2024; Schwerin & Prier, 2013) [6,11]. Nevertheless, these research strands seldom intersect: compliance studies typically overlook strategic avoidance, and evasion studies frequently treat non-compliance as homogeneous. Consequently, there is a dearth of empirical frameworks to quantify the net effect when both behaviors coexist.
The Total Carbon Emissions Control Policy provides an ideal context to address the existing gap. Distinct from the market-based mechanism of the EU ETS or the legal strictness of the UK Carbon Budget, TCP integrates binding targets with flexible implementation approaches, thereby generating incentives for innovation and regulatory arbitrage. This policy design gives rise to behavioral ambiguity, as identical emission results can stem from technological advancements or creative accounting and lobbying. In the absence of a unified carbon accounting system in China, traditional emission-based metrics are unable to resolve this ambiguity. We put forward ESG performance as the “criterion” to distinguish behaviors, as it reflects organizational transformations that differentiate genuine compliance from superficial adaptation. This study conceptualizes corporate responses to TCP through a coexistence-offsetting mechanism, in which substantive compliance and strategic avoidance co-function within the same regulatory context. These behaviors are not mutually exclusive and can coexist between different enterprise subgroups or at different developmental stages of a single enterprise. Therefore, the net impact of TCP on aggregate ESG performance is an empirical issue determined by the relative strength of compliance and avoidance forces, necessitating a systematic examination of the prevailing mechanism.
We therefore selected A-share non-financial listed companies from 2009 to 2023 as our sample and employed a DID model to estimate the effect of the aggregate carbon-control policy on ESG performance, thereby revealing whether firms engage in substantive compliance or strategic avoidance. The study reveals the following: (1) Following TCP implementation, firms’ ESG performance improved by an average of 0.1309, consistent with the substantive compliance hypothesis. (2) The policy effects are more pronounced for SOEs and eastern-region firms. (3) TCP not only enhances the ESG performance of enterprises by promoting their independent innovation but also offsets this improvement effect by increasing transaction costs. The findings of this study confirm that firms engage in both substantive compliance and strategic avoidance, with the former ultimately prevailing.
ESG performance was employed in this study to ascertain enterprises’ compliance with total carbon-emission control policies. Dual mechanisms were investigated: total carbon control policies can either stimulate enterprises’ green innovation and enhance ESG performance or augment their rent-seeking behavior and diminish ESG performance. The paper uncovers the possible substantive compliance and symbolic avoidance behaviors of enterprises. The potential contributions of this article may lie in the following four aspects. First, the positive and negative impacts of TCP were evaluated, and the underlying mechanisms were identified. Given that China accounts for 28–30% of global emissions, this fills an important gap. Second, a theoretical integrative dual-mechanism framework was developed. This framework models substantive compliance and strategic avoidance as co-existing responses and reconciles the Porter hypothesis with regulatory evasion theory by determining the conditions under which innovation-driven compliance prevails over rent-seeking avoidance. Third, regarding the empirical methodology, the validity of ESG performance as a behavioral proxy for differentiating regulatory responses was verified. The multidimensional objectivity of third-party ratings was utilized to overcome the manipulation vulnerabilities of self-reported metrics. Fourth, in mechanism analysis, offsetting pathways were identified. Independent innovation enhances ESG performance, while transaction costs diminish it. This indicates that policy effectiveness hinges on the balance between these forces. Collectively, these contributions enhance the understanding of how stringent environmental regulations influence corporate behavior in emerging economies with evolving enforcement capabilities and market institutions.
The remainder of the paper is structured as follows: Section 2 details the theoretical analysis and research hypotheses, Section 3 outlines the empirical research design, Section 4 analyzes the empirical test results and provides explanations, and Section 5 summarizes the research findings and presents policy implications.
2. Hypothesis Development
2.1. Substantive Compliance Analysis
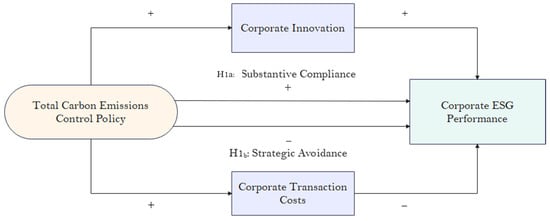
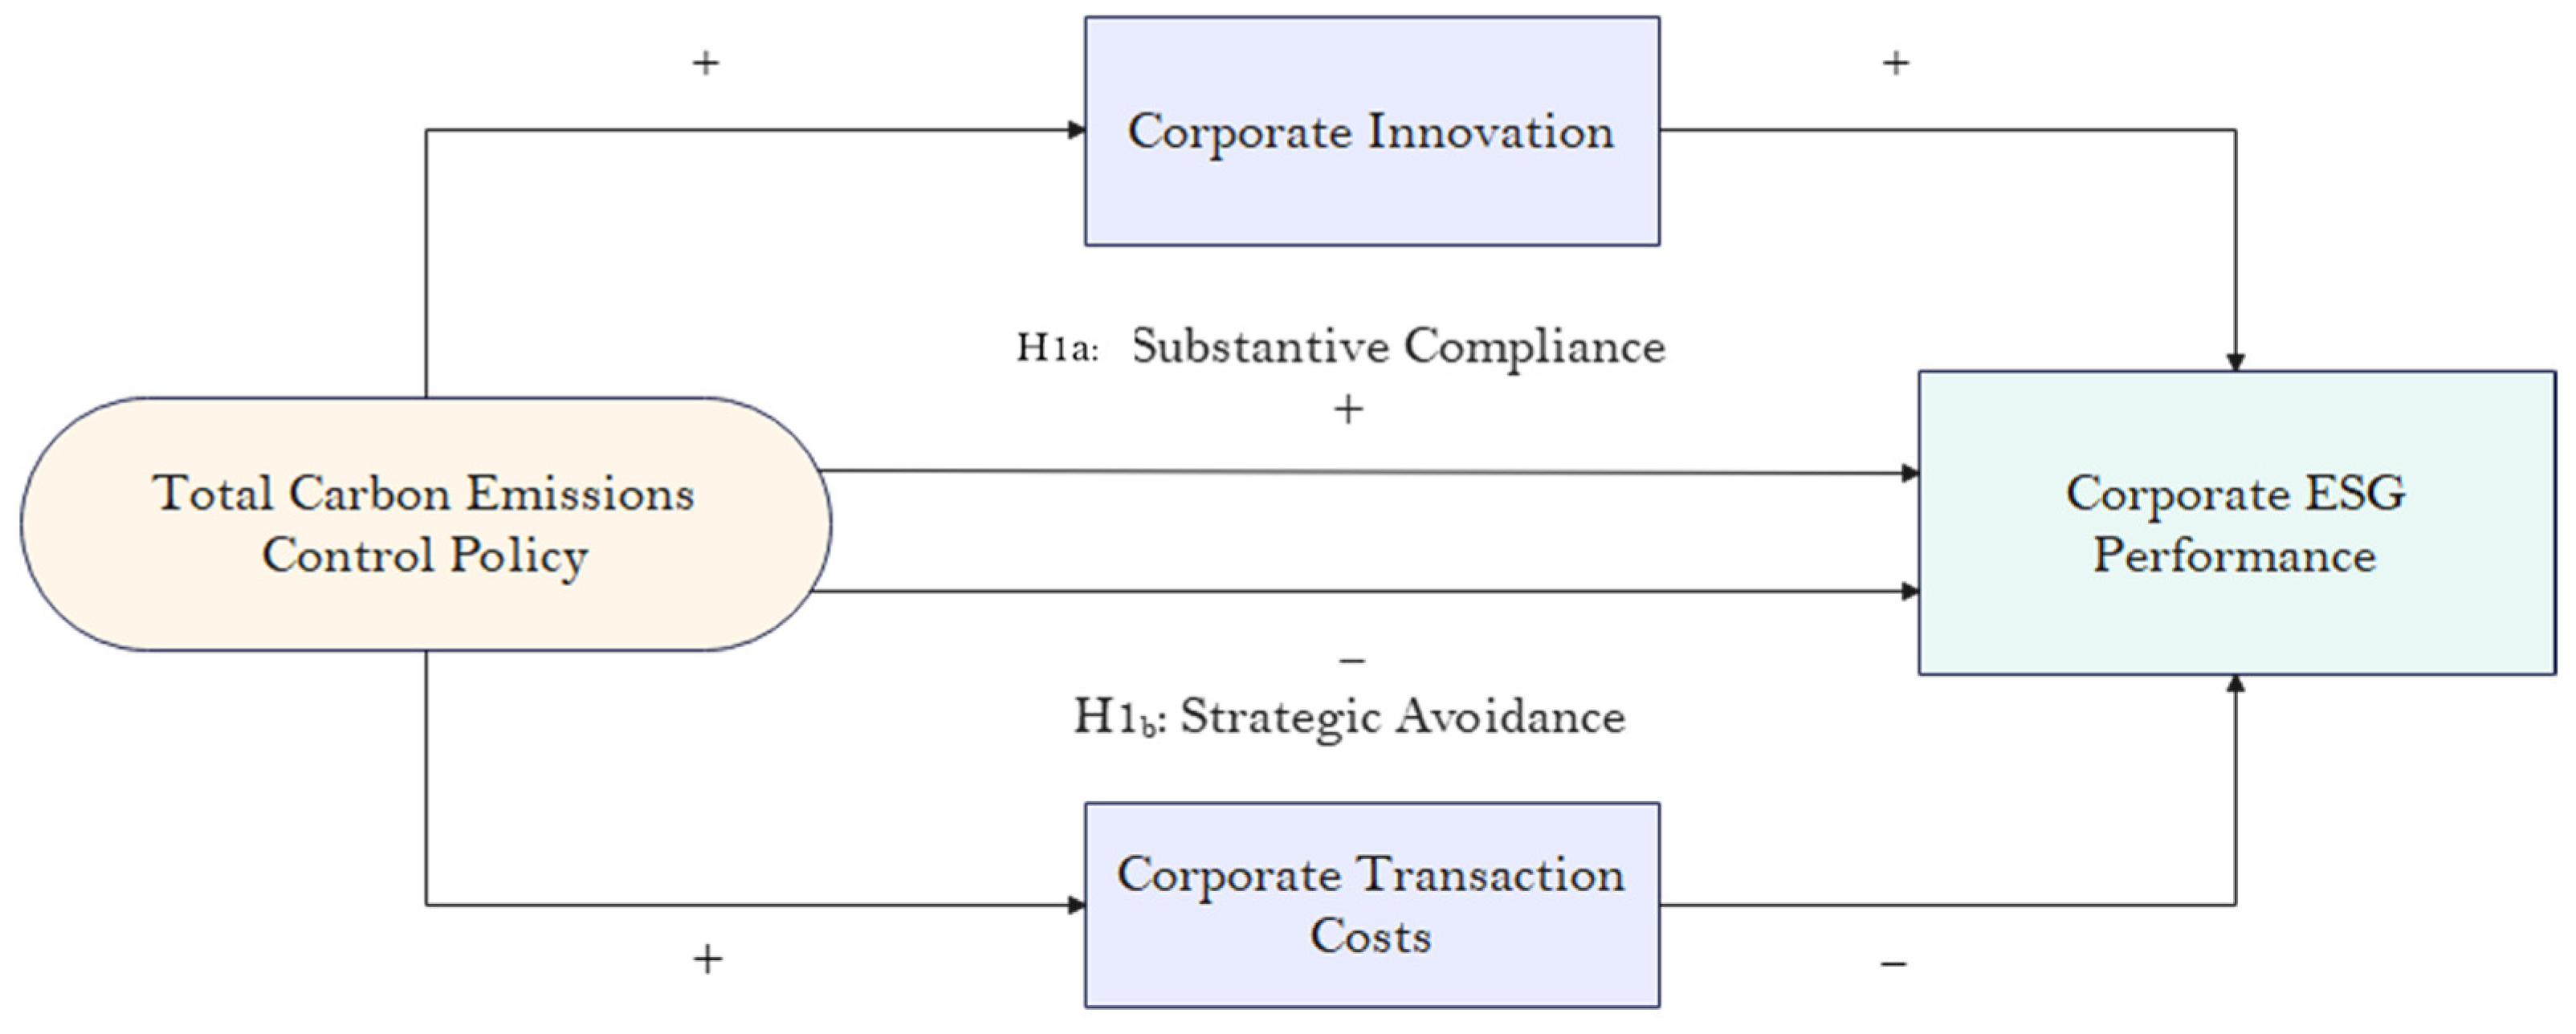
The Total Carbon Emissions Control Policy sets carbon-emission thresholds for specific periods, exerting stringent compliance pressure on enterprises (Dong et al., 2022) [10]. If this policy can prompt companies to substantially integrate carbon-reduction responsibilities into their core strategies, it will fully meet the intrinsic requirements of environmental, social, and governance (ESG) through three interrelated channels.
Environmental (E) dimension: The binding carbon caps under the TCP generate coercive isomorphic pressure, compelling enterprises to internalize environmental responsibilities throughout the production process (DiMaggio & Powell, 1983) [12]. Substantive compliance necessitates tangible technological investments, including (i) energy-saving retrofits and smart metering systems (Pizer, 2002) [13]; (ii) carbon capture, utilization, and storage (CCUS) infrastructure (Luo et al., 2024) [14]; and (iii) renewable energy substitution and waste-heat recovery systems (Zhou et al., 2014) [15]. These operational adjustments directly reduce carbon intensity and enhance environmental performance metrics monitored by third-party ESG raters.
Social (S) dimension: The TCP creates reputation incentives, promoting cooperation between enterprises and stakeholders beyond transactional relationships (Sethi et al., 2017) [16]. Enterprises achieving substantive compliance incorporate low-carbon standards into supply-chain management through green supplier audits, joint carbon-reduction programs, and sustainable logistics deployment (Liu et al., 2018) [17]. These practices strengthen community bonds through local environmental co-investment and enhance employee engagement through green skill development programs, directly improving social performance indicators.
Governance (G) dimension: The TCP mandates organizational adaptation, which elevates the quality of corporate governance (Feng et al., 2009) [18]. Substantive compliance requires the establishment of dedicated carbon management departments under the oversight of the C-suite, the integration of emission targets into executive compensation schemes, and the optimization of ESG disclosure transparency (McWilliams & Siegel, 2000; Liu & Anbumozhi, 2009) [19,20]. These structural transformations enhance board effectiveness and strategic risk management capabilities.
Synthesizing these channels, substantive compliance driven by the TCP generates complementarities across ESG dimensions. Environmental innovation leads to resource efficiency that provides funds for social investments, while governance restructuring ensures long-term commitment. This multi-dimensional synergy differentiates substantive compliance from superficial adaptation, resulting in measurable ESG improvement.
Above all, substantive compliance with the TCP will enhance an enterprise’s ESG performance. The following baseline hypothesis is proposed:
Hypothesis H1a:
TCP has a positive effect on corporate ESG performance.
2.2. Strategic Avoidance Analysis
The long-term characteristic of ESG investments renders them susceptible to cost-compression pressures (Minev et al., 2025; Rojo-Suárez & Alonso-Conde, 2023) [21,22]. When the costs of compliance surpass the short-term financial capabilities of firms and regulatory enforcement demonstrates ambiguity, firms abandon proactive compliance and opt for strategic avoidance (Ha et al., 2017) [23]. This section elaborates on the subsequent mechanisms through which strategic avoidance induced by TCP undermines ESG performance.
The greenwashing mechanism: Strategic avoiders engage in impression management, which involves the selective disclosure of carbon reduction initiatives without substantial operational transformation (Lyon & Maxwell, 2011; Marquis et al., 2016) [9,24]. With the flexible implementation of TCP, firms may manipulate the verification of emission data, overstate clean technology investments in public reports, or adopt “green” branding while persisting with carbon-intensive production processes (Zhang, 2022) [7]. This decoupling between symbolic and substantive actions (Westphal & Zajac, 1998) [25] directly impairs the governance (G) dimension through fraudulent reporting and integrity violations. Meanwhile, the environmental (E) performance remains stagnant despite the disclosure claims.
The resource misallocation mechanism: When the costs of TCP compliance exceed the expected penalties and regulatory capture is viable, firms reallocate resources from productive innovation to non-productive transaction costs (Liu et al., 2018; Zhang et al., 2024) [1,17]. These costs encompass bribing environmental officials for favorable carbon quotas, lobbying for enforcement exemptions, and maintaining “relationship” networks with regulators. Such rent-seeking expenditures (Anne, 1974; Murphy et al., 1993) [26,27] trigger a resource crowding-out effect: the funds allocated to regulatory evasion reduce the available investment in clean technology, environmental management systems, and stakeholder engagement programs. Consequently, all three ESG dimensions deteriorate: the environmental (E) dimension due to underinvestment, the social (S) dimension due to the deterioration of stakeholder trust, and the governance (G) dimension due to corruption and opacity.
Synthesizing these mechanisms, strategic avoidance under TCP operates through the deterioration of specific ESG dimensions rather than a uniform decline. Governance quality is most severely affected by data manipulation and corruption, environmental performance stagnates because of underinvestment, and social performance erodes as stakeholder expectations are betrayed. The overall effect is a negative ESG trajectory despite regulatory pressure.
Based on this, the paper puts forward the following hypothesis:
Hypothesis H1b:
TCP has a negative effect on corporate ESG performance.
2.3. Mediating Mechanism Analysis
According to the Porter hypothesis, appropriately designed environmental regulation spurs corporate innovation, which offsets compliance costs and enhances competitiveness (Porter & Vander Linde, 1995; Ambec et al., 2013) [8,28]. This study extends this line of reasoning to propose that environmental innovation driven by the Total Carbon Emissions Control Policy (TCP) serves as the primary mechanism through which substantive compliance enhances environmental, social, and governance (ESG) performance, operating via a “technology-environment-ESG” causal chain. The binding carbon caps of TCP impose regulatory pressure, necessitating technological breakthroughs in three domains: clean energy technologies (renewable energy systems, energy storage, and smart grids) (Saudi et al., 2019) [29], low-carbon process innovations (carbon capture, utilization, and storage; circular production systems; and waste-heat recovery) (Zhou et al., 2014; Dong et al., 2022) [10,15], and green product development (eco-design, sustainable packaging, and carbon-neutral services) (Flammer, 2015) [30]. These innovations demand asset-specific investments, which demonstrate commitment credibility and yield measurable environmental outcomes (Lanoie et al., 2008) [31].
Environmental innovation directly reduces carbon intensity, energy consumption, and pollution emissions, which are the core metrics in the environmental (E) scoring of ESG (Qian & Liu, 2024) [32]. Significantly, the innovation induced by TCP generates benefits beyond compliance. Firms that invest in clean technology often surpass regulatory minimums, achieving superior environmental performance that differentiates them from symbolic compliers (Ambec et al., 2013; Frondel et al., 2007) [28,33]. This improvement in performance can be verified through third-party audits, reducing the risk of greenwashing and enhancing the reliability of ESG ratings (Lyon & Maxwell, 2011) [9].
Environmental innovation generates spillovers across the ESG dimensions through three mechanisms: stakeholder legitimacy, where superior environmental performance attracts green consumers, responsible investors, and community support, thereby improving social (S) scores (Flammer, 2015; Sethi et al., 2017) [16,30]; operational efficiency, through which the savings in energy and material costs can be used to fund social investments (employee welfare, supplier development) (Luo et al., 2024) [14]; and governance adaptation, in which the implementation of environmental innovation requires dedicated ESG committees, executive compensation linked to carbon targets, and transparent disclosure systems, thus improving governance (G) scores (Feng et al., 2009; McWilliams & Siegel, 2000) [18,19].
The paper proposes the following hypothesis:
Hypothesis H2:
TCP improves the ESG performance of enterprises by promoting their independent innovation.
The strategic avoidance pathway functions via a distinct mechanism, wherein the Total Carbon Emissions Control Policy (TCP) incites rent-seeking behavior, which, in turn, generates transaction costs, ultimately undermining corporate environmental, social, and governance (ESG) performance. The institutional design of TCP, which integrates ambitious binding targets with flexible implementation pathways, creates conducive conditions for rent-seeking. When compliance costs surpass expected penalties and regulatory enforcement is ambiguous, firms rationally reallocate resources from productive innovation to non-productive transaction costs (Liu et al., 2018) [17]. These costs encompass bribing environmental officials to obtain favorable carbon quotas, manipulating emission data verification through illegal “relationship maintenance,” and lobbying for enforcement exemptions. Such rent-seeking expenditures (Anne, 1974; Murphy et al., 1993) [26,27] trigger a resource crowding-out effect: the funds allocated to regulatory evasion reduce the available investment in clean technology, environmental management systems, and stakeholder engagement programs.
The relationship between transaction costs and rent-seeking is theoretically rooted in the political economy. While transaction costs in the Coasian tradition signify frictions in market exchange, rent-seeking specifically pertains to expenditures aimed at securing preferential treatment through political influence rather than creating economic value (Anne, 1974) [26]. In environmental governance, when policies offer a combination of public goods and narrow-based political returns, rent-seeking becomes intertwined with regulatory compliance. Firms invest in political influence because rent-seeking yields private returns, such as preferential quotas and enforcement exemptions, whereas abatement investments generate public environmental benefits while imposing private costs. Research affirms that when the information costs borne by the public in detecting rent-seeking are high, these conditions are frequently met in the context of environmental regulation.
The transition from rent-seeking to impaired ESG performance occurs through a resource crowding-out effect. Rent-seeking expenditures, approximated by excess selling, general, and administrative expenses, represent resources diverted from value-creating investments in clean technology, environmental management systems, and stakeholder engagement (Liu et al., 2018; Lin & Xie, 2023) [17,34]. This reallocation negatively impacts all three ESG dimensions: environmental performance stalls due to underinvestment in emission reductions; social performance deteriorates as stakeholder trust erodes when communities perceive regulatory manipulation; and governance quality is compromised by corruption, opacity, and weakened internal controls. Studies indicate that a reduction in rent-seeking, achieved through anti-corruption campaigns or central environmental inspections, significantly enhances corporate environmental behavior and green innovation (Lin & Xie, 2023) [34].
The paper proposes the following hypothesis:
Hypothesis H3:
TCP inhibits corporate ESG performance by increasing transaction costs.
Figure 1 illustrates the integrated theoretical framework of this paper.
Figure 1.
Research mechanism schematic diagram.
3. Research Design
3.1. Sample Source
Chinese non-financial A-share firms from 2009 to 2023 were selected as the sample in this study. All continuous variables were winsorized at the 1% and 99% to mitigate the influence of outliers. In addition to manually organizing the TCP data, all other major variable data were obtained from the China Stock Market & Accounting Research Database (CSMAR).
3.2. Variable Measurement
3.2.1. Corporate ESG Performance
Drawing on the studies of Wang et al. (2024), Deng et al. (2024), Yu et al. (2026), and Hu et al. (2025) [35,36,37,38], we used the Huazheng ESG composite score as our primary proxy for corporate ESG performance. A higher ESG rating indicates superior ESG performance.
This research utilizes third-party ESG ratings to assess corporate sustainable development performance, capitalizing on their advantage of being less susceptible to manipulation compared with self-disclosure. Third-party ratings are based on objective performance indicators (such as energy intensity, carbon emissions, and board independence), which elevate the costs of manipulation (Lyon & Maxwell, 2011; Huang et al., 2024) [9,39]. The multi-dimensional integration of the E, S, and G dimensions imposes consistency requirements that cannot be readily met by single-dimensional symbolic compliance (Treepongkaruna et al., 2024) [40]. The temporal stability in panel data helps differentiate path-dependent substantial investments from reversible strategic responses (Marquis et al., 2016) [24]. Therefore, continuous improvement in ESG performance signals substantial compliance, whereas stagnation suggests strategic evasion.
3.2.2. Total Carbon Emissions Control Policy (TCP)
Drawing on the studies of Kong et al. (2025) [41] and Xu et al. (2026) [42], we treated the seven provinces that announced explicit carbon-peak targets in 2016–2017 (Shanghai, Beijing, Tianjin, Yunnan, Sichuan, Chongqing, and Shandong) as the treated group. Among these, only Beijing implemented the relevant carbon emissions control policies in the August 2016 edition, whereas the other six provinces implemented such policies only after 2017. Consequently, this study adhered to the research methodologies of Kong et al. (2025) and Xu et al. (2026) [41,42]. For listed companies registered in Beijing, the value of the TCP variable has been set to 1 since 2016. For listed companies registered in the other 6 provinces, the value of the TCP variable has been set to 1 since 2017. In all other cases, the TCP value is 0.
3.2.3. Corporate Innovation (Patent)
The approach proposed by Brunnermeier (2003) [43] was adopted in this study, and the green innovation of enterprises was measured based on the number of green patents obtained by listed companies after excluding the annual average level.
3.2.4. Transaction Costs (Tcost)
Liu et al. (2018) and Lin & Xie (2023) [17,34] employed entertainment expenditure, travel expenditure, and the excess management expenses of Chinese enterprises as proxy variables for rent-seeking activities, respectively. As per the accounting standards of Chinese enterprises, the costs and expenses incurred by enterprises in rent-seeking activities do not fall within the scope of production costs and can only be recorded as period expenses. In line with the practices of Liu et al. (2018), Lin & Xie (2023), and Collins and Fabozzi (1991) [17,34,44], transaction costs were consequently measured by calculating the logarithm of the ratios of total sales, management expenses, and financial expenses exceeding the annual industry average level (denoted as Tcost).
3.3. Model Design
The following regression model was constructed to examine the relationship between TCP and corporate ESG performance:
In Equation (1), ESG denotes corporate ESG performance, TCP represents the core explanatory variable. The coefficient denotes the core regression coefficient. CVS serves as the control variable. Considering that a company’s ESG performance might be affected by factors such as its financial status, operational conditions, capital market performance, and capital structure, the control variables ultimately selected for this study are as follows: firm size (SIZE), debt-to-asset ratio (LEV), board size (BOD), independent director ratio (DEP), return on total assets (ROA), combined leverage (DCL), firm growth (TBQ), and operating cash flow (OCF), capital intensity (CAP), and firm age (AGE). , , , respectively, represent the fixed effects of the year, industry, province, and company. To enhance the robustness of the results, this paper reports clustered standard errors at the firm level.
We constructed the following mediation mechanism regression model to explore the roles of corporate innovation and transaction costs in the impact of TCP on the ESG performance of enterprises:
In Equations (2) and (3), represents the mediating mechanism variable, which includes corporate innovation (Patent) and transaction costs (Tcost). The coefficient identifies the influence of TCP on corporate innovation (or transaction costs), while the coefficient identifies the influence of corporate innovation (or transaction costs) on ESG performance. If both coefficients and are significantly different from 0, it indicates that the corporate innovation (or transaction costs) plays a mediating role in the process where TCP affects the ESG performance. The variable definitions are shown in Table 1.
Table 1.
Definition of main variables.
4. Results and Discussion
4.1. Benchmark Test Results
Table 2 presents the descriptive statistics of the main variables. The mean ESG performance of enterprises is 4.096. The mean value of TCP is 0.090. Descriptive statistics for other variables are presented in Table 2.
Table 2.
Descriptive statistics of main variables.
Table 3 presents the Pearson correlation results for the main variables. The data shows that TCP and ESG are significantly correlated at the 1% level, with a correlation coefficient of 0.072. The specific correlation analyses of the remaining variables are detailed in Table 3.
Table 3.
Pearson correlation analysis of the main variables.
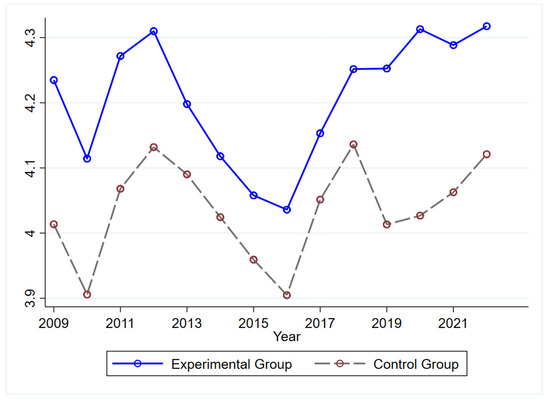
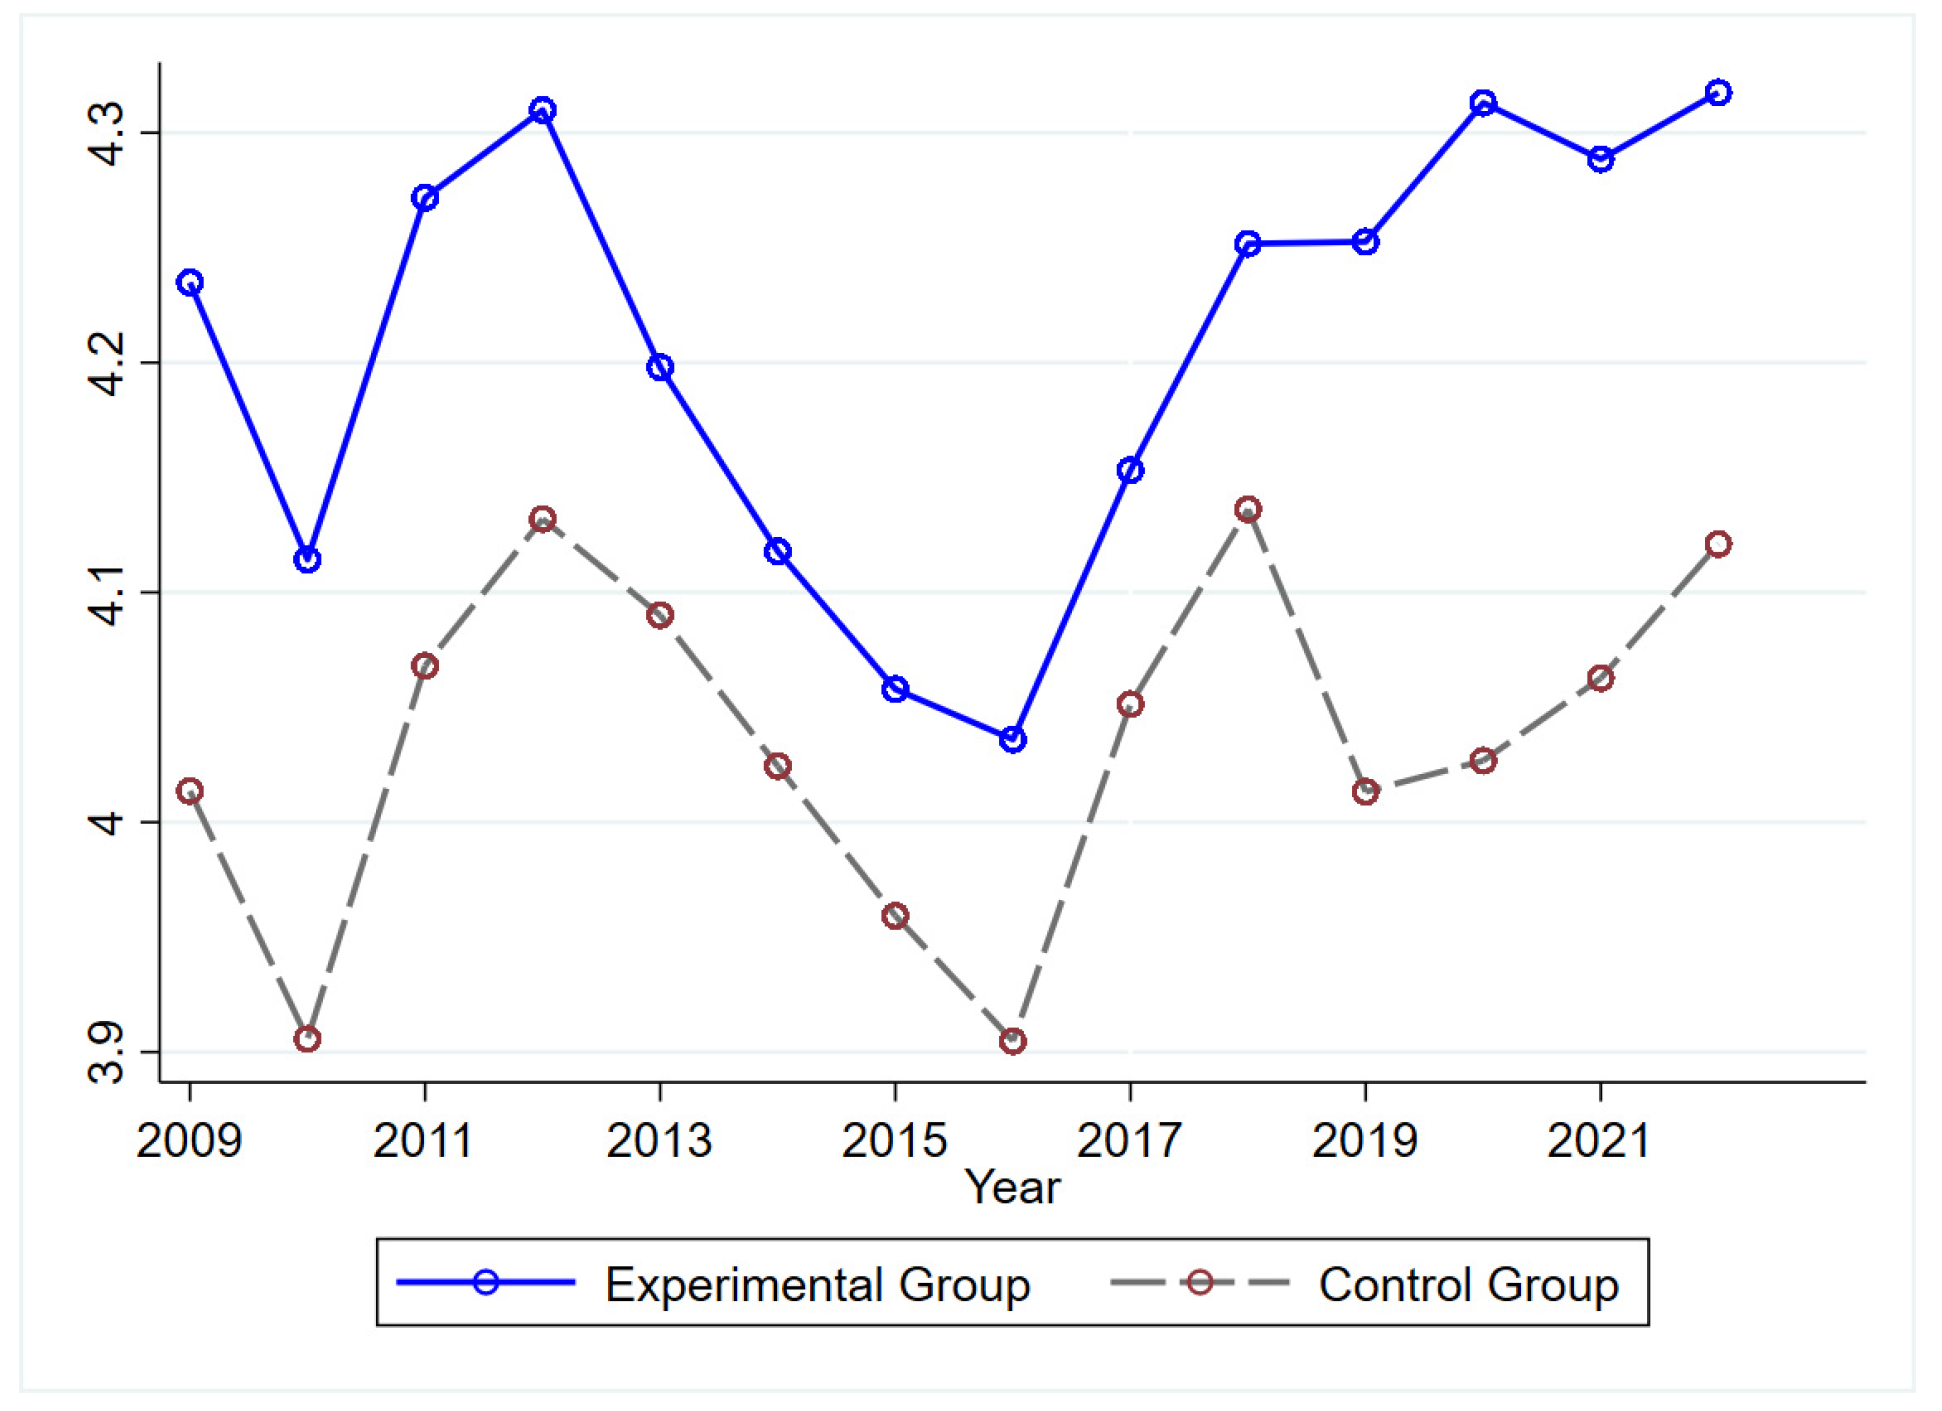
Figure 2 illustrates the average annual trends of ESG changes for the companies in the experimental group (the companies from the seven provinces and cities where the TCP was implemented) and those in the control group (the companies from other provinces and cities). It is observable that prior to the implementation of the TCP, the change trends of the companies in the experimental group and the control group exhibited a high degree of synchronicity. Nevertheless, after the implementation of the TCP, the synchronicity of the change trends between the companies in the experimental group and the control group decreased notably. Specifically, the average ESG disparity between the experimental group and the control group companies widened significantly, and the ESG of the companies in the experimental group demonstrated a continuous upward trend.
Figure 2.
Comparison chart of the average annual ESG change trends between the experimental group and the control group.
Table 4 reports the multiple regression results of TCP and enterprise ESG. Column (1) shows that the estimated coefficient of TCP is 0.0998, which is significant at the 1% level. This indicates that TCP has a significant positive impact on an organization’s environmental, social, and governance performance, which is consistent with the substantive compliance hypothesis. Columns (2)–(4) sequentially add control variables, industry effects, time effects, and firm effects; the coefficient on TCP remains positive and significant at the 1% level, further confirming that TCP significantly enhances corporate ESG performance. Column (4) shows that the estimated coefficient for TCP is 0.1309, which means that the implementation of TCP has increased the company’s ESG score by an average of 3.19%. Therefore, Hypothesis H1a was verified, while Hypothesis H1b of the study was not supported.
Table 4.
Benchmark regression analysis of TCP and ESG.
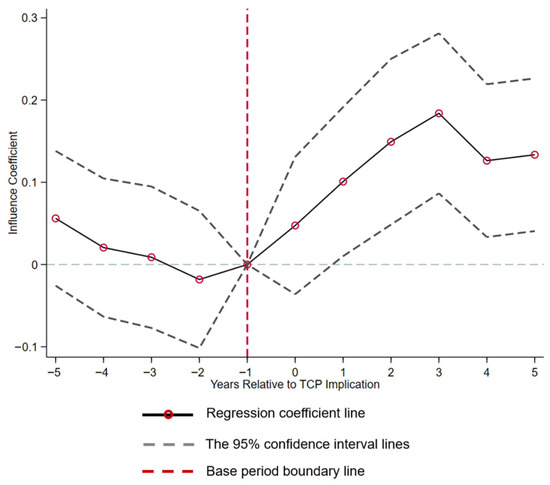
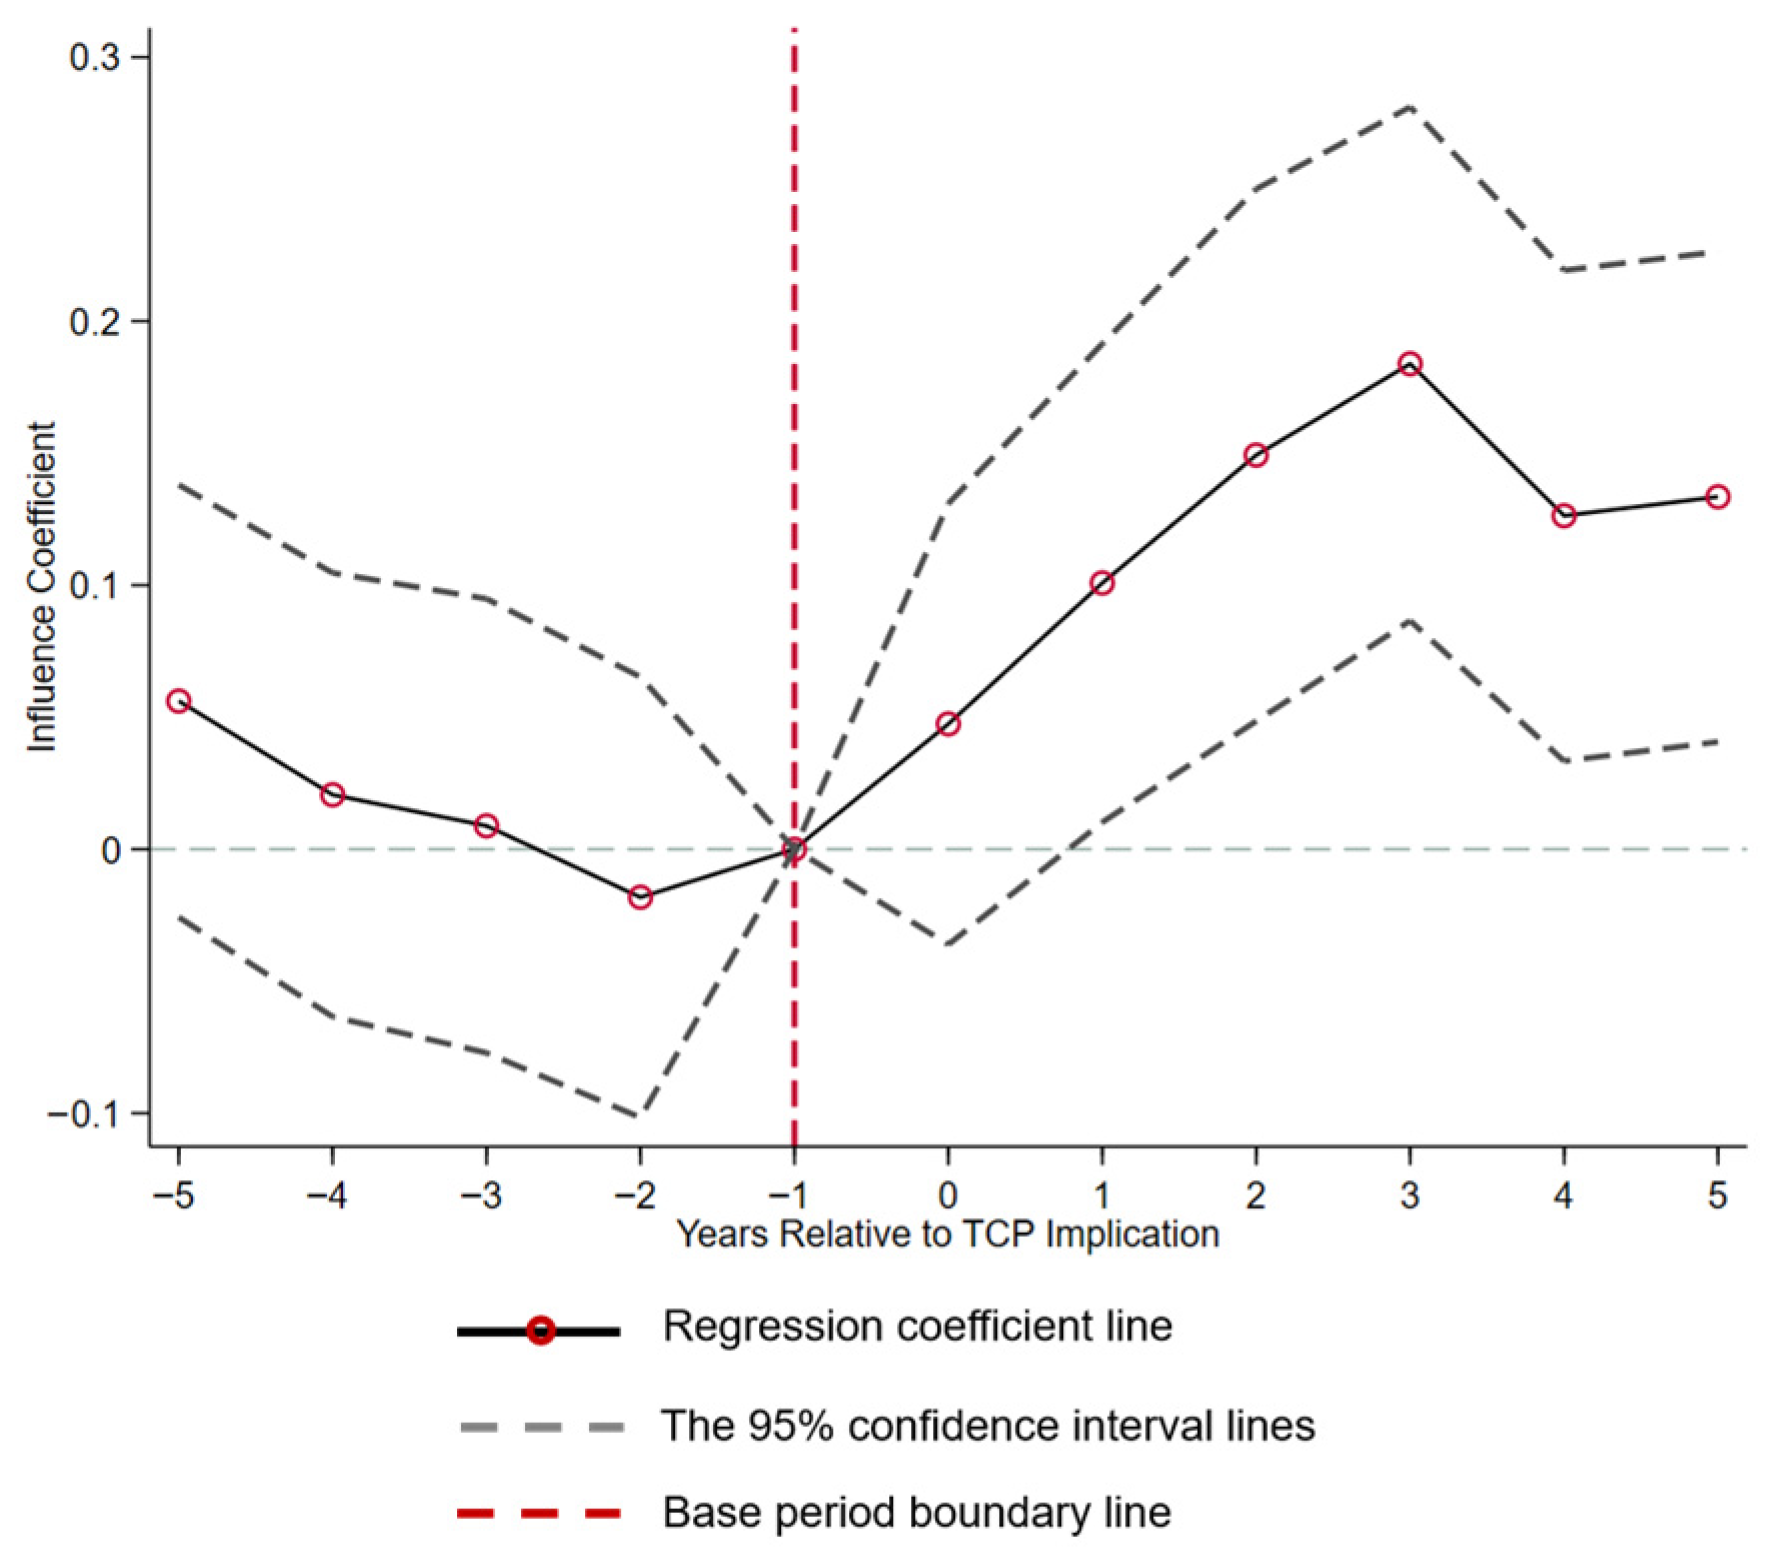
Figure 3 illustrates the parallel-trend and dynamic-effect tests over a 10-year window surrounding the implementation of TCP. The baseline is defined as the year prior to the implementation of TCP. The range on the X-axis, i.e., [−5, −2], represents the two to five years prior to the implementation, 0 represents the year of the implementation, and the range [1, 5] covers the 1 to 5 years following the implementation. Figure 1 shows that within the range of [−5, −2], TCP does not exert a significant impact on the ESG performance. However, within the range of [1, 5], the estimated coefficient was significantly positive. These results further validate the hypothesis that TCP significantly enhances corporate ESG performance.
Figure 3.
Parallel trend test results.
Table 5 presents the tests regarding the influence of the TCP on the environmental dimension (E), the social dimension (S), and the governance dimension (G). It can be observed that the TCP exerts a significant promotional effect on the environmental dimension (E), the social dimension (S), and the governance dimension (G). Among these dimensions, the TCP has the most substantial impact on the governance dimension (G), followed by the social dimension (S), and, lastly, the environmental dimension (E).
Table 5.
Regression analysis of TCP and ESG in different dimensions.
4.2. Robustness Test Results
4.2.1. Propensity Score Matching (PSM)
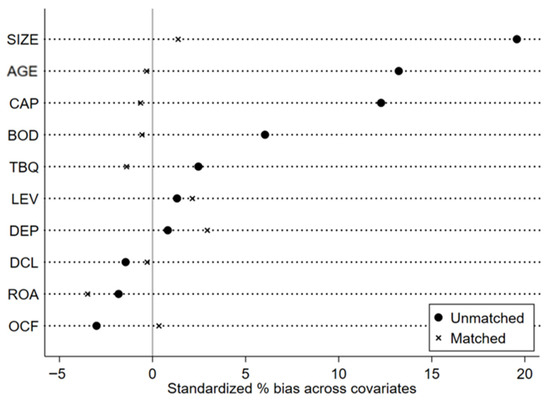
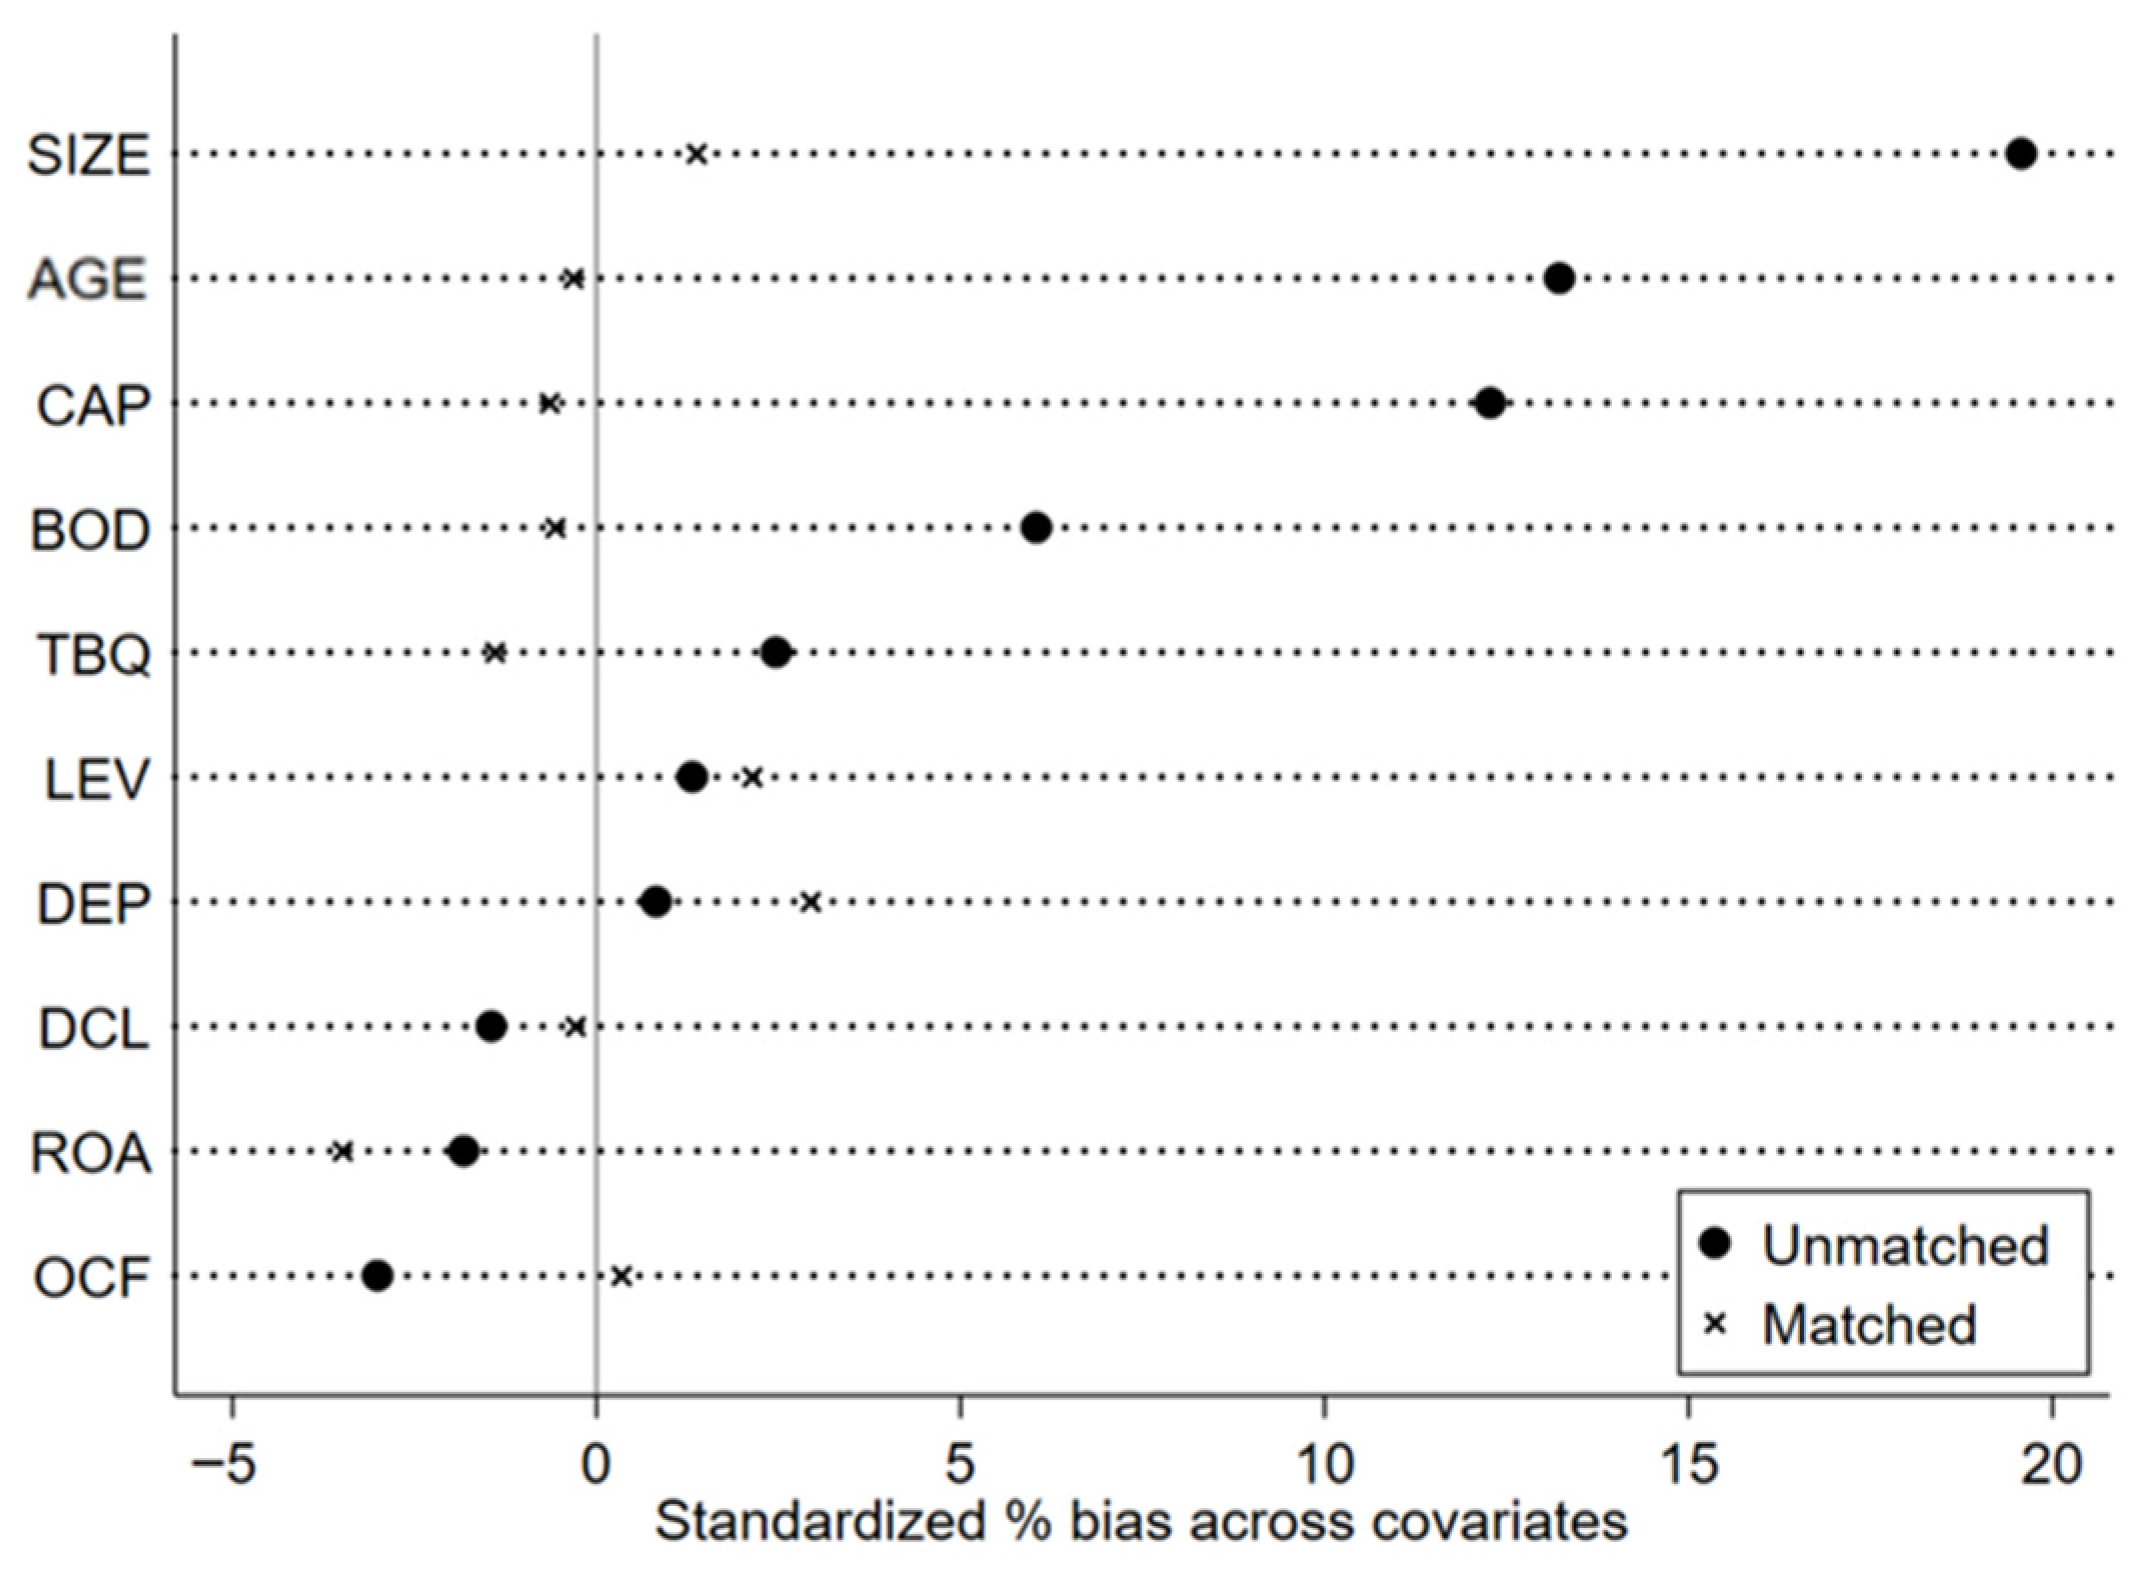
To address potential endogeneity arising from TCP exposure, we combined propensity-score matching (PSM) with a difference-in-differences strategy. First, a logit model was employed to estimate each firm’s propensity score, with treatment status (policy exposure) as the dependent variable. Second, 1:1 nearest-neighbor matching was applied within a 0.05 caliper. Third, multiple regressions were run on the matched sample. Figure 4 shows that observable differences between treated and control firms are largely eliminated.
Figure 4.
Deviations before and after PSM matching.
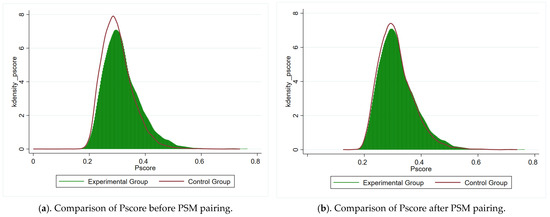
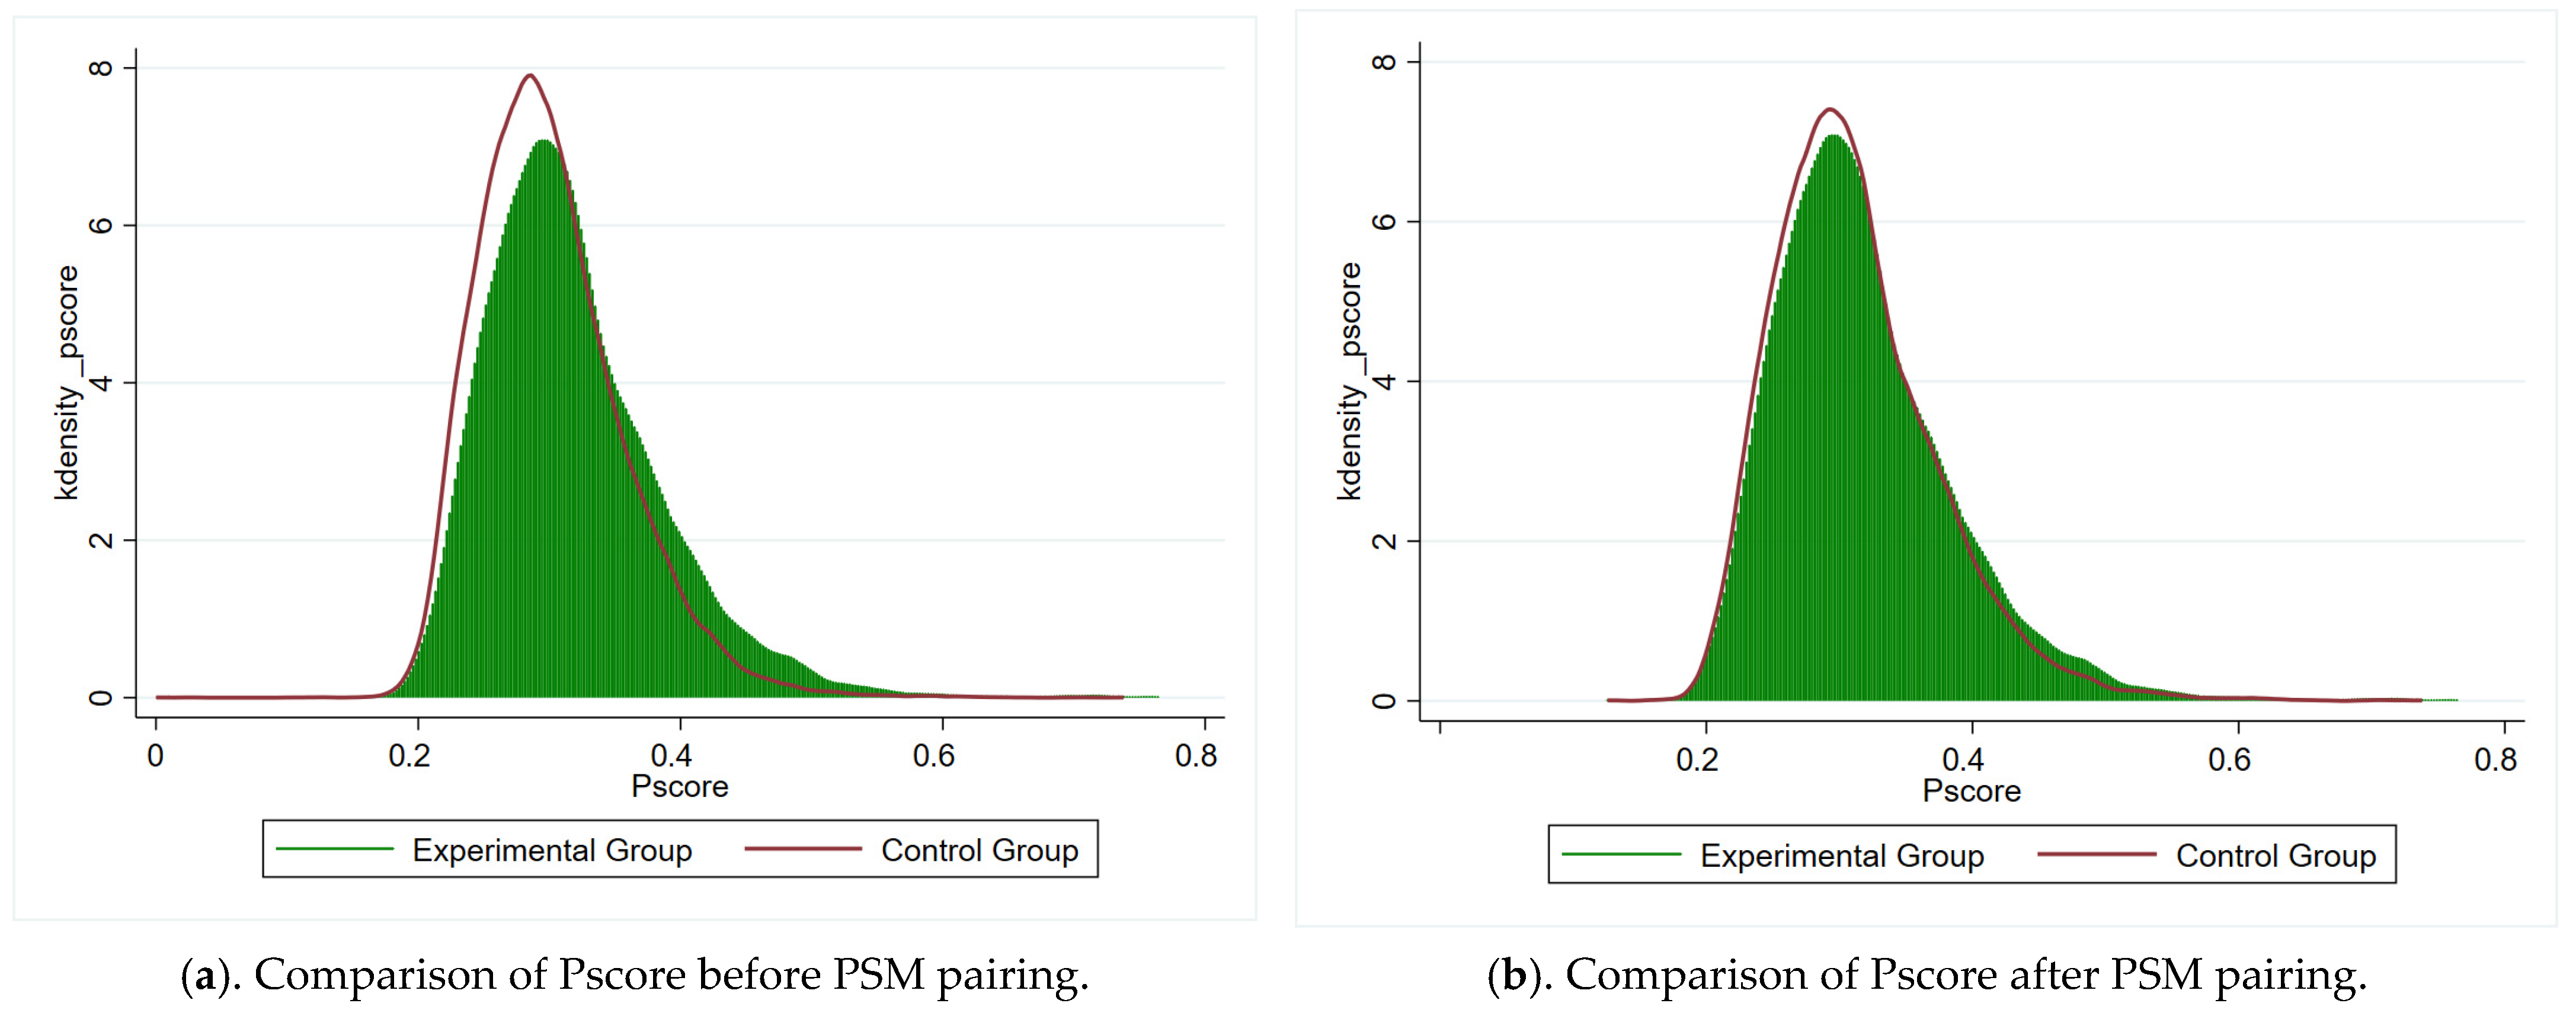
Figure 5 further presents the comparison of the group-wise distribution of pS propensity scores prior to and after pairing. Specifically, Figure 5a reveals that prior to propensity score pairing, there remained certain disparities in the propensity scores between the experimental group and the control group, suggesting that there were still certain differences between the companies in the experimental group and the control group before the pairing. Nevertheless, Figure 5b demonstrates that after propensity score matching, the difference in propensity scores between the experimental group and the control group significantly diminished, indicating that propensity score matching effectively regulated the differences between the groups. Column (1) of Table 6 presents the results of the PSM test, which still indicate that TCP has a significant positive impact on ESG performance.
Figure 5.
Comparison of Pscore before and after PSM pairing.
Table 6.
Summary table of all robustness test results.
4.2.2. Placebo Test
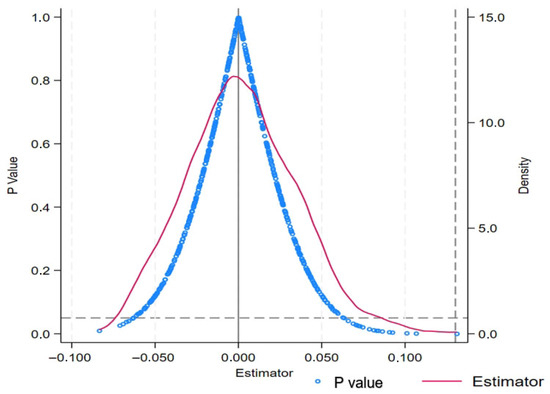
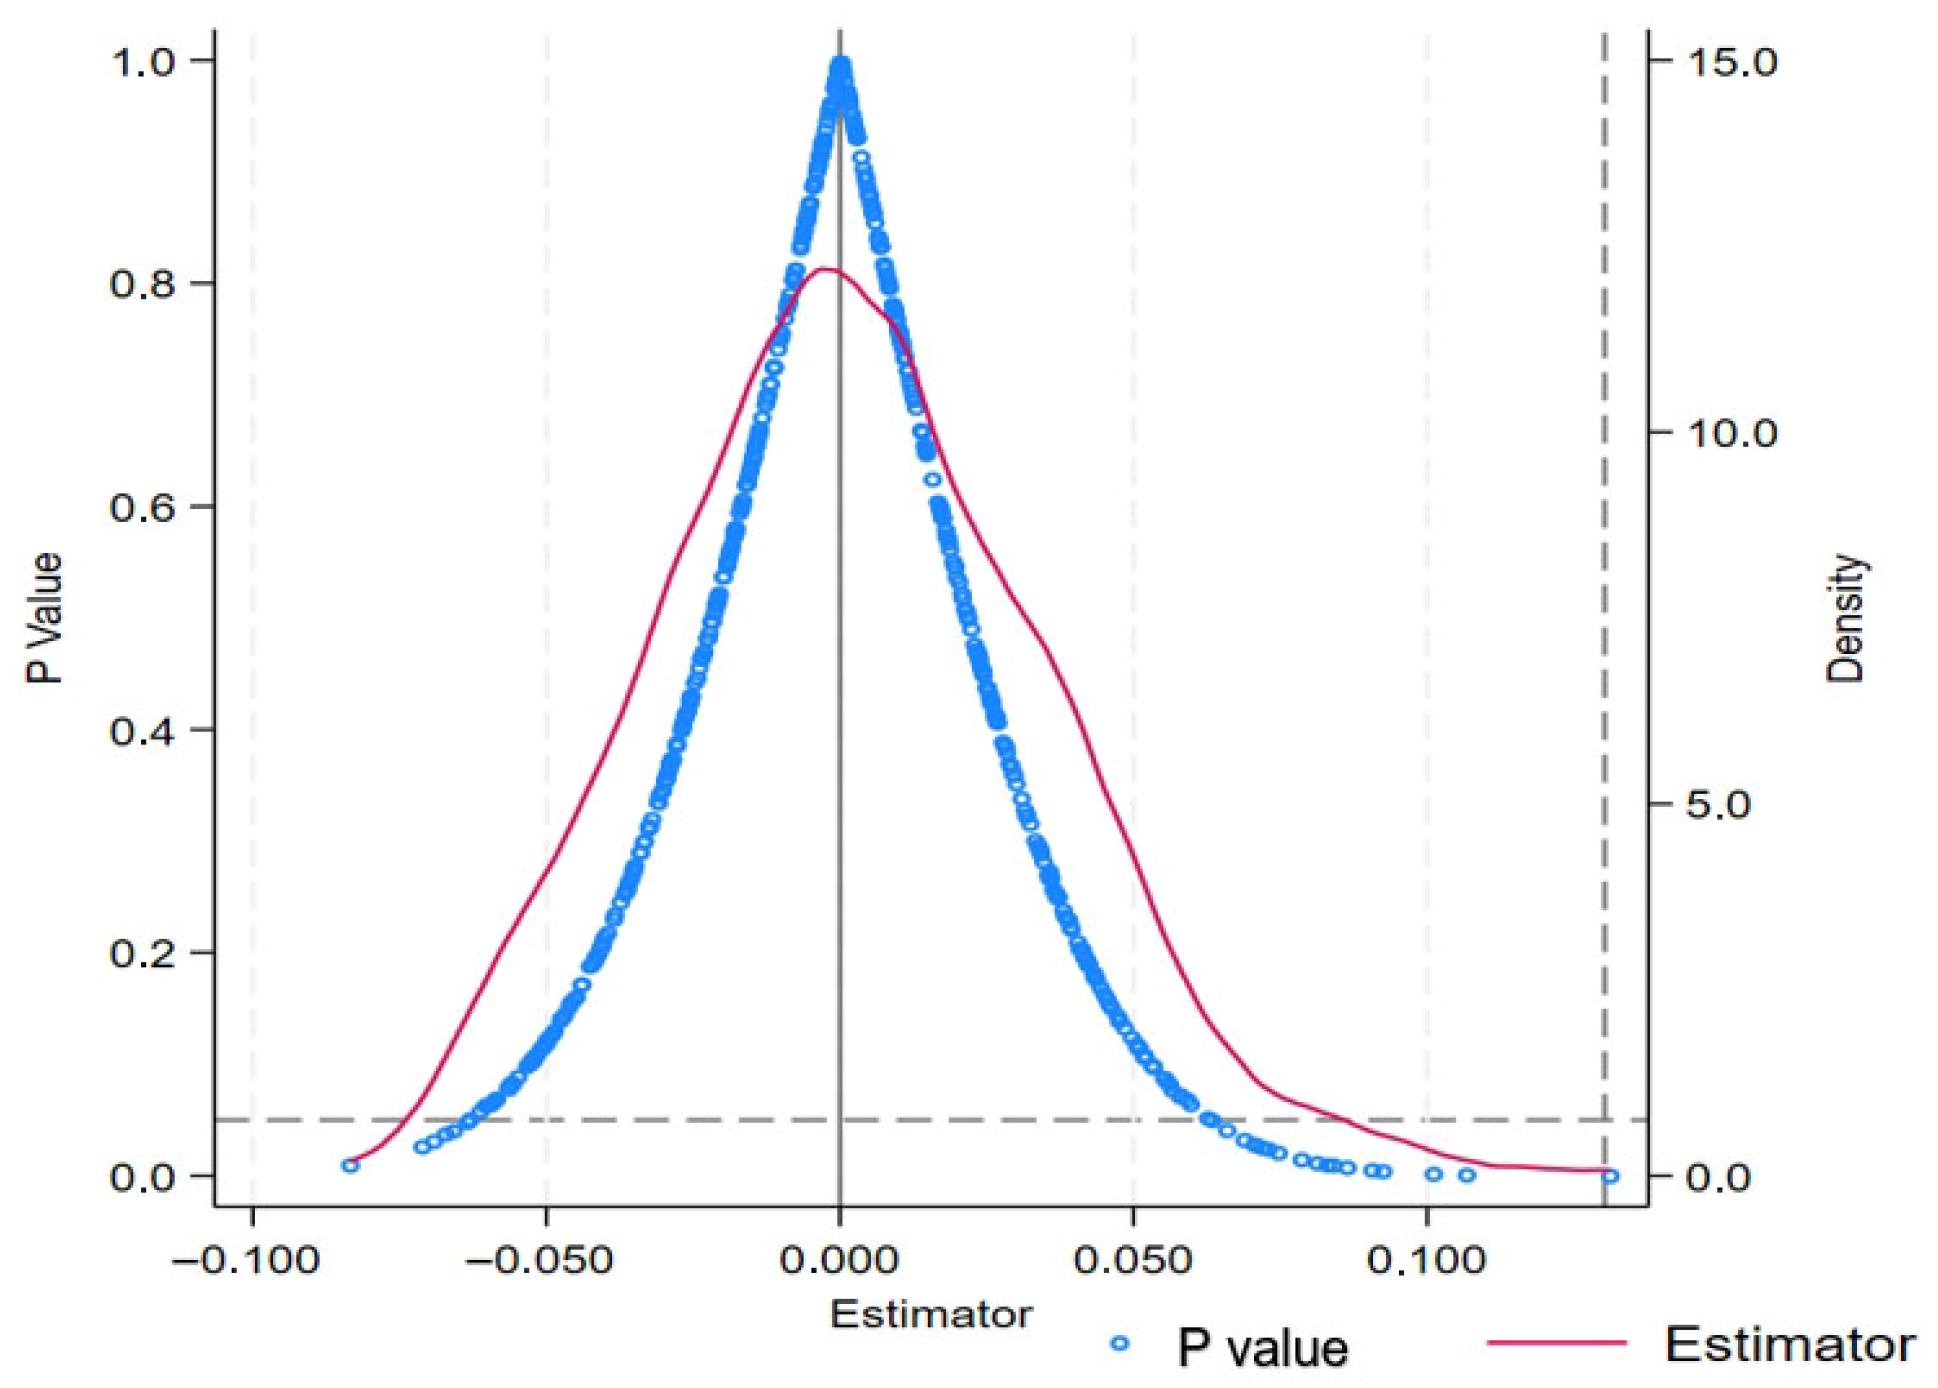
Figure 6 presents the placebo test employed to mitigate the potential bias in empirical findings stemming from omitted variable problems. Initially, leveraging the sample firms from 2015, the treatment group, the control group, and the impact time were randomly determined. The randomly assigned treatment group and impact time were subsequently incorporated into the baseline model for re-regression, yielding the estimated coefficients of the pseudo-policy experiment based on random sampling. Ultimately, 500 iterations of random generation and estimation were conducted to acquire 500 random impact multivariate regression outcomes, and the coefficient kernel density distribution and p-value distribution plots of all estimated results were constructed. Figure 6 reveals that the p-values of the pseudo-policy experiment regression predominantly exceed 10%, suggesting that the placebo test was successfully passed. In other words, the research findings of this paper are not a random occurrence.
Figure 6.
Placebo test results.
4.2.3. Control Interference from Other Policies
To eliminate the impact of other policies during the same period, Column (2) of Table 6 introduces additional policies: New Environmental Protection Law (NEP), Interaction Term between New Environmental Protection Law and Heavy Polluting Industries (NEP × POLLUT), the High-Speed Rail network expansion (HSR), the Free Trade Zone pilot program (FTZ), the Market Access Negative List (MANL) system, and the Cross-border E-commerce Comprehensive pilot zone (CEC). The test results still show that TCP has a significantly positive correlation with the company’s ESG performance.
4.2.4. Wild Bootstrap Two-Way Clustered Standard Errors
To account for heteroskedasticity and within-group correlation, Column (3) of Table 6 reports T-values using the Wild bootstrap method with standard errors clustered at both the province and firm levels. The results confirm that TCP has a robust, significantly positive effect on corporate ESG performance.
4.2.5. Excluding Non-Adjacent Provinces
The experimental group established based on geographical identification may display specific geographical biases, including disparities in economic development levels, climate, culture, and geographical advantages among the provinces where the TCP was carried out. To reduce the geographical differences between the experimental group and the control—group companies, Table 6 Column (4) further excluded samples from provinces that had no border connections with the seven provinces where the TCP was implemented. Instead, it only retained samples from provinces that had bordering relationships with these seven provinces as control companies. The core conclusion of this research remains reliable.
4.2.6. Changing the Sample Range
The COVID-19 pandemic spread rapidly worldwide at the end of 2019, causing a significant impact on the global economy and influencing corporate decisions. Column (5) of Table 6 further excludes the samples after 2020 to avoid the influence of this exogenous event.
4.2.7. Mitigating Potential Omitted Variables
This study controlled for key factors that may simultaneously affect the implementation of regional environmental policies and the ESG performance of enterprises. Specifically, regional economic development level (GDP) and industrial structure (IST) were introduced, local fiscal budgetary revenue (EGF) was added, and the number of environmental protection background executives of enterprises (EBN) was also included. Table 6 Column (6) shows that after further controlling for omitted variables, the core conclusion of this paper remains robust.
4.2.8. Heekman Two-Step Method
Column (7) of Table 6 reports the estimation results based on the Heckman two-step approach used to further control for potential selection bias between the treatment and control groups. The core findings of this paper remain robust.
4.2.9. Exclude Geographically Dispersed Samples
Given that listed companies can invest in subsidiaries nationwide, when the region where the parent company is located implements carbon-emission control policies, they can still circumvent these restrictions by investing in subsidiaries in other provinces. Therefore, the theoretical hypothesis put forward in this paper holds greater significance for geographically concentrated companies, while its theoretical significance is diminished for geographically dispersed companies. Consequently, in Column (8) of Table 6, the Herfindahl–Hirschman Index (HHI) of the geographical distribution of listed companies’ subsidiaries was employed to exclude samples with geographically dispersed subsidiaries, aiming to enhance the identification accuracy of this study.
4.2.10. Pollution Emission Inspection
Environmental, social, and governance (ESG) ratings not only reflect corporate behavior; the disclosed content is equally important. An increase in the score may result from a more comprehensive reporting mechanism or a revision of the scoring criteria, rather than actual operational changes. Therefore, the role of the total carbon control policy can be further verified by using ammonia nitrogen emissions to represent the intensity of pollution emissions (EMISSION). Table 6 Column (9) indicates that the core conclusion of this paper remains robust.
4.3. Heterogeneity Test Results
4.3.1. Heterogeneity of Enterprise Ownership Attribute
In China, there are significant institutional differences between state-owned enterprises (SOEs) and other enterprises (non-SOEs). State-owned enterprises have a close relationship with the government and have dual responsibilities of market competition and policy implementation. Therefore, there may be a gap in the response to TCP between state-owned enterprises and other enterprises. To address this, Columns (1) and (2) of Table 7 divide the samples into state-owned enterprises (SOEs) and non-state-owned enterprises (non-SOEs). Among SOEs, the TCP coefficient is 0.1383 and significant at the 1% level, whereas the estimate for non-state-owned enterprises is significant at the 10% level, confirming that state-owned enterprises are more likely to actively comply with TCP. The more pronounced enhancement in ESG performance within state-owned enterprises may well indicate substantial compliance. The Huazheng ESG ratings integrate objective environmental indicators and are verified by third parties, making manipulation expensive. SOEs are subject to more stringent regulatory oversight and face higher political costs for greenwashing, which reinforces their genuine compliance. Consequently, the heterogeneous outcomes support substantial compliance within the TCP framework.
Table 7.
Summary table of all heterogeneity test results.
4.3.2. Heterogeneity of Regional Distribution
The regional distribution disparity is also a problem that cannot be ignored in China. It stems from the systematic differences arising from different geographical and institutional environments. For the eastern region, the policy system is more complete, and the legal awareness of enterprises is also stronger. The legal environment in the western regions is backward. Their primary task is economic development, which may lead to the neglect of non-economic goals. This may lead to differences in the responses of enterprises in the eastern and western regions to TCP. To address this, Columns (3) and (4) of Table 7 divide the samples into eastern enterprises and non-eastern enterprises. Among the eastern enterprises, the TCP coefficient is 0.1683 and significant at the 1% level, whereas the estimate for non-eastern enterprises is statistically indistinguishable from zero, confirming that enterprises in developed regions were significantly more likely to actively comply with the TCP regulations.
4.3.3. Heterogeneity of Company Scale
There might be disparities in response behaviors between companies of varying scales when confronted with national carbon emission control. Large-scale companies possess the capacity to adhere to emission reduction policies, uphold a favorable social image, and guarantee the sustainable development of the enterprise. Nevertheless, the ability of small-scale companies to shoulder the cost of carbon emission reduction is restricted, and the cost of carbon emission reduction might pose a threat to their profit targets. Their motivation to comply with carbon emission reduction policies may consequently be weaker. To address this, Columns (5) and (6) in Table 7 classify the sample into large-scale and small-scale companies. The test reveals that TCP is significantly related to the ESG of large-scale companies at the 1% significance level, while it is significant for small-scale companies at the 5% significance level, which verifies that large-scale companies are more inclined to actively comply with carbon-emission reduction policies.
4.3.4. Heterogeneity of Heavily Polluting Industries
The pollution attribute of an industry determines an enterprise’s environmental behavior. Heavy-pollution industries face stricter environmental supervision and greater emission-reduction pressure due to high resource consumption and pollutant emissions. Thus, they respond more sensitively to total quantity control policies. In contrast, non-heavy pollution industries are less directly affected by policies, and their ESG performance changes may be more influenced by indirect transmission or self-transformation. Table 7’s Columns (7) and (8) show significant regional disparities in the impact of carbon total quantity control policies on enterprises’ ESG performance. In column 7 (heavy-pollution industries), the policy coefficient is 0.3069; in column 8 (non-heavy pollution industries), it is 0.1137. Comparison reveals that the policy has a greater effect on heavy-pollution industries, indicating a more prominent enhancing effect on their ESG performance.
4.4. Further Test Results
4.4.1. Corporate Innovation Mechanism Analysis
Columns (1) and (2) of Table 8 further report the mediation test results for corporate innovation based on Equation (2) and Equation (3) to examine the positive role of enterprise innovation in the process of TCP promoting ESG performance. It can be seen that TCP is significantly positively correlated with enterprise innovation (Patent) at the 10% level, and at the same time, enterprise innovation (Patent and L.Patent) is significantly positively correlated with ESG performance at the 5% level. The results support the notion that TCP drives enterprises to enhance their innovation capabilities, which, in turn, is beneficial for improving the ESG performance of these enterprises. Therefore, Hypothesis H2 is verified.
Table 8.
The test results of the mediating mechanism of TCP on ESG.
4.4.2. Corporate Transaction Costs Mechanism Analysis
Columns (3) and (4) of Table 8 report the mediation test results for corporate transaction costs based on Equations (2) and (3) to examine the offsetting effect of enterprise transaction costs in the process where TCP promotes ESG performance. It can be observed that TCP is significantly positively correlated with transaction costs (Tcost) at the 1% level, and transaction costs (Tcost and L.Tcost) are significantly negatively correlated with ESG performance at the 5% and 1% level. The test results also support the view that TCP can also trigger rent-seeking behavior in enterprises, increasing the cost of rent-seeking, and such strategic avoidance behavior will harm the ESG performance of these enterprises. Therefore, Hypothesis H3 is verified.
5. Conclusions
Our empirical analysis of non-financial listed companies in China’s A-share market from 2009 to 2023 uncovers the dual behavioral logic of enterprises under the Total carbon-emission control policy (TCP). This paper conducts empirical tests using the STATA 17.0 version. The baseline regression indicates that the implementation of TCP led to an increase of 0.1309 in firms’ Huazheng ESG score. This represents a 3.2% improvement relative to the sample mean of 4.096, which is sufficient to shift a firm by one decile in the ESG distribution and improve its access to green finance. This finding directly validates Hypothesis H1a (substantive compliance), suggesting that TCP drives real operational transformation rather than symbolic adaptation.
However, the mechanism analysis reveals conflicting forces. TCP promotes green innovation, which, in turn, enhances ESG. Simultaneously, it increases transaction costs, which have a negative impact on ESG. The coexistence of “innovation incentives” and “rent-seeking costs” validates our dual-mechanism framework, indicating that corporate behavior is a strategic balance under institutional constraints, rather than a binary choice between compliance and evasion. The net positive effect (0.1309) implies that substantive compliance prevails, although the 0.0549 offset due to rent-seeking suggests potential for policy improvement.
Heterogeneity results further clarify the institutional embeddedness of compliance behavior. State-owned enterprises exhibit stronger TCP effects compared with non-state-owned enterprises. Firms in the eastern region respond significantly, while those in the western region do not. Large-scale firms and heavy-pollution industries show amplified effects. These patterns reflect structural capacity differences rather than random fluctuations. State-owned enterprises face stricter political supervision and higher greenwashing costs, making their ESG gains more reliable. Western and smaller firms, constrained by resource scarcity and enforcement loopholes, are more likely to engage in strategic avoidance. Notably, the effect in the heavy-pollution industry is 2.3 times the sample average, suggesting that the binding pressure of TCP is most effective in areas where environmental risks are highest. However, this also raises concerns about the risks of regulatory capture in these industries.
Policy implications should be targeted at these mechanism-specific and heterogeneity-specific findings. First, to enhance the net positive effect, the “rent-seeking drag” should be reduced by closing implementation gaps. Unified carbon accounting standards must be established to prevent data manipulation and strengthen the monitoring of transaction cost anomalies as indicators of rent-seeking. Second, heterogeneity should be addressed through differentiated governance. The compliance advantages of state-owned enterprises need to be leveraged by implementing mandatory ESG-linked executive compensation. The capacity of the western regions must be built through technology transfer subsidies rather than uniform targets. Stricter third-party audits on heavy-pollution industries should be imposed despite (or because of) their high responsiveness to prevent quota manipulation. Third, optimize and innovate relevant channels to align the carbon price signal with patent incentive measures, ensuring the sustainability of the ESG reporting resulting from each unit of innovation. Lastly, it is necessary to recognize the limitations of these evidence.
This research still presents certain limitations, such as the reliance on third-party ESG rating outcomes. Although this method alleviates the risk of corporate greenwashing, it still cannot rule out the possibility of corporate interference in ESG ratings. Additionally, due to data limitations, this study was unable to accurately identify the specific carbon-reduction measures implemented by enterprises. Future research should integrate micro-data from the production process to more comprehensively identify corporate behaviors, including their carbon-reduction actions and ESG performance, thereby providing more evidence that is more in line with the actual situations of enterprises.
Author Contributions
Conceptualization, writing—review and editing, and software, F.X. (Fangda Xu); Methodology, software and data curation, Z.L.; Validation, software, and supervision, F.X. (Fei Xu). All authors have read and agreed to the published version of the manuscript.
Funding
This research received no external funding.
Institutional Review Board Statement
Not applicable.
Informed Consent Statement
Not applicable.
Data Availability Statement
The data presented in this study are available on request from the corresponding author.
Conflicts of Interest
The authors declare no conflicts of interest.
References
- Zhang, Y.J.; Shi, W.; Liu, J.Y. Inhibiting or promoting? The impact of carbon emissions trading on corporate environmental responsibility. Int. Rev. Financ. Anal. 2024, 96, 103703. [Google Scholar] [CrossRef] [Scilit]
- Yang, T.; Yi, L.; Li, J.; Liang, Q. Have the pilot carbon markets achieved synergistic control of carbon abatement and pollution reduction? The quasi-experimental evidence from China. Energy Environ. 2025, 36, 1906–1928. [Google Scholar] [CrossRef] [Scilit]
- Wang, G.; Wu, J.; Zhou, J. Multi-objective optimization research on the achievement path of dual carbon goals in mining enterprises. Energy 2025, 333, 137194. [Google Scholar] [CrossRef] [Scilit]
- Zhang, Y.; Qi, L.; Tao, M.; Silva, E.; Zhang, Q. Impact of carbon emission trading on carbon transfers in China’s inter-provincial and international trade. J. Environ. Manag. 2025, 392, 126744. [Google Scholar] [CrossRef] [Scilit] [PubMed]
- Shi, B.; Li, N.; Gao, Q.; Li, G. Market incentives, carbon quota allocation and carbon emission reduction: Evidence from China’s carbon trading pilot policy. J. Environ. Manag. 2022, 319, 115650. [Google Scholar] [CrossRef] [Scilit]
- Ma, J.; Wang, A.; Weng, Z. Do policies make a difference? Assessing the impact of China’s air pollution prevention and control action plan on carbon emissions. J. Environ. Manag. 2024, 370, 122685. [Google Scholar] [CrossRef] [Scilit] [PubMed]
- Zhang, D. Green financial system regulation shock and greenwashing behaviors: Evidence from Chinese firms. Energy Econ. 2022, 111, 106064. [Google Scholar] [CrossRef] [Scilit]
- Porter, M.E.; Vander Linde, C. Toward a new conception of the environment-competitiveness relationship. J. Econ. Perspect. 1995, 9, 97–118. [Google Scholar] [CrossRef] [Scilit]
- Lyon, T.P.; Maxwell, J.W. Greenwash: Corporate environmental disclosure under threat of audit. J. Econ. Manag. Strategy 2011, 20, 3–41. [Google Scholar] [CrossRef] [Scilit]
- Dong, Z.; Xia, C.; Fang, K.; Zhang, W. Effect of the carbon emissionstrading policy on the co-benefits of carbon emissions reductionand air pollution control. Energy Policy 2022, 165, 112998. [Google Scholar] [CrossRef] [Scilit]
- Schwerin, E.; Prier, E. Rent-seeking obstacles to changing environmental practices and sustainable public procurement in China. Environ. Pract. 2013, 15, 240–252. [Google Scholar] [CrossRef] [Scilit]
- DiMaggio, P.J.; Powell, W.W. The iron cage revisited: Institutional isomorphism and collective rationality in organizational fields. Am. Sociol. Rev. 1983, 48, 147–160. [Google Scholar] [CrossRef] [Scilit]
- Pizer, W.A. Combining price and quantity controls to mitigate global climate change. J. Public Econ. 2002, 85, 409–434. [Google Scholar] [CrossRef] [Scilit]
- Luo, K.; Huang, Y.; Lv, Y. Non-State Shareholder Governance and Corporate Sustainability: Evidence from Environmental, Social and Governance Ratings. Sustain. Dev. 2024, 32, 211–226. [Google Scholar] [CrossRef] [Scilit]
- Zhou, Y.; Hao, F.; Meng, W.; Fu, J. Scenario analysis of energy-based low-carbon development in China. J. Environ. Sci. 2014, 26, 1631–1640. [Google Scholar] [CrossRef] [Scilit]
- Sethi, S.P.; Martell, T.F.; Demir, M. Enhancing the role and effectiveness of corporate social responsibility (CSR) reports: The missing element of content verification and integrity assurance. J. Bus. Ethics 2017, 144, 59–82. [Google Scholar] [CrossRef] [Scilit]
- Liu, B.; Lin, Y.; Chan, K.C.; Fung, H.-G. The dark side of rent-seeking: The impact of rent-seeking on earnings management. J. Bus. Res. 2018, 91, 94–107. [Google Scholar] [CrossRef] [Scilit]
- Feng, T.; Sun, L.; Zhang, Y. The relationship between energy consumption structure, economic structure and energy intensity in China. Energy Policy 2009, 37, 5475–5483. [Google Scholar] [CrossRef] [Scilit]
- McWilliams, A.; Siegel, D. Corporate social responsibility and financial performance: Correlation or misspecification? Strateg. Manag. J. 2000, 21, 603–609. [Google Scholar] [CrossRef]
- Liu, X.; Anbumozhi, V. Determinant factors of corporate environmental information disclosure: An empirical study of Chinese listed companies. J. Clean. Prod. 2009, 17, 593–600. [Google Scholar] [CrossRef] [Scilit]
- Minev, S.; Dankova, P.; Štrukelj, T. Long-Term Effect of Environmental, Social, and Governance (ESG) Corporate Practices on Corporate Stock Performance. Sustainability 2025, 17, 11321. [Google Scholar] [CrossRef] [Scilit]
- Rojo-Suárez, J.; Alonso-Conde, A.B. Short-run and long-run effects of ESG policies on value creation and the cost of equity of firms. Econ. Anal. Policy 2023, 77, 599–616. [Google Scholar] [CrossRef] [Scilit]
- Ha, H.T.C.; Uyen, N.T.U.; Thao, P.D.P.; Minh, L.T.H. Financial distress and corporate income tax avoidance of firms in Vietnam. Asian J. Econ. Bank. 2017, 1, 115–132. [Google Scholar]
- Marquis, C.; Toffel, M.W.; Zhou, Y. Scrutiny, norms, and selective disclosure: A global study of greenwashing. Organ. Sci. 2016, 27, 483–504. [Google Scholar] [CrossRef] [Scilit]
- Westphal, J.D.; Zajac, E.J. The symbolic management of stockholders: Corporate governance reforms and shareholder reactions. Adm. Sci. Q. 1998, 43, 127–153. [Google Scholar] [CrossRef] [Scilit]
- Anne, K. The political economy of the rent-seeking society. Am. Econ. Rev. 1974, 64, 291–303. [Google Scholar]
- Murphy, K.M.; Shleifer, A.; Vishny, R.W. Why is rent-seeking so costly to growth? Am. Econ. Rev. 1993, 83, 409–414. [Google Scholar]
- Ambec, S.; Cohen, M.A.; Elgie, S.; Lanoie, P. The Porter hypothesis at 20: Can environmental regulation enhance innovation and competitiveness? Rev. Environ. Econ. Policy 2013, 7, 2–22. [Google Scholar] [CrossRef] [Scilit]
- Saudi, M.H.M.; Sinaga, O.; Roespinoedji, D.; Ghani, E.K. The impact of technological innovation on energy intensity: Evidence from Indonesia. Int. J. Energy Econ. Policy 2019, 9, 11. [Google Scholar] [CrossRef] [Scilit]
- Flammer, C. Does corporate social responsibility lead to superior financial performance? A regression discontinuity approach. Manag. Sci. 2015, 61, 2549–2568. [Google Scholar] [CrossRef] [Scilit]
- Lanoie, P.; Patry, M.; Lajeunesse, R. Environmental regulation and productivity: Testing the porter hypothesis. J. Product. Anal. 2008, 30, 121–128. [Google Scholar] [CrossRef] [Scilit]
- Qian, Y.; Liu, Y. Improve carbon emission efficiency: What role does the ESG initiatives play? J. Environ. Manag. 2024, 367, 122016. [Google Scholar] [CrossRef] [Scilit]
- Frondel, M.; Horbach, J.; Rennings, K. End-of-pipe or cleaner production? An empirical comparison of environmental innovation decisions across OECD countries. Bus. Strategy Environ. 2007, 16, 571–584. [Google Scholar] [CrossRef] [Scilit]
- Lin, B.; Xie, J. Superior administration’s environmental inspections and local polluters’ rent seeking: A perspective of multilevel principal–agent relationships. Econ. Anal. Policy 2023, 80, 805–819. [Google Scholar] [CrossRef] [Scilit]
- Wang, H.; Jiao, S.; Ma, C. The impact of ESG responsibility performance on corporate resilience. Int. Rev. Econ. Financ. 2024, 93, 1115–1129. [Google Scholar] [CrossRef] [Scilit]
- Deng, B.; Peng, Z.; Huang, K. ESG rating declines and stock price crash risk. Appl. Econ. Lett. 2024, 46, 1–7. [Google Scholar] [CrossRef] [Scilit]
- Yu, Y.; Wang, L.; Wu, Y.; Zhang, J.Z.; Li, H.; Zhang, Y. How ESG governance affects total factor productivity: Evidence from Chinese listed companies. Environ. Impact Assess. Rev. 2026, 116, 108074. [Google Scholar] [CrossRef] [Scilit]
- Hu, G.; Hou, C.; Wang, H. Do high-quality online interactions improve corporate ESG performance? Evidence from China. Sustain. Account. Manag. Policy J. 2025, 16, 1426–1447. [Google Scholar] [CrossRef] [Scilit]
- Huang, S.; Du, P.; Hong, Y.; Wu, W. Are corporate environmental, social, and governance practices contagious? The peer-effect perspective. Energy Environ. 2024, 35, 4049–4082. [Google Scholar] [CrossRef] [Scilit]
- Treepongkaruna, S.; Yong, H.H.A.; Thomsen, S.; Kyaw, K. Greenwashing, carbon emission, and ESG. Bus. Strategy Environ. 2024, 33, 8526–8539. [Google Scholar] [CrossRef] [Scilit]
- Kong, L.; Jin, X.; Xu, Y.; Xu, K. The impact of China’s Total Carbon Emission control policy on low carbon total factor productivity. Ind. Innov. 2025, 32, 449–475. [Google Scholar] [CrossRef] [Scilit]
- Xu, K.; Jin, X.; Xu, Y.; Kong, L. How does environmental regulation promote environmental total factor productivity: Evidence from China’s Total Carbon Emission control policy. Int. J. Financ. Econ. 2026, 31, 305–316. [Google Scholar] [CrossRef] [Scilit]
- Brunnermeier, S.B.; Cohen, M.A. Determinants of environmental innovation in US manufacturing industries. J. Environ. Econ. Manag. 2003, 45, 278–293. [Google Scholar] [CrossRef] [Scilit]
- Collins, B.M.; Fabozzi, F.J. A methodology for measuring transaction costs. Financ. Anal. J. 1991, 47, 27–36. [Google Scholar] [CrossRef] [Scilit]

Disclaimer/Publisher’s Note: The statements, opinions and data contained in all publications are solely those of the individual author(s) and contributor(s) and not of MDPI and/or the editor(s). MDPI and/or the editor(s) disclaim responsibility for any injury to people or property resulting from any ideas, methods, instructions or products referred to in the content. |
© 2026 by the authors. Licensee MDPI, Basel, Switzerland. This article is an open access article distributed under the terms and conditions of the Creative Commons Attribution (CC BY) license.